Embed Size (px)
Citation preview
Key China
Energy Statistics
2012
Lawrence Berkeley
National Laboratory
The LBNL China Energy Group
The China Energy Group at Lawrence Berkeley National
Laboratory (LBNL) was established in 1988. Over the years
the Group has gained recognition as an authoritative source of
China energy statistics through the publication of its China
Energy Databook (CED). The Group has published seven
editions to date of the CED (http://china.lbl.gov/research/china-
energy-databook). This handbook summarizes key statistics
from the CED and is expressly modeled on the International
Energy Agency’s “Key World Energy Statistics” series of
publications. The handbook contains timely, clearly-presented
data on the supply, transformation, and consumption of all
major energy sources.
Gathering and analyzing data is one important function of the
LBNL China Energy Group. The mission of the Group, located
within the Environmental Energy Technologies Division of the
Lawrence Berkeley National Laboratory, is to:
Develop and enhance the capabilities of Chinese
institutions that promote energy efficiency;
Better understand the dynamics of energy use in China;
and
Create links between Chinese, U.S., and international
institutions.
Major achievements of the China Energy Group include: Introduced appliance energy efficiency standards to China
Initiated pilot policy programs that led to the top 1000
enterprises program
Analyzed long-term energy demand in China to 2020, 2030
and 2050
Played a key role in creating the Beijing Energy Efficiency
Center and the Energy Foundation Sustainable Energy
Program with collaborators
Leadership of the US-China Clean Energy Research Center
– Building Energy Efficiency
Disclaimer
This document was prepared as an account of work sponsored
by the United States Government. While this document is
believed to contain correct information, neither the United
States Government nor any agency thereof, nor The Regents
of the University of California, nor any of their employees,
makes any warranty, express or implied, or assumes any legal
responsibility for the accuracy, completeness, or usefulness of
any information, apparatus, product, or process disclosed, or
represents that its use would not infringe privately owned
rights. Reference herein to any specific commercial product,
process, or service by its trade name, trademark,
manufacturer, or otherwise, does not necessarily constitute or
imply its endorsement, recommendation, or favoring by the
United States Government or any agency thereof, or The
Regents of the University of California. The views and opinions
of authors expressed herein do not necessarily state or reflect
those of the United States Government or any agency thereof,
or The Regents of the University of California.
Ernest Orlando Lawrence Berkeley National Laboratory is an
equal opportunity employer.
Table of Contents
Supply 1
Transformation 13
Consumption 18
Prices 26
Emissions 34
Economic and Demographic Indicators 37
International Comparison 40
Appendices
Acronyms 45
Glossary 46
Conversion Factors 47
Energy Balance (2010) in Standard Unit 48
Energy Balance (2010) in Physical Unit 53
Data Sources 58
Supply
1
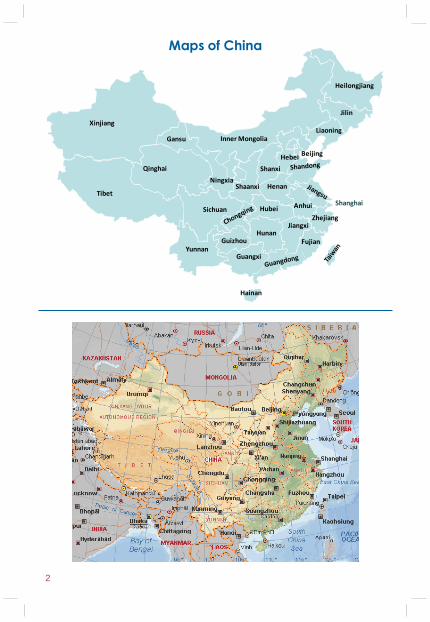
Maps of China
2
Hainan
Heilongjiang
Jilin
Liaoning
Hebei
Fujian
Jiangxi
AnhuiHubei
Hunan
Guangxi
Shanghai
Henan
Shanxi
Inner Mongolia
ShaanxiNingxia
Gansu
Qinghai
Sichuan
GuizhouYunnan
Tibet
Xinjiang
Zhejiang
Beijing
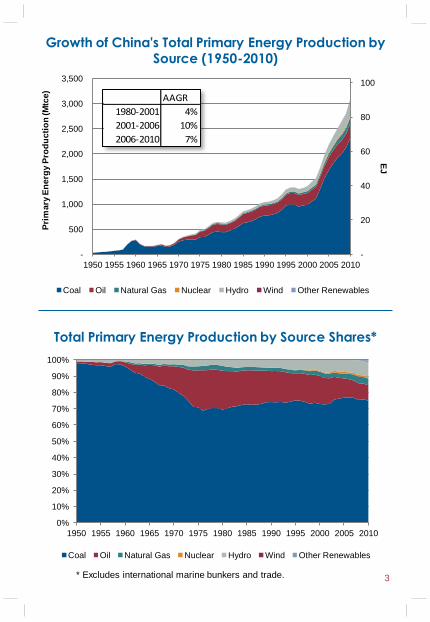
* Excludes international marine bunkers and trade.
Growth of China's Total Primary Energy Production by Source (1950-2010)
Total Primary Energy Production by Source Shares*
0%
10%
20%
30%
40%
50%
60%
70%
80%
90%
100%
1950 1955 1960 1965 1970 1975 1980 1985 1990 1995 2000 2005 2010
Coal Oil Natural Gas Nuclear Hydro Wind Other Renewables
-
20
40
60
80
100
-
500
1,000
1,500
2,000
2,500
3,000
3,500
1950 1955 1960 1965 1970 1975 1980 1985 1990 1995 2000 2005 2010
Pri
mary
En
erg
y P
rod
ucti
on
(M
tce)
Coal Oil Natural Gas Nuclear Hydro Wind Other Renewables
EJ
AAGR
1980-2001 4%
2001-2006 10%
2006-2010 7%
3
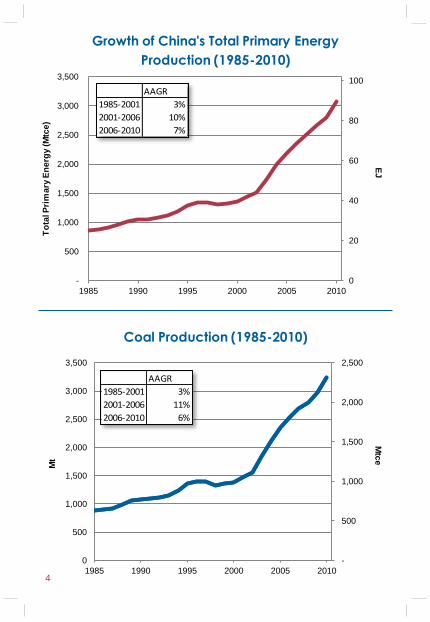
Growth of China's Total Primary Energy
Production (1985-2010)
Coal Production (1985-2010)
-
500
1,000
1,500
2,000
2,500
0
500
1,000
1,500
2,000
2,500
3,000
3,500
1985 1990 1995 2000 2005 2010
Mt
Mtc
e
AAGR
1985-2001 3%
2001-2006 11%
2006-2010 6%
0
20
40
60
80
100
-
500
1,000
1,500
2,000
2,500
3,000
3,500
1985 1990 1995 2000 2005 2010
To
tal P
rim
ary
En
erg
y (M
tce)
EJ
AAGR
1985-2001 3%
2001-2006 10%
2006-2010 7%
4
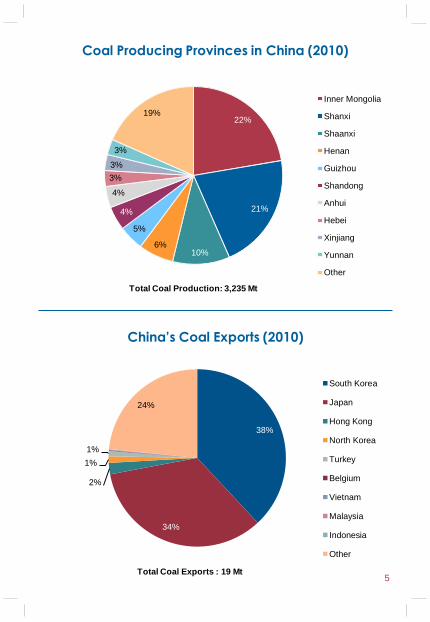
38%
34%
2%
1%
1%
24%
South Korea
Japan
Hong Kong
North Korea
Turkey
Belgium
Vietnam
Malaysia
Indonesia
Other
Total Coal Exports : 19 Mt
Coal Producing Provinces in China (2010)
China’s Coal Exports (2010)
22%
21%
10% 6%
5%
4%
4%
3%
3%
3%
19%
Inner Mongolia
Shanxi
Shaanxi
Henan
Guizhou
Shandong
Anhui
Hebei
Xinjiang
Yunnan
Other
Total Coal Production: 3,235 Mt
5
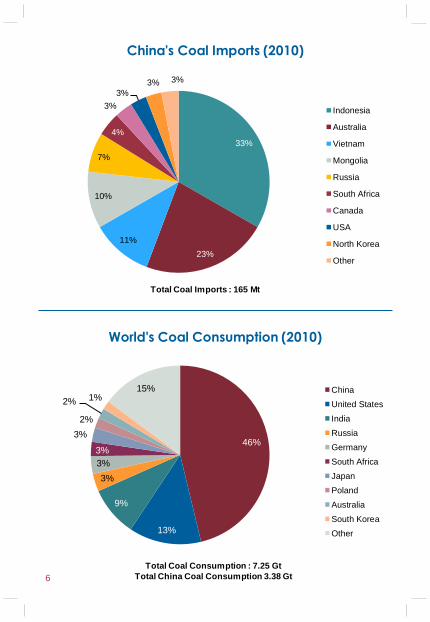
China's Coal Imports (2010)
World's Coal Consumption (2010)
6
33%
23%
11%
10%
7%
4%
3%
3%
3% 3%
Indonesia
Australia
Vietnam
Mongolia
Russia
South Africa
Canada
USA
North Korea
Other
Total Coal Imports : 165 Mt
46%
13%
9%
3%
3%
3%
3%
2%
2% 1% 15% China
United States
India
Russia
Germany
South Africa
Japan
Poland
Australia
South Korea
Other
Total Coal Consumption : 7.25 Gt
Total China Coal Consumption 3.38 Gt
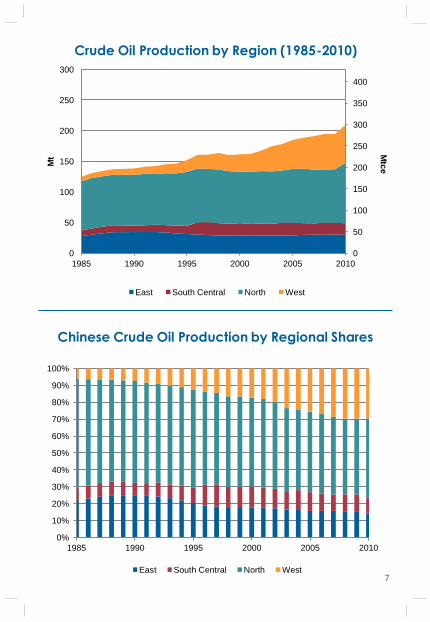
Crude Oil Production by Region (1985-2010)
Chinese Crude Oil Production by Regional Shares
0
50
100
150
200
250
300
350
400
0
50
100
150
200
250
300
1985 1990 1995 2000 2005 2010
Mt
East South Central North West
Mtc
e
0%
10%
20%
30%
40%
50%
60%
70%
80%
90%
100%
1985 1990 1995 2000 2005 2010
East South Central North West7
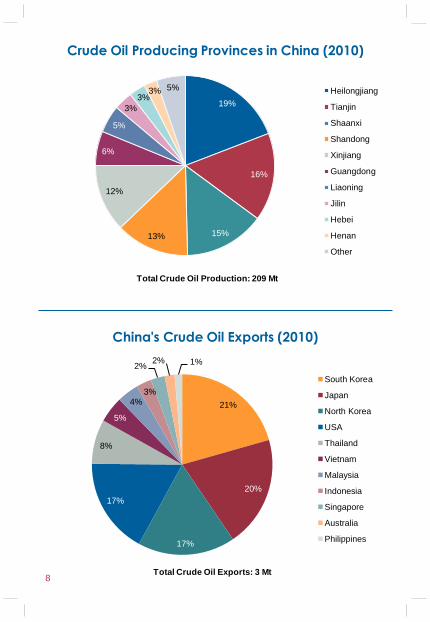
Crude Oil Producing Provinces in China (2010)
China's Crude Oil Exports (2010)
8
19%
16%
15% 13%
12%
6%
5%
3%
3% 3% 5% Heilongjiang
Tianjin
Shaanxi
Shandong
Xinjiang
Guangdong
Liaoning
Jilin
Hebei
Henan
Other
Total Crude Oil Production: 209 Mt
21%
20%
17%
17%
8%
5%
4% 3%
2% 2% 1%
South Korea
Japan
North Korea
USA
Thailand
Vietnam
Malaysia
Indonesia
Singapore
Australia
Philippines
Total Crude Oil Exports: 3 Mt
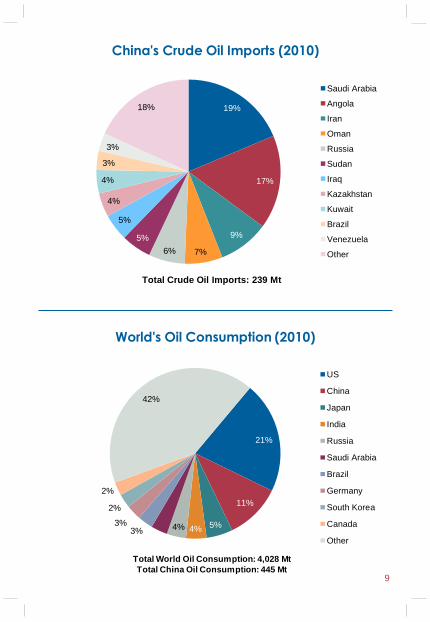
China's Crude Oil Imports (2010)
World's Oil Consumption (2010)
19%
17%
9%
7% 6%
5%
5%
4%
4%
3%
3%
18%
Saudi Arabia
Angola
Iran
Oman
Russia
Sudan
Iraq
Kazakhstan
Kuwait
Brazil
Venezuela
Other
Total Crude Oil Imports: 239 Mt
21%
11%
5% 4% 4%
3% 3%
3%
2%
2%
42%
US
China
Japan
India
Russia
Saudi Arabia
Brazil
Germany
South Korea
Canada
Other
Total World Oil Consumption: 4,028 Mt
Total China Oil Consumption: 445 Mt 9
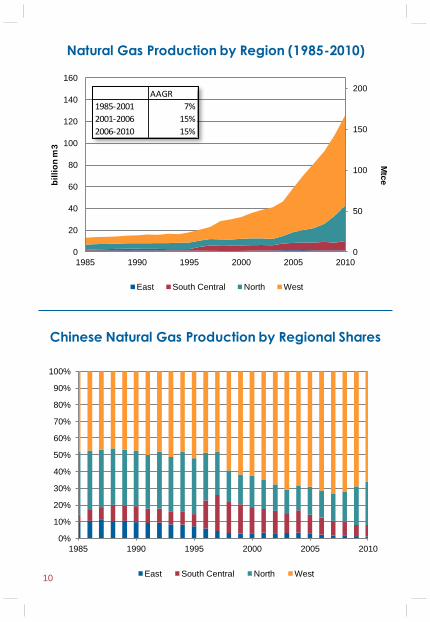
Natural Gas Production by Region (1985-2010)
Chinese Natural Gas Production by Regional Shares
10
0
50
100
150
200
0
20
40
60
80
100
120
140
160
1985 1990 1995 2000 2005 2010
bil
lio
n m
3
East South Central North West
Mtc
e
0%
10%
20%
30%
40%
50%
60%
70%
80%
90%
100%
1985 1990 1995 2000 2005 2010
East South Central North West
AAGR
1985-2001 7%
2001-2006 15%
2006-2010 15%
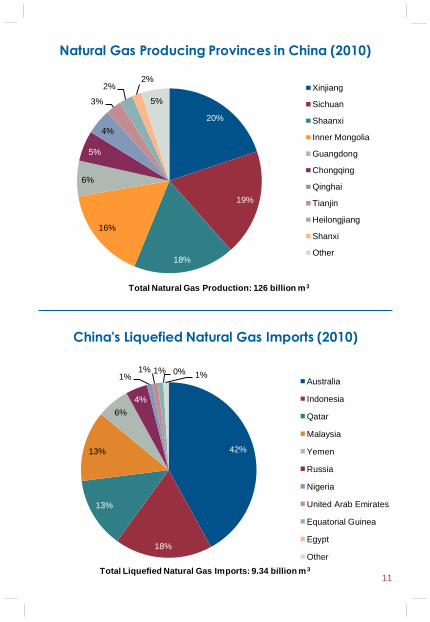
Natural Gas Producing Provinces in China (2010)
China's Liquefied Natural Gas Imports (2010)
20%
19%
18%
16%
6%
5%
4%
3%
2% 2%
5%
Xinjiang
Sichuan
Shaanxi
Inner Mongolia
Guangdong
Chongqing
Qinghai
Tianjin
Heilongjiang
Shanxi
Other
Total Natural Gas Production: 126 billion m3
11
42%
18%
13%
13%
6%
4%
1% 1% 1% 0% 1%
Total Liquefied Natural Gas Imports: 9.34 billion m 3
Australia
Indonesia
Qatar
Malaysia
Yemen
Russia
Nigeria
United Arab Emirates
Equatorial Guinea
Egypt
Other
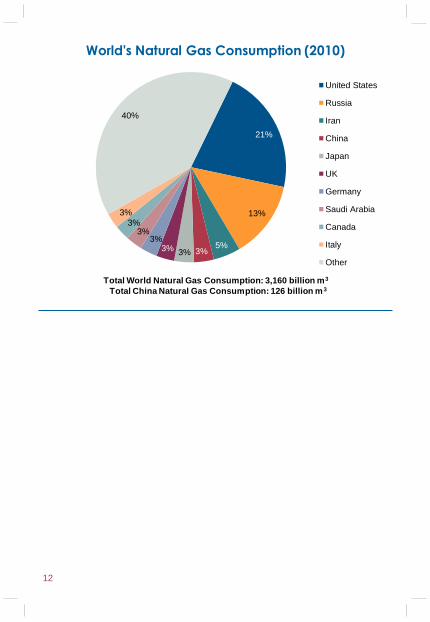
World's Natural Gas Consumption (2010)
12
21%
13%
5% 3% 3% 3%
3% 3%
3%
3%
40%
United States
Russia
Iran
China
Japan
UK
Germany
Saudi Arabia
Canada
Italy
Other
Total World Natural Gas Consumption: 3,160 billion m3
Total China Natural Gas Consumption: 126 billion m3
Transformation
13
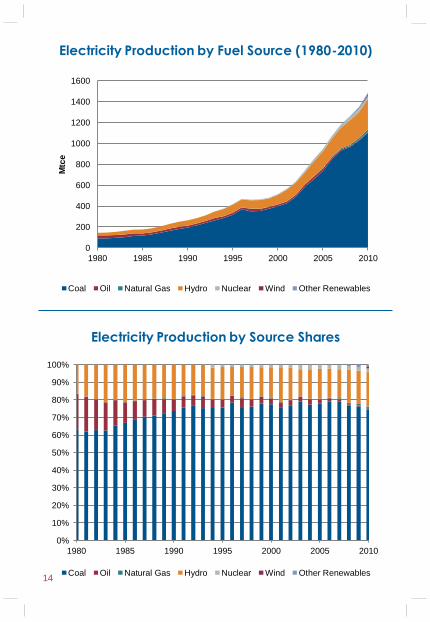
Electricity Production by Fuel Source (1980-2010)
Electricity Production by Source Shares
14
0
200
400
600
800
1000
1200
1400
1600
1980 1985 1990 1995 2000 2005 2010
Mtc
e
Coal Oil Natural Gas Hydro Nuclear Wind Other Renewables
0%
10%
20%
30%
40%
50%
60%
70%
80%
90%
100%
1980 1985 1990 1995 2000 2005 2010
Coal Oil Natural Gas Hydro Nuclear Wind Other Renewables
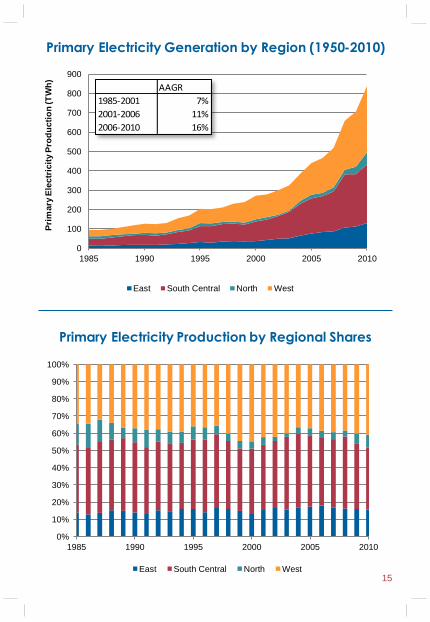
Primary Electricity Generation by Region (1950-2010)
Primary Electricity Production by Regional Shares
0
100
200
300
400
500
600
700
800
900
1985 1990 1995 2000 2005 2010
Pri
mary
Ele
ctr
icit
y P
rod
ucti
on
(T
Wh
)
East South Central North West
0%
10%
20%
30%
40%
50%
60%
70%
80%
90%
100%
1985 1990 1995 2000 2005 2010
East South Central North West
AAGR
1985-2001 7%
2001-2006 11%
2006-2010 16%
15
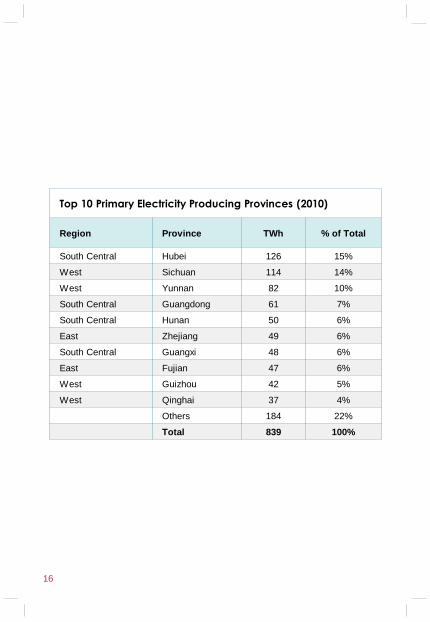
Top 10 Primary Electricity Producing Provinces (2010)
Region Province TWh % of Total
South Central Hubei 126 15%
West Sichuan 114 14%
West Yunnan 82 10%
South Central Guangdong 61 7%
South Central Hunan 50 6%
East Zhejiang 49 6%
South Central Guangxi 48 6%
East Fujian 47 6%
West Guizhou 42 5%
West Qinghai 37 4%
Others 184 22%
Total 839 100%
16
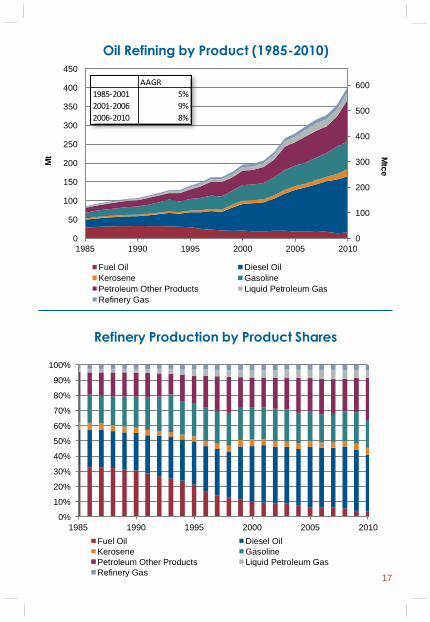
Oil Refining by Product (1985-2010)
Refinery Production by Product Shares
0
100
200
300
400
500
600
0
50
100
150
200
250
300
350
400
450
1985 1990 1995 2000 2005 2010
Mt
Fuel Oil Diesel Oil
Kerosene Gasoline
Petroleum Other Products Liquid Petroleum Gas
Refinery Gas
Mtc
e
AAGR
1985-2001 5%
2001-2006 9%
2006-2010 8%
0%
10%
20%
30%
40%
50%
60%
70%
80%
90%
100%
1985 1990 1995 2000 2005 2010
Fuel Oil Diesel Oil
Kerosene Gasoline
Petroleum Other Products Liquid Petroleum Gas
Refinery Gas17
Consumption
18
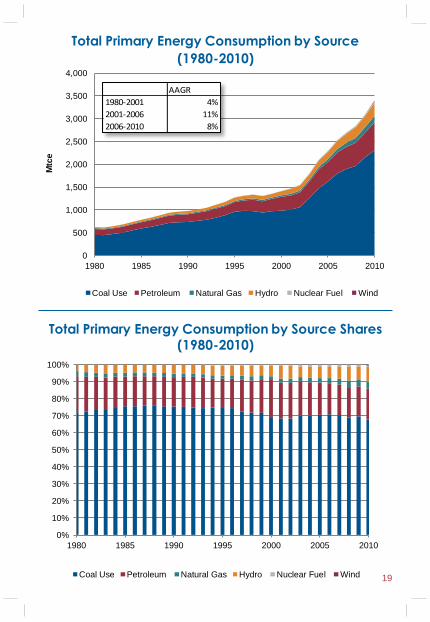
Total Primary Energy Consumption by Source
(1980-2010)
Total Primary Energy Consumption by Source Shares (1980-2010)
0
500
1,000
1,500
2,000
2,500
3,000
3,500
4,000
1980 1985 1990 1995 2000 2005 2010
Mtc
e
Coal Use Petroleum Natural Gas Hydro Nuclear Fuel Wind
AAGR
1980-2001 4%
2001-2006 11%
2006-2010 8%
0%
10%
20%
30%
40%
50%
60%
70%
80%
90%
100%
1980 1985 1990 1995 2000 2005 2010
Coal Use Petroleum Natural Gas Hydro Nuclear Fuel Wind 19
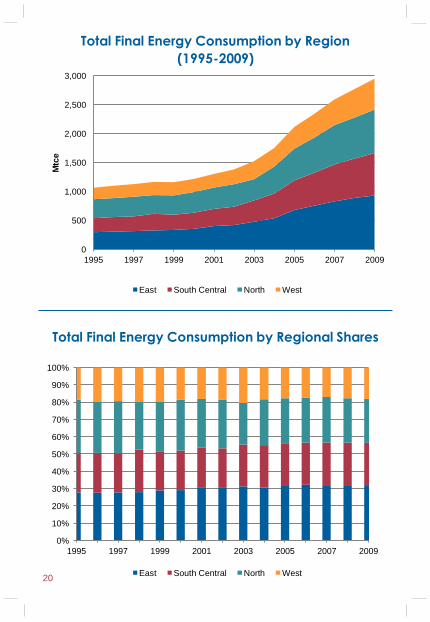
Total Final Energy Consumption by Region
(1995-2009)
Total Final Energy Consumption by Regional Shares
0
500
1,000
1,500
2,000
2,500
3,000
1995 1997 1999 2001 2003 2005 2007 2009
Mtc
e
East South Central North West
0%
10%
20%
30%
40%
50%
60%
70%
80%
90%
100%
1995 1997 1999 2001 2003 2005 2007 2009
East South Central North West20
0
500
1000
1500
2000
2500
3000
3500
1980 1985 1990 1995 2000 2005 2010
En
erg
y In
ten
sit
y
(k
gc
e/1
0,0
00
RM
B (
20
05
pri
ce
))
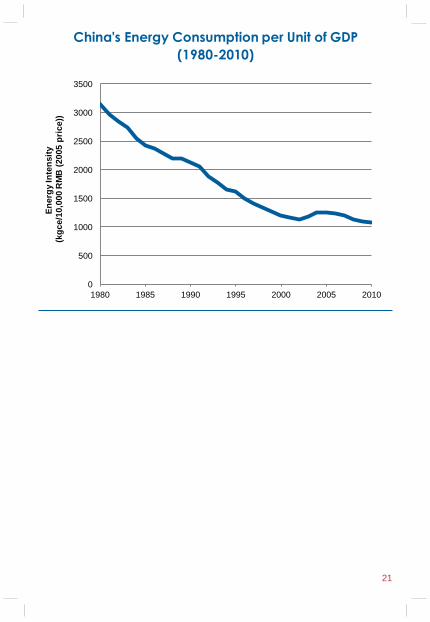
China's Energy Consumption per Unit of GDP
(1980-2010)
21
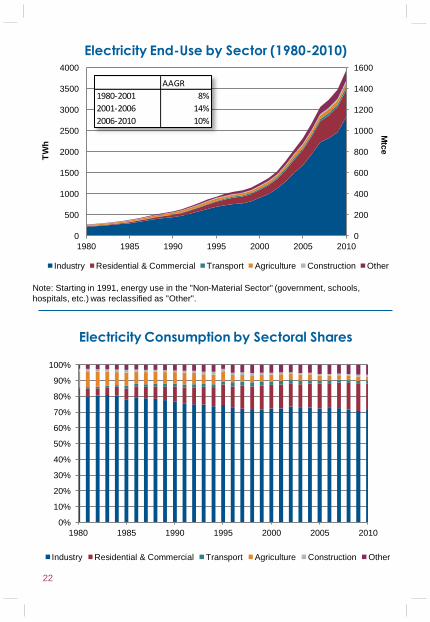
Electricity End-Use by Sector (1980-2010)
Electricity Consumption by Sectoral Shares
Note: Starting in 1991, energy use in the "Non-Material Sector" (government, schools,
hospitals, etc.) was reclassified as "Other".
0%
10%
20%
30%
40%
50%
60%
70%
80%
90%
100%
1980 1985 1990 1995 2000 2005 2010
Industry Residential & Commercial Transport Agriculture Construction Other
0
200
400
600
800
1000
1200
1400
1600
0
500
1000
1500
2000
2500
3000
3500
4000
1980 1985 1990 1995 2000 2005 2010
TW
h
Industry Residential & Commercial Transport Agriculture Construction Other
Mtc
e
AAGR
1980-2001 8%
2001-2006 14%
2006-2010 10%
22
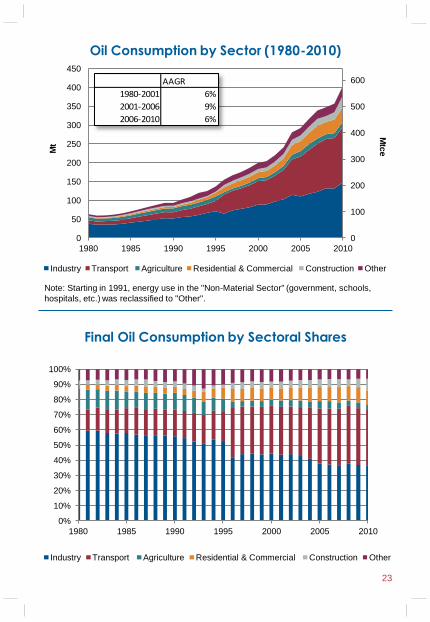
Oil Consumption by Sector (1980-2010)
Final Oil Consumption by Sectoral Shares
Note: Starting in 1991, energy use in the "Non-Material Sector" (government, schools,
hospitals, etc.) was reclassified to "Other".
0%
10%
20%
30%
40%
50%
60%
70%
80%
90%
100%
1980 1985 1990 1995 2000 2005 2010
Industry Transport Agriculture Residential & Commercial Construction Other
0
100
200
300
400
500
600
0
50
100
150
200
250
300
350
400
450
1980 1985 1990 1995 2000 2005 2010
Mt
Industry Transport Agriculture Residential & Commercial Construction Other
Mtc
e
AAGR
1980-2001 6%
2001-2006 9%
2006-2010 6%
23
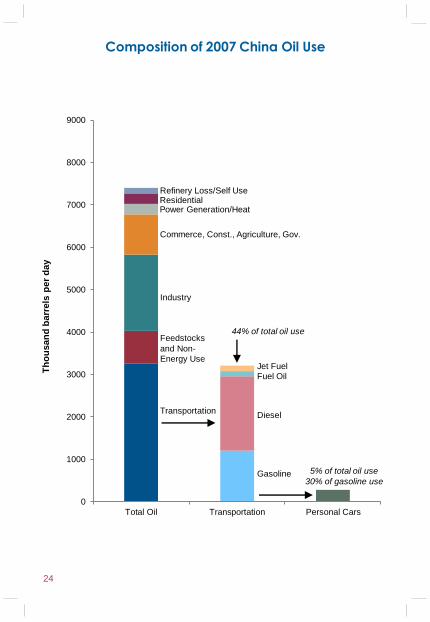
Composition of 2007 China Oil Use
24
0
1000
2000
3000
4000
5000
6000
7000
8000
9000
Total Oil Transportation Personal Cars
Th
ou
san
d b
arr
els
per
day
Refinery Loss/Self Use Residential Power Generation/Heat
Commerce, Const., Agriculture, Gov.
Industry
Feedstocks
and Non-
Energy Use
Transportation
Jet Fuel Fuel Oil
Diesel
Gasoline 5% of total oil use
30% of gasoline use
44% of total oil use
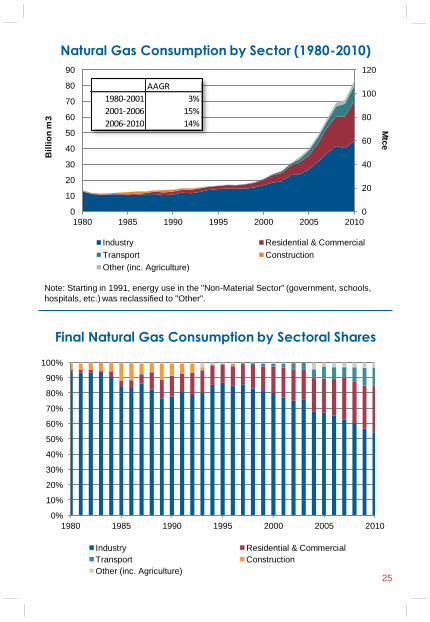
Natural Gas Consumption by Sector (1980-2010)
Final Natural Gas Consumption by Sectoral Shares
Note: Starting in 1991, energy use in the "Non-Material Sector" (government, schools,
hospitals, etc.) was reclassified to "Other".
0%
10%
20%
30%
40%
50%
60%
70%
80%
90%
100%
1980 1985 1990 1995 2000 2005 2010
Industry Residential & Commercial
Transport Construction
Other (inc. Agriculture)
0
20
40
60
80
100
120
0
10
20
30
40
50
60
70
80
90
1980 1985 1990 1995 2000 2005 2010
Bil
lio
n m
3
Industry Residential & Commercial
Transport Construction
Other (inc. Agriculture)
Mtc
e
AAGR
1980-2001 3%
2001-2006 15%
2006-2010 14%
25

Prices
26
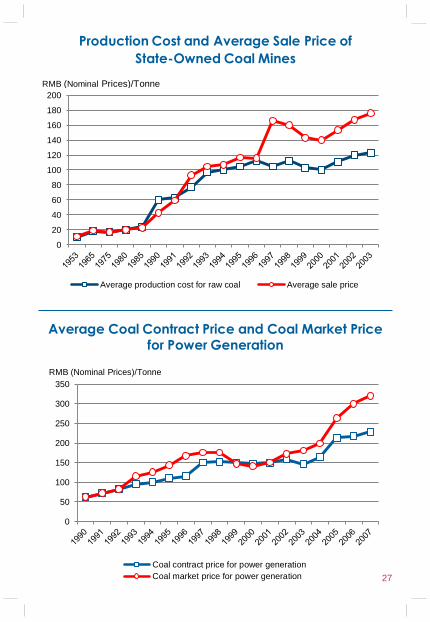
Production Cost and Average Sale Price of
State-Owned Coal Mines
Average Coal Contract Price and Coal Market Price for Power Generation
0
20
40
60
80
100
120
140
160
180
200
Average production cost for raw coal Average sale price
RMB (Nominal Prices)/Tonne
0
50
100
150
200
250
300
350
Coal contract price for power generation
Coal market price for power generation
RMB (Nominal Prices)/Tonne
27
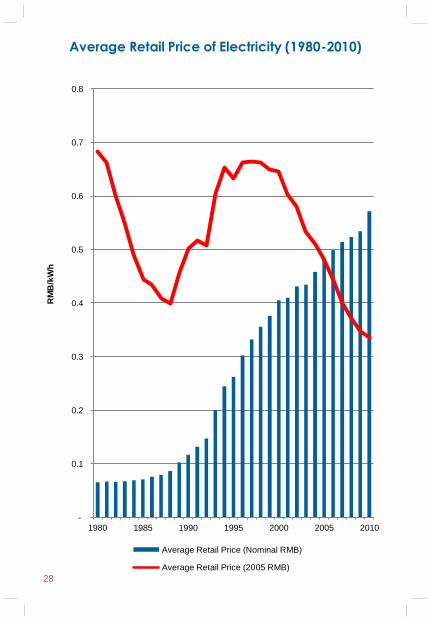
Average Retail Price of Electricity (1980-2010)
28
-
0.1
0.2
0.3
0.4
0.5
0.6
0.7
0.8
1980 1985 1990 1995 2000 2005 2010
RM
B/k
Wh
Average Retail Price (Nominal RMB)
Average Retail Price (2005 RMB)
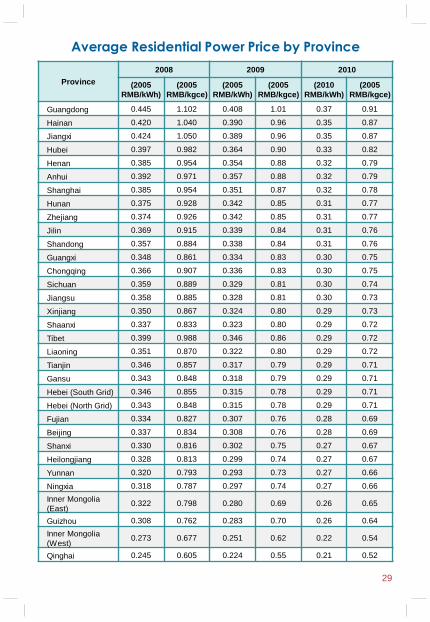
Average Residential Power Price by Province
Province
2008 2009 2010
(2005
RMB/kWh)
(2005
RMB/kgce)
(2005
RMB/kWh)
(2005
RMB/kgce)
(2010
RMB/kWh)
(2005
RMB/kgce)
Guangdong 0.445 1.102 0.408 1.01 0.37 0.91
Hainan 0.420 1.040 0.390 0.96 0.35 0.87
Jiangxi 0.424 1.050 0.389 0.96 0.35 0.87
Hubei 0.397 0.982 0.364 0.90 0.33 0.82
Henan 0.385 0.954 0.354 0.88 0.32 0.79
Anhui 0.392 0.971 0.357 0.88 0.32 0.79
Shanghai 0.385 0.954 0.351 0.87 0.32 0.78
Hunan 0.375 0.928 0.342 0.85 0.31 0.77
Zhejiang 0.374 0.926 0.342 0.85 0.31 0.77
Jilin 0.369 0.915 0.339 0.84 0.31 0.76
Shandong 0.357 0.884 0.338 0.84 0.31 0.76
Guangxi 0.348 0.861 0.334 0.83 0.30 0.75
Chongqing 0.366 0.907 0.336 0.83 0.30 0.75
Sichuan 0.359 0.889 0.329 0.81 0.30 0.74
Jiangsu 0.358 0.885 0.328 0.81 0.30 0.73
Xinjiang 0.350 0.867 0.324 0.80 0.29 0.73
Shaanxi 0.337 0.833 0.323 0.80 0.29 0.72
Tibet 0.399 0.988 0.346 0.86 0.29 0.72
Liaoning 0.351 0.870 0.322 0.80 0.29 0.72
Tianjin 0.346 0.857 0.317 0.79 0.29 0.71
Gansu 0.343 0.848 0.318 0.79 0.29 0.71
Hebei (South Grid) 0.346 0.855 0.315 0.78 0.29 0.71
Hebei (North Grid) 0.343 0.848 0.315 0.78 0.29 0.71
Fujian 0.334 0.827 0.307 0.76 0.28 0.69
Beijing 0.337 0.834 0.308 0.76 0.28 0.69
Shanxi 0.330 0.816 0.302 0.75 0.27 0.67
Heilongjiang 0.328 0.813 0.299 0.74 0.27 0.67
Yunnan 0.320 0.793 0.293 0.73 0.27 0.66
Ningxia 0.318 0.787 0.297 0.74 0.27 0.66
Inner Mongolia
(East) 0.322 0.798 0.280 0.69 0.26 0.65
Guizhou 0.308 0.762 0.283 0.70 0.26 0.64
Inner Mongolia
(West) 0.273 0.677 0.251 0.62 0.22 0.54
Qinghai 0.245 0.605 0.224 0.55 0.21 0.52
29
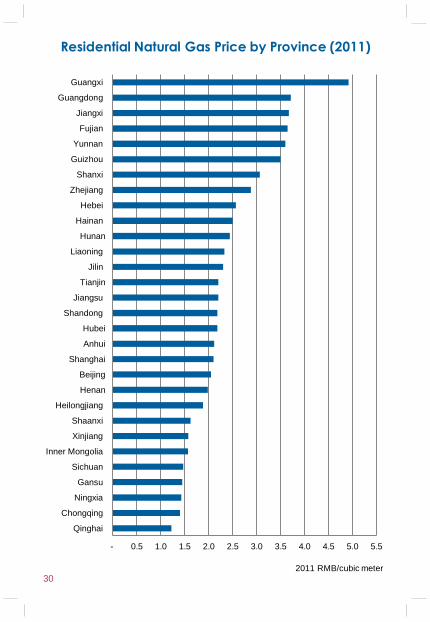
Residential Natural Gas Price by Province (2011)
30
- 0.5 1.0 1.5 2.0 2.5 3.0 3.5 4.0 4.5 5.0 5.5
Qinghai
Chongqing
Ningxia
Gansu
Sichuan
Inner Mongolia
Xinjiang
Shaanxi
Heilongjiang
Henan
Beijing
Shanghai
Anhui
Hubei
Shandong
Jiangsu
Tianjin
Jilin
Liaoning
Hunan
Hainan
Hebei
Zhejiang
Shanxi
Guizhou
Yunnan
Fujian
Jiangxi
Guangdong
Guangxi
2011 RMB/cubic meter
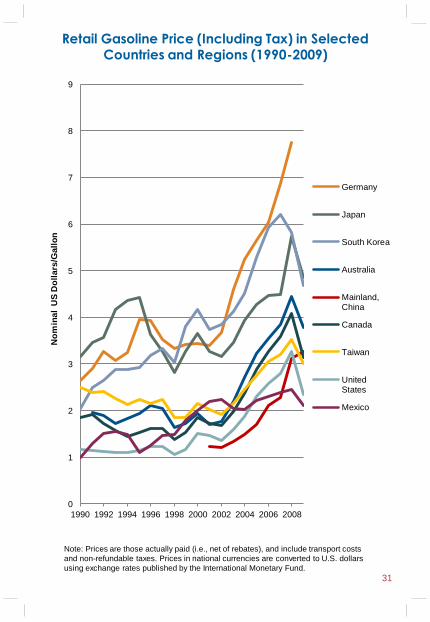
Retail Gasoline Price (Including Tax) in Selected Countries and Regions (1990-2009)
Note: Prices are those actually paid (i.e., net of rebates), and include transport costs
and non-refundable taxes. Prices in national currencies are converted to U.S. dollars
using exchange rates published by the International Monetary Fund.
0
1
2
3
4
5
6
7
8
9
1990 1992 1994 1996 1998 2000 2002 2004 2006 2008
No
min
al U
S D
oll
ars
/Ga
llo
n
Germany
Japan
South Korea
Australia
Mainland,China
Canada
Taiwan
UnitedStates
Mexico
31
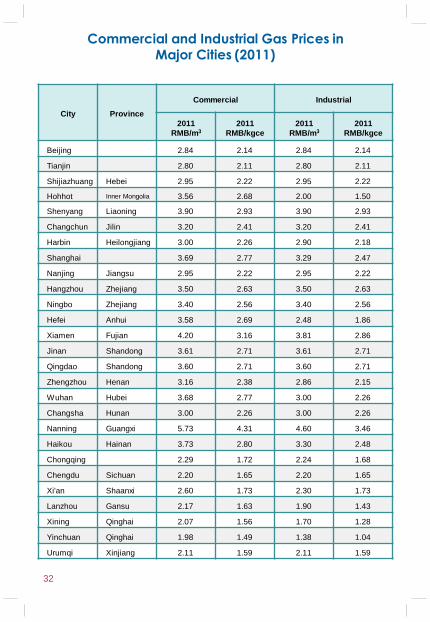
Commercial and Industrial Gas Prices in Major Cities (2011)
32
City Province
Commercial Industrial
2011
RMB/m3
2011
RMB/kgce
2011
RMB/m3
2011
RMB/kgce
Beijing 2.84 2.14 2.84 2.14
Tianjin 2.80 2.11 2.80 2.11
Shijiazhuang Hebei 2.95 2.22 2.95 2.22
Hohhot Inner Mongolia 3.56 2.68 2.00 1.50
Shenyang Liaoning 3.90 2.93 3.90 2.93
Changchun Jilin 3.20 2.41 3.20 2.41
Harbin Heilongjiang 3.00 2.26 2.90 2.18
Shanghai 3.69 2.77 3.29 2.47
Nanjing Jiangsu 2.95 2.22 2.95 2.22
Hangzhou Zhejiang 3.50 2.63 3.50 2.63
Ningbo Zhejiang 3.40 2.56 3.40 2.56
Hefei Anhui 3.58 2.69 2.48 1.86
Xiamen Fujian 4.20 3.16 3.81 2.86
Jinan Shandong 3.61 2.71 3.61 2.71
Qingdao Shandong 3.60 2.71 3.60 2.71
Zhengzhou Henan 3.16 2.38 2.86 2.15
Wuhan Hubei 3.68 2.77 3.00 2.26
Changsha Hunan 3.00 2.26 3.00 2.26
Nanning Guangxi 5.73 4.31 4.60 3.46
Haikou Hainan 3.73 2.80 3.30 2.48
Chongqing 2.29 1.72 2.24 1.68
Chengdu Sichuan 2.20 1.65 2.20 1.65
Xi'an Shaanxi 2.60 1.73 2.30 1.73
Lanzhou Gansu 2.17 1.63 1.90 1.43
Xining Qinghai 2.07 1.56 1.70 1.28
Yinchuan Qinghai 1.98 1.49 1.38 1.04
Urumqi Xinjiang 2.11 1.59 2.11 1.59
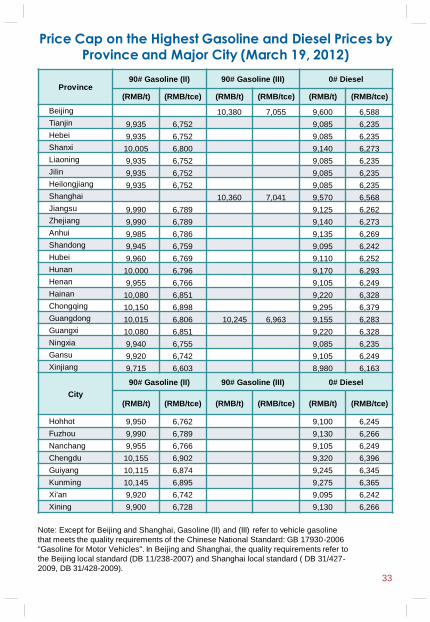
Price Cap on the Highest Gasoline and Diesel Prices by Province and Major City (March 19, 2012)
Note: Except for Beijing and Shanghai, Gasoline (II) and (III) refer to vehicle gasoline
that meets the quality requirements of the Chinese National Standard: GB 17930-2006
"Gasoline for Motor Vehicles". In Beijing and Shanghai, the quality requirements refer to
the Beijing local standard (DB 11/238-2007) and Shanghai local standard ( DB 31/427-
2009, DB 31/428-2009).
Province 90# Gasoline (II) 90# Gasoline (III) 0# Diesel
(RMB/t) (RMB/tce) (RMB/t) (RMB/tce) (RMB/t) (RMB/tce)
Beijing 10,380 7,055 9,600 6,588
Tianjin 9,935 6,752 9,085 6,235
Hebei 9,935 6,752 9,085 6,235
Shanxi 10,005 6,800 9,140 6,273
Liaoning 9,935 6,752 9,085 6,235
Jilin 9,935 6,752 9,085 6,235
Heilongjiang 9,935 6,752 9,085 6,235
Shanghai 10,360 7,041 9,570 6,568
Jiangsu 9,990 6,789 9,125 6,262
Zhejiang 9,990 6,789 9,140 6,273
Anhui 9,985 6,786 9,135 6,269
Shandong 9,945 6,759 9,095 6,242
Hubei 9,960 6,769 9,110 6,252
Hunan 10,000 6,796 9,170 6,293
Henan 9,955 6,766 9,105 6,249
Hainan 10,080 6,851 9,220 6,328
Chongqing 10,150 6,898 9,295 6,379
Guangdong 10,015 6,806 10,245 6,963 9,155 6,283
Guangxi 10,080 6,851 9,220 6,328
Ningxia 9,940 6,755 9,085 6,235
Gansu 9,920 6,742 9,105 6,249
Xinjiang 9,715 6,603 8,980 6,163
City
90# Gasoline (II) 90# Gasoline (III) 0# Diesel
(RMB/t) (RMB/tce) (RMB/t) (RMB/tce) (RMB/t) (RMB/tce)
Hohhot 9,950 6,762 9,100 6,245
Fuzhou 9,990 6,789 9,130 6,266
Nanchang 9,955 6,766 9,105 6,249
Chengdu 10,155 6,902 9,320 6,396
Guiyang 10,115 6,874 9,245 6,345
Kunming 10,145 6,895 9,275 6,365
Xi'an 9,920 6,742 9,095 6,242
Xining 9,900 6,728 9,130 6,266
33
Emissions
34
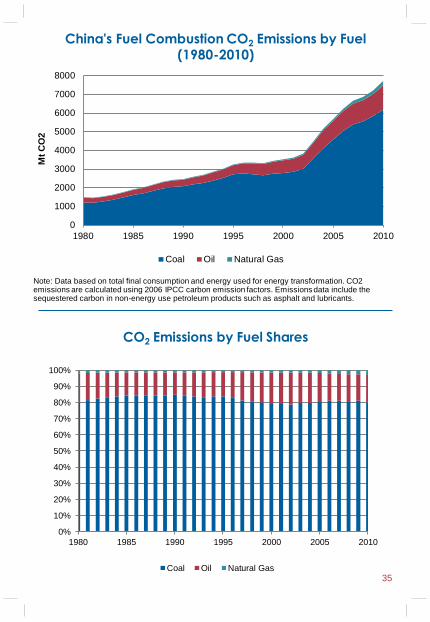
China's Fuel Combustion CO2 Emissions by Fuel (1980-2010)
CO2 Emissions by Fuel Shares
Note: Data based on total final consumption and energy used for energy transformation. CO2 emissions are calculated using 2006 IPCC carbon emission factors. Emissions data include the sequestered carbon in non-energy use petroleum products such as asphalt and lubricants.
0
1000
2000
3000
4000
5000
6000
7000
8000
1980 1985 1990 1995 2000 2005 2010
Mt
CO
2
Coal Oil Natural Gas
0%
10%
20%
30%
40%
50%
60%
70%
80%
90%
100%
1980 1985 1990 1995 2000 2005 2010
Coal Oil Natural Gas
35
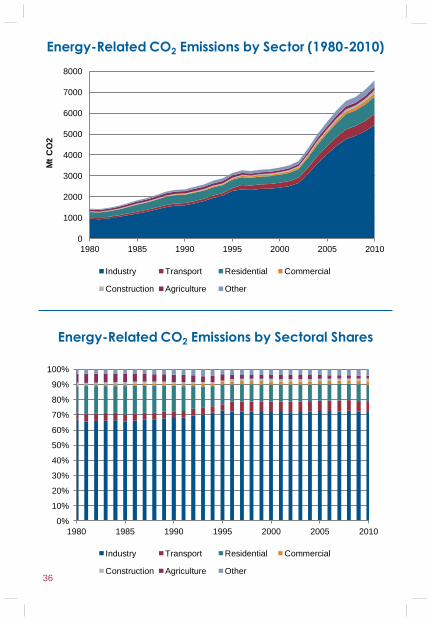
Energy-Related CO2 Emissions by Sectoral Shares
36
0
1000
2000
3000
4000
5000
6000
7000
8000
1980 1985 1990 1995 2000 2005 2010
Mt
CO
2
Industry Transport Residential Commercial
Construction Agriculture Other
0%
10%
20%
30%
40%
50%
60%
70%
80%
90%
100%
1980 1985 1990 1995 2000 2005 2010
Industry Transport Residential Commercial
Construction Agriculture Other
Energy-Related CO2 Emissions by Sector (1980-2010)
Economic and
Demographic
Indicators
37
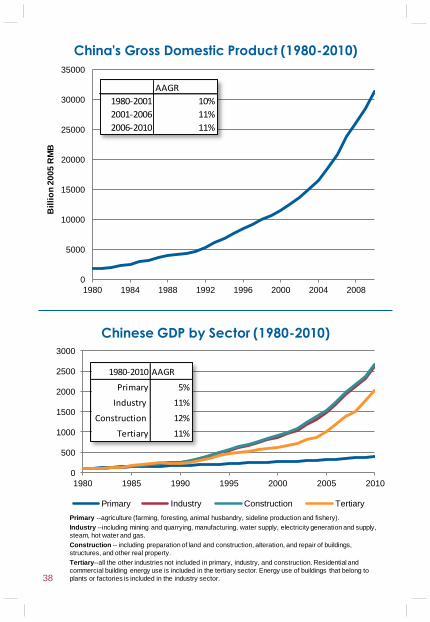
China's Gross Domestic Product (1980-2010)
Chinese GDP by Sector (1980-2010)
38
Primary --agriculture (farming, foresting, animal husbandry, sideline production and fishery).
Industry --including mining and quarrying, manufacturing, water supply, electricity generation and supply,
steam, hot water and gas.
Construction -- including preparation of land and construction, alteration, and repair of buildings,
structures, and other real property.
Tertiary--all the other industries not included in primary, industry, and construction. Residential and
commercial building energy use is included in the tertiary sector. Energy use of buildings that belong to
plants or factories is included in the industry sector.
0
5000
10000
15000
20000
25000
30000
35000
1980 1984 1988 1992 1996 2000 2004 2008
Bil
lio
n 2
005 R
MB
AAGR
1980-2001 10%
2001-2006 11%
2006-2010 11%
0
500
1000
1500
2000
2500
3000
1980 1985 1990 1995 2000 2005 2010
primary Industry Construction TertiaryPrimary
1980-2010 AAGR
Primary 5%
Industry 11%
Construction 12%
Tertiary 11%
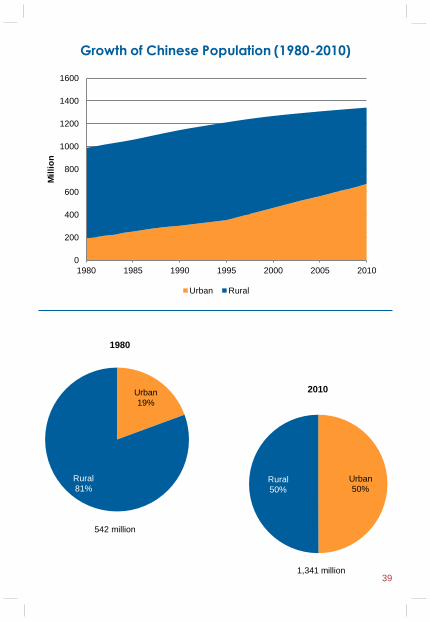
Growth of Chinese Population (1980-2010)
0
200
400
600
800
1000
1200
1400
1600
1980 1985 1990 1995 2000 2005 2010
Mil
lio
n
Urban Rural
Urban
19%
Rural
81%
1980
542 million
Urban
50% Rural
50%
2010
1,341 million 39
International
Comparison
40
0.0
0.5
1.0
1.5
2.0
2.5
tce/t
ho
usan
d U
SD
(2000 p
rice)
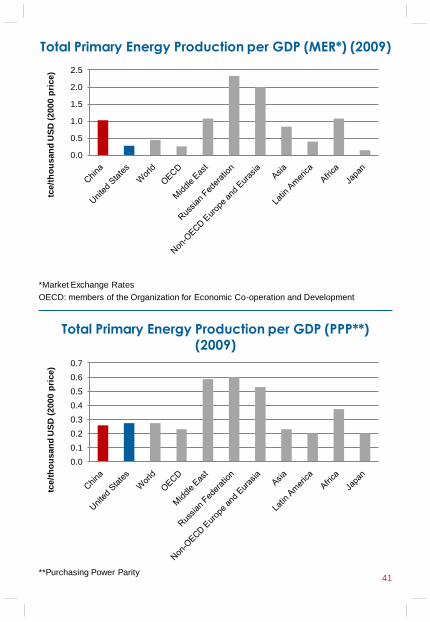
Total Primary Energy Production per GDP (PPP**) (2009)
**Purchasing Power Parity
0.0
0.1
0.2
0.3
0.4
0.5
0.6
0.7
tce/t
ho
usan
d U
SD
(2000 p
rice)
*Market Exchange Rates
OECD: members of the Organization for Economic Co-operation and Development
Total Primary Energy Production per GDP (MER*) (2009)
41
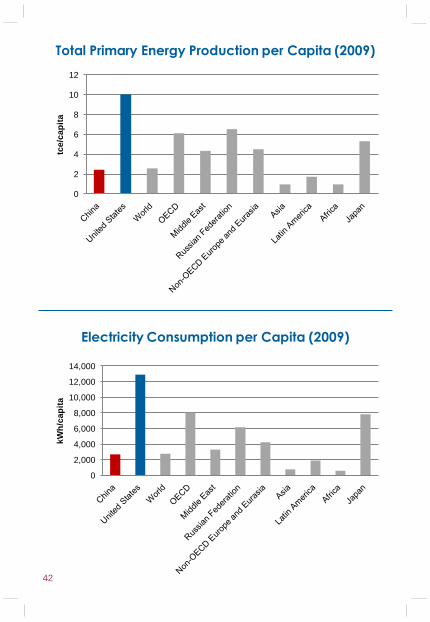
Total Primary Energy Production per Capita (2009)
Electricity Consumption per Capita (2009)
42
0
2
4
6
8
10
12
tce/c
ap
ita
0
2,000
4,000
6,000
8,000
10,000
12,000
14,000
kW
h/c
ap
ita
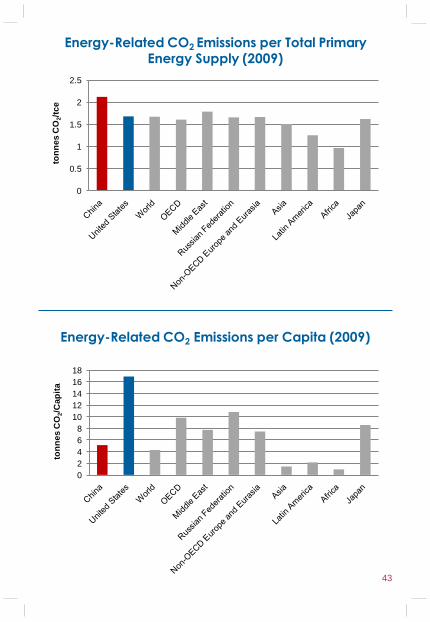
Energy-Related CO2 Emissions per Total Primary
Energy Supply (2009)
Energy-Related CO2 Emissions per Capita (2009)
0
0.5
1
1.5
2
2.5
ton
nes C
O2/t
ce
0
2
4
6
8
10
12
14
16
18
ton
nes C
O2/C
ap
ita
43
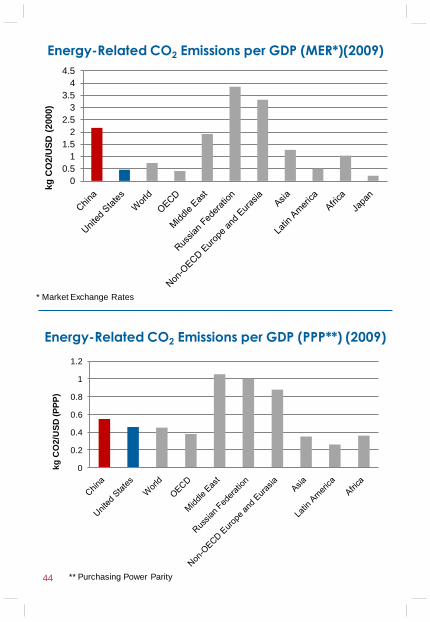
Energy-Related CO2 Emissions per GDP (MER*)(2009)
Energy-Related CO2 Emissions per GDP (PPP**) (2009)
44
0
0.5
1
1.5
2
2.5
3
3.5
4
4.5
kg
CO
2/U
SD
(2000)
0
0.2
0.4
0.6
0.8
1
1.2
kg
CO
2/U
SD
(P
PP
)
* Market Exchange Rates
** Purchasing Power Parity
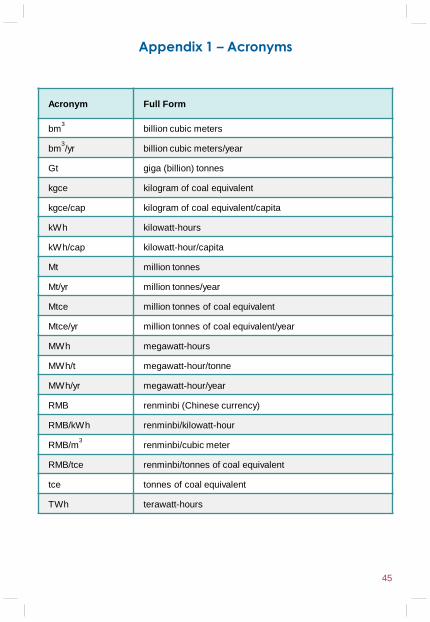
Appendix 1 – Acronyms
Acronym Full Form
bm3 billion cubic meters
bm3/yr billion cubic meters/year
Gt giga (billion) tonnes
kgce kilogram of coal equivalent
kgce/cap kilogram of coal equivalent/capita
kWh kilowatt-hours
kWh/cap kilowatt-hour/capita
Mt million tonnes
Mt/yr million tonnes/year
Mtce million tonnes of coal equivalent
Mtce/yr million tonnes of coal equivalent/year
MWh megawatt-hours
MWh/t megawatt-hour/tonne
MWh/yr megawatt-hour/year
RMB renminbi (Chinese currency)
RMB/kWh renminbi/kilowatt-hour
RMB/m3 renminbi/cubic meter
RMB/tce renminbi/tonnes of coal equivalent
tce tonnes of coal equivalent
TWh terawatt-hours
45
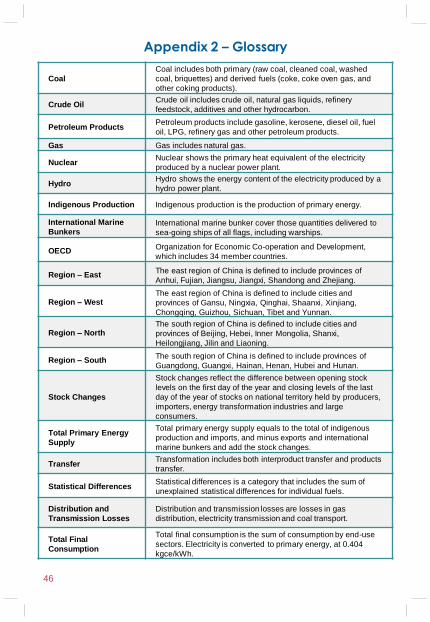
Appendix 2 – Glossary
46
Coal
Coal includes both primary (raw coal, cleaned coal, washed
coal, briquettes) and derived fuels (coke, coke oven gas, and
other coking products).
Crude Oil Crude oil includes crude oil, natural gas liquids, refinery
feedstock, additives and other hydrocarbon.
Petroleum Products Petroleum products include gasoline, kerosene, diesel oil, fuel
oil, LPG, refinery gas and other petroleum products.
Gas Gas includes natural gas.
Nuclear Nuclear shows the primary heat equivalent of the electricity
produced by a nuclear power plant.
Hydro Hydro shows the energy content of the electricity produced by a
hydro power plant.
Indigenous Production Indigenous production is the production of primary energy.
International Marine
Bunkers International marine bunker cover those quantities delivered to
sea-going ships of all flags, including warships.
OECD Organization for Economic Co-operation and Development,
which includes 34 member countries.
Region – East The east region of China is defined to include provinces of
Anhui, Fujian, Jiangsu, Jiangxi, Shandong and Zhejiang.
Region – West The east region of China is defined to include cities and
provinces of Gansu, Ningxia, Qinghai, Shaanxi, Xinjiang,
Chongqing, Guizhou, Sichuan, Tibet and Yunnan.
Region – North The south region of China is defined to include cities and
provinces of Beijing, Hebei, Inner Mongolia, Shanxi,
Heilongjiang, Jilin and Liaoning.
Region – South The south region of China is defined to include provinces of
Guangdong, Guangxi, Hainan, Henan, Hubei and Hunan.
Stock Changes
Stock changes reflect the difference between opening stock
levels on the first day of the year and closing levels of the last
day of the year of stocks on national territory held by producers,
importers, energy transformation industries and large
consumers.
Total Primary Energy
Supply
Total primary energy supply equals to the total of indigenous
production and imports, and minus exports and international
marine bunkers and add the stock changes.
Transfer Transformation includes both interproduct transfer and products
transfer.
Statistical Differences Statistical differences is a category that includes the sum of
unexplained statistical differences for individual fuels.
Distribution and
Transmission Losses
Distribution and transmission losses are losses in gas
distribution, electricity transmission and coal transport.
Total Final
Consumption
Total final consumption is the sum of consumption by end-use
sectors. Electricity is converted to primary energy, at 0.404
kgce/kWh.
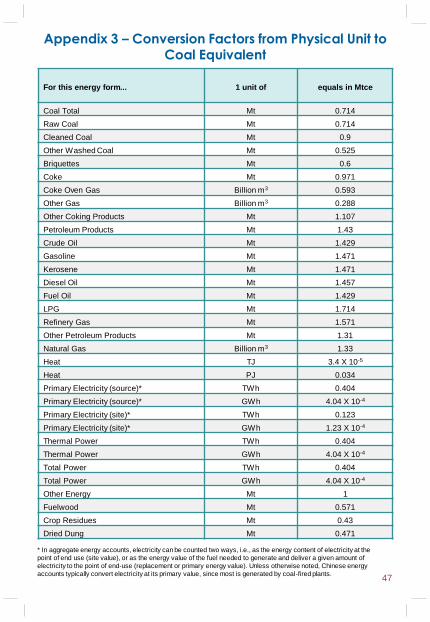
Appendix 3 – Conversion Factors from Physical Unit to Coal Equivalent
For this energy form... 1 unit of equals in Mtce
Coal Total Mt 0.714
Raw Coal Mt 0.714
Cleaned Coal Mt 0.9
Other Washed Coal Mt 0.525
Briquettes Mt 0.6
Coke Mt 0.971
Coke Oven Gas Billion m3 0.593
Other Gas Billion m3 0.288
Other Coking Products Mt 1.107
Petroleum Products Mt 1.43
Crude Oil Mt 1.429
Gasoline Mt 1.471
Kerosene Mt 1.471
Diesel Oil Mt 1.457
Fuel Oil Mt 1.429
LPG Mt 1.714
Refinery Gas Mt 1.571
Other Petroleum Products Mt 1.31
Natural Gas Billion m3 1.33
Heat TJ 3.4 X 10⁻⁵
Heat PJ 0.034
Primary Electricity (source)* TWh 0.404
Primary Electricity (source)* GWh 4.04 X 10⁻⁴
Primary Electricity (site)* TWh 0.123
Primary Electricity (site)* GWh 1.23 X 10⁻⁴
Thermal Power TWh 0.404
Thermal Power GWh 4.04 X 10⁻⁴
Total Power TWh 0.404
Total Power GWh 4.04 X 10⁻⁴
Other Energy Mt 1
Fuelwood Mt 0.571
Crop Residues Mt 0.43
Dried Dung Mt 0.471
* In aggregate energy accounts, electricity can be counted two ways, i.e., as the energy content of electricity at the
point of end use (site value), or as the energy value of the fuel needed to generate and deliver a given amount of
electricity to the point of end-use (replacement or primary energy value). Unless otherwise noted, Chinese energy
accounts typically convert electricity at its primary value, since most is generated by coal-fired plants. 47
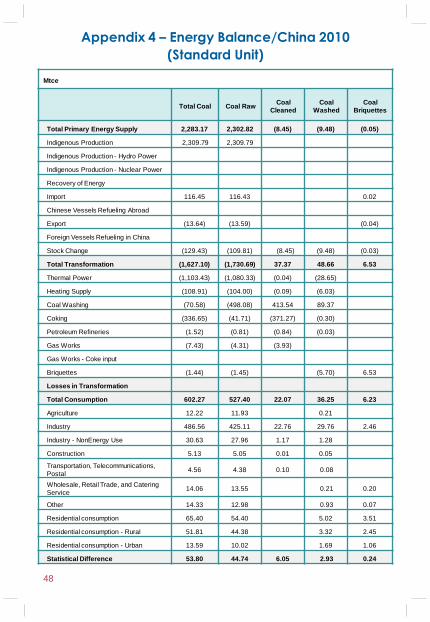
Appendix 4 – Energy Balance/China 2010
(Standard Unit)
48
Mtce
Total Coal Coal Raw Coal
Cleaned
Coal
Washed
Coal
Briquettes
Total Primary Energy Supply 2,283.17 2,302.82 (8.45) (9.48) (0.05)
Indigenous Production 2,309.79 2,309.79
Indigenous Production - Hydro Power
Indigenous Production - Nuclear Power
Recovery of Energy
Import 116.45 116.43 0.02
Chinese Vessels Refueling Abroad
Export (13.64) (13.59) (0.04)
Foreign Vessels Refueling in China
Stock Change (129.43) (109.81) (8.45) (9.48) (0.03)
Total Transformation (1,627.10) (1,730.69) 37.37 48.66 6.53
Thermal Power (1,103.43) (1,080.33) (0.04) (28.65)
Heating Supply (108.91) (104.00) (0.09) (6.03)
Coal Washing (70.58) (498.08) 413.54 89.37
Coking (336.65) (41.71) (371.27) (0.30)
Petroleum Refineries (1.52) (0.81) (0.84) (0.03)
Gas Works (7.43) (4.31) (3.93)
Gas Works - Coke input
Briquettes (1.44) (1.45) (5.70) 6.53
Losses in Transformation
Total Consumption 602.27 527.40 22.07 36.25 6.23
Agriculture 12.22 11.93 0.21
Industry 486.56 425.11 22.76 29.76 2.46
Industry - NonEnergy Use 30.63 27.96 1.17 1.28
Construction 5.13 5.05 0.01 0.05
Transportation, Telecommunications,
Postal 4.56 4.38 0.10 0.08
Wholesale, Retail Trade, and Catering
Service 14.06 13.55 0.21 0.20
Other 14.33 12.98 0.93 0.07
Residential consumption 65.40 54.40 5.02 3.51
Residential consumption - Rural 51.81 44.38 3.32 2.45
Residential consumption - Urban 13.59 10.02 1.69 1.06
Statistical Difference 53.80 44.74 6.05 2.93 0.24
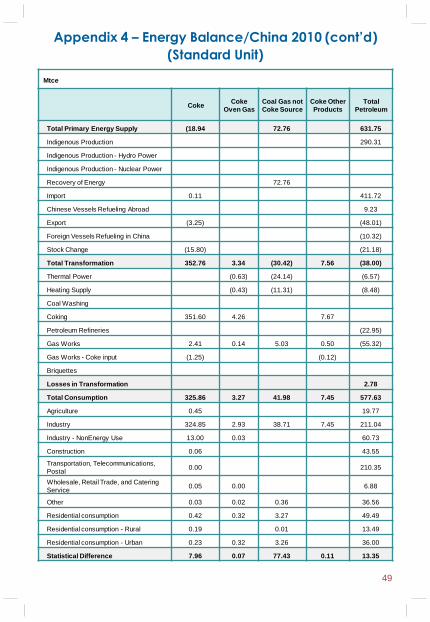
Appendix 4 – Energy Balance/China 2010 (cont’d)
(Standard Unit)
Mtce
Coke Coke
Oven Gas
Coal Gas not
Coke Source
Coke Other
Products
Total
Petroleum
Total Primary Energy Supply (18.94 72.76 631.75
Indigenous Production 290.31
Indigenous Production - Hydro Power
Indigenous Production - Nuclear Power
Recovery of Energy 72.76
Import 0.11 411.72
Chinese Vessels Refueling Abroad 9.23
Export (3.25) (48.01)
Foreign Vessels Refueling in China (10.32)
Stock Change (15.80) (21.18)
Total Transformation 352.76 3.34 (30.42) 7.56 (38.00)
Thermal Power (0.63) (24.14) (6.57)
Heating Supply (0.43) (11.31) (8.48)
Coal Washing
Coking 351.60 4.26 7.67
Petroleum Refineries (22.95)
Gas Works 2.41 0.14 5.03 0.50 (55.32)
Gas Works - Coke input (1.25) (0.12)
Briquettes
Losses in Transformation 2.78
Total Consumption 325.86 3.27 41.98 7.45 577.63
Agriculture 0.45 19.77
Industry 324.85 2.93 38.71 7.45 211.04
Industry - NonEnergy Use 13.00 0.03 60.73
Construction 0.06 43.55
Transportation, Telecommunications,
Postal 0.00 210.35
Wholesale, Retail Trade, and Catering
Service 0.05 0.00 6.88
Other 0.03 0.02 0.36 36.56
Residential consumption 0.42 0.32 3.27 49.49
Residential consumption - Rural 0.19 0.01 13.49
Residential consumption - Urban 0.23 0.32 3.26 36.00
Statistical Difference 7.96 0.07 77.43 0.11 13.35
49
Appendix 4 – Energy Balance/China 2010 (cont’d)
(Standard Unit)
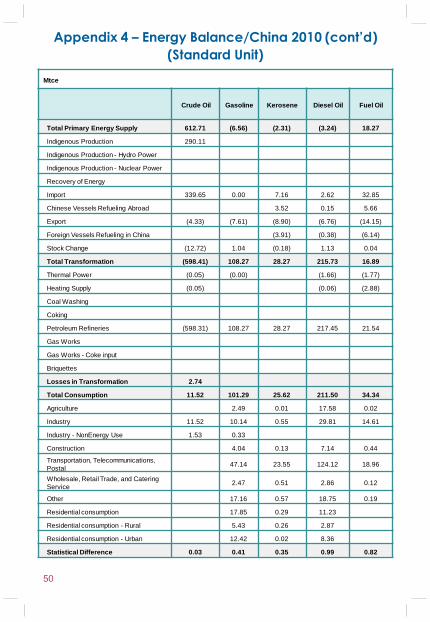
50
Mtce
Crude Oil Gasoline Kerosene Diesel Oil Fuel Oil
Total Primary Energy Supply 612.71 (6.56) (2.31) (3.24) 18.27
Indigenous Production 290.11
Indigenous Production - Hydro Power
Indigenous Production - Nuclear Power
Recovery of Energy
Import 339.65 0.00 7.16 2.62 32.85
Chinese Vessels Refueling Abroad 3.52 0.15 5.66
Export (4.33) (7.61) (8.90) (6.76) (14.15)
Foreign Vessels Refueling in China (3.91) (0.38) (6.14)
Stock Change (12.72) 1.04 (0.18) 1.13 0.04
Total Transformation (598.41) 108.27 28.27 215.73 16.89
Thermal Power (0.05) (0.00) (1.66) (1.77)
Heating Supply (0.05) (0.06) (2.88)
Coal Washing
Coking
Petroleum Refineries (598.31) 108.27 28.27 217.45 21.54
Gas Works
Gas Works - Coke input
Briquettes
Losses in Transformation 2.74
Total Consumption 11.52 101.29 25.62 211.50 34.34
Agriculture 2.49 0.01 17.58 0.02
Industry 11.52 10.14 0.55 29.81 14.61
Industry - NonEnergy Use 1.53 0.33
Construction 4.04 0.13 7.14 0.44
Transportation, Telecommunications,
Postal 47.14 23.55 124.12 18.96
Wholesale, Retail Trade, and Catering
Service 2.47 0.51 2.86 0.12
Other 17.16 0.57 18.75 0.19
Residential consumption 17.85 0.29 11.23
Residential consumption - Rural 5.43 0.26 2.87
Residential consumption - Urban 12.42 0.02 8.36
Statistical Difference 0.03 0.41 0.35 0.99 0.82
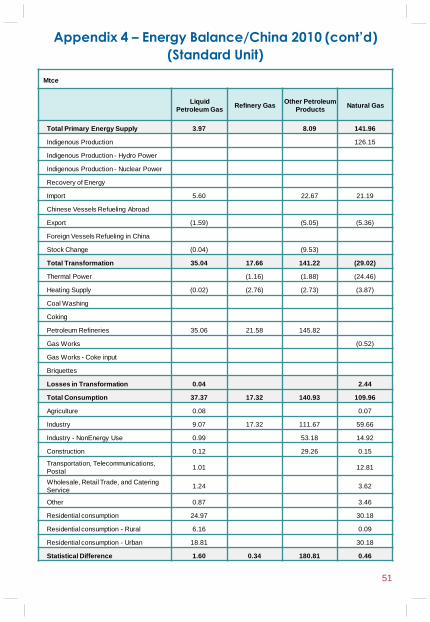
Appendix 4 – Energy Balance/China 2010 (cont’d)
(Standard Unit)
Mtce
Liquid
Petroleum Gas Refinery Gas
Other Petroleum
Products Natural Gas
Total Primary Energy Supply 3.97 8.09 141.96
Indigenous Production 126.15
Indigenous Production - Hydro Power
Indigenous Production - Nuclear Power
Recovery of Energy
Import 5.60 22.67 21.19
Chinese Vessels Refueling Abroad
Export (1.59) (5.05) (5.36)
Foreign Vessels Refueling in China
Stock Change (0.04) (9.53)
Total Transformation 35.04 17.66 141.22 (29.02)
Thermal Power (1.16) (1.88) (24.46)
Heating Supply (0.02) (2.76) (2.73) (3.87)
Coal Washing
Coking
Petroleum Refineries 35.06 21.58 145.82
Gas Works (0.52)
Gas Works - Coke input
Briquettes
Losses in Transformation 0.04 2.44
Total Consumption 37.37 17.32 140.93 109.96
Agriculture 0.08 0.07
Industry 9.07 17.32 111.67 59.66
Industry - NonEnergy Use 0.99 53.18 14.92
Construction 0.12 29.26 0.15
Transportation, Telecommunications,
Postal 1.01 12.81
Wholesale, Retail Trade, and Catering
Service 1.24 3.62
Other 0.87 3.46
Residential consumption 24.97 30.18
Residential consumption - Rural 6.16 0.09
Residential consumption - Urban 18.81 30.18
Statistical Difference 1.60 0.34 180.81 0.46
51
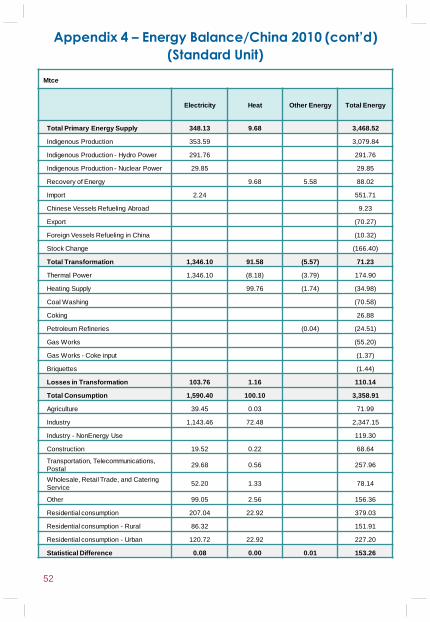
Appendix 4 – Energy Balance/China 2010 (cont’d)
(Standard Unit)
52
Mtce
Electricity Heat Other Energy Total Energy
Total Primary Energy Supply 348.13 9.68 3,468.52
Indigenous Production 353.59 3,079.84
Indigenous Production - Hydro Power 291.76 291.76
Indigenous Production - Nuclear Power 29.85 29.85
Recovery of Energy 9.68 5.58 88.02
Import 2.24 551.71
Chinese Vessels Refueling Abroad 9.23
Export (70.27)
Foreign Vessels Refueling in China (10.32)
Stock Change (166.40)
Total Transformation 1,346.10 91.58 (5.57) 71.23
Thermal Power 1,346.10 (8.18) (3.79) 174.90
Heating Supply 99.76 (1.74) (34.98)
Coal Washing (70.58)
Coking 26.88
Petroleum Refineries (0.04) (24.51)
Gas Works (55.20)
Gas Works - Coke input (1.37)
Briquettes (1.44)
Losses in Transformation 103.76 1.16 110.14
Total Consumption 1,590.40 100.10 3,358.91
Agriculture 39.45 0.03 71.99
Industry 1,143.46 72.48 2,347.15
Industry - NonEnergy Use 119.30
Construction 19.52 0.22 68.64
Transportation, Telecommunications,
Postal 29.68 0.56 257.96
Wholesale, Retail Trade, and Catering
Service 52.20 1.33 78.14
Other 99.05 2.56 156.36
Residential consumption 207.04 22.92 379.03
Residential consumption - Rural 86.32 151.91
Residential consumption - Urban 120.72 22.92 227.20
Statistical Difference 0.08 0.00 0.01 153.26
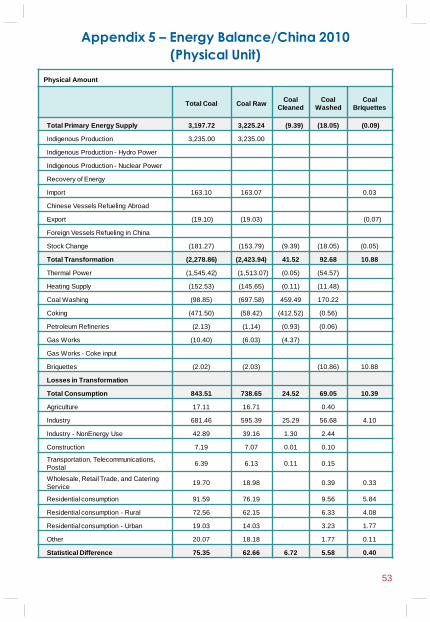
Appendix 5 – Energy Balance/China 2010
(Physical Unit)
Physical Amount
Total Coal Coal Raw Coal
Cleaned
Coal
Washed
Coal
Briquettes
Total Primary Energy Supply 3,197.72 3,225.24 (9.39) (18.05) (0.09)
Indigenous Production 3,235.00 3,235.00
Indigenous Production - Hydro Power
Indigenous Production - Nuclear Power
Recovery of Energy
Import 163.10 163.07 0.03
Chinese Vessels Refueling Abroad
Export (19.10) (19.03) (0.07)
Foreign Vessels Refueling in China
Stock Change (181.27) (153.79) (9.39) (18.05) (0.05)
Total Transformation (2,278.86) (2,423.94) 41.52 92.68 10.88
Thermal Power (1,545.42) (1,513.07) (0.05) (54.57)
Heating Supply (152.53) (145.65) (0.11) (11.48)
Coal Washing (98.85) (697.58) 459.49 170.22
Coking (471.50) (58.42) (412.52) (0.56)
Petroleum Refineries (2.13) (1.14) (0.93) (0.06)
Gas Works (10.40) (6.03) (4.37)
Gas Works - Coke input
Briquettes (2.02) (2.03) (10.86) 10.88
Losses in Transformation
Total Consumption 843.51 738.65 24.52 69.05 10.39
Agriculture 17.11 16.71 0.40
Industry 681.46 595.39 25.29 56.68 4.10
Industry - NonEnergy Use 42.89 39.16 1.30 2.44
Construction 7.19 7.07 0.01 0.10
Transportation, Telecommunications,
Postal 6.39 6.13 0.11 0.15
Wholesale, Retail Trade, and Catering
Service 19.70 18.98 0.39 0.33
Residential consumption 91.59 76.19 9.56 5.84
Residential consumption - Rural 72.56 62.15 6.33 4.08
Residential consumption - Urban 19.03 14.03 3.23 1.77
Other 20.07 18.18 1.77 0.11
Statistical Difference 75.35 62.66 6.72 5.58 0.40
53
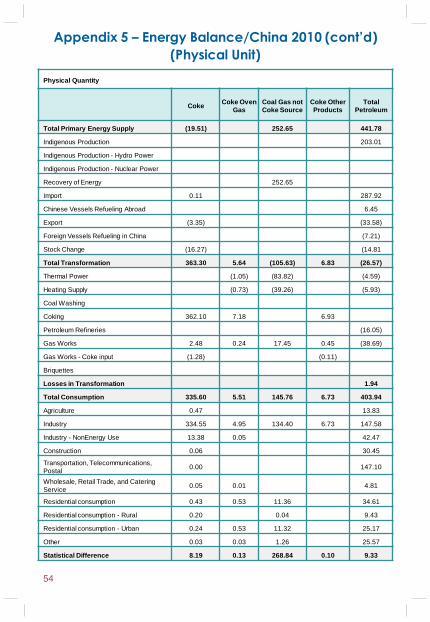
Appendix 5 – Energy Balance/China 2010 (cont’d)
(Physical Unit)
54
Physical Quantity
Coke Coke Oven
Gas
Coal Gas not
Coke Source
Coke Other
Products
Total
Petroleum
Total Primary Energy Supply (19.51) 252.65 441.78
Indigenous Production 203.01
Indigenous Production - Hydro Power
Indigenous Production - Nuclear Power
Recovery of Energy 252.65
Import 0.11 287.92
Chinese Vessels Refueling Abroad 6.45
Export (3.35) (33.58)
Foreign Vessels Refueling in China (7.21)
Stock Change (16.27) (14.81
Total Transformation 363.30 5.64 (105.63) 6.83 (26.57)
Thermal Power (1.05) (83.82) (4.59)
Heating Supply (0.73) (39.26) (5.93)
Coal Washing
Coking 362.10 7.18 6.93
Petroleum Refineries (16.05)
Gas Works 2.48 0.24 17.45 0.45 (38.69)
Gas Works - Coke input (1.28) (0.11)
Briquettes
Losses in Transformation 1.94
Total Consumption 335.60 5.51 145.76 6.73 403.94
Agriculture 0.47 13.83
Industry 334.55 4.95 134.40 6.73 147.58
Industry - NonEnergy Use 13.38 0.05 42.47
Construction 0.06 30.45
Transportation, Telecommunications,
Postal 0.00 147.10
Wholesale, Retail Trade, and Catering
Service 0.05 0.01 4.81
Residential consumption 0.43 0.53 11.36 34.61
Residential consumption - Rural 0.20 0.04 9.43
Residential consumption - Urban 0.24 0.53 11.32 25.17
Other 0.03 0.03 1.26 25.57
Statistical Difference 8.19 0.13 268.84 0.10 9.33
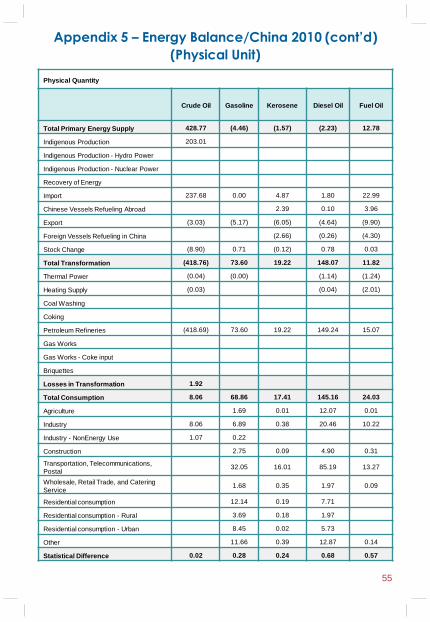
Appendix 5 – Energy Balance/China 2010 (cont’d)
(Physical Unit)
Physical Quantity
Crude Oil Gasoline Kerosene Diesel Oil Fuel Oil
Total Primary Energy Supply 428.77 (4.46) (1.57) (2.23) 12.78
Indigenous Production 203.01
Indigenous Production - Hydro Power
Indigenous Production - Nuclear Power
Recovery of Energy
Import 237.68 0.00 4.87 1.80 22.99
Chinese Vessels Refueling Abroad 2.39 0.10 3.96
Export (3.03) (5.17) (6.05) (4.64) (9.90)
Foreign Vessels Refueling in China (2.66) (0.26) (4.30)
Stock Change (8.90) 0.71 (0.12) 0.78 0.03
Total Transformation (418.76) 73.60 19.22 148.07 11.82
Thermal Power (0.04) (0.00) (1.14) (1.24)
Heating Supply (0.03) (0.04) (2.01)
Coal Washing
Coking
Petroleum Refineries (418.69) 73.60 19.22 149.24 15.07
Gas Works
Gas Works - Coke input
Briquettes
Losses in Transformation 1.92
Total Consumption 8.06 68.86 17.41 145.16 24.03
Agriculture 1.69 0.01 12.07 0.01
Industry 8.06 6.89 0.38 20.46 10.22
Industry - NonEnergy Use 1.07 0.22
Construction 2.75 0.09 4.90 0.31
Transportation, Telecommunications,
Postal 32.05 16.01 85.19 13.27
Wholesale, Retail Trade, and Catering
Service 1.68 0.35 1.97 0.09
Residential consumption 12.14 0.19 7.71
Residential consumption - Rural 3.69 0.18 1.97
Residential consumption - Urban 8.45 0.02 5.73
Other 11.66 0.39 12.87 0.14
Statistical Difference 0.02 0.28 0.24 0.68 0.57
55
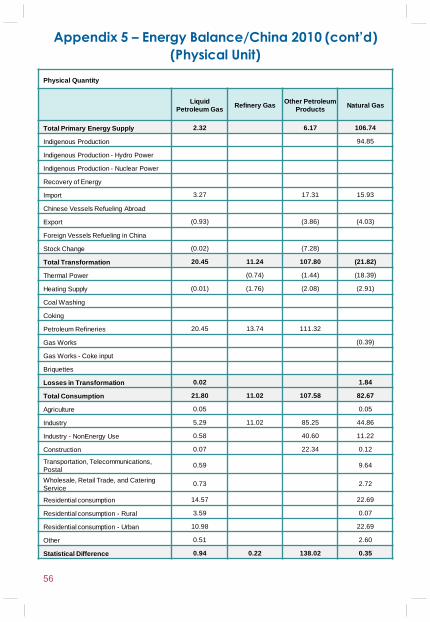
Appendix 5 – Energy Balance/China 2010 (cont’d)
(Physical Unit)
56
Physical Quantity
Liquid
Petroleum Gas Refinery Gas
Other Petroleum
Products Natural Gas
Total Primary Energy Supply 2.32 6.17 106.74
Indigenous Production 94.85
Indigenous Production - Hydro Power
Indigenous Production - Nuclear Power
Recovery of Energy
Import 3.27 17.31 15.93
Chinese Vessels Refueling Abroad
Export (0.93) (3.86) (4.03)
Foreign Vessels Refueling in China
Stock Change (0.02) (7.28)
Total Transformation 20.45 11.24 107.80 (21.82)
Thermal Power (0.74) (1.44) (18.39)
Heating Supply (0.01) (1.76) (2.08) (2.91)
Coal Washing
Coking
Petroleum Refineries 20.45 13.74 111.32
Gas Works (0.39)
Gas Works - Coke input
Briquettes
Losses in Transformation 0.02 1.84
Total Consumption 21.80 11.02 107.58 82.67
Agriculture 0.05 0.05
Industry 5.29 11.02 85.25 44.86
Industry - NonEnergy Use 0.58 40.60 11.22
Construction 0.07 22.34 0.12
Transportation, Telecommunications,
Postal 0.59 9.64
Wholesale, Retail Trade, and Catering
Service 0.73 2.72
Residential consumption 14.57 22.69
Residential consumption - Rural 3.59 0.07
Residential consumption - Urban 10.98 22.69
Other 0.51 2.60
Statistical Difference 0.94 0.22 138.02 0.35
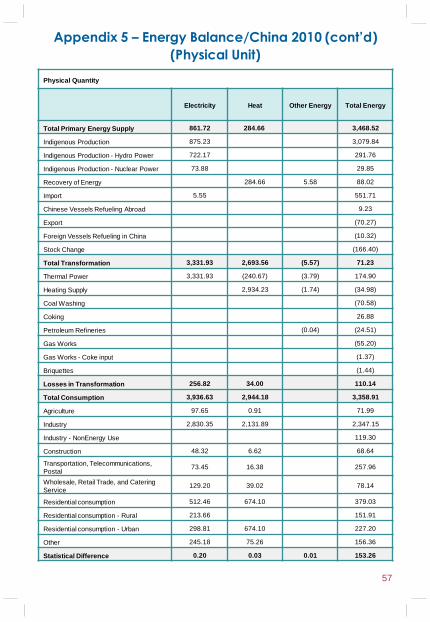
Appendix 5 – Energy Balance/China 2010 (cont’d)
(Physical Unit)
Physical Quantity
Electricity Heat Other Energy Total Energy
Total Primary Energy Supply 861.72 284.66 3,468.52
Indigenous Production 875.23 3,079.84
Indigenous Production - Hydro Power 722.17 291.76
Indigenous Production - Nuclear Power 73.88 29.85
Recovery of Energy 284.66 5.58 88.02
Import 5.55 551.71
Chinese Vessels Refueling Abroad 9.23
Export (70.27)
Foreign Vessels Refueling in China (10.32)
Stock Change (166.40)
Total Transformation 3,331.93 2,693.56 (5.57) 71.23
Thermal Power 3,331.93 (240.67) (3.79) 174.90
Heating Supply 2,934.23 (1.74) (34.98)
Coal Washing (70.58)
Coking 26.88
Petroleum Refineries (0.04) (24.51)
Gas Works (55.20)
Gas Works - Coke input (1.37)
Briquettes (1.44)
Losses in Transformation 256.82 34.00 110.14
Total Consumption 3,936.63 2,944.18 3,358.91
Agriculture 97.65 0.91 71.99
Industry 2,830.35 2,131.89 2,347.15
Industry - NonEnergy Use 119.30
Construction 48.32 6.62 68.64
Transportation, Telecommunications,
Postal 73.45 16.38 257.96
Wholesale, Retail Trade, and Catering
Service 129.20 39.02 78.14
Residential consumption 512.46 674.10 379.03
Residential consumption - Rural 213.66 151.91
Residential consumption - Urban 298.81 674.10 227.20
Other 245.18 75.26 156.36
Statistical Difference 0.20 0.03 0.01 153.26
57
Appendix 6 – Data Sources
58
1. Supply
United Nations. United Nations Commodity Trade Statistics
Database. New York: United Nations.
National Bureau of Statistics of the People's Republic of China,
various years. China Energy Statistical Yearbook. Beijing: China
Statistics Press.
2. Transformation
National Bureau of Statistics of the People's Republic of China,
various years. China Energy Statistical Yearbook. Beijing: China
Statistics Press.
3. Consumption
National Bureau of Statistics of the People's Republic of China,
various years. China Energy Statistical Yearbook. Beijing: China
Statistics Press.
4. Prices
Department of Price, National Development and Reform
Commission, China.
State Electricity Regulatory Commission of the People's Republic
of China, various years. Annual Report of Electricity Regulation.
Beijing: State Electricity Regulatory Commission.
Energy Information Administration, United States.
International Energy Statistics.
Ni, C. 2009. China Energy Primer. Berkeley, CA: Lawrence
Berkeley National Laboratory (LBNL-2860E).
Appendix 6 – Data Sources
5. Emissions
National Bureau of Statistics of the People's Republic of China,
various years. China Energy Statistical Yearbook. Beijing: China
Statistics Press.
National Bureau of Statistics of the People's Republic of China,
various years. China Statistical Yearbook. Beijing: China Statistics
Press.
Intergovernmental Panel on Climate Change (IPCC), 2006.
Revised 2006 IPCC Guidelines for National Greenhouse Gas
Inventories: Reference Manual (Volume 3).
6. Economic and Demographic Indicators
National Bureau of Statistics of the People's Republic of China,
various years. China Statistical Yearbook. Beijing: China Statistics
Press.
7. International Comparison
International Energy Agency (IEA). 2011. Key World Energy
Statistics 2011. Paris, France: IEA.
Appendices:
National Bureau of Statistics of the People's Republic of China,
2012. 2011 China Energy Statistical Yearbook. Beijing: China
Statistics Press.
59
Acknowledgements
60
The LBNL team responsible for this compilation of energy
statistics of China consists of David Fridley, Mark Levine,
Hongyou Lu, and Cecilia Fino-Chen. The team wishes to
acknowledge the following institutions and individuals:
The Dow Chemical Company for their financial support of the
compilation and equally for their patience in accepting the long
delay brought about by the decadal revision of energy
statistics;
The China Sustainable Energy Program of the Energy
Foundation whose grants have enabled the China Energy
Group to gain access to many data sources in China and to
augment the expertise needed to understand the data.
Our Chinese colleagues who provided valuable data.
The International Energy Agency (IEA) whose compilation “Key
World Energy Statistics” gave us the idea for this booklet and
whose template served as a guide to our work. “Imitation is
the highest form of flattery.”
Darren Verbout, for his wonderful sense of graphics
presentation and layout and especially for his willingness to do
whatever was needed when it was needed; and
All members of the China Energy Group at LBNL for their
assistance in data collection and review.
We also acknowledge most of these same parties for the support
of the much more extensive China Energy Databook. Instructions
for obtaining the databook can be found on our website
http://china.lbl.gov.
We plan to publish updates to this compilation annually or
biannually. We are thus eager to learn about any errors you may
find, suggestions for improvement, and the most important data
additions you would like to see.
This work was supported by the U.S. Department of Energy under
Contract No. DE-AC02-05CH11231.

Notes

Notes

Notes
http://china.lbl.gov
For more information about the
LBNL China Energy Group, go to our website:
Environmental Energy Technologies Division
Lawrence Berkeley
National Laboratory