Embed Size (px)
Citation preview

TEKS (3)(G) Determine possible solutions in the solution set of systems of two or more linear inequalities in two variables.
TEKS (1)(A) Apply mathematics to problems arising in everyday life, society, and the workplace.
Additional TEKS (3)(E), (3)(F)
TEKS FOCUS
•Constraint – restriction on the variables of the objective function in a linear programming problem
•Feasible region – contains all the values that satisfy the constraints of the objective function
•Linear programming – a method for finding a minimum or maximum value of some quantity, given a set of constraints
•Objective function – a model of the quantity that you want to make as large or as small as possible
•Apply – use knowledge or information for a specific purpose, such as solving a problem
VOCABULARY
Some real-world problems involve multiple linear relationships. Linear programming accounts for all of these linear relationships and gives the solution to the problem.
ESSENTIAL UNDERSTANDING
If there is a maximum or a minimum value of the linear objective function, it occurs at one or more vertices of the feasible region.
The constraints in a linear programming situation form a system of inequalities, like the one at the right. The graph of the system is the feasible region. It contains all the points that satisfy all the constraints.
The quantity you are trying to maximize or minimize is modeled with an objective function. Often this quantity is cost or profit. Suppose the objective function is C = 2x + y.
Graphs of the objective function for various values of C are parallel lines. Lines closer to the origin represent smaller values of C.
The graphs of the equations 7 = 2x + y and 17 = 2x + y intersect the feasible region at (2, 3) and (7, 3). These vertices of the feasible region represent the least and the greatest values for the objective function.
Key Concept Vertex Principle of Linear Programming
2 4 6 8
4
6
8
2
O
y
x
FeasibleRegion
2 4 6 8
4
6
8
2
O
y
x
17 � 2x � y
7 � 2x � y
d x Ú 2
y Ú 3
y … 6
x + y … 10
3-4 Linear Programming
88 Lesson 3-4 Linear Programming
Problem 2
Problem 1
Testing Vertices
Multiple Choice What point in the feasible region maximizes P for the objective function P ∙ 2x ∙ y?
(2, 0) (0, 0) (3, 1) (0, 2.5)
Step 1
Graph the inequalities.
2 4�2
2
y
xO
x � y � 2
x � 2y � 5
Step 2
Form the feasible region.
x
y4
4
2
Q
R
T
S
The intersections ofthe boundaries arethe vertices of thefeasible region.
Step 3
Find the coordinates of each vertex.
Q (0, 0)
R (0, 2.5)
S (3, 1)
T (2, 0)
Step 4
Evaluate P at each vertex.
P = 2(0) + 0 = 0
P = 2(0) + 2.5 = 2.5
P = 2(3) + 1 = 7
P = 2(2) + 0 = 4
P has a maximum value of 7 when x = 3 and y = 1. The correct choice is C.
Maximum Value
Constraints d x ∙ 2y " 5x ∙ y " 2x # 0y # 0
Using Linear Programming to Maximize Profit
Business You are screen-printing T-shirts and sweatshirts to sell at the Polk County Blues Festival and are working with the following constraints.
• Youhaveatmost20hourstomakeshirts.
• Youwanttospendnomorethan$600 on supplies.
• Youwanttohaveatleast50items to sell.
How many T-shirts and how many sweatshirts should you make to maximize your profit? How much is the maximum profit?
TEKS Process Standard (1)(A)
3-Color Sweatshirt Takes 30 minutes to make
Takes 10 minutes to make1-Color T-shirt
Profit $6Supplies cost $4
Supplies cost $20
Profit $20
continued on next page ▶
What quadrant will the feasible region be in?The constraints x Ú 0 and y Ú 0 indicate the first quadrant.
89PearsonTEXAS.com

continuedProblem 2
Organize the information in a table.
Write the constraints and the objective function.
Constraints: e 10x + 30y … 1200
x + y Ú 50
4x + 20y … 600
x Ú 0
y Ú 0 Objective Function: P = 6x + 20y
Step 1
Graph the constraints to form the feasible region.
30 60 90 120T-shirts
Swea
tshirts
150
12
18
24
30
6
00
A
B
C
D
Step 2
Find the coordinates of each vertex.
A(50, 0)
B(25, 25)
C(75, 15)
D(120, 0)
Step 3
Evaluate P.
P = 6(50) + 20(0) = 300
P = 6(25) + 20(25) = 650
P = 6(75) + 20(15) = 750
P = 6(120) + 20(0) = 720
You can maximize your profit by selling 75 T-shirts and 15 sweatshirts. The maximum profit is $750.
T-Shirts, x Sweatshirts, y Total
Minutes
Number
Cost
Profit
10x
x
4x
6x
1200
50
600
6x � 20y
30y
y
20y
20y
PRACTICE and APPLICATION EXERCISES
ONLINE
HO
M E W O RK
For additional support whencompleting your homework, go to PearsonTEXAS.com.
Graph each system of constraints. Name all vertices. Then find the values of x and y that maximize or minimize the objective function.
1. d x + y … 8
2x + y … 10
x Ú 0
y Ú 0
2. •x + 2y Ú 8
x Ú 2
y Ú 0
3. •
2 … x … 6
1 … y … 5
x + y … 8
Maximum for Minimum for Maximum for N = 100x + 40y C = x + 3y P = 3x + 2y
4. Apply Mathematics (1)(A) Baking a tray of corn muffins takes 4 cups of milk and 3 cups of wheat flour. Baking a tray of bran muffins takes 2 cups of milk and 3 cups of wheat flour. A baker has 16 cups of milk and 15 cups of wheat flour. He makes $3 profit per tray of corn muffins and $2 profit per tray of bran muffins. How many trays of each type of muffin should the baker make to maximize his profit?
Scan page for a Virtual Nerd™ tutorial video.
How do you find the coordinates of the vertices if they are hard to read off the graph?Solve the system of equations related to the lines that intersect to form the vertex.
90 Lesson 3-4 Linear Programming

5. Apply Mathematics (1)(A) A biologist is developing two new strains of bacteria. Each sample of Type I bacteria produces four new viable bacteria, and each sample of Type II produces three new viable bacteria. Altogether, at least 240 new viable bacteria must be produced. At least 30, but not more than 60, of the original samples must be Type I. Not more than 70 of the original samples can be Type II. A sample of Type I costs $5 and a sample of Type II costs $7. How many samples of Type II bacteria should the biologist use to minimize the cost?
6. Sometimes two corners of a graph both yield the maximum profit. In this case, many other points may also yield the maximum profit. Evaluate the profit formula P = x + 2y for the graph shown. Find four points that yield the maximum profit.
7. Evaluate Reasonableness (1)(B) Your friend is trying to find the maximum value of P = -x + 3y subject to the following constraints.
c y … -2x + 6
y … x + 3
x Ú 0, y Ú 0
What error did your friend make? What is the correct solution?
8. A vertex of a feasible region does not always have whole number coordinates. Sometimes you may need to round coordinates to find the solution. Using the objective function and the constraints at the right, find the whole number values of x and y that minimize C. Then find C for those values of x and y.
D(4, 6)
B(10, 0)x
y
O
E(0, 6) C(10, 3)
2 4 6x
4
6
2
O
y
2 4 6
4
6
2
00
y
x
C = 6x + 9y
•
x + 2y Ú 50
2x + y Ú 60
x Ú 0, y Ú 0
TEXAS Test Practice
9. Which is the graph of y … 0 x - 3 �?
A.
Ox
y
2 4
4
2
B.
Ox
y
2 4
4
2
C.
Ox
y
2 4
4
2
D.
Ox
y
2 4
4
2
10. Solve the equation 12(a + b) = c for b.
F. b = 12c - a G. b = 2a - c H. b = 2c - a J. b = 2ca
91PearsonTEXAS.com

Technology Lab Linear Programming
Use With Lesson 3-4 teks (3)(G), (1)(E)
Step 1 Rewrite the first two inequalities to isolate y. Enter the inequalities.
Step 2 Use the value option of CalC to find the upper left vertex. Press 0 enter .
Step 3 Enter the objective function on the home screen. Press enter for the value of P at the vertex.
Step 4 Use the interseCt option of CalC to find the upper right vertex. Go to the home screen and press enter for the value of P.
Step 5 Use the ZerO option of CalC to find the lower right vertex. Go to the home screen and press enter for the value of P. The objective function has a value of 0 when the vertex is at the origin.
The maximum value of P is 136.
Plot1 Plot2 Plot3Y1Y2\Y3\Y4\Y5\Y6\Y7
= (3/2)X + 4= 8X – 48= = = = =
Y1 � (3/2)X � 4
X � 0 Y � 4
13X + 2Y 8
IntersectionX = 8 Y = 16
13X + 2Y 8
13678
You can solve linear programming problems using your graphing calculator.
Find the values of x and y that will maximize the objective function P ∙ 13x ∙ 2y for the constraints at the right. What is the value of P at this maximum point? •
∙3x ∙ 2y " 8∙8x ∙ y # ∙48
x # 0, y # 0
continued on next page ▶
92 technology lab Linear Programming
Technology Lab continued
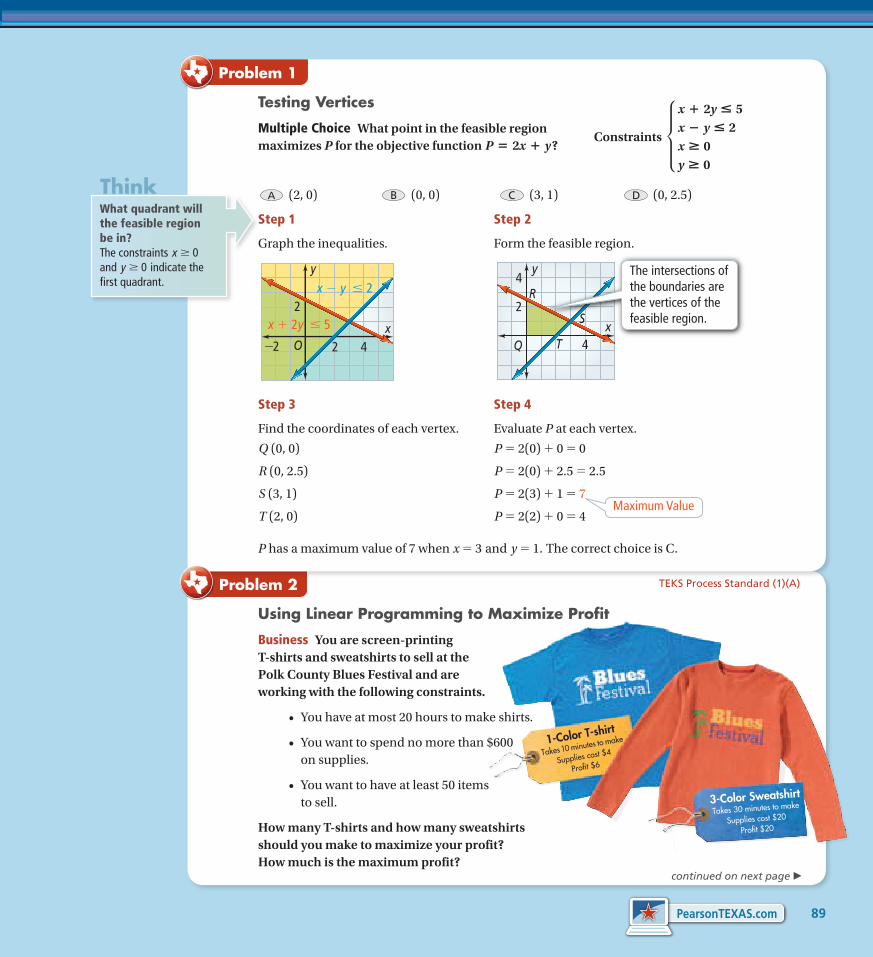
ExercisesGraph the following systems of inequalities using a graphing calculator. Identify each vertex of the region.
1. •y … -3x + 9
y … -12x + 4
x Ú 0, y Ú 0
2. •3x + 2y … 24
5x + 6y Ú 60
x Ú 0, y Ú 0
3. •x + 3y Ú 18
5x + 2y Ú 25
x Ú 0, y Ú 0
4. µ5x - y … 40
x + y … 20
y … 15
x Ú 0, y Ú 0
Find the values of x and y that maximize or minimize the objective function.
5. •
4x + 3y Ú 30
x + 3y Ú 21
x Ú 0, y Ú 0
6. •
3x + 5y Ú 35
2x + y … 14
x Ú 0, y Ú 0
Minimum for Maximum for C = 5x + 8y P = 3x + 2y
7. •
x + y Ú 8
x + 5y Ú 20
x Ú 0, y Ú 2
8. µ
x + 2y … 24
3x + 2y … 34
3x + y … 29
x Ú 0, y Ú 0
Minimum for Maximum for C = 3x + 4y P = 2x + 3y
93PearsonTEXAS.com


![1 A Tighter Uncertainty Principle For Linear Canonical ... · A Tighter Uncertainty Principle For Linear Canonical Transform ... [16] and [21] are not as the same as that for the](https://img.pdfslide.net/doc/110x75/5b3793bd7f8b9a4a728c380a/1-a-tighter-uncertainty-principle-for-linear-canonical-a-tighter-uncertainty.jpg)