Embed Size (px)
Citation preview

"A4rb
_sta
ndar
d_band_
phot
o" – 2
0100111 –
do n
ot dele
te this
text
obje
ct!
colo
red
Key Findings:
EFInA Access to Financial Services in Nigeria
2018 Survey
11 December, 2018

"A4rb
_sta
ndar
d_band_
phot
o" – 2
0100111 –
do n
ot dele
te this
text
obje
ct!
colo
red
2
A
B
C
D
F
Background
Nigeria at a Glance
Financial Behaviour – Uptake & Usage
Financial Inclusion Indicator (Financial Access Strand)
Key Take Outs
E Access Frontiers for achieving the NFIS Targets
Contents
2

"A4rb
_sta
ndar
d_band_
phot
o" – 2
0100111 –
do n
ot dele
te this
text
obje
ct!
colo
red
A. Background

"A4rb
_sta
ndar
d_band_
phot
o" – 2
0100111 –
do n
ot dele
te this
text
obje
ct!
colo
red
4
Background
4
About EFInA Enhancing Financial Innovation & Access (EFInA) is a financial sector development organization that promotes financial inclusion in Nigeria
EFInA’s vision is to be the leader in facilitating the emergence of an all-inclusive and growth-promoting financial system. EFInA adopts a holistic approach to impact the market at three levels – micro, meso and macro levels
Leveraging A2F
2018 Surveys A2F research identifies the financial needs of the adult population and gives service
providers data and analyses to develop innovative products to serve them
It provides insights into regulatory and market obstacles to growth and innovation in the financial sector
Approach &
Methodology The A2F survey has been conducted biennially since 2008.
The size of the participants included in each of the survey prior to 2018 A2F was 24,000 with a proportional representation across states.
Nationally representative sample of Nigerian adults (18+) across all 36 states and FCT Abuja
Results are weighted by the National Bureau of Statistics (NBS) to provide for the total adult population and benchmarked to national population estimates for verification

"A4rb
_sta
ndar
d_band_
phot
o" – 2
0100111 –
do n
ot dele
te this
text
obje
ct!
colo
red
5
Objectives of A2F 2018 Survey
5
• To describe the levels of financial inclusion (i.e. levels of access to financial products and services – both
formal and informal)
• To describe the landscape of access (i.e. the type of products and services used by financially included
individuals)
• To identify the drivers of, and barriers to financial access
• To stimulate evidence-based dialogue that will ultimately lead to effective public and private sector
interventions that will increase and deepen financial inclusion
• To track financial inclusion trends in Nigeria and also to provide an assessment of changes due to
interventions to enhance access and deepen inclusion

"A4rb
_sta
ndar
d_band_
phot
o" – 2
0100111 –
do n
ot dele
te this
text
obje
ct!
colo
red
6
Coverage And Methodology for the A2F 2018 Survey
Design
• Designed by the National Bureau of Statistics (NBS)
• Sampling of respondents was based on equal representation (750 respondents) per state
• Allows for statistically robust headline indicators of financial access at the state, regional and
national level.
Coverage
• Nationally representative sample of Nigerian adults (18+) across all 36 States and FCT
Abuja
• Achieved 27,470 interviews (97% of target sample of 28,380)
• Household listing and data collection conducted from August to October 2018 by Ipsos
Nigeria – a research firm, with supervision by the National Bureau of Statistics (NBS)
Questionnaire
• The questionnaire (in English), was translated into and also administered in Hausa, Yoruba,
Igbo and Pidgin English
Results
• Results were weighted by the NBS to provide for the total adult population.
• Also benchmarked to national population estimates for verification
6

"A4rb
_sta
ndar
d_band_
phot
o" – 2
0100111 –
do n
ot dele
te this
text
obje
ct!
colo
red
B. Nigeria at a Glance

"A4rb
_sta
ndar
d_band_
phot
o" – 2
0100111 –
do n
ot dele
te this
text
obje
ct!
colo
red
8 Source: EFInA Access to Financial Services in Nigeria 2018 survey
Demographic Profile
The Nigerian adult population (18 years and
above) is 99.6 million
Of this adult population:
63.1m (63.3%) are based in rural areas
49.9m (50.1%) are women
56.7m (56.9%) are 35 years and younger
20.2m (20.4%) have no formal education
5.2 average household size
1.6 average income earners per household
56.9%
35 years and
younger
68.9%
Own a Mobile
Phone
20.4% have
No Formal
Education
63.3% Rural
49.9% | 50.1%
Adult
Population
99.6m

"A4rb
_sta
ndar
d_band_
phot
o" – 2
0100111 –
do n
ot dele
te this
text
obje
ct!
colo
red
9
Snapshot Of Key Economic Indicators – Nigeria (1 of 2)
9
Source: Central Bank of Nigeria (CBN)
Source: Central Bank of Nigeria (CBN)
Source: National Bureau Of Statistics (NBS)
80.1 89.0 94.1
101.5 113.7
124.3
50.0
100.0
150.0
2013 2014 2015 2016 2017 2018
Gross Domestic Product in Naira (trillion)
100
53 44
54
73
0
20
40
60
80
100
120
2014 2015 2016 2017 2018
Crude Oil Price (US$/Barrel)
168 197 253 305
305
0
100
200
300
400
2014 2015 2016 2017 2018
USD/Naira Exchange Rate (Max. Selling Rate:Official)

"A4rb
_sta
ndar
d_band_
phot
o" – 2
0100111 –
do n
ot dele
te this
text
obje
ct!
colo
red
10
Snapshot Of Key Economic Indicators – Nigeria (2 of 2)
10
The Consumer Price Index (CPI) measures the average change over time in
prices of goods and services consumed by people for day-to-day living•
Source: National Bureau Of Statistics (NBS)
Source: National Bureau Of Statistics (NBS)
Source: CBN (Money Market Indicators In Percentage)
26 27 27
31 31
22
24
26
28
30
32
2014 2015 2016 2017 2018
Maximum Lending Rate
159 173 190
218 247
100
150
200
250
300
2014 2015 2016 2017 2018
Average CPI
7.8 9
13.4 16.5
18.8
0
5
10
15
20
2014 2015 2016 2017 2018
Unemployment Rate

"A4rb
_sta
ndar
d_band_
phot
o" – 2
0100111 –
do n
ot dele
te this
text
obje
ct!
colo
red
11
Nigeria has exited economic recession but is slowly recovering
11
• Unemployment continues to be on a sharp rise. The rate rose from
13.9% in Q4 2016 to 18.8% in Q4 2017.
• Nigeria is out of the recession that started in the first half of
2016. However, the marginal improvement in economic growth
is not positively impacting employment levels.
Source: NBS - Nigerian Gross Domestic Product Report (Expenditure and Income approach) Q3, 2018
GDP Employment Oil
Revenue Currency
Value Population
Economy Population
• GDP grew by 0.6% from
Q3 2017-Q3 2018
• Marginal increase in oil
revenues due to rising oil
prices
• Inflation dropped from 18%
(Q3 2016) to 11% (Q3
2018)
Inflation
"A4rb
_sta
ndar
d_band_
phot
o" – 2
0100111 –
do n
ot dele
te this
text
obje
ct!
colo
red
12 Source: EFInA Access to Financial Services in Nigeria 2018 survey
Slow economic recovery is yet to impact individuals
Formal sector
employment comparison
%
South Africa 36%
Kenya 14%
India 7%
Tanzania 4%
Source: FS SA/FinAcces/FS Tanzania/India (ILO)
Formal sector
employment
Own business
(non-farming)
Own business
(farming)
Rely mainly on
farming for income
Save
regularly
% of adult
population 8% 16.7% 11.2% 23.4% 53.4%
Vs. 2016 -1.0% -2.9% +1.1% +4.3% -8.2%

"A4rb
_sta
ndar
d_band_
phot
o" – 2
0100111 –
do n
ot dele
te this
text
obje
ct!
colo
red
13 Source: EFInA Access to Financial Services in Nigeria 2018 survey
Slow economic recovery has resulted in more small businesses, largely in agriculture
44.3 million
Business owners
+2.4m
Key sectors:
1. Agriculture (29.3%)
2. Artisan services (21.2%)
3. Retail (19.1%)
4. Other services (12.6%)
5. Construction (6.0%)
36.8m individual entrepreneurs
7.5m business owners with employees
81.2%
18.8%
Employing 22.9 million people
Business owners make important
contribution to employment
Creating about 67.2 million employment including owners
• Micro enterprises (less than 10 employees) =94.8%
• Small enterprises (10 – 49 employees) = 5.2%

"A4rb
_sta
ndar
d_band_
phot
o" – 2
0100111 –
do n
ot dele
te this
text
obje
ct!
colo
red
C. Financial Behaviour – Uptake and Usage Deposit Money Banks (DMBs)

"A4rb
_sta
ndar
d_band_
phot
o" – 2
0100111 –
do n
ot dele
te this
text
obje
ct!
colo
red
15 Source: EFInA Access to Financial Services in Nigeria 2018 survey
Banked population is up from 36.9m in 2016 to 39.5m in 2018
2016 2018 Growth/
decline
Banked population 38.3% 39.7% +1.4%
Remittances (send and receive) 24.2% 22.4% -2.2%
Savings with a bank 27.7% 21.0% -6.7%
Payments 12.1% 15.5% +3.4%
Receive income 8.4% 9.7% +1.3%
Loan with a bank 1.3% 1.3% Stable
Banking agents 2.6% 3.3% +0.6%
Total population:99.6 million

"A4rb
_sta
ndar
d_band_
phot
o" – 2
0100111 –
do n
ot dele
te this
text
obje
ct!
colo
red
16 Source: EFInA Access to Financial Services in Nigeria 2018 survey
More banked people are using their bank accounts
• 68.7% of bank clients used at least one bank product during the month prior to the A2F 2018
• 4.6% used at least one product during the 6 months before the survey
• 26.8% of the banked adults have dormant account, meaning the account was not used in the past 90 days year prior to the survey
59.9%
68.7%
3.2%
4.6%
37.0%
26.8%
2016
2018
High (monthly transaction) Medium (past 3 months) Inactive (occassionally or annually)
Banked population = 39.7m

"A4rb
_sta
ndar
d_band_
phot
o" – 2
0100111 –
do n
ot dele
te this
text
obje
ct!
colo
red
17 Source: EFInA Access to Financial Services in Nigeria 2018 survey
Affordability and institutional exclusion are the biggest obstacles to having a bank account
35
23
20
12
11
10
10
10
7
Irregular income
Banks are too far
Don't have a job
Costs too much
Prefer cash
Cannot read
Too much documentation
involved
No reason
It is expensive to have a
bank account
Barriers Net %
Affordability 64.9
Institutional exclusion 38.4
Attitudes/perceptions 23.6
Other 4.5
Unbanked population = 60.1m
Percentage
"A4rb
_sta
ndar
d_band_
phot
o" – 2
0100111 –
do n
ot dele
te this
text
obje
ct!
colo
red
Financial Behaviour - Uptake and Usage Other Formal/Regulated (non-DMBs) Institutions

"A4rb
_sta
ndar
d_band_
phot
o" – 2
0100111 –
do n
ot dele
te this
text
obje
ct!
colo
red
19 Source: EFInA Access to Financial Services in Nigeria 2018 survey
28.5% of adults use other formal financial institutions. This is slightly down from 30.1% in 2016
2016 2018 Growth/
decline
Other formal (non-bank) 30.1% 28.5% -1.6%
Pension 7.8% 8.0% 0.2%
Savings* 5.0% 3.7% -1.3%
Mobile Money 1.6% 3.3% +2.2%
Mobile Money agents 0.2% 1.1% +0.9%
Insurance 1.7% 1.6% -0.1%
Remittances 0.9 1.5% +0.6%
Loan with other formal
institutions 1.0% 1.3% +0.3%
Total population:99.6 million
*Fixed deposit, stock/shares, mutual funds, saving with Microfinance Bank etc.

"A4rb
_sta
ndar
d_band_
phot
o" – 2
0100111 –
do n
ot dele
te this
text
obje
ct!
colo
red
20 Source: EFInA Access to Financial Services in Nigeria 2018 survey
Increased Usage of Mobile Money and Microfinance Banks
1.9 1.7 1.5
7.8
3.0
1.6
3.3
8.0
Microfinance Banks Insurance Mobile Money Pension
2016 2018
%
Savings
Credit
Remittances
Remittances
Airtime
purchase
Paying
bills
+12%
+1%
+1%
2018 Total population:99.6 million
Microfinance Bank= 3.0m Mobile Money= 3.3m
62%
56%
15%
57%
26%
9%
-12%
+13%
-2%
Lan
dscap
e

"A4rb
_sta
ndar
d_band_
phot
o" – 2
0100111 –
do n
ot dele
te this
text
obje
ct!
colo
red
21 Source: EFInA Access to Financial Services in Nigeria 2018 survey
Although registered users have doubled since 2016, overall, mobile money usage remains low
21
98.7%
0.3%
0.2%
0.8%
96.7%
0.7%
1.1%
1.7%
You are not registeredand have never used
mobile money services
You have used it beforebut not any more
You use mobile moneyservices but you are not
registered
You are a registeredmobile money user
Mobile Money Experience
2018
2016
Drivers for Mobile Money uptake
For sake of ease 55.0%
To conduct fast transactions 49.1%
Family/friends are using mobile money 20.7%
To conduct safe transactions 13.8%
To store/save money 12.5%
Just to try or test mobile money 4.6%
To pay bills 4.0%
Total population:99.6 million

"A4rb
_sta
ndar
d_band_
phot
o" – 2
0100111 –
do n
ot dele
te this
text
obje
ct!
colo
red
22 Source: EFInA Access to Financial Services in Nigeria 2018 survey
Lack of awareness remains the key barrier to the use of Mobile Money and Insurance
77.2
4.9
4.3
3.9
2.5
2.5
2.3
2.5
Not aware of Insurance
Have not thought about ityet
Have nothing to insure
Do not believe ininsurance
Do not know where toget it
Cannot afford to pay forInsurance
Do not know its' benefits
No reason
83.3
5.7
4.2
3.6
2.5
1.6
Not aware of MobileMoney
Do not know muchabout Mobile Money
No reason
Use other means
Do not trust MobileMoney
Do not know how toget Mobile Money
Do not have/use Mobile Money = 96.3m Do not have Insurance = 97.9m
Percentage Percentage

"A4rb
_sta
ndar
d_band_
phot
o" – 2
0100111 –
do n
ot dele
te this
text
obje
ct!
colo
red
23 Source: EFInA Access to Financial Services in Nigeria 2018 survey
Mobile Money currently deepening rather than expanding inclusion levels, as Mobile Money services are being taken up by the banked population
23
Both Mobile Money
wallet and Bank
account
(3.0 million)
Bank account only
36.7%
Mobile Money wallet Only
0.3%
Excluded 60.0%
3.0%
• 36.7% (36.5m) adults use bank account only • 3.1% (3.0m) adults have both mobile money and bank account • 0.3% (313k) adults have mobile money wallet only • 60.0% (59.4m) neither have mobile money nor banking account • Clear strategy to target non-bank population to take up mobile money services is required
Total population:99.6 million

"A4rb
_sta
ndar
d_band_
phot
o" – 2
0100111 –
do n
ot dele
te this
text
obje
ct!
colo
red
24 Source: EFInA Access to Financial Services in Nigeria 2018 survey
Potential to drive financial inclusion levels by targeting 82% of Nigerians who currently receive their main income in cash
24
82.0 10.0 8.0
Receive main
income in cash
Receive main income into
bank account or via MM
Do not receive an
income
• Based on main source of income, 17% of adults are subsistence farmers, 38% own businesses (farming, non-farming, and services), and 9% receive money from family/friends
• Over 97% of both subsistence farmers and business owners (farming, non-farming, and services), receive their
income in cash
• 12% of adults that receive money from family/friends get it via bank account or mobile money wallets
• G2P and B2P (formal) are driving income received via bank accounts and mobile money wallets

"A4rb
_sta
ndar
d_band_
phot
o" – 2
0100111 –
do n
ot dele
te this
text
obje
ct!
colo
red
25 Source: EFInA Access to Financial Services in Nigeria 2018 survey
Overall, over 15 million Nigerian adults (16%) made at least one digital payment for goods and services in the past 12 months
25
15.6
84.4
Yes No
+3.3%
Make a digital payment* (All adults)

"A4rb
_sta
ndar
d_band_
phot
o" – 2
0100111 –
do n
ot dele
te this
text
obje
ct!
colo
red
Financial Behaviour - Uptake and Usage Savings, Credit and Remittance

"A4rb
_sta
ndar
d_band_
phot
o" – 2
0100111 –
do n
ot dele
te this
text
obje
ct!
colo
red
27 Source: EFInA Access to Financial Services in Nigeria 2018 survey
Savings: Majority of Nigerian adults save, but savings overall declined
54.7%
68.0%
45.3%
32.0%
Saving Not Saving
Where adults save
2018 (Base = 99.6m)
2016 (Base = 96.4m)
2016 (65.6m) 2018 (54.5m)
Saving with a bank 40.7% 38.3%
Saving with other
formal institution 12.3% 9.7%
Informal 31.4% 42.7%
Family/friends 47.2% 33.0%
"A4rb
_sta
ndar
d_band_
phot
o" – 2
0100111 –
do n
ot dele
te this
text
obje
ct!
colo
red
28 Source: EFInA Access to Financial Services in Nigeria 2018 survey
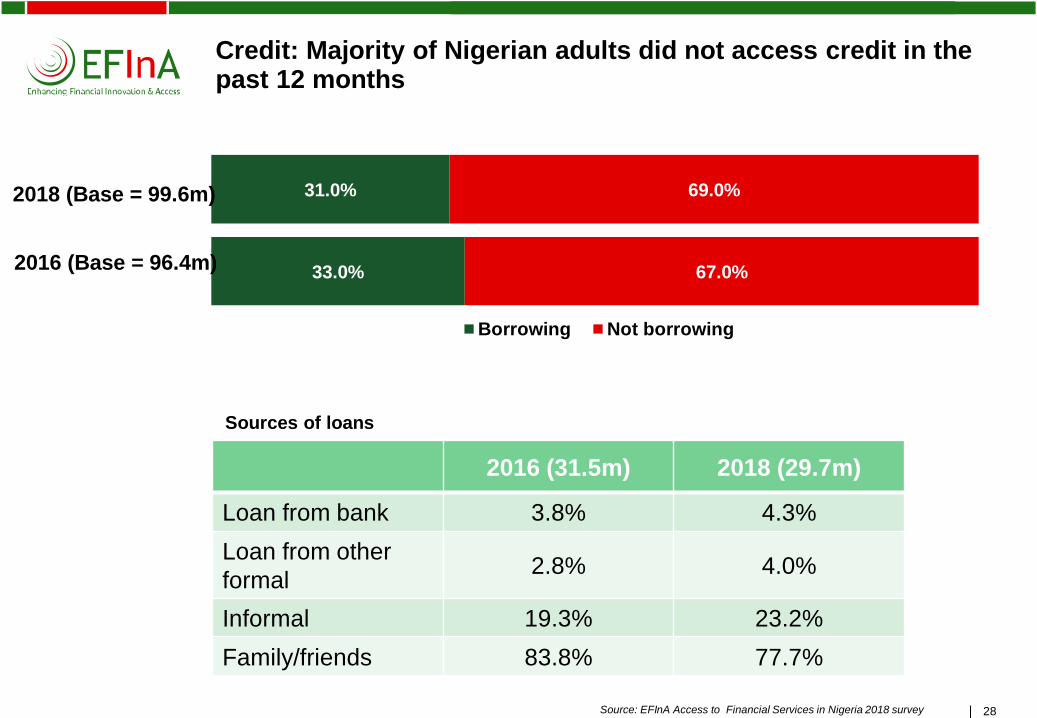
Credit: Majority of Nigerian adults did not access credit in the past 12 months
31.0%
33.0%
69.0%
67.0%
Borrowing Not borrowing
2018 (Base = 99.6m)
2016 (Base = 96.4m)
2016 (31.5m) 2018 (29.7m)
Loan from bank 3.8% 4.3%
Loan from other
formal 2.8% 4.0%
Informal 19.3% 23.2%
Family/friends 83.8% 77.7%
Sources of loans

"A4rb
_sta
ndar
d_band_
phot
o" – 2
0100111 –
do n
ot dele
te this
text
obje
ct!
colo
red
29 Source: EFInA Access to Financial Services in Nigeria 2018 survey
Remittances: 43.1m Nigerian adults received or sent money in the past 12 months
• 17.9 m Nigerian adults remit money through family/friends ONLY, • 82.1% of those remitting through family/friends have access to mobile phones • 83.3% of those remitting through family/friends are not aware of mobile money
43.0%
44.0%
57.0%
56.0%
Remitting Not remitting
2018 (Base = 99.6m)
2016 (Base = 96.4m)
2016 (41.9m) 2018 (43.1m)
Banking channels 58.2% 51.5%
Other formal 1.9% 3.5%
Informal 9.1% 7.8%
Family/friends 52.9% 56.8%
Remitting channels

"A4rb
_sta
ndar
d_band_
phot
o" – 2
0100111 –
do n
ot dele
te this
text
obje
ct!
colo
red
D. Financial Access Strands (FAS)
"A4rb
_sta
ndar
d_band_
phot
o" – 2
0100111 –
do n
ot dele
te this
text
obje
ct!
colo
red
31 Source: EFInA Access to Financial Services in Nigeria 2018 survey
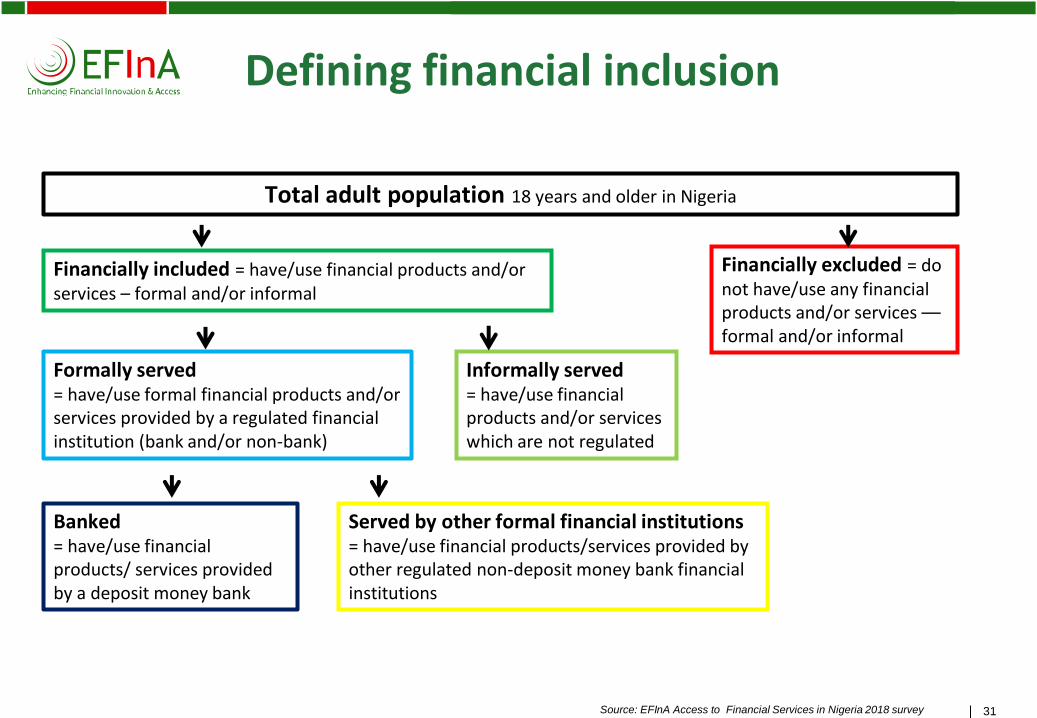
Defining financial inclusion
Total adult population 18 years and older in Nigeria
Financially included = have/use financial products and/or services – formal and/or informal
Financially excluded = do not have/use any financial products and/or services –– formal and/or informal
Formally served = have/use formal financial products and/or services provided by a regulated financial institution (bank and/or non-bank)
Informally served = have/use financial products and/or services which are not regulated
Banked = have/use financial products/ services provided by a deposit money bank
Served by other formal financial institutions = have/use financial products/services provided by other regulated non-deposit money bank financial institutions

"A4rb
_sta
ndar
d_band_
phot
o" – 2
0100111 –
do n
ot dele
te this
text
obje
ct!
colo
red
32 Source: EFInA Access to Financial Services in Nigeria 2018 survey
39.6% 9.0% 14.6% 36.8%
Financial Access Strand 2018
Banked Formal
other
Informal
only Financially excluded
48.6% Formally included
63.2% Financially served 36.8% Financially excluded
39.5m 36.6m 14.6m 8.9m
Note: These four strands are mutually exclusive
99.6m
• Over 60% of the Nigerian adult population are now financially included
• Financially excluded proportion of the adult population still remains large

"A4rb
_sta
ndar
d_band_
phot
o" – 2
0100111 –
do n
ot dele
te this
text
obje
ct!
colo
red
33 Source: EFInA Access to Financial Services in Nigeria 2018 survey
Trends In Financial Access Strand – 2008 to 2018
33
21.1%
30.0%
32.5%
36.3%
38.3%
39.6%
2.5%
6.3%
10.5%
12.3%
10.3%
9.0%
23.9%
17.4%
17.3%
11.9%
9.8%
14.6%
52.5%
46.3%
39.7%
39.5%
41.6%
36.8%
2008
2010
2012
2014
2016
2018
Banked Formal other Informal only Financially excluded
18.3m 2.2m 20.7m 45.4m
25.4m
28.6m
36.9m
39.5m
11.5m
5.3m
8.9m
9.4m
11.3m
15.2m
14.8m
14.6m
39.2m
34.9m
36.9m
40.1m
36.6m
33.9m
10.0m
9.2m
Between 2016 and 2018: • Significant gains in financial inclusion as excluded population declined by 4.8% from 40.1 million to 36.6 million • Proportion of the formally served remains static at just below 50%
Adult Population 18+ Years
99.6 m
96.4m
93.5m
87.9m
84.7m
86.6m

"A4rb
_sta
ndar
d_band_
phot
o" – 2
0100111 –
do n
ot dele
te this
text
obje
ct!
colo
red
34 Source: EFInA Access to Financial Services in Nigeria 2018 survey
Financial inclusion Consumer Access Strand (ranked by banked population)
34
80
68
42
40
26
22
18
13
10
10
5
33
9
42
36
22
52
39
3
5
7
15
21
20
21
7
15
7
22
17
37
11
22
39
28
36
South Africa 2018
Namibia 2017
Kenya 2016
Nigeria 2018
Rwanda 2016
Uganda 2017
Burkina Faso 2016
Tanzania 2017
Cameroon 2017
Banked Other formal (non-bank) Informal Excluded
Note: There are some slight differences in the classification of products/services in the categories of the access strands between the countries
• Nigeria has a fairly large banked population (39.7%), but also has the highest proportion of
financially excluded adults at 37%

"A4rb
_sta
ndar
d_band_
phot
o" – 2
0100111 –
do n
ot dele
te this
text
obje
ct!
colo
red
35 Source: EFInA Access to Financial Services in Nigeria 2018 survey
Overlaps in Financial Access
39.7%
28.6%
29.5%
36.8%
Banked
Formal Other
Informal
Excluded
Aggregate Levels of Financial Access*
Banked Formal Other
Informal Excluded
*Figures may include overlaps across access strands
Informal
14.6%
Formal Other
5.5%
Banked
14.6%
13.7% 5.5%
Excluded 36.8%
3.5%
5.9%
• Consumers generally use a combination of financial products and services to meet their financial needs • 33.8% rely on formal financial services only, up from 29.2% in 2016 • 15.0% use a combination of formal and informal mechanisms to manage their financial needs, thus indicating
that their needs are not fully met by the formal sector alone

"A4rb
_sta
ndar
d_band_
phot
o" – 2
0100111 –
do n
ot dele
te this
text
obje
ct!
colo
red
36 Source: EFInA Access to Financial Services in Nigeria 2018 survey
Banked
14.6%
Other
formal
(non-bank)
5.5%
Informal
only
14.6%
Excluded
36.8%
5.5%
5.9%
3.5%
13.7%
2018
Banked
13.7%
Other
formal
(non-bank)
2.8%
Informal
only
9.8%
Excluded
41.6%
3.1%
8.8%
7.5%
12.7%
2016
Financial inclusion Overlaps
• Adults who rely on formal services only increased from 29.2% to 33.8% since 2016 • Adults using a combination of formal and informal declined from 19.4% in 2016 to 15.0%

"A4rb
_sta
ndar
d_band_
phot
o" – 2
0100111 –
do n
ot dele
te this
text
obje
ct!
colo
red
37 Source: EFInA Access to Financial Services in Nigeria 2018 survey
Financial Access by Gender
37
46.1%
33.3%
39.7%
8.9%
9.1%
9.0%
12.5%
16.7%
14.6%
32.5%
40.9%
36.8%
Male
Female
Total
Banked Formal other Informal only Financially excluded
22.9m 16.2m 6.2m
16.6m 20.5m 8.3m
4.4m
4.5m
39.5m 36.6m 14.6m 8.9m
• Financial access is skewed towards male adults • Adult men are more likely to be banked than adult women • Adult women tend to use more formal-other and informal financial services than adult men
Adult Population 18+ Years
49.7 m
49.9 m
99.6 m

"A4rb
_sta
ndar
d_band_
phot
o" – 2
0100111 –
do n
ot dele
te this
text
obje
ct!
colo
red
38 Source: EFInA Access to Financial Services in Nigeria 2018 survey
Financial Access by Age Group
30.9%
44.2%
45.7%
41.4%
36.0%
9.1%
9.1%
8.6%
9.7%
8.5%
13.0%
15.2%
15.1%
16.5%
14.2%
47.0%
31.5%
30.6%
32.4%
41.4%
18 to 25 Years
26 to 35 Years
36 to 45 Years
46 to 55 Years
Above 56 Years
Banked Formal other Informal only Financially excluded
• The 26 – 35 age group has the highest population but rank second for formal financial inclusion • The highest level of formally included are in the 36 to 45 age group • The highest level of financial excluded are in the 18 to 25 age group
30.3 m
Adult Population 18+ Years
19.5 m
26.4m
10.9 m
12.5 m

"A4rb
_sta
ndar
d_band_
phot
o" – 2
0100111 –
do n
ot dele
te this
text
obje
ct!
colo
red
39 Source: EFInA Access to Financial Services in Nigeria 2018 survey
Financial Access by Urban/Rural Setting
22.1m 7.9m 4.4m 2.1m
17.4m 28.8m 10.1m 6.8m
39.5m 36.6m 14.6m 8.9m
36.6m
63.1m
99.6m
• Banking services are not getting to rural areas, BUT the data shows an increase of 3.2% among rural
population
• Informal financial services continue to be dominant in the rural areas
• Interventions dealing with key excluded populations seem to be slightly bearing fruits; rural population
reduction in the excluded population is 6.6% higher than the national average
Adult Population 18+ Years
39.7%
27.6%
60.5%
9.0%
10.8%
5.8%
14.6%
16.1%
12.1%
36.8%
45.6%
21.6%
Total
Rural
Urban
Banked Other Formal Informal Only Excluded

"A4rb
_sta
ndar
d_band_
phot
o" – 2
0100111 –
do n
ot dele
te this
text
obje
ct!
colo
red
40 Source: EFInA Access to Financial Services in Nigeria 2014/ 2016/ 2018 survey
Financial Access Performance Across Geo-Political Zones
40
North East 2014 2016 2018
Total Adult
Population 11M 12M 12M
Formally Included 26% 25% 34%
Informal Only 5% 14% 12%
Financially Excluded 68% 62% 55%
South South 2014 2016 2018
Total Adult
Population 15M 16M 16M
Formally Included 52% 55% 60%
Informal Only 15% 14% 17%
Financially Excluded 33% 31% 23%
North West 2014 2016 2018
Total Adult
Population 21M 22M 23M
Formally Included 35% 24% 27%
Informal Only 9% 6% 11%
Financially Excluded 56% 70% 62%
North Central 2014 2016 2018
Total Adult
Population 14M 14M 14M
Formally Included 49% 48% 50%
Informal Only 19% 14% 19%
Financially Excluded 33% 39% 31%
South West 2014 2016 2018
Total Adult
Population 20M 21M 22M
Formally Included 63% 78% 64%
Informal Only 13% 4% 17%
Financially Excluded 25% 18% 19%
South East 2014 2016 2018
Total Adult
Population 12M 12M 12M
Formally Included 63% 59% 60%
Informal Only 11% 13% 11%
Financially Excluded 25% 28% 29%
Kogi
Adamawa
Akwa
Ibom
Bauchi
Baye-
lsa
Benue
Borno
Cross
River
Delta
Ebonyi
Edo
Ekiti
Enugu
FCT
Gombe
Imo
Jigawa
Kaduna
Kano
Katsina
Kebbi
Kwara
Lagos
Nasarawa
Niger
Ogun
Ondo
Osun
Oyo
Plateau
Rivers
Sokoto
Taraba
Yobe Zamfara
Abia
Ana-
mbra
"A4rb
_sta
ndar
d_band_
phot
o" – 2
0100111 –
do n
ot dele
te this
text
obje
ct!
colo
red
41 Source: EFInA Access to Financial Services in Nigeria 2014/ 2016/ 2018 survey
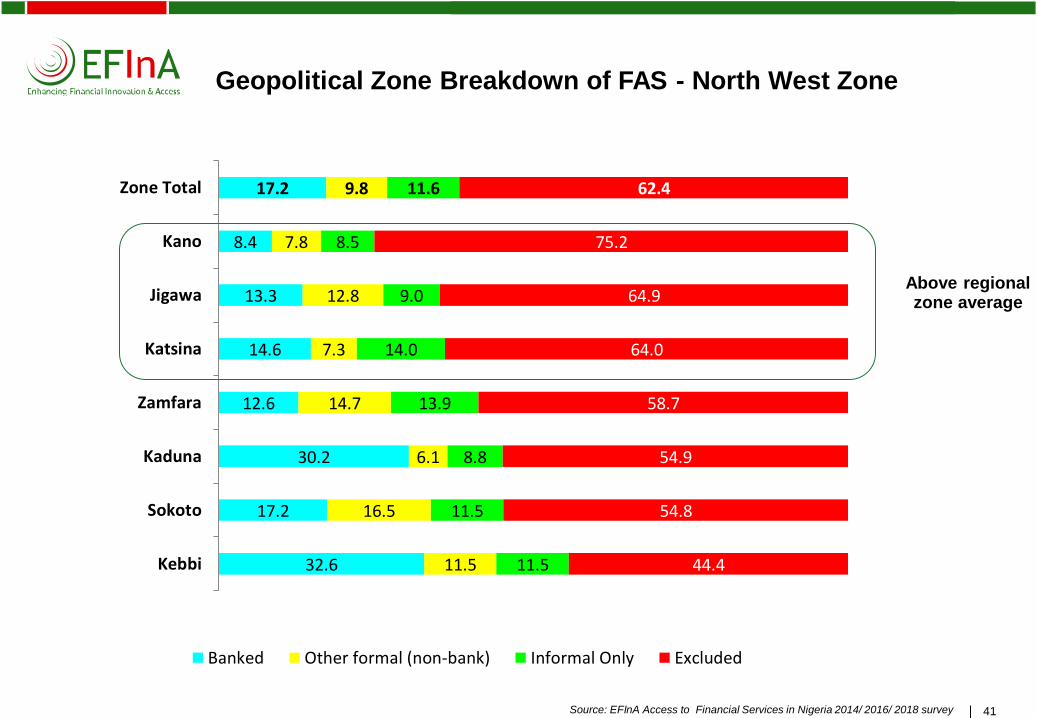
Geopolitical Zone Breakdown of FAS - North West Zone
41
32.6
17.2
30.2
12.6
14.6
13.3
8.4
17.2
11.5
16.5
6.1
14.7
7.3
12.8
7.8
9.8
11.5
11.5
8.8
13.9
14.0
9.0
8.5
11.6
44.4
54.8
54.9
58.7
64.0
64.9
75.2
62.4
Kebbi
Sokoto
Kaduna
Zamfara
Katsina
Jigawa
Kano
Zone Total
Banked Other formal (non-bank) Informal Only Excluded
Above regional zone average

"A4rb
_sta
ndar
d_band_
phot
o" – 2
0100111 –
do n
ot dele
te this
text
obje
ct!
colo
red
42 Source: EFInA Access to Financial Services in Nigeria 2014/ 2016/ 2018 survey
Geopolitical Zone Breakdown of FAS - North East Zone
42
23.5
23.4
28.7
19.3
19.5
16.4
22.0
19.6
16.4
8.5
8.4
11.8
4.4
11.9
26.0
11.7
12.4
12.3
7.8
3.2
11.6
30.9
48.6
50.4
60.0
60.8
76.1
54.5
Taraba
Borno
Adamawa
Yobe
Bauchi
Gombe
Zone Total
Banked Other formal (non-bank) Informal Only Excluded
Above regional zone average

"A4rb
_sta
ndar
d_band_
phot
o" – 2
0100111 –
do n
ot dele
te this
text
obje
ct!
colo
red
43 Source: EFInA Access to Financial Services in Nigeria 2014/ 2016/ 2018 survey
Geopolitical Zone Breakdown of FAS - North Central Zone
43
43.5
53.3
30.6
55.4
34.2
35.8
33.5
40.1
10.2
8.7
9.6
6.7
11.3
12.4
5.9
9.6
28.5
16.1
31.4
6.0
16.7
13.7
21.0
19.6
17.8
22.0
28.4
31.9
37.8
38.1
39.5
30.6
Kogi
Kwara
Benue
FCT Abuja
Plateau
Niger
Nasarawa
Zone Total
Banked Other formal (non-bank) Informal Only Excluded
Above regional zone average
"A4rb
_sta
ndar
d_band_
phot
o" – 2
0100111 –
do n
ot dele
te this
text
obje
ct!
colo
red
44 Source: EFInA Access to Financial Services in Nigeria 2014/ 2016/ 2018 survey
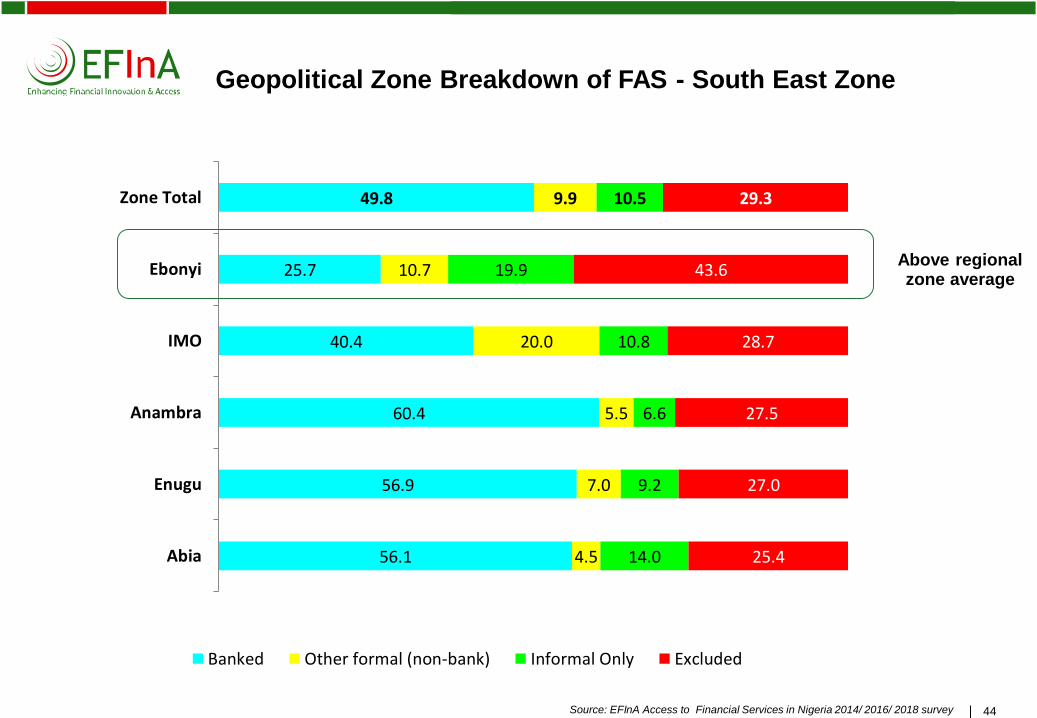
Geopolitical Zone Breakdown of FAS - South East Zone
44
56.1
56.9
60.4
40.4
25.7
49.8
4.5
7.0
5.5
20.0
10.7
9.9
14.0
9.2
6.6
10.8
19.9
10.5
25.4
27.0
27.5
28.7
43.6
29.3
Abia
Enugu
Anambra
IMO
Ebonyi
Zone Total
Banked Other formal (non-bank) Informal Only Excluded
Above regional zone average

"A4rb
_sta
ndar
d_band_
phot
o" – 2
0100111 –
do n
ot dele
te this
text
obje
ct!
colo
red
45 Source: EFInA Access to Financial Services in Nigeria 2014/ 2016/ 2018 survey
Geopolitical Zone Breakdown of FAS – South - South Zone
45
54.5
62.5
60.8
47.2
25.9
46.3
50.7
12.7
2.8
7.5
8.2
20.1
3.7
9.2
16.5
16.9
11.6
19.2
24.9
14.6
17.5
16.3
17.8
20.1
25.4
29.1
35.3
22.7
Cross River
Rivers
Delta
Edo
Akwa Ibom
Bayelsa
Zone Total
Banked Other formal (non-bank) Informal Only Excluded
Above regional zone average

"A4rb
_sta
ndar
d_band_
phot
o" – 2
0100111 –
do n
ot dele
te this
text
obje
ct!
colo
red
46 Source: EFInA Access to Financial Services in Nigeria 2014/ 2016/ 2018 survey
Geopolitical Zone Breakdown of FAS - South West Zone
46
56.0
69.4
61.1
55.8
47.3
47.5
58.4
5.2
3.8
4.5
8.9
5.9
5.8
5.4
24.2
12.1
16.7
13.5
24.0
17.9
17.1
14.6
14.7
17.6
21.8
22.8
28.8
19.1
Osun
Lagos
Ekiti
Ogun
Oyo
Ondo
Zone Total
Banked Other formal (non-bank) Informal Only Excluded
Above regional zone average

"A4rb
_sta
ndar
d_band_
phot
o" – 2
0100111 –
do n
ot dele
te this
text
obje
ct!
colo
red
47 Source: EFInA Access to Financial Services in Nigeria 2018 survey
Profile of the Financially Excluded (1 of 2)
47
36.6 Million Adult Nigerians (18 years and older) are excluded
55.9%
44.1%
Small scale farming
78.5%
21.5%
71.3% Median income
N15000
34%
(18-25
years)
North West 38.4%
North East 18.3%
23.5%
Remittances
Family/friends
18.3%
Save money at home
22.4%
• Not aware of mobile money (95.9%)
• Not aware of banking agents (89.4%)
• No access to any financial institutions (76%)

"A4rb
_sta
ndar
d_band_
phot
o" – 2
0100111 –
do n
ot dele
te this
text
obje
ct!
colo
red
48 Source: EFInA Access to Financial Services in Nigeria 2018 survey
Profile of the Financially Excluded Adults (2 of 2)
Excluded
Population
36,640,750
Income
Below N15,000 37.2%
N15000 – N35,000 26.3%
N35001 – N55,000 5.5%
N55,001 – N75,000 1.7%
More than 75,000 1.6%
Refused 9.8%
Don’t know 17.9%
Highest Level of Education
Primary School 23.4%
Secondary School 34.7%
University/ OND/ HND 1.9%
Post University 0.2%
Non-formal education 20.2%
No education 19.4%
22.4%
Saved (Past 12 Months)
17.5%
Borrowed (Past 12 Months)
18.3%
Received money from Friends/ Family

"A4rb
_sta
ndar
d_band_
phot
o" – 2
0100111 –
do n
ot dele
te this
text
obje
ct!
colo
red
National Financial Inclusion Strategy (NFIS) Targets

"A4rb
_sta
ndar
d_band_
phot
o" – 2
0100111 –
do n
ot dele
te this
text
obje
ct!
colo
red
50 Source: EFInA Access to Financial Services in Nigeria 2010/2012/2014/ 2016/2018 survey
Progress on National Financial Inclusion Targets
50
Reduce financial exclusion rate of adults to 20% by 2020
STATUS
Focus
Areas
Target by
2020 2010 2012 2014 2016 2018
Variance
to 2020
Target
% of Total
Adult
Population
Payments 70% 22% 20% 24% 38% 40% -30%
Savings 60% 24% 25% 32% 36% 24% -36%
Credit 40% 2% 2% 3% 3% 2% -38%
Insurance 40% 1% 3% 1% 2% 2% -38%
Pension 40% 5% 2% 5% 7% 8% -32%
Financial
Exclusion 20% 46.3% 39.7% 39.5% 41.6% 36.8% -16.8%
DEFINITION OF INDICATORS
Payments: % of adult population that has a transaction account with a regulated financial institution and/or has made an electronic payment through a regulated financial institution in
the last 12 months
Savings: % of adult population that has a savings-related product at a regulated financial institution and/or has saved through a regulated financial institution in the last 12 months
Credit: % of adult population that has had a credit product through a regulated financial institution in the last 12 months
Insurance: % of adult population that is covered by a regulated insurance policy
Pension: % of adult population that is contributing to a regulated pension scheme or receiving a pension through a regulated pension scheme
**

"A4rb
_sta
ndar
d_band_
phot
o" – 2
0100111 –
do n
ot dele
te this
text
obje
ct!
colo
red
E. Access Frontiers for achieving the NFIS Targets

"A4rb
_sta
ndar
d_band_
phot
o" – 2
0100111 –
do n
ot dele
te this
text
obje
ct!
colo
red
52 Source: EFInA Access to Financial Services in Nigeria 2018 survey
Access Frontiers – Identifying the Opportunities
52
Does not
have access
to the
product
Excluded by
default
Too poor
Has access to
the product
but does not
use it
Does not want
the product
Potential users
Does not
have/use
the
product
Excluded by
design
Market development
zone
Market enablement
zone
Total
market
Currently has/uses
the product
Market
redistribution zone

"A4rb
_sta
ndar
d_band_
phot
o" – 2
0100111 –
do n
ot dele
te this
text
obje
ct!
colo
red
53 Source: EFInA Access to Financial Services in Nigeria 2018 survey
Access Frontiers – Overall Excluded 40% of the excluded have access to neither FI nor a mobile phone
53
Financially
Excluded
36.6m
Does not have
access to FI
14.9m
No Identity
Documents
7.6m
No mobile phone
12.8m
Have access
but do not use
it
21.6m
Don’t want the
product
7.9m
Potential users
13.7m
No Access to FI
near household
11.7m
Market development
zone
Market enablement
zone

"A4rb
_sta
ndar
d_band_
phot
o" – 2
0100111 –
do n
ot dele
te this
text
obje
ct!
colo
red
54 Source: EFInA Access to Financial Services in Nigeria 2018 survey
Access Frontiers – Women
54
Total
market
49.9m
Included
29.4m
Excluded
20.5m
Formally
Served
21.5m
Informal
ONLY
8.5m
By Default
By Design
Potential
users
Excluded
20.5m By Default
By Design
Potential
users
1.9m
6.4m
4.1m
No access to FI, no ID,
No access to mobile phone
Have access to FI, ID,
Mobile phone
Willing to use MM, MMA
Need product knowledge
9.2m
11.2m
6.6m
No access to FI, no ID,
No access to mobile phone
Have access to FI, ID,
Mobile phone
Willing to use MM, MMA
Need product knowledge

"A4rb
_sta
ndar
d_band_
phot
o" – 2
0100111 –
do n
ot dele
te this
text
obje
ct!
colo
red
55 Source: EFInA Access to Financial Services in Nigeria 2018 survey
Access Frontiers – Rural population
55
Total
market
63.1m
Included
34.3m
Excluded
28.7m
Formally
Served
24.2m
Informal
ONLY
10.1m
By Default
By Design
Potential
users
Excluded
28.7m By Default
By Design
Potential
users
2.2m
7.9m
6.6m
No access to FI, no ID,
No access to mobile phone
Have access to FI, ID,
Mobile phone
Willing to use MM, MMA
Need product knowledge
12.5m
16.2m
10.1m
No access to FI, no ID,
No access to mobile phone
Have access to FI, ID,
Mobile phone
Willing to use MM, MMA
Need product knowledge

"A4rb
_sta
ndar
d_band_
phot
o" – 2
0100111 –
do n
ot dele
te this
text
obje
ct!
colo
red
56 Source: EFInA Access to Financial Services in Nigeria 2018 survey
Access Frontiers – Youth
56
Total
market
26.1m
Included
13.9m
Excluded
12.4m
Formally
Served
10.5m
Informal
ONLY
3.4m
By Default
By Design
Potential
users
Excluded
12.4m By Default
By Design
Potential
users
875k
2.6m
1.7m
No access to FI, no ID,
No access to mobile phone
Have access to FI, ID,
Mobile phone
Willing to use MM, MMA
Need product knowledge
6.1m
6.3m
4.0m
No access to FI, no ID,
No access to mobile phone
Have access to FI, ID,
Mobile phone
Willing to use MM, MMA
Need product knowledge

"A4rb
_sta
ndar
d_band_
phot
o" – 2
0100111 –
do n
ot dele
te this
text
obje
ct!
colo
red
57 Source: EFInA Access to Financial Services in Nigeria 2018 survey
Access Frontiers – North East
57
Total
market
12.3m
Included
5.6m
Excluded
6.7m
Formally
Served
4.2m
Informal
ONLY
1.4m
By Default
By Design
Potential
users
Excluded
6.7m By Default
By Design
Potential
users
234k
1.2m
834k
No access to FI, no ID,
No access to mobile phone
Have access to FI, ID,
Mobile phone
Willing to use MM, MMA
Need product knowledge
2.6m
4.1m
2.5m
No access to FI, no ID,
No access to mobile phone
Have access to FI, ID,
Mobile phone
Willing to use MM, MMA
Need product knowledge

"A4rb
_sta
ndar
d_band_
phot
o" – 2
0100111 –
do n
ot dele
te this
text
obje
ct!
colo
red
58 Source: EFInA Access to Financial Services in Nigeria 2018 survey
Access Frontiers – North West
58
Total
market
22.5m
Included
8.5m
Excluded
14.1m
Formally
Served
6.1m
Informal
ONLY
2.4m
By Default
By Design
Potential
users
Excluded
14.1m By Default
By Design
Potential
users
1.0m
1.4m
1.1m
No access to FI, no ID,
No access to mobile phone
Have access to FI, ID,
Mobile phone
Willing to use MM, MMA
Need product knowledge
7.2m
6.6m
4.5m
No access to FI, no ID,
No access to mobile phone
Have access to FI, ID,
Mobile phone
Willing to use MM, MMA
Need product knowledge

"A4rb
_sta
ndar
d_band_
phot
o" – 2
0100111 –
do n
ot dele
te this
text
obje
ct!
colo
red
Key Take outs

"A4rb
_sta
ndar
d_band_
phot
o" – 2
0100111 –
do n
ot dele
te this
text
obje
ct!
colo
red
60
Key Take Outs
60
. Formal labour market is not absorbing enough Nigerians
Reduction in formal employment has led to reduced disposable income and savings
Adults resort to starting small businesses (driven by the agric sector) to survive
Day to day expenses are the most important financial need while planning for unexpected
shocks and planning for long term goals are second and third priorities respectively
Banked population went up by 1.4% – the growth has been largely driven by transaction
products
The number of adults relying on informal financial mechanisms ONLY increased
significantly – as more adults move into informal employment
Payments are mostly cashed-based, driven by the size of the informal sector
Digital payments increased from 12% in 2016 to 16% in 2018, driven by the deepening of
financial inclusion. Mobile money usage is driven by the banked population
Main barriers to financial inclusion remain lack of product/services, awareness and
knowledge, and institutional exclusion and affordability

"A4rb
_sta
ndar
d_band_
phot
o" – 2
0100111 –
do n
ot dele
te this
text
obje
ct!
colo
red
61
Data Dissemination Options
61
EFInA Access to Financial Services in Nigeria 2008 / 2010 / 2012 / 2014 / 2016 / 2018 surveys
Comprehensive database where information can be segmented in multiple dimensions, e.g., gender,
geopolitical zone, age, education, etc.
Data will be provided in SPSS or Ms Excel format
Key findings can be downloaded from the EFInA website
Data Options
Data request form can be downloaded from the EFInA website
Full dataset
Limited number of variables
Customised analysis
Contact
Website
www.efina.org.ng

"A4rb
_sta
ndar
d_band_
phot
o" – 2
0100111 –
do n
ot dele
te this
text
obje
ct!
colo
red
62
Disclaimer
To the best of our knowledge, the information contained herein is accurate and reliable as of the date of
publication; however, we do not assume any liability whatsoever for the accuracy and completeness of the
above information and we provide no warranty, expressed or implied, in respect thereof.
The provision of the information contained in this report does not constitute legal or financial advice or opinions
of any kind. No advisory, fiduciary or other relationship is created between EFInA and any person accessing or
otherwise using any of the information provided in this report. EFInA and any of its directors, officers,
employees, agents or contributors will not be liable for any damages, losses or causes of action of any nature
arising from any use of any of the said information.
The content of this report does not necessarily reflect the views or official position of the UK Department for
International Development with regard to financial inclusion in Nigeria.
62