Embed Size (px)
Citation preview
Key findings - SHIVERS (Southern Hemisphere Influenza and Vaccine
Effectiveness Research and Surveillance)Dr. Sue Huang
Principal investigator of the SHIVERS project
Director, WHO National Influenza Centre
Institute of Environmental Science and Research, Wellington, New Zealand
3rd New Zealand Influenza Symposium, 2 November, 2016
Wellington
Outline
• Background of SHIVERS
• Disease burden and epidemiology
• Vaccine effectiveness
• Risk factors
• Etiology

Acknowledgement• ESR: Don Bandaranayake, Ruth Seeds, Tim Wood, Ange Bissielo, Graham Mackereth, Thomas Metz, Anne
McNicholas, Angela Todd, Namrata Prasad, Laboratory staff, IT staff
• ADHB: Sally Roberts, Colin McArthur, Debbie Williamson, Kathryn Haven, Research nurses, clinical team staff, laboratory staff, IT staff
• CMDHB: Adrian Trenholme, Conroy Wong, Susan Taylor, Shirley Lawrence, Research nurses, clinical team staff, laboratory staff, IT staff
• University of Auckland: Nikki Turner, Cameron Grant, Sarah Redke, Barbara McArdle, Tracey Poole, Anne McLean, Debbie Raroa, Carol Taylor
• University of Otago: Michael Baker, Nevil Pierse, David Murdoch
• Primarycare Advisory Group from PHOs (Procare, East Tamaki, Auckland) and ARPHS: John Cameron, Bruce Adlam, Gary Reynolds, Rosemary Gordon, Leane Els, Marion Howie, Gillian Davies
• ILI sentinel practices
• WHOCC-St Jude: Richard Webby, Paul Thomas
• US-CDC: Mark Thompson, Marc-Alain Widdowson, Jazmin Duque, Diane Gross
• Funding from US-CDC: 1U01IP000480
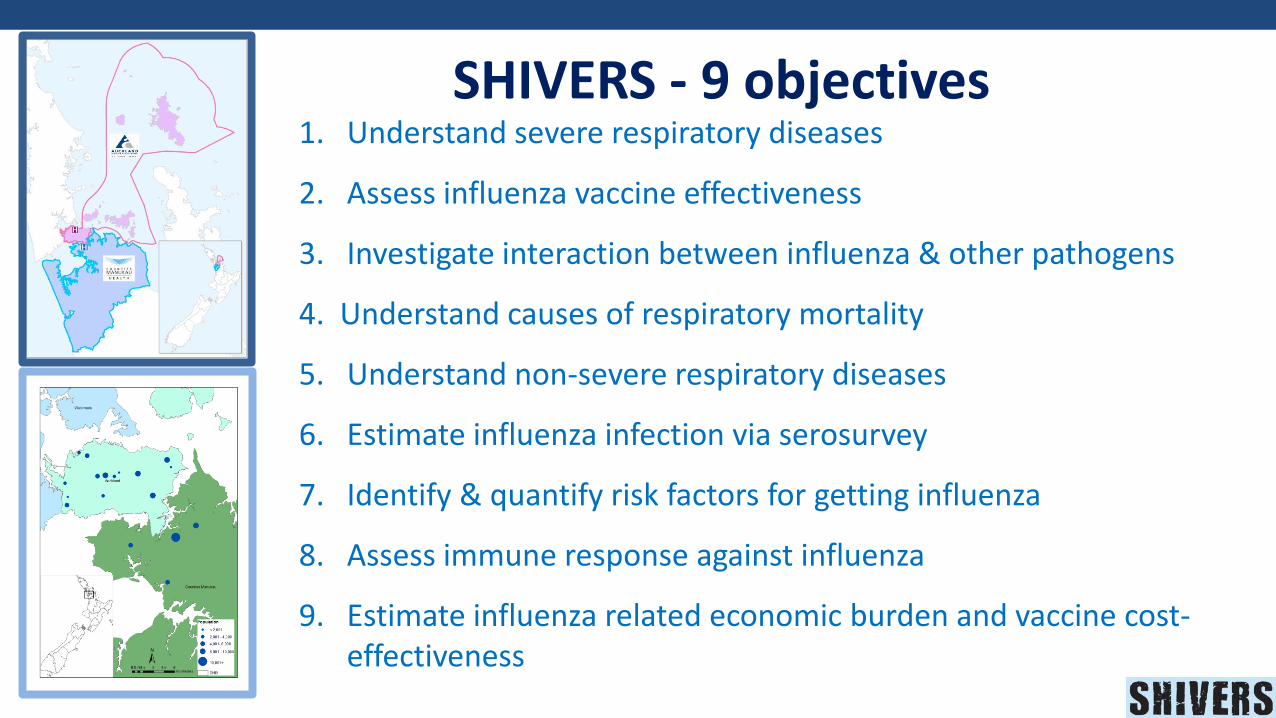
SHIVERS - 9 objectives 1. Understand severe respiratory diseases
2. Assess influenza vaccine effectiveness
3. Investigate interaction between influenza & other pathogens
4. Understand causes of respiratory mortality
5. Understand non-severe respiratory diseases
6. Estimate influenza infection via serosurvey
7. Identify & quantify risk factors for getting influenza
8. Assess immune response against influenza
9. Estimate influenza related economic burden and vaccine cost-effectiveness
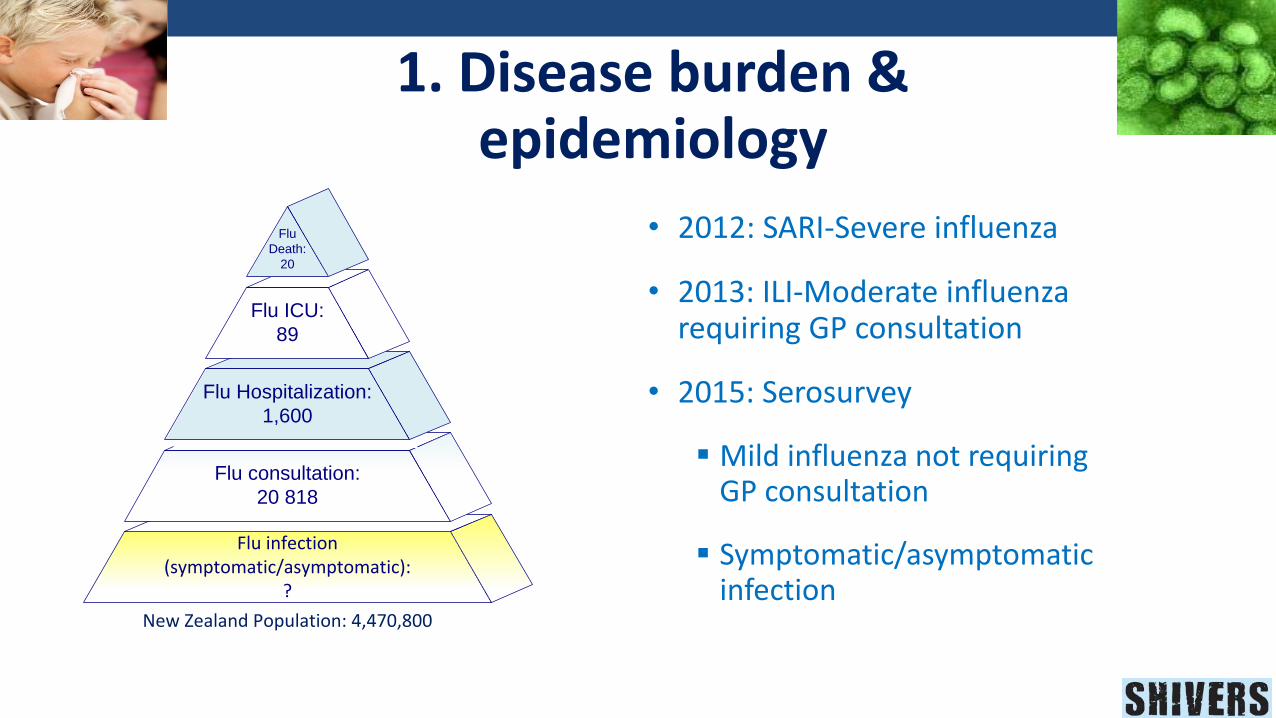
1. Disease burden & epidemiology
• 2012: SARI-Severe influenza
• 2013: ILI-Moderate influenza requiring GP consultation
• 2015: Serosurvey
Mild influenza not requiring GP consultation
Symptomatic/asymptomatic infection
Flu infection (symptomatic/asymptomatic):
?
Flu consultation:
20 818
Flu Hospitalization:
1,600
Flu ICU:
89
Flu
Death:
20
New Zealand Population: 4,470,800
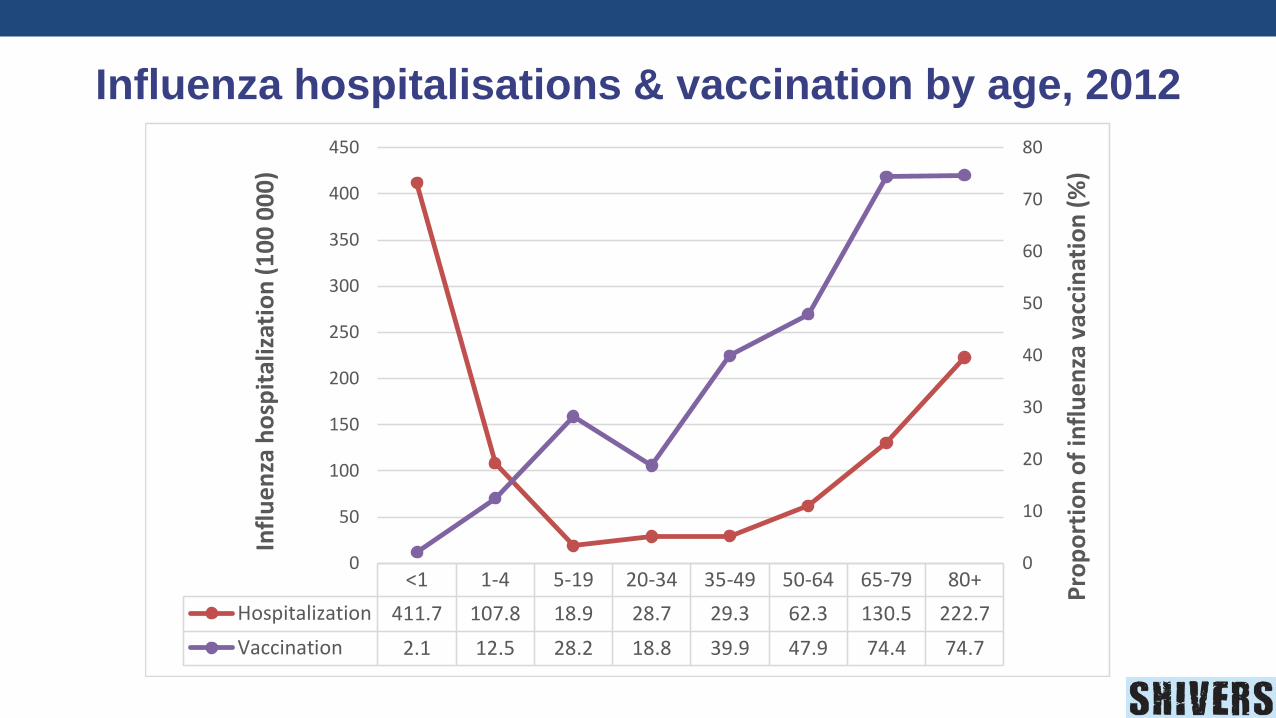
Influenza hospitalisations & vaccination by age, 2012
<1 1-4 5-19 20-34 35-49 50-64 65-79 80+
Hospitalization 411.7 107.8 18.9 28.7 29.3 62.3 130.5 222.7
Vaccination 2.1 12.5 28.2 18.8 39.9 47.9 74.4 74.7
0
10
20
30
40
50
60
70
80
0
50
100
150
200
250
300
350
400
450
Pro
po
rtio
n o
f in
flu
enza
vac
cin
atio
n (
%)
Infl
uen
za h
osp
ital
izat
ion
(1
00
00
0)
Huang et al, NZPHSR 2013;11(2):5-6
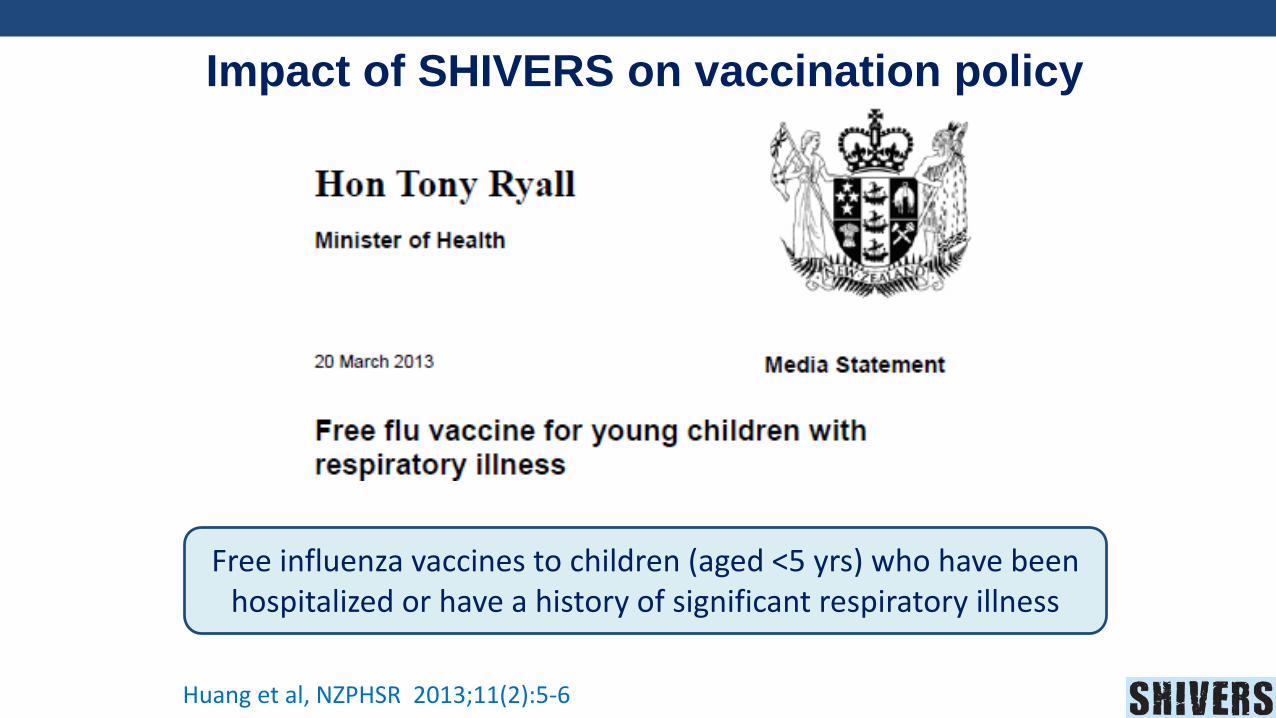
Impact of SHIVERS on vaccination policy
Free influenza vaccines to children (aged <5 yrs) who have been hospitalized or have a history of significant respiratory illness
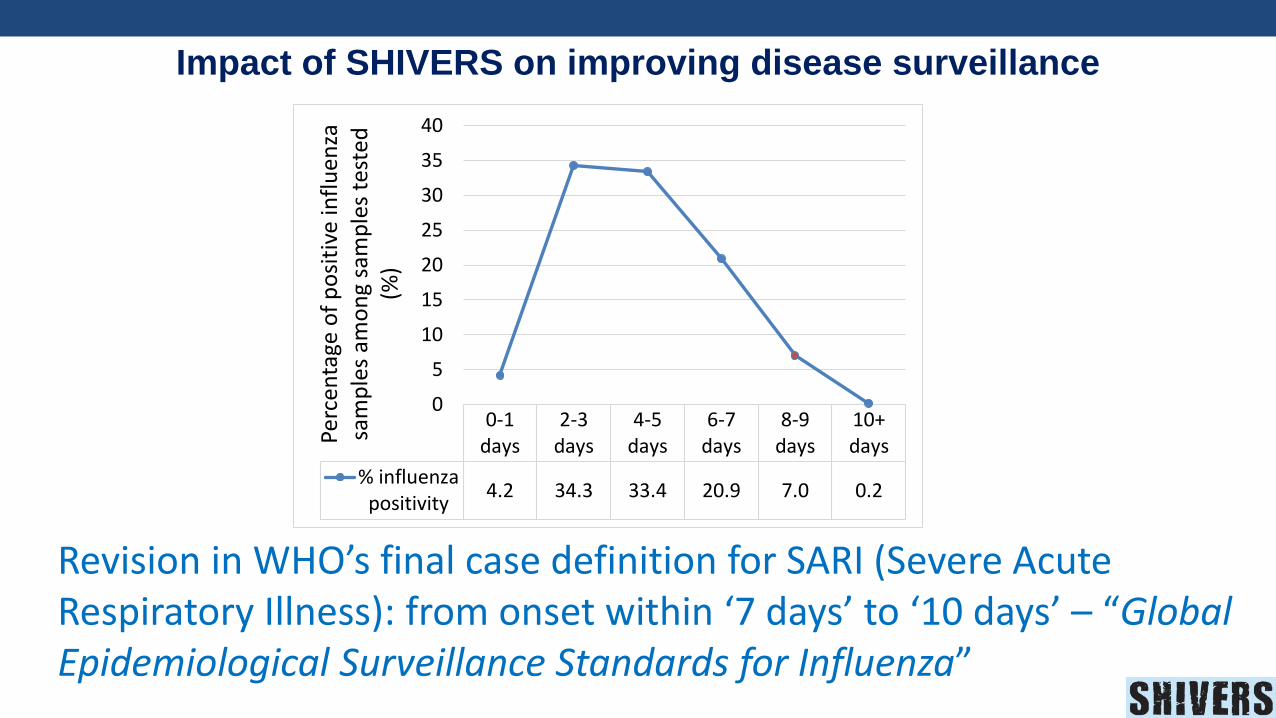
Revision in WHO’s final case definition for SARI (Severe Acute Respiratory Illness): from onset within ‘7 days’ to ‘10 days’ – “Global Epidemiological Surveillance Standards for Influenza”
Impact of SHIVERS on improving disease surveillance
0-1days
2-3days
4-5days
6-7days
8-9days
10+days
% influenzapositivity
4.2 34.3 33.4 20.9 7.0 0.2
0
5
10
15
20
25
30
35
40
Perc
enta
ge o
f p
osi
tive
infl
uen
za
sam
ple
s am
on
g sa
mp
les
test
ed
(%)
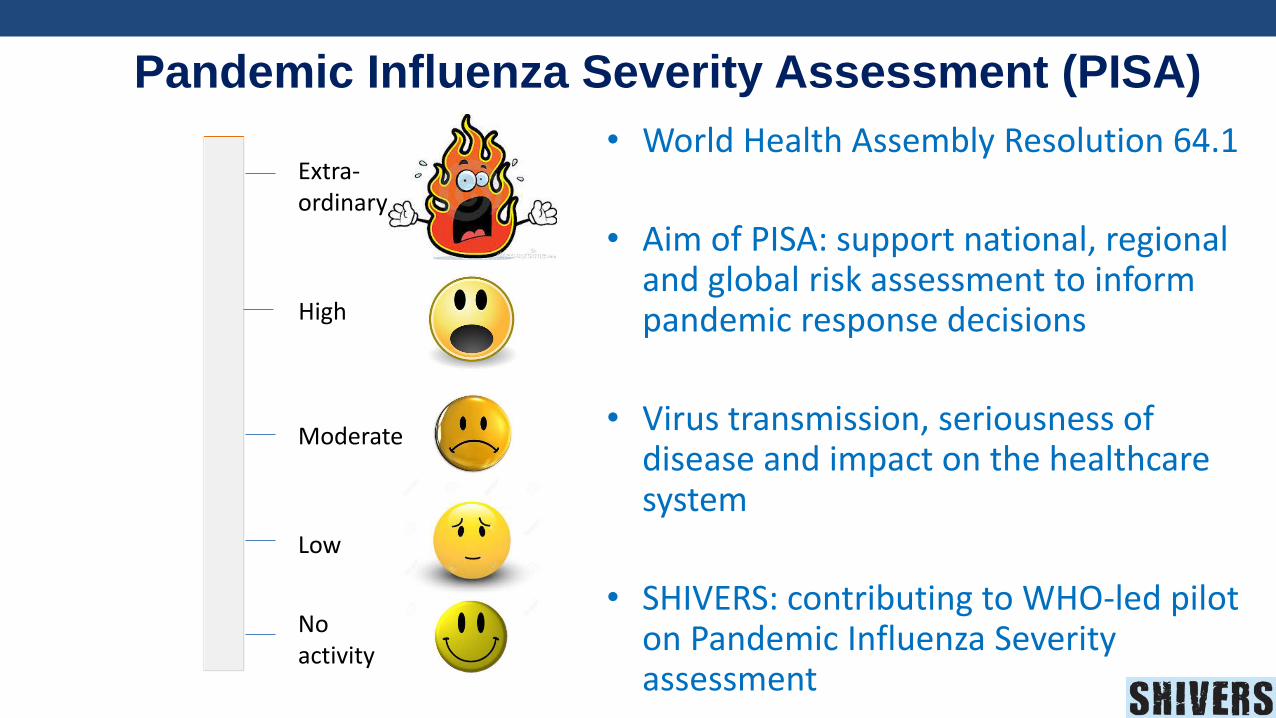
• World Health Assembly Resolution 64.1
• Aim of PISA: support national, regional and global risk assessment to inform pandemic response decisions
• Virus transmission, seriousness of disease and impact on the healthcare system
• SHIVERS: contributing to WHO-led pilot on Pandemic Influenza Severity assessment
Pandemic Influenza Severity Assessment (PISA)
Extra-ordinary
High
Moderate
Low
No activity
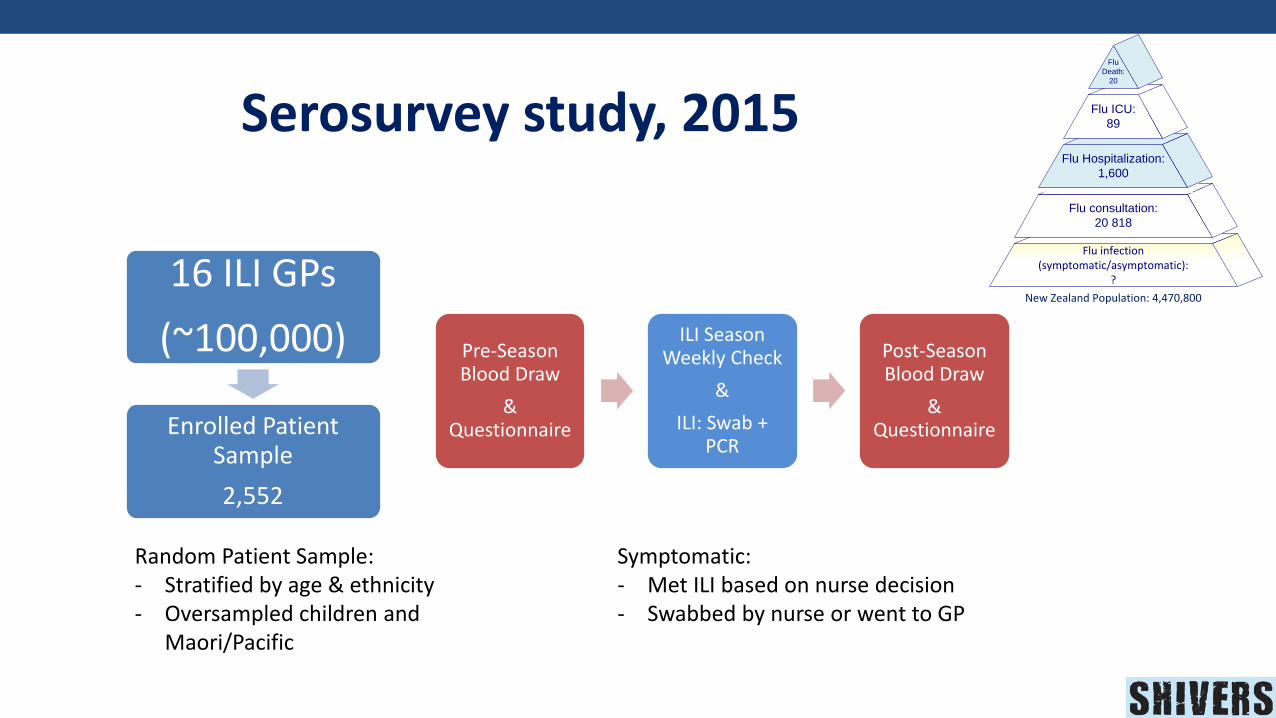
Serosurvey study, 2015
16 ILI GPs
(~100,000)
Enrolled Patient Sample
2,552
Random Patient Sample:- Stratified by age & ethnicity- Oversampled children and
Maori/Pacific
Pre-Season Blood Draw
& Questionnaire
ILI Season Weekly Check
&
ILI: Swab + PCR
Post-Season Blood Draw
& Questionnaire
Symptomatic: - Met ILI based on nurse decision- Swabbed by nurse or went to GP
Flu infection (symptomatic/asymptomatic):
?
Flu consultation:
20 818
Flu Hospitalization:
1,600
Flu ICU:
89
Flu
Death:
20
New Zealand Population: 4,470,800
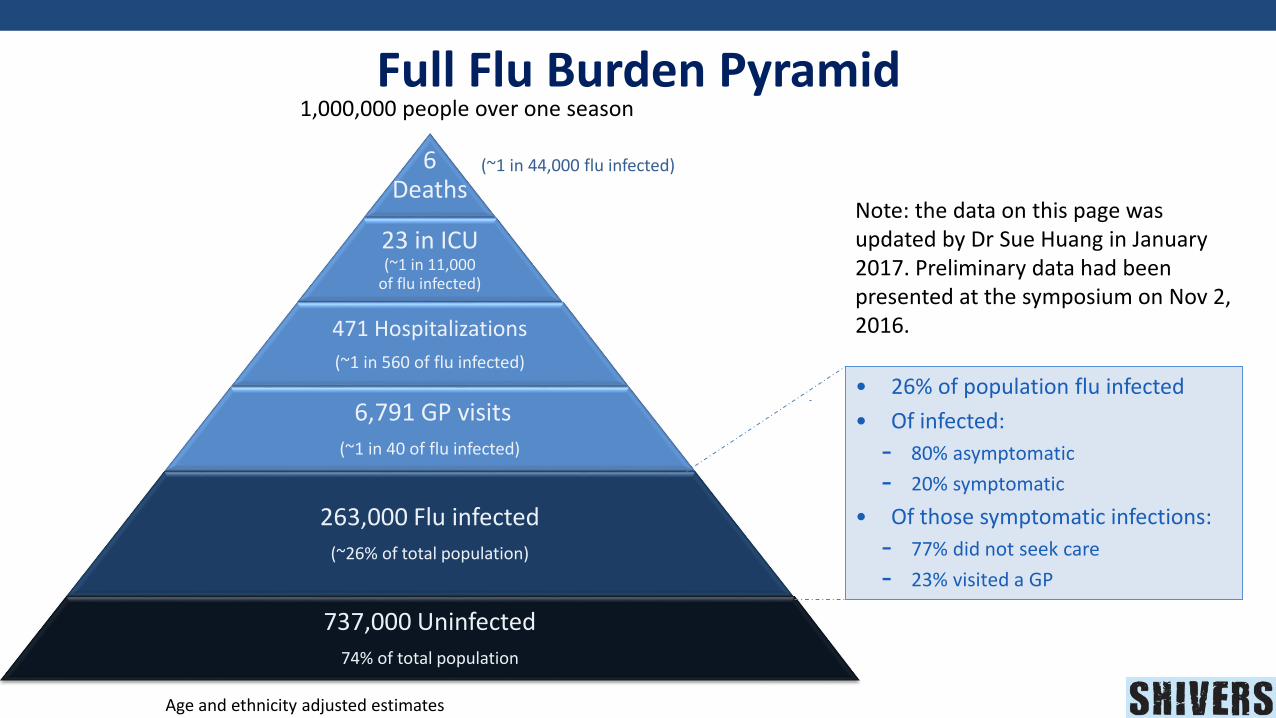
Full Flu Burden Pyramid
6Deaths
23 in ICU(~1 in 11,000
of flu infected)
471 Hospitalizations
(~1 in 560 of flu infected)
6,791 GP visits
(~1 in 40 of flu infected)
263,000 Flu infected
(~26% of total population)
737,000 Uninfected
74% of total population
(~1 in 44,000 flu infected)
Age and ethnicity adjusted estimates
1,000,000 people over one season
• 26% of population flu infected
• Of infected:
- 80% asymptomatic
- 20% symptomatic
• Of those symptomatic infections:
- 77% did not seek care
- 23% visited a GP
Note: the data on this page was updated by Dr Sue Huang in January 2017. Preliminary data had been presented at the symposium on Nov 2, 2016.
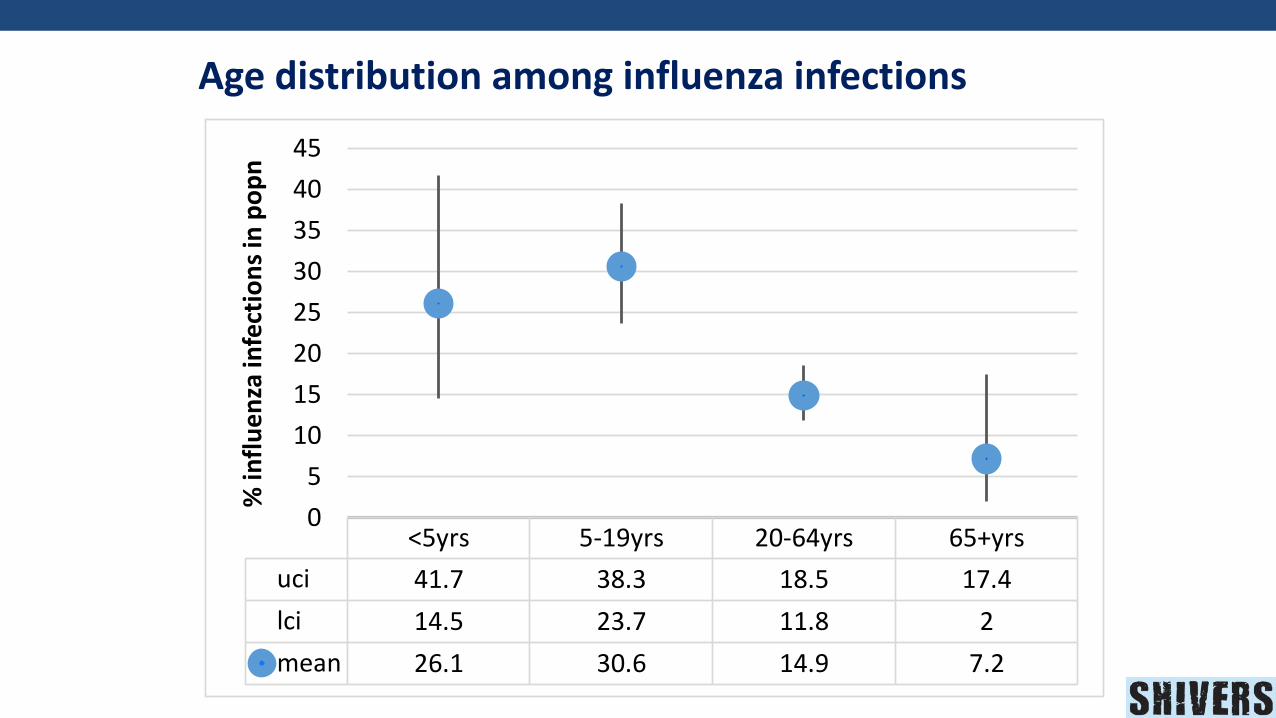
Age distribution among influenza infections
<5yrs 5-19yrs 20-64yrs 65+yrs
uci 41.7 38.3 18.5 17.4
lci 14.5 23.7 11.8 2
mean 26.1 30.6 14.9 7.2
0
5
10
15
20
25
30
35
40
45
% in
flu
enza
infe
ctio
ns
in p
op
n
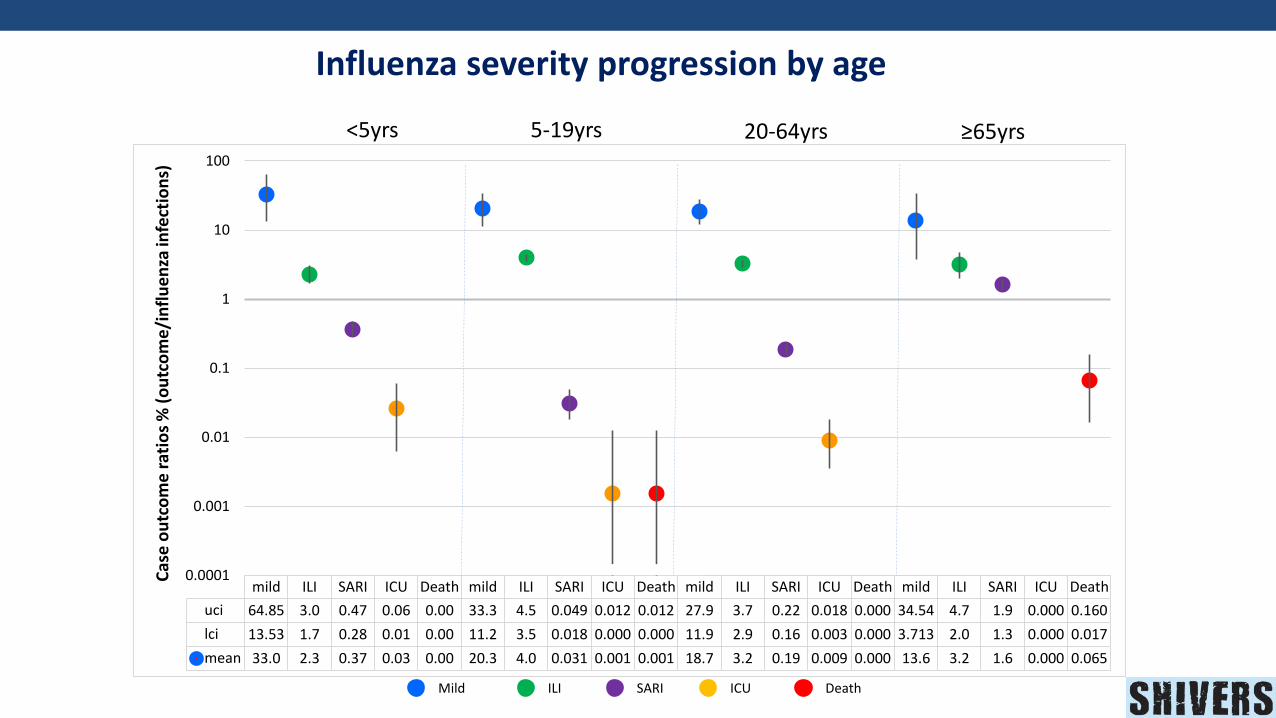
Influenza severity progression by age
<5yrs 5-19yrs 20-64yrs ≥65yrs
mild ILI SARI ICU Death mild ILI SARI ICU Death mild ILI SARI ICU Death mild ILI SARI ICU Death
uci 64.85 3.0 0.47 0.06 0.00 33.3 4.5 0.049 0.012 0.012 27.9 3.7 0.22 0.018 0.000 34.54 4.7 1.9 0.000 0.160
lci 13.53 1.7 0.28 0.01 0.00 11.2 3.5 0.018 0.000 0.000 11.9 2.9 0.16 0.003 0.000 3.713 2.0 1.3 0.000 0.017
mean 33.0 2.3 0.37 0.03 0.00 20.3 4.0 0.031 0.001 0.001 18.7 3.2 0.19 0.009 0.000 13.6 3.2 1.6 0.000 0.065
0.0001
0.001
0.01
0.1
1
10
100C
ase
ou
tco
me
rat
ios
% (
ou
tco
me
/in
flu
en
za in
fect
ion
s)
Mild ILI SARI ICU Death
2. Vaccine effectiveness:
• A case test negative control design: estimate VE
• SHIVERS VE data: contributed to WHO/AIVC process for vaccine strain selection for Southern Hemisphere
• Southern Hemisphere countries: VE provided by NZ & Australia
VE BY YEAR
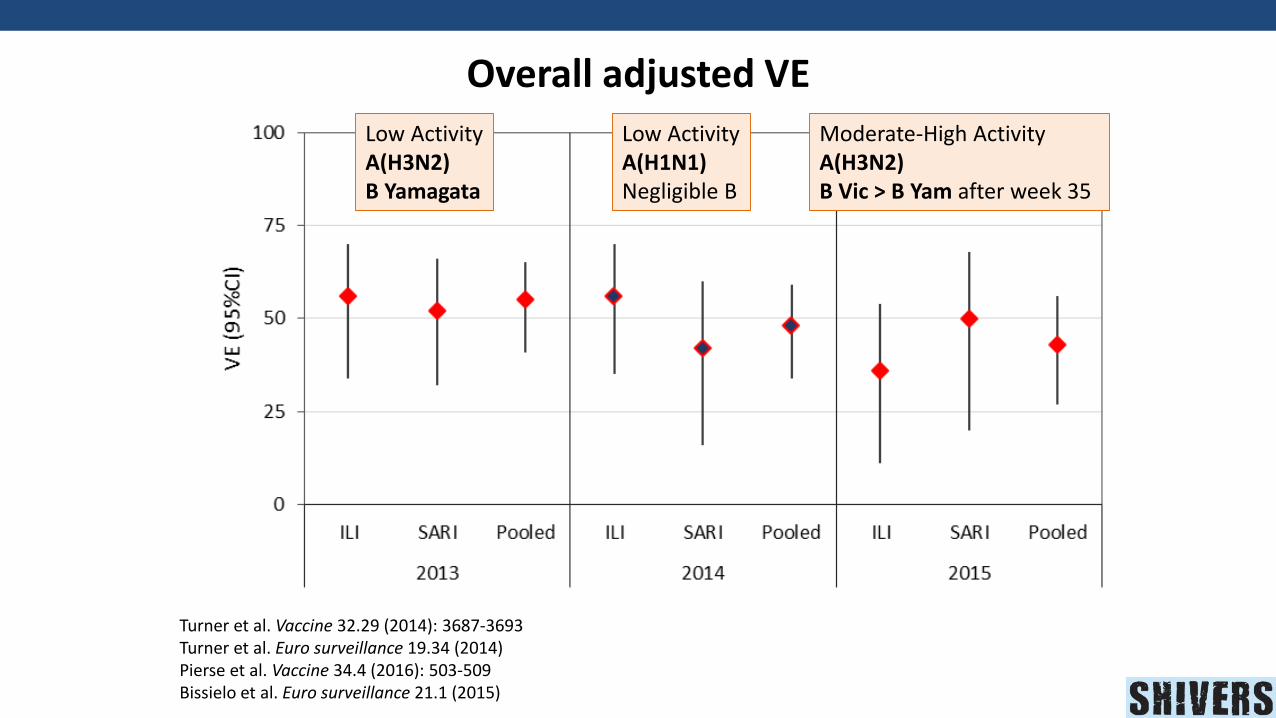
Overall adjusted VE
Turner et al. Vaccine 32.29 (2014): 3687-3693Turner et al. Euro surveillance 19.34 (2014) Pierse et al. Vaccine 34.4 (2016): 503-509Bissielo et al. Euro surveillance 21.1 (2015)
Moderate-High ActivityA(H3N2)B Vic > B Yam after week 35
Low ActivityA(H1N1)Negligible B
Low ActivityA(H3N2)B Yamagata
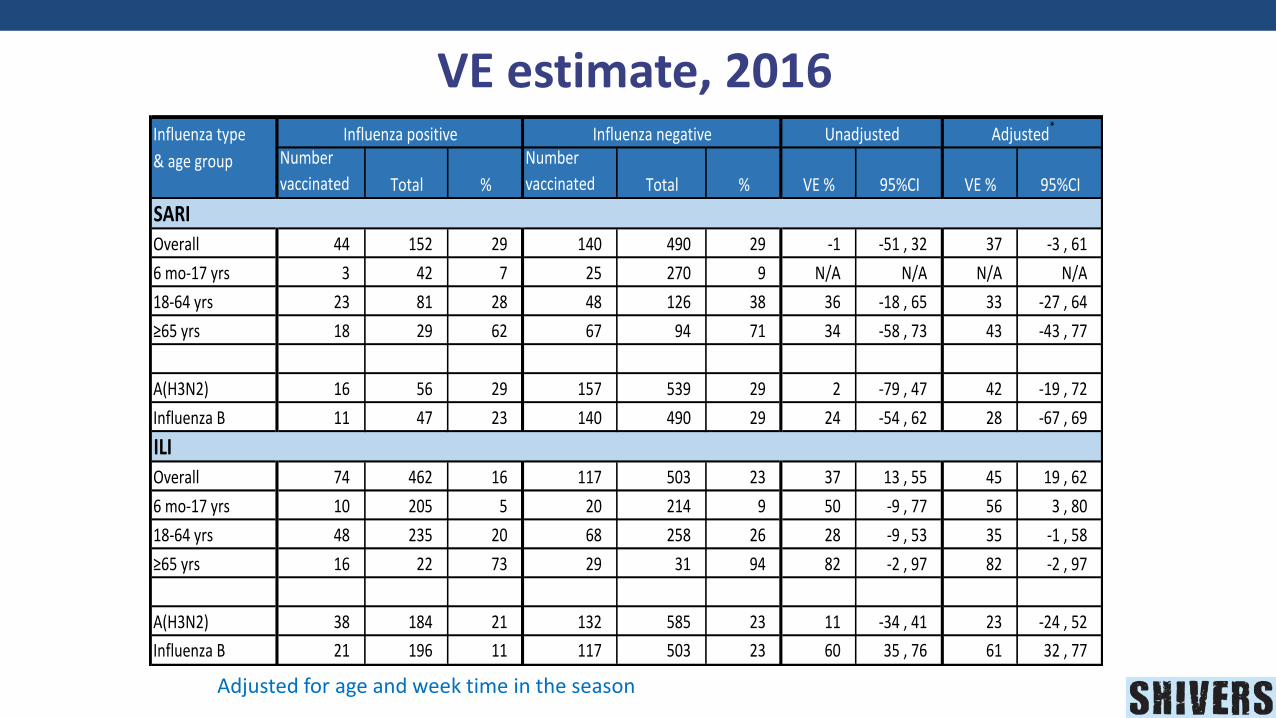
VE estimate, 2016
Adjusted for age and week time in the season
Influenza type
& age group Number
vaccinated Total %
Number
vaccinated Total % VE % 95%CI VE % 95%CI
SARIOverall 44 152 29 140 490 29 -1 -51 , 32 37 -3 , 61
6 mo-17 yrs 3 42 7 25 270 9 N/A N/A N/A N/A
18-64 yrs 23 81 28 48 126 38 36 -18 , 65 33 -27 , 64
≥65 yrs 18 29 62 67 94 71 34 -58 , 73 43 -43 , 77
A(H3N2) 16 56 29 157 539 29 2 -79 , 47 42 -19 , 72
Influenza B 11 47 23 140 490 29 24 -54 , 62 28 -67 , 69
ILIOverall 74 462 16 117 503 23 37 13 , 55 45 19 , 62
6 mo-17 yrs 10 205 5 20 214 9 50 -9 , 77 56 3 , 80
18-64 yrs 48 235 20 68 258 26 28 -9 , 53 35 -1 , 58
≥65 yrs 16 22 73 29 31 94 82 -2 , 97 82 -2 , 97
A(H3N2) 38 184 21 132 585 23 11 -34 , 41 23 -24 , 52
Influenza B 21 196 11 117 503 23 60 35 , 76 61 32 , 77
Influenza positive Influenza negative Unadjusted Adjusted*
3. Risk factors
• Identify and quantify risk factors for getting influenza:
–Host: socio-demography (Age, ethnicity, Sex, deprivation), underlying conditions (BMI, Diabetes, Asthma, Pregnancy etc)
–Healthcare: Antivirals/vaccinations, oxygen, ICU, healthcare utilization
–Environmental factors: housing conditions, crowding
–Behavioral factors: smoking, contact
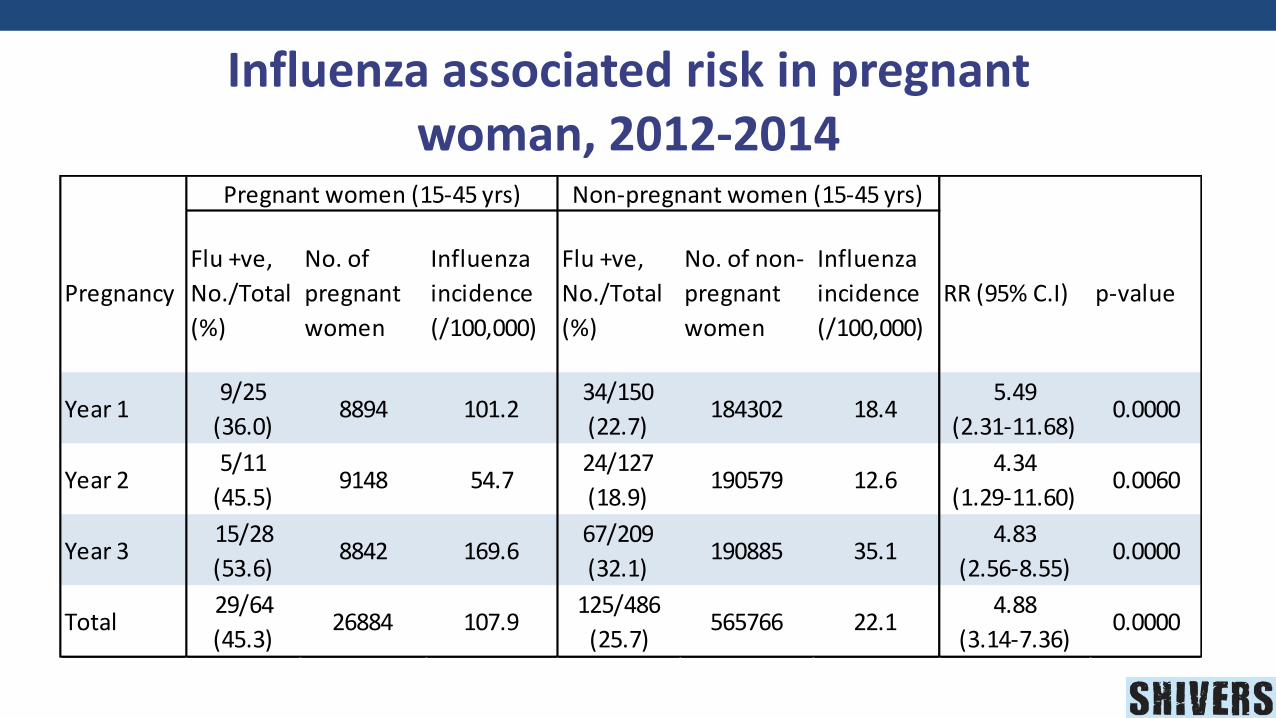
Influenza associated risk in pregnant woman, 2012-2014
Pregnancy
Flu +ve,
No./Total
(%)
No. of
pregnant
women
Influenza
incidence
(/100,000)
Flu +ve,
No./Total
(%)
No. of non-
pregnant
women
Influenza
incidence
(/100,000)
RR (95% C.I) p-value
Year 19/25
(36.0)8894 101.2
34/150
(22.7)184302 18.4
5.49
(2.31-11.68)0.0000
Year 25/11
(45.5)9148 54.7
24/127
(18.9)190579 12.6
4.34
(1.29-11.60)0.0060
Year 315/28
(53.6)8842 169.6
67/209
(32.1)190885 35.1
4.83
(2.56-8.55)0.0000
Total 29/64
(45.3)26884 107.9
125/486
(25.7)565766 22.1
4.88
(3.14-7.36)0.0000
Pregnant women (15-45 yrs) Non-pregnant women (15-45 yrs)
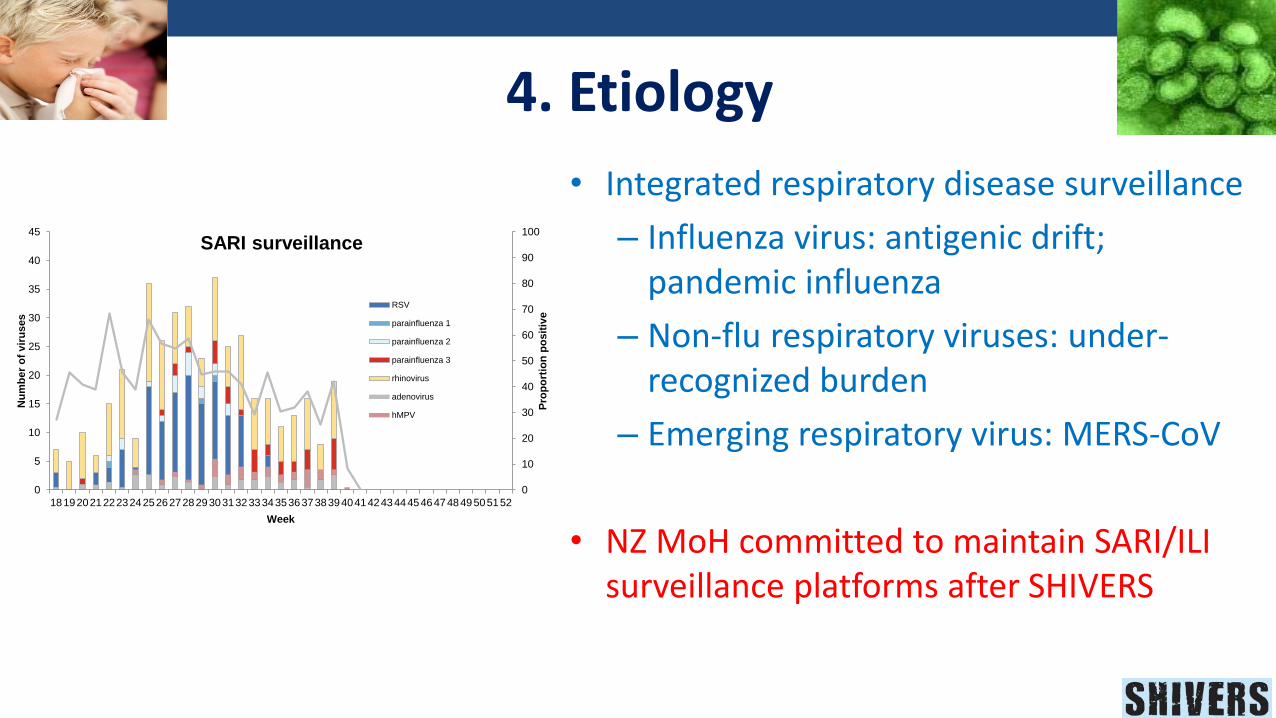
4. Etiology
• Integrated respiratory disease surveillance
– Influenza virus: antigenic drift; pandemic influenza
– Non-flu respiratory viruses: under-recognized burden
– Emerging respiratory virus: MERS-CoV
• NZ MoH committed to maintain SARI/ILI surveillance platforms after SHIVERS
0
10
20
30
40
50
60
70
80
90
100
0
5
10
15
20
25
30
35
40
45
1819202122232425262728293031323334353637383940414243444546474849505152
Pro
po
rtio
n p
os
itiv
e
Nu
mb
er
of
vir
us
es
Week
SARI surveillance
RSV
parainfluenza 1
parainfluenza 2
parainfluenza 3
rhinovirus
adenovirus
hMPV
Conclusion • SHIVERS platform– national infrastructure for seasonal influenza control
and pandemic preparedness and other emerging and endemic respiratory pathogens: burden, severity, VE, risk factors, etiology, immunology, clinical outcomes
• Impact of SHIVERS on vaccination policy: Free influenza vaccine is offered to young children with respiratory illness
• Impact of SHIVERS on improving disease surveillance: SHIVERS data contributed to finalize WHO SARI case definition
• SHIVERS results – value in WHO-led severity assessment
• SHIVERS VE study – value in vaccine strain selection
• Disease burden estimate for respiratory viruses– value in guiding vaccine development and vaccination strategies and better prediction