Embed Size (px)
Citation preview

Performance Tuning Microsoft SQL Server in Windows Azure Virtual MachinesGuy Bowerman
DBI-B311

Whitepaper
Performance Guidance for SQL Server in Windows Azure Virtual Machines
Published: June 2013
Download it here:http://go.microsoft.com/fwlink/?LinkId=306266

AgendaKey Perf
considerations & bottlenecks
Windows Azure VM
characteristics
Monitoring
Troubleshooting
Best practices
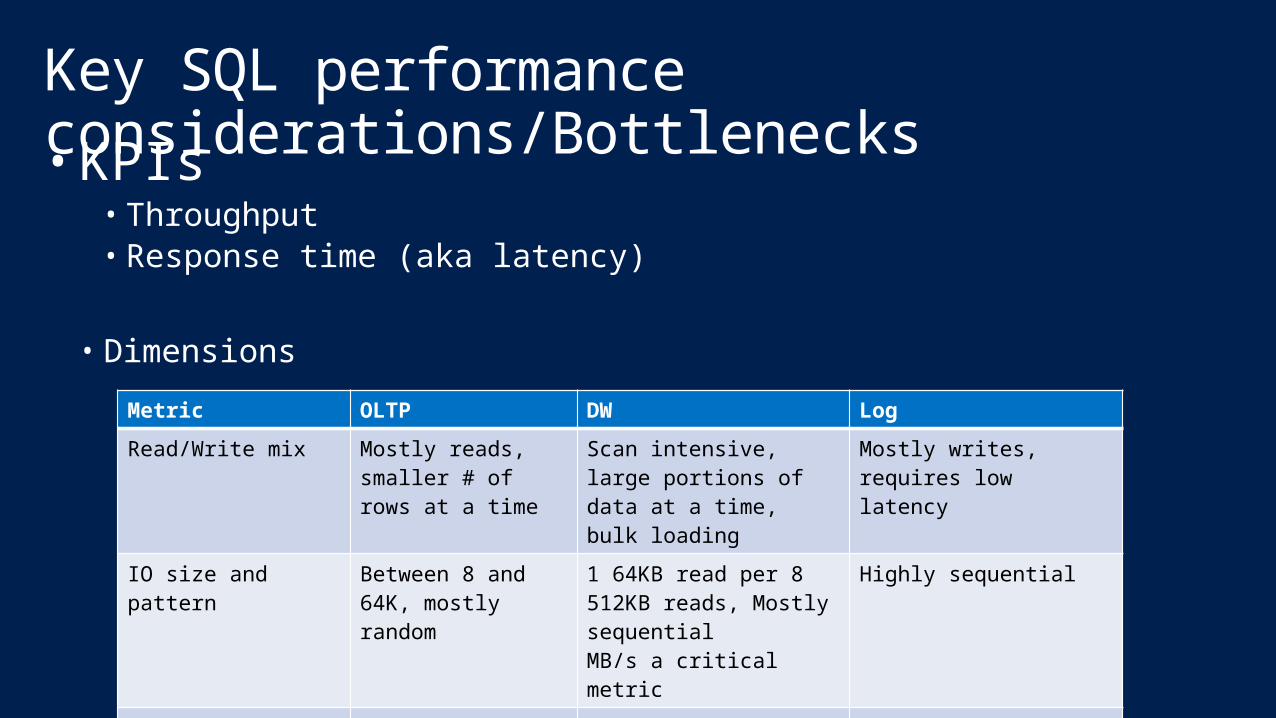
Key SQL performance considerations/Bottlenecks• KPIs
• Throughput• Response time (aka latency)
• Dimensions
Metric OLTP DW Log
Read/Write mix Mostly reads, smaller # of rows at a time
Scan intensive, large portions of data at a time, bulk loading
Mostly writes, requires low latency
IO size and pattern Between 8 and 64K, mostly random
1 64KB read per 8 512KB reads, Mostly sequential MB/s a critical metric
Highly sequential
# users high low n/a

Key Windows Azure VM CharacteristicsArchitec
tureLatency
Variability
Configuration options

VM Configuration Options
Virtual Machine size
Network bandwidth
Disk types and
configurations
Disk cache settings

Windows Azure VM Size & Bandwidth
Virtual Machine Size
CPU Cores Memory
Disk Space for Cloud Services
Disk Space for Virtual Machines
Allocated Bandwidth (Mbps)
Maximum data disks (1 TB each)
Maximum IOPS (500 maximum per disk)
ExtraSmall Shared 768 MB 19 GB 20 GB 5 1 1x500
Small 1 1.75 GB 224 GB 70 GB 100 2 2x500
Medium 2 3.5 GB 489 GB 135 GB 200 4 4x500
Large 4 7 GB 999 GB 285 GB 400 8 8x500
ExtraLarge 8 14 GB 2,039 GB 605 GB 800 16 16x500
A6 4 28 GB 999 GB 285 GB 1,000 8 8x500
A7 8 56 GB 2,039 GB 605 GB 2,000 16 16x500Source: http://msdn.microsoft.com/en-us/library/windowsazure/dn197896.aspx

Windows Azure IO subsystem• Disks implemented as a
shared multi-tenant service
• Built-in triple redundancy, optional geo-redundancy
• Performance less predictable than on-prem• Host machines, storage services, network
bandwidth shared between subscribers• Perf can depend on where and when VM is
provisioned• Subject to maintenance operations• Granular control & configurability vs. cost,
simplicity, out of box redundancy Storage Stamp
Stream Layer
Partition Layer
Front-ends
LB
Intra-stamp replicationStream Layer
Partition Layer
Front-ends
LB
Intra-stamp replication
Storage Stamp
Geo-replication
Storage Location Service

VM Disk Types & Configurations• OS disk (persistent)• Dynamic 127GB disk optimized for OS access patterns (e.g. boot up)
• Data disk (persistent)• A VHD you can attach to a VM to store app data• Up to 1TB in size• Up to 16 disks for XL VMs
• Temporary local disk (non-persistent)• Used for transient/temporary data storage & OS page files• Hosted in attached disks on physical host• Cleaned up in case of a VM failure or recycling• Physical disks shared across other VMs on same physical machine• Not recommended for user or system database files
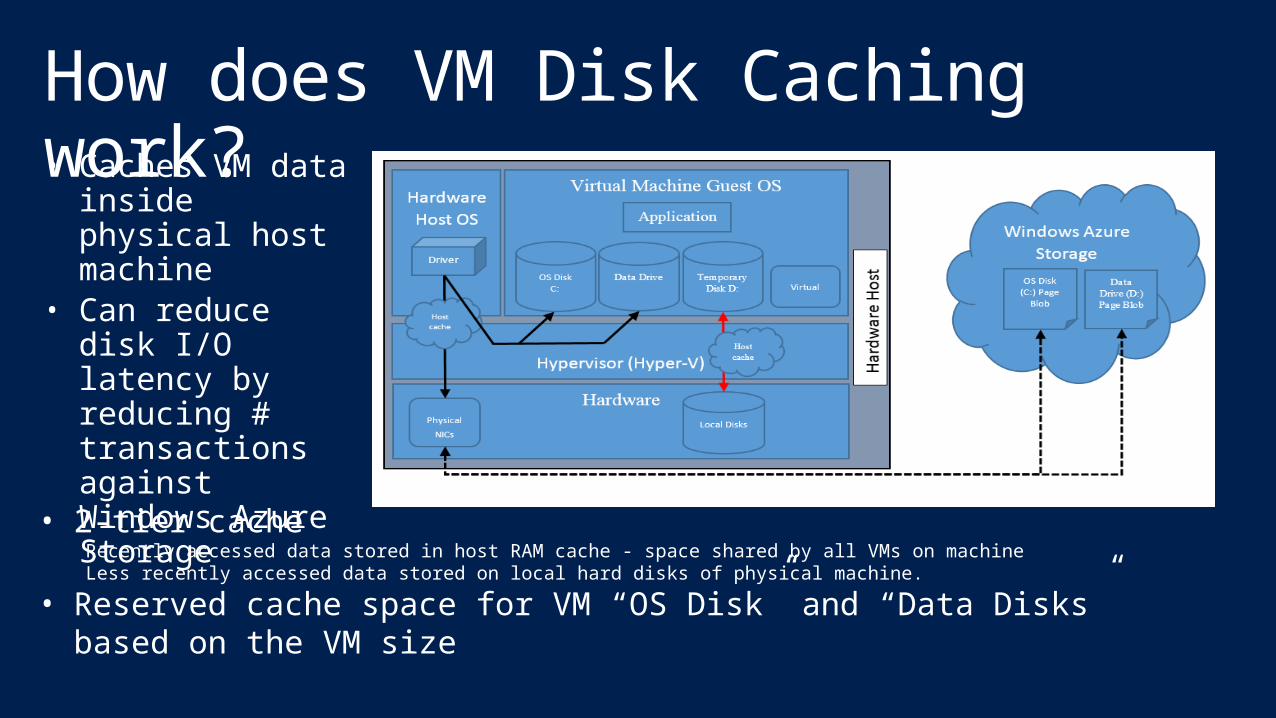
How does VM Disk Caching work?• Caches VM data
inside physical host machine
• Can reduce disk I/O latency by reducing # transactions against Windows Azure Storage
• 2-tier cacheRecently accessed data stored in host RAM cache - space shared by all VMs on machine Less recently accessed data stored on local hard disks of physical machine.
• Reserved cache space for VM “OS Disk” and “Data Disks” based on the VM size

What are the default VM cache settings?
Disk type Read Only Read Write None (disabled)OS disk Supported Default mode Not supportedData disk Supported (up to 4) Supported (up to 4) Default modeTemporary disk Implemented using local attached storage
Read Only: All requests cached for future reads. All writes persisted directly to Windows Azure Storage
Read Write: Reads and writes cached for future reads. Regular writes persisted to local cache. If Write-through, Forced Unit Access (FUA) or flush is asserted, write commits directly to Windows Azure Storage- Lowest disk latency for light workloads
None (disabled): Bypasses cache. All disk transfers persisted to Windows Azure Storage- Highest I/O rate for I/O intensive workloads- Also consider TX cost

Monitoring
Key tools
Storage Analytics
VM Dashboard
SQL Perf counters

Key monitoring tools – SQLIO / DMVs• SQLIO – determine IO capacity of VM
configurations• Disk Subsystem Benchmark Tool• Generates common SQL Server I/O patterns • Measure results on different storage configurations
• DMVs – monitor critical resource usage…
::Test random 8K reads/writes
sqlio -kW -s300 -frandom -o32 -b8 -LS -Fparam.txt
sqlio -kR -s300 -frandom -o32 -b8 -LS -Fparam.txt

Monitoring DMVs for critical resources• Instance level waits -
sys.dm_os_wait_stats • Query resource Consumers -
sys.dm_exec_query_stats • 1 row per query in cached plan• Identify top resource consumers, monitor query execution and
efficiency
• I/O consumers and characteristics - sys.dm_io_virtual_file_stats
• Monitor executing requests - sys.dm_exec_requests (snapshot)• locking, blocking, latching and other performance issues
caused by resource contention
• Memory object contention - sys.dm_os_spinlock_stats

IO Consumers – sys.dm_io_virtual_file_stats
Logical disk counter
Typical storage termSuggested actions in Windows Azure virtual machine environment
Disk reads / second
Disk writes / second
IOPS Measure the number of I/O’s per second.
Consider adding more data disks in line with your IOPS requirements.
Average disk sec / read
Average disk sec / write
Latency Measure disk latency.
Note: Numbers might vary; look at averages over time.
Average disk bytes / read
Average disk bytes / write
Block size Measure the size of I/O’s being issued.
Note: Larger I/O’s tend to have higher latency, such as those associated with BACKUP/RESTORE.
Average / current disk queue length
Outstanding or waiting IOPS
Provides insight into the applications I/O pattern.
Disk read bytes/sec
Disk write bytes/sec
Throughput or aggregate throughput
Measure of total disk throughput.
Note: Ideally, larger block scans should be able to heavily utilize connection bandwidth (for example, your throughput can be higher with a smaller number of larger IOPS).

Windows Azure Storage Analytics Metrics
• Tracks aggregated storage usage for Blobs, Tables and Queues• Capacity – e.g. #containers, total #blobs• Requests - #requests, total ingress/egress, average E2E latency and server latency, total #
failures by category, etc.• Access via storage account namespace
https://<accountname>.table.core.windows.net/Tables("$MetricsTransactionsBlob")
• Enable in portal or using Set Blob Service Properties (REST API)• Set retention policy• Minimal – aggregated metrics | Verbose – metrics for each storage operation• See Windows Azure Storage Metrics: Using Metrics to Track Storage Usage

Performance Charts on the WA Portal• VM Dashboard• Monitor tab for
storage account• Enabled under the “configure”
tab • VM read and write to their VHDs
using GetBlob and PutPage commands respectively

Use Perf countersTypical SQL KPIs
• Max/Avg \Process(SQLServ)\% Processor Time
• Max/Avg \Processor(_Total)\% Processor Time
• Max/Avg \SQLServer:SQL Statistics\Batch Requests/sec
• Max/Avg \Logical Disk\*
Typical Web App KPIs
• Max/Avg \ASP.NET Applications (_Total_)\Requests/sec
• Avg \Memory\Available Mbytes
• Max/Avg \Processor(_Total)\% Processor Time
• Avg \ASP.NET\Request Wait Time
• Avg \ASP.NET\Request Execution Time
• Avg \ASP.NET\Requests Queued
• Avg \ASP.NET\Requests Rejected
• Avg \ASP.NET\Requests Current Typical User/test characteristics• Number of concurrent users • Average/Max request execution time• Number of web servers • Ramp up period, test method • Start and end time of test

Troubleshooting
Classic performance
factors
High-level troubleshoot
ing steps
Common issues

Classic SQL Server Performance Factors Plan
change/choice issues
Software/hardware
configuration
Locking & latching
Multi-user operations
and blocking
Checkpoint & system operations

High-level Troubleshooting Steps
Define KPIs to monitor resource utilization
Monitor KPIs to track utilization
over time
Examine trends and patterns as
workload increases
Monitor DMVs to understand
resource contention/waits

Troubleshooting Common VM Issues
Issue KPIs To Monitor Actions to Consider
CPU at or near 80% % Processor Time (_Total) SOS_SCHEDULER_YIELD waits
Increase instance sizeIdentify top consuming queries and tuneLoad balance (e.g. move DB to another
instance)
Near I/O capacity limits or
IO Latency Increases
Average disk reads per secondAverage disk writes per second
Disk reads per secondDisk writes per second
io_virtual_file_statsPAGEIOLATCH waits
SQL Server: Buffer Manager\Page Life Expectancy
Check Page Life Expectancy counter, for mem pressure. Increase instance size Identify which DB and log files have I/O
bottleneckAdd more data disks and separate data files
if near IOPS limits per disk Tune queries to reduce reads and writes
Consider enabling row or page compression
Memory resource pressure
Memory: Available Bytes Memory: Pages per second
SQL Server: Buffer Manager\Page Life ExpectancyProcess: Working Set (for SQL Server)
RESOURCE_SEMAPHORE waits
Check max server memory setting for SQL Server.
Use high memory instanceIdentify SQL component (such as, CLR, high memory grants for app queries, et.), tune
appropriately.

Best Practices
NetworkLatency
Disk configuratio
n
Tempdb placement
IO optimization

VM network performance• Network latency can be
higher• Virtualization, security, load balancing, proximity• Reducing network round trips can have more
impact
• Consolidate “chatty” application layers on the same machine
• Host VMs in the same cloud service• Allows communication via internal IP addresses
(DIPs)• Use Windows Azure Virtual Network for VMs in
different cloud services• Load balance multiple VMs in the same cloud
service via public virtual IP addresses
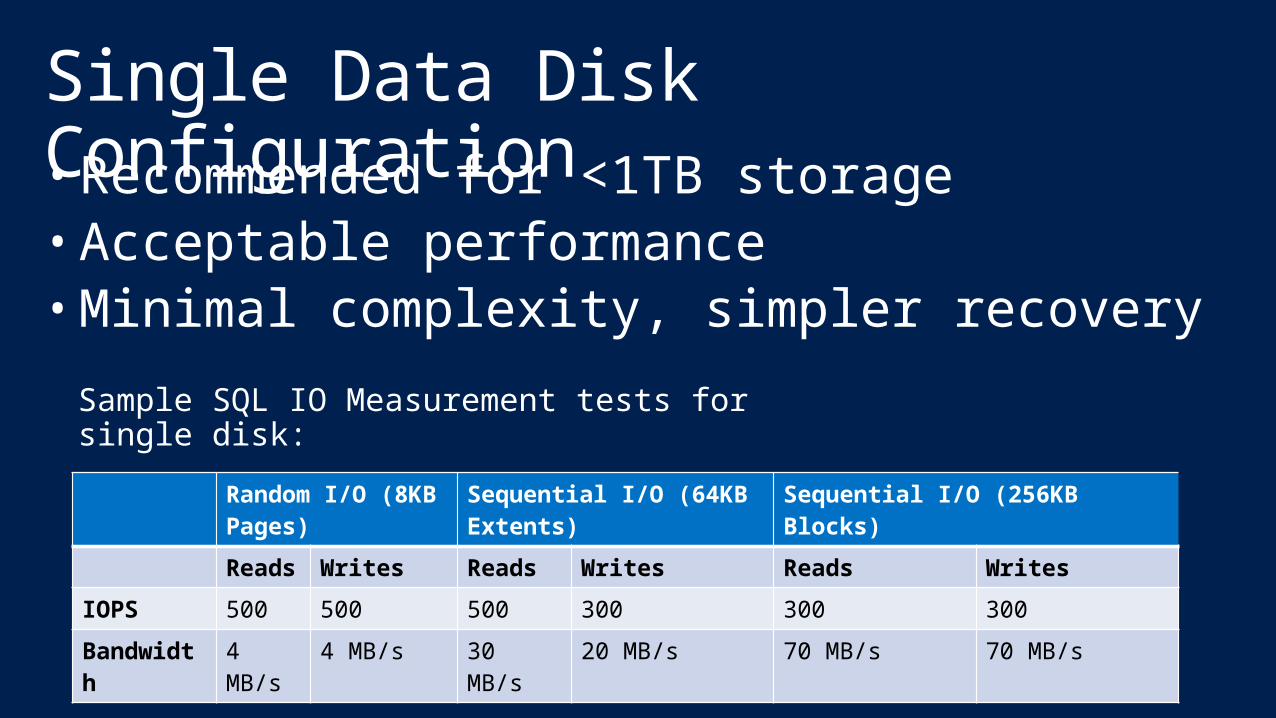
Single Data Disk Configuration• Recommended for <1TB storage • Acceptable performance• Minimal complexity, simpler recovery
Random I/O (8KB Pages)
Sequential I/O (64KB Extents)
Sequential I/O (256KB Blocks)
Reads
Writes Reads Writes Reads Writes
IOPS 500 500 500 300 300 300
Bandwidth
4 MB/s
4 MB/s 30 MB/s 20 MB/s 70 MB/s 70 MB/s
Sample SQL IO Measurement tests for single disk:

Multiple Disk Configuration• Recommended for >1TB DB files & higher
IOPS/bandwidth• Config options• Use Database files and Filegroups, place DB files across multiple data
disks• Best performance in our testing• Includes tempDB
• Create OS volume on multiple data disks (e.g. OS striped volume or WS2012 storage space)• Storage spaces recommended over OS striped volumes

Demo – Multiple disk configuration

Aggregated Measurement Samples4 disks Random I/O (8KB
Pages)Sequential I/O (64KB Extents)
Sequential I/O (256KB Blocks)
Reads Writes Reads Writes Reads Writes
IOPS 2000 2000 2000 1300 700 1100
Bandwidth
20 MB/s 20 MB/s 120 MB/s 80 MB/s 170 MB/s 270 MB/s
16 disks Random I/O (8KB Pages)
Sequential I/O (64KB Extents)
Sequential I/O (256KB Blocks)
Reads Writes Reads Writes Reads Writes
IOPS 8000 8000 2500 5000 700 2400
Bandwidth
60 MB/s 60 MB/s 150 MB/s 300 MB/s 170 MB/s 600 MB/s
8 disks Random I/O (8KB Pages)
Sequential I/O (64KB Extents)
Sequential I/O (256KB Blocks)
Reads Writes Reads Writes Reads Writes
IOPS 4000 4000 2500 2600 700 2200
Bandwidth
30 MB/s 30 MB/s 150 MB/s 160 MB/s 170 MB/s 550 MB/s
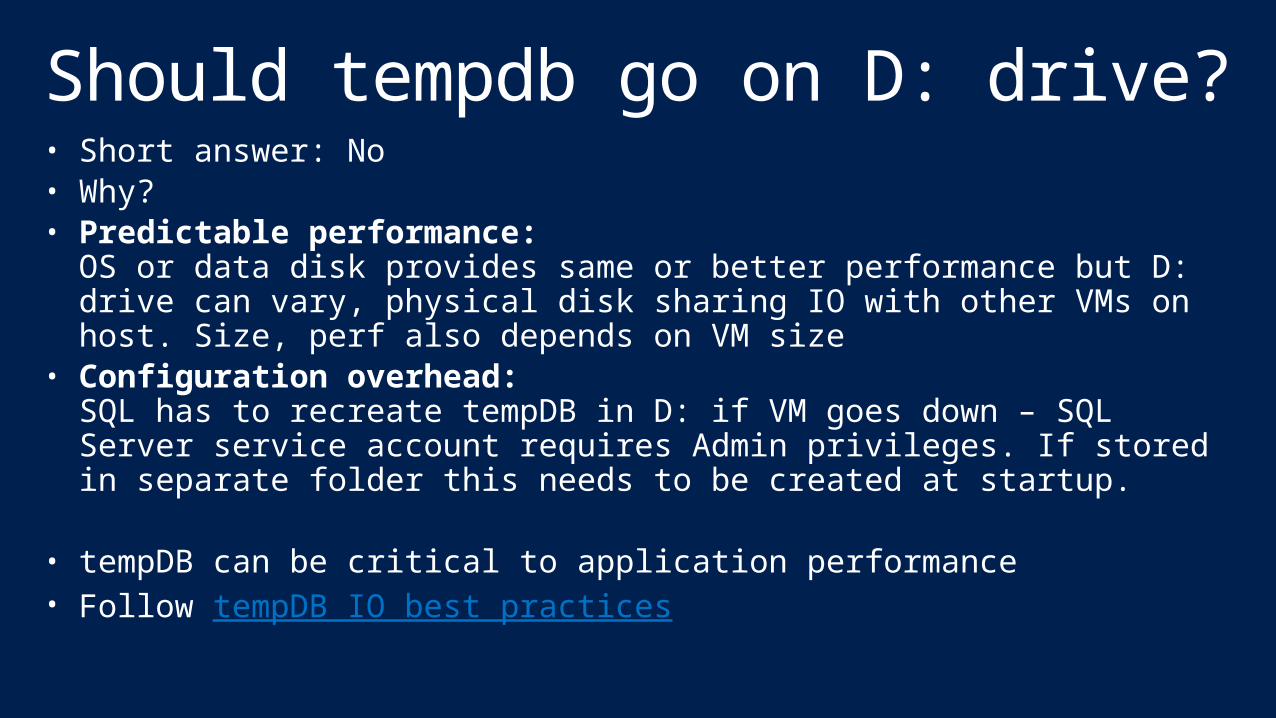
Should tempdb go on D: drive?• Short answer: No• Why?• Predictable performance:
OS or data disk provides same or better performance but D: drive can vary, physical disk sharing IO with other VMs on host. Size, perf also depends on VM size
• Configuration overhead: SQL has to recreate tempDB in D: if VM goes down – SQL Server service account requires Admin privileges. If stored in separate folder this needs to be created at startup.
• tempDB can be critical to application performance• Follow tempDB IO best practices

What are SQL caching best practices?OS Disk• “Read Write” (default) reduces read
latency for IO intensive workloads with smaller DBs (<=10GB) • Working set can fit in disk cache or memory,
reducing blob storage IO
Data disks • Recommended for DBs > 10GB.
• Cache setting depends on the IO pattern and workload intensity
• Use default of “None” (disable) for Higher rate of random IOs (e.g. OLTP) & higher throughput• Bypasses physical host local disks, maximizing IO
rate
• Consider enabling read cache for latency sensitive read heavy workloads

Best Practice: Data Compression
NONE PAGE100000
150000
200000
250000
400000
500000
600000
700000
800000
900000
1000000
Query Performance with Data Com-pression
CPU Time Elapsed TimeLogical Reads Physical Reads (+RA)
Tim
e (
ms)
Read
s
NONE PAGE0
10
20
30
40
50
60
70
OLTP Throughput and CPU Usage with Data Compression
Throughput CPU Time (%)C
PU
Tim
e (
%),
Thro
ughput
(Busin
ess T
rans-
acti
ons/s
ec)
IO intensive workloads: fewer pages ->reduced IO

Reduce IO with Instant File Initialization• Not default in Azure VM images• Reduces IO for• Creating a DB• Restoring a DB• Adding files to a DB • Extending file size• Autogrow, etc.
• Add SQL service account to Perform Volume Maintenance Tasks security policy
• Restart SQL Server
Create 100 GB database Restore 100 GB database0
10
20
30
40
50
60
Impact of Instant File Initialization
Without Instant File Initialization
With Instant File InitializationTim
e (
min
ute
s)

What else effects data disk performance?• Disk warm-up - adaptive
partitioning and load balancing adjusts to workload changes
• NTFS Allocation Unit Size – use default 4K cluster
• Single vs. multiple storage accounts with a single VM• Data in different blobs not written at the same
time• BLOBs that make up the stripe set could be out of
sync• Spread the load across multiple VHDs instead• Note a storage account has a limit of 20K tps
Stream Layer
Partition Layer
Front-ends
LB
Intra-stamp replicationStream Layer
Partition Layer
Front-ends
LB
Intra-stamp replication
Geo-replication
Storage Location Service

Conclusions• Read the Performance Guidance for SQL Server in Windows Azure Virtual Machines white paper
• Plan and test for IO perf variability• Identify optimal VM size• Optimize for reduced IO and network round
trips• Use Filegroups and multiple data disks for
large DBs• Identify your KPIs to monitor• Revisit optimization decisions as workload
grows

Further ReadingWhite paper: Performance Guidance for SQL Server in Windows Azure Virtual Machines
SQL IaaS Basics• SQL Server in Windows Azure Virtual Machines• SQL Server HA/DR on IaaS
Windows Azure Storage• Windows
Azure’s Flat Network Storage and 2012 Scalability Targets
• Windows Azure Storage: A Highly Available Cloud Storage Service with Strong Consistency
• Erasure Coding in Windows Azure Storage• SQL Server Backup and Restore with Windows Az
ure Blob Storage Service
SQL Server Performance• Analyzing I/O Characteristics and Sizing Storage
Systems for SQL Server Database Applications• Compilation of SQL Server TempDB IO Best
Practices• Windows Azure SQL Database and SQL Ser
ver -- Performance and Scalability Compared and Contrasted
TechEd 2013 Sessions
DBI-B201: Lap Around Windows Azure SQL Database and Microsoft SQL Server in Windows Azure Virtual MachinesMDC-B406: Achieve High Availability with Microsoft SQL Server on Windows Azure Virtual MachinesDBI-B206: Private Cloud – Better Together: Microsoft SQL Server 2012, Windows Server 2012 and System Center 2012DBI-B316: Running BI Workloads on Windows Azure Virtual MachinesDBI-B306: Microsoft SQL Server High Availability and Disaster Recovery on Windows AzureDBI-B329: Overview, Best Practices and Lessons Learned on Microsoft SQL Server in Windows Azure Virtual MachinesMDC-B361: Best Practices from Real Customers: Deploying to Windows Azure Infrastructure Services (IaaS)WAD-B402: Windows Azure Internals

Track Resources
@sqlserver
mvaMicrosoft Virtual Academy
SQL Server Website
Get Certified!
Hands-On Labs
Download Data Explorer
Download Geoflow
Windows Azure

msdn
Resources for Developers
http://microsoft.com/msdn
Learning
Microsoft Certification & Training Resources
www.microsoft.com/learning
TechNet
Resources
Sessions on Demand
http://channel9.msdn.com/Events/TechEd
Resources for IT Professionals
http://microsoft.com/technet

Complete an evaluation on CommNet and enter to win!

Evaluate this session
Scan this QR code to evaluate this session and be automatically entered in a drawing to win a prize

© 2013 Microsoft Corporation. All rights reserved. Microsoft, Windows and other product names are or may be registered trademarks and/or trademarks in the U.S. and/or other countries.The information herein is for informational purposes only and represents the current view of Microsoft Corporation as of the date of this presentation. Because Microsoft must respond to changing market conditions, it should not be interpreted to be a commitment on the part of Microsoft, and Microsoft cannot guarantee the accuracy of any information provided after the date of this presentation. MICROSOFT MAKES NO WARRANTIES, EXPRESS, IMPLIED OR STATUTORY, AS TO THE INFORMATION IN THIS PRESENTATION.


![CICADA - USENIX · 1 vm 2 vm 3 vm 4 vm 5vm 6 vm 7 vm 8 vm 9 vm 2 vm 3 vm 4 vm 5 vm 6 vm 7 vm 8 vm 9 vm 1 rigid application (similar to VOC [1]) vm 1 vm 2 vm 3 vm 4 vm 5vm 6 vm 7 vm](https://img.pdfslide.net/doc/110x75/5f3ade2be7477529602b0cb3/cicada-usenix-1-vm-2-vm-3-vm-4-vm-5vm-6-vm-7-vm-8-vm-9-vm-2-vm-3-vm-4-vm-5-vm.jpg)