Embed Size (px)
Citation preview

Small Business Branch
Key Small Business StatisticsJuly 2011
www.ic.gc.ca/sbstatistics

For additional copies of this publication, please contact:
Publishing and Depository Services Public Works and Government Services Canada Ottawa ON K1A 0S5
Telephone (toll-free): 1-800-635-7943 (Canada and U.S.) Telephone (local): 613-941-5995 TTY: 1-800-465-7735 Fax (toll-free): 1-800-565-7757 (Canada and U.S.) Fax (local): 613-954-5779 Email: [email protected] Website: www.publications.gc.ca
This publication is available upon request in accessible formats. Contact:
Multimedia Services Section Communications and Marketing Branch Industry Canada Room 441E, East Tower 235 Queen Street Ottawa ON K1A 0H5
Telephone: 613-947-5177 Fax: 613-954-6436 Email: [email protected]
This publication is also available online at www.ic.gc.ca/sbstatistics.
Permission to Reproduce Except as otherwise specifically noted, the information in this publication may be reproduced, in part or in whole and by any means, without charge or further permission from Industry Canada, provided that due diligence is exercised in ensuring the accuracy of the information reproduced; that Industry Canada is identified as the source institution; and that the reproduction is not represented as an official version of the information reproduced, nor as having been made in affiliation with, or with the endorsement of, Industry Canada.
For permission to reproduce the information in this publication for commercial redistribution, please email [email protected].
Cat. No. Iu186-1/2011-2E-PDF ISSN 1718-3456 60928
Aussi offert en français sous le titre Principales statistiques relatives aux petites entreprises.

1Key Small Business Statistics — July 2011
Table of Contents
2 Foreword
3 Highlights
Number of Businesses
5 When is a business “small”?
6 How many businesses are there in Canada?
Survival
12 How many businesses appear and disappear each year?
14 Bankruptcy statistics
14 How long do small businesses survive?
15 Whatshareoffirmsarehigh-growthfirms?
Employment and Earnings
18 How many people work for small businesses?
21 How many jobs do small businesses create?
25 How much do employees of small businesses earn?
Contribution to GDP
28 What is the contribution of small businesses to Canada’s gross domestic product?
Self-Employment
30 Whoisself-employed?
30 Howmanypeopleareself-employed?
34 Howhasself-employmentcontributedtojobcreation?
36 Dotheself-employedworklongerhoursthanemployees?
Women in Business
38 How many small business entrepreneurs are women?
Exports
40 What is the contribution of small businesses to Canada’s exports?

2
Foreword
Key Small Business Statisticsisasemi-annualpublicationthatprovidesbaselinedataonthesmall business sector in Canada. This seventeenth edition updates data found in previous editions. The following sections have been updated with new data:
• How many businesses are there in Canada?
• How many businesses appear and disappear each year?
• Bankruptcy statistics
• How long do small businesses survive?
• Whatshareoffirmsarehigh-growthfirms?
• How many people work for small businesses?
• How many jobs do small businesses create?
• How much do employees of small businesses earn?
• What is the contribution of small businesses to Canada’s gross domestic product?
• Howmanypeopleareself-employed?
• Howhasself-employmentcontributedtojobcreation?
• Dotheself-employedworklongerhoursthanemployees?
• How many small business entrepreneurs are women?
• What is the contribution of small businesses to Canada’s exports?
This new edition and previous publications are available on the Small Business Research and Statistics website: www.ic.gc.ca/sbresearch.

3Key Small Business Statistics — July 2011
Highlights
IndustryCanada’sdefinitionof“smallbusiness”isfirmsthathavefewerthan100employees.
Number of Businesses
• There are just over one million small businesses in Canada that have employees (excludes self-employedentrepreneurs).Ninety-eightpercentofbusinessesinCanadahavefewerthan 100 employees.
• Between 2002 and 2007, 104 000 new small businesses, on average, were created in Canada each year.
• Takingintoaccountfirmsthatexitthemarketplace,thenumberoffirmsincreasedby15 000 per year, on average, over the 2002–2007 period.
Contribution to Gross Domestic Product (GDP)
• Small businesses contribute slightly more than 30 percent to Canada’s GDP.
Employment
• Asof2010,smallbusinessesemployedapproximatelyfivemillionindividualsinCanada,or48 percent of the total labour force in the private sector.
• Small businesses created about 15 000 jobs in 2010. Over the 2001 to 2010 period, small firmsaccountedfor47percentofalljobscreated,onaverage,intheprivatesector.
• Approximately 16 percent of all employed workers in the Canadian economy in 2010 were self-employed.
Earnings
• On average, small business employees in Canada earned around $744 per week in 2010, less than the overall average of $830.
Sectoral Breakdowns
• SmallbusinessesaccountforovertwothirdsofemploymentinfiveCanadianindustrycategories:non-institutionalhealthcare,forestry,otherservices,construction,andaccommodation and food.
• Roughly21percentofsmallbusinessesoperateinCanadiangoods-producingindustries;the remaining 79 percent operate in service industries.

4
Survival
• Survivalratesforsmallandmedium-sizedbusinesses(withlessthan250employees)in Canada decline over time. About 85 percent of businesses that enter the marketplace surviveforonefullyear,70percentsurvivefortwoyearsand51percentsurviveforfiveyears.
• The number of business bankruptcies in Canada fell by 56 percent between 2000 and 2010 to about 5200 in 2010.
Growth
• High-growthfirmsaredefinedasthosewithaverageannualizedgrowthratesgreaterthan20percentperyear,overathree-yearperiod,andwith10ormoreemployeesatthebeginning of the period.
• While 4.7 percent of businesses achieved high growth in terms of employment, they created approximately 45 percent of net new jobs over the 2003–2006 period.
• High-growthfirmsarepresentineveryeconomicsectorandarenotjustconcentratedinknowledge-basedindustries.Thehighestconcentrationofhigh-growthfirmswasinprofessional,scientificandtechnicalservices;construction;andadministrativeandsupport,waste management and remediation services.
Women in Business
• In2007,itwasestimatedthat46percentofsmallandmedium-sizedenterprises(SMEs)hadsomedegreeoffemaleownership:16percentofSMEsweremajority-ownedbywomen, 19 percent were owned in equal partnerships between male and female owners, and11percentofSMEshadaminorityfemaleownership.
Exports
• About 86 percent of Canadian exporters were small businesses. In 2009, small businesses were responsible for $68 billion, or about 25 percent of Canada’s total value, of exports.
• Thelargestcontributionstoexportsbysmallbusinesseswereinretailtrade(79.1percent),agriculture,forestry,fishingandhunting(72.3percent)andothersectors(72.0percent).

5Key Small Business Statistics — July 2011
When is a business “small”?
Thesizeofabusinesscanbedefinedinmanyways,bythevalueofitsannualsalesorshipments,forexample,orbyitsannualgrossornetrevenue,thesizeofitsassetsorthenumber of its employees.
Manyinstitutionsdefinesmallbusinessesaccordingtotheirownneeds—theCanadianBankersAssociationclassifiesacompanyas“small”ifitqualifiesforaloanauthorizationoflessthan$250000,whereastheExportDevelopmentCorporationdefinessmallor“emerging”exportersasfirmswithexportsalesunder$1million.Insomeinstances,IndustryCanadahasusedadefinitionbasedonthenumberofemployees,whichvariesaccordingtothesector—goods-producingfirmsareconsidered“small”iftheyhavefewerthan100employees,whereasforservice-producingfirmsthecut-offpointis50employees.Abovethatsize,andupto499employees,afirmisconsideredmedium-sized.Thesmallestofsmallbusinessesarecalledmicro-enterprises,mostoftendefinedashavingfewerthanfiveemployees.Theterm“SME” (forsmallandmedium-sizedenterprise)referstoallbusinesseswithfewerthan500employees,whereasfirmswith500ormoreemployeesareclassifiedas“large”businesses.
Aswillbeseen,inpractice,reportingonsmallbusinessesseldomadherestoanystrictdefinitiondue to data limitations.

6
How many businesses are there in Canada?
Statistics Canada’s Business Register maintains a count of business locations1 and publishes resultstwiceayear.Businesslocationscanbelongtothesamecompany;eachcompanyownsat least one business location. For an individual business location to be included in the Business Register, the company to which it belongs must meet at least one of the following minimum criteria: it must have at least one paid employee (with payroll deductions remitted to the CanadaRevenueAgency(CRA)),itmusthaveannualsalesrevenuesof$30000,oritmustbeincorporatedandhavefiledafederalcorporateincometaxreturnatleastonceinthepreviousthree years.
As of December 2010, there were about 2.4 million business locations2 in Canada, as shown in Table 1. About half of all business locations are called “employer businesses” because they maintainapayrollofatleastoneperson(possiblytheowner).Theotherhalfareclassifiedas “indeterminate” because they do not have any employees registered with the CRA. Such businesses may indeed have no workforce (they may simply be paper entities that nonetheless meetoneofthecriteriaforrecognitionasabusinesslocation)ortheymayhavecontractworkers, family members and/or only the owners working for them. The “indeterminate” category was created because information about their workforce is not available.
1. In previous editions of Key Small Business Statistics, the term “establishments” has been used. In 2009, Statistics Canada’s Business Register introduced the use of location counts. Therefore, the term “establishments” has been replaced by the term “locations.” Abusinesslocationisanoperatingentity,specificallyaproductionentity,that: a)conductseconomicactivityatorfromasinglephysicallocationorgroupoflocations; b)resideswithinthesmalleststandardizedgeographicalarea;and c)isabletoprovideemploymentdataataminimum.
2. Thisnumberincludesbothcommercialandnon-commercialbusinesslocations.

7Key Small Business Statistics — July 2011
Table 1: Total Number of Business Locations, and Number of Locations Relative to Provincial/Territorial Population and Gross Domestic Product, December 2010
Source:StatisticsCanada,BusinessRegister,December2010;NationalIncomeandExpenditureAccounts2009;EstimatesofPopulation by Age and Gender for Canada, the Provinces and the Territories, January 2011.
Note1:The“indeterminate”categoryconsistsofincorporatedorunincorporatedbusinessesthatdonothaveaCanadaRevenueAgency payroll deductions account. The workforce of such businesses may consist of contract workers, family members and/or owners.
Approximately 58 percent of all business locations in Canada are located in Ontario and Quebec.Virtuallyalltherestaredividedbetweenthewesternprovinces(37percent)andtheAtlanticprovinces(6percent).TheNorthwestTerritories,YukonandNunavutrepresentonly0.3 percent of Canada’s businesses.
Relativetopopulation,thewesternprovinces,YukonandPrinceEdwardIslandhavemorebusinesslocations than elsewhere, with the highest ratios in Alberta and Saskatchewan at 91.9 and 91.8per1000populationrespectively.Nunavut,NewfoundlandandLabrador,NewBrunswickandNovaScotiahavethelowestratiosofbusinesslocationsper1000population.OntarioandQuebec are below the national average of 70.8, with 67.8 and 62.5 business locations per 1000 population respectively.
Intermsofgrossdomesticproduct(GDP)perbusinesslocationbyprovince,Nunavutshowsthe highest ratio at $1 793 000 per location. (This is likely due, in part, to the low number of businesslocationsper1000residents;therefore,itsGDPisspreadoverfewerbusinesslocations.)
Provinces/Territories
No. of Business Locations No. of Business Locations per 1000
Population
GDP per Business Location
($ thousands)Total Indeterminate1 Employer Businesses
Small(<100)
Medium(100–499)
Large(500+)
Newfoundlandand Labrador 26 351 8 494 17 857 17 559 255 43 51.8 948
PrinceEdwardIsland 10 505 4 347 6 158 6 059 86 13 73.2 452
NovaScotia 55 078 23 490 31 588 30 957 554 77 58.4 622
NewBrunswick 42 907 16 190 26 717 26 227 432 58 57.0 641
Quebec 496 463 249 028 247 435 242 710 4 128 597 62.5 612
Ontario 901 190 504 232 396 958 387 986 7 878 1 094 67.8 642
Manitoba 78 400 41 288 37 112 36 275 723 114 63.0 650
Saskatchewan 96 548 56 778 39 770 39 156 547 67 91.8 586
Alberta 344 135 188 815 155 320 152 499 2 481 340 91.9 718
British Columbia 370 262 194 349 175 913 173 170 2 445 298 81.3 516
YukonTerritory 2 985 1 294 1 691 1 656 33 2 87.0 679
NorthwestTerritories 2 606 981 1 625 1 577 45 3 59.8 1 583
Nunavut 840 223 617 592 23 2 25.2 1 793
Canada Total 2 428 270 1 289 509 1 138 761 1 116 423 19 630 2 708 70.8 629

8
Morebroadly,thereisanoticeablenegativerelationshipbetweenthenumberofbusinesslocations per 1000 inhabitants and contribution to GDP per business location in that a higher number of business locations per 1000 population corresponds to a lower GDP per business location. Alberta is an exception to this rule, with a relatively high GDP per business location as well as a high number of business locations per 1000 residents.
Ofthe1138761employerbusinesses,2708(about0.2percent)have500employeesormore,1116423employerbusinesses(98percent)havefewerthan100employees,75percenthavefewerthan10employeesand55percenthaveonly1to4employees(seeTable2).
Table 2: Number of Business Locations by Sector and Firm Size (Number of Employees), December 2010
Source: Statistics Canada, Business Register, December 2010.Note1:The“indeterminate”categoryconsistsofincorporatedorunincorporatedbusinessesthatdonothaveaCanadaRevenue
Agency payroll deductions account. The workforce of such businesses may consist of contract workers, family members and/or owners.
Note2:ByconventionalStatisticsCanadadefinition,thegoods-producingsectorconsistsofNorthAmericanIndustryClassificationSystem(NAICS)codes11to31–33,whileNAICScodes41to91definetheservice-producingsector.
Number of Employees
Cumulative Percent ofEmployer Businesses
No. of Business Locations
Total
Goods-ProducingSector2
Service-ProducingSector2
Indeterminate1 1 289 509 311 675 977 834
Employer Business Total 100.0 1 138 761 242 682 896 079
1–4 54.6 621 968 137 303 484 665
5–9 75.0 232 189 47 416 184 773
10–19 87.4 140 554 27 322 113 232
20–49 95.5 92 292 18 451 73 841
50–99 98.0 29 420 6 680 22 740
100–199 99.2 13 147 3 335 9 812
200–499 99.8 6 483 1 664 4 819
500+ 100.0 2 708 511 2 197
Grand Total 2 428 270 554 357 1 873 913

9Key Small Business Statistics — July 2011
Aboutonequarterofallbusinesslocations(indeterminateandemployerbusinessesalike)producegoods,whereastheremainderprovideservices.Smallfirms(thosewithfewerthan100employees)makeup98percentofgoods-producingemployerbusinessesand98percentofallservice-producingemployerbusinesses(Table2andFigure1).Usinganalternativedefinitionofsmallbusinessesintheservice-producingsectorthatdefinessmallbusinessesasthosewithfewerthan50employees,smallfirmsaccountfor96percentofallservice-producingemployerfirms.
Figure 1: Distribution of Business Locations in the Goods-Producing and Service-Producing Sectors by Firm Size (Number of Employees), December 2010
Source: Statistics Canada, Business Register, December 2010.Note1:ByconventionalStatisticsCanadadefinition,thegoods-producingsectorconsistsofNorthAmericanIndustryClassification
System(NAICS)codes11to31–33,whileNAICScodes41to91definetheservice-producingsector.Note2:The“indeterminate”categoryconsistsofincorporatedorunincorporatedbusinessesthatdonothaveaCanadaRevenue
Agency payroll deductions account. The workforce of such businesses may consist of contract workers, family members and/or owners.
Indeterminate2
(52.2%)
500+ (0.2%)200–499 (0.7%)100–199 (1.4%)50–99 (2.8%)20–49 (7.6%)10–19 (11.3%)5–9 (19.5%)1–4 (56.6%)
500+ (0.2%)200–499 (0.5%)100–199 (1.1%)50–99 (2.5%)20–49 (8.2%)10–19 (12.6%)5–9 (20.6%)1–4 (54.1%)
Indeterminate2
(56.2%)
EmployerBusinesses(43.8%)
EmployerBusinesses(47.8%)
Goods-Producing Sector1Service-Producing Sector1

10
Table3showsthedistributionofemployerbusinessesbysizeofbusinesslocationineachprovinceandterritory.Generallyspeaking,thedistributionbysizeintheprovincesissimilartothenationalaveragedistributionbysize.However,thereissomevariationamongtheprovincesandterritories;forexample,thereisahigherpercentageofmicro-enterprises(1to4employees)inAlberta(59percent)andBritishColumbia(57percent)thaninOntario(55percent),Quebec(51percent)ortheterritories(from24percentto50percent).
Table 3: Employer Businesses by Firm Size (Number of Employees) in the Provinces and Territories, December 2010
Source: Statistics Canada, Business Register, December 2010.
Table4presentsthedistributionofemployerbusinessesbysizeofbusinesslocationineachindustry.Thegreatestvariationacrossindustriesisfoundamongmicro-enterprises.Thehighestpercentageofmicro-industriesisinprofessional,scientificandtechnicalservices(74.8percent)andinagriculture,forestry,fishingandhunting(71.4percent).Thelowestpercentagesofmicro-enterprisesarefoundinpublicadministration(22.1percent),accommodationandfoodservices(27.9percent),andutilities(34.1percent).
Provinces/Territories
Employer Businesses
TotalPercent of Total
1–4 5–9 10–19 20–49 50–99 Small (<100 ) 100–199 200–499 Medium
(100–499 )Large (500+)
Newfoundlandand Labrador 17 857 54.3 22.7 12.1 7.3 1.9 98.3 0.9 0.5 1.4 0.2
PrinceEdwardIsland 6 158 50.2 24.0 13.5 8.2 2.5 98.4 1.0 0.4 1.4 0.2
NovaScotia 31 588 54.3 21.2 12.0 8.1 2.4 98.0 1.2 0.5 1.8 0.2
NewBrunswick 26 717 54.1 21.2 12.6 7.9 2.4 98.2 1.1 0.5 1.6 0.2
Quebec 247 435 50.8 22.5 13.2 8.9 2.8 98.1 1.1 0.5 1.7 0.2
Ontario 396 958 55.3 19.5 12.0 8.2 2.7 97.7 1.3 0.7 2.0 0.3
Manitoba 37 112 49.9 21.7 13.8 9.3 3.0 97.7 1.3 0.7 1.9 0.3
Saskatchewan 39 770 54.8 21.0 12.7 7.8 2.2 98.5 0.9 0.5 1.4 0.2
Alberta 155 320 58.8 18.2 11.5 7.3 2.4 98.2 1.1 0.5 1.6 0.2
British Columbia 175 913 56.5 20.2 12.1 7.5 2.3 98.4 1.0 0.4 1.4 0.2
YukonTerritory 1 691 50.1 23.8 13.3 8.5 2.1 97.9 1.2 0.7 2.0 0.1
NorthwestTerritories 1 625 34.0 23.7 20.2 14.5 4.6 97.0 1.9 0.9 2.8 0.2
Nunavut 617 24.0 22.5 21.9 19.1 8.4 95.9 3.2 0.5 3.7 0.3
Canada Total 1 138 761 54.6 20.4 12.3 8.1 2.6 98.0 1.2 0.6 1.7 0.2

11Key Small Business Statistics — July 2011
Table 4: Employer Businesses by Firm Size (Number of Employees) in Industries, December 2010
Source: Statistics Canada, Business Register, December 2010.
Industry(Ranked by number of employer businesses)
Employer Businesses
TotalPercent of Total
1–4 5–9 10–19 20–49 50–99 Small (<100) 100–199 200–499 Medium
(100–499)Large (500+)
Retail Trade 145 790 37.0 31.6 17.5 8.9 3.1 98.0 1.4 0.5 2.0 0.0
Other Services (except PublicAdministration) 130 970 69.8 18.3 7.6 3.2 0.7 99.6 0.3 0.1 0.4 0.0
Construction 126 677 60.3 21.0 10.4 5.8 1.6 99.1 0.6 0.2 0.8 0.1
Professional,ScientificandTechnical Services 125 378 74.8 12.3 6.9 4.0 1.2 99.1 0.6 0.2 0.8 0.1
Health Care and Social Assistance 96 570 54.3 21.3 12.8 6.8 2.4 97.5 1.4 0.8 2.1 0.4
Accommodation and Food Services 75 501 27.9 23.9 22.5 18.4 5.7 98.4 1.2 0.3 1.5 0.1
Wholesale Trade 64 132 44.9 24.1 16.1 10.4 3.0 98.4 1.1 0.4 1.5 0.1
Manufacturing 54 163 34.8 20.6 16.5 14.8 6.7 93.3 3.9 2.1 6.1 0.6
ManagementandRemediation Services 52 579 53.1 21.9 11.8 7.4 2.9 97.2 1.5 0.9 2.4 0.4
Transportation and Warehousing 51 703 65.6 14.2 9.2 6.7 2.4 98.1 1.0 0.7 1.7 0.2
Agriculture, Forestry, Fishing and Hunting 50 376 71.4 15.8 7.5 3.8 1.1 99.5 0.4 0.1 0.5 0.0
RealEstateandRentalandLeasing 44 227 67.1 17.1 9.2 4.5 1.2 99.3 0.5 0.2 0.7 0.1
Finance and Insurance 42 396 49.0 15.6 13.3 17.8 2.3 97.9 1.0 0.7 1.6 0.4
Arts,EntertainmentandRecreation 17 362 45.7 21.4 14.1 11.5 4.1 96.8 2.1 0.8 2.9 0.3
ManagementofCompaniesandEnterprises 14 400 58.9 14.7 9.3 8.5 3.8 95.2 2.1 1.5 3.7 1.1
Information and Cultural Industries 14 265 51.9 16.9 13.1 10.5 3.7 96.1 2.1 1.1 3.2 0.6
EducationalServices 12 575 42.9 19.4 14.9 11.4 4.1 92.8 1.9 1.8 3.7 3.5
Mining,Quarrying,andOilandGasExtraction 10 067 56.3 14.5 11.9 9.8 3.9 96.4 1.9 1.2 3.1 0.5
Public Administration 8 231 22.1 17.9 16.5 18.2 9.5 84.2 7.3 4.8 12.1 3.8
Utilities 1 399 34.1 18.9 15.6 13.1 7.5 89.2 4.7 3.3 8.0 2.8
Total 1 138 761 54.6 20.4 12.3 8.1 2.6 98.0 1.2 0.6 1.7 0.2

12
How many businesses appear and disappear each year?
Thousands of businesses enter and exit the marketplace throughout the year. Keeping track ofthesebirthsanddeathsisnoeasymatter.StatisticsCanadamadeavailabledataonSMEsinCanadathroughtheSmallandMedium-SizedEnterprisesDataWarehouse(SMEsDataWarehouse).
Figure2showsthenumberofsmallbusinesses(thosewithfewerthan100employees)thatentered and exited the marketplace annually between 2002 and 2007. Over this period, 104 000 new small businesses, on average, were created in Canada each year. There was no clear pattern of business entries over the period. In 2002, there were approximately 90 000 entries, gradually increasingtoapeakofover115000in2005.Thisfigurefellto97000in2006beforerecoveringto 110 000 in 2007. The number of exits remained at approximately 86 000 from 2002 to 2004. In the following two years, the number of exits totalled 190 000 and declined to 86 000 in 2007. On a net basis, the average number of entries over the 2002–2007 period was 15 000. Only in 2006weretheremoreexitsthanentries,althoughnotbyasignificantamount.

13Key Small Business Statistics — July 2011
Figure 2: Entries and Exits of Small Businesses with up to 100 Employees, 2002 to 2007
Source:StatisticsCanada,SmallandMedium-SizedEnterprisesDataWarehouse,2010.
Average2002-2007
Entries and Exits
2002 2003 2004
Entries Exits
Net Entries
20062005
2002 2004 20052003 2006
2007
Average2002-2007
-5 000
0
5 000
10 000
15 000
20 000
25 000
30 000
0
20 000
40 000
60 000
80 000
100 000
120 000
140 000
2007

14
Bankruptcy statistics
Onlyasmallproportionoffirmsthatexitthemarketplaceendupfilingforbankruptcy.Onaverage over the last 20 years, there have been approximately 11 000 business bankruptcies per year in Canada. In the 1990s, they gradually increased from about 12 000 to a peak of more than 14 000 in 1997. Since then, business bankruptcies have been on the decline, to about 5200 in 2010.
Moredetailedstatisticsonbusinessbankruptciesandtheliabilitiesinvolvedareregularlyreported in Industry Canada’s Small Business Quarterly (www.ic.gc.ca/SMEquarterly)and arealsoavailableonthewebsiteoftheOfficeoftheSuperintendentofBankruptcyat www.osb.ic.gc.ca.
How long do small businesses survive?
One way to answer the question of how long small businesses are likely to survive is to determine the probability of survival based on predictable factors. Geographic location, type of industry, sizeandagearesomeusefulfactorsinpredictinghowlongabusinessstaysactive.Other,unforeseen, factors can also affect the survival of a business, including general economic conditions, aswellasmarketinfluencessuchasthenumberandsizeofcompetitorsandnewentrants.
Survivalisdefinedasthepercentageofnewfirmsthatcontinuetooperatewhentheyreachagivenage.Thesurvivalofbusinessesreflectstheirproductivity,innovationandresourcefulness,as well as their adaptability to changing market conditions.
Figure3showssurvivalratesforCanadiansmallandmedium-sizedbusinesseswithlessthan 250employees.Theratesrepresentthepercentageoffirmsthatsurviveduntil2006andwere createdonetofiveyearspriortothat.About85percentofbusinessesthatenteredthemarketplacein2005survivedforonefullyear.Survivalratesdeclinedovertime.About70percentoffirmssurvivedfortwoyears,62percentsurvivedforthreeyearsand51percentoffirmssurvivedforfiveyears.Thefactthathalfofthebusinessessurvivetheirfirstfiveyearsofoperationsuggeststhat these businesses are able to attain competitive advantage in their markets.

15Key Small Business Statistics — July 2011
Figure 3: Survival Rates of Canadian Employer Businesses (with less than 250 employees), 2001–2006
Source:StatisticsCanada,SmallandMedium-SizedEnterprisesDataWarehouse,2008.
What share of firms are high-growth firms?
TheCanadianeconomyisdynamic,involvingagreatdealofchurning,i.e.,entryandexitoffirms.Withinthisever-changingenvironment,start-upsandnewfirmsareveryimportantforcreatingjobsandwealth.Thosefirmsthatachievehighgrowthinashortperiodoftimetendtomakevery large contributions in terms of employment and wealth creation. This is one of the reasons fortherisinginterestingrowthfirmsoverthepastyearsamongpolicy-makersandacademics.
AccordingtothedefinitionoftheOrganisationforEconomicCo-operationandDevelopment(OECD),high-growthfirmsarethosewithaverageannualizedgrowthratesgreaterthan20percentperyear,overathree-yearperiod,andwith10ormoreemployeesatthebeginningoftheperiod.Theirgrowthcanberecordedintermsofrevenueoremployment(numberofemployees).
Figure4illustratesthedistributionofallfirmsbasedonaverageannualemploymentgrowthbetween2003and2006.While4.7percentofbusinessesarehigh-growthfirms(definedintermsofemployment),theycreatedapproximately45percentofnetnewjobs.Theyaremoreprevalentintermsofrevenuethanintermsofemployment,with12percentoffirmsachievinghighgrowthinrevenues.High-growthfirmsarepresentineveryeconomicsectorandarenotjustconcentratedinknowledge-basedindustries.AsshowninFigure5,thehighestconcentrationofhigh-growthfirmsforthe2003–2006periodwasinprofessional,scientificandtechnicalservices;construction;andadministrativeandsupport,wastemanagementandremediation services.
1 Year 3 Years 4 Years2 Years 5 Years
Per
cent
age
0102030405060708090

16
Figure 4: Distribution of all Firms Based on Average Annual Employment Growth, 2003–2006
Source:StatisticsCanada,SmallandMedium-SizedEnterprisesDataWarehouse,2009;IndustryCanadacalculations.
Figure 5: Distribution of High-Growth Firms (Employment Growth) by Industry, 2003–2006
Source:StatisticsCanada,SmallandMedium-SizedEnterprisesDataWarehouse,2009;IndustryCanadacalculations.
High-growthfirmsaremorelikelythanotherfirmstoberesearchanddevelopment(R&D)intensive.3Overtheperiod2001–2004,8percentofhigh-growthfirmswereR&Dintensivecomparedwith4.3percentoftraditionalfirms.Furthermore,employmentfortheaveragehigh-growthfirmgrew87.8percentcomparedwith0.1percentgrowthfortheaveragenon-high-growthfirmoverthesameperiod.4
3. R&Dintensivefirmsaredefinedasbusinessesthatspendmorethan20percentoftheirinvestmentbudgetonresearch and development.
4. Statistics Canada, Survey on Financing of Small and Medium Enterprises,2004;IndustryCanadacalculations.
<-20%
-15% to
-10%
-10% to
-5%
-20% to
-15%
-5% to
-1%
Per
cent
age
of F
irms
0.0
4.0
8.0
12.0
16.0
20.0
-1% to
1%
5% to
10%
10% to
15%
1% to
5%
15% to
20%
>20%
0 1 2 3 4 5 6 7 8
All Industries
Accommodation and Food Services
Retail Trade
Agriculture, Forestry, Fishing and HuntingWholesale Trade
Real Estate and Rental and Leasing
Management of Companies and EnterprisesManufacturing
Finance and Insurance
Information and Cultural IndustriesTransportation and Warehousing
Administrative and Support, Waste Managementand Remediation Services
ConstructionProfessional, Scientific and Technical Services
Percentage

17Key Small Business Statistics — July 2011
Figure6showstheshareofhigh-growthfirmsinCanadaandtenothercountries.Canadaranksfifth,behindthefirst-rankedUnitedKingdom(6.4percent)andthird-rankedUnitedStates.However,Canadarankshigherthansixothercountrieswhoseshareofhigh-growthfirmsranges from 3.2 to 4.4 percent.
Figure 6: Share of High-Growth Firms (Employment Growth), International Comparisons, 2002–2005
Source: Biosca, A.B., Growth Dynamics, Exploring Business Growth and Contraction in Europe and the U.S.NationalEndowmentforScience,TechnologyandtheArts(NESTA),2010.
Formoreinformationonhigh-growthfirms,pleaserefertoKey Small Business Statistics, Special Edition: Growth Map of Canadian Firms(January2010).
0 1 2 3 4 5 6 7
Norway
Austria
Netherlands
Denmark
Italy
Finland
Canada
Spain
United States
New Zealand
United Kingdom
Percentage of High-Growth Firms

18
How many people work for small businesses?
To best answer this question, it is necessary to look at business establishments as part of the largerenterprisetowhichtheybelong,whereapplicable.StatisticsCanadadefinesabusinessenterprise as “a family of businesses under common ownership and control for which a set ofconsolidatedfinancialstatementsisproducedonanannualbasis.”StatisticsCanada’sSurvey of Employment, Payrolls and Hours(SEPH)coversemployerbusinessesinCanadaandreportsthenumberofemployeesattheenterpriselevel.Self-employedpersonswhoarenotonapayrollarenotincludedinthesefigures,norareemployeesinthefollowingindustries:agriculture,fishingandtrapping,privatehouseholdservices,religiousorganizationsandmilitarypersonnelofdefenceservices.Firmsaregroupedintosevensizecategories:thosewithfewerthan 5 employees, from 5 to 19, from 20 to 49, from 50 to 99, from 100 to 299, from 300 to 499, and 500 and more employees.
AccordingtoSEPHdata,onaveragein2010,justover5.1millionemployeesonpayroll,or48 percent of the total private sector labour force,5 worked for small enterprises (those with fewerthan100employees)asshowninTable5.Morethan1.6million,or16percent,workedformedium-sizedenterprises(thosewith100to499employees).Intotal,therefore,SMEsemployedalmost6.8million,or64percent,ofprivatesectoremployeescoveredbySEPH.
Thedistributionofemploymentbysizeoffirmvariesconsiderablyacrossindustries.Asshownin Table5andFigure7,smallbusinessesaccountforovertwothirdsofemploymentinfiveindustries:the(non-institutional)healthcaresector(89percent),forestry(77percent),otherservices (75percent),theconstructionindustry(74percent),andaccommodationandfood(66percent).Inthreeotherindustries,atleasthalfoftheworkforceisemployedbysmallbusinesses.Lastly,in terms of the total number of employees, industries that had the largest number of employees workingforsmallfirmswere,inorderofmagnitude,retailtrade(0.80million),accommodationandfood(0.71million),construction(0.61million),manufacturing(0.53million),professionalservices(0.45million)andwholesaletrade(0.38million).Theseindustriesaloneaccounted for68percentofalljobsinsmallfirmsinCanada.
5. A technical note on the methodology used to determine the private sector has been revised in 2011 and can be obtained by contacting Customer Services at [email protected](seeNote1,Table5),data shown in Table 5 and Figure 7 exclude employment in public administration, public utilities (water, sewage and other systems),postalservices,publictransit,educationalservices,andinstitutionalandothergovernment-fundedhealthcareservices,butincludeemploymentintheCBC,privatepractices(physicians,dentistsandotherhealthpractitioners),andbeerand liquor stores.

19Key Small Business Statistics — July 2011
Table 5: Number of Private Sector Employees by Industry and Size of Business Enterprise, 20101, 2, 3
Source: Statistics Canada, Survey of Employment, Payrolls and Hours (SEPH),April2011,andcalculationsbyIndustryCanada.IndustrydataareclassifiedinaccordancewiththeNorthAmericanIndustryClassificationSystem(NAICS).
*Industriesinthegoods-producingsectoraccountfor24.6percentoftotalemploymentintheprivatesectorand23.7percentofemployment in small businesses.
Note1:SEPHdataexcludeself-employedworkerswhoarenotonapayroll,andemployeesinthefollowingindustries:agriculture,fishingandtrapping,privatehouseholdservices,religiousorganizationsandmilitarypersonnelofdefenceservices.Thedatabreakingdownemploymentbysizeoffirmalsoexcludeunclassifiedindustries.
Note2:BesidesdataexcludedfromtheSEPH,datashowninthistablealsoexcludeemploymentinpublicadministration,publicutilities(water,sewageandothersystems),postalservices,publictransit,educationalservices,andinstitutionalandothergovernment-fundedhealthcareservices,butincludeemploymentintheCBC,privatepractices(physicians,dentistsandotherhealthpractitioners),andbeerandliquorstores.IndustryCanada’s Small Business Quarterly regularly publishes data similar to those in Table 5, but without excluding public sector employment. A technical note on the separation of public and private sector employment is available upon request by contacting Customer Services at [email protected].
Note3:ByconventionalStatisticsCanadadefinition,thegoods-producingsectorconsistsofNorthAmericanIndustryClassificationSystem(NAICS)codes11to31–33,whileNAICScodes41to91definetheservice-producingsector.
Industry (Ranked by number of employees in smallbusinesses)
Size of Business Enterprise (No. of Employees)
0–4 5–19 20–49 50–99Small (<100) 100–299 300–499
Medium (100–499)
Large (500+) Total
Retail Trade 106 388 282 739 220 918 188 823 798 868 162 939 36 116 199 055 854 754 1 852 677
Accommodation and Food 47 568 240 546 249 278 168 222 705 614 136 461 40 660 177 121 179 736 1 062 471
*Construction 141 250 235 968 145 200 85 328 607 746 87 048 23 168 110 215 104 135 822 096
*Manufacturing 41 920 151 510 179 962 159 581 532 972 256 329 113 574 369 903 562 273 1 465 147
Professional Services 140 058 153 421 96 558 61 289 451 326 82 172 35 109 117 281 188 362 756 969
Wholesale Trade 51 182 138 044 113 711 81 809 384 745 107 530 38 145 145 674 198 735 729 155
Other Services 101 057 165 534 72 033 41 301 379 925 54 072 14 978 69 049 57 949 506 923
Administration, WasteManagement 51 665 99 226 75 058 60 963 286 912 94 813 46 276 141 089 303 466 731 467
Health2 79 424 101 520 19 721 3 927 204 592 2 873 1 276 4 149 22 557 231 297
Transportation and Warehousing2 45 082 60 499 46 505 33 580 185 665 47 044 20 395 67 440 288 621 541 726
RealEstateandRental 42 979 55 179 33 090 21 556 152 804 26 051 10 674 36 725 53 043 242 571
Finance and Insurance 29 172 41 390 35 046 31 838 137 445 51 110 24 349 75 459 469 192 682 095
Arts,EntertainmentandRecreation 15 162 36 742 35 576 26 971 114 451 32 357 9 799 42 156 88 404 245 010
Information and Cultural 10 896 21 980 19 524 17 520 69 920 30 266 11 625 41 891 213 196 325 006
ManagementofCompanies and Enterprises 11 499 14 632 12 184 7 992 46 307 10 172 7 028 17 201 43 081 106 589
*Mining 9 134 14 019 12 054 10 297 45 503 20 013 11 967 31 980 108 977 186 460
*Forestry 7 359 11 614 7 535 3 817 30 325 3 583 525 4 108 5 129 39 561
*Utilities2 110 641 641 638 2 030 2 190 1 755 3 945 100 905 106 880Percent in Service-Producing Sector 78.6 77.3 74.9 74.2 76.3 69.4 66.3 68.6 77.1 75.4Percent in Goods-Producing Sector 21.4 22.7 25.1 25.8 23.7 30.6 33.7 31.4 22.9 24.6
Industry Aggregate Total 931 903 1 825 202 1 374 592 1 005 450 5 137 147 1 207 022 447 416 1 654 438 3 842 514 10 634 097
Percentage of Total Employment 8.8 17.2 12.9 9.5 48.3 11.4 4.2 15.6 36.1 100.0

20
Figure 7: Number of Private Sector Employees by Industry and Size of Business Enterprise, 20101, 2
Source: Statistics Canada, Survey of Employment, Payrolls and Hours(SEPH),April2011,andcalculationsbyIndustryCanada.IndustrydataareclassifiedinaccordancewiththeNorthAmericanIndustryClassificationSystem(NAICS).
Note1:SEPHdataexcludeself-employedworkerswhoarenotonapayroll,andemployeesinthefollowingindustries:agriculture,fishingandtrapping,privatehouseholdservices,religiousorganizationsandmilitarypersonnelofdefenceservices.Thedatabreakingdownemploymentbysizeoffirmalsoexcludeunclassifiedindustries.
Note2:BesidesdataexcludedfromtheSEPH,datashowninthisfigurealsoexcludeemploymentinpublicadministration,publicutilities(water,sewageandothersystems),postalservices,publictransit,educationalservices,andinstitutionalandothergovernment-fundedhealthcareservices,butincludeemploymentintheCBC,privatepractices(physicians,dentistsandotherhealthpractitioners),andbeerandliquorstores.IndustryCanada’sSmall Business Quarterly regularly publishes data similar to those in Figure 7, but without excluding public sector employment. A technical note on the separation of public and private sector employment is available upon request by contacting Customer Services at [email protected].
0
100
200
300
400
500
600
700
800
900
50–9920–495–190–4
Oth
er S
ervi
ces
Acc
omm
odat
ion
and
Food
Arts
, Ent
erta
inm
ent a
nd R
ecre
atio
n
Hea
lth2
Adm
inis
tratio
n, W
aste
Man
agem
ent
Min
ing
Pro
fess
iona
l Ser
vice
s
Rea
l Est
ate
and
Ren
tal
Fina
nce
and
Insu
ranc
e
Info
rmat
ion
and
Cul
tura
l
Tran
spor
tatio
n an
d W
areh
ousi
ng2
Ret
ail T
rade
Who
lesa
le T
rade
Man
ufac
turin
g
Con
stru
ctio
n
Util
ities
2
Fore
stry
Man
agem
ent o
f Com
pani
esan
d E
nter
pris
es
Number of Employees (thousands)

21Key Small Business Statistics — July 2011
How many jobs do small businesses create?
The data that make it possible to answer this question are derived from Statistics Canada’s Survey of Employment, Payrolls and Hours(SEPH),andareregularlypublishedinIndustryCanada’s Small Business Quarterly.SEPHdataexcludeself-employedworkerswhoarenotona payroll. Other limitations also apply (see How many people work for small businesses?).
Table 6 displays relative contributions to the net change in private sector paid employment bysmall,medium-sizedandlargebusinessesfrom2001to2010.Overtheyears,therelativecontributionintermsofsizevariedgreatly.Duringtheperiodunderreview,eachofthebusiness-sizecategoriesplayedtheleadingroleatdifferenttimesinnetjobcreationinCanada.Forthreeyears, from 2001 to 2002 and in 2010, small businesses made the greatest contribution to net jobcreation.Ontheotherhand,largebusinessesplayedtheleadingjob-creationrolefrom2003to2008.Overthe2001to2010period,smallfirmsaccountedfor47percentofalljobscreated,on average, in the private sector.

22
Table 6: Net Change in Private Sector Paid Employment by Size of Business Enterprise (Annual Averages), 2001–2010 1, 2
Source: Statistics Canada, Survey of Employment, Payrolls and Hours(SEPH),April2011,andcalculationsbyIndustryCanada.Historicaldataarefrequentlyrevisedand,asof2000,areavailableonaNorthAmericanIndustryClassificationSystem(NAICS)basis.UpdatesforthetotaleconomycoveredbySEPHareregularlypublishedinIndustryCanada’sSmall Business Quarterly.
Note1:SEPHdataexcludeself-employedworkerswhoarenotonapayroll,andemployeesinthefollowingindustries:agriculture,fishingandtrapping,privatehouseholdservices,religiousorganizationsandmilitarypersonnelofdefenceservices.Datainthistablealsoexcludeemploymentinpublicadministration,publicutilities(water,sewageandothersystems),postalservices,publictransit,educationalservices,andinstitutionalandothergovernment-fundedhealthcareservices,butincludeemploymentintheCBC,privatepractices(physicians,dentistsandotherhealthpractitioners),andbeerandliquorstores.
Note2:DifferencesbetweenthesedataandthosepublishedinpreviousversionsofKey Small Business Statistics are largely due torevisionstothehistoricalSEPHdata.Asmallproportionofthedifferencesistheresultofrefinementsinthemethodology used to separate the private and public sectors. A technical note on the separation of public and private sector employment is available upon request by contacting Customer Services at [email protected].
YearSize of Business — Number of Employees
0–4 5–19 20–49 50–99 Small (<100)
Medium (100–499)
SMEs(<500)
Large (500+)
2001 43 434 30 579 26 994 32 449 133 457 -7 979 125 478 62 808
2002 -7274 30 622 46 924 64 780 135 052 3 181 138 233 52 214
2003 12 814 259 24 905 23 976 61 953 28 725 90 678 125 383
2004 -12430 27 944 4 093 7 159 26 766 11 118 37 884 66 989
2005 18 270 -6774 10 330 17 541 39 367 36 068 75 435 81 977
2006 21 159 22 386 36 523 28 838 108 907 59 425 168 331 121 571
2007 -1698 38 747 35 846 22 780 95 675 46 801 142 476 106 866
2008 10 080 21 375 21 852 20 849 74 156 13 952 88 107 76 139
2009 -15970 -43447 -38631 -53654 -151 703 -105 045 -256 748 -151963
2010 -1978 6 599 3 115 6 980 14 715 619 15 334 -14197
Total Job Creation (2001–2010) 66 406 128 290 171 951 171 697 538 344 86 864 625 208 527 787
Percentage of Job Creation 5.8 11.1 14.9 14.9 46.7 7.5 54.2 45.8

23Key Small Business Statistics — July 2011
Table7showsyear-over-yearquarterlychangesinpaidemploymentfromthethirdquarterof2007tothefourthquarterof2010bybusinesssize.Jobswerecreatedintheprivatesectorfromthe third quarter of 2007 to the fourth quarter of 2008 and were lost in every quarter of 2009 andinthefirsttwoquartersof2010.Inthesecondhalfof2007,therateofjobcreationaveragedabout275000jobsperquarter.Thenumberofjobscreatedstarteddecliningsignificantlyin2008and became negative in 2009. In 2009, the number of jobs lost increased rapidly from 235 000 jobs lostinthefirstquarterto527000jobslostinthethirdquarter.ThedecreaseinGDPgrowthwasafactorincausingjoblossesthroughout2009amongbusinessesofallsizes.Therateofjobcreation started to recover in the fourth quarter of 2009 and reached positive levels in the third quarter of 2010.
Smallbusinesseslostjobsineachyear-over-yearperiodbetweenthefirstquarterof2009andthefirstquarterof2010.Smallbusinessesregainedjobsinthesecondquarterof2010whilemedium-sizedandlargebusinessesregainedjobsinthethirdquarterof2010.
Jobcreationamongmicro-businesseswasthemostvolatileofthesevenfirm-sizecategories.Micro-businessesshedjobsfromthefourthquarterof2008tothesecondquarterof2009,inthefourthquarterof2009andinthethirdquarterin2010.Thisistheonlyfirm-sizecategoryin2009thatwasasourceofjobcreation,whenmicro-businessescreatedabout16000jobsinthethirdquarter of 2009.

24
Table 7: Year-Over-Year Net Private Sector Paid Employment Change and Percent Contribution by Size of Business Enterprise, Quarterly, 2007 Q3 to 2010 Q41, 2, 3
Source: Statistics Canada, Survey of Employment, Payrolls and Hours(SEPH),April2011,andcalculationsbyIndustryCanada.Note1:SEPHdataexcludeself-employedworkerswhoarenotonapayroll,andemployeesinthefollowingindustries:agriculture,
fishingandtrapping,privatehouseholdservices,religiousorganizationsandmilitarypersonnelofdefenceservices.Datainthistablealsoexcludeemploymentinpublicadministration,publicutilities(water,sewageandothersystems),postalservices,publictransit,educationalservices,andinstitutionalandothergovernment-fundedhealthcareservices,butincludeemploymentintheCBC,privatepractices(physicians,dentistsandotherhealthpractitioners),andbeerandliquorstores.
Note2:DifferencesbetweenthesedataandthosepublishedinpreviousversionsofKey Small Business Statistics are largely due torevisionstothehistoricalSEPHdata.Asmallproportionofthedifferencesistheresultofrefinementsinthemethodologyused to separate the private and public sectors. A technical note on the separation of public and private sector employment is available upon request by contacting Customer Services at [email protected].
Note3:Minordiscrepanciesbetweentotalnetemploymentchangeandthesumofchangesbysizearelargelyduetosmalldifferences between aggregate and the sum of disaggregated source data.
Year and Quarter
Total Net Change
Net Private Sector Paid Employment Change by Size of Business
0–4 5–19 20–49 50–99Small (<100) 100–299 300–499
Medium (100–499)
Large (500+)
2007 Q3 284 148 9 869 50 052 38 288 27 599 125 808 34 981 12 556 47 537 110 799
Q4 266 238 403 53 992 35 061 25 295 114 752 27 982 10 728 38 710 112 771
2008 Q1 228 641 15 876 38 506 28 692 28 028 111 103 11 646 6 099 17 745 99 795
Q2 217 399 20 594 31 010 31 509 26 193 109 307 2 972 20 880 23 852 84 246
Q3 162 193 5 753 4 772 22 482 26 326 59 332 -3212 20 993 17 781 85 072
Q4 48 755 -1890 11 202 4 734 2 855 16 900 -11883 8 326 -3 557 35 409
2009 Q1 -235076 -17752 -32123 -17016 -33154 -100 045 -56857 -4516 -61 373 -73654
Q2 -446421 -49058 -34698 -46780 -60785 -191 322 -66064 -43817 -109 881 -145221
Q3 -527341 15 659 -74641 -59341 -71973 -190 296 -75541 -55131 -130 672 -206366
Q4 -426015 -12751 -32324 -31404 -48703 -125 182 -72042 -46215 -118 257 -182578
2010 Q1 -194338 3 623 -3441 -16064 -17697 -33 579 -25677 -32730 -58 407 -102359
Q2 -15397 15 161 4 206 6 736 2 644 28 746 -957 -8412 -9 369 -34774
Q3 90 275 -33515 33 053 18 067 25 595 43 200 19 597 7 634 27 231 19 847
Q4 124 008 6 854 -7447 3 720 17 368 20 495 34 701 8 306 43 006 60 509
% Contribution to Private Sector Employment Change by Size of Business
2007 Q3 100 3.5 17.6 13.5 9.7 44.3 12.3 4.4 16.7 39.0
Q4 100 0.2 20.3 13.2 9.5 43.1 10.5 4.0 14.5 42.4
2008 Q1 100 6.9 16.8 12.5 12.3 48.6 5.1 2.7 7.8 43.6
Q2 100 9.5 14.3 14.5 12.0 50.3 1.4 9.6 11.0 38.8
Q3 100 3.5 2.9 13.9 16.2 36.6 -2.0 12.9 11.0 52.5
Q4 100 -3.9 23.0 9.7 5.9 34.7 -24.4 17.1 -7.3 72.6
2009 Q1 100 7.6 13.7 7.2 14.1 42.6 24.2 1.9 26.1 31.3
Q2 100 11.0 7.8 10.5 13.6 42.9 14.8 9.8 24.6 32.5
Q3 100 -3.0 14.2 11.3 13.6 36.1 14.3 10.5 24.8 39.1
Q4 100 3.0 7.6 7.4 11.4 29.4 16.9 10.8 27.8 42.9
2010 Q1 100 -1.9 1.8 8.3 9.1 17.3 13.2 16.8 30.1 52.7
Q2 100 -98.5 -27.3 -43.7 -17.2 -186.7 6.2 54.6 60.9 225.8
Q3 100 -37.1 36.6 20.0 28.4 47.9 21.7 8.5 30.2 22.0
Q4 100 5.5 -6.0 3.0 14.0 16.5 28.0 6.7 34.7 48.8

25Key Small Business Statistics — July 2011
How much do employees of small businesses earn?
Statistics Canada’s Survey of Employment, Payrolls and Hours(SEPH)publishesaverageweekly earnings at the enterprise level based on weekly payroll data. Data include gross pay, as well as overtime and bonuses, commissions and other special payments, before major deductions such as income taxes, employment insurance contributions, etc., but exclude taxable allowancesandbenefits,andemployercontributionstoemploymentinsurance,pensionplansand other welfare plans. Average weekly earnings are derived by dividing total weekly payrolls by payroll employment (see How many people work for small businesses?).SEPHexcludesself-employedpersonsnotonapayrollanddoesnotcoverthefollowingindustries:agriculture,fishingandtrapping,privatehouseholdservices,religiousorganizationsandmilitarypersonnelof defence services. The data shown below also exclude employment in public administration, publicutilities(water,sewageandothersystems),postalservices,publictransit,educationalservices,andinstitutionalandothergovernment-fundedhealthcareservices,butincludeemploymentintheCBC,privatepractices(physicians,dentistsandotherhealthpractitioners),and beer and liquor stores.
In 2010, an average worker in Canada’s private sector earned approximately $830 per week (orabout$43160peryear)(Table8andFigure8).Generally,employees’weeklyearningswerepositivelyrelatedtothesizeofthebusiness—employeesworkingforbusinesseswithfewerthan100employeesearnedbelowtheaveragewithweeklyearningsof$744($38688inannualearnings),whereasthoseworkingformedium-sizedfirms(morethan100butfewerthan500employees)andlargefirms(500employeesormore)earnedabovetheaveragewithweeklyearningsof $841and$916respectively($43732and$47632inannualearnings).Intheservice-producingsector,micro-firmshadthehighestweeklyearningsofallsmallbusinessesat$760(or$39520 peryear).Thismaybebecauseemploymentinlargersmallfirmsisconcentratedinthethreelowest-payingindustries,namelyretailtrade;accommodationandfoodservices;andarts,entertainment and recreation.
Onaveragein2010,employeesinthegoods-producingsectorwerepaid$319moreperweekthanthoseworkingintheservice-producingsector.Thedifferenceinearningsbetweenthetwosectorswasgreatestinlargefirmsatapproximately$485perweekoranannualaveragedifferentialof$25220.However,goods-producingemployeesalsoworkedlongerhours,sothedifference in earnings per hour would be less pronounced.

26
Table 8: Average Weekly Earnings by Firm Size (Number of Employees) in the Private Sector, 20101, 2
Source: Statistics Canada, Survey of Employment, Payrolls and Hours(SEPH),April2011,andcalculationsbyIndustryCanada.Note1:SEPHdataexcludeself-employedworkerswhoarenotonapayroll,andemployeesinthefollowingindustries:agriculture,
fishingandtrapping,privatehouseholdservices,religiousorganizationsandmilitarypersonnelofdefenceservices.Datainthistablealsoexcludeemploymentinpublicadministration,publicutilities(water,sewageandothersystems),postalservices,publictransit,educationalservices,andinstitutionalandothergovernment-fundedhealthcareservices,butincludeemploymentintheCBC,privatepractices(physicians,dentistsandotherhealthpractitioners),andbeerandliquorstores. A technical note on the separation of public and private sector employment is available upon request by contacting Customer Services at [email protected].
Note2:ByconventionalStatisticsCanadadefinition,thegoods-producingsectorconsistsofNorthAmericanIndustryClassificationSystem(NAICS)codes11to31–33,whileNAICScodes41to91definetheservice-producingsector.
Number of Employees Private Sector Goods-Producing Sector2 Service-Producing Sector2
0–4 $770 $805 $760
5–19 $710 $870 $663
20–49 $753 $945 $688
50–99 $770 $989 $694
Small Enterprises (fewer than 100) $744 $906 $694
100–299 $847 $1042 $761
300–499 $824 $1079 $695
Medium-Sized Enterprises (100–499) $841 $1053 $744
Large Enterprises (500 or more) $916 $1289 $804
Average $830 $1070 $751

27Key Small Business Statistics — July 2011
Figure 8: Average Weekly Earnings in the Goods-Producing and Service-Producing Sectors by Firm Size in the Private Sector, 20101, 2
Source: Statistics Canada, Survey of Employment, Payrolls and Hours(SEPH),April2011,andcalculationsbyIndustryCanada.Note1:SEPHdataexcludeself-employedworkerswhoarenotonapayroll,andemployeesinthefollowingindustries:agriculture,
fishingandtrapping,privatehouseholdservices,religiousorganizationsandmilitarypersonnelofdefenceservices.Datainthisfigurealsoexcludeemploymentinpublicadministration,publicutilities(water,sewageandothersystems),postalservices,publictransit,educationalservices,andinstitutionalandothergovernment-fundedhealthcareservices,butincludeemploymentintheCBC,privatepractices(physicians,dentistsandotherhealthpractitioners),andbeerandliquorstores. A technical note on the separation of public and private sector employment is available upon request by contacting Customer Services at [email protected].
Note2:ByconventionalStatisticsCanadadefinition,thegoods-producingsectorconsistsofNorthAmericanIndustryClassificationSystem(NAICS)codes11to31–33,whileNAICScodes41to91definetheservice-producingsector.
Per Week ($)
Total Private Sector Goods-Producing Sector Service-Producing Sector
0
200
400
600
800
1000
1200
1400
Total Private Sector Goods-Producing Sector Service-Producing SectorAv
erag
e
Larg
e E
nter
pris
es
(500
or m
ore)
Med
ium
-Siz
edE
nter
pris
es (1
00–4
99)
300–
499
100–
299
Sm
all E
nter
pris
es (f
ewer
than
100
)
50–9
9
20–4
9
5–190–
4

28
What is the contribution of small businesses to Canada’s gross domestic product?
Grossdomesticproduct(GDP)isakeymeasureofeconomicproductionthatcanbeusedtocompare any two industries’ value added, i.e., the value that an industry, through its activities, addstoitsinputs.ThemainadvantageoftheGDPconceptisthatitavoidsdoublecounting;hence, it is considered superior in gauging economic performance over, for example, revenue, business counts or even employment.
TheGovernmentofBritishColumbia’sstatisticalservice(BCStats)hasdevelopedamethodtodeterminethesmallbusinesscontributiontoGDPbyprovinceusingtheincome-basedapproachoftheSystemofNationalAccounts.6 Table 9 shows the percentage of small business’ contributiontoGDP(includingpublicandprivatesectors)forCanadaandeachprovincefrom2000 to 2009.
BCStats’definitionofsmallbusinessisrestrictedtobusinesseswithfewerthan50employees,plusthoseoperatedbytheself-employedwithnopaidemployees.Bythisdefinition,itisestimatedthat, in 2009, small businesses accounted for approximately 28 percent of Canada’s GDP. Thepercentagevariesfromalowof20percentinNewfoundlandandLabradortoahighof 35 percent in Saskatchewan. Over the 2000 to 2009 period, the contribution of small businesses to GDP increased slightly at the national level from 26 percent in 2000 to 29 percent in 2007 and 2008 and to 28 percent in 2009. The largest increase occurred in Saskatchewan, where the GDP contribution was 26 percent in 2000 and 35 percent in 2009. The GDP contribution decreased mostinPrinceEdwardIsland,whereitfellfrom34percentin2000to29percentin2009.
Figure9showsthecontributiontoGDPbyfirmsizeforonlyoneyear,2005,usingadifferentmethodology.Inarecentstudy,StatisticsCanadafoundthatsmallbusinesses(heredefinedasthosewith1to100employees)accountedforabout42percentofprivatesectorGDPandSMEs(thosewith1to499employees)accountedforabout54percent(Figure9.1).IndustryCanada’sestimates indicate that, when taking into account both the public and the private sectors, small businessesintheprivatesectoraccountforabout31percentofGDP,whilemedium-sizedbusinessesaccountfor9percent(Figure9.2).
6. A background note describing the method in somewhat greater detail is available upon request by contacting Customer Services at [email protected].

29Key Small Business Statistics — July 2011
Table 9: Small Business’ Contribution to GDP by Province, 2000 to 20091, 2
Source: British Columbia’s Statistical Service.Note1:Inthesedata,smallbusinessescomprisebusinesseswithfewerthan50employees,plusthoseoperatedbytheself-
employed with no paid employees.Note2:DifferencesbetweenthesedataandthosepublishedinpreviousversionsofKey Small Business Statisticsreflectchanges
totheunderlyingdataonwhichthenumbersarebased,aswellasarefinementofthemethodologyusedtogenerate the estimates.
Figure 9: Contribution to GDP by Firm Size, Public and Private Sectors, 2005
Source: Statistics Canada, Small, Medium-Sized and Large Businesses in the Canadian Economy: Measuring Their Contribution to Gross Domestic Product in 2005,June2011;IndustryCanadacalculations.
ProvinceContribution to GDP (Percent)
2000 2001 2002 2003 2004 2005 2006 2007 2008 2009
NewfoundlandandLabrador 20 20 19 18 21 19 19 18 18 20
PrinceEdwardIsland 34 33 32 29 31 30 30 29 29 29
NovaScotia 26 26 26 25 26 25 25 26 25 25
NewBrunswick 23 24 25 23 25 25 24 25 25 24
Quebec 27 27 27 27 29 30 30 30 31 30
Ontario 25 25 24 23 24 25 26 26 27 26
Manitoba 24 24 23 24 25 25 26 26 26 26
Saskatchewan 26 26 26 24 29 29 30 32 33 35
Alberta 25 26 28 26 26 27 29 31 31 29
British Columbia 28 29 28 29 33 33 33 34 34 32
Canada 26 26 26 25 27 28 28 29 29 28
Public Medium LargeSmall
Per
cent
age
0
5
10
15
20
25
30
35
40
Private Sector
Figure 9.2: Public and Private Sectors
Medium LargeSmall
Per
cent
age
05
101520253035404550
Figure 9.1: Private Sector
41.9%
12.4%
45.7%
25.0%
31.4%
9.3%
34.3%
30
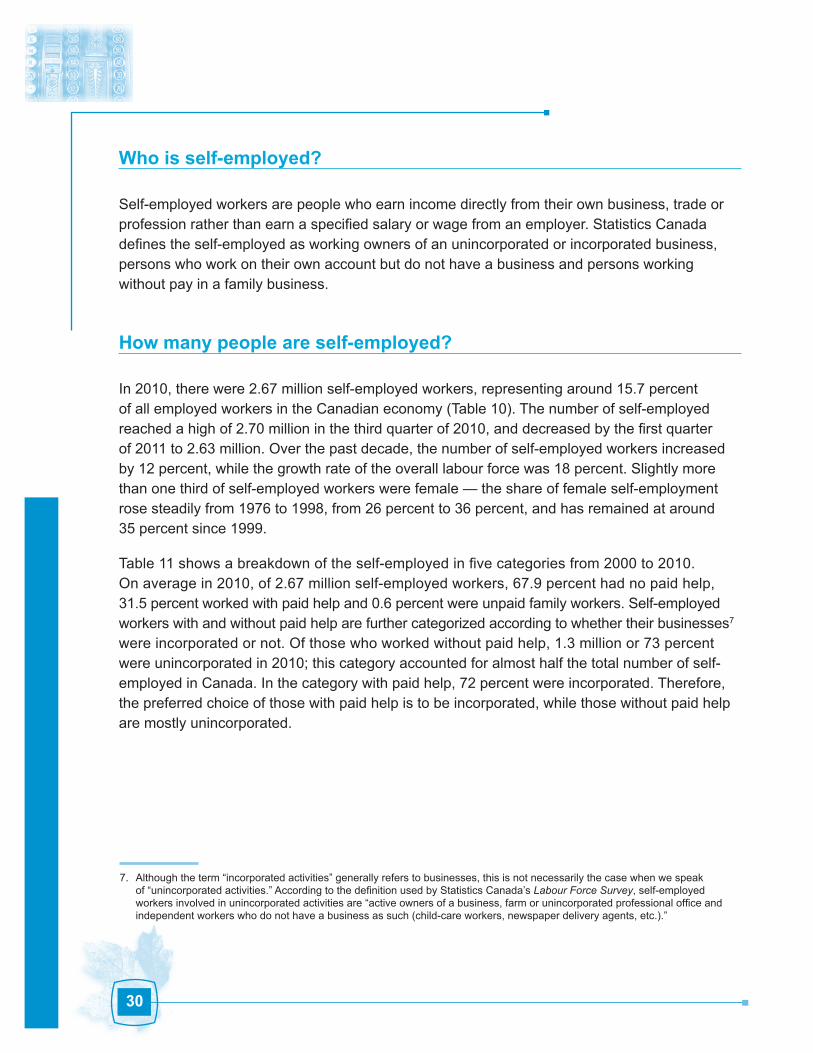
Who is self-employed?
Self-employedworkersarepeoplewhoearnincomedirectlyfromtheirownbusiness,tradeorprofessionratherthanearnaspecifiedsalaryorwagefromanemployer.StatisticsCanadadefinestheself-employedasworkingownersofanunincorporatedorincorporatedbusiness,persons who work on their own account but do not have a business and persons working without pay in a family business.
How many people are self-employed?
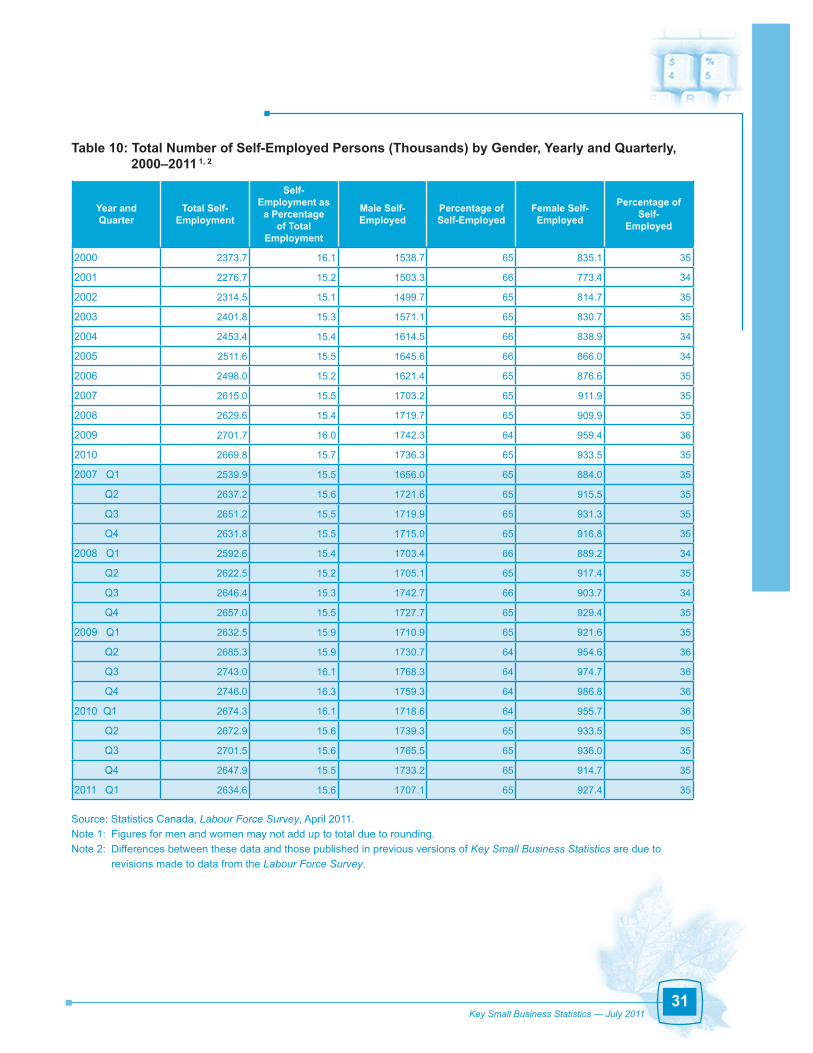
In2010,therewere2.67millionself-employedworkers,representingaround15.7percentofallemployedworkersintheCanadianeconomy(Table10).Thenumberofself-employedreachedahighof2.70millioninthethirdquarterof2010,anddecreasedbythefirstquarterof2011to2.63million.Overthepastdecade,thenumberofself-employedworkersincreasedby 12 percent, while the growth rate of the overall labour force was 18 percent. Slightly more thanonethirdofself-employedworkerswerefemale—theshareoffemaleself-employmentrose steadily from 1976 to 1998, from 26 percent to 36 percent, and has remained at around 35 percent since 1999.
Table11showsabreakdownoftheself-employedinfivecategoriesfrom2000to2010. Onaveragein2010,of2.67millionself-employedworkers,67.9percenthadnopaidhelp, 31.5percentworkedwithpaidhelpand0.6percentwereunpaidfamilyworkers.Self-employedworkerswithandwithoutpaidhelparefurthercategorizedaccordingtowhethertheirbusinesses7 were incorporated or not. Of those who worked without paid help, 1.3 million or 73 percent wereunincorporatedin2010;thiscategoryaccountedforalmosthalfthetotalnumberofself-employed in Canada. In the category with paid help, 72 percent were incorporated. Therefore, the preferred choice of those with paid help is to be incorporated, while those without paid help are mostly unincorporated.
7. Although the term “incorporated activities” generally refers to businesses, this is not necessarily the case when we speak of“unincorporatedactivities.”AccordingtothedefinitionusedbyStatisticsCanada’sLabour Force Survey,self-employedworkersinvolvedinunincorporatedactivitiesare“activeownersofabusiness,farmorunincorporatedprofessionalofficeandindependentworkerswhodonothaveabusinessassuch(child-careworkers,newspaperdeliveryagents,etc.).”
31Key Small Business Statistics — July 2011
Table 10: Total Number of Self-Employed Persons (Thousands) by Gender, Yearly and Quarterly, 2000–2011 1, 2
Source: Statistics Canada, Labour Force Survey, April 2011.Note1:Figuresformenandwomenmaynotadduptototalduetorounding.Note2:DifferencesbetweenthesedataandthosepublishedinpreviousversionsofKey Small Business Statistics are due to
revisions made to data from the Labour Force Survey.
Year and Quarter
Total Self-Employment
Self-Employment as
a Percentage of Total
Employment
Male Self-Employed
Percentage of Self-Employed
Female Self-Employed
Percentage of Self-
Employed
2000 2373.7 16.1 1538.7 65 835.1 35
2001 2276.7 15.2 1503.3 66 773.4 34
2002 2314.5 15.1 1499.7 65 814.7 35
2003 2401.8 15.3 1571.1 65 830.7 35
2004 2453.4 15.4 1614.5 66 838.9 34
2005 2511.6 15.5 1645.6 66 866.0 34
2006 2498.0 15.2 1621.4 65 876.6 35
2007 2615.0 15.5 1703.2 65 911.9 35
2008 2629.6 15.4 1719.7 65 909.9 35
2009 2701.7 16.0 1742.3 64 959.4 36
2010 2669.8 15.7 1736.3 65 933.5 35
2007 Q1 2539.9 15.5 1656.0 65 884.0 35
Q2 2637.2 15.6 1721.6 65 915.5 35
Q3 2651.2 15.5 1719.9 65 931.3 35
Q4 2631.8 15.5 1715.0 65 916.8 35
2008 Q1 2592.6 15.4 1703.4 66 889.2 34
Q2 2622.5 15.2 1705.1 65 917.4 35
Q3 2646.4 15.3 1742.7 66 903.7 34
Q4 2657.0 15.5 1727.7 65 929.4 35
2009 Q1 2632.5 15.9 1710.9 65 921.6 35
Q2 2685.3 15.9 1730.7 64 954.6 36
Q3 2743.0 16.1 1768.3 64 974.7 36
Q4 2746.0 16.3 1759.3 64 986.8 36
2010 Q1 2674.3 16.1 1718.6 64 955.7 36
Q2 2672.9 15.6 1739.3 65 933.5 35
Q3 2701.5 15.6 1765.5 65 936.0 35
Q4 2647.9 15.5 1733.2 65 914.7 35
2011 Q1 2634.6 15.6 1707.1 65 927.4 35

32
Thenumberofself-employedpersonswithincorporatedbusinessesincreased2.8percentannually,onaverage,overthepast10years(notshown),comparedwith1.1percentforallself-employed. However, there was a great difference in the pattern of growth between incorporated businesses with paid help and those without. The number of incorporated businesses with paid help grew 1.4 percent annually, on average, between 2000 and 2010. In contrast, the number ofincorporatedself-employedpersonswithoutpaidhelpincreasedrapidlybetween2000and2010, at an average annual increase of 4.8 percent.
AsshowninTable11,thetotalnumberofself-employedworkersinCanadaincreasedatanannual rate of 2.2 percent between 1980 and 2010 but, as shown in Figure 10, the various categoriesofself-employedworkersexperiencedslightlydifferentgrowthratesoverthatperiod. For example, in the last two decades, there was negative growth in the category of unincorporated self-employedindividualswithpaidhelp.Theannualaveragegrowthovertheentireperiodwas-0.1percent.Thehighestgrowthforself-employedworkerswithoutpaidhelpoccurredoverthe1990–2000period(4.1percent).Forthosewithpaidhelp,thehighestgrowthoccurredduringthe1980–1990period(3.6percent).
Table 11: Average Annual Number of Self-Employed Persons by Category (Thousands), 2000–2010, and Average Annual Growth Rates (Percent), 1980–20101
Source: Statistics Canada, Labour Force Survey, April 2011. Note1:DifferencesbetweenthesedataandthosepublishedinpreviousversionsofKey Small Business Statistics are due to
revisions made to data from the Labour Force Survey.
Year
Total
With Paid Help Without Paid Help Unpaid Family
WorkersTotal Incorporated Unincorporated Total Incorporated Unincorporated
2000 2373.7 815.6 519.8 295.8 1516.5 292.0 1224.5 41.6
2001 2276.7 787.1 495.3 291.8 1457.2 304.2 1153.0 32.4
2002 2314.4 781.1 497.2 283.9 1500.8 323.2 1177.6 32.5
2003 2401.8 796.2 513.1 283.1 1571.6 355.3 1216.3 34.0
2004 2453.5 835.3 559.4 275.9 1588.5 384.6 1203.9 29.7
2005 2511.5 863.8 590.4 273.4 1622.1 400.3 1221.8 25.6
2006 2498.1 847.9 584.9 263.0 1621.9 407.9 1214.0 28.3
2007 2615.0 855.5 594.8 260.7 1734.2 448.7 1285.5 25.3
2008 2629.7 861.3 603.8 257.5 1743.1 469.1 1274.0 25.3
2009 2701.6 850.6 612.2 238.4 1829.6 485.2 1344.4 21.4
2010 2669.7 841.2 607.7 233.5 1811.4 490.4 1321.0 17.1
Average Annual Growth Rate, 1980–2010
1980–1990 2.7% 3.6% 4.2% 2.7% 2.9% 6.8% 2.4% -4.3%
1990–2000 2.4% 0.2% 0.8% -0.7% 4.1% 8.4% 3.4% -4.3%
2000–2010 1.1% 0.3% 1.4% -2.1% 1.6% 4.8% 0.7% -7.8%
1980–2010 2.2% 1.4% 2.3% -0.1% 3.1% 7.1% 2.3% -5.8%

33Key Small Business Statistics — July 2011
Figure 10: Self-Employed Persons (Thousands) by Category, 1980–2010
Source: Statistics Canada, Labour Force Survey, April 2011.
Self-employedworkersowningincorporatedbusinessesregisteredthehighestgrowthratesbetween1980and2010—7.1percentforbusinesseswithoutpaidemployees,followedbyunincorporated businesses without paid employees and incorporated businesses with paid employees at 2.3 percent.
Twocategoriesexperiencedgrowthratesbelowthe2.2-percentaverage,whichmeanstheirrelativeimportanceintermsofself-employedworkersdiminished.Thesecategorieswereself-employedworkersowningunincorporatedbusinesseswithpaidemployees(-0.1percent)andunpaidfamilyworkers(-5.8percent).
(Thousands)
Unincorporated, without paid helpIncorporated, with paid help
Unincorporated, with paid helpIncorporated, without paid help
Unpaid family workers
0
375
750
1125
1500
2010
2009
2008
2007
2006
2005
2004
2003
2002
2001
2000
1999
1998
1997
1996
1995
1994
1993
1992
1991
1990
1989
1988
1987
1986
1985
1984
1983
1982
1981
1980

34
How has self-employment contributed to job creation?
Generally,theincreasingtrendtowardself-employmenthassupportedtotalemploymentgrowth.Positive contributions to total net employment growth in the private sector have ranged from 12percentto40percentperyearbetween2000and2010(Table12).8Thenumberofself-employedworkersfellin2010,whichisonlythefifthtimethishashappenedoverthe1980–2010period(Figure11).Theotherfouryearswere1986,2000,2001and2006.In1982,1991,1992and2009,self-employmentgrew,whiletotalemploymentgrowthturnednegativeduetoeconomic recessions. It is interesting to note that the two greatest increases in the number of self-employedpersonsrelativetotheoverallchangeinprivatesectoremploymentoccurredattheendoftheserecessions(in1983and1993)—167percentin1983and125percentin1993.
Table 12: Private Sector Total Net Employment Change and Net Self-Employment Change, Year-Over-Year, 2000–20101, 2, 3
Source: Statistics Canada, Labour Force Survey, April 2011. Note1:(-)indicatesanegativecontributiontototalnetemploymentchange.Note2:Netchangefiguresmaynotadduptototalnetchangeduetorounding.Note3:DifferencesbetweenthesedataandthosepublishedinpreviousversionsofKey Small Business Statistics are due to
revisions made to data from the Labour Force Survey.
Year
Private Sector Total Net
Employment Change(thousands)
Private Sector Employees Self-Employed Persons
Net Change(thousands)
Percentage of Total Private Sector
Employment Change
Net Change(thousands)
Percentage of Total Private Sector
Employment Change
2000 258.8 318.0 123 -59.2 -23
2001 138.3 235.4 170 -97.1 -70
2002 298.9 261.1 87 37.8 13
2003 315.0 227.6 72 87.3 28
2004 186.2 134.7 72 51.5 28
2005 144.1 85.9 60 58.2 40
2006 240.0 253.6 106 -13.6 -6
2007 297.3 180.2 61 117.1 39
2008 117.7 103.1 88 14.6 12
2009 -264.6 -336.6 127 72.1 -27
2010 92.9 124.9 134 -31.9 -34
8.InTable12,employmentintheprivatesectorisdefinedasthetotalofself-employedworkersandprivatesectoremployees,regardlessofbusinesssize.ThedefinitionofprivatesectoremployeesintheLabour Force Survey used in Table 12 is not identical tothedefinitionintheSurvey of Employment, Payrolls and Hours(SEPH)datainTables5to7,butthedifferencesareminor.

Figure 11: Private Sector Total Net Employment Change and Net Self-Employment Change, Year-Over-Year (Thousands), 1980–2010
Source: Statistics Canada, Labour Force Survey, April 2011.
(Thousands)
Net
Em
ploy
men
t Cha
nge
Net Private Sector Total Employment ChangeNet Self-Employment Change
1980
1981
1982
1983
1984
1985
1986
1987
1988
1989
1990
1991
1992
1993
1994
1995
1996
1997
1998
1999
2000
2001
2002
2003
2004
2005
2006
2007
2008
2009
2010
-500
-250
0
250
500
35Key Small Business Statistics — July 2011
36
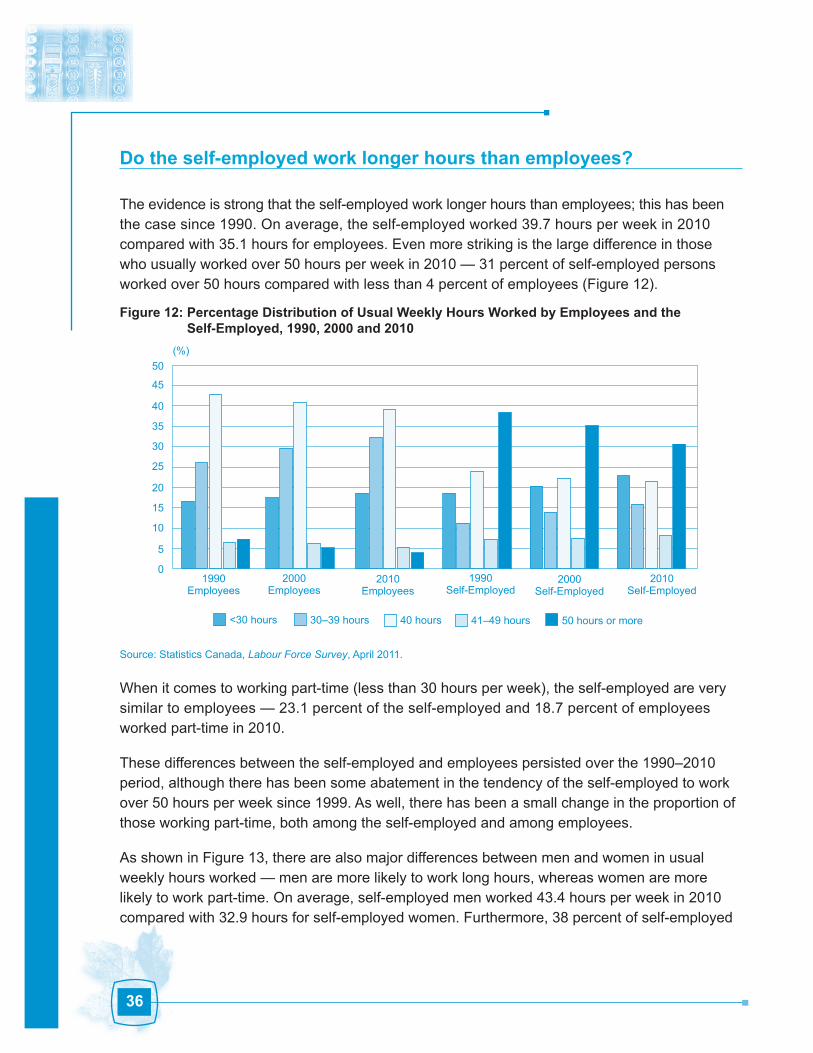
Do the self-employed work longer hours than employees?
Theevidenceisstrongthattheself-employedworklongerhoursthanemployees;thishasbeenthecasesince1990.Onaverage,theself-employedworked39.7hoursperweekin2010comparedwith35.1hoursforemployees.Evenmorestrikingisthelargedifferenceinthosewhousuallyworkedover50hoursperweekin2010—31percentofself-employedpersonsworkedover50hourscomparedwithlessthan4percentofemployees(Figure12).
Figure 12: Percentage Distribution of Usual Weekly Hours Worked by Employees and the Self-Employed, 1990, 2000 and 2010
Source: Statistics Canada, Labour Force Survey, April 2011.
Whenitcomestoworkingpart-time(lessthan30hoursperweek),theself-employedareverysimilartoemployees—23.1percentoftheself-employedand18.7percentofemployeesworkedpart-timein2010.
Thesedifferencesbetweentheself-employedandemployeespersistedoverthe1990–2010period,althoughtherehasbeensomeabatementinthetendencyoftheself-employedtoworkover 50 hours per week since 1999. As well, there has been a small change in the proportion of thoseworkingpart-time,bothamongtheself-employedandamongemployees.
As shown in Figure 13, there are also major differences between men and women in usual weeklyhoursworked—menaremorelikelytoworklonghours,whereaswomenaremorelikelytoworkpart-time.Onaverage,self-employedmenworked43.4hoursperweekin2010comparedwith32.9hoursforself-employedwomen.Furthermore,38percentofself-employed
(%)
<30 hours 30–39 hours 40 hours 41–49 hours 50 hours or more
1990Employees
1990Self-Employed
2010Self-Employed
2010Employees
2000Employees
2000Self-Employed
0
5
10
15
20
25
30
35
40
45
50

37Key Small Business Statistics — July 2011
menworkedover50hoursin2010comparedwith19percentofself-employedwomen.Thesamepatternappliesamongemployees,althoughatmuchlowerlevels—6.3percentofmaleemployees worked over 50 hours in 2010 compared with 1.5 percent of female employees.
Figure 13: Percentage Distribution of Usual Weekly Hours Worked by Class of Worker and Gender, 2010
Source: Statistics Canada, Labour Force Survey, April 2011.
Femalesaremorelikelytoworkpart-time,whethertheyareself-employedorareemployees.Amongtheself-employed,38.6percentofwomenworkedpart-time(lessthan30hours)in2010comparedwith14.7percentofmen.Amongemployees,25.9percentofwomenworkedpart-time in 2010 compared with 11.5 percent of men.
(%)
MaleEmployees
FemaleEmployees
MaleSelf-Employed
FemaleSelf-Employed
0
10
20
30
40
50
60
<30 hours 30–39 hours 40 hours 41–49 hours 50 hours or more

38
How many small business entrepreneurs are women?
There is no easy way to precisely determine the number of entrepreneurs in Canada, much less the number of women entrepreneurs. However, it is possible to estimate the number using availabledataonself-employmentandbusinessownership.
Statistics Canada’s Labour Force Surveyreportstherewere910000self-employedwomeninCanadain2008,accountingforaboutonethirdofallself-employedpersons.(Althoughnotalloftheself-employedwouldidentifythemselvesasentrepreneurs,thenumberofself-employedwomen provides an upper limit for the number of female entrepreneurs.9)Between1998and2008,thenumberofself-employedwomengrewby6.4percentcomparedwith11-percentgrowthinmaleself-employment.
Another way to count entrepreneurs is through business ownership. Statistics Canada’s Survey on Financing of Small and Medium Enterprises distinguishes four types of business ownership based on gender: majority female ownership, equal partnership between male and female owners, minority female ownership and no female ownership.
Inthe2007survey,itwasestimatedthat46percentofSMEshadsomedegreeoffemaleownershipin2007.SMEswithequalpartnershipsbetweenmaleandfemaleownersaccountedfor19percent,while16percentweremajority-ownedbyfemales.Thedegreeoffemaleownershipvariedbyindustry,butitisclearthatthepercentageoffemale-ownedbusinesseslagsbehindthepercentageofmajoritymale-ownedbusinessesineveryindustry(Figure14).Accommodation and food services industries have the highest share of businesses that are majority-ownedbyfemales,at22percent,whereasSMEsinagricultureandprimaryindustrieshavethelowestlevel,withonly5percentofbusinessesmajority-ownedbyfemales.
ThesurveyshowedthatSMEsmajority-ownedbywomenwerelesslikelythanotherSMEstoemploymorethan20employeesandalsostartedupmorerecentlythanfirmsthataremajority-ownedbymen.WomenownersofSMEsalsotendedtohavefeweryearsofexperienceintheindustries in which they operated compared with their male counterparts.
9. Someentrepreneurs,especiallyiftheyareonthepayrolloftheirownbusinesses,maynotidentifythemselvesasbeingself-employed;however,thisnumberislikelytobesmallerthanthenumberofself-employedwhoarenotentrepreneurs.

39Key Small Business Statistics — July 2011
Figure 14: Business Ownership Distribution by Gender and Industry, 2007
Source: Statistics Canada, Survey on Financing of Small and Medium Enterprises, 2007.
Table13showsthedegreeoffemalebusinessownershipbyregion.In2007,majorityfemale-ownedSMEsaccountedfor20percentofallSMEsinOntarioand17percentofallSMEsinAtlanticCanada.Majorityfemale-ownedSMEsinthePrairiesandQuebecaccountedfor11percentand15percentofallSMEsineachregionrespectively.WhilethePrairieshadthelowestpercentageofmajorityfemale-ownedfirms,theregionhadthehighestpercentageoffirmsthatwerehalf-ownedbywomen(28percent).
Table 13: Business Ownership Distribution by Gender and Region, 2007
Source: Statistics Canada, Survey on Financing of Small and Medium Enterprises, 2007.Note1:Somefiguresmaynotaddupto100duetorounding.Note2:Dashindicatesestimatessuppressedduetoconfidentiality.
RegionDegree of Female Ownership1 (Percent)
0% >0% to <50% 50% >50% >0%Atlantic Provinces 54 11 17 17 45
Quebec 66 8 11 15 34
Ontario 52 8 19 20 47
Prairies 44 17 28 11 56
British Columbia 52 13 20 16 49
Territories2 – – – – –
(%)
Majority Female Male-Owned OnlyEqual Partnership
Industry Aggregate
Total
Manufacturing Knowledge-Based
Industries
Agriculture/Primary
Wholesale and Retail
ProfessionalServices
Other
Minority Female
Accommodationand
Food Services
0
20
40
60
80
100

40
What is the contribution of small businesses to Canada’s exports?
ExportingisvitaltoCanada’seconomyandhasaccountedforcloseto40percentofGDPinrecent years, with the exception of 2009. In 2009, exports of goods and services accounted for 30 percent of GDP, which could be explained by the global recession and the high value of theCanadiandollar.Exportscanbeadriverofeconomicgrowthandarestronglycorrelatedwith real GDP growth. Furthermore, exporting can provide a strategically important means ofgrowingafirmbyexpandingitsmarketbeyondtheconfinesofCanada’srelativelysmalldomestic market.
Table14showsthedistributionofthevalueofexportsbyindustryandsizeoffirmin2009.In 2009, the total value of merchandise exports by Canadian enterprises was approximately $300 billion.10Thisrepresentsadeclineofabout$114billion(27.5percent)comparedwith2008and$94billion(24percent)comparedwith2007.AreductioninthedemandforCanadiangoodsandothereffectsoftheglobalrecessionmade2009aparticularlydifficultyearforexports.
In 2009, about 86 percent of Canadian exporters were small businesses compared with 85 percent in2008and87percentin1999.Moreimportantly,smallbusinesseswereresponsiblefor$68billion(25percent)ofthetotalvalueofexportsin2009,withanaveragevalueof$2millionperfirm.Medium-sizedbusinessesaccountedfor$51billion(18percent)ofthetotalvalueofexportsin2009,withanaveragevalueof$13millionperfirm.Largebusinessesaccountedfor$157billion(57percent)ofthetotalvalueofexports,withanaveragevalueof$139millionperfirm.
Small business’ contribution to the total value of exports decreased by 2.5 percentage points in2009comparedwith1999,whilethatofmedium-sizedfirmsincreasedby8.7percentagepoints.Thecontributionoflargefirmstothetotalvalueofexportsdecreasedby6percentagepointsover the same period.
Theproportionofsmallbusinessesthatexport(1.4percent)islowerthantheproportionofsmallbusinessesintheoveralleconomy(98percent).In2009,27percentofmedium-sizedbusinessesand40percentoflargebusinessesexported.About2percentofsmallandmedium-sizedenterprisesexportedgoodsin2009.Theyaccounted,however,forover40percentoftheoverall export value in 2009.
Small businesses contributed about 12 percent to total manufacturing exports compared with 66 percentfromlargefirms.Inmostotherindustries,however,smallbusinessesmadethelargestcontributiontoexports.Thelargestcontributionswereinretailtrade(79.1percent),agriculture,forestry,fishingandhunting(72.3percent)andothersectors(72.0percent).
10.Thetotalvalueofexportsin2009wasabout$300billion.However,oncethevaluesaredistributedbyfirmsizeandindustry,about$24billionofexportsareclassifiedasconfidential.Therefore,thepercentagespresentedinTable14arecalculatedusing$276 billion as the total value of exports.

41Key Small Business Statistics — July 2011
Table 14: Distribution of the Total Value of Exported Merchandise by Industry and by Size of Business (Number of Employees), 20091
Source:StatisticsCanada,ExporterRegister,2009.Note1:DatathatareconfidentialaredenotedbyX.Note2:Somevalueswerenotclassifiedbyfirmsizeduetoconfidentiality;therefore,thetotalsarecalculatedasfollows:
A:Totalvalueofexports(small,mediumandlargecategories) B:Totalvalueofexports(small,medium,largeandconfidentialcategories)
For more information on small business exports, please refer to Canadian Small Business Exporters, Special Edition: Key Small Business Statistics(June2011).
Industry Grouping (NAICS)
Employer Businesses
Size of Business Enterprise - Number of Employees (Percent of Total)
Total Value2 ($ millions)
Total (all business sizes)
Small (<100)
Medium (100–499)
Large (500+)
Agriculture, Forestry, Fishing and Hunting 3 224 1.2 72.3 9.2 18.5
Mining,OilandGasExtraction/Utilities A: 42 671B: 44 356 15.4 13.6 8.6 77.8
Construction 1 407 0.5 71.3 23.7 5.1
Manufacturing A: 165 032B: 169 233 59.7 12.1 22.3 65.6
Wholesale Trade 30 793 11.1 70.0 20.9 9.0
Retail Trade 1 753 0.6 79.1 3.9 17.0
Transportation and Warehousing A: 341B: 18 196 0.1 x 100.0 x
Information and Cultural Industries 498 0.2 52.8 43.1 4.1
Finance and Insurance 9 851 3.6 62.2 6.8 31.0
Business Services 17 504 6.3 41.4 8.0 50.6
Other 3 485 1.3 72.0 19.2 8.8
Industry Aggregate Total A: 276 559B: 300 298 100.0 24.7 18.4 56.9
Total Number of
FirmsSmall (<100)
Medium (100–499)
Large (500+)
AllIndustryExports A: 36 154B: 38 675 86.2% 10.7% 3.1%

42
Publications
Available through the Small Business Research and Statistics website (www.ic.gc.ca/sbresearch)
StatisticsKey Small Business Statistics (KSBS) (www.ic.gc.ca/sbstatistics)The KSBS provides key statistics on small business topics, responding to some of the most commonly asked questions. This publication is produced annually and is released in July. A special edition of the KSBS,whichexploresaparticularissueindetail,isusuallypublishedinthefirsthalfofayear.
Special EditionsCanadianSmallBusinessExporters—June2011GrowthMapofCanadianFirms—January2010
Small Business Quarterly (SBQ) (www.ic.gc.ca/SMEquarterly)TheSBQprovidesaquickandeasy-to-readsnapshotoftherecentperformanceofCanada’ssmallbusinesssector.ThispublicationisproducedinFebruary,May,AugustandNovember.Itisavailable in printed and electronic versions.
Research Reports (www.ic.gc.ca/sbresearch/sbreports)
ThesereportsarepreparedorcommissionedbytheSmallBusinessBranch(SBB).
ProfileofMid-CareerEntrepreneurs:Careertrade-offsandincomeappropriationofhighhumancapitalindividualsTheTeachingandPracticeofEntrepreneurshipwithinCanadianHigherEducationInstitutions—December 2010TheStateofEntrepreneurshipinCanada—February2010ProfileofGrowthFirms:ASummaryofIndustryCanadaResearch—March2008
Subscription (www.ic.gc.ca/SMEstatistics/subscription)YoucansubscribeonlinetoreceiveemailnotificationofonlinereleasesofSmallBusinessResearchandStatistics website publications and reports managed by the SBB.
Available through the SME Financing Data Initiative(SMEFDI)website(www.sme-fdi.gc.ca) Key Small Business Financing Statistics (KSBFS) (www.sme-fdi.gc.ca/sbfstatistics)TheKSBFSprovideskeystatisticsonthestateofSMEfinancinginCanada.Theinformationprovidedresponds to some of the most commonly asked questions. This publication is available in printed and electronic versions. The most recent KSBFS was published in December 2009.
Venture Capital (VC) Monitor (www.sme-fdi.gc.ca/vcmonitor)Thisisaquarterlypublicationontheventurecapital(VC)industryinCanada.Thegoalofthisseriesis to provide current information about this key enabling industry. To this end, the series will track trends ininvestmentactivity,reportontopicalVC-relatedresearchandlookatkeytechnologyclusterswhere VC investment is taking place. This publication is only available in an electronic version.
Small Business Financing Profiles (www.sme-fdi.gc.ca/sbfprofiles)Small Business Financing Profiles areshortreferencedocumentsonaspecificsegmentofthesmallbusinessmarketplace.Thesepapersprovideadetailedprofileofthefinancial/ownershipstructureandtypesoffinancingusedbythesegmenttargeted.Theyidentifyaccesstofinancingissuesandposefutureresearch questions that need to be addressed. As most of the printed copies of these publications are out of stock, they are mainly available electronically.

43Key Small Business Statistics — July 2011
RegionsRural-BasedEntrepreneurs—October2008SMEsinOntario—September2007SMEsintheAtlanticProvinces—September2007SMEsinthePrairieProvinces—September2007SMEsinQuebec—August2007SMEsinBritishColumbia—June2007
Business CharacteristicsFinancingInnovativeSmallandMedium-SizedEnterprisesinCanada—March2009BorrowersundertheCanadaSmallBusinessFinancingProgram—February2009InformallyFinancedSMEs—September2006ExporterSMEs—September2006High-GrowthSMEs—May2006
Business Owner CharacteristicsWomenEntrepreneurs—October2010YoungEntrepreneurs—January2006VisibleMinorityEntrepreneurs—March2005WomenEntrepreneurs—November2004
Research Reports (www.sme-fdi.gc.ca/SMEfinreports)In addition to research presented in Small Business Financing Profiles and Key Small Business Financing Statistics, the SME FDIalsocommissionsresearchintonicheareasofSMEfinancing.
AnInterpretationofDiscouragedBorrowersBasedonRelationshipLending—August2010TheEconomicImpactoftheCanadaSmallBusinessFinancingProgram—June2010DeterminantsofTradeCreditUsebySmallandMedium-SizedEnterprisesinCanada— December 2009FinancingInnovativeSmallandMedium-SizedEnterprisesinCanada—October2009CanadianSMEExporters—January2008FinancingCanadianSMEExporters—June2007FinancingGlobalGazelles—March2006
Subscription (www.sme-fdi.gc.ca/subscription)
Available through the Paperwork Burden Reduction Initiative website (www.reducingpaperburden.gc.ca)
Analysis of Regulatory Compliance Costs (www.reducingpaperburden.gc.ca/Survey)ThesepublicationsshowcasefindingsfromthejointIndustryCanada–StatisticsCanadaSurvey of Regulatory Compliance Costs. Publications are available in an electronic version.