Embed Size (px)
Citation preview
Members’ Research Service / Gwasanaeth Ymchwil yr Aelodau
April 2008
Abstract This paper provides key statistics for the Ceredigion Local Authority area, under a number of topic headings. This is one of a series of Members’ Research Service profiles for all Local Authorities in Wales which are updated on a regular basis.
Key Statistics for Ceredigion

Enquiry no: 08/1256/SH April 2008
Members’ Research Service briefings are compiled for the benefit of Assembly Members and their support staff. Authors are available to discuss the contents of these papers with Members and their staff but cannot advise members of the general public. We welcome comments on our briefings; these should be sent to the Members’ Research Service, National Assembly for Wales, Cardiff CF99 1NA or e-mailed to Members’[email protected].
Members’ Research Service: Research Paper Gwasanaeth Ymchwil yr Aelodau: Papur Ymchwil
Key Statistics for Ceredigion Finance and Statistics Team April 2008 Paper number: 08/017 © National Assembly for Wales Commission 2008 © Comisiwn Cynulliad Cenedlaethol Cymru 2008

Members’ Research Service: Research Paper Gwasanaeth Ymchwil yr Aelodau: Papur Ymchwil
Summary
The following points provide a brief overview of Ceredigion, drawn from detailed statistics in the main body of this paper. Technical terms have been avoided, and in general the reference periods of the statistics are not mentioned as these vary. Details on reference periods can be found in the tables or notes at the end of the paper.
• Around 77,200 people live in Ceredigion, which with 43 people per square kilometre is less densely populated than Wales as a whole.
• Between 1996 and 2006, the local authority's population increased by 9.3%, compared to a 2.6% rise in Wales overall.
• 59% of Ceredigion residents were born in Wales and 52% of people aged three or more can speak Welsh. Across Wales, 75% of all Welsh residents were born in Wales and 21% of people aged three or more can speak Welsh.
• Compared to the Welsh average, life expectancy in Ceredigion is higher for males and higher for females.
• Around 68% of the working age population of Ceredigion are economically active, and 1.3% claim Job Seekers' Allowance. This compares to an economically active population of 75% for Wales, and 2.2% claiming Job Seekers' Allowance.
• At £353, the median(i) weekly pay for full-time workers in Ceredigion is around £63 less than the Welsh median.
• Proportionally, slightly fewer people in Ceredigion than in Wales reported having a limiting long term illness (20.7% and 23.3% respectively).
• A higher percentage of adults than in Wales met guidelines for undertaking physical activity, and a higher percentage than in Wales met guidelines for the consumption of fruit and vegetables.
• The rate of people waiting for their first outpatient appointment in Ceredigion is 518.3 per 10,000 people. The equivalent rate for Wales is 560.6 per 10,000 people.
• A higher proportion of pupils in their final year of compulsory education achieved five or more GCSEs at grades A*-C, compared to the figure for Wales.
• There are around 31,000 households in Ceredigion, 70% of which are owner occupied. This compares to 71.3% for Wales.
• The median(i) house price in 2006 was around £172,000. This was £39,500 more than the Welsh median.
• The rate of accidents per length of road is noticeably lower in the area than the rate for Wales (11.3 per 100 km and 25.5 per 100 km respectively).
• Around 45% of municipal waste was recycled or composted in 2006-07. The percentage for Wales over the same period was 30%.
• The Welsh Index of Multiple Deprivation 2005 ranks specific small areas in Wales in terms of deprivation: none of Ceredigion’s areas fall in the 10% most deprived areas in Wales, and the majority of its areas are less deprived than the Wales average.
(i) The median is the value with half of all values above it and half below (i.e. the middle value).

Members’ Research Service: Research Paper Gwasanaeth Ymchwil yr Aelodau: Papur Ymchwil
Contents
Introduction ....................................................................................................................... 1 Background......................................................................................................................... 1 Structure of this paper......................................................................................................... 1 Sources for further information ........................................................................................... 1 Map of Ceredigion Local Authority ................................................................................. 2 Table 1: Population and Vital Statistics.......................................................................... 3 Table 2: Economic and Labour Market Statistics .......................................................... 5 Table 3: Health and Social Services Statistics............................................................... 6 Table 4: Education and Training Statistics..................................................................... 9 Table 5: Housing Statistics ............................................................................................ 11 Table 6: Transport, Crime and Environment Statistics ............................................... 12 Deprivation Statistics ..................................................................................................... 14 Annex 1: Sources and Notes ......................................................................................... 15 Annex 2: Overall Index of Multiple Deprivation map for Ceredigion.......................... 20

1
Members’ Research Service: Research Paper Gwasanaeth Ymchwil yr Aelodau: Papur Ymchwil
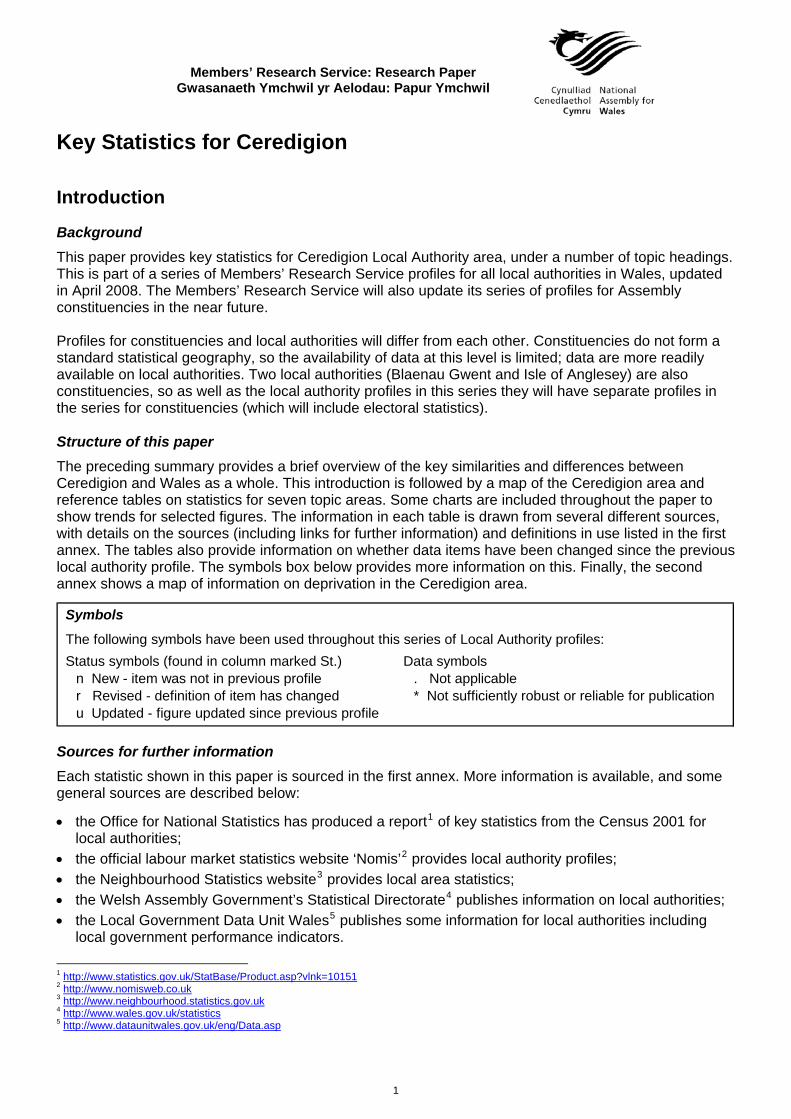
Symbols
The following symbols have been used throughout this series of Local Authority profiles:Status symbols (found in column marked St.) Data symbols
n New - item was not in previous profile . Not applicabler Revised - definition of item has changed * Not sufficiently robust or reu Updated - figure updated since previous profile
Key Statistics for Ceredigion
Introduction
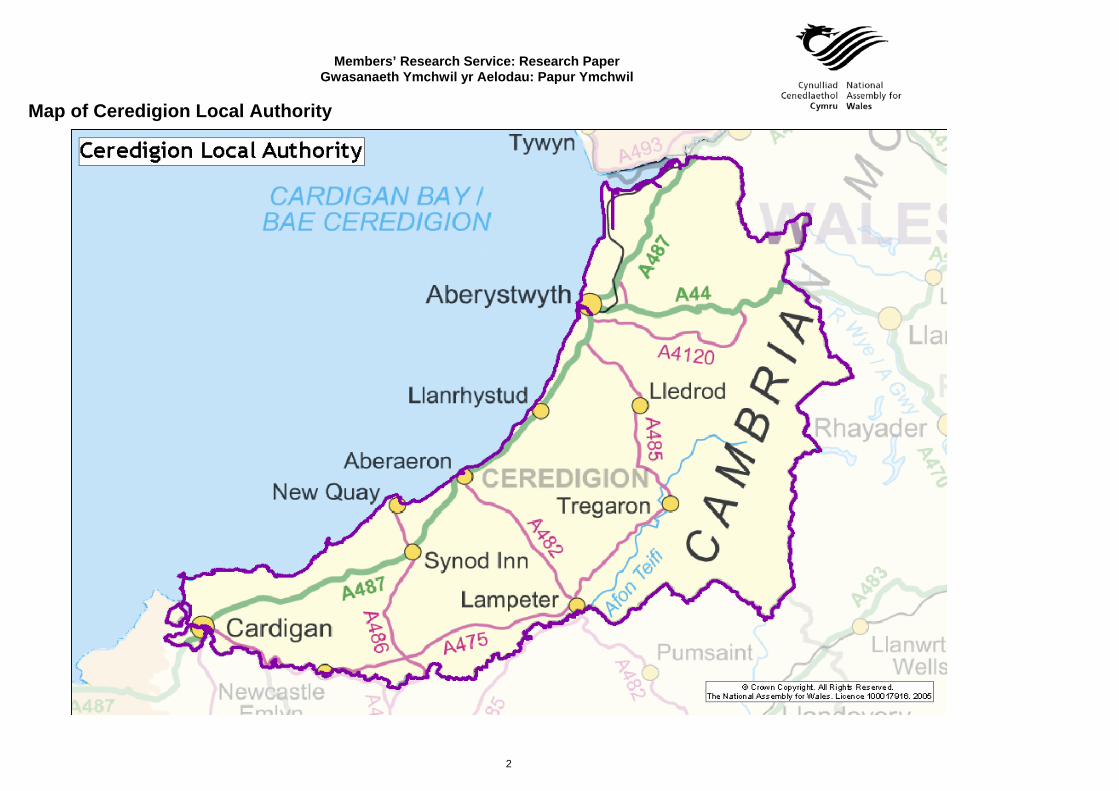
Background This paper provides key statistics for Ceredigion Local Authority area, under a number of topic headings. This is part of a series of Members’ Research Service profiles for all local authorities in Wales, updated in April 2008. The Members’ Research Service will also update its series of profiles for Assembly constituencies in the near future. Profiles for constituencies and local authorities will differ from each other. Constituencies do not form a standard statistical geography, so the availability of data at this level is limited; data are more readily available on local authorities. Two local authorities (Blaenau Gwent and Isle of Anglesey) are also constituencies, so as well as the local authority profiles in this series they will have separate profiles in the series for constituencies (which will include electoral statistics). Structure of this paper The preceding summary provides a brief overview of the key similarities and differences between Ceredigion and Wales as a whole. This introduction is followed by a map of the Ceredigion area and reference tables on statistics for seven topic areas. Some charts are included throughout the paper to show trends for selected figures. The information in each table is drawn from several different sources, with details on the sources (including links for further information) and definitions in use listed in the first annex. The tables also provide information on whether data items have been changed since the previous local authority profile. The symbols box below provides more information on this. Finally, the second annex shows a map of information on deprivation in the Ceredigion area.
liable for publication
Sources for further information Each statistic shown in this paper is sourced in the first annex. More information is available, and some general sources are described below:
• the Office for National Statistics has produced a report1 of key statistics from the Census 2001 for local authorities;
• the official labour market statistics website ‘Nomis’2 provides local authority profiles; • the Neighbourhood Statistics website3 provides local area statistics; • the Welsh Assembly Government’s Statistical Directorate4 publishes information on local authorities; • the Local Government Data Unit Wales5 publishes some information for local authorities including
local government performance indicators.
1 http://www.statistics.gov.uk/StatBase/Product.asp?vlnk=101512 http://www.nomisweb.co.uk3 http://www.neighbourhood.statistics.gov.uk4 http://www.wales.gov.uk/statistics5 http://www.dataunitwales.gov.uk/eng/Data.asp
2
Members’ Research Service: Research Paper Gwasanaeth Ymchwil yr Aelodau: Papur Ymchwil
Map of Ceredigion Local Authority
Members’ Research Service: Research Paper Gwasanaeth Ymchwil yr Aelodau: Papur Ymchwil
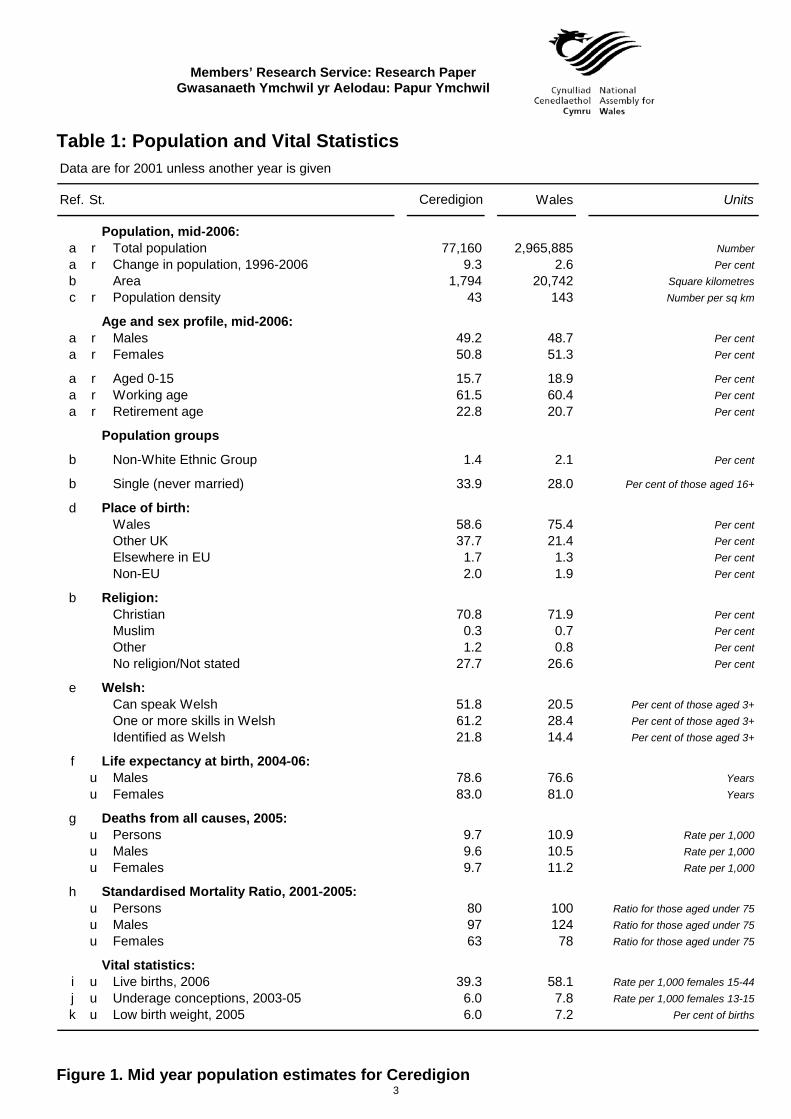
Table 1: Population and Vital Statistics Data are for 2001 unless another year is given
Ref. St. Ceredigion Wales Units
Population, mid-2006:a r Total population 77,160 2,965,885 Numbera r Change in population, 1996-2006 9.3 2.6 Per centb Area 1,794 20,742 Square kilometresc r Population density 43 143 Number per sq km
Age and sex profile, mid-2006:a r Males 49.2 48.7 Per centa r Females 50.8 51.3 Per cent
a r Aged 0-15 15.7 18.9 Per centa r Working age 61.5 60.4 Per centa r Retirement age 22.8 20.7 Per cent
Population groups
b Non-White Ethnic Group 1.4 2.1 Per cent
b Single (never married) 33.9 28.0 Per cent of those aged 16+
d Place of birth:Wales 58.6 75.4 Per centOther UK 37.7 21.4 Per centElsewhere in EU 1.7 1.3 Per centNon-EU 2.0 1.9 Per cent
b Religion:Christian 70.8 71.9 Per centMuslim 0.3 0.7 Per centOther 1.2 0.8 Per centNo religion/Not stated 27.7 26.6 Per cent
e Welsh:Can speak Welsh 51.8 20.5 Per cent of those aged 3+One or more skills in Welsh 61.2 28.4 Per cent of those aged 3+Identified as Welsh 21.8 14.4 Per cent of those aged 3+
f Life expectancy at birth, 2004-06:u Males 78.6 76.6 Yearsu Females 83.0 81.0 Years
g Deaths from all causes, 2005:u Persons 9.7 10.9 Rate per 1,000u Males 9.6 10.5 Rate per 1,000u Females 9.7 11.2 Rate per 1,000
h Standardised Mortality Ratio, 2001-2005:u Persons 80 100 Ratio for those aged under 75u Males 97 124 Ratio for those aged under 75u Females 63 78 Ratio for those aged under 75
Vital statistics:i u Live births, 2006 39.3 58.1 Rate per 1,000 females 15-44j u Underage conceptions, 2003-05 6.0 7.8 Rate per 1,000 females 13-15k u Low birth weight, 2005 6.0 7.2 Per cent of births
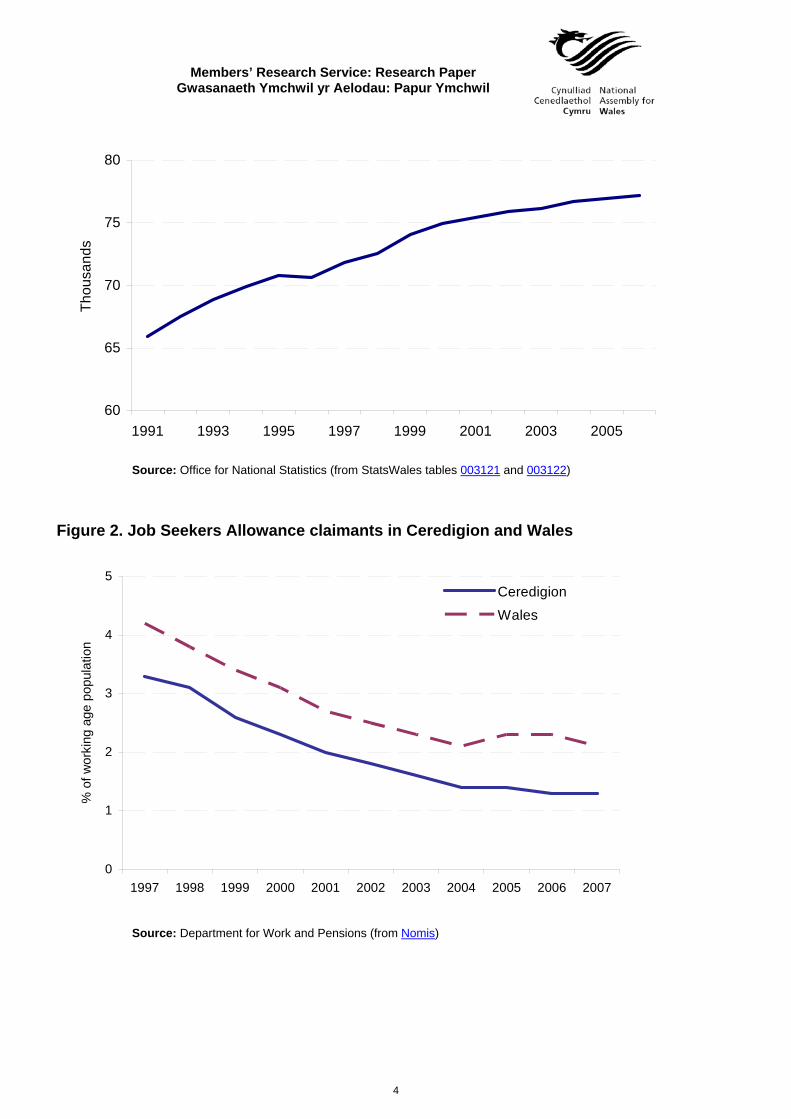
3 Figure 1. Mid year population estimates for Ceredigion
Members’ Research Service: Research Paper Gwasanaeth Ymchwil yr Aelodau: Papur Ymchwil
60
65
70
75
80
1991 1993 1995 1997 1999 2001 2003 2005
Thou
sand
s
Source: Office for National Statistics (from StatsWales tables 003121 and 003122)
Figure 2. Job Seekers Allowance claimants in Ceredigion and Wales
0
1
2
3
4
5
1997 1998 1999 2000 2001 2002 2003 2004 2005 2006 2007
% o
f wor
king
age
pop
ulat
ion
CeredigionWales
Source: Department for Work and Pensions (from Nomis)
4
Members’ Research Service: Research Paper Gwasanaeth Ymchwil yr Aelodau: Papur Ymchwil
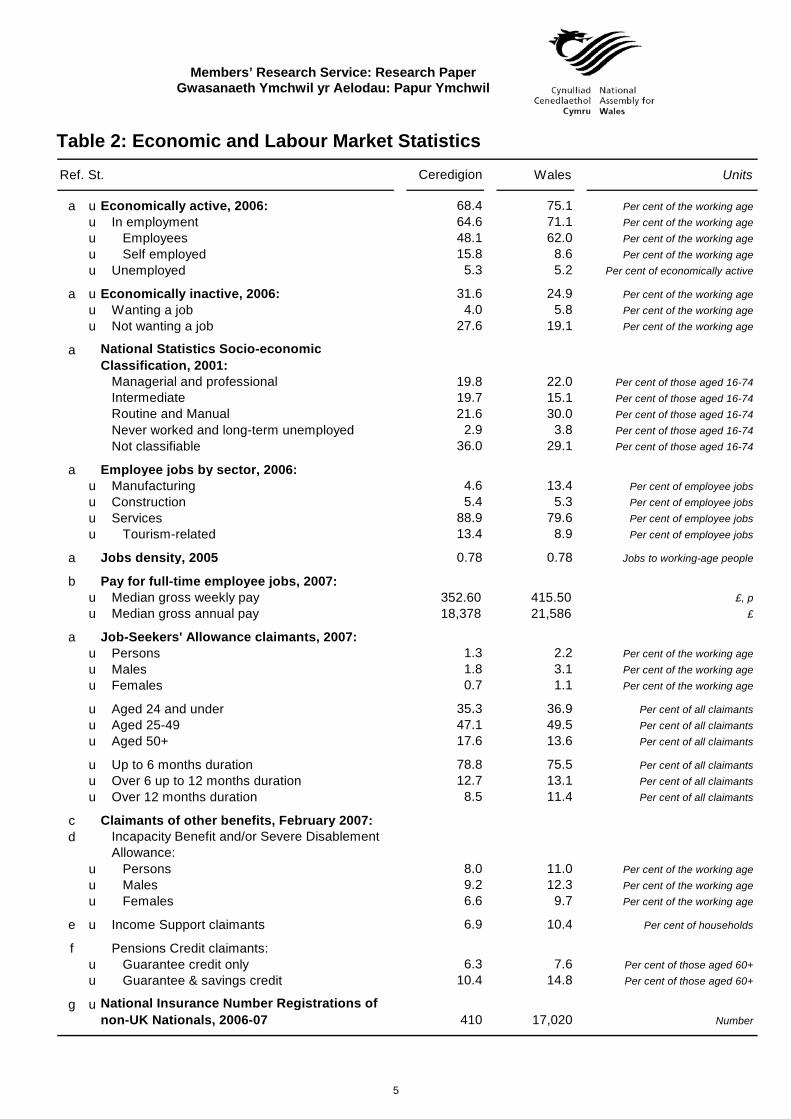
Table 2: Economic and Labour Market Statistics Ref. St. Ceredigion Wales Units
a u Economically active, 2006: 68.4 75.1 Per cent of the working ageu In employment 64.6 71.1 Per cent of the working ageu Employees 48.1 62.0 Per cent of the working ageu Self employed 15.8 8.6 Per cent of the working ageu Unemployed 5.3 5.2 Per cent of economically active
a u Economically inactive, 2006: 31.6 24.9 Per cent of the working ageu Wanting a job 4.0 5.8 Per cent of the working ageu Not wanting a job 27.6 19.1 Per cent of the working age
a National Statistics Socio-economic Classification, 2001:
Managerial and professional 19.8 22.0 Per cent of those aged 16-74Intermediate 19.7 15.1 Per cent of those aged 16-74Routine and Manual 21.6 30.0 Per cent of those aged 16-74Never worked and long-term unemployed 2.9 3.8 Per cent of those aged 16-74Not classifiable 36.0 29.1 Per cent of those aged 16-74
a Employee jobs by sector, 2006:u Manufacturing 4.6 13.4 Per cent of employee jobsu Construction 5.4 5.3 Per cent of employee jobsu Services 88.9 79.6 Per cent of employee jobsu Tourism-related 13.4 8.9 Per cent of employee jobs
a Jobs density, 2005 0.78 0.78 Jobs to working-age people
b Pay for full-time employee jobs, 2007:u Median gross weekly pay 352.60 415.50 £, pu Median gross annual pay 18,378 21,586 £
a Job-Seekers' Allowance claimants, 2007:u Persons 1.3 2.2 Per cent of the working ageu Males 1.8 3.1 Per cent of the working ageu Females 0.7 1.1 Per cent of the working age
u Aged 24 and under 35.3 36.9 Per cent of all claimantsu Aged 25-49 47.1 49.5 Per cent of all claimantsu Aged 50+ 17.6 13.6 Per cent of all claimants
u Up to 6 months duration 78.8 75.5 Per cent of all claimantsu Over 6 up to 12 months duration 12.7 13.1 Per cent of all claimantsu Over 12 months duration 8.5 11.4 Per cent of all claimants
c Claimants of other benefits, February 2007:d Incapacity Benefit and/or Severe Disablement
Allowance:u Persons 8.0 11.0 Per cent of the working ageu Males 9.2 12.3 Per cent of the working ageu Females 6.6 9.7 Per cent of the working age
e u Income Support claimants 6.9 10.4 Per cent of households
f Pensions Credit claimants:u Guarantee credit only 6.3 7.6 Per cent of those aged 60+u Guarantee & savings credit 10.4 14.8 Per cent of those aged 60+
g u National Insurance Number Registrations of non-UK Nationals, 2006-07 410 17,020 Number
5
Members’ Research Service: Research Paper Gwasanaeth Ymchwil yr Aelodau: Papur Ymchwil
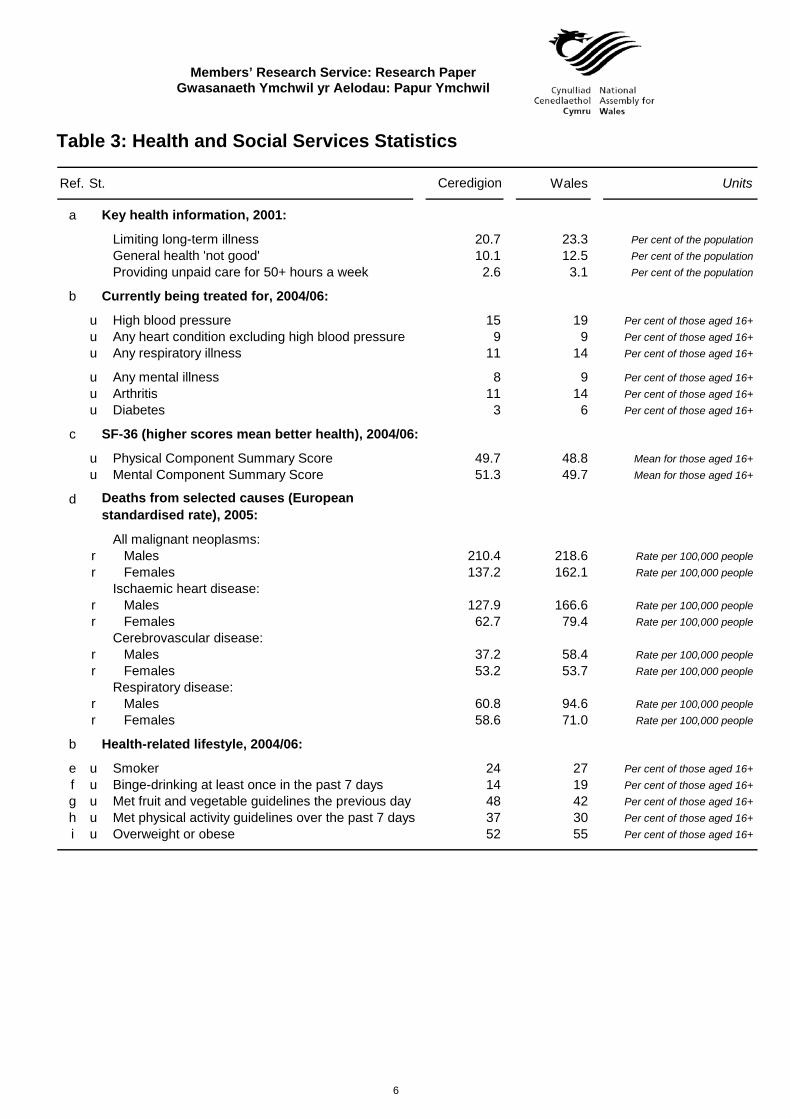
Table 3: Health and Social Services Statistics
Ref. St. Ceredigion Wales Units
a Key health information, 2001:
Limiting long-term illness 20.7 23.3 Per cent of the populationGeneral health 'not good' 10.1 12.5 Per cent of the populationProviding unpaid care for 50+ hours a week 2.6 3.1 Per cent of the population
b Currently being treated for, 2004/06:
u High blood pressure 15 19 Per cent of those aged 16+u Any heart condition excluding high blood pressure 9 9 Per cent of those aged 16+u Any respiratory illness 11 14 Per cent of those aged 16+
u Any mental illness 8 9 Per cent of those aged 16+u Arthritis 11 14 Per cent of those aged 16+u Diabetes 3 6 Per cent of those aged 16+
c SF-36 (higher scores mean better health), 2004/06:
u Physical Component Summary Score 49.7 48.8 Mean for those aged 16+u Mental Component Summary Score 51.3 49.7 Mean for those aged 16+
d Deaths from selected causes (European standardised rate), 2005:
All malignant neoplasms:r Males 210.4 218.6 Rate per 100,000 peopler Females 137.2 162.1 Rate per 100,000 people
Ischaemic heart disease:r Males 127.9 166.6 Rate per 100,000 peopler Females 62.7 79.4 Rate per 100,000 people
Cerebrovascular disease:r Males 37.2 58.4 Rate per 100,000 peopler Females 53.2 53.7 Rate per 100,000 people
Respiratory disease:r Males 60.8 94.6 Rate per 100,000 peopler Females 58.6 71.0 Rate per 100,000 people
b Health-related lifestyle, 2004/06:
e u Smoker 24 27 Per cent of those aged 16+f u Binge-drinking at least once in the past 7 days 14 19 Per cent of those aged 16+g u Met fruit and vegetable guidelines the previous day 48 42 Per cent of those aged 16+h u Met physical activity guidelines over the past 7 days 37 30 Per cent of those aged 16+i u Overweight or obese 52 55 Per cent of those aged 16+
6
Members’ Research Service: Research Paper Gwasanaeth Ymchwil yr Aelodau: Papur Ymchwil
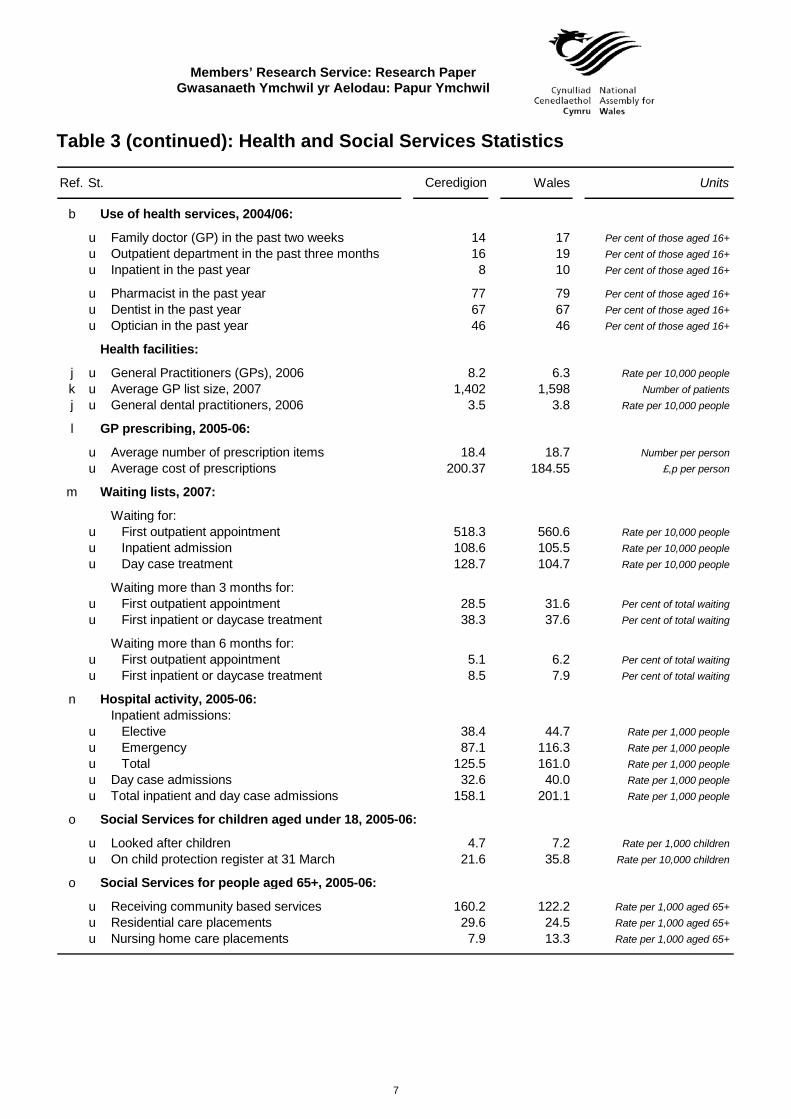
Table 3 (continued): Health and Social Services Statistics
Ref. St. Ceredigion Wales Units
b Use of health services, 2004/06:
u Family doctor (GP) in the past two weeks 14 17 Per cent of those aged 16+u Outpatient department in the past three months 16 19 Per cent of those aged 16+u Inpatient in the past year 8 10 Per cent of those aged 16+
u Pharmacist in the past year 77 79 Per cent of those aged 16+u Dentist in the past year 67 67 Per cent of those aged 16+u Optician in the past year 46 46 Per cent of those aged 16+
Health facilities:
j u General Practitioners (GPs), 2006 8.2 6.3 Rate per 10,000 peoplek u Average GP list size, 2007 1,402 1,598 Number of patientsj u General dental practitioners, 2006 3.5 3.8 Rate per 10,000 people
l GP prescribing, 2005-06:
u Average number of prescription items 18.4 18.7 Number per personu Average cost of prescriptions 200.37 184.55 £,p per person
m Waiting lists, 2007:
Waiting for:u First outpatient appointment 518.3 560.6 Rate per 10,000 peopleu Inpatient admission 108.6 105.5 Rate per 10,000 peopleu Day case treatment 128.7 104.7 Rate per 10,000 people
Waiting more than 3 months for:u First outpatient appointment 28.5 31.6 Per cent of total waitingu First inpatient or daycase treatment 38.3 37.6 Per cent of total waiting
Waiting more than 6 months for:u First outpatient appointment 5.1 6.2 Per cent of total waitingu First inpatient or daycase treatment 8.5 7.9 Per cent of total waiting
n Hospital activity, 2005-06:Inpatient admissions:
u Elective 38.4 44.7 Rate per 1,000 peopleu Emergency 87.1 116.3 Rate per 1,000 peopleu Total 125.5 161.0 Rate per 1,000 peopleu Day case admissions 32.6 40.0 Rate per 1,000 peopleu Total inpatient and day case admissions 158.1 201.1 Rate per 1,000 people
o Social Services for children aged under 18, 2005-06:
u Looked after children 4.7 7.2 Rate per 1,000 childrenu On child protection register at 31 March 21.6 35.8 Rate per 10,000 children
o Social Services for people aged 65+, 2005-06:
u Receiving community based services 160.2 122.2 Rate per 1,000 aged 65+u Residential care placements 29.6 24.5 Rate per 1,000 aged 65+u Nursing home care placements 7.9 13.3 Rate per 1,000 aged 65+
7
Members’ Research Service: Research Paper Gwasanaeth Ymchwil yr Aelodau: Papur Ymchwil
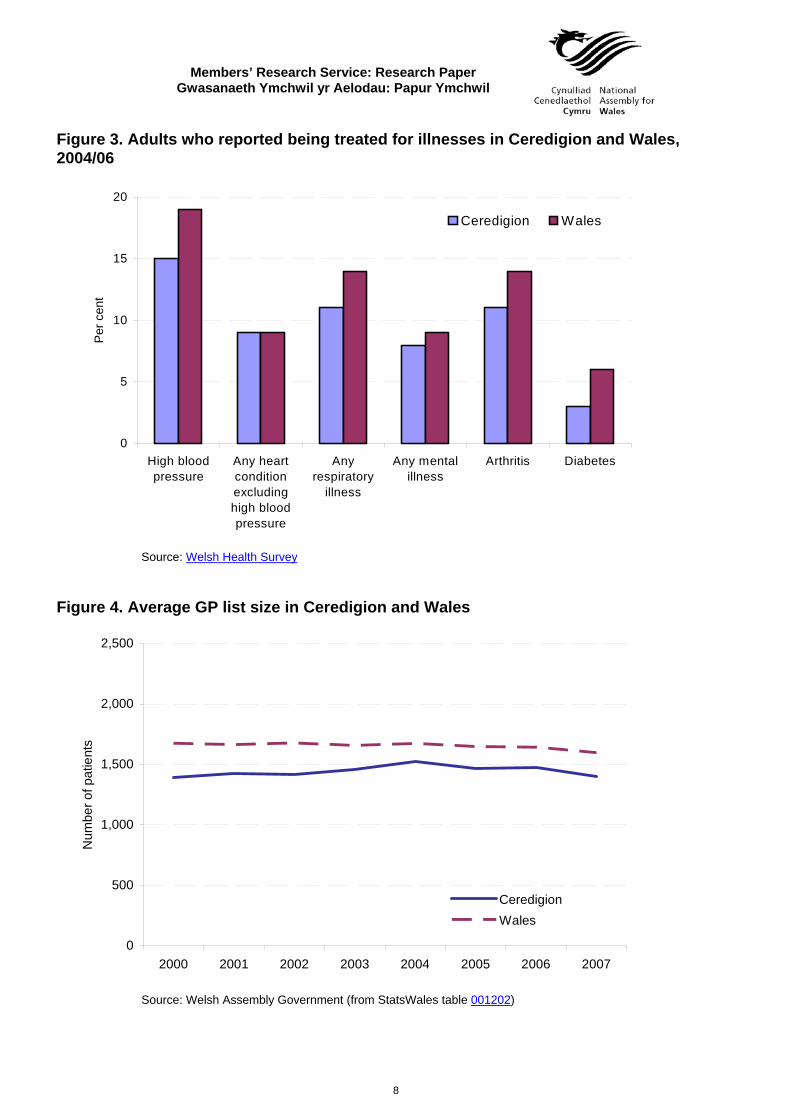
Figure 3. Adults who reported being treated for illnesses in Ceredigion and Wales, 2004/06
0
5
10
15
20
High bloodpressure
Any heartconditionexcludinghigh bloodpressure
Anyrespiratory
illness
Any mentalillness
Arthritis Diabetes
Per
cen
t
Ceredigion Wales
Source: Welsh Health Survey
Figure 4. Average GP list size in Ceredigion and Wales
0
500
1,000
1,500
2,000
2,500
2000 2001 2002 2003 2004 2005 2006 2007
Num
ber o
f pat
ient
s
CeredigionWales
Source: Welsh Assembly Government (from StatsWales table 001202)
8
Members’ Research Service: Research Paper Gwasanaeth Ymchwil yr Aelodau: Papur Ymchwil
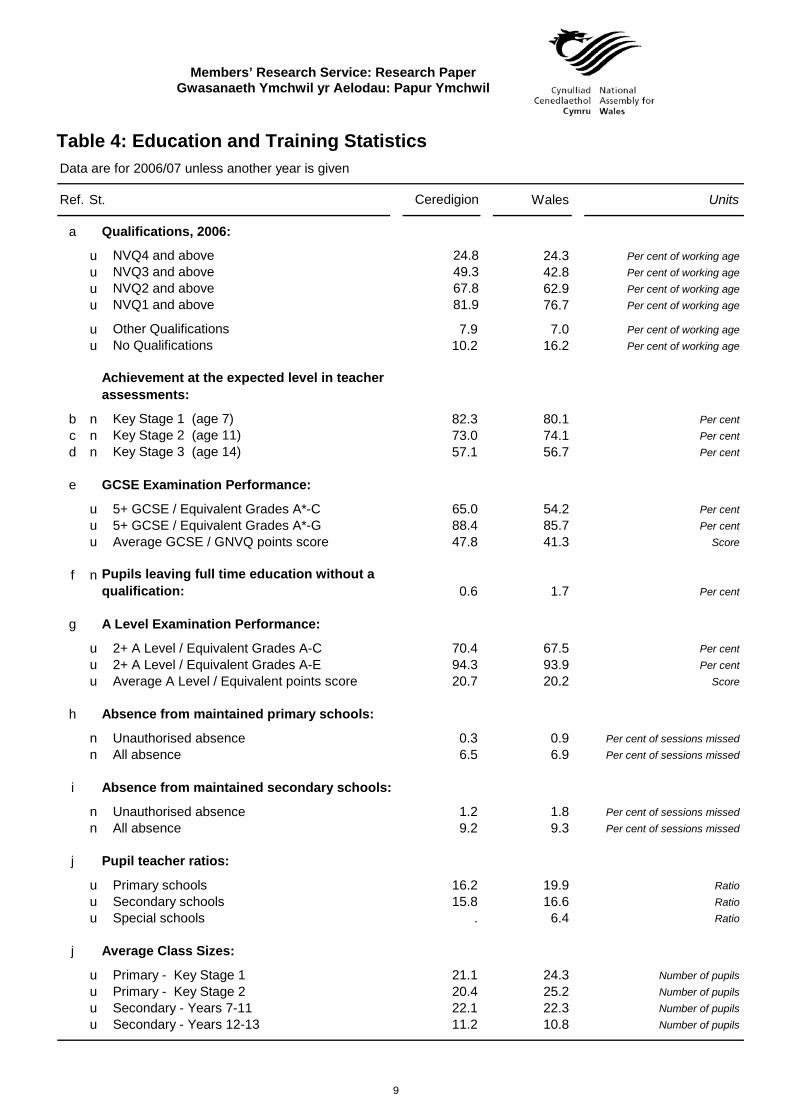
Table 4: Education and Training Statistics Data are for 2006/07 unless another year is given
Ref. St. Ceredigion Wales Units
a Qualifications, 2006:
u NVQ4 and above 24.8 24.3 Per cent of working ageu NVQ3 and above 49.3 42.8 Per cent of working ageu NVQ2 and above 67.8 62.9 Per cent of working ageu NVQ1 and above 81.9 76.7 Per cent of working age
u Other Qualifications 7.9 7.0 Per cent of working ageu No Qualifications 10.2 16.2 Per cent of working age
Achievement at the expected level in teacher assessments:
b n Key Stage 1 (age 7) 82.3 80.1 Per centc n Key Stage 2 (age 11) 73.0 74.1 Per centd n Key Stage 3 (age 14) 57.1 56.7 Per cent
e GCSE Examination Performance:
u 5+ GCSE / Equivalent Grades A*-C 65.0 54.2 Per centu 5+ GCSE / Equivalent Grades A*-G 88.4 85.7 Per centu Average GCSE / GNVQ points score 47.8 41.3 Score
f n Pupils leaving full time education without a qualification: 0.6 1.7 Per cent
g A Level Examination Performance:
u 2+ A Level / Equivalent Grades A-C 70.4 67.5 Per centu 2+ A Level / Equivalent Grades A-E 94.3 93.9 Per centu Average A Level / Equivalent points score 20.7 20.2 Score
h Absence from maintained primary schools:
n Unauthorised absence 0.3 0.9 Per cent of sessions missedn All absence 6.5 6.9 Per cent of sessions missed
i Absence from maintained secondary schools:
n Unauthorised absence 1.2 1.8 Per cent of sessions missedn All absence 9.2 9.3 Per cent of sessions missed
j Pupil teacher ratios:
u Primary schools 16.2 19.9 Ratiou Secondary schools 15.8 16.6 Ratiou Special schools . 6.4 Ratio
j Average Class Sizes:
u Primary - Key Stage 1 21.1 24.3 Number of pupilsu Primary - Key Stage 2 20.4 25.2 Number of pupilsu Secondary - Years 7-11 22.1 22.3 Number of pupilsu Secondary - Years 12-13 11.2 10.8 Number of pupils
9
Members’ Research Service: Research Paper Gwasanaeth Ymchwil yr Aelodau: Papur Ymchwil
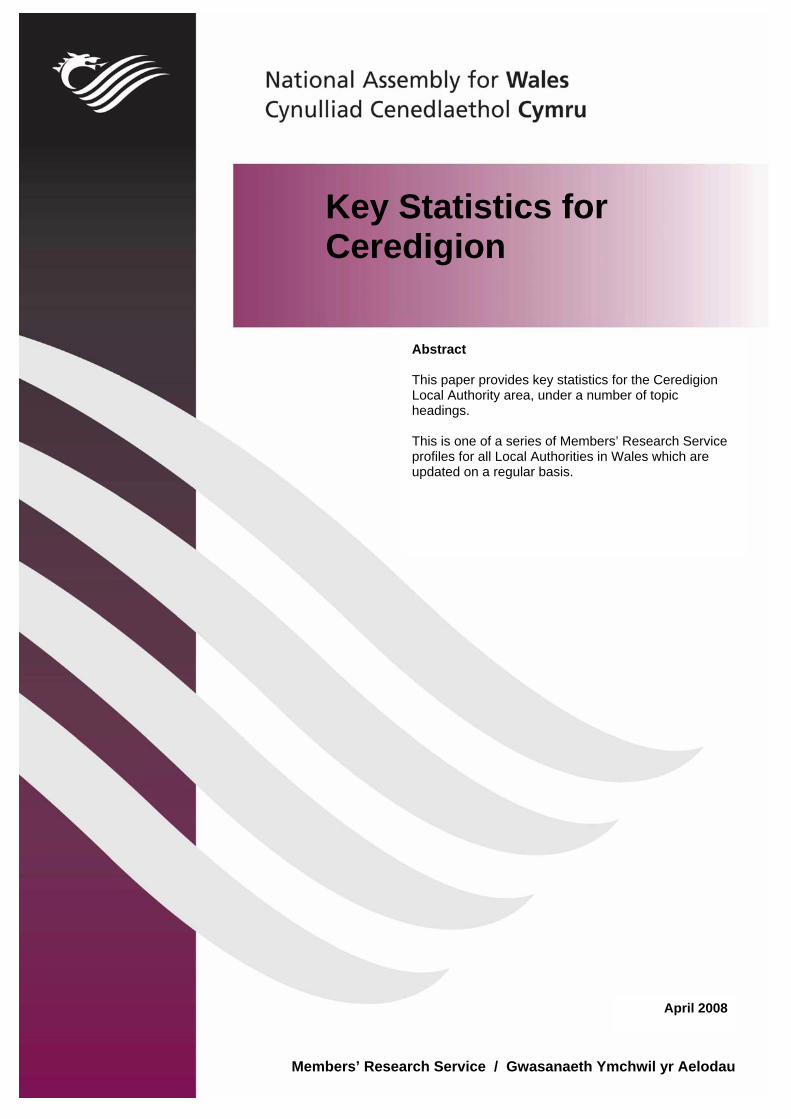
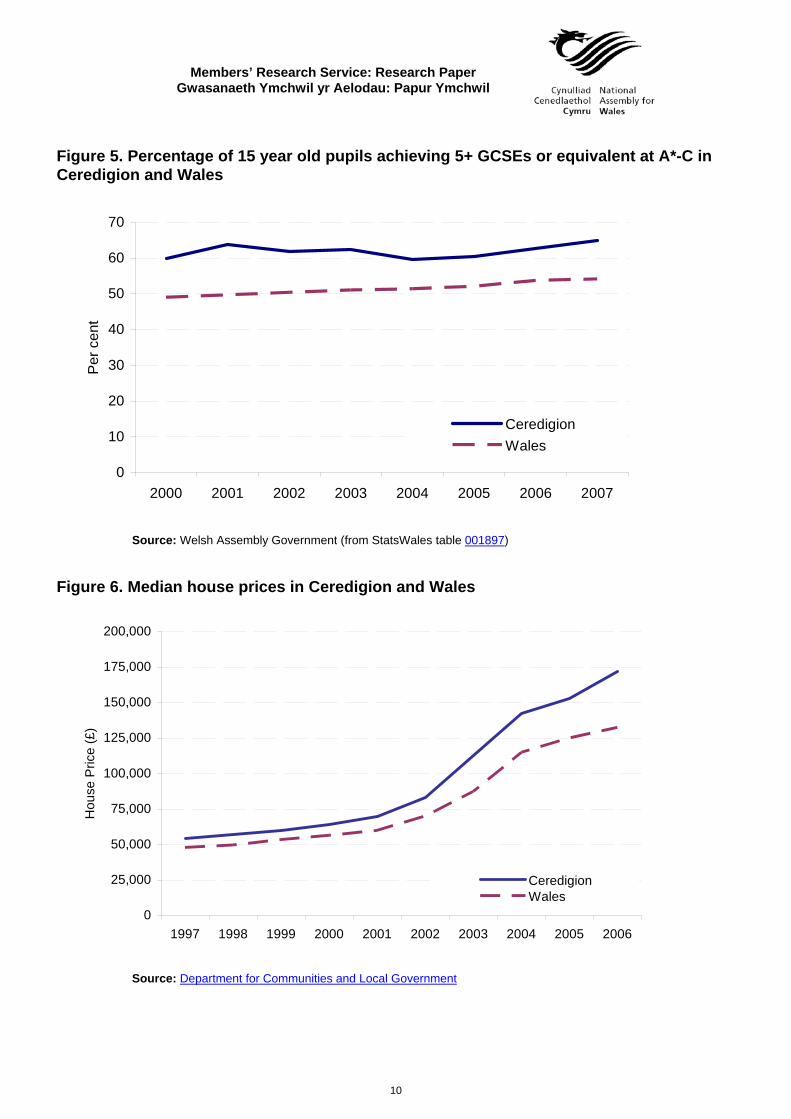
Figure 5. Percentage of 15 year old pupils achieving 5+ GCSEs or equivalent at A*-C in Ceredigion and Wales
0
10
20
30
40
50
60
70
2000 2001 2002 2003 2004 2005 2006 2007
Per
cen
t
CeredigionWales
Source: Welsh Assembly Government (from StatsWales table 001897)
Figure 6. Median house prices in Ceredigion and Wales
0
25,000
50,000
75,000
100,000
125,000
150,000
175,000
200,000
1997 1998 1999 2000 2001 2002 2003 2004 2005 2006
Hou
se P
rice
(£)
CeredigionWales
Source: Department for Communities and Local Government
10
Members’ Research Service: Research Paper Gwasanaeth Ymchwil yr Aelodau: Papur Ymchwil
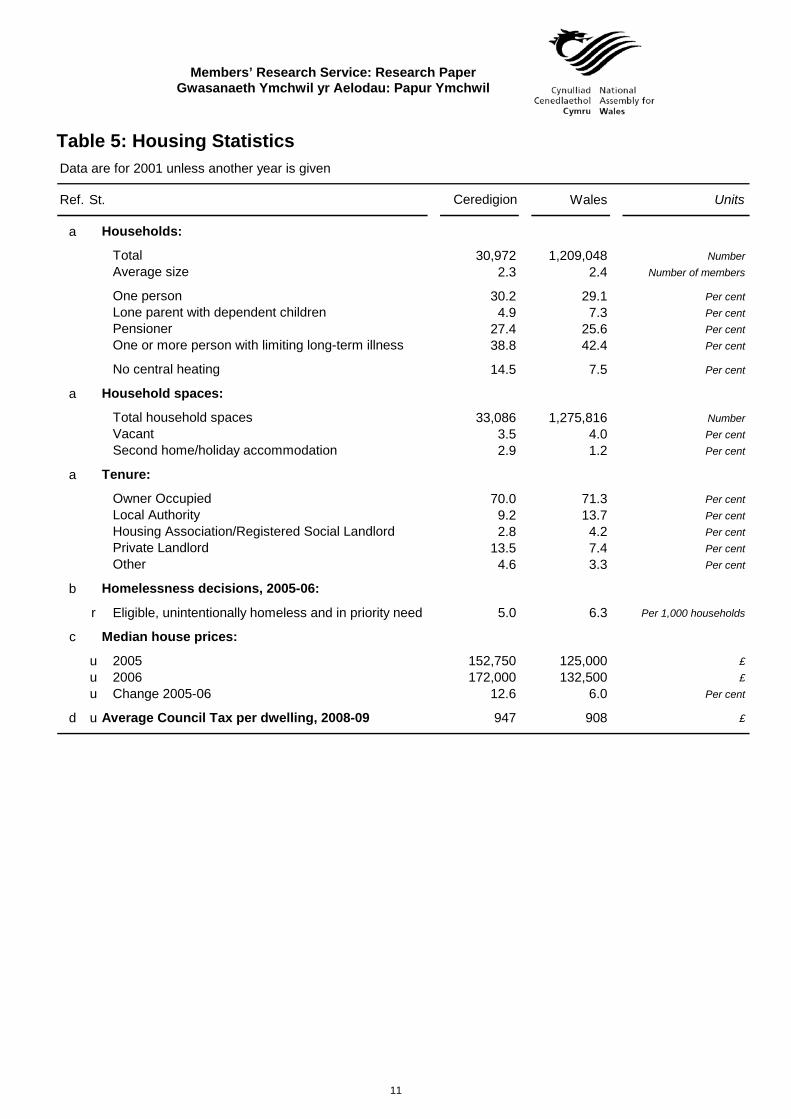
Table 5: Housing Statistics Data are for 2001 unless another year is given
Ref. St. Ceredigion Wales Units
a Households:
Total 30,972 1,209,048 NumberAverage size 2.3 2.4 Number of members
One person 30.2 29.1 Per centLone parent with dependent children 4.9 7.3 Per centPensioner 27.4 25.6 Per centOne or more person with limiting long-term illness 38.8 42.4 Per cent
No central heating 14.5 7.5 Per cent
a Household spaces:
Total household spaces 33,086 1,275,816 NumberVacant 3.5 4.0 Per centSecond home/holiday accommodation 2.9 1.2 Per cent
a Tenure:
Owner Occupied 70.0 71.3 Per centLocal Authority 9.2 13.7 Per centHousing Association/Registered Social Landlord 2.8 4.2 Per centPrivate Landlord 13.5 7.4 Per centOther 4.6 3.3 Per cent
b Homelessness decisions, 2005-06:
r Eligible, unintentionally homeless and in priority need 5.0 6.3 Per 1,000 households
c Median house prices:
u 2005 152,750 125,000 £u 2006 172,000 132,500 £u Change 2005-06 12.6 6.0 Per cent
d u Average Council Tax per dwelling, 2008-09 947 908 £
11
Members’ Research Service: Research Paper Gwasanaeth Ymchwil yr Aelodau: Papur Ymchwil
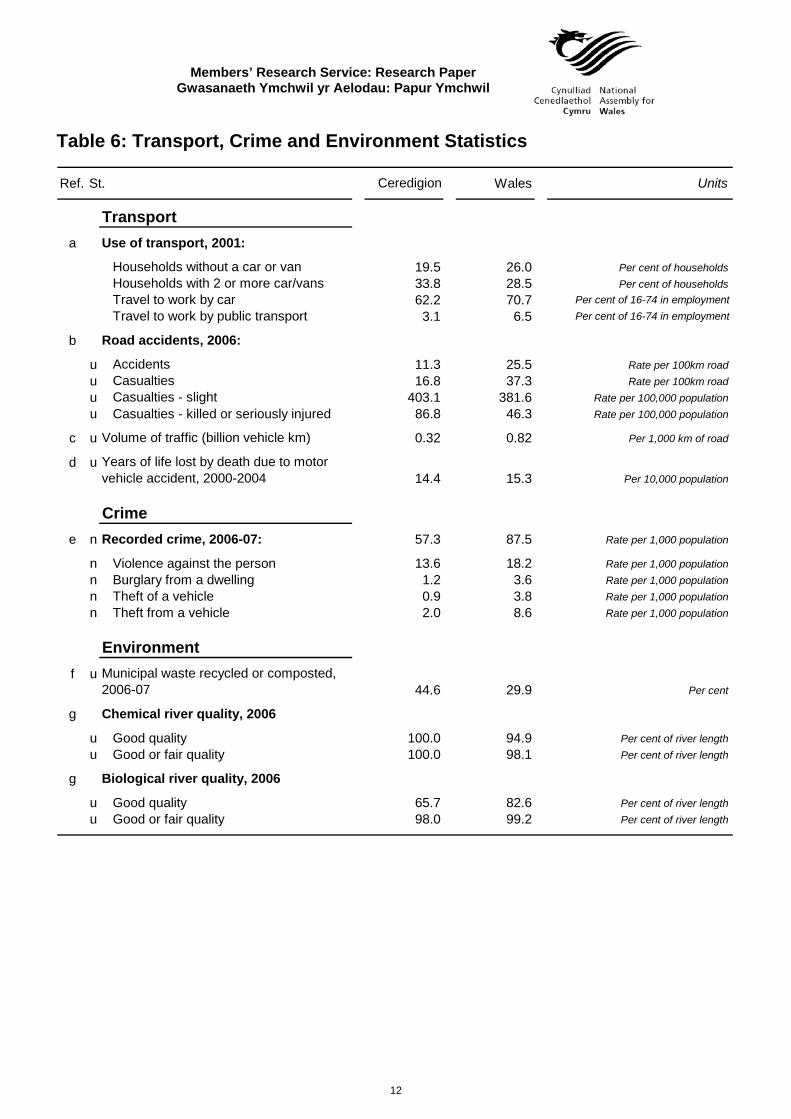
Table 6: Transport, Crime and Environment Statistics
Ref. St. Ceredigion Wales Units
Transporta Use of transport, 2001:
Households without a car or van 19.5 26.0 Per cent of householdsHouseholds with 2 or more car/vans 33.8 28.5 Per cent of householdsTravel to work by car 62.2 70.7 Per cent of 16-74 in employmentTravel to work by public transport 3.1 6.5 Per cent of 16-74 in employment
b Road accidents, 2006:
u Accidents 11.3 25.5 Rate per 100km roadu Casualties 16.8 37.3 Rate per 100km roadu Casualties - slight 403.1 381.6 Rate per 100,000 populationu Casualties - killed or seriously injured 86.8 46.3 Rate per 100,000 population
c u Volume of traffic (billion vehicle km) 0.32 0.82 Per 1,000 km of road
d u Years of life lost by death due to motor vehicle accident, 2000-2004 14.4 15.3 Per 10,000 population
Crimee n Recorded crime, 2006-07: 57.3 87.5 Rate per 1,000 population
n Violence against the person 13.6 18.2 Rate per 1,000 populationn Burglary from a dwelling 1.2 3.6 Rate per 1,000 populationn Theft of a vehicle 0.9 3.8 Rate per 1,000 populationn Theft from a vehicle 2.0 8.6 Rate per 1,000 population
Environmentf u Municipal waste recycled or composted,
2006-07 44.6 29.9 Per cent
g Chemical river quality, 2006
u Good quality 100.0 94.9 Per cent of river lengthu Good or fair quality 100.0 98.1 Per cent of river length
g Biological river quality, 2006
u Good quality 65.7 82.6 Per cent of river lengthu Good or fair quality 98.0 99.2 Per cent of river length
12
Members’ Research Service: Research Paper Gwasanaeth Ymchwil yr Aelodau: Papur Ymchwil
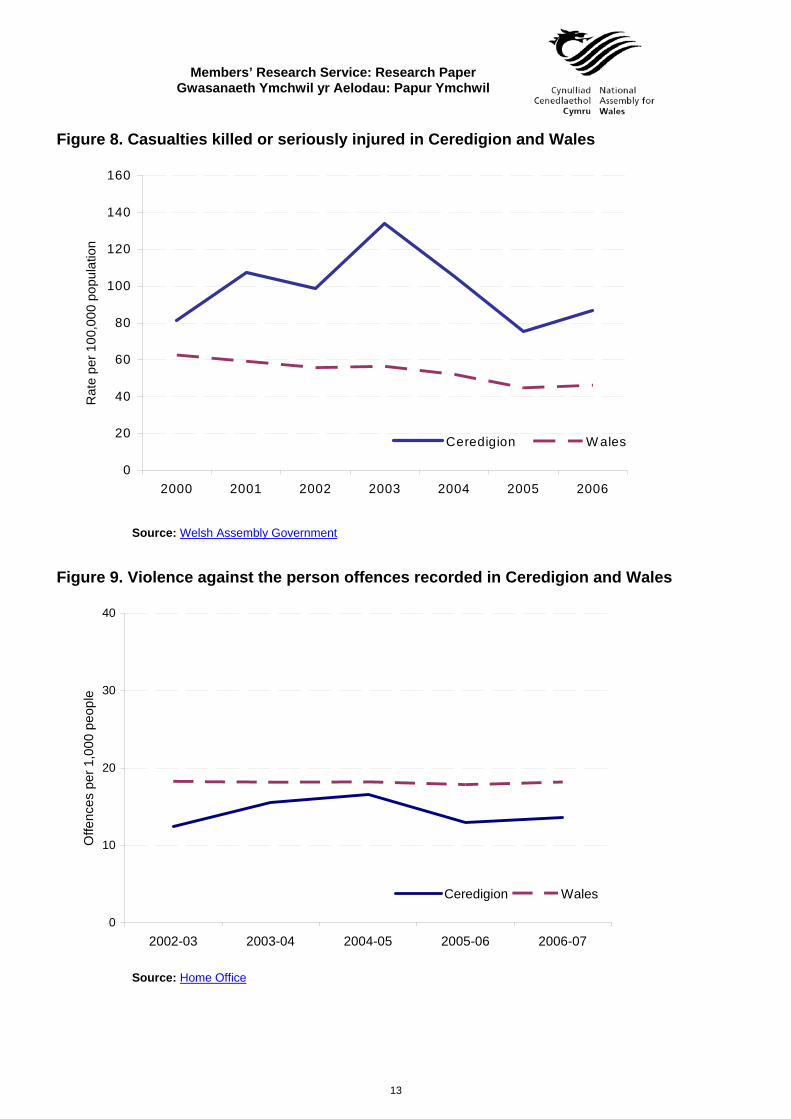
Figure 8. Casualties killed or seriously injured in Ceredigion and Wales
0
20
40
60
80
100
120
140
160
2000 2001 2002 2003 2004 2005 2006
Rat
e pe
r 100
,000
pop
ulat
ion
Ceredigion W ales
Source: Welsh Assembly Government
Figure 9. Violence against the person offences recorded in Ceredigion and Wales
0
10
20
30
40
2002-03 2003-04 2004-05 2005-06 2006-07
Offe
nces
per
1,0
00 p
eopl
e
Ceredigion Wales
Source: Home Office
13
Members’ Research Service: Research Paper Gwasanaeth Ymchwil yr Aelodau: Papur Ymchwil
Deprivation Statistics
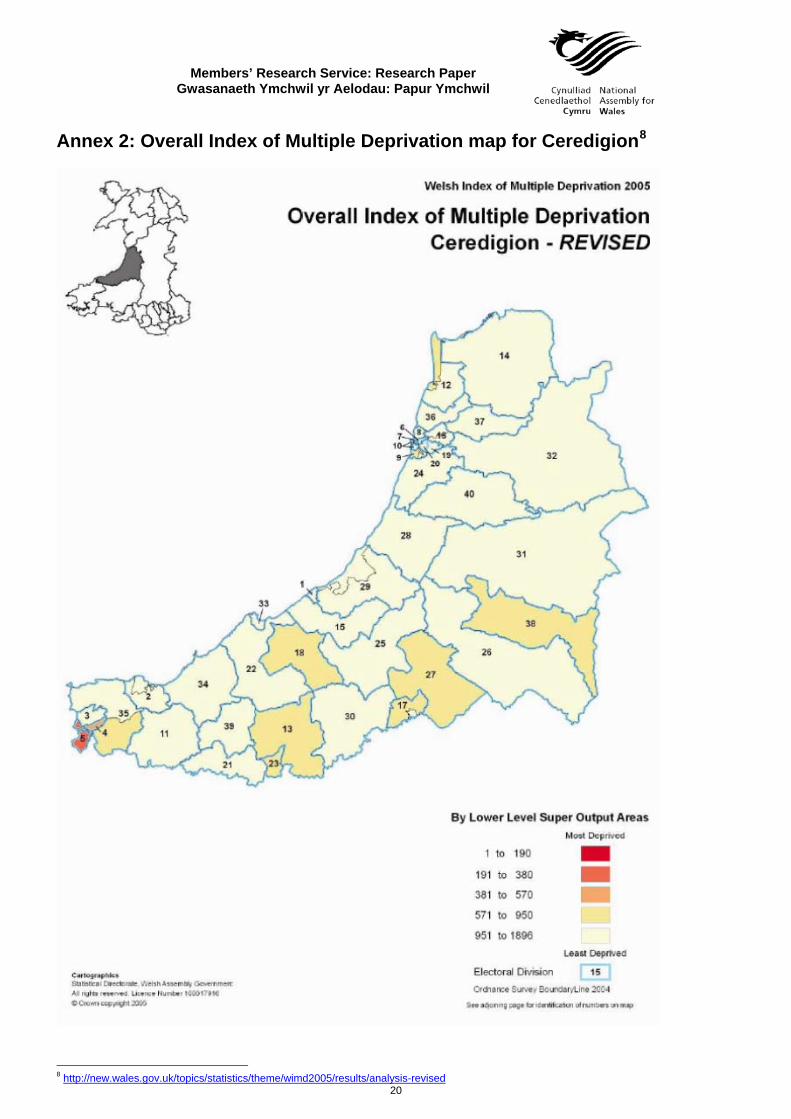
The Welsh Index of Multiple Deprivation 2005 (WIMD6) is a measure of deprivation for small areas in Wales. It ranks statistical geographies known as Lower Super Output Areas (LSOAs) in terms of deprivation across various domains such as health and employment, as well as providing an overall deprivation rank. Although WIMD does not provide deprivation ranks for local authorities as a whole it is possible to look at the rank of LSOAs within a local authority.
In Ceredigion (which has 47 LSOAs):
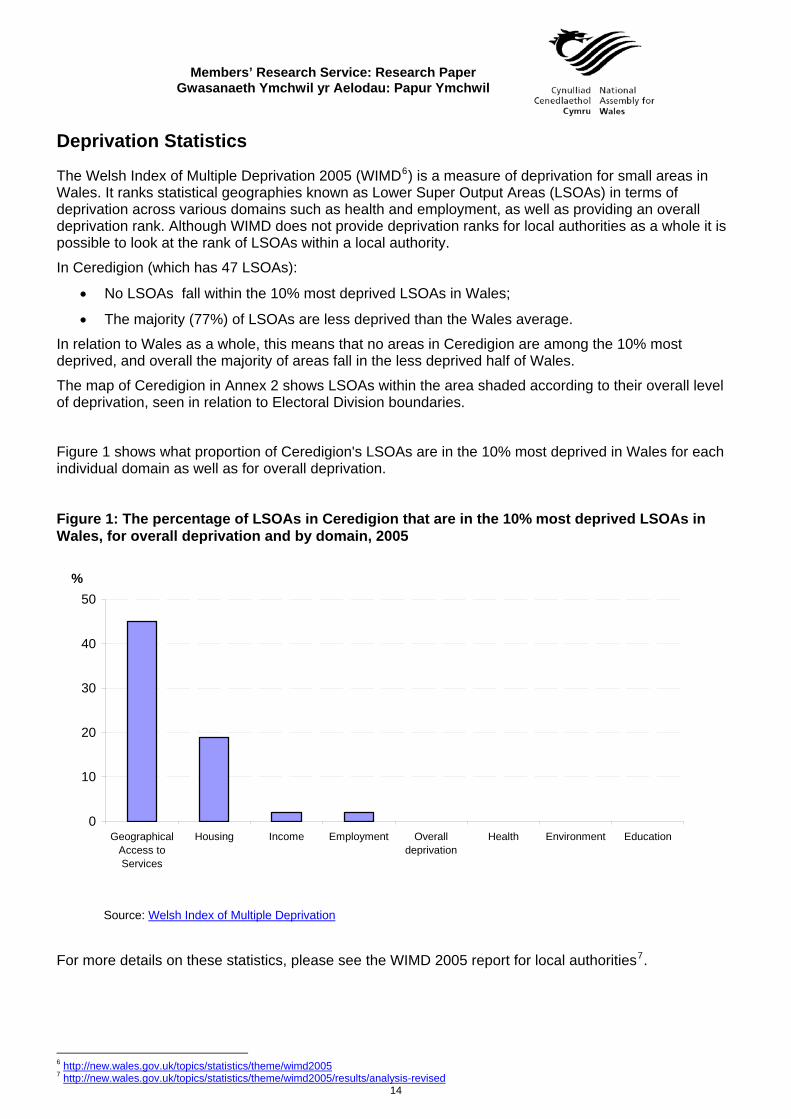
• No LSOAs fall within the 10% most deprived LSOAs in Wales;
• The majority (77%) of LSOAs are less deprived than the Wales average.
In relation to Wales as a whole, this means that no areas in Ceredigion are among the 10% most deprived, and overall the majority of areas fall in the less deprived half of Wales.
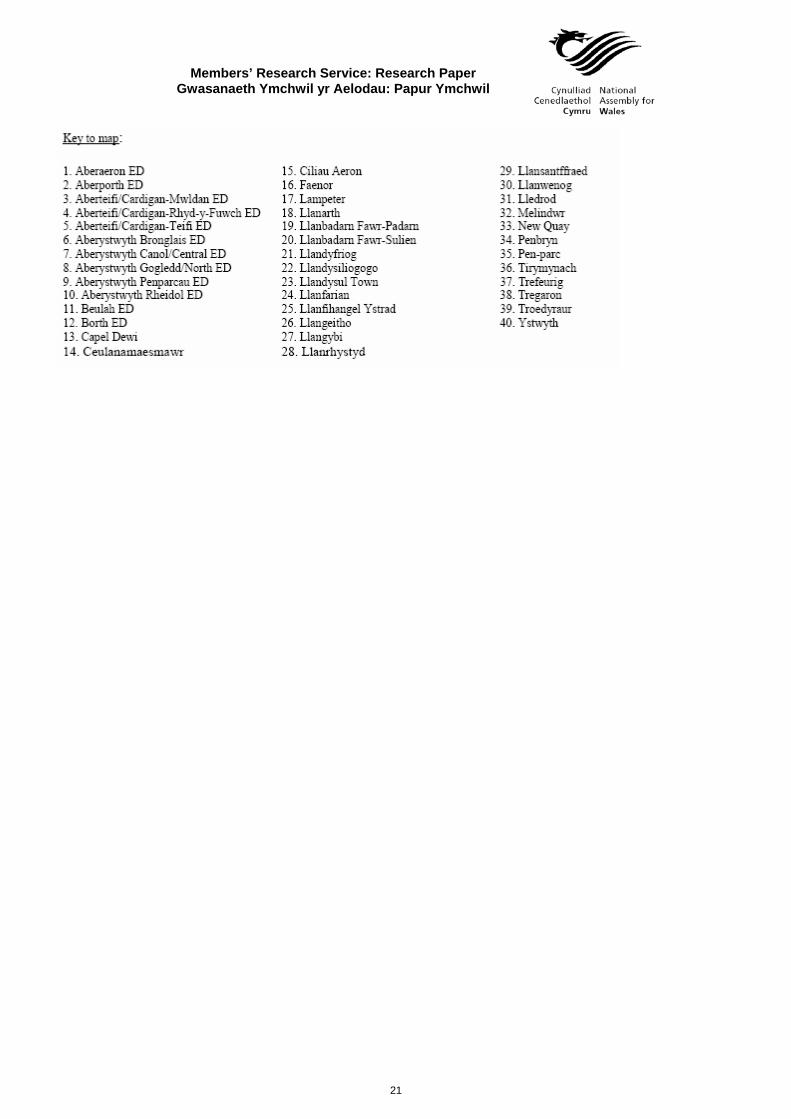
The map of Ceredigion in Annex 2 shows LSOAs within the area shaded according to their overall level of deprivation, seen in relation to Electoral Division boundaries.
Figure 1 shows what proportion of Ceredigion's LSOAs are in the 10% most deprived in Wales for each individual domain as well as for overall deprivation.
Figure 1: The percentage of LSOAs in Ceredigion that are in the 10% most deprived LSOAs in Wales, for overall deprivation and by domain, 2005
0
10
20
30
40
50
GeographicalAccess toServices
Housing Income Employment Overalldeprivation
Health Environment Education
%
Source: Welsh Index of Multiple Deprivation
For more details on these statistics, please see the WIMD 2005 report for local authorities7.
6 http://new.wales.gov.uk/topics/statistics/theme/wimd2005
14 7 http://new.wales.gov.uk/topics/statistics/theme/wimd2005/results/analysis-revised
Members’ Research Service: Research Paper Gwasanaeth Ymchwil yr Aelodau: Papur Ymchwil
15
Annex 1: Sources and Notes
Small discrepancies in Census statistics In the sources listed above, similar Census statistics may be available from more than one table, and there are rare but occasional discrepancies in counts between tables. For example the counts of households in table KS16 (household spaces and accommodation type) and KS20 (household composition) differ by one or two households (out of a typical 50,000) for some local authorities. This is usually because cells in tables are randomly adjusted to avoid the release of confidential data. Ref Source & Notes Table 1: Population and Vital Statistics 1-a StatsWales (tables 003121 and 003122) - 1996 and 2006 mid year estimates of the population http://www.statswales.wales.gov.uk/TableViewer/tableView.aspx?ReportId=3121 http://www.statswales.wales.gov.uk/TableViewer/tableView.aspx?ReportId=31221-b Neighbourhood Statistics, 2001 Census: Key Statistics (tables KS01, KS04, KS06A & KS07) http://www.neighbourhood.statistics.gov.uk/dissemination/ Area measurements are based on the 2001 version of the Ordnance Survey Boundary-Line data-set, amended
where district boundaries have changed since 2001, and do not include inland water. Area is on Census Day (29th April 2001).
‘Non-white ethnic group’ includes people from a mixed white-other ethnic group. 1-c Figures are constructed from area measurements from 2001 Census table KS01 and mid 2006 estimates of the
population. 1-d Neighbourhood Statistics, 2001 Census: Key Statistics (table KS05) http://www.neighbourhood.statistics.gov.uk/dissemination/ The EU is as defined on Census day (29 April 2001). 1-e Neighbourhood Statistics, 2001 Census: Key Statistics (table KS06A & KS25) http://www.neighbourhood.statistics.gov.uk/dissemination/ One or more skills in Welsh means speaks, reads, writes and/or understands Welsh. Identified as Welsh means those who have written 'Welsh' or 'Cymraeg' or similar in one or more of the write-in
boxes in the ethnic group question. 1-f StatsWales (table 003311) http://www.statswales.wales.gov.uk/TableViewer/tableView.aspx?ReportId=3816 The figures are constructed from the estimated population and total deaths by single year/quinary age each
year, based on a three year average. The "expected years of life" is the lifetime of a newborn person, if they were subject throughout their lives to the average recorded death rate of the three year period. Such a calculation excludes future improvements to mortality rates.
1-g StatsWales (table 003384) http://www.statswales.wales.gov.uk/TableViewer/tableView.aspx?ReportId=3384 Death rate is calculated as the number of deaths occurring in each calendar year per 1,000 residents, estimated
at 30 June of each year. 1-h StatsWales (table 003396) http://www.statswales.wales.gov.uk/TableViewer/tableView.aspx?ReportId=3396 Standardised Mortality Ratios are calculated as the number of actual deaths in each area in a given period of
years, as a percentage of deaths which would have been expected if the local population had experienced the age-specific mortality rates in Wales as a whole during that period.
1-i ONS, Births 2006 http://www.statistics.gov.uk/statbase/Product.asp?vlnk=144081-j ONS, Underage conceptions: Numbers and rates by area of usual residence and outcome, 2000-02 and 2003-
05 http://www.statistics.gov.uk/statbase/ssdataset.asp?vlnk=9571&More=Y Underage means aged under 16 years old. Numbers and rates for 2005 conceptions are provisional. 1-k Health Statistics Wales 2007 (table 1.6)
Members’ Research Service: Research Paper Gwasanaeth Ymchwil yr Aelodau: Papur Ymchwil
16
http://new.wales.gov.uk/topics/statistics/publications/publication-archive/hsw2007/ Live and still births under 2,500g per 100 births with a stated birth weight. Table 2: Economic and Labour Market Statistics 2-a NOMIS official labour market statistics http://www.nomisweb.co.uk/ https://www.nomisweb.co.uk/reports/lmp/la/2038432105/report.aspx?town=ceredigion Information on economically active/inactive from the Annual Population Survey January - December 2006. Information on the National Statistics Socio-economic Classification is from Census Area Statistics table
CAS042. The 3 class version is used, for further details please see the link below: http://www.statistics.gov.uk/nsbase/methods_quality/ns_sec/downloads/NS-SEC_User.pdf Information on employee jobs is from the Annual Business Inquiry employee analysis 2006, included in the Local
Authority profile at April 2008. Tourism-related jobs are a subset of the Services category. Information on jobs density is from Jobs Density 2005, included in the Local Authority profile at April 2008. Jobs
density is the total number of filled jobs in an area divided by the resident population of working age in that area. The number of jobs in an area is composed of jobs done by residents (of any age) and jobs done by workers (of any age) who commute into the area. The working-age population comprises residents of working age who work in the area plus workers of working age who commute out of the area to work in other areas and those who are unemployed or economically inactive of working age.
JSA claimant counts averaged over the twelve month period January - December 2007. 2-b ONS, 2007 Annual Survey of Hours and Earnings (tables 8.1a & 8.7a) http://www.statistics.gov.uk/ashe The median is the value with half of all values above and half below (i.e.: the middle value). 2-c Department for Work and Pensions (DWP) Tabulation Tool http://www.dwp.gov.uk/asd/tabtool.asp2-d DWP, Working age claimants of incapacity benefits, February 2007 http://83.244.183.180/100pc/wapop/ccla/ccstatgp/a_cnpop_r_ccla_c_ccstatgp_feb07.html Includes those receiving Incapacity Benefit or Severe Disablement Allowance. Incapacity Benefit is paid to
people who are assessed as being incapable of work and who meet certain contribution conditions. Until April 2001, people who were incapable of work and did not satisfy the contribution conditions for Incapacity Benefit could get Severe Disablement Allowance.
2-e DWP, Income Support, February 2007 http://83.244.183.180/100pc/is/ccla/ccgor/a_carate_r_ccla_c_ccgor_feb07.html Income Support is intended to help people on low incomes who do not have to be available for employment. The
main types of people who receive it are lone parents, the long and short-term sick, people with disabilities and other special groups. Rates are calculated using 2001 Census estimates of numbers of households from http://www.neighbourhood.statistics.gov.uk/dissemination/ (table KS16).
2-f DWP, Pension Credit, February 2007 http://83.244.183.180/100pc/pc/ccla/pctype/a_benefic_r_ccla_c_pctype_feb07.html Pension Credit is designed to help pensioners at the lower end of the income scale by ensuring a guaranteed
minimum weekly income (guaranteed credit) and, in addition, to reward those people who have made modest provision for their retirement (savings credit). Rates are calculated using mid-2006 estimates of the population aged 60+, from StatsWales table 003122.
2-g DWP, National Insurance Number (NINo) Registrations of non-UK Nationals, 2006-07 100% sample at 14 May 2007 from the National Insurance Recording System (NIRS). Numbers are rounded to
the nearest ten. Local Authority counts are based on the most recently recorded address of the NINo recipient, assigned to an Authority by matching postcodes against the relevant postcode directory.
Information supplied by DWP. See the following DWP report for further information on NINo allocations made to overseas nationals entering the UK.
http://www.dwp.gov.uk/asd/asd1/niall/registration_tables2007.xls Table 3: Health and Social Services Statistics 3-a Neighbourhood Statistics, 2001 Census: Key Statistics (table KS08) http://www.neighbourhood.statistics.gov.uk/dissemination/3-b Welsh Health Survey, 2004/06 http://new.wales.gov.uk/topics/statistics/publications/health-survey200506/?lang=en
Members’ Research Service: Research Paper Gwasanaeth Ymchwil yr Aelodau: Papur Ymchwil
17
Figures for local authorities are based on a sample of between 1,100 and 2,200 adults. Results are age-standardised, to take account of possible differences in the age distributions of areas being
compared. Data collection is through self-completion questionnaire, so results reflect people's own understanding of their
health rather than a clinical assessment of their medical condition. 3-c See source and notes at 3-b. The SF-36 is a standard set of 36 health status questions asking respondents about their own perception of their
physical and mental health and the impact it has on their daily lives. Responses can be combined to produce summary scores for both physical and mental health. For further details, please see the Welsh Health Survey link above, or:
www.sf-36.org3-d Health Statistics Wales 2007 (table 1.13) http://new.wales.gov.uk/topics/statistics/publications/publication-archive/hsw2007/ European standardised death rates are a way of comparing death rates for populations whose age and sex
distribution vary. It eliminates from the trends the increase or decrease that may be due to changes in the age/sex structure of the population. In this case they are calculated by applying the age-specific death rates for 5 year age bands and by sex for the Welsh population in a given year to a standard European population to estimate the rates for the standard population had the Welsh age-specific rates by sex applied in that standard population.
Due to changes in the published source material, rates have been provided for deaths at all ages. In previous publications (including Members' Research Service local authority profiles) rates were given for deaths under the age of 75 only.
3-e The figure includes daily and occasional smokers. 3-f Refers to the most units drunk on any one day in the past seven days. Binge-drinking is defined as men drinking
more than 8 units a day, women more than 6 units. For example, a small glass of wine is one unit, and a pint of normal strength lager is two. The proportion is based on all adults (including non-drinkers).
3-g Guidelines recommend eating at least five portions of a variety of fruit and vegetables each day. Examples of portions are one apple, or three tablespoons of vegetables.
3-h Guidelines currently recommend that adults do at least 30 minutes of at least moderate intensity physical activity (such as heavy gardening or fast walking), on five or more days a week.
3-i The Body Mass Index (BMI) is a measure of overweight and obesity, allowing for differences in weight due to height. Adults are defined as being overweight or obese if they have a BMI of 25 or more.
3-j Health Statistics Wales 2007 (tables 5.6 and 5.7) http://new.wales.gov.uk/topics/statistics/publications/publication-archive/hsw2007/ General Practitioners at 30 September 2006, excluding GP registrars, GP retainers, and locums. General dental practitioners (principals, assistants and vocational trainees) at 30 September 2006. Rates are calculated using 2006 mid-year estimates of population from StatsWales table 003122. 3-k General Medical Practitioners in Wales, September 2007 http://new.wales.gov.uk/topics/statistics/headlines/health2008/hdw20080314 Average GP list size is the number of registered patients divided by the number of all practitioners. 3-l Health Statistics Wales 2007 (table 5.17) http://new.wales.gov.uk/topics/statistics/publications/publication-archive/hsw2007/ Prescriptions in the year ending 31 March 2006. 3-m Health Statistics Wales 2007 (tables 6.2, 6.3 & 6.4) http://new.wales.gov.uk/topics/statistics/publications/publication-archive/hsw2007/ Waiting lists for all specialities, at 31 March 2007. Waiting lists reported by Local Health Boards include all those resident in the area who are waiting for NHS-
funded treatment. This will include those waiting for treatment at NHS hospitals outside Wales and at private hospitals where the Local Health Board is providing funding for the treatment.
3-n Health Statistics Wales 2007 (table 8.1) http://new.wales.gov.uk/topics/statistics/publications/publication-archive/hsw2007/ Data relating to in-patients and day cases are obtained from the Patient Episode Database for Wales (PEDW).
Some NHS activity undertaken using the U.K. independent sector is not included in these figures. 3-o Personal Social Services Statistics Wales 2006-07 (tables 1.2, 1.22 & 2.1) http://www.dataunitwales.gov.uk/eng/Project.asp?nc=MNHL&id=4120 "Looked after” is the term used to describe all children who are the subject of a care order, or who are provided
with accommodation on a voluntary basis for more than 24 hours.
Members’ Research Service: Research Paper Gwasanaeth Ymchwil yr Aelodau: Papur Ymchwil
18
Child protection registers contain information on all children in the area who are considered to be suffering from or are likely to suffer significant harm.
Figures for looked after children and children on the child protection register are rounded to the nearest five. Figures for residential care include local authority and independent sector residential care. Table 4: Education and Training Statistics 4-a NOMIS official labour market statistics http://www.nomisweb.co.uk Information from the Annual Population Survey, January - December 2006. The link below provides detailed
definitions of the qualification levels. http://www.statswales.wales.gov.uk/tableviewer/document.aspx?FileId=6904-b StatsWales (table 003451) http://www.statswales.wales.gov.uk/TableViewer/tableView.aspx?ReportId=3899 Figures relate to the percentage of pupils in National Curriculum Year 2 who were assessed as achieving level 2
or above in each of the Core Subjects (English or Welsh first language, Science and Maths). 4-c StatsWales (table 003298) http://www.statswales.wales.gov.uk/TableViewer/tableView.aspx?ReportId=3901 Figures relate to the percentage of pupils in National Curriculum Year 6 who were assessed as achieving level 4
or above in each of the Core Subjects (English or Welsh first language, Science and Maths). 4-d StatsWales (table 003300) http://www.statswales.wales.gov.uk/TableViewer/tableView.aspx?ReportId=3903 Figures relate to the percentage of pupils in National Curriculum Year 9 who were assessed as achieving level 5
or above in each of the Core Subjects (English or Welsh first language, Science and Maths). 4-e StatsWales (table 001897) http://www.statswales.wales.gov.uk/TableViewer/tableView.aspx?ReportId=3506
GCSE/GNVQ data relate to the examination achievements of pupils in their final year of compulsory education (i.e. aged 15 at the beginning of the academic year) at maintained schools. Figures for Wales include independent schools.
4-f Pupils aged 15 leaving education without a recognised qualification, 2007 (table 3) http://new.wales.gov.uk/topics/statistics/headlines/schools-2007/schools-2006/hdw200612213 Figures relate to maintained secondary and special schools, and pupil referral units. Figures for Wales include
independent schools. 4-g StatsWales (table 001892) http://www.statswales.wales.gov.uk/TableViewer/tableView.aspx?ReportId=1892 A Level / equivalent results relate to the examination achievements of pupils in maintained schools, aged 17 at
the start of the academic year, entering two or more A/AS levels or a vocational equivalent. Figures for Wales include independent schools, but exclude further education institutions.
4-h Absenteeism from Primary Schools, 2007 http://new.wales.gov.uk/topics/statistics/headlines/schools2008/hdw200802262 Figures relate to maintained primary schools. Figures for Wales include independent schools. 4-i Absenteeism from Secondary Schools, 2007 (table 6) http://new.wales.gov.uk/topics/statistics/headlines/schools-2007/hdw200710311 Figures relate to maintained secondary schools and special schools with pupils of secondary school age.
Figures for Wales include independent schools. 4-j Schools in Wales: General Statistics 2007 (tables 11.4, 11.5 & 11.6) new.wales.gov.uk/topics/statistics/publications/swgs2007 Results for maintained schools, at January 2007. Primary Key Stage 1 includes reception and mixed nursery/reception classes. Table 5: Housing Statistics 5-a Neighbourhood Statistics, 2001 Census: Key Statistics (tables KS16, KS18, KS19, KS20 & KS21) http://www.neighbourhood.statistics.gov.uk/dissemination/ A household comprises one person living alone, or a group of people living at the same address with common
housekeeping (sharing a living room/sitting room or at least one meal a day). 'Total households' refers to households with residents; 'total household spaces' to households with or without residents.
Members’ Research Service: Research Paper Gwasanaeth Ymchwil yr Aelodau: Papur Ymchwil
19
A dependent child is a person in a household aged 0-15 (whether or not in a family) or a person aged 16-18 who is a full time student in a family with parent(s).
5-b Welsh Housing Statistics 2006 (table 7.2) http://www.dataunitwales.gov.uk/eng/Project.asp?nc=Q8F6&id=3890 Based on decisions taken by the local authority under Part VII of the Housing Act 1996. Households are
accepted as homeless by a local authority if they are eligible, unintentionally homeless and in one of the priority need groups specified in legislation.
Due to changes in the published source material, rates have been calculated per 1,000 households. In previous publications (including Members' Research Service local authority profiles) rates were calculated per 1,000 population.
5-c Department for Communities and Local Government Housing Statistics (table 586) http://www.communities.gov.uk/documents/housing/xls/table-586 Median house prices based on Land Registry data. Excluded from the above figures are sales at less than
market price (e.g. Right To Buy), sales below £1,000 and sales above £20m. The median is the value with half of all values above and half below (i.e. the middle value).
5-d Council Tax Levels, 2008-09 (table 1) http://new.wales.gov.uk/docrepos/40382/40382313/statistics/locgov/locgov2008/sdr44-2008.pdf? Average council tax per dwelling is calculated from all chargeable dwellings before disabled discounts and
reductions are taken into account. Exempt dwellings are excluded. Table 6: Transport, Crime and Environment Statistics 6-a Neighbourhood Statistics, 2001 Census: Key Statistics (tables KS15 & KS17) http://www.neighbourhood.statistics.gov.uk/dissemination/ Travel to work by car means driving (or as a passenger in) a car or van, or by taxi/minicab. Travel to work by
public transport means by underground, metro, light rail, tram, train, bus, mini bus or coach. 6-b 2006 Road Casualties Wales (tables 3.6 & 6.8) http://new.wales.gov.uk/topics/statistics/publications/rcw2006/?lang=en Total road length is as at 1 April 2006, excluding green lanes and footpaths. 6-c 2006 Road Casualties Wales (tables 3.6 & 14.1) http://new.wales.gov.uk/topics/statistics/publications/publication-archive/rcw2005 Volume of traffic excluding pedal cycles. Vehicle kilometre: One vehicle times one kilometre travelled. For
example, 1 vehicle travelling 1 kilometre a day for a year would be 365 vehicle kilometres. 6-d Health Statistics Wales 2007 (table 1.15) http://new.wales.gov.uk/topics/statistics/publications/publication-archive/hsw2007/ The number of deaths of people aged under 75 in each 5 year age-group is multiplied by the difference between
the midpoint of the age group and 74.5. The average annual years of life lost are obtained by summing across the age groups and dividing by 5.
6-e Crime in England and Wales 2006/07 http://www.homeoffice.gov.uk/rds/crimeew0607.html These statistics are drawn from police recorded crime figures, and have not been seasonally adjusted. Further
details on crime type definitions can be found through the link above. Previous Members' Research Service profiles covered the period January - March. Owing to changes in the
source material, figures in this profile cover different crime categories and relate to the period April 2006 to March 2007. Figures on all recorded crime were obtained from the Home Office. Rates in this profile may differ from rates published by the Home Office due to revisions made to the mid-year estimate population figures.
6-f Municipal Waste Management Survey 2006-07 http://new.wales.gov.uk/topics/statistics/headlines/env-2007/hdw200711211 Data from the Municipal Waste Management Survey 2006-07 (excludes abandoned vehicles). Municipal waste
is household waste plus waste from non-household sources. 6-g Department for Environment, Food and Rural Affairs, River Quality Database 2006 http://www.defra.gov.uk/environment/statistics/inlwater/iwriverquality.htm#tableslist These data are best estimates of monitored river water quality. River courses and catchment areas often cross
local authority boundaries and therefore the quality of some river waters within a single area may be affected by factors outside the borders of the authority. The same is true to a lesser extent for Wales.
Members’ Research Service: Research Paper Gwasanaeth Ymchwil yr Aelodau: Papur Ymchwil
Annex 2: Overall Index of Multiple Deprivation map for Ceredigion8
20 8 http://new.wales.gov.uk/topics/statistics/theme/wimd2005/results/analysis-revised
Members’ Research Service: Research Paper Gwasanaeth Ymchwil yr Aelodau: Papur Ymchwil
21