Embed Size (px)
Citation preview
econstorMake Your Publications Visible.
A Service of
zbwLeibniz-InformationszentrumWirtschaftLeibniz Information Centrefor Economics
Dhyne, Emmanuel; Druant, Martine
Working Paper
Wages, labor or prices: How do firms react toshocks?
NBB Working Paper, No. 193
Provided in Cooperation with:National Bank of Belgium, Brussels
Suggested Citation: Dhyne, Emmanuel; Druant, Martine (2010) : Wages, labor or prices: Howdo firms react to shocks?, NBB Working Paper, No. 193, National Bank of Belgium, Brussels
This Version is available at:http://hdl.handle.net/10419/144405
Standard-Nutzungsbedingungen:
Die Dokumente auf EconStor dürfen zu eigenen wissenschaftlichenZwecken und zum Privatgebrauch gespeichert und kopiert werden.
Sie dürfen die Dokumente nicht für öffentliche oder kommerzielleZwecke vervielfältigen, öffentlich ausstellen, öffentlich zugänglichmachen, vertreiben oder anderweitig nutzen.
Sofern die Verfasser die Dokumente unter Open-Content-Lizenzen(insbesondere CC-Lizenzen) zur Verfügung gestellt haben sollten,gelten abweichend von diesen Nutzungsbedingungen die in der dortgenannten Lizenz gewährten Nutzungsrechte.
Terms of use:
Documents in EconStor may be saved and copied for yourpersonal and scholarly purposes.
You are not to copy documents for public or commercialpurposes, to exhibit the documents publicly, to make thempublicly available on the internet, or to distribute or otherwiseuse the documents in public.
If the documents have been made available under an OpenContent Licence (especially Creative Commons Licences), youmay exercise further usage rights as specified in the indicatedlicence.
www.econstor.eu

Working Paper Research
Wages, labor or prices : How do firms react to shocks ?
by Emmanuel Dhyne and Martine Druant
July 2010 No 193
NBB WORKING PAPER No. 193 - JULY 2010
Editorial Director Jan Smets, Member of the Board of Directors of the National Bank of Belgium Statement of purpose:
The purpose of these working papers is to promote the circulation of research results (Research Series) and analytical studies (Documents Series) made within the National Bank of Belgium or presented by external economists in seminars, conferences and conventions organised by the Bank. The aim is therefore to provide a platform for discussion. The opinions expressed are strictly those of the authors and do not necessarily reflect the views of the National Bank of Belgium. Orders
For orders and information on subscriptions and reductions: National Bank of Belgium, Documentation - Publications service, boulevard de Berlaimont 14, 1000 Brussels. Tel +32 2 221 20 33 - Fax +32 2 21 30 42 The Working Papers are available on the website of the Bank: http://www.nbb.be. © National Bank of Belgium, Brussels All rights reserved. Reproduction for educational and non-commercial purposes is permitted provided that the source is acknowledged. ISSN: 1375-680X (print) ISSN: 1784-2476 (online)
NBB WORKING PAPER No.193 - JULY 2010
Abstract
Survey results in 15 European countries for almost 15,000 firms reveal that Belgian firms react
more than the average European firm to adverse shocks by reducing permanent and temporary
employment. On the basis of a firm-level analysis, this paper confirms that the different reaction
to shocks is significant and investigates what factors explain this difference. Although the
explanatory value of the variables is limited, most of the explanatory power of the model being
associated with the dummy variables coding for firm size, sector and country, the variables
investigated provide valuable information. The importance of wage bargaining above the firm
level, the automatic system of index-linking wages to past inflation, the limited use of flexible pay,
the high share of low-skilled blue-collar workers, the labor intensive production process as well as
the less stringent legislation with respect to the protection against dismissal are at the basis of the
stronger employment reaction of Belgian firms. On the contrary, employment is safeguarded by
the presence of many small firms and a wage cushion.
Key Words: survey, wage rigidity, cost-push shocks, demand shock, wage bargaining institutions,
indexation
JEL Classification: D21, E30, J31
Corresponding authors: Emmanuel Dhyne, NBB, Research Department and Université de Mons, e-mail: [email protected]. Martine Druant, NBB, Research Department, e-mail: [email protected]. This paper has been prepared in the context of the Eurosystem Wage Dynamics Network (WDN) research project. We are very grateful to all participants in the WDN meetings for the encouraging discussion and suggestions. We also want to thank an anonymous referee, Catherine Fuss, Philippe Delhez, Jan De Mulder, Philip Vermeulen and Raf Wouters for their valuable comments on previous versions. The views expressed in this paper are those of the authors and do not necessarily reflect the views of the National Bank of Belgium or of the European Central Bank.
NBB WORKING PAPER - No.193 - JULY 2010
TABLE OF CONTENTS
1. Introduction.................................................................................................................................. 1
2. Data and methodology ................................................. ............................................................. 2
2.1 The dataset ................................................................................................................ ............. 2
2.2 The variables ............................................................................................................................ 3
2.3. The model ................................................................................................................................ 7
3. Response to unexpected adverse shocks: Do Belgian firms behave differently? .............. 8
3.1 Descriptive analysis .................................................................................................................7
3.2 Prices and Costs: What affects the adjustment channel at the firm level? ............................. 9
3.3 How do firms adjust cost? ...................................................................................................... 12
4. Firm level response to unexpected adverse shocks: Specificities of the Belgian sample 16
5. Conclusions ............................................................................................................................... 20
References ..................................................................................................................................... .22
Appendix ........................................................................................................................................ 24
National Bank of Belgium - Working papers series .......................................................................... 35
1
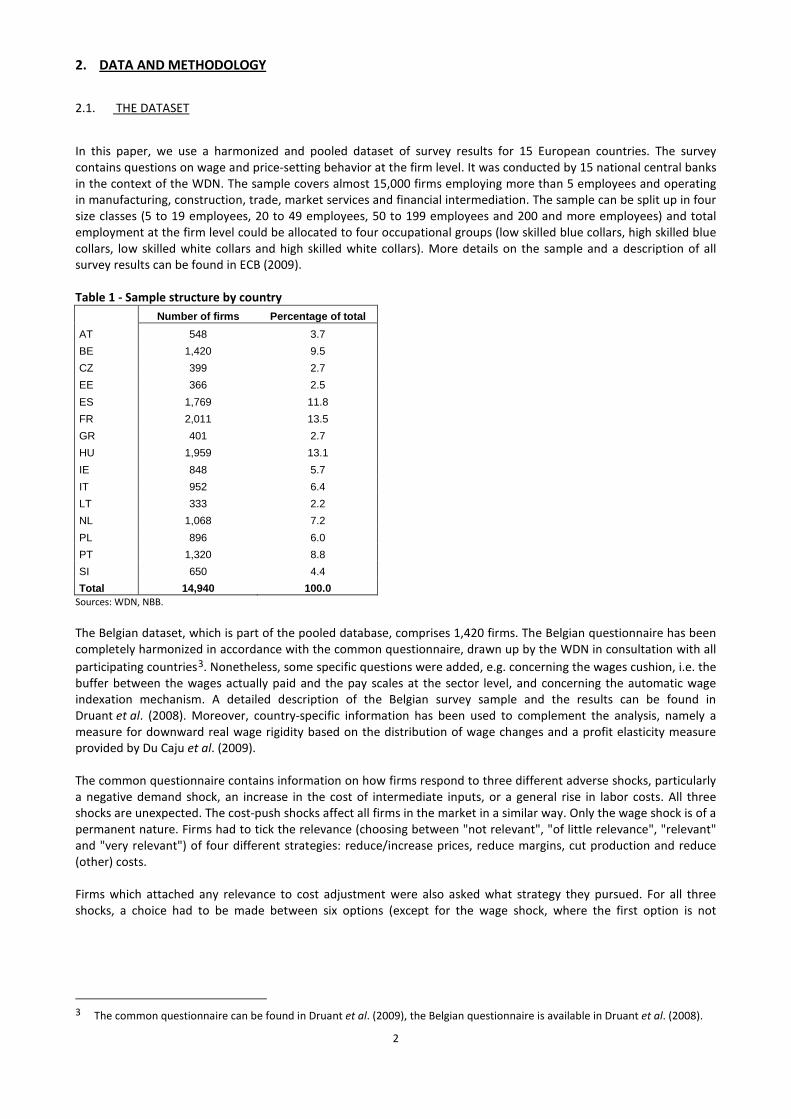
1. INTRODUCTION
A firm-level survey on wage-setting conducted in Belgium in the context of the Wage Dynamics Network (WDN)1
, reveals that, in response to adverse shocks (unexpected demand fall, intermediate input price rise or wage increase), almost 50% of firms reduce costs by cutting employment.
The fact that adjustment mainly goes through employment in Belgian firms, is also found in Fuss (2009). A decomposition of the wage bill at the firm level shows that (i) the major part of wage bill variation is associated to labor fluctuations and (ii) wage bill contractions often result from employment contraction, while wages continue to increase. Besides, Fuss and Wintr (2009) analyze the elasticity of firms' real labor compensation and employment to idiosyncratic and sectoral productivity shocks. They find that in both cases the elasticity of employment is large. Besides, the elasticity of wages to idiosyncratic productivity shocks is very low, but it is much higher in the case of a sectoral productivity shock. Similar surveys on wage-setting have been conducted in 14 other European countries2
. On average, for the total group of 15 countries, the employment strategy is used by one third of firms. This rich database allows us to investigate on the key question of this paper, namely why are Belgian firms using more intensively (relative to other European firms) the employment channel in response to adverse shocks? To our knowledge, no empirical comparison exists of the reaction of Belgian and other European firms to adverse shocks. Some pieces of information can be found in Bertola et al. (2010) but their focus is not on the Belgian situation. They analyze the global results of the WDN-wage-setting survey with respect to price versus cost and wage versus employment adjustments in response to cost-push shocks, finding that the intensity and character of the adjustment depends on the intensity of competition, the importance of collective bargaining and on other structural and institutional features of firms and their environment. We use this paper as a benchmark but focus in our analysis on country differences, more specifically on the reaction of Belgian firms versus other European firms, and we extend the set of explanatory variables. Besides, we also exploit the information on the demand shock.
Using the same dataset as in Bertola et al. (2010), namely the pooled results of the WDN wage-setting survey in 15 countries, we construct a set of explanatory variables. As in Hall (2005), we first considered a set of variables measuring or driving wage rigidity. This set includes direct measures of downward wage rigidity computed in the context of the WDN (Babecký et al., 2009a and Du Caju et al., 2009) and several indirect measures of wage rigidity relating to labor market institutions, such as the presence of indexation. The latter were chosen on the basis of the conclusions of Dickens et al. (2007) and Babecký et al. (2009a), namely that national labor market institutions explain differences in downward wage rigidity measured at the microeconomic level. We also included in our dataset some firm specific characteristics such as size and labor force composition following Messina et al. (2010), who investigate the role of firm and work force characteristics in shaping wage rigidities at the sector level. Finally, the set of potential explanatory variables has been completed with several measures of employment flexibility, such as the share of part time and temporary employment, the employment turnover, and indicators of employment protection, and, following Bertola et al. (2010), measures of product market competition and labor intensity. After controlling for the impact of all variables mentioned above, the differences in employment response of Belgian firms to shocks compared to other countries remains significant. Country dummies related to employment protection legislation provide additional explanation for the remaining cross-country differences. Focusing on the Belgian situation, we also added some specific Belgian information. The remaining structure of the paper is as follow. In Section 2, we describe the dataset and the methodology used. Next, we analyze in Section 3 the pooled dataset, with a special focus on differences between countries in their firms' responses to the two cost-push shocks. In section 4, we restrict our analysis to the Belgian sample and try to find some common characteristics of Belgian firms that might explain their response to cost-push shocks. Section 5 concludes.
1 The WDN is an ESCB/Eurosystem research network studying the features and sources of wage and labor cost dynamics in EU
countries. 2 AT, BE, CZ, EE, ES, FR, GR, HU, IE, IT, LT, NL, PL, PT, SI.
2
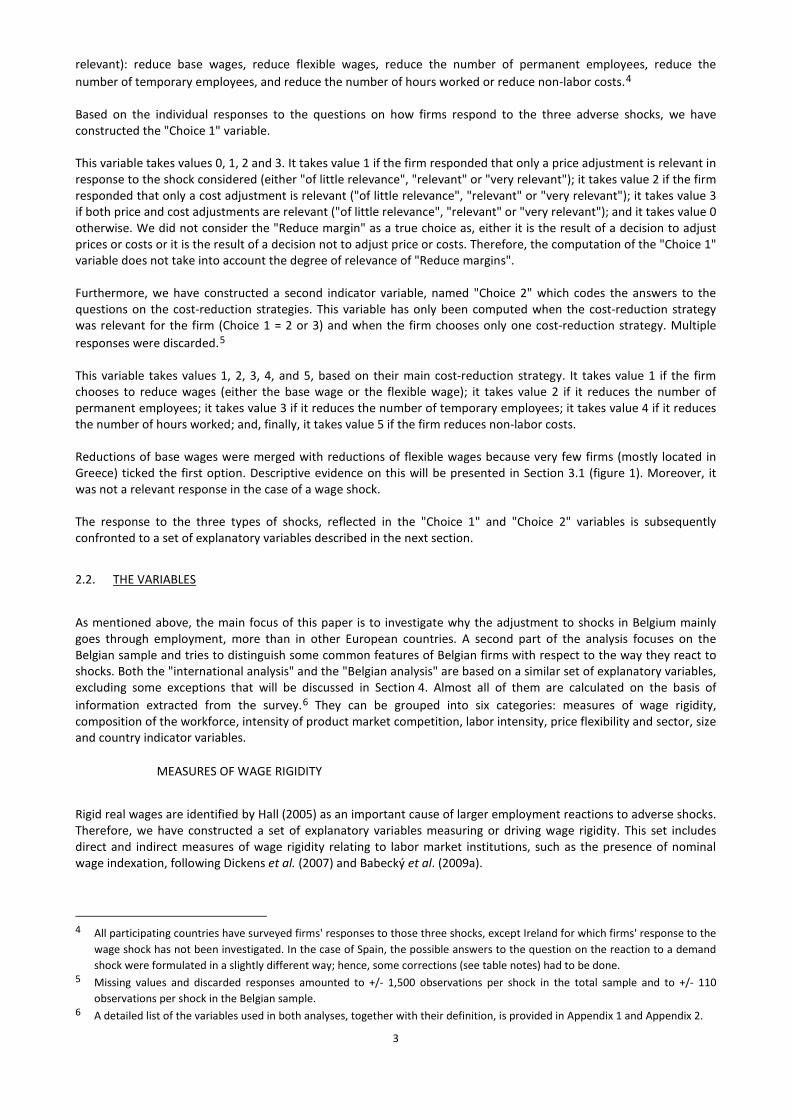
2. DATA AND METHODOLOGY
2.1. THE DATASET
In this paper, we use a harmonized and pooled dataset of survey results for 15 European countries. The survey contains questions on wage and price-setting behavior at the firm level. It was conducted by 15 national central banks in the context of the WDN. The sample covers almost 15,000 firms employing more than 5 employees and operating in manufacturing, construction, trade, market services and financial intermediation. The sample can be split up in four size classes (5 to 19 employees, 20 to 49 employees, 50 to 199 employees and 200 and more employees) and total employment at the firm level could be allocated to four occupational groups (low skilled blue collars, high skilled blue collars, low skilled white collars and high skilled white collars). More details on the sample and a description of all survey results can be found in ECB (2009). Table 1 - Sample structure by country Number of firms Percentage of total AT 548 3.7 BE 1,420 9.5 CZ 399 2.7 EE 366 2.5 ES 1,769 11.8 FR 2,011 13.5 GR 401 2.7 HU 1,959 13.1 IE 848 5.7 IT 952 6.4 LT 333 2.2 NL 1,068 7.2 PL 896 6.0 PT 1,320 8.8 SI 650 4.4 Total 14,940 100.0
Sources: WDN, NBB.
The Belgian dataset, which is part of the pooled database, comprises 1,420 firms. The Belgian questionnaire has been completely harmonized in accordance with the common questionnaire, drawn up by the WDN in consultation with all participating countries3
. Nonetheless, some specific questions were added, e.g. concerning the wages cushion, i.e. the buffer between the wages actually paid and the pay scales at the sector level, and concerning the automatic wage indexation mechanism. A detailed description of the Belgian survey sample and the results can be found in Druant et al. (2008). Moreover, country-specific information has been used to complement the analysis, namely a measure for downward real wage rigidity based on the distribution of wage changes and a profit elasticity measure provided by Du Caju et al. (2009).
The common questionnaire contains information on how firms respond to three different adverse shocks, particularly a negative demand shock, an increase in the cost of intermediate inputs, or a general rise in labor costs. All three shocks are unexpected. The cost-push shocks affect all firms in the market in a similar way. Only the wage shock is of a permanent nature. Firms had to tick the relevance (choosing between "not relevant", "of little relevance", "relevant" and "very relevant") of four different strategies: reduce/increase prices, reduce margins, cut production and reduce (other) costs. Firms which attached any relevance to cost adjustment were also asked what strategy they pursued. For all three shocks, a choice had to be made between six options (except for the wage shock, where the first option is not
3 The common questionnaire can be found in Druant et al. (2009), the Belgian questionnaire is available in Druant et al. (2008).
3
relevant): reduce base wages, reduce flexible wages, reduce the number of permanent employees, reduce the number of temporary employees, and reduce the number of hours worked or reduce non-labor costs.4
Based on the individual responses to the questions on how firms respond to the three adverse shocks, we have constructed the "Choice 1" variable. This variable takes values 0, 1, 2 and 3. It takes value 1 if the firm responded that only a price adjustment is relevant in response to the shock considered (either "of little relevance", "relevant" or "very relevant"); it takes value 2 if the firm responded that only a cost adjustment is relevant ("of little relevance", "relevant" or "very relevant"); it takes value 3 if both price and cost adjustments are relevant ("of little relevance", "relevant" or "very relevant"); and it takes value 0 otherwise. We did not consider the "Reduce margin" as a true choice as, either it is the result of a decision to adjust prices or costs or it is the result of a decision not to adjust price or costs. Therefore, the computation of the "Choice 1" variable does not take into account the degree of relevance of "Reduce margins". Furthermore, we have constructed a second indicator variable, named "Choice 2" which codes the answers to the questions on the cost-reduction strategies. This variable has only been computed when the cost-reduction strategy was relevant for the firm (Choice 1 = 2 or 3) and when the firm chooses only one cost-reduction strategy. Multiple responses were discarded.5
This variable takes values 1, 2, 3, 4, and 5, based on their main cost-reduction strategy. It takes value 1 if the firm chooses to reduce wages (either the base wage or the flexible wage); it takes value 2 if it reduces the number of permanent employees; it takes value 3 if it reduces the number of temporary employees; it takes value 4 if it reduces the number of hours worked; and, finally, it takes value 5 if the firm reduces non-labor costs. Reductions of base wages were merged with reductions of flexible wages because very few firms (mostly located in Greece) ticked the first option. Descriptive evidence on this will be presented in Section 3.1 (figure 1). Moreover, it was not a relevant response in the case of a wage shock. The response to the three types of shocks, reflected in the "Choice 1" and "Choice 2" variables is subsequently confronted to a set of explanatory variables described in the next section.
2.2. THE VARIABLES
As mentioned above, the main focus of this paper is to investigate why the adjustment to shocks in Belgium mainly goes through employment, more than in other European countries. A second part of the analysis focuses on the Belgian sample and tries to distinguish some common features of Belgian firms with respect to the way they react to shocks. Both the "international analysis" and the "Belgian analysis" are based on a similar set of explanatory variables, excluding some exceptions that will be discussed in Section 4. Almost all of them are calculated on the basis of information extracted from the survey.6
They can be grouped into six categories: measures of wage rigidity, composition of the workforce, intensity of product market competition, labor intensity, price flexibility and sector, size and country indicator variables.
MEASURES OF WAGE RIGIDITY
Rigid real wages are identified by Hall (2005) as an important cause of larger employment reactions to adverse shocks. Therefore, we have constructed a set of explanatory variables measuring or driving wage rigidity. This set includes direct and indirect measures of wage rigidity relating to labor market institutions, such as the presence of nominal wage indexation, following Dickens et al. (2007) and Babecký et al. (2009a).
4 All participating countries have surveyed firms' responses to those three shocks, except Ireland for which firms' response to the
wage shock has not been investigated. In the case of Spain, the possible answers to the question on the reaction to a demand shock were formulated in a slightly different way; hence, some corrections (see table notes) had to be done.
5 Missing values and discarded responses amounted to +/- 1,500 observations per shock in the total sample and to +/- 110 observations per shock in the Belgian sample.
6 A detailed list of the variables used in both analyses, together with their definition, is provided in Appendix 1 and Appendix 2.
4
A first direct measure of downward nominal wage rigidity is computed on the basis of the survey question "Has the base wage been frozen over the last five years?". It is defined as a dummy variable that takes value of 1 is the answer to this question is "yes" and 0 otherwise.7
We do not have direct information with respect to downward real wage rigidity, but we can observe the existence of a policy that links wage changes to inflation. Following Babecký et al. (2009a), we consider that a firm faces downward real wage rigidity if an automatic link between wages and past or expected inflation exists. To account for labor market institutions other than indexation mechanisms, our set of explanatory variables also includes the presence/absence of collective wage agreements. While collective agreements signed at the national, regional, sector or occupational levels (referred to as collective agreements signed outside the firm) are generally considered to enhance wage rigidity, decentralized wage bargaining by means of collective wage agreements at the firm level may reduce downward real wage rigidity (Messina et al., 2010). Finally, our set of explanatory variables also includes variables with respect to labor force composition and firm's characteristics (as in Messina et al., 2010).
COMPOSITION OF THE WORKFORCE
Regarding the skill composition, the labor force is allocated into four categories: low skilled blue collars, high skilled blue collars, low skilled white collars, and high skilled white collars. Messina et al. (2010) find a higher rigidity for high skilled workers. The theory of human capital explains that the higher the human capital of employees and the higher a firm's investment in those workers, the more difficult and costly it is to replace them. Having these turnover costs in mind, firms do not want these employees to leave and, hence, they are also less inclined to cut their wages. The same theory can explain the higher wage rigidity for white collars relative to blue collars found in Babecký et al. (2009a). Employment adjustment is also enhanced by the presence of a high share of part time employment and a high share of temporary employment.
INTENSITY OF PRODUCT MARKET COMPETITION
Bertola et al. (2010) found that competition increases the likelihood of wage and employment responses to shocks. According to them, the reaction depends essentially on the elasticity of demand at the firm levelthe elasticity of labor demand being expected to be larger in a competitive environment. However, Babecký et al. (2009a) find that sectors with stronger competition experience higher downward nominal wage rigidity. This is explained by wage-bargaining practices: firms in competitive sectors generally earn less profit and, hence, wages actually paid are close to pay scales, leaving less room for downward adjustment. Employees of firms facing less competition, on the other hand, try to appropriate part of the higher rents, sometimes by means of a firm-level agreement. Wages effectively paid in those sectors are above pay scales and thus more flexible. According to their results, a higher competition is expected to enhance a reaction in employment, while wages are rigid. Considering the information provided by the survey, the intensity of competitive pressures is computed on the basis of the question "To what extent will the firm follow a price reduction by competitors?".
LABOR INTENSITY
To measure labor intensity, we consider the share of labor costs in total costs. Similar to the degree of product market competition, this variable is expected to positively affect the wage and employment responses to shocks (Bertola et al., 2010).
7 This is a rough measure of downward nominal wage rigidity. If we consider the case of an expanding firm operating in a
favourable economic environment that faces no shocks, the absence of wage freezes will not be a sign of wage rigidity.

5
PRICE FLEXIBILITY
For the analysis of variable "Choice 1"8
, we also consider a measure of price flexibility. The survey provides several indications in this respect. A simple measure of price flexibility would be the frequency of price changes. However, as more than one quarter of firms report to have "no pattern" in price changes, too many observations would be lost. Moreover, the frequency of price changes is a rather rough measure of price flexibility: if there is no reason to change prices, frequency will be low without being a sign of rigidity (Dhyne et al., 2007). Therefore, an alternative measure has been used, namely the number of firms stating that price changes are not concentrated in particular months. The absence of time-dependent price-setting strategies, or, vice versa, the fact that price setting is state-dependent, is considered to be a sign of lower price rigidity.
SECTOR, SIZE AND COUNTRY
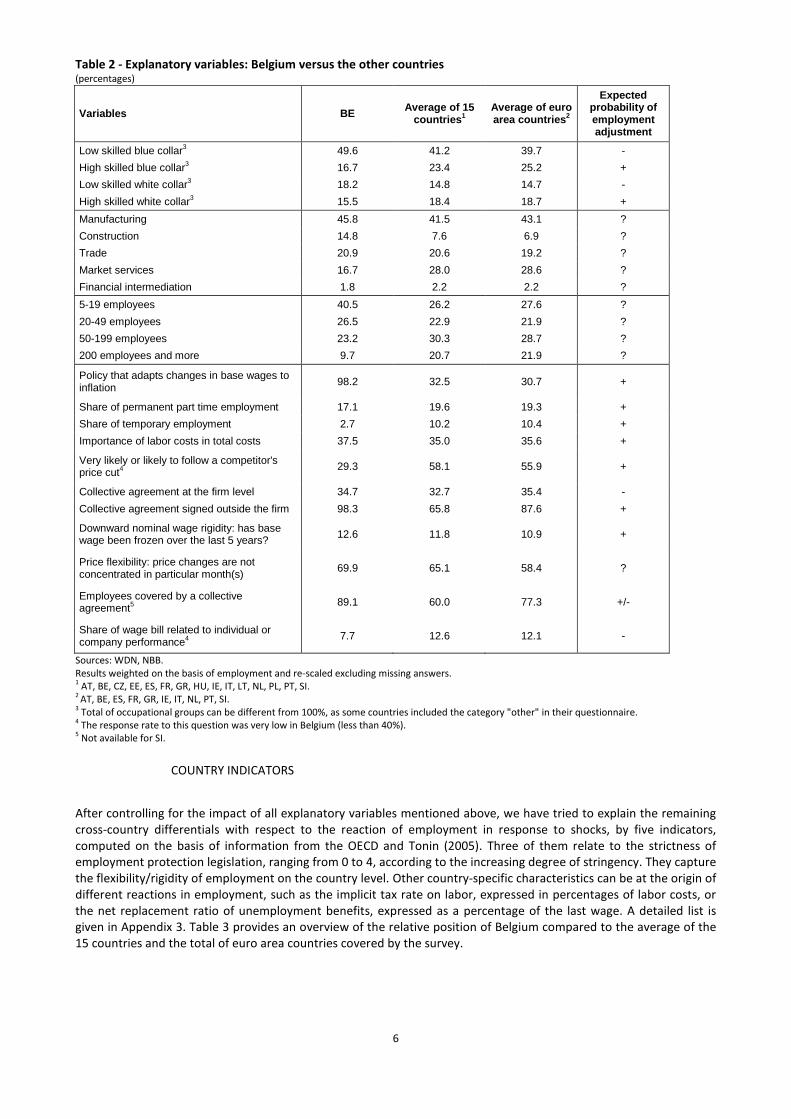
Finally, we also considered a set of additional control variables for other firm's characteristics. We considered indicator variables related to the sector of activity (manufacturing=reference sector, construction, trade, market services and financial intermediation), to the size of the firm, approximated by the number of employees (5-19, 20-49, 50-199 and 200 and more=reference group) and, for the international analysis, to the country where the firm is located (Belgium=reference country). In Table 2, weighted averages of all the variables mentioned above are presented. These data give an overview of the position of Belgium compared to the average of the 15 countries and the total of euro area countries covered by the survey. They help us to understand the results presented in Section 3.
ALTERNATIVE SPECIFICATIONS
For the international analysis, alternative specifications have been tested, extending the set of explanatory variables with the share of employees covered by a collective agreement and the share of the wage bill related to individual or company performance. The additional information contained in the former variable, compared to the existence of collective wage agreements at any level, is that it takes into account if the agreements cover all employees or only part of them. A high coverage might be a sign of high wage rigidity, although if most agreements are signed at the firm level, it could be a sign of low wage rigidity (see above). Messina et al. (2010) find a positive relation between flexible pay structures and nominal wage flexibility. Bonuses and other kinds of flexible pay can be more easily adapted to the firms' situation. Because of low response rates to the survey questions investigating on both variables, a large amount of observations is lost when these variables are included in the analysis. For this reason, we do not report detailed results in the paper, but we mention them where relevant. This alternative specification was not used in the Belgian analysis, the loss of observations being too high to have significant results. Other variables have been considered, but were not maintained in the analysis, due to the large share of missing values. They relate to the intensity of competition, namely the fact whether or not the firm is price-taker for its main product and the share of sales in foreign markets.
8 This variable summarizes the response of firms with respect to the relevance of the "adjust only prices", "reduce only costs"
and "adjust both prices and costs" strategies in response to an unexpected adverse shock.
6
Table 2 - Explanatory variables: Belgium versus the other countries (percentages)
Variables BE Average of 15 countries1
Average of euro area countries2
Expected probability of employment adjustment
Low skilled blue collar3 49.6 41.2 39.7 - High skilled blue collar3 16.7 23.4 25.2 + Low skilled white collar3 18.2 14.8 14.7 - High skilled white collar3 15.5 18.4 18.7 + Manufacturing 45.8 41.5 43.1 ? Construction 14.8 7.6 6.9 ? Trade 20.9 20.6 19.2 ? Market services 16.7 28.0 28.6 ? Financial intermediation 1.8 2.2 2.2 ? 5-19 employees 40.5 26.2 27.6 ? 20-49 employees 26.5 22.9 21.9 ? 50-199 employees 23.2 30.3 28.7 ? 200 employees and more 9.7 20.7 21.9 ?
Policy that adapts changes in base wages to inflation 98.2 32.5 30.7 +
Share of permanent part time employment 17.1 19.6 19.3 + Share of temporary employment 2.7 10.2 10.4 + Importance of labor costs in total costs 37.5 35.0 35.6 +
Very likely or likely to follow a competitor's price cut4 29.3 58.1 55.9 +
Collective agreement at the firm level 34.7 32.7 35.4 - Collective agreement signed outside the firm 98.3 65.8 87.6 +
Downward nominal wage rigidity: has base wage been frozen over the last 5 years? 12.6 11.8 10.9 +
Price flexibility: price changes are not concentrated in particular month(s) 69.9 65.1 58.4 ?
Employees covered by a collective agreement5 89.1 60.0 77.3 +/-
Share of wage bill related to individual or company performance4 7.7 12.6 12.1 -
Sources: WDN, NBB. Results weighted on the basis of employment and re-scaled excluding missing answers. 1 AT, BE, CZ, EE, ES, FR, GR, HU, IE, IT, LT, NL, PL, PT, SI. 2 AT, BE, ES, FR, GR, IE, IT, NL, PT, SI. 3 Total of occupational groups can be different from 100%, as some countries included the category "other" in their questionnaire. 4 The response rate to this question was very low in Belgium (less than 40%). 5 Not available for SI.
COUNTRY INDICATORS
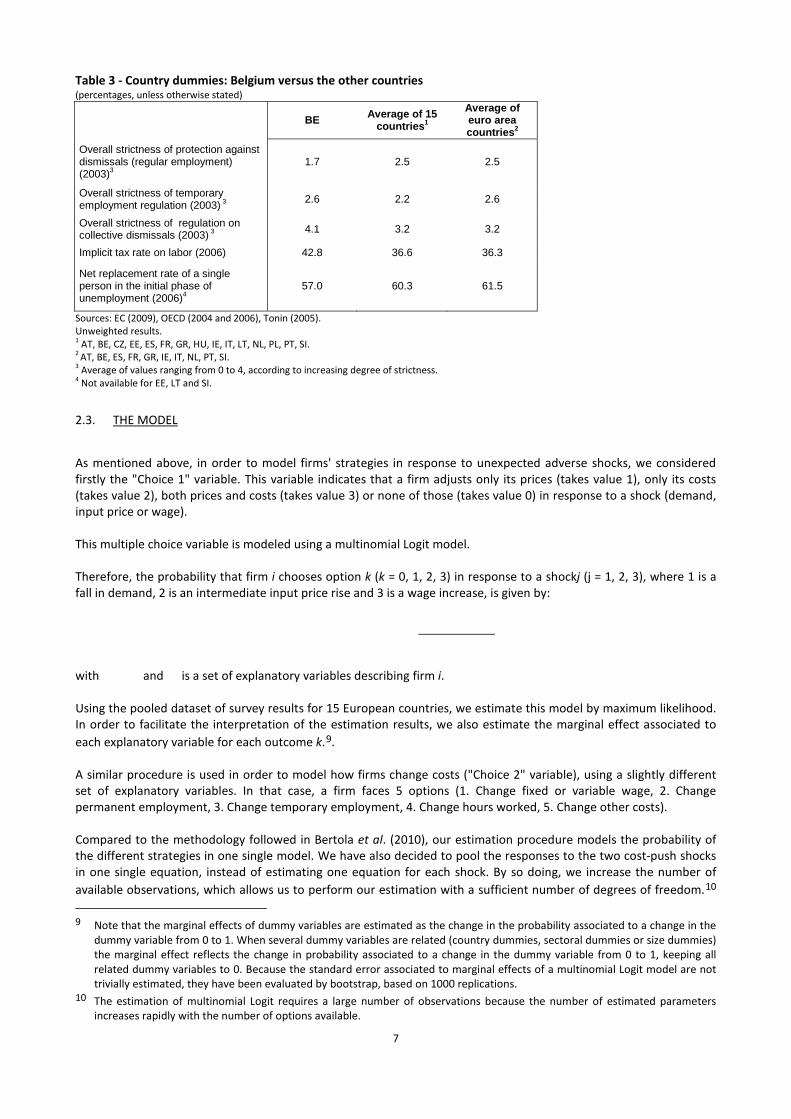
After controlling for the impact of all explanatory variables mentioned above, we have tried to explain the remaining cross-country differentials with respect to the reaction of employment in response to shocks, by five indicators, computed on the basis of information from the OECD and Tonin (2005). Three of them relate to the strictness of employment protection legislation, ranging from 0 to 4, according to the increasing degree of stringency. They capture the flexibility/rigidity of employment on the country level. Other country-specific characteristics can be at the origin of different reactions in employment, such as the implicit tax rate on labor, expressed in percentages of labor costs, or the net replacement ratio of unemployment benefits, expressed as a percentage of the last wage. A detailed list is given in Appendix 3. Table 3 provides an overview of the relative position of Belgium compared to the average of the 15 countries and the total of euro area countries covered by the survey.
7
Table 3 - Country dummies: Belgium versus the other countries (percentages, unless otherwise stated)
BE Average of 15 countries1
Average of euro area countries2
Overall strictness of protection against dismissals (regular employment) (2003)3
1.7 2.5 2.5
Overall strictness of temporary employment regulation (2003) 3 2.6 2.2 2.6
Overall strictness of regulation on collective dismissals (2003) 3 4.1 3.2 3.2
Implicit tax rate on labor (2006) 42.8 36.6 36.3
Net replacement rate of a single person in the initial phase of unemployment (2006)4
57.0 60.3 61.5
Sources: EC (2009), OECD (2004 and 2006), Tonin (2005). Unweighted results. 1 AT, BE, CZ, EE, ES, FR, GR, HU, IE, IT, LT, NL, PL, PT, SI. 2 AT, BE, ES, FR, GR, IE, IT, NL, PT, SI. 3 Average of values ranging from 0 to 4, according to increasing degree of strictness. 4 Not available for EE, LT and SI.
2.3. THE MODEL
As mentioned above, in order to model firms' strategies in response to unexpected adverse shocks, we considered firstly the "Choice 1" variable. This variable indicates that a firm adjusts only its prices (takes value 1), only its costs (takes value 2), both prices and costs (takes value 3) or none of those (takes value 0) in response to a shock (demand, input price or wage). This multiple choice variable is modeled using a multinomial Logit model. Therefore, the probability that firm i chooses option k (k = 0, 1, 2, 3) in response to a shockj (j = 1, 2, 3), where 1 is a fall in demand, 2 is an intermediate input price rise and 3 is a wage increase, is given by:
with and is a set of explanatory variables describing firm i. Using the pooled dataset of survey results for 15 European countries, we estimate this model by maximum likelihood. In order to facilitate the interpretation of the estimation results, we also estimate the marginal effect associated to each explanatory variable for each outcome k.9
.
A similar procedure is used in order to model how firms change costs ("Choice 2" variable), using a slightly different set of explanatory variables. In that case, a firm faces 5 options (1. Change fixed or variable wage, 2. Change permanent employment, 3. Change temporary employment, 4. Change hours worked, 5. Change other costs). Compared to the methodology followed in Bertola et al. (2010), our estimation procedure models the probability of the different strategies in one single model. We have also decided to pool the responses to the two cost-push shocks in one single equation, instead of estimating one equation for each shock. By so doing, we increase the number of available observations, which allows us to perform our estimation with a sufficient number of degrees of freedom.10
9 Note that the marginal effects of dummy variables are estimated as the change in the probability associated to a change in the
dummy variable from 0 to 1. When several dummy variables are related (country dummies, sectoral dummies or size dummies) the marginal effect reflects the change in probability associated to a change in the dummy variable from 0 to 1, keeping all related dummy variables to 0. Because the standard error associated to marginal effects of a multinomial Logit model are not trivially estimated, they have been evaluated by bootstrap, based on 1000 replications.
10 The estimation of multinomial Logit requires a large number of observations because the number of estimated parameters increases rapidly with the number of options available.
8
Moreover, the pooling of the two shocks simplifies the presentation of the results. As information on responses to wage shocks was not available for Ireland, the pooled sample only considers 14 countries. We also exploited the response to demand shocks, but these results are only presented in Appendix 5 and we only comment them when they are significantly different from the response to cost-push shocks.11
3. RESPONSE TO UNEXPECTED ADVERSE SHOCKS: DO BELGIAN FIRMS BEHAVE DIFFERENTLY?
3.1. DESCRIPTIVE ANALYSIS
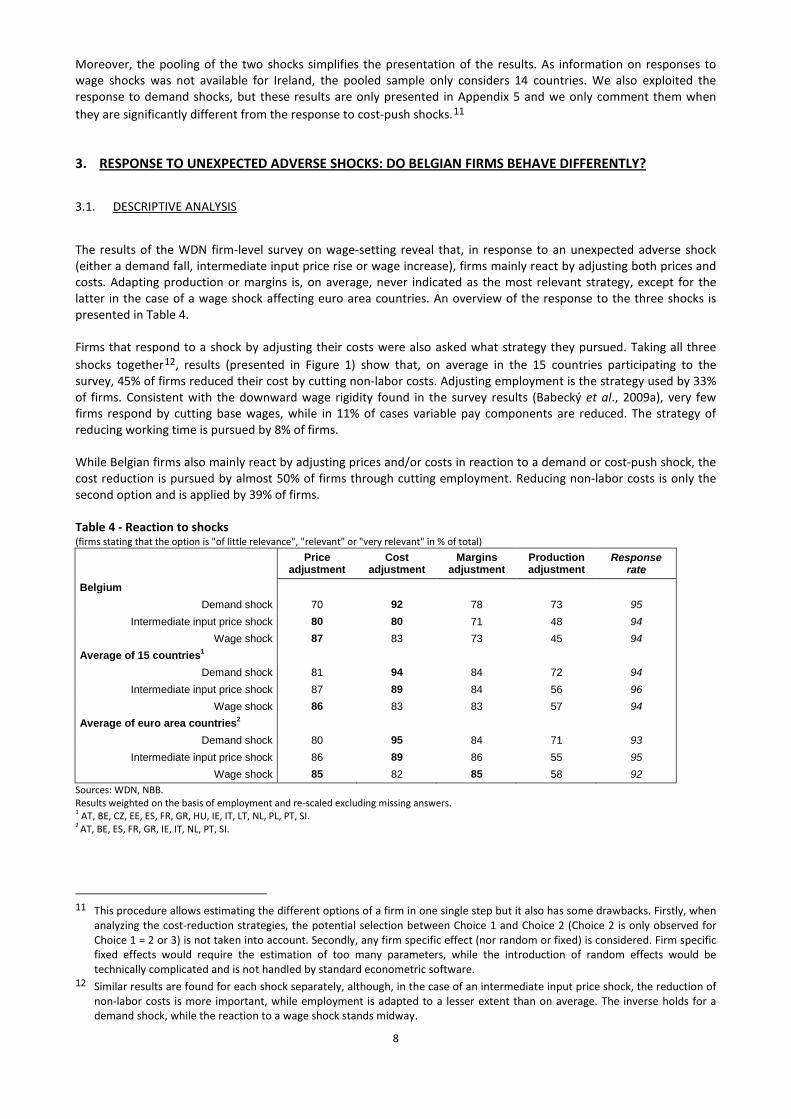
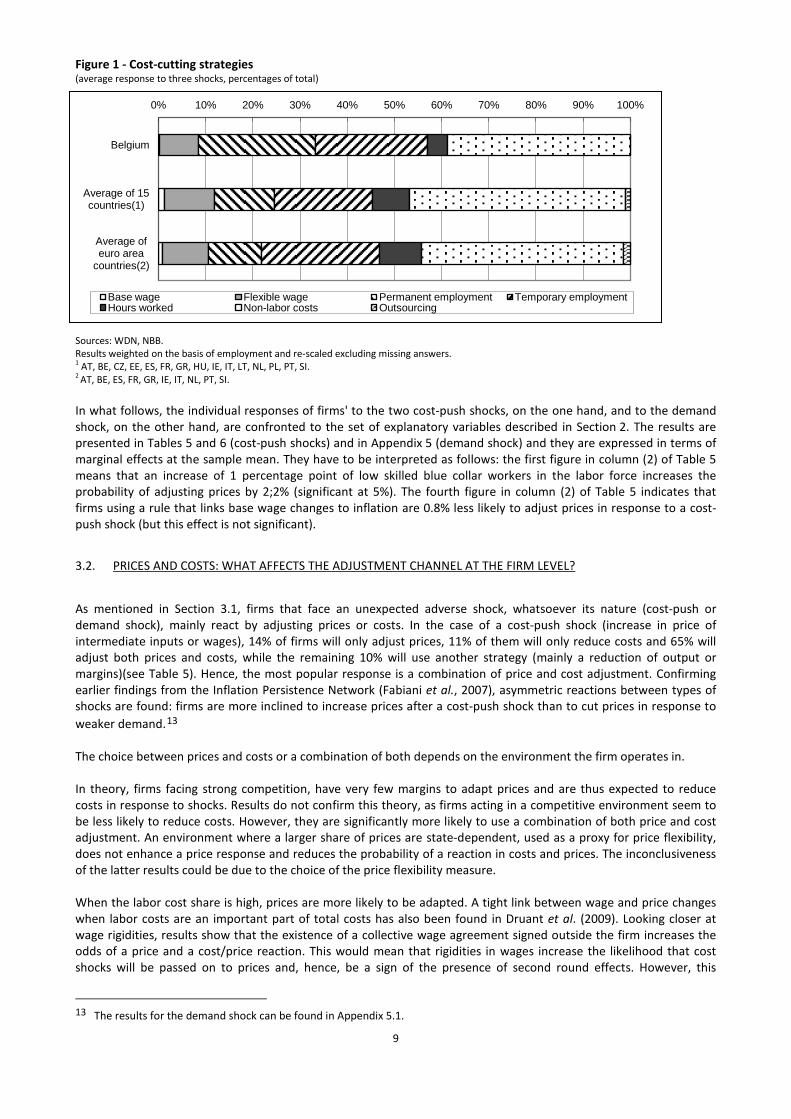
The results of the WDN firm-level survey on wage-setting reveal that, in response to an unexpected adverse shock (either a demand fall, intermediate input price rise or wage increase), firms mainly react by adjusting both prices and costs. Adapting production or margins is, on average, never indicated as the most relevant strategy, except for the latter in the case of a wage shock affecting euro area countries. An overview of the response to the three shocks is presented in Table 4. Firms that respond to a shock by adjusting their costs were also asked what strategy they pursued. Taking all three shocks together12
, results (presented in Figure 1) show that, on average in the 15 countries participating to the survey, 45% of firms reduced their cost by cutting non-labor costs. Adjusting employment is the strategy used by 33% of firms. Consistent with the downward wage rigidity found in the survey results (Babecký et al., 2009a), very few firms respond by cutting base wages, while in 11% of cases variable pay components are reduced. The strategy of reducing working time is pursued by 8% of firms.
While Belgian firms also mainly react by adjusting prices and/or costs in reaction to a demand or cost-push shock, the cost reduction is pursued by almost 50% of firms through cutting employment. Reducing non-labor costs is only the second option and is applied by 39% of firms. Table 4 - Reaction to shocks (firms stating that the option is "of little relevance", "relevant" or "very relevant" in % of total)
Price
adjustment Cost
adjustment Margins
adjustment Production adjustment
Response rate
Belgium Demand shock 70 92 78 73 95
Intermediate input price shock 80 80 71 48 94 Wage shock 87 83 73 45 94
Average of 15 countries1 Demand shock 81 94 84 72 94
Intermediate input price shock 87 89 84 56 96 Wage shock 86 83 83 57 94
Average of euro area countries2 Demand shock 80 95 84 71 93
Intermediate input price shock 86 89 86 55 95 Wage shock 85 82 85 58 92
Sources: WDN, NBB. Results weighted on the basis of employment and re-scaled excluding missing answers. 1 AT, BE, CZ, EE, ES, FR, GR, HU, IE, IT, LT, NL, PL, PT, SI. 2 AT, BE, ES, FR, GR, IE, IT, NL, PT, SI.
11 This procedure allows estimating the different options of a firm in one single step but it also has some drawbacks. Firstly, when
analyzing the cost-reduction strategies, the potential selection between Choice 1 and Choice 2 (Choice 2 is only observed for Choice 1 = 2 or 3) is not taken into account. Secondly, any firm specific effect (nor random or fixed) is considered. Firm specific fixed effects would require the estimation of too many parameters, while the introduction of random effects would be technically complicated and is not handled by standard econometric software.
12 Similar results are found for each shock separately, although, in the case of an intermediate input price shock, the reduction of non-labor costs is more important, while employment is adapted to a lesser extent than on average. The inverse holds for a demand shock, while the reaction to a wage shock stands midway.
9
Figure 1 - Cost-cutting strategies (average response to three shocks, percentages of total)
Sources: WDN, NBB. Results weighted on the basis of employment and re-scaled excluding missing answers. 1 AT, BE, CZ, EE, ES, FR, GR, HU, IE, IT, LT, NL, PL, PT, SI. 2 AT, BE, ES, FR, GR, IE, IT, NL, PT, SI.
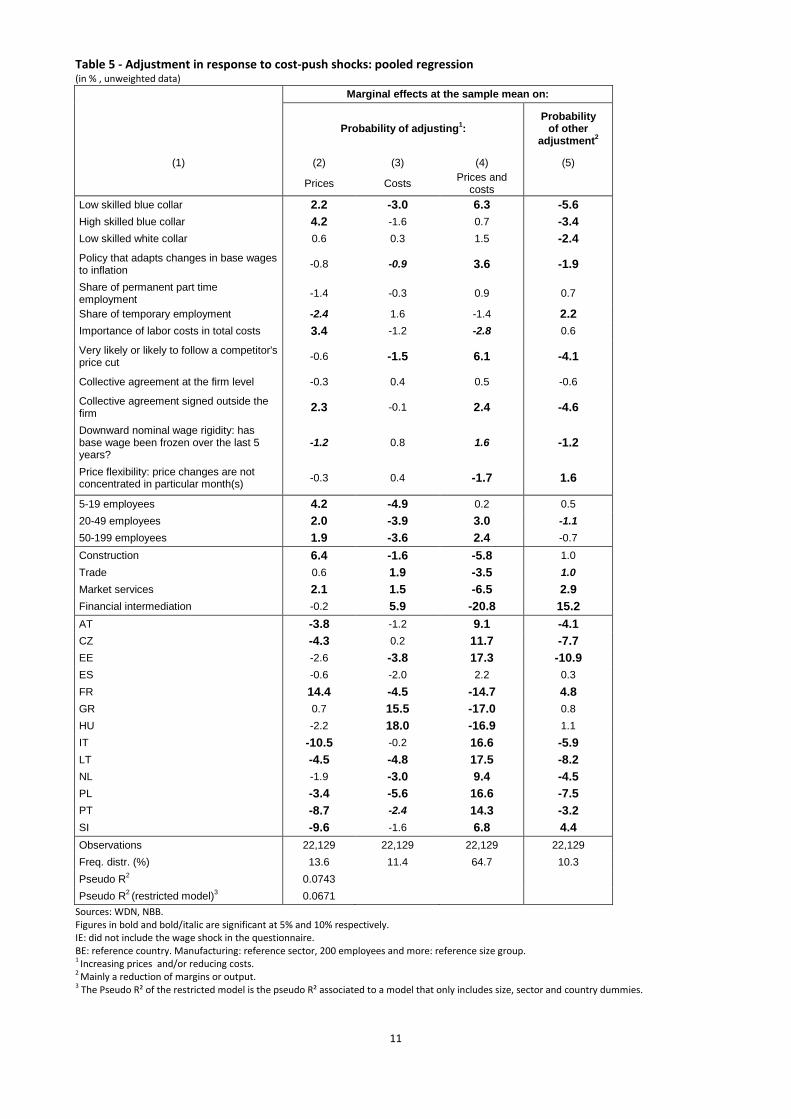
In what follows, the individual responses of firms' to the two cost-push shocks, on the one hand, and to the demand shock, on the other hand, are confronted to the set of explanatory variables described in Section 2. The results are presented in Tables 5 and 6 (cost-push shocks) and in Appendix 5 (demand shock) and they are expressed in terms of marginal effects at the sample mean. They have to be interpreted as follows: the first figure in column (2) of Table 5 means that an increase of 1 percentage point of low skilled blue collar workers in the labor force increases the probability of adjusting prices by 2;2% (significant at 5%). The fourth figure in column (2) of Table 5 indicates that firms using a rule that links base wage changes to inflation are 0.8% less likely to adjust prices in response to a cost-push shock (but this effect is not significant).
3.2. PRICES AND COSTS: WHAT AFFECTS THE ADJUSTMENT CHANNEL AT THE FIRM LEVEL?
As mentioned in Section 3.1, firms that face an unexpected adverse shock, whatsoever its nature (cost-push or demand shock), mainly react by adjusting prices or costs. In the case of a cost-push shock (increase in price of intermediate inputs or wages), 14% of firms will only adjust prices, 11% of them will only reduce costs and 65% will adjust both prices and costs, while the remaining 10% will use another strategy (mainly a reduction of output or margins)(see Table 5). Hence, the most popular response is a combination of price and cost adjustment. Confirming earlier findings from the Inflation Persistence Network (Fabiani et al., 2007), asymmetric reactions between types of shocks are found: firms are more inclined to increase prices after a cost-push shock than to cut prices in response to weaker demand.13
The choice between prices and costs or a combination of both depends on the environment the firm operates in. In theory, firms facing strong competition, have very few margins to adapt prices and are thus expected to reduce costs in response to shocks. Results do not confirm this theory, as firms acting in a competitive environment seem to be less likely to reduce costs. However, they are significantly more likely to use a combination of both price and cost adjustment. An environment where a larger share of prices are state-dependent, used as a proxy for price flexibility, does not enhance a price response and reduces the probability of a reaction in costs and prices. The inconclusiveness of the latter results could be due to the choice of the price flexibility measure. When the labor cost share is high, prices are more likely to be adapted. A tight link between wage and price changes when labor costs are an important part of total costs has also been found in Druant et al. (2009). Looking closer at wage rigidities, results show that the existence of a collective wage agreement signed outside the firm increases the odds of a price and a cost/price reaction. This would mean that rigidities in wages increase the likelihood that cost shocks will be passed on to prices and, hence, be a sign of the presence of second round effects. However, this
13 The results for the demand shock can be found in Appendix 5.1.
0% 10% 20% 30% 40% 50% 60% 70% 80% 90% 100%
Belgium
Average of 15 countries(1)
Average of euro area
countries(2)
Base wage Flexible wage Permanent employment Temporary employmentHours worked Non-labor costs Outsourcing
10
evidence is not confirmed by other measures of wage rigidity tested, namely downward nominal wage rigidity or the existence of a policy that adapts changes in base wages to inflation. The presence of a firm-level wage agreement does not have any significant effects on the choice between adjustment strategies. Firms employing many blue collar workers seem to adapt more easily prices. Those firms probably have smaller margins to reduce costs when facing shocks than firms characterized by a large share of white collar employment. After controlling for the factors mentioned above, the same conclusion holds for small firms. Looking at country effects, controlling for the impact of all other explanatory variables and taking Belgium as the reference country, firms in most countries seem to be less inclined to adjust only costs or only prices and more inclined to use a mixture of both adjustments. However, the position of Belgian firms is not particular in this respect.14
Considering the goodness of fit of our model, the pseudo R² associated to the estimation of our baseline multinomial Logit specification is relatively small. Moreover, it seems that most of the explanatory power of the model is associated to the dummy variables coding for the firm size, the sector and the country.15
In an alternative specification, the set of explanatory variables has been extended. We considered the percentage of employees covered by a collective agreement (hereafter named "coverage") and the share of the wage bill related to individual or company performance as additional explanatory variables. Results with respect to the flexible wage bill are not significant. Firms in which a large share of workers is covered by a collective wage agreement are more inclined to reduce prices and costs in response to shocks. This confirms the assumption that rigidities in wages might increase the likelihood of transmitting cost shocks into prices.
14 Several robustness checks of our results have been performed (introduction of shock specific dummies, removal of not
significant variables ...). These alternative specifications did not alter the main results discussed in Section 3.2. 15 The size, sector and country indicator variables account for 90% of the pseudo R² of our baseline model.
11
Table 5 - Adjustment in response to cost-push shocks: pooled regression (in % , unweighted data)
Marginal effects at the sample mean on:
Probability of adjusting1: Probability
of other adjustment2
(1) (2) (3) (4) (5)
Prices Costs Prices and costs
Low skilled blue collar 2.2 -3.0 6.3 -5.6 High skilled blue collar 4.2 -1.6 0.7 -3.4 Low skilled white collar 0.6 0.3 1.5 -2.4 Policy that adapts changes in base wages to inflation -0.8 -0.9 3.6 -1.9
Share of permanent part time employment -1.4 -0.3 0.9 0.7
Share of temporary employment -2.4 1.6 -1.4 2.2 Importance of labor costs in total costs 3.4 -1.2 -2.8 0.6
Very likely or likely to follow a competitor's price cut -0.6 -1.5 6.1 -4.1
Collective agreement at the firm level -0.3 0.4 0.5 -0.6
Collective agreement signed outside the firm 2.3 -0.1 2.4 -4.6
Downward nominal wage rigidity: has base wage been frozen over the last 5 years?
-1.2 0.8 1.6 -1.2
Price flexibility: price changes are not concentrated in particular month(s) -0.3 0.4 -1.7 1.6
5-19 employees 4.2 -4.9 0.2 0.5 20-49 employees 2.0 -3.9 3.0 -1.1 50-199 employees 1.9 -3.6 2.4 -0.7 Construction 6.4 -1.6 -5.8 1.0 Trade 0.6 1.9 -3.5 1.0 Market services 2.1 1.5 -6.5 2.9 Financial intermediation -0.2 5.9 -20.8 15.2 AT -3.8 -1.2 9.1 -4.1 CZ -4.3 0.2 11.7 -7.7 EE -2.6 -3.8 17.3 -10.9 ES -0.6 -2.0 2.2 0.3 FR 14.4 -4.5 -14.7 4.8 GR 0.7 15.5 -17.0 0.8 HU -2.2 18.0 -16.9 1.1 IT -10.5 -0.2 16.6 -5.9 LT -4.5 -4.8 17.5 -8.2 NL -1.9 -3.0 9.4 -4.5 PL -3.4 -5.6 16.6 -7.5 PT -8.7 -2.4 14.3 -3.2 SI -9.6 -1.6 6.8 4.4 Observations 22,129 22,129 22,129 22,129 Freq. distr. (%) 13.6 11.4 64.7 10.3 Pseudo R2 0.0743 Pseudo R2 (restricted model)3 0.0671
Sources: WDN, NBB. Figures in bold and bold/italic are significant at 5% and 10% respectively. IE: did not include the wage shock in the questionnaire. BE: reference country. Manufacturing: reference sector, 200 employees and more: reference size group. 1 Increasing prices and/or reducing costs. 2 Mainly a reduction of margins or output. 3 The Pseudo R² of the restricted model is the pseudo R² associated to a model that only includes size, sector and country dummies.
12
3.3. HOW DO FIRMS ADJUST COST?
As outlined in Section 2.2, the relevance of employment adjustment as a cost-cutting strategy is to a large extent determined by the presence of wage and employment rigidities, competitive pressures and by labor intensity. These factors will not necessarily lead to similar reductions in permanent employment (pursued by 9% of firms, see Table 6) and in the easy-to-adjust level of temporary employees (pursued by 17% of firms). Wage rigidities, measured by the existence of collective wage agreements signed outside the firm, enhance a reduction of temporary employment in response to adverse shocks. This is also the case for another measure of downward real wage rigidity, namely the presence of a wage-setting rule that links base wage variations to (past or expected) inflation when a demand shock occurs. However, the existence of a firm-level wage agreement does not have any significant impact. Our results also seem to indicate that firms facing downward nominal wage rigidity are more likely to reduce flexible wages. The contra-intuitiveness of the latter result could be due to the choice of the measure for downward nominal wage rigidity. However, it is consistent with the finding of Babecký et al. (2009b) that firms subject to nominal wage rigidity are more likely to use alternative ways of cutting labor costs, such as recruiting new workers at lower wages, using early retirement to replace workers on high wages with workers on lower wages, reducing or abolishing bonuses or benefits in kind, adjusting shift working, and delaying or freezing promotions. The result with respect to nominal rigidities suggests that it is the downward real rigidity that is the source of larger employment fluctuations. If we consider the finding of Messina et al. (2010) that wage rigidity is higher for high skilled workers, our estimation results with respect to skill levels do not support this argument: the larger the share of (low-skilled) blue collar, the lower the odds that a firm reduces wages in response to adverse shocks. This result could partly reflect that firms that employ many blue collars probably have fewer margins to adjust wages as only a small share of wages of blue collars is flexible. However, even after controlling for this in alternative specifications (not presented), this result still holds. The largest employment reaction (permanent and temporary employment) is found for low skilled blue collars, for which labor adjustment costs are generally smaller. Moreover, the larger the share of blue collar workers in the labor force, the larger the probability to cut hours worked. As expected, employment flexibility, measured by the share of part time and temporary employment, enhances the reaction of hours worked and reduces the probability of decreasing flexible pay. A high share of temporary employment increases the likelihood of a reaction in temporary employment, while it protects permanent employment from being reduced. This indicates that European firms tend to divide their labor force into a core component, which is relatively well protected from adverse shocks, and a peripheral component, which supports the necessary adjustment. As expected (Bertola et al., 2010), competitive pressures and a labor intensive production process increase the likelihood of permanent employment and flexible wage responses to shocks. After controlling for the factors mentioned above, smaller firms seem to prefer adjusting costs by reducing hours worked and non-labor costs, but they are less likely to cut temporary employment. This result holds when the share of flexible wage, which is higher in larger firms, is taken into account (alternative specification) and could reflect the fact that smaller firms have simply less margin to reduce the already limited amount of employment. Moreover, professional relationships are probably tighter in small firms, which can restrain employers from cutting employment and induce them to wait for better times. These results are of course conditional on the fact that the shock is not that large that it makes firms disappear, a factor we cannot control for on the basis of the survey information and that applies rather to the more cyclically sensitive small firms. Compared to manufacturing, construction and market services (as well as trade in the case of a demand shock) are more likely to reduce flexible pay (even after controlling for the share of flexible wages in total wages) and less likely to cut temporary employment.16
Finally, according to alternative specifications (not presented here), a high share of variable pay increases the reaction through flexible wages and safeguards employment. Firms in which a large share of workers are covered by a
16 Several robustness checks of our results have been performed (introduction of shock specific dummies, removal of not
significant variables ...). These alternative specifications did not alter the main results discussed in Section 3.3.
13
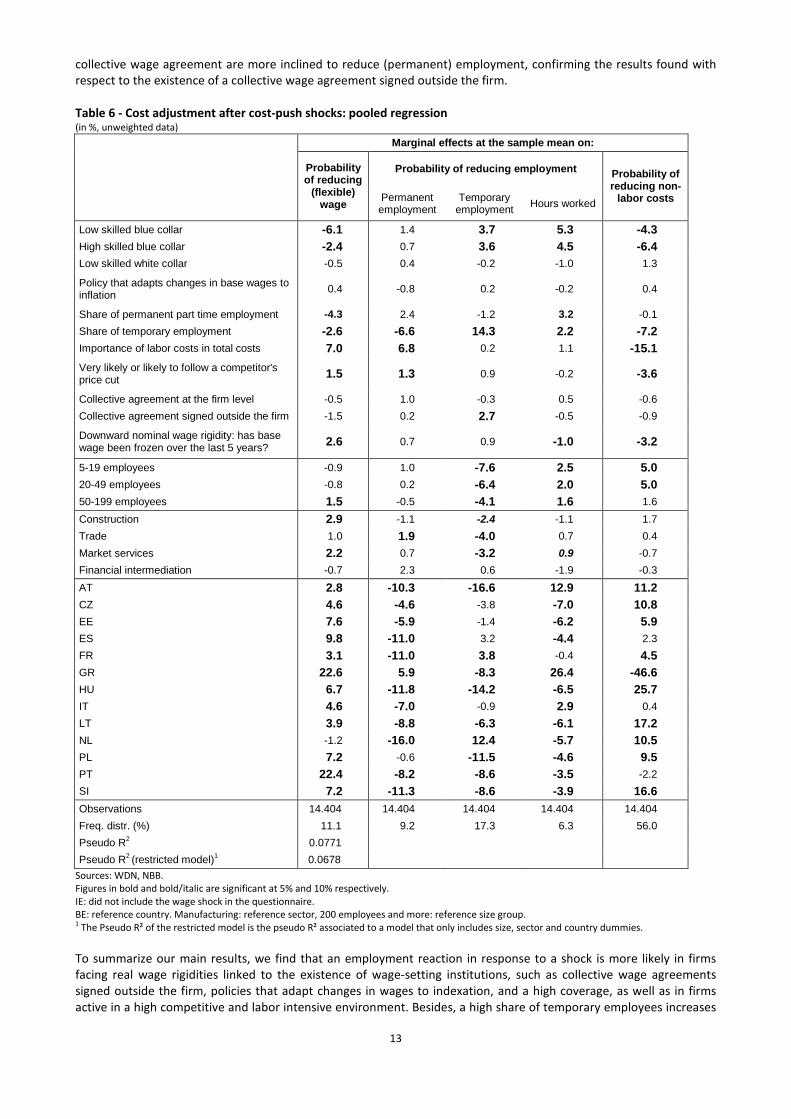
collective wage agreement are more inclined to reduce (permanent) employment, confirming the results found with respect to the existence of a collective wage agreement signed outside the firm. Table 6 - Cost adjustment after cost-push shocks: pooled regression (in %, unweighted data)
Marginal effects at the sample mean on:
Probability of reducing
(flexible) wage
Probability of reducing employment Probability of reducing non-
labor costs
Permanent employment
Temporary employment Hours worked
Low skilled blue collar -6.1 1.4 3.7 5.3 -4.3 High skilled blue collar -2.4 0.7 3.6 4.5 -6.4 Low skilled white collar -0.5 0.4 -0.2 -1.0 1.3
Policy that adapts changes in base wages to inflation 0.4 -0.8 0.2 -0.2 0.4
Share of permanent part time employment -4.3 2.4 -1.2 3.2 -0.1 Share of temporary employment -2.6 -6.6 14.3 2.2 -7.2 Importance of labor costs in total costs 7.0 6.8 0.2 1.1 -15.1 Very likely or likely to follow a competitor's price cut 1.5 1.3 0.9 -0.2 -3.6
Collective agreement at the firm level -0.5 1.0 -0.3 0.5 -0.6 Collective agreement signed outside the firm -1.5 0.2 2.7 -0.5 -0.9
Downward nominal wage rigidity: has base wage been frozen over the last 5 years? 2.6 0.7 0.9 -1.0 -3.2
5-19 employees -0.9 1.0 -7.6 2.5 5.0 20-49 employees -0.8 0.2 -6.4 2.0 5.0 50-199 employees 1.5 -0.5 -4.1 1.6 1.6 Construction 2.9 -1.1 -2.4 -1.1 1.7 Trade 1.0 1.9 -4.0 0.7 0.4 Market services 2.2 0.7 -3.2 0.9 -0.7 Financial intermediation -0.7 2.3 0.6 -1.9 -0.3 AT 2.8 -10.3 -16.6 12.9 11.2 CZ 4.6 -4.6 -3.8 -7.0 10.8 EE 7.6 -5.9 -1.4 -6.2 5.9 ES 9.8 -11.0 3.2 -4.4 2.3 FR 3.1 -11.0 3.8 -0.4 4.5 GR 22.6 5.9 -8.3 26.4 -46.6 HU 6.7 -11.8 -14.2 -6.5 25.7 IT 4.6 -7.0 -0.9 2.9 0.4 LT 3.9 -8.8 -6.3 -6.1 17.2 NL -1.2 -16.0 12.4 -5.7 10.5 PL 7.2 -0.6 -11.5 -4.6 9.5 PT 22.4 -8.2 -8.6 -3.5 -2.2 SI 7.2 -11.3 -8.6 -3.9 16.6 Observations 14.404 14.404 14.404 14.404 14.404 Freq. distr. (%) 11.1 9.2 17.3 6.3 56.0 Pseudo R2 0.0771 Pseudo R2 (restricted model)1 0.0678
Sources: WDN, NBB. Figures in bold and bold/italic are significant at 5% and 10% respectively. IE: did not include the wage shock in the questionnaire. BE: reference country. Manufacturing: reference sector, 200 employees and more: reference size group. 1 The Pseudo R² of the restricted model is the pseudo R² associated to a model that only includes size, sector and country dummies.
To summarize our main results, we find that an employment reaction in response to a shock is more likely in firms facing real wage rigidities linked to the existence of wage-setting institutions, such as collective wage agreements signed outside the firm, policies that adapt changes in wages to indexation, and a high coverage, as well as in firms active in a high competitive and labor intensive environment. Besides, a high share of temporary employees increases

14
the likelihood of a reduction of temporary employment, while it protects permanent employment. Employment is also safeguarded by a large share of flexible pay in total wages. These results corroborate earlier findings by Bertola et al. (2010), although their results are not based on the same set of variables (policies that adapt changes in wages to indexation and coverage were not tested). Moreover, we find a larger employment reaction for firms employing a large share of low skilled blue collars, while small firms and firms operating in construction, trade and market services are less likely to cut temporary employment. If some explanatory variables significantly affect the probability associated to the different cost reduction strategies, the explanatory power of those variables is still extremely small (pseudo R² of 0.077 for the pooled cost-push shocks) and most of the explanation comes from the size, sector and country dummies (88% of the explanation). Most of these findings can partly explain the stronger employment reaction of Belgian firms compared to the average of countries participating in the survey. Belgian companies are indeed characterized (see Table 2) by a larger share of above firm-level collective wage agreements, an automatic system of index-linking wages to past inflation, a high share of employees covered by collective agreements, a low share of flexible wages, many low skilled blue collars in their workforce and a slightly higher labor intensity, compared to the average of the 15 countries participating to the survey. The low competitive pressure they face and the presence of many small firms, however, should safeguard employment. As to the first variable, it is probably unreliable because of the very low response rate in Belgium. In Section 4, we will use an alternative measure for competition. The relatively small share of temporary employment in Belgium, will, on the one hand, reduce lay-offs of temporary workers, but, on the other hand, it won't protect permanent employees when shocks occur. After controlling for the impact of all variables mentioned above, the different employment response of Belgian firms to shocks compared to other countries remains significant. Firms in almost all countries are significantly less likely to reduce permanent and temporary employment than Belgian firms with the same characteristics in terms of coverage, competition etc. (see Table 6). They are also less likely to reduce labor time, while the odds of cutting non-labor costs or flexible wages are higher. Figure 2 - Cost adjustment after cost-push shocks: pooled regression (rank of countries; the higher the rank, the more intensively the strategy is used)
Sources: WDN, NBB. IE: excluded, because it did not include the wage shock in the questionnaire.
15
Based on the probabilities computed at the sample mean, the ranking of the 15 countries reveals that Belgium is ranked highest, after Greece, with respect to the probability of permanent employment adjustment. It is lowest in the Netherlands, a country where firms mostly respond to adverse shocks by cutting temporary employment. A similar trade-off between low permanent employment reaction and high temporary employment adjustment is also found in Spain and France. It goes in the opposite direction in Greece and Poland. Both types of employment reaction rank high in Belgium, as well as in Italy Estonia and the Czech Republic. In order to explain the remaining cross-country differentials, we regress the probability to adjust wages, permanent employment or temporary employment on a set of the 5 variables observed at the national level mentioned in Section 2. Three of those variables relate to the strictness of employment protection legislation, namely protection against dismissals, temporary employment regulation and regulation on collective dismissals. The other two country-specific variables tested are the implicit tax rate on labor and the net replacement ratio of unemployment benefits. The complete set of results is presented in Appendix 4.1 (cost-push shocks) and Appendix 4.2 (demand shock). The most significant results are found when the strictness of protection against dismissals and of temporary employment regulations are taken into account, presented as equation 3 (OLS) and equation 4 (Papke and Wooldridge, 1996, QML estimation) in Appendix 4.1 and 4.2. Based on these equations, it seems that the more stringent the protection against dismissals, the more firms adjust wages and the less firms adjust permanent employment in response to an adverse shock. The marginal effect of an increase in protection of 1 (its value ranges from 0 to 4, according to the increasing degree of stringency) is a 4.2% higher likeliness of a decrease of wages and a 2.1% lower probability of a reduction in permanent employment in the case of cost-push shocks (respectively 4.8% and -6.2% in the case of a demand shock). Results with respect to temporary employment, although not significant, point to a positive relationship with the strictness of employment protection. This means that this form of labor market regulation safeguards permanent employment, while temporary employment acts as a buffer against shocks. Similar results were found by Bertola et al. (2010). As employment protection legislation is less severe in Belgium compared to the average of 15 countries participating in the survey (see Table 3), this indicator helps to explain the larger reaction of permanent employment to shocks in Belgian firms.

16
4. FIRM LEVEL RESPONSE TO UNEXPECTED ADVERSE SHOCKS: SPECIFICITIES OF THE BELGIAN SAMPLE
In a second analysis, we focus on the Belgian sample of 1,420 firms and try to distinguish some common features of Belgian firms with respect to the way they react to unexpected adverse shocks. It is based on the set of the explanatory variables used in Section 3, but some variables could no longer be used while others were added, based on information specific to the Belgian survey. Weighted averages of all these variables are presented in Table 7. Table 7 - Explanatory variables used for the Belgian analysis only (percentages)
Weighted average
Expected probability of employment adjustment
Turnover: share of employees that joined the firm - share of employees that left the firm -0.1 +
Downward real wage rigidity based on distribution of individual wage changes 0.6 +
Positive wage cushion: actual wages > pay scales 72.7 -
No use of alternative strategies (other than cut/freeze base wages) to reduce labor costs 67.4 +
Profit elasticity 7.8 + Firm's employees are covered by an all-in clause 36.2 -
Sources: WDN, NBB. Results weighted on the basis of employment and re-scaled excluding missing answers.
As almost 100% of Belgian firms are covered by a sector-level wage agreement and adopt an automatic system of index-linking wages to past inflation, the variables "collective agreement signed outside the firm" and "policy that adapts changes in base wage to inflation" could not be used. The latter was replaced by an indicator, which represents the share of employees not hit by a real wage cut, while this would have been the case in the absence of rigidities (calculated by Du Caju et al., 2009 for 15 branches of activity). Besides, the effect on wage developments of the Belgian system of automatic wage indexation is tempered to some extent by the activation of all-in clauses which are included in some sectoral wage agreements17
. Based on information from the Federal Public Service Employment, Labour and Social Dialogue, 36 % of employees covered by the survey are subject to this type of clause. Under such sectoral wage agreements, the agreed wage increases depends on the difference between actual and forecasted indexation. If the actual indexation exceeds the level of indexation forecasted at the time of the sectoral negotiations, the difference is deducted from the real wage increases and, in some cases, even from the nominal wage increases. As such, the existence of all-in clauses reduces wage rigidity.
The set of variables used for the Belgian analysis also includes additional information. First, we consider a variable that captures wage adjustment margins by the existence of a positive wage cushion. Namely, we observe in the Belgian survey the extent to which the wages actually paid deviate from the scales fixed by the agreements at the sector level. Only very few firms answer that they pay lower wages, while the wages of 73 % of employees covered by the survey are higher than pay scales. Such a positive wage cushion can provide a buffer between the actual wage and the lower limit for that wage, so that the firm has more scope for adjusting the actual wage in line with economic circumstances without coming up against the lower limit. As such, a positive wage cushion leads to higher wage flexibility. Another variable, although only indirectly related to wage rigidity, is computed on the basis of the survey question "Apart from reducing or freezing base wages, has your firm used other strategies to reduce labor costs?" Among the possibilities were mentioned: recruiting new workers at lower wages, using early retirement to replace workers on high wages with workers on lower wages, reducing or abolishing bonuses or benefits in kind, adjusting shift working, and delaying or freezing promotions. If none of these alternative strategies other than base wages cuts or freezes to
17 More details on the Belgian automatic indexation system and on the all-in clauses can be found in "Report 2008, Economic and
financial developments" of the National Bank of Belgium, Section 4.2.
17
reduce labor costs are used, the only adjustment margin left is to cut employment, as in the case of wage rigidity. This is the case for 67 % of employees covered by the survey. Finally, we added a measure of employment turnover, calculated as the share of employees that joined the firm during the reference period of the survey minus the share of employees that left the firm. This variable captures whether a firm is in a phase of expansion or decline and gives indications on the flexibility of employment. As the response rate to the question used to proxy competitive pressure in the international analysis was relatively low in Belgium (less than 40%18
), the profit elasticity estimated by Du Caju et al. (2009) for 15 branches of activity has been used as an alternative in the Belgian analysis; following the arguments in Boone (2008).
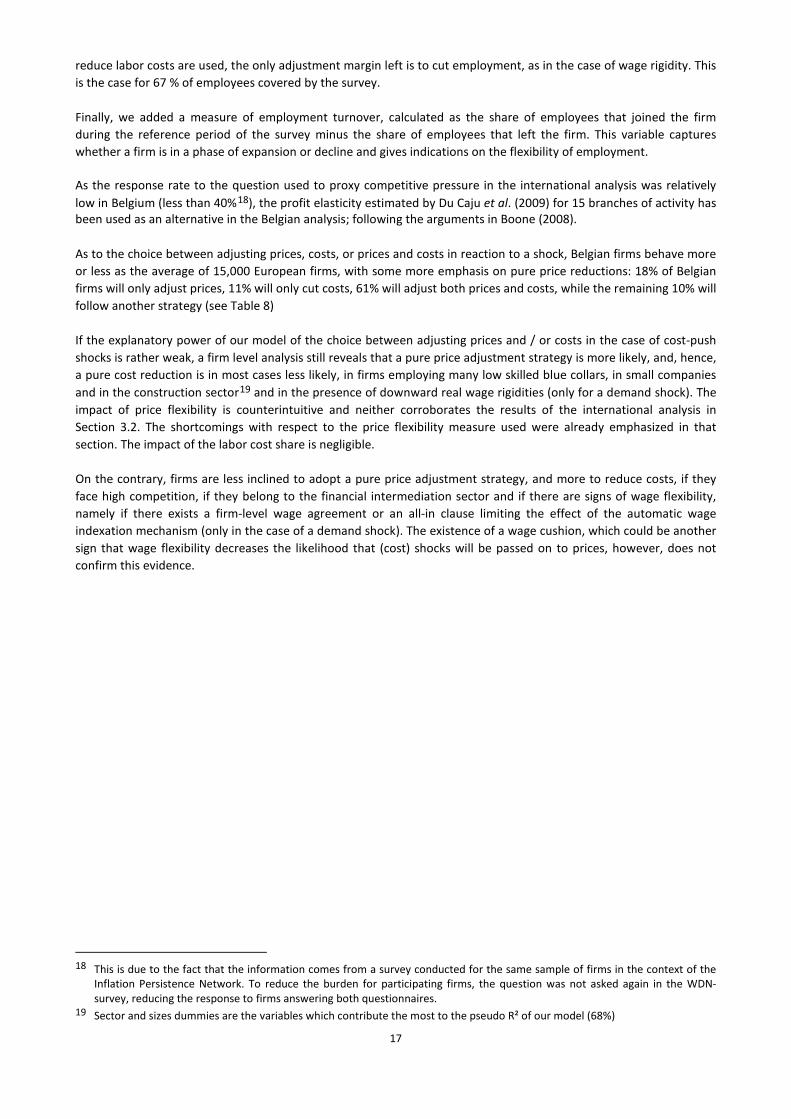
As to the choice between adjusting prices, costs, or prices and costs in reaction to a shock, Belgian firms behave more or less as the average of 15,000 European firms, with some more emphasis on pure price reductions: 18% of Belgian firms will only adjust prices, 11% will only cut costs, 61% will adjust both prices and costs, while the remaining 10% will follow another strategy (see Table 8) If the explanatory power of our model of the choice between adjusting prices and / or costs in the case of cost-push shocks is rather weak, a firm level analysis still reveals that a pure price adjustment strategy is more likely, and, hence, a pure cost reduction is in most cases less likely, in firms employing many low skilled blue collars, in small companies and in the construction sector19
and in the presence of downward real wage rigidities (only for a demand shock). The impact of price flexibility is counterintuitive and neither corroborates the results of the international analysis in Section 3.2. The shortcomings with respect to the price flexibility measure used were already emphasized in that section. The impact of the labor cost share is negligible.
On the contrary, firms are less inclined to adopt a pure price adjustment strategy, and more to reduce costs, if they face high competition, if they belong to the financial intermediation sector and if there are signs of wage flexibility, namely if there exists a firm-level wage agreement or an all-in clause limiting the effect of the automatic wage indexation mechanism (only in the case of a demand shock). The existence of a wage cushion, which could be another sign that wage flexibility decreases the likelihood that (cost) shocks will be passed on to prices, however, does not confirm this evidence.
18 This is due to the fact that the information comes from a survey conducted for the same sample of firms in the context of the
Inflation Persistence Network. To reduce the burden for participating firms, the question was not asked again in the WDN-survey, reducing the response to firms answering both questionnaires.
19 Sector and sizes dummies are the variables which contribute the most to the pseudo R² of our model (68%)
18
Table 8 - Adjustment of Belgian firms in response to cost-push shocks: pooled regression (in %, unweighted data)
Marginal effects at the sample mean on:
Probability of adjusting1: Probability of other
adjustment2 Prices Costs Prices and costs
Low skilled blue collar 9.1 -7.9 -0.3 -0.9 High skilled blue collar 2.5 -2.6 -3.9 3.9 Low skilled white collar 6.9 -3.9 -10.1 7.0
Share of permanent part time employment -10.6 0.8 -0.2 10.0 Share of temporary employment -0.3 0.2 0.0 0.0
Importance of labor costs in total costs 0.0 0.0 -0.1 0.1
Collective agreement at the firm level -3.8 0.2 2.3 1.3
Downward nominal wage rigidity: has base wage been frozen over the last 5 years?
-1.3 3.4 -3.5 1.3
Price flexibility: price changes are not concentrated in particular month(s)
-1.4 3.5 -5.7 3.6
Share of employees that joined the firm - share of employees that left the firm
0.1 0.0 -0.1 0.0
Positive wage cushion: actual wages > pay scales
1.6 -2.2 6.0 -5.3
Downward real wage rigidity based on distribution of individual wage changes
3.8 5.7 -15.3 5.8
Profit elasticity -3.6 2.2 0.9 0.6
Firm's employees are covered by an all-in clause
-3.2 0.9 0.8 1.4
5-19 employees 10.5 0.5 -11.3 0.3 20-49 employees 10.0 -1.2 -5.6 -3.2 50-199 employees 2.5 3.6 -4.0 -2.1 Construction 12.0 -8.4 -5.2 1.6 Trade 1.0 0.8 -4.7 2.8 Market services -5.7 3.9 -3.0 4.8 Financial intermediation -11.1 47.4 -35.9 -0.5 Observations 2,023 2,023 2,023 2,023 Freq. distr. (%) 17.7 10.6 61.5 10.1 Pseudo R2 0.0685 Pseudo R2 (restricted model)3 0.0468
Sources: WDN, NBB. Figures in bold and bold/italic are significant at 5% and 10% respectively. Manufacturing: reference sector, 200 employees and more: reference size group.
1 Increasing prices and/or reducing costs. 2 Mainly a reduction of margins or output. 3 The Pseudo R² of the restricted model is the pseudo R² associated to a model that only includes size and sector dummies.
The cost-adjustment strategy of Belgian firms differs significantly from the average of firms in the 15 participating countries: 18% of firms will reduce the permanent workforce and 19% will cut temporary employment (see Table 9), compared to respectively 9% and 17% on average for the two cost-push shocks (see Table 6) and 28% and 23%, compared to 13% and 25% for the demand shock (see Appendix 5.4 and 5.2).. The strong reaction of temporary employment is remarkable as this type of employees is only 2.7% of the workforce in Belgium, while it is 10% on average in all countries considered (see Table 2). However, the adjustment costs associated to temporary employment relative to the adjustment costs associated to permanent employment seem to be extremely low in Belgium (Dhyne and Mahy, 2009). Even if temporary employment represents a small fraction of total employment, almost 20% of Belgian firms, mostly the large ones, have temporary employees in their workforce. Therefore, many firms can use flexible employment as a buffer to absorb unexpected shocks. Wage rigidity/flexibility has a strong impact on the cost-adjustment strategy used by firms to face shocks. The likelihood of a reduction of temporary employment is higher in the presence of downward real wage rigidity, and it is lower when a wage cushion exists. The variable with respect to the inclusion of all-in clauses in collective wage
19
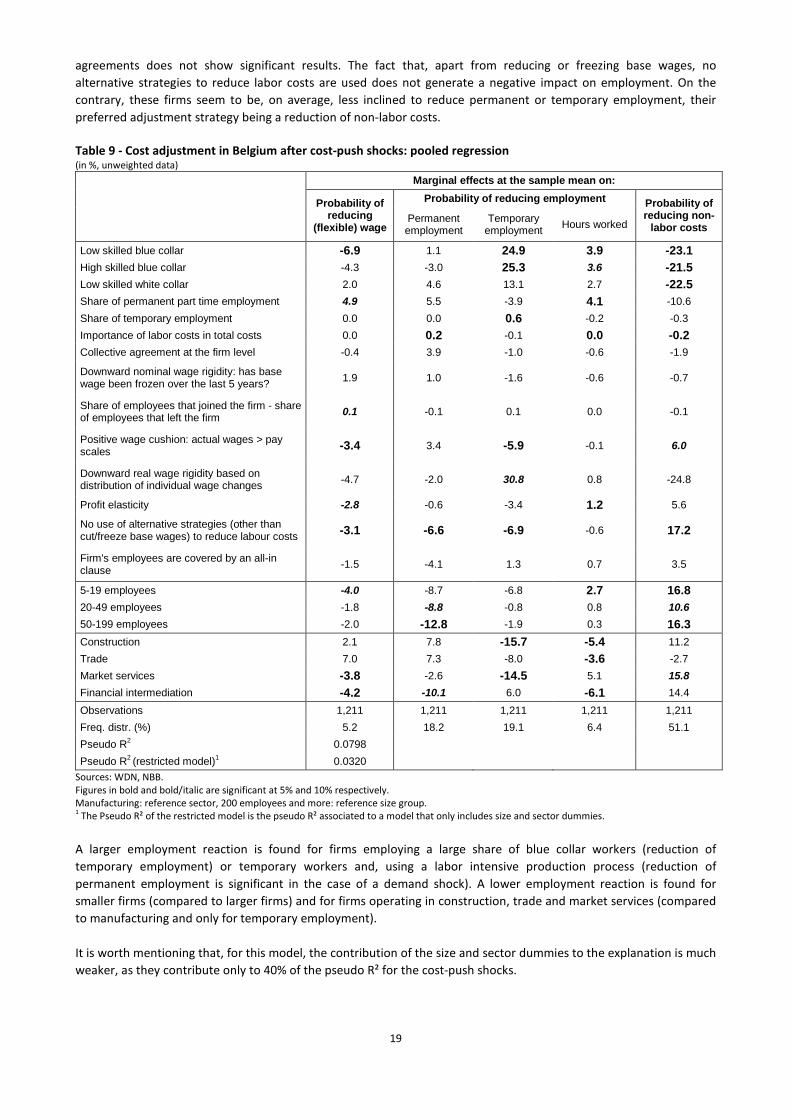
agreements does not show significant results. The fact that, apart from reducing or freezing base wages, no alternative strategies to reduce labor costs are used does not generate a negative impact on employment. On the contrary, these firms seem to be, on average, less inclined to reduce permanent or temporary employment, their preferred adjustment strategy being a reduction of non-labor costs. Table 9 - Cost adjustment in Belgium after cost-push shocks: pooled regression (in %, unweighted data)
Marginal effects at the sample mean on: Probability of
reducing (flexible) wage
Probability of reducing employment Probability of reducing non-
labor costs Permanent employment
Temporary employment Hours worked
Low skilled blue collar -6.9 1.1 24.9 3.9 -23.1 High skilled blue collar -4.3 -3.0 25.3 3.6 -21.5 Low skilled white collar 2.0 4.6 13.1 2.7 -22.5 Share of permanent part time employment 4.9 5.5 -3.9 4.1 -10.6 Share of temporary employment 0.0 0.0 0.6 -0.2 -0.3 Importance of labor costs in total costs 0.0 0.2 -0.1 0.0 -0.2 Collective agreement at the firm level -0.4 3.9 -1.0 -0.6 -1.9
Downward nominal wage rigidity: has base wage been frozen over the last 5 years? 1.9 1.0 -1.6 -0.6 -0.7
Share of employees that joined the firm - share of employees that left the firm 0.1 -0.1 0.1 0.0 -0.1
Positive wage cushion: actual wages > pay scales -3.4 3.4 -5.9 -0.1 6.0
Downward real wage rigidity based on distribution of individual wage changes -4.7 -2.0 30.8 0.8 -24.8
Profit elasticity -2.8 -0.6 -3.4 1.2 5.6
No use of alternative strategies (other than cut/freeze base wages) to reduce labour costs -3.1 -6.6 -6.9 -0.6 17.2
Firm's employees are covered by an all-in clause -1.5 -4.1 1.3 0.7 3.5
5-19 employees -4.0 -8.7 -6.8 2.7 16.8 20-49 employees -1.8 -8.8 -0.8 0.8 10.6 50-199 employees -2.0 -12.8 -1.9 0.3 16.3 Construction 2.1 7.8 -15.7 -5.4 11.2 Trade 7.0 7.3 -8.0 -3.6 -2.7 Market services -3.8 -2.6 -14.5 5.1 15.8 Financial intermediation -4.2 -10.1 6.0 -6.1 14.4 Observations 1,211 1,211 1,211 1,211 1,211 Freq. distr. (%) 5.2 18.2 19.1 6.4 51.1 Pseudo R2 0.0798 Pseudo R2 (restricted model)1 0.0320
Sources: WDN, NBB. Figures in bold and bold/italic are significant at 5% and 10% respectively. Manufacturing: reference sector, 200 employees and more: reference size group. 1 The Pseudo R² of the restricted model is the pseudo R² associated to a model that only includes size and sector dummies.
A larger employment reaction is found for firms employing a large share of blue collar workers (reduction of temporary employment) or temporary workers and, using a labor intensive production process (reduction of permanent employment is significant in the case of a demand shock). A lower employment reaction is found for smaller firms (compared to larger firms) and for firms operating in construction, trade and market services (compared to manufacturing and only for temporary employment). It is worth mentioning that, for this model, the contribution of the size and sector dummies to the explanation is much weaker, as they contribute only to 40% of the pseudo R² for the cost-push shocks.
20
The group of firms that are more likely to reduce hours worked in response to cost-push shocks, is characterized by a large share of part time employees, high profit elasticity, a small size in terms of number of employees and many blue collar workers. The system of temporary unemployment, which enables firms to reduce paid hours without having to fire people, was until July 2009 only applicable to the latter group of workers. Although the survey does not provide information on the time dimension of the reaction to shocks, results suggest that the system of temporary unemployment allows firms to encounter (short) bad periods, but that it does not protect against dismissal in the long run. A reduction of hours can also be realized through cutting overtime work and is more likely for blue and low-skilled white collars.20
5. CONCLUSIONS
Besides confirming earlier findings with respect to the response of firms to cost-push shocks (Bertola et al., 2010) and to the link between wage and price changes (Druant et al., 2009), this paper provides new empirical evidence for monetary policy models, namely that real wage rigidities lead to larger employment reactions and that they are, just like employment protection, a cause of different employment response between countries. It analyses the reaction of Belgian firms to adverse shocks and compares with other European firms on the basis of the pooled results of a harmonized survey in 15 European countries, covering almost 15,000 firms. The Belgian dataset, which is part of the pooled database, comprises 1,420 firms. On the basis of the analysis of a pooled regression of the firms' reaction to two cost-push shocks, namely an increase in the cost of intermediate inputs and a general rise in labor costs, and of a regression of the firms' reaction to a negative demand shock, we test the adjustment channel used by European firms : Do they adjust prices ? Costs? Or a mixture of both? In the case of a cost adjustment, the choice between a reduction of (base or flexible) wages, permanent employment, temporary employment, hours worked or non-labor costs is investigated. This exercise is done twice: firstly, for a sample of 15,000 European firms, in order to detect whether Belgian firms exhibit different reactions, and secondly, for the sub-sample of Belgian firms only, in order to distinguish some common features or groups of Belgian firms, in the way they adjust to shocks. In both cases, the same set of explanatory variables is used, although, in the latter case, additional variables, based on country-specific information, have been added. Although their explanatory power is limited, the variables investigated provide valuable information on the key question of this paper: why are Belgian firms using more intensively (relative to other European firms) the employment channel in response to adverse shocks? With respect to the choice between prices and costs, our analysis reveals that the most popular response to cost-push shocks, used by two-third of European firms, is a combination of both price and cost adjustment. 14% of firms will only adjust prices, 11% of them will only reduce costs, while the remaining 10% will use another strategy. A pure price adjustment strategy is more likely, and, hence, a pure cost reduction is in most cases less likely, if the labor cost share is high, in firms employing many (low skilled) blue collar workers, in small companies and when wages are rigid (although some measures of wage rigidity show counterintuitive results). On the contrary, firms are less inclined to adopt a pure price adjustment strategy, and more likely to reduce prices and costs, if they face high competition. Belgian firms behave more or less the same. Moreover, they add explanatory power to wage rigidity/flexibility, as the variable "firm-level wage agreement" becomes significant. Overall, international and Belgian survey findings with respect to wage rigidity suggest that flexible wages reduce the likelihood that (cost) shocks will be passed on to prices. Firms that respond to a shock by adjusting their costs, do so mostly by reducing non-labor costs. The survey analysis reveals that 27% of European firms will reduce employment, while the remaining 17% will cut flexible wages or working time. An employment reaction is more likely in firms facing (real) wage rigidities linked to the existence of wage-setting institutions, such as collective wage agreements signed outside the firm, policies that adapt changes in wages to indexation (only for a demand shock), and a high coverage, as well as in firms active in a highly competitive and labor intensive environment and employing many low skilled blue collars. Besides, a high share of temporary employees increases the likelihood of a reduction in temporary employment, while it protects permanent employment. This indicates that European firms divide their labor force into a core component, which is relatively well protected from adverse shocks, and a peripheral component, which supports the necessary adjustment. Employment
20 Several robustness checks of our results have been performed (introduction of shock specific dummies, removal of not
significant variables ...). These alternative specifications did not alter the main results discussed in Section 4.
21
is also safeguarded by a large share of flexible pay in total wages and firms operating in construction, trade and market services, as well as small firms are less likely to cut back on temporary employment. The latter result could reflect the fact that smaller firms have simply less margin to reduce the already limited amount of employment and that tighter professional relationships might protect against dismissal. These results are of course conditional on the fact that the shock is not so large that it would push the firm out of the market, a factor we cannot control for. Most of these findings go some way towards explaining the stronger employment reaction of Belgian firms (37% of firms will cut employment) compared to the average of countries participating in the survey. Belgian companies are indeed characterized by a larger share of above-firm-level collective wage agreements, an automatic system of index-linking wages to past inflation, a high share of employees covered by collective agreements, a low share of flexible wages, slightly higher labor intensity and many low skilled blue collars in their workforce, compared to the average of the 15 countries. As for the blue collar workers, a reduction in the number of hours worked is also more likely, because the system of temporary unemployment protects workers against dismissal in the initial phase of the shock. Even though the share of temporary employment is low in Belgium, its use is widespread and adjustment costs are low compared to permanent employment. Therefore, many firms use flexible employment as a buffer to absorb unexpected shocks. The presence of many small firms in Belgium also tends to safeguard employment. A test of some country-specific control variables reveals that employment is further protected by the presence of a wage cushion. After controlling for the impact of the common variables mentioned above, the difference between the employment response to shocks of firms in Belgium and that of other countries remains significant. In order to explain the remaining cross-country differences, the probability of adjusting wages, permanent employment or temporary employment is regressed on a set of variables observed at the national level. The results reveal that the more stringent the legislation with respect to the protection against dismissals, the more firms adjust wages and the less they tend to adjust permanent employment, with temporary employment contracts acting as a buffer in response to an adverse shock. As the legislation is less strict in Belgium, it helps to explain the larger reaction of permanent employment to shocks in Belgian firms.
22
REFERENCES
Babecký J., P. Du Caju, T. Kosma, M. Lawless, J. Messina and T. Rõõm (2009a), Downward nominal and real wage
rigidity: Survey evidence from European firms, NBB Working Paper Research 182.
Babecký J., P. Du Caju, T. Kosma, M. Lawless, J. Messina and T. Rõõm (2009b), The margins of labour cost adjustment:
Survey evidence from European firms, NBB Working Paper Research 183.
Bertola G., A. Dabusinskas, M. M. Hoeberichts, M. Izquierdo, C. Kwapil, J. Montornès and D. Radowski (2010), Price,
wage and employment response to shocks: Evidence from the WDN survey, ECB Working Paper 1164.
Boone J. (2008), "A new way to measure competition", Economic Journal, Vol. 118, pp. 1245-1261
Dhyne E. and B. Mahy (2009), The use of fixed-term contracts and the labour adjustment in Belgium, NBB Working
Paper Research 169.
Dhyne E., C. Fuss, H. Pesaran and P. Sevestre (2007), Lumpy price adjustments: A microeconometric analysis, CESIfo
Working Paper Series 2010.
Dickens W.T., L. Goette, E.L. Groshen, S. Holden, J. Messina, M. E. Schweitzer, J. Turunen and M.E. Ward (2007), "How
wages change: Micro evidence from the International Wage Flexibility Network", Journal of Economic Perspectives,
21(2), 95 -214.
Druant M., Ph. Du Caju and Ph. Delhez (2008), "Results of the Bank's survey of wage-setting in Belgian firms",
Economic Review of the National Bank of Belgium, September, 49-73.
Druant M., S. Fabiani, G. Kezdi, A. Lamo, F. Martins and R. Sabbatini (2009), How are firms' wages and prices linked:
Survey evidence in Europe, NBB Working Paper Research 174.
Du Caju P., C. Fuss and L. Wintr (2009), Understanding sectoral differences in downward real wage rigidity: workforce
composition, institutions, technology and competition, NBB Working Paper Research 156.
EC(2009), Taxation trends in the European Union, Luxembourg, Office for Official Publications of the European
Communities.
ECB (2009), "New survey evidence on wage setting in Europe", Monthly Bulletin, February, 69 -84.
Fabiani S., C. Loupias, F. Martins and R. Sabbatini (2007), Pricing decisions in the euro area: How firms set prices and
why, New York, US, Oxford University Press.
Fuss C. (2009), "What is the most flexible component of wage bill adjustment? Evidence from Belgium", Labour
Economics, 16(3), 320-329.
Fuss C. and L. Wintr (2009), Rigid labor compensation and flexible employment? Firm-level evidence with regard to
productivity for Belgium, NBB Working Paper Research 159.
Hall R.E. (2005), "Employment fluctuations with equilibrium wage stickiness", American Economic Review, 95(1),
50-65.
Messina J., P. Du Caju, C.F. Duarte, M. Izquierdo and N.L. Hansen (2010), The incidence of nominal and real wage
rigidity: An individual based sectoral approach, Journal of the European Economic Association, 8(2-3), 487-496.

23
OECD (2004), Employment Outlook, Paris, France.
OECD (2006), Benefits and wages, Paris, France.
Papke L. E. and J. M. Wooldridge (1996). "Econometric methods for fractional response with an application to 401(K)
plan participation rates" Journal of Applied Econometrics, 11(6), 619-632.
Tonin M. (2005), Updated employment protection legislation indicators for Central and Eastern European Countries,
Institute for International Economic Studies.

24
Appendix 1 - Variables used in the international regression analysis
Name Description Calculation Availability by country Three shocks: prices or costs
Availability by country Three shocks: wages or labor
pays_1 AT
Dummies: 1 if yes, 0 otherwise
Yes Yes pays_2 BE Yes Yes pays_3 CZ Yes Yes pays_4 EE Yes Yes pays_5 ES Yes Yes pays_6 FR Yes Yes pays_7 GR Yes Yes pays_8 HU Yes Yes pays_9 IE No No pays_10 IT Yes Yes pays_11 LT Yes Yes pays_12 NL Yes Yes pays_13 PL Yes Yes pays_14 PT Yes Yes pays_15 SI Yes Yes
sec_1 Manufacturing=NACE 15 to
37
Dummies: 1 if yes, 0 otherwise
All countries except IE All countries except IE
sec_2 Construction=NACE 45 All except ES, FR, GR, IE, IT
All except ES, FR, GR, IE, IT
sec_3 Trade=NACE 50 to 52 All countries except IE All countries except IE sec_4 Market services=NACE 55 to
64 and 70 to 74 All countries except IE All countries except IE
sec_5 Financial intermediation=NACE 65 to 67
All except CZ, EE, ES, FR, GR,IE
All except CZ, EE, ES, FR, GR,IE
size_1 5-19 employees
Dummies: 1 if yes, 0 otherwise
All except CZ, IE All except CZ, IE size_2 20-49 employees All countries except IE All countries except IE size_3 50-199 employees All countries except IE All countries except IE size_4 200 employees and more All countries except IE All countries except IE
Composition of the workforce
Dummies: 1 if yes, 0 otherwise Drop if C_1a+C_1b+C_1c+C_1d < than 90% of workforce
C_1a Low skilled blue collar All countries except IE All countries except IE C_1b High skilled blue collar All countries except IE All countries except IE C_1c Low skilled white collar All countries except IE All countries except IE C_1d High skilled white collar All countries except IE All countries except IE
C_34c Share of permanent part
time employment Pct. of total employment
All countries except IE All countries except IE
C_34d Share of temporary
employment Pct. of total employment
All countries except IE All countries except IE
Measure of price flexibility
C_32m Price changes are not concentrated in particular month(s)
Dummy: 1 if yes, 0 otherwise
All countries except IE Not used
Direct measures of wage rigidity
DNWR Downward nominal wage rigidity: has base wage been frozen over the last 5 years?
Dummy: 1 if yes, 0 otherwise
All countries except IE All countries except IE
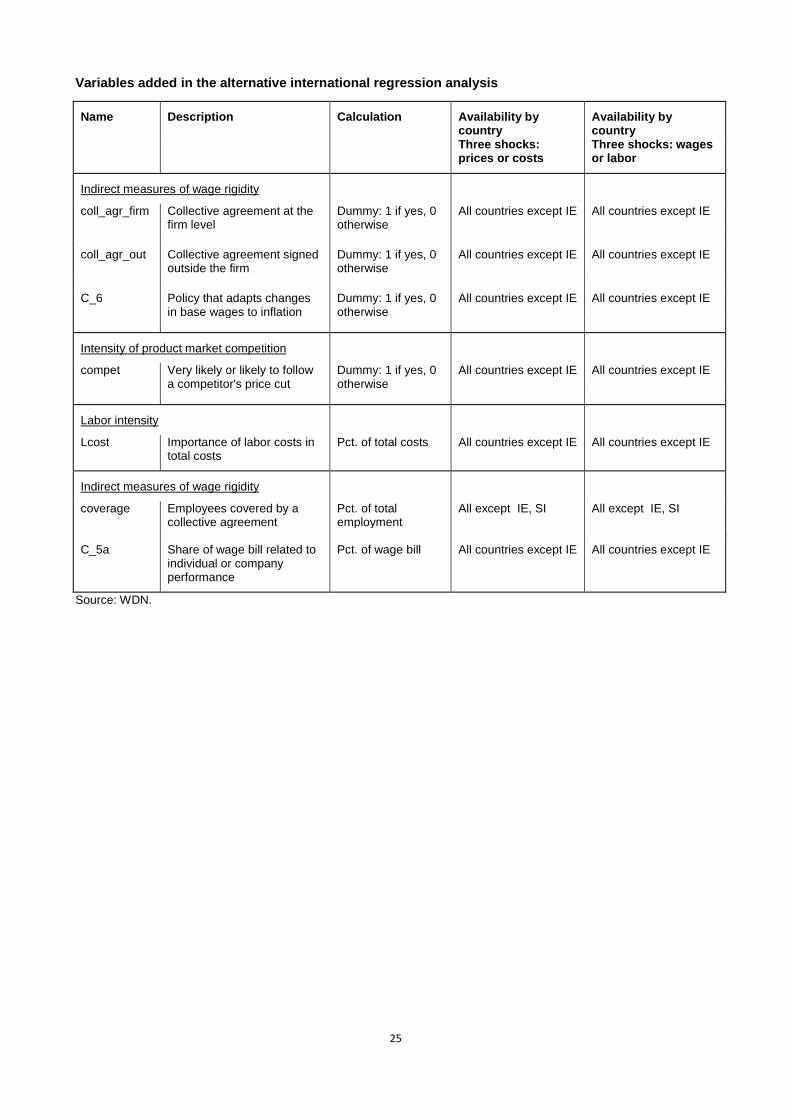
25
Variables added in the alternative international regression analysis
Name Description Calculation Availability by country
Availability by country
Three shocks: prices or costs
Three shocks: wages or labor
Indirect measures of wage rigidity
coll_agr_firm Collective agreement at the firm level
Dummy: 1 if yes, 0 otherwise
All countries except IE All countries except IE
coll_agr_out Collective agreement signed
outside the firm Dummy: 1 if yes, 0 otherwise
All countries except IE All countries except IE
C_6 Policy that adapts changes
in base wages to inflation Dummy: 1 if yes, 0 otherwise
All countries except IE All countries except IE
Intensity of product market competition
compet Very likely or likely to follow a competitor's price cut
Dummy: 1 if yes, 0 otherwise
All countries except IE All countries except IE
Labor intensity
Lcost Importance of labor costs in total costs
Pct. of total costs All countries except IE All countries except IE
Indirect measures of wage rigidity
coverage Employees covered by a collective agreement
Pct. of total employment
All except IE, SI All except IE, SI
C_5a Share of wage bill related to
individual or company performance
Pct. of wage bill All countries except IE All countries except IE
Source: WDN.
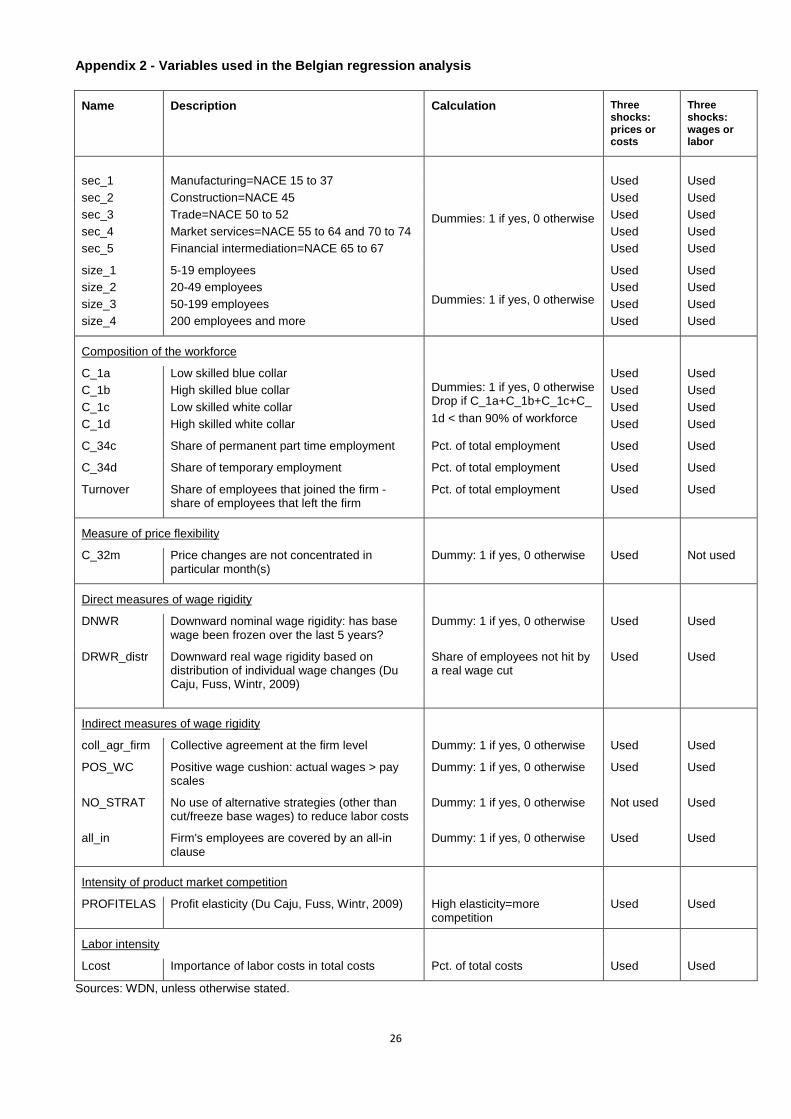
26
Appendix 2 - Variables used in the Belgian regression analysis
Name Description Calculation Three shocks: prices or costs
Three shocks: wages or labor
sec_1 Manufacturing=NACE 15 to 37
Dummies: 1 if yes, 0 otherwise
Used Used sec_2 Construction=NACE 45 Used Used sec_3 Trade=NACE 50 to 52 Used Used sec_4 Market services=NACE 55 to 64 and 70 to 74 Used Used sec_5 Financial intermediation=NACE 65 to 67 Used Used
size_1 5-19 employees
Dummies: 1 if yes, 0 otherwise
Used Used size_2 20-49 employees Used Used size_3 50-199 employees Used Used size_4 200 employees and more Used Used
Composition of the workforce
C_1a Low skilled blue collar Dummies: 1 if yes, 0 otherwise Drop if C_1a+C_1b+C_1c+C_ 1d < than 90% of workforce
Used Used C_1b High skilled blue collar Used Used C_1c Low skilled white collar Used Used C_1d High skilled white collar Used Used
C_34c Share of permanent part time employment Pct. of total employment Used Used
C_34d Share of temporary employment Pct. of total employment Used Used
Turnover Share of employees that joined the firm - share of employees that left the firm
Pct. of total employment Used Used
Measure of price flexibility
C_32m Price changes are not concentrated in particular month(s)
Dummy: 1 if yes, 0 otherwise Used Not used
Direct measures of wage rigidity
DNWR Downward nominal wage rigidity: has base wage been frozen over the last 5 years?
Dummy: 1 if yes, 0 otherwise Used Used
DRWR_distr Downward real wage rigidity based on distribution of individual wage changes (Du Caju, Fuss, Wintr, 2009)
Share of employees not hit by a real wage cut
Used Used
Indirect measures of wage rigidity
coll_agr_firm Collective agreement at the firm level Dummy: 1 if yes, 0 otherwise Used Used
POS_WC Positive wage cushion: actual wages > pay scales
Dummy: 1 if yes, 0 otherwise Used Used
NO_STRAT No use of alternative strategies (other than cut/freeze base wages) to reduce labor costs
Dummy: 1 if yes, 0 otherwise Not used Used
all_in Firm's employees are covered by an all-in clause
Dummy: 1 if yes, 0 otherwise Used Used
Intensity of product market competition
PROFITELAS Profit elasticity (Du Caju, Fuss, Wintr, 2009) High elasticity=more competition
Used Used
Labor intensity
Lcost Importance of labor costs in total costs Pct. of total costs Used Used
Sources: WDN, unless otherwise stated.
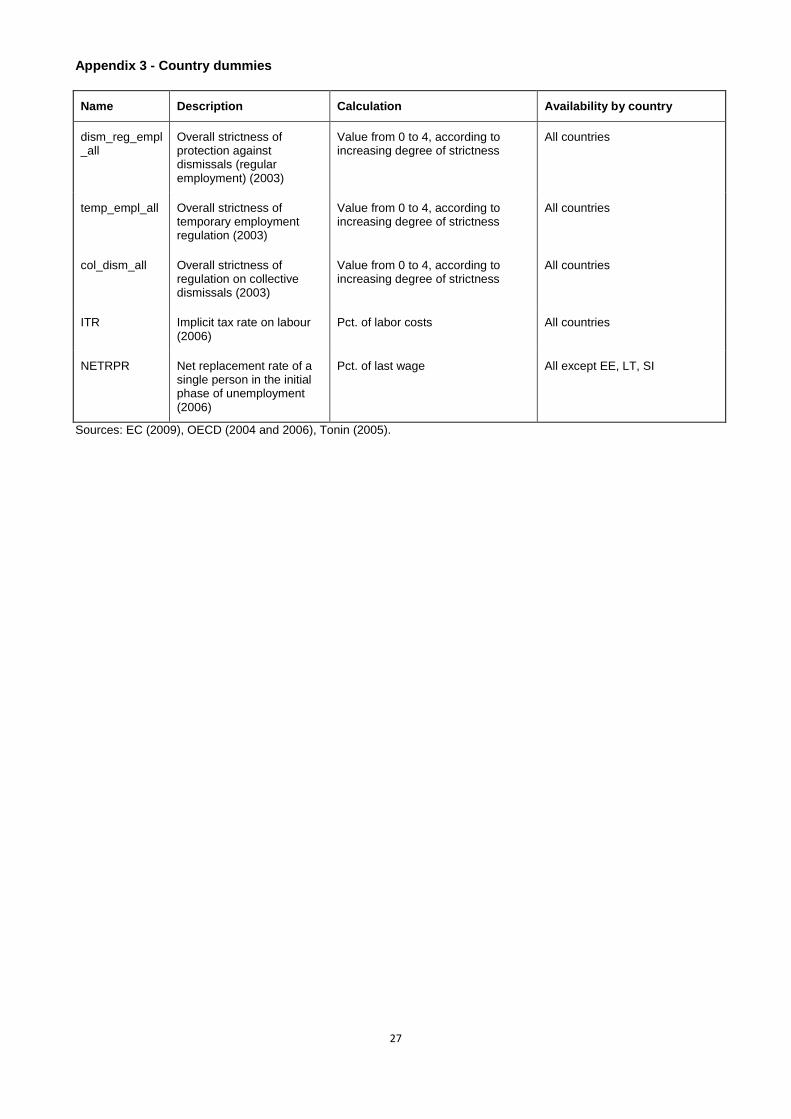
27
Appendix 3 - Country dummies
Name Description Calculation Availability by country
dism_reg_empl_all
Overall strictness of protection against dismissals (regular employment) (2003)
Value from 0 to 4, according to increasing degree of strictness
All countries
temp_empl_all Overall strictness of temporary employment regulation (2003)
Value from 0 to 4, according to increasing degree of strictness
All countries
col_dism_all Overall strictness of regulation on collective dismissals (2003)
Value from 0 to 4, according to increasing degree of strictness
All countries
ITR Implicit tax rate on labour (2006)
Pct. of labor costs All countries
NETRPR Net replacement rate of a single person in the initial phase of unemployment (2006)
Pct. of last wage All except EE, LT, SI
Sources: EC (2009), OECD (2004 and 2006), Tonin (2005).
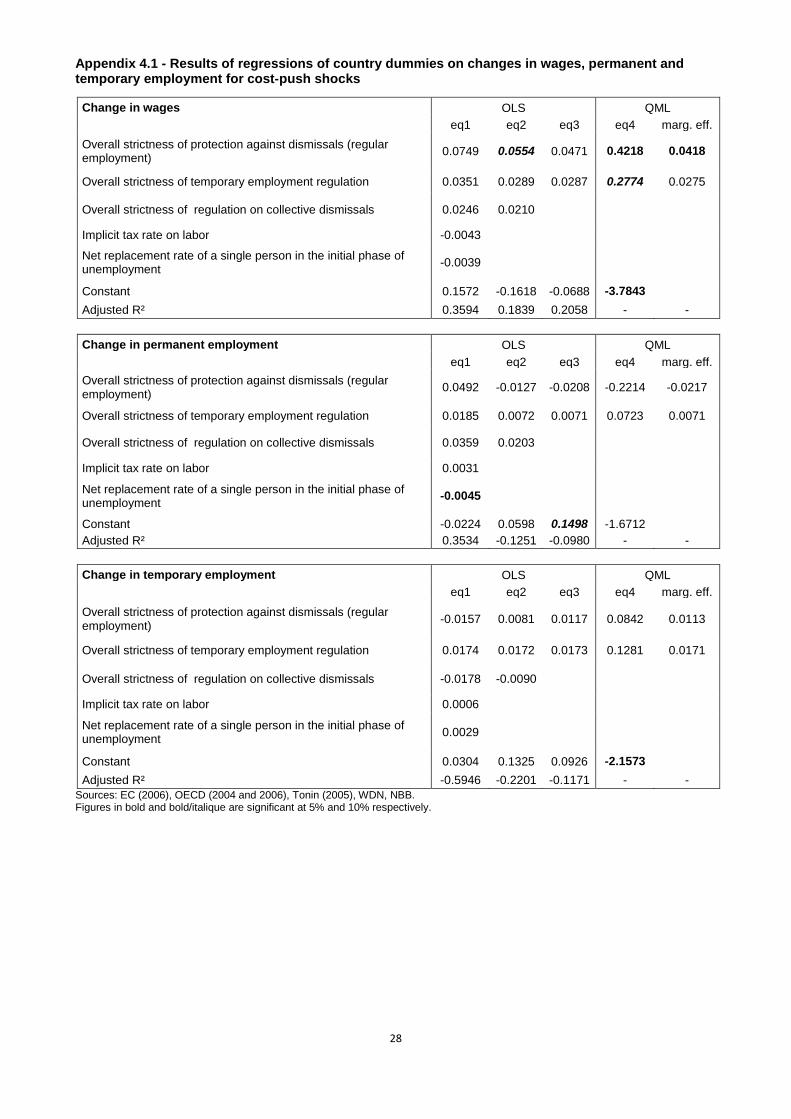
28
Appendix 4.1 - Results of regressions of country dummies on changes in wages, permanent and temporary employment for cost-push shocks
Change in wages OLS QML eq1 eq2 eq3 eq4 marg. eff. Overall strictness of protection against dismissals (regular employment) 0.0749 0.0554 0.0471 0.4218 0.0418
Overall strictness of temporary employment regulation 0.0351 0.0289 0.0287 0.2774 0.0275
Overall strictness of regulation on collective dismissals 0.0246 0.0210
Implicit tax rate on labor -0.0043
Net replacement rate of a single person in the initial phase of unemployment -0.0039
Constant 0.1572 -0.1618 -0.0688 -3.7843 Adjusted R² 0.3594 0.1839 0.2058 - - Change in permanent employment OLS QML eq1 eq2 eq3 eq4 marg. eff. Overall strictness of protection against dismissals (regular employment) 0.0492 -0.0127 -0.0208 -0.2214 -0.0217
Overall strictness of temporary employment regulation 0.0185 0.0072 0.0071 0.0723 0.0071
Overall strictness of regulation on collective dismissals 0.0359 0.0203
Implicit tax rate on labor 0.0031
Net replacement rate of a single person in the initial phase of unemployment -0.0045
Constant -0.0224 0.0598 0.1498 -1.6712 Adjusted R² 0.3534 -0.1251 -0.0980 - - Change in temporary employment OLS QML eq1 eq2 eq3 eq4 marg. eff.
Overall strictness of protection against dismissals (regular employment) -0.0157 0.0081 0.0117 0.0842 0.0113
Overall strictness of temporary employment regulation 0.0174 0.0172 0.0173 0.1281 0.0171
Overall strictness of regulation on collective dismissals -0.0178 -0.0090
Implicit tax rate on labor 0.0006
Net replacement rate of a single person in the initial phase of unemployment 0.0029
Constant 0.0304 0.1325 0.0926 -2.1573 Adjusted R² -0.5946 -0.2201 -0.1171 - -
Sources: EC (2006), OECD (2004 and 2006), Tonin (2005), WDN, NBB. Figures in bold and bold/italique are significant at 5% and 10% respectively.
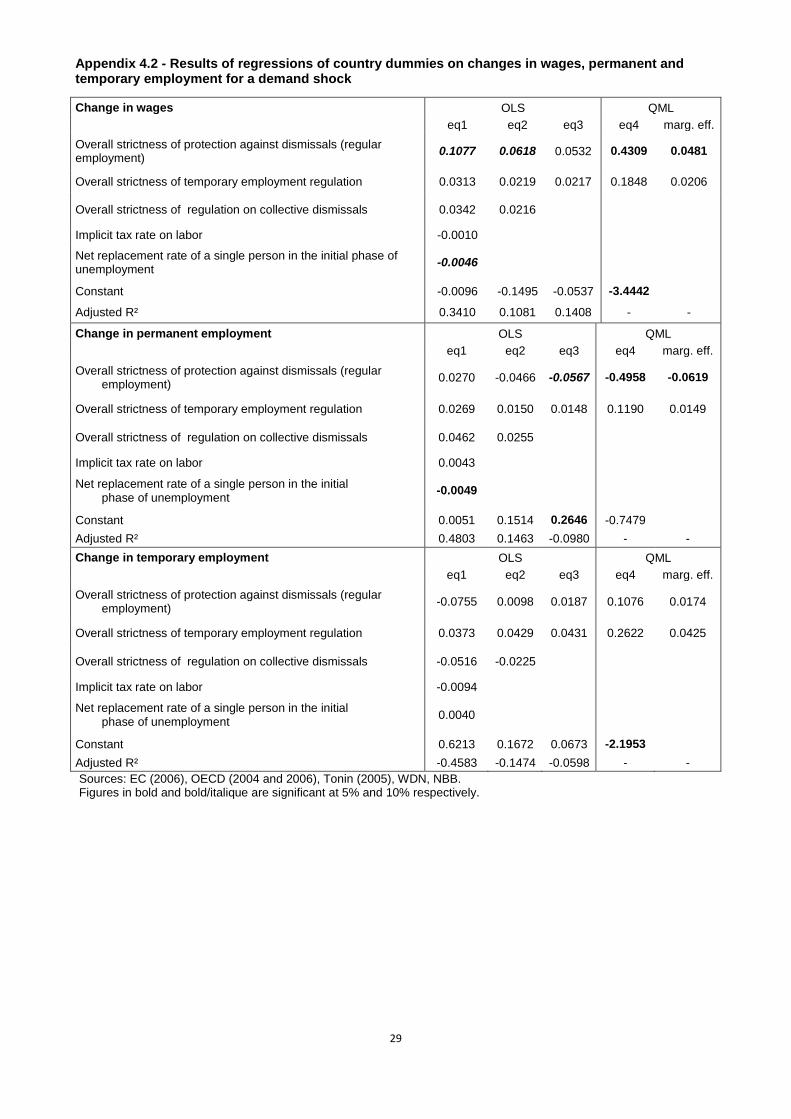
29
Appendix 4.2 - Results of regressions of country dummies on changes in wages, permanent and temporary employment for a demand shock
Change in wages OLS QML eq1 eq2 eq3 eq4 marg. eff. Overall strictness of protection against dismissals (regular employment) 0.1077 0.0618 0.0532 0.4309 0.0481
Overall strictness of temporary employment regulation 0.0313 0.0219 0.0217 0.1848 0.0206
Overall strictness of regulation on collective dismissals 0.0342 0.0216
Implicit tax rate on labor -0.0010
Net replacement rate of a single person in the initial phase of unemployment -0.0046
Constant -0.0096 -0.1495 -0.0537 -3.4442
Adjusted R² 0.3410 0.1081 0.1408 - -
Change in permanent employment OLS QML eq1 eq2 eq3 eq4 marg. eff.
Overall strictness of protection against dismissals (regular employment) 0.0270 -0.0466 -0.0567 -0.4958 -0.0619
Overall strictness of temporary employment regulation 0.0269 0.0150 0.0148 0.1190 0.0149
Overall strictness of regulation on collective dismissals 0.0462 0.0255
Implicit tax rate on labor 0.0043
Net replacement rate of a single person in the initial phase of unemployment -0.0049
Constant 0.0051 0.1514 0.2646 -0.7479 Adjusted R² 0.4803 0.1463 -0.0980 - - Change in temporary employment OLS QML eq1 eq2 eq3 eq4 marg. eff.
Overall strictness of protection against dismissals (regular employment) -0.0755 0.0098 0.0187 0.1076 0.0174
Overall strictness of temporary employment regulation 0.0373 0.0429 0.0431 0.2622 0.0425
Overall strictness of regulation on collective dismissals -0.0516 -0.0225
Implicit tax rate on labor -0.0094
Net replacement rate of a single person in the initial phase of unemployment 0.0040
Constant 0.6213 0.1672 0.0673 -2.1953 Adjusted R² -0.4583 -0.1474 -0.0598 - - Sources: EC (2006), OECD (2004 and 2006), Tonin (2005), WDN, NBB. Figures in bold and bold/italique are significant at 5% and 10% respectively.
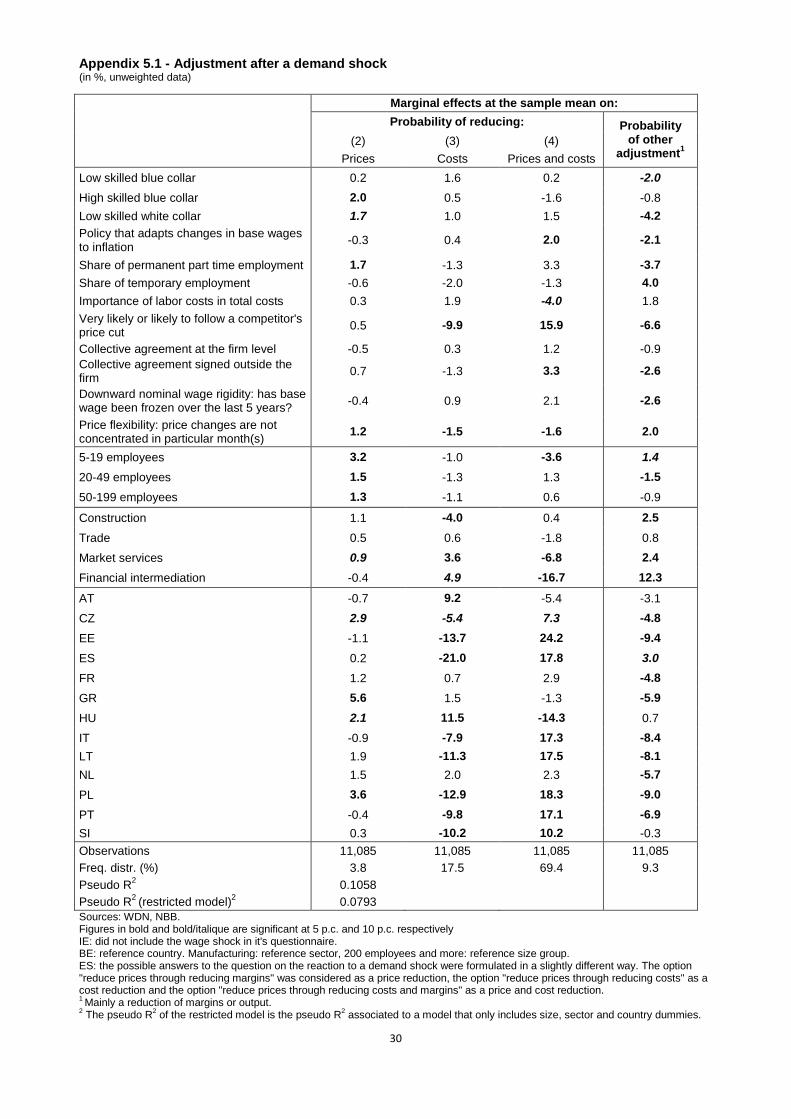
30
Appendix 5.1 - Adjustment after a demand shock (in %, unweighted data)
Marginal effects at the sample mean on: Probability of reducing: Probability
of other adjustment1 (2) (3) (4)
Prices Costs Prices and costs Low skilled blue collar 0.2 1.6 0.2 -2.0 High skilled blue collar 2.0 0.5 -1.6 -0.8 Low skilled white collar 1.7 1.0 1.5 -4.2 Policy that adapts changes in base wages to inflation -0.3 0.4 2.0 -2.1
Share of permanent part time employment 1.7 -1.3 3.3 -3.7 Share of temporary employment -0.6 -2.0 -1.3 4.0 Importance of labor costs in total costs 0.3 1.9 -4.0 1.8 Very likely or likely to follow a competitor's price cut 0.5 -9.9 15.9 -6.6
Collective agreement at the firm level -0.5 0.3 1.2 -0.9 Collective agreement signed outside the firm 0.7 -1.3 3.3 -2.6
Downward nominal wage rigidity: has base wage been frozen over the last 5 years? -0.4 0.9 2.1 -2.6
Price flexibility: price changes are not concentrated in particular month(s) 1.2 -1.5 -1.6 2.0
5-19 employees 3.2 -1.0 -3.6 1.4 20-49 employees 1.5 -1.3 1.3 -1.5 50-199 employees 1.3 -1.1 0.6 -0.9
Construction 1.1 -4.0 0.4 2.5 Trade 0.5 0.6 -1.8 0.8
Market services 0.9 3.6 -6.8 2.4 Financial intermediation -0.4 4.9 -16.7 12.3
AT -0.7 9.2 -5.4 -3.1
CZ 2.9 -5.4 7.3 -4.8 EE -1.1 -13.7 24.2 -9.4 ES 0.2 -21.0 17.8 3.0 FR 1.2 0.7 2.9 -4.8 GR 5.6 1.5 -1.3 -5.9 HU 2.1 11.5 -14.3 0.7
IT -0.9 -7.9 17.3 -8.4 LT 1.9 -11.3 17.5 -8.1 NL 1.5 2.0 2.3 -5.7 PL 3.6 -12.9 18.3 -9.0 PT -0.4 -9.8 17.1 -6.9 SI 0.3 -10.2 10.2 -0.3 Observations 11,085 11,085 11,085 11,085 Freq. distr. (%) 3.8 17.5 69.4 9.3 Pseudo R2 0.1058 Pseudo R2 (restricted model)2 0.0793 Sources: WDN, NBB. Figures in bold and bold/italique are significant at 5 p.c. and 10 p.c. respectively IE: did not include the wage shock in it's questionnaire. BE: reference country. Manufacturing: reference sector, 200 employees and more: reference size group. ES: the possible answers to the question on the reaction to a demand shock were formulated in a slightly different way. The option "reduce prices through reducing margins" was considered as a price reduction, the option "reduce prices through reducing costs" as a cost reduction and the option "reduce prices through reducing costs and margins" as a price and cost reduction. 1 Mainly a reduction of margins or output. 2 The pseudo R2 of the restricted model is the pseudo R2 associated to a model that only includes size, sector and country dummies.
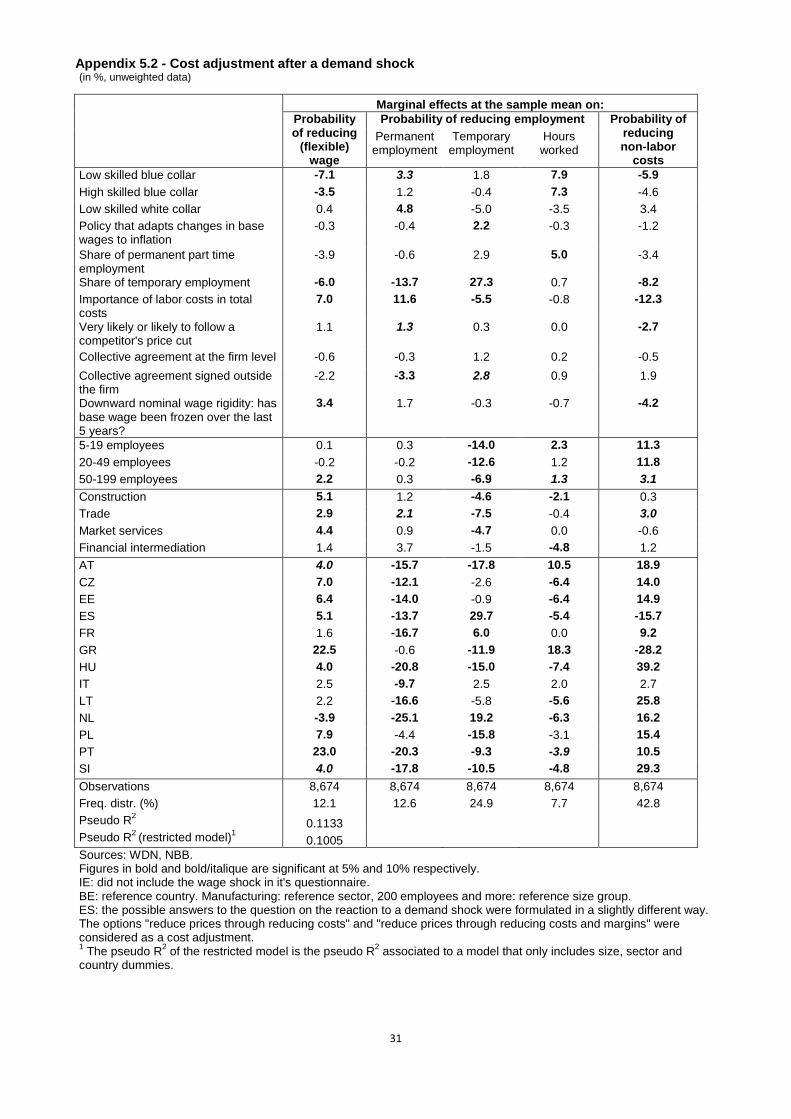
31
Appendix 5.2 - Cost adjustment after a demand shock (in %, unweighted data)
Marginal effects at the sample mean on:
Probability of reducing
(flexible) wage
Probability of reducing employment Probability of reducing non-labor
costs
Permanent employment
Temporary employment
Hours worked
Low skilled blue collar -7.1 3.3 1.8 7.9 -5.9 High skilled blue collar -3.5 1.2 -0.4 7.3 -4.6 Low skilled white collar 0.4 4.8 -5.0 -3.5 3.4 Policy that adapts changes in base wages to inflation
-0.3 -0.4 2.2 -0.3 -1.2
Share of permanent part time employment
-3.9 -0.6 2.9 5.0 -3.4
Share of temporary employment -6.0 -13.7 27.3 0.7 -8.2 Importance of labor costs in total costs
7.0 11.6 -5.5 -0.8 -12.3
Very likely or likely to follow a competitor's price cut
1.1 1.3 0.3 0.0 -2.7
Collective agreement at the firm level -0.6 -0.3 1.2 0.2 -0.5 Collective agreement signed outside the firm
-2.2 -3.3 2.8 0.9 1.9
Downward nominal wage rigidity: has base wage been frozen over the last 5 years?
3.4 1.7 -0.3 -0.7 -4.2
5-19 employees 0.1 0.3 -14.0 2.3 11.3 20-49 employees -0.2 -0.2 -12.6 1.2 11.8 50-199 employees 2.2 0.3 -6.9 1.3 3.1 Construction 5.1 1.2 -4.6 -2.1 0.3 Trade 2.9 2.1 -7.5 -0.4 3.0 Market services 4.4 0.9 -4.7 0.0 -0.6 Financial intermediation 1.4 3.7 -1.5 -4.8 1.2 AT 4.0 -15.7 -17.8 10.5 18.9 CZ 7.0 -12.1 -2.6 -6.4 14.0 EE 6.4 -14.0 -0.9 -6.4 14.9 ES 5.1 -13.7 29.7 -5.4 -15.7 FR 1.6 -16.7 6.0 0.0 9.2 GR 22.5 -0.6 -11.9 18.3 -28.2 HU 4.0 -20.8 -15.0 -7.4 39.2 IT 2.5 -9.7 2.5 2.0 2.7 LT 2.2 -16.6 -5.8 -5.6 25.8 NL -3.9 -25.1 19.2 -6.3 16.2 PL 7.9 -4.4 -15.8 -3.1 15.4 PT 23.0 -20.3 -9.3 -3.9 10.5 SI 4.0 -17.8 -10.5 -4.8 29.3 Observations 8,674 8,674 8,674 8,674 8,674 Freq. distr. (%) 12.1 12.6 24.9 7.7 42.8 Pseudo R2 0.1133
Pseudo R2 (restricted model)1 0.1005 Sources: WDN, NBB. Figures in bold and bold/italique are significant at 5% and 10% respectively. IE: did not include the wage shock in it's questionnaire. BE: reference country. Manufacturing: reference sector, 200 employees and more: reference size group. ES: the possible answers to the question on the reaction to a demand shock were formulated in a slightly different way. The options "reduce prices through reducing costs" and "reduce prices through reducing costs and margins" were considered as a cost adjustment. 1 The pseudo R2 of the restricted model is the pseudo R2 associated to a model that only includes size, sector and country dummies.
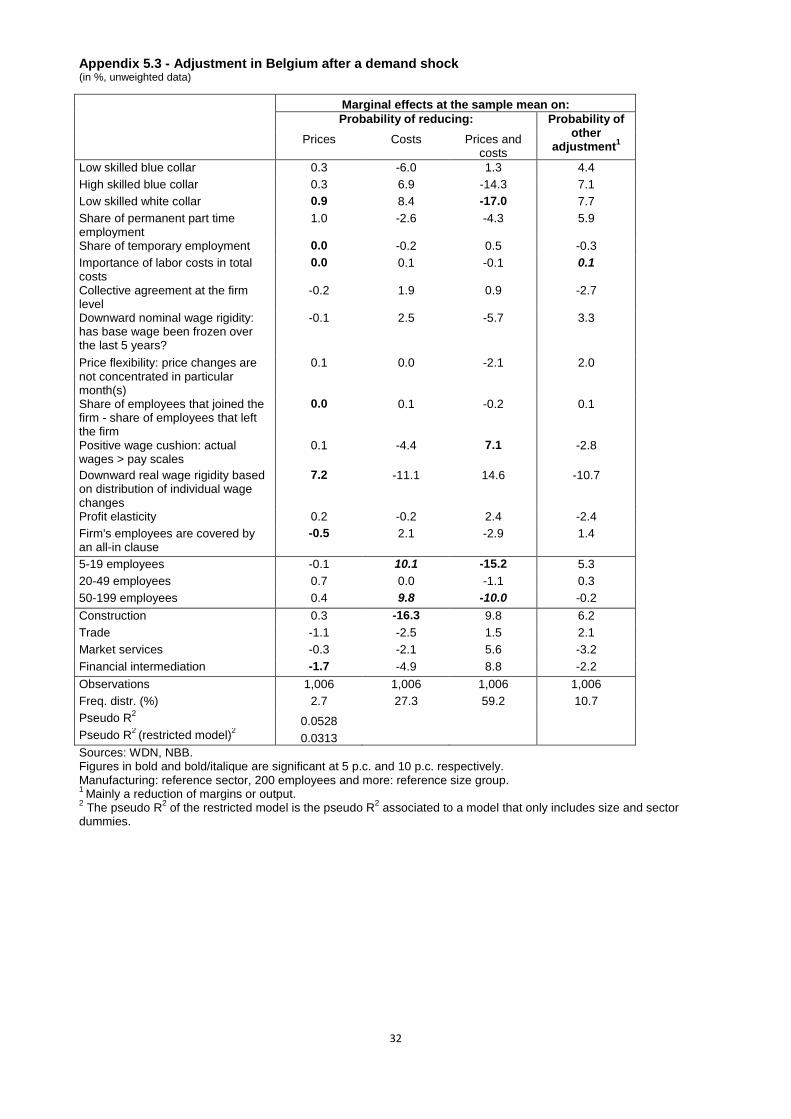
32
Appendix 5.3 - Adjustment in Belgium after a demand shock (in %, unweighted data)
Marginal effects at the sample mean on: Probability of reducing: Probability of
other adjustment1
Prices Costs Prices and costs
Low skilled blue collar 0.3 -6.0 1.3 4.4 High skilled blue collar 0.3 6.9 -14.3 7.1 Low skilled white collar 0.9 8.4 -17.0 7.7 Share of permanent part time employment
1.0 -2.6 -4.3 5.9
Share of temporary employment 0.0 -0.2 0.5 -0.3 Importance of labor costs in total costs
0.0 0.1 -0.1 0.1
Collective agreement at the firm level
-0.2 1.9 0.9 -2.7
Downward nominal wage rigidity: has base wage been frozen over the last 5 years?
-0.1 2.5 -5.7 3.3
Price flexibility: price changes are not concentrated in particular month(s)
0.1 0.0 -2.1 2.0
Share of employees that joined the firm - share of employees that left the firm
0.0 0.1 -0.2 0.1
Positive wage cushion: actual wages > pay scales
0.1 -4.4 7.1 -2.8
Downward real wage rigidity based on distribution of individual wage changes
7.2 -11.1 14.6 -10.7
Profit elasticity 0.2 -0.2 2.4 -2.4 Firm's employees are covered by an all-in clause
-0.5 2.1 -2.9 1.4
5-19 employees -0.1 10.1 -15.2 5.3 20-49 employees 0.7 0.0 -1.1 0.3 50-199 employees 0.4 9.8 -10.0 -0.2 Construction 0.3 -16.3 9.8 6.2 Trade -1.1 -2.5 1.5 2.1 Market services -0.3 -2.1 5.6 -3.2 Financial intermediation -1.7 -4.9 8.8 -2.2 Observations 1,006 1,006 1,006 1,006 Freq. distr. (%) 2.7 27.3 59.2 10.7 Pseudo R2 0.0528
Pseudo R2 (restricted model)2 0.0313 Sources: WDN, NBB. Figures in bold and bold/italique are significant at 5 p.c. and 10 p.c. respectively. Manufacturing: reference sector, 200 employees and more: reference size group. 1 Mainly a reduction of margins or output. 2 The pseudo R2 of the restricted model is the pseudo R2 associated to a model that only includes size and sector dummies.
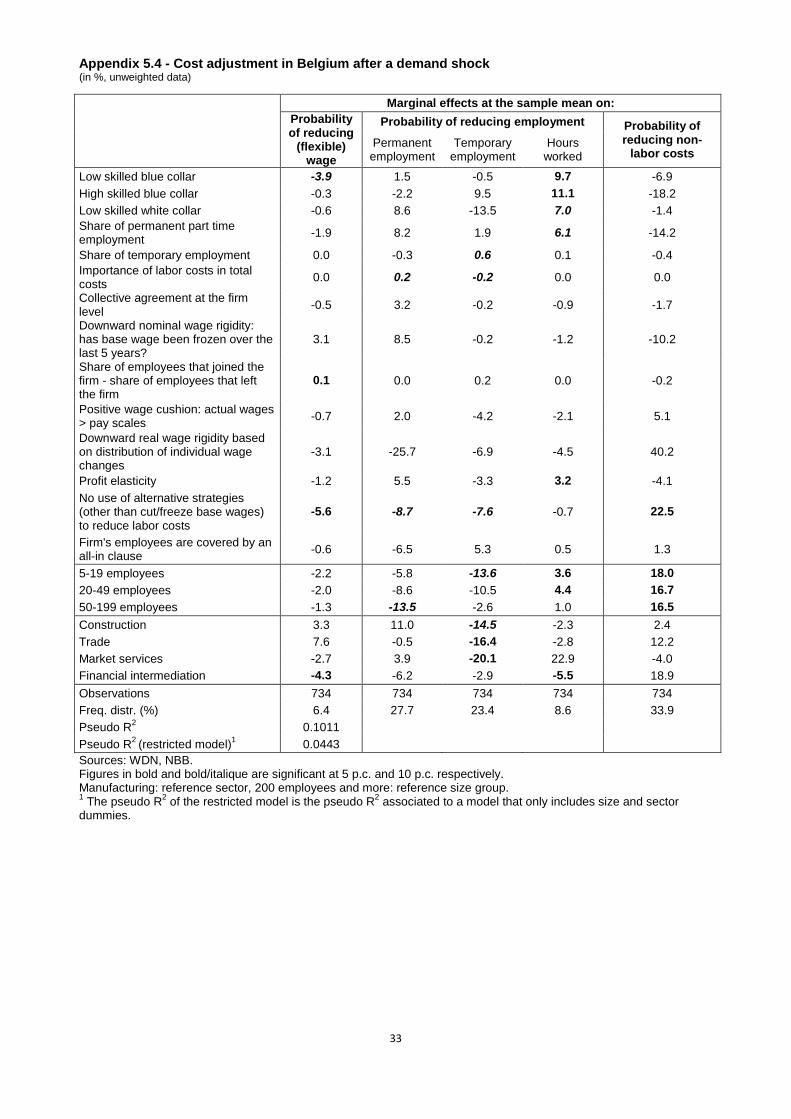
33
Appendix 5.4 - Cost adjustment in Belgium after a demand shock (in %, unweighted data)
Marginal effects at the sample mean on:
Probability of reducing
(flexible) wage
Probability of reducing employment Probability of reducing non-
labor costs Permanent employment
Temporary employment
Hours worked
Low skilled blue collar -3.9 1.5 -0.5 9.7 -6.9 High skilled blue collar -0.3 -2.2 9.5 11.1 -18.2 Low skilled white collar -0.6 8.6 -13.5 7.0 -1.4 Share of permanent part time employment -1.9 8.2 1.9 6.1 -14.2
Share of temporary employment 0.0 -0.3 0.6 0.1 -0.4 Importance of labor costs in total costs 0.0 0.2 -0.2 0.0 0.0
Collective agreement at the firm level -0.5 3.2 -0.2 -0.9 -1.7
Downward nominal wage rigidity: has base wage been frozen over the last 5 years?
3.1 8.5 -0.2 -1.2 -10.2
Share of employees that joined the firm - share of employees that left the firm
0.1 0.0 0.2 0.0 -0.2
Positive wage cushion: actual wages > pay scales -0.7 2.0 -4.2 -2.1 5.1
Downward real wage rigidity based on distribution of individual wage changes
-3.1 -25.7 -6.9 -4.5 40.2
Profit elasticity -1.2 5.5 -3.3 3.2 -4.1 No use of alternative strategies (other than cut/freeze base wages) to reduce labor costs
-5.6 -8.7 -7.6 -0.7 22.5
Firm's employees are covered by an all-in clause -0.6 -6.5 5.3 0.5 1.3
5-19 employees -2.2 -5.8 -13.6 3.6 18.0 20-49 employees -2.0 -8.6 -10.5 4.4 16.7 50-199 employees -1.3 -13.5 -2.6 1.0 16.5 Construction 3.3 11.0 -14.5 -2.3 2.4 Trade 7.6 -0.5 -16.4 -2.8 12.2 Market services -2.7 3.9 -20.1 22.9 -4.0 Financial intermediation -4.3 -6.2 -2.9 -5.5 18.9 Observations 734 734 734 734 734 Freq. distr. (%) 6.4 27.7 23.4 8.6 33.9 Pseudo R2 0.1011 Pseudo R2 (restricted model)1 0.0443 Sources: WDN, NBB. Figures in bold and bold/italique are significant at 5 p.c. and 10 p.c. respectively. Manufacturing: reference sector, 200 employees and more: reference size group. 1 The pseudo R2 of the restricted model is the pseudo R2 associated to a model that only includes size and sector dummies.
NBB WORKING PAPER No. 193 - JULY 2010 35
NATIONAL BANK OF BELGIUM - WORKING PAPERS SERIES 1. "Model-based inflation forecasts and monetary policy rules", by M. Dombrecht and R. Wouters, Research
Series, February 2000. 2. "The use of robust estimators as measures of core inflation", by L. Aucremanne, Research Series,
February 2000. 3. "Performances économiques des Etats-Unis dans les années nonante", by A. Nyssens, P. Butzen and
P. Bisciari, Document Series, March 2000. 4. "A model with explicit expectations for Belgium", by P. Jeanfils, Research Series, March 2000. 5. "Growth in an open economy: Some recent developments", by S. Turnovsky, Research Series, May
2000. 6. "Knowledge, technology and economic growth: An OECD perspective", by I. Visco, A. Bassanini and
S. Scarpetta, Research Series, May 2000. 7. "Fiscal policy and growth in the context of European integration", by P. Masson, Research Series, May
2000. 8. "Economic growth and the labour market: Europe's challenge", by C. Wyplosz, Research Series, May
2000. 9. "The role of the exchange rate in economic growth: A euro-zone perspective", by R. MacDonald,
Research Series, May 2000. 10. "Monetary union and economic growth", by J. Vickers, Research Series, May 2000. 11. "Politique monétaire et prix des actifs: le cas des États-Unis", by Q. Wibaut, Document Series, August
2000. 12. "The Belgian industrial confidence indicator: Leading indicator of economic activity in the euro area?", by
J.-J. Vanhaelen, L. Dresse and J. De Mulder, Document Series, November 2000. 13. "Le financement des entreprises par capital-risque", by C. Rigo, Document Series, February 2001. 14. "La nouvelle économie" by P. Bisciari, Document Series, March 2001. 15. "De kostprijs van bankkredieten", by A. Bruggeman and R. Wouters, Document Series, April 2001. 16. "A guided tour of the world of rational expectations models and optimal policies", by Ph. Jeanfils,
Research Series, May 2001. 17. "Attractive prices and euro - Rounding effects on inflation", by L. Aucremanne and D. Cornille,
Documents Series, November 2001. 18. "The interest rate and credit channels in Belgium: An investigation with micro-level firm data", by
P. Butzen, C. Fuss and Ph. Vermeulen, Research series, December 2001. 19. "Openness, imperfect exchange rate pass-through and monetary policy", by F. Smets and R. Wouters,
Research series, March 2002. 20. "Inflation, relative prices and nominal rigidities", by L. Aucremanne, G. Brys, M. Hubert, P. J. Rousseeuw
and A. Struyf, Research series, April 2002. 21. "Lifting the burden: Fundamental tax reform and economic growth", by D. Jorgenson, Research series,
May 2002. 22. "What do we know about investment under uncertainty?", by L. Trigeorgis, Research series, May 2002. 23. "Investment, uncertainty and irreversibility: Evidence from Belgian accounting data" by D. Cassimon,
P.-J. Engelen, H. Meersman and M. Van Wouwe, Research series, May 2002. 24. "The impact of uncertainty on investment plans", by P. Butzen, C. Fuss and Ph. Vermeulen, Research
series, May 2002. 25. "Investment, protection, ownership, and the cost of capital", by Ch. P. Himmelberg, R. G. Hubbard and
I. Love, Research series, May 2002. 26. "Finance, uncertainty and investment: Assessing the gains and losses of a generalised non-linear
structural approach using Belgian panel data", by M. Gérard and F. Verschueren, Research series, May 2002.
27. "Capital structure, firm liquidity and growth", by R. Anderson, Research series, May 2002. 28. "Structural modelling of investment and financial constraints: Where do we stand?", by J.-B. Chatelain,
Research series, May 2002. 29. "Financing and investment interdependencies in unquoted Belgian companies: The role of venture
capital", by S. Manigart, K. Baeyens, I. Verschueren, Research series, May 2002. 30. "Development path and capital structure of Belgian biotechnology firms", by V. Bastin, A. Corhay,
G. Hübner and P.-A. Michel, Research series, May 2002. 31. "Governance as a source of managerial discipline", by J. Franks, Research series, May 2002. 32. "Financing constraints, fixed capital and R&D investment decisions of Belgian firms", by M. Cincera,
Research series, May 2002.
NBB WORKING PAPER No. 193 - JULY 2010 36
33. "Investment, R&D and liquidity constraints: A corporate governance approach to the Belgian evidence", by P. Van Cayseele, Research series, May 2002.
34. "On the origins of the Franco-German EMU controversies", by I. Maes, Research series, July 2002. 35. "An estimated dynamic stochastic general equilibrium model of the euro area", by F. Smets and
R. Wouters, Research series, October 2002. 36. "The labour market and fiscal impact of labour tax reductions: The case of reduction of employers' social
security contributions under a wage norm regime with automatic price indexing of wages", by K. Burggraeve and Ph. Du Caju, Research series, March 2003.
37. "Scope of asymmetries in the euro area", by S. Ide and Ph. Moës, Document series, March 2003. 38. "De autonijverheid in België: Het belang van het toeleveringsnetwerk rond de assemblage van
personenauto's", by F. Coppens and G. van Gastel, Document series, June 2003. 39. "La consommation privée en Belgique", by B. Eugène, Ph. Jeanfils and B. Robert, Document series,
June 2003. 40. "The process of European monetary integration: A comparison of the Belgian and Italian approaches", by
I. Maes and L. Quaglia, Research series, August 2003. 41. "Stock market valuation in the United States", by P. Bisciari, A. Durré and A. Nyssens, Document series,
November 2003. 42. "Modeling the term structure of interest rates: Where do we stand?", by K. Maes, Research series,
February 2004. 43. "Interbank exposures: An ampirical examination of system risk in the Belgian banking system", by
H. Degryse and G. Nguyen, Research series, March 2004. 44. "How frequently do prices change? Evidence based on the micro data underlying the Belgian CPI", by
L. Aucremanne and E. Dhyne, Research series, April 2004. 45. "Firms' investment decisions in response to demand and price uncertainty", by C. Fuss and
Ph. Vermeulen, Research series, April 2004. 46. "SMEs and bank lending relationships: The impact of mergers", by H. Degryse, N. Masschelein and
J. Mitchell, Research series, May 2004. 47. "The determinants of pass-through of market conditions to bank retail interest rates in Belgium", by
F. De Graeve, O. De Jonghe and R. Vander Vennet, Research series, May 2004. 48. "Sectoral vs. country diversification benefits and downside risk", by M. Emiris, Research series,
May 2004. 49. "How does liquidity react to stress periods in a limit order market?", by H. Beltran, A. Durré and P. Giot,
Research series, May 2004. 50. "Financial consolidation and liquidity: Prudential regulation and/or competition policy?", by
P. Van Cayseele, Research series, May 2004. 51. "Basel II and operational risk: Implications for risk measurement and management in the financial
sector", by A. Chapelle, Y. Crama, G. Hübner and J.-P. Peters, Research series, May 2004. 52. "The efficiency and stability of banks and markets", by F. Allen, Research series, May 2004. 53. "Does financial liberalization spur growth?", by G. Bekaert, C.R. Harvey and C. Lundblad, Research
series, May 2004. 54. "Regulating financial conglomerates", by X. Freixas, G. Lóránth, A.D. Morrison and H.S. Shin, Research
series, May 2004. 55. "Liquidity and financial market stability", by M. O'Hara, Research series, May 2004. 56. "Economisch belang van de Vlaamse zeehavens: Verslag 2002", by F. Lagneaux, Document series,
June 2004. 57. "Determinants of euro term structure of credit spreads", by A. Van Landschoot, Research series, July
2004. 58. "Macroeconomic and monetary policy-making at the European Commission, from the Rome Treaties to
the Hague Summit", by I. Maes, Research series, July 2004. 59. "Liberalisation of network industries: Is electricity an exception to the rule?", by F. Coppens and D. Vivet,
Document series, September 2004. 60. "Forecasting with a Bayesian DSGE model: An application to the euro area", by F. Smets and
R. Wouters, Research series, September 2004. 61. "Comparing shocks and frictions in US and euro area business cycle: A Bayesian DSGE approach", by
F. Smets and R. Wouters, Research series, October 2004. 62. "Voting on pensions: A survey", by G. de Walque, Research series, October 2004. 63. "Asymmetric growth and inflation developments in the acceding countries: A new assessment", by S. Ide
and P. Moës, Research series, October 2004. 64. "Importance économique du Port Autonome de Liège: rapport 2002", by F. Lagneaux, Document series,
November 2004.
NBB WORKING PAPER No. 193 - JULY 2010 37
65. "Price-setting behaviour in Belgium: What can be learned from an ad hoc survey", by L. Aucremanne and M. Druant, Research series, March 2005.
66. "Time-dependent versus state-dependent pricing: A panel data approach to the determinants of Belgian consumer price changes", by L. Aucremanne and E. Dhyne, Research series, April 2005.
67. "Indirect effects – A formal definition and degrees of dependency as an alternative to technical coefficients", by F. Coppens, Research series, May 2005.
68. "Noname – A new quarterly model for Belgium", by Ph. Jeanfils and K. Burggraeve, Research series, May 2005.
69. "Economic importance of the Flemish maritime ports: Report 2003", by F. Lagneaux, Document series, May 2005.
70. "Measuring inflation persistence: A structural time series approach", by M. Dossche and G. Everaert, Research series, June 2005.
71. "Financial intermediation theory and implications for the sources of value in structured finance markets", by J. Mitchell, Document series, July 2005.
72. "Liquidity risk in securities settlement", by J. Devriese and J. Mitchell, Research series, July 2005. 73. "An international analysis of earnings, stock prices and bond yields", by A. Durré and P. Giot, Research
series, September 2005. 74. "Price setting in the euro area: Some stylized facts from Individual Consumer Price Data", by E. Dhyne,
L. J. Álvarez, H. Le Bihan, G. Veronese, D. Dias, J. Hoffmann, N. Jonker, P. Lünnemann, F. Rumler and J. Vilmunen, Research series, September 2005.
75. "Importance économique du Port Autonome de Liège: rapport 2003", by F. Lagneaux, Document series, October 2005.
76. "The pricing behaviour of firms in the euro area: New survey evidence, by S. Fabiani, M. Druant, I. Hernando, C. Kwapil, B. Landau, C. Loupias, F. Martins, T. Mathä, R. Sabbatini, H. Stahl and A. Stokman, Research series, November 2005.
77. "Income uncertainty and aggregate consumption”, by L. Pozzi, Research series, November 2005. 78. "Crédits aux particuliers - Analyse des données de la Centrale des Crédits aux Particuliers", by
H. De Doncker, Document series, January 2006. 79. "Is there a difference between solicited and unsolicited bank ratings and, if so, why?", by P. Van Roy,
Research series, February 2006. 80. "A generalised dynamic factor model for the Belgian economy - Useful business cycle indicators and
GDP growth forecasts", by Ch. Van Nieuwenhuyze, Research series, February 2006. 81. "Réduction linéaire de cotisations patronales à la sécurité sociale et financement alternatif", by
Ph. Jeanfils, L. Van Meensel, Ph. Du Caju, Y. Saks, K. Buysse and K. Van Cauter, Document series, March 2006.
82. "The patterns and determinants of price setting in the Belgian industry", by D. Cornille and M. Dossche, Research series, May 2006.
83. "A multi-factor model for the valuation and risk management of demand deposits", by H. Dewachter, M. Lyrio and K. Maes, Research series, May 2006.
84. "The single European electricity market: A long road to convergence", by F. Coppens and D. Vivet, Document series, May 2006.
85. "Firm-specific production factors in a DSGE model with Taylor price setting", by G. de Walque, F. Smets and R. Wouters, Research series, June 2006.
86. "Economic importance of the Belgian ports: Flemish maritime ports and Liège port complex - Report 2004", by F. Lagneaux, Document series, June 2006.
87. "The response of firms' investment and financing to adverse cash flow shocks: The role of bank relationships", by C. Fuss and Ph. Vermeulen, Research series, July 2006.
88. "The term structure of interest rates in a DSGE model", by M. Emiris, Research series, July 2006. 89. "The production function approach to the Belgian output gap, estimation of a multivariate structural time
series model", by Ph. Moës, Research series, September 2006. 90. "Industry wage differentials, unobserved ability, and rent-sharing: Evidence from matched worker-firm
data, 1995-2002", by R. Plasman, F. Rycx and I. Tojerow, Research series, October 2006. 91. "The dynamics of trade and competition", by N. Chen, J. Imbs and A. Scott, Research series, October
2006. 92. "A New Keynesian model with unemployment", by O. Blanchard and J. Gali, Research series, October
2006. 93. "Price and wage setting in an integrating Europe: Firm level evidence", by F. Abraham, J. Konings and
S. Vanormelingen, Research series, October 2006. 94. "Simulation, estimation and welfare implications of monetary policies in a 3-country NOEM model", by
J. Plasmans, T. Michalak and J. Fornero, Research series, October 2006.
NBB WORKING PAPER No. 193 - JULY 2010 38
95. "Inflation persistence and price-setting behaviour in the euro area: A summary of the Inflation Persistence Network evidence ", by F. Altissimo, M. Ehrmann and F. Smets, Research series, October 2006.
96. "How wages change: Micro evidence from the International Wage Flexibility Project", by W.T. Dickens, L. Goette, E.L. Groshen, S. Holden, J. Messina, M.E. Schweitzer, J. Turunen and M. Ward, Research series, October 2006.
97. "Nominal wage rigidities in a new Keynesian model with frictional unemployment", by V. Bodart, G. de Walque, O. Pierrard, H.R. Sneessens and R. Wouters, Research series, October 2006.
98. "Dynamics on monetary policy in a fair wage model of the business cycle", by D. De la Croix, G. de Walque and R. Wouters, Research series, October 2006.
99. "The kinked demand curve and price rigidity: Evidence from scanner data", by M. Dossche, F. Heylen and D. Van den Poel, Research series, October 2006.
100. "Lumpy price adjustments: A microeconometric analysis", by E. Dhyne, C. Fuss, H. Peseran and P. Sevestre, Research series, October 2006.
101. "Reasons for wage rigidity in Germany", by W. Franz and F. Pfeiffer, Research series, October 2006. 102. "Fiscal sustainability indicators and policy design in the face of ageing", by G. Langenus, Research
series, October 2006. 103. "Macroeconomic fluctuations and firm entry: Theory and evidence", by V. Lewis, Research series,
October 2006. 104. "Exploring the CDS-bond basis", by J. De Wit, Research series, November 2006. 105. "Sector concentration in loan portfolios and economic capital", by K. Düllmann and N. Masschelein,
Research series, November 2006. 106. "R&D in the Belgian pharmaceutical sector", by H. De Doncker, Document series, December 2006. 107. "Importance et évolution des investissements directs en Belgique", by Ch. Piette, Document series,
January 2007. 108. "Investment-specific technology shocks and labor market frictions", by R. De Bock, Research series,
February 2007. 109. "Shocks and frictions in US business cycles: A Bayesian DSGE approach", by F. Smets and R. Wouters,
Research series, February 2007. 110. "Economic impact of port activity: A disaggregate analysis. The case of Antwerp", by F. Coppens,
F. Lagneaux, H. Meersman, N. Sellekaerts, E. Van de Voorde, G. van Gastel, Th. Vanelslander, A. Verhetsel, Document series, February 2007.
111. "Price setting in the euro area: Some stylised facts from individual producer price data", by Ph. Vermeulen, D. Dias, M. Dossche, E. Gautier, I. Hernando, R. Sabbatini, H. Stahl, Research series, March 2007.
112. "Assessing the gap between observed and perceived inflation in the euro area: Is the credibility of the HICP at stake?", by L. Aucremanne, M. Collin and Th. Stragier, Research series, April 2007.
113. "The spread of Keynesian economics: A comparison of the Belgian and Italian experiences", by I. Maes, Research series, April 2007.
114. "Imports and exports at the level of the firm: Evidence from Belgium", by M. Muûls and M. Pisu, Research series, May 2007.
115. "Economic importance of the Belgian ports: Flemish maritime ports and Liège port complex - Report 2005", by F. Lagneaux, Document series, May 2007.
116. "Temporal distribution of price changes: Staggering in the large and synchronization in the small", by E. Dhyne and J. Konieczny, Research series, June 2007.
117. "Can excess liquidity signal an asset price boom?", by A. Bruggeman, Research series, August 2007. 118. "The performance of credit rating systems in the assessment of collateral used in Eurosystem monetary
policy operations", by F. Coppens, F. González and G. Winkler, Research series, September 2007. 119. "The determinants of stock and bond return comovements", by L. Baele, G. Bekaert and K. Inghelbrecht,
Research series, October 2007. 120. "Monitoring pro-cyclicality under the capital requirements directive: Preliminary concepts for developing a
framework", by N. Masschelein, Document series, October 2007. 121. "Dynamic order submission strategies with competition between a dealer market and a crossing
network", by H. Degryse, M. Van Achter and G. Wuyts, Research series, November 2007. 122. "The gas chain: Influence of its specificities on the liberalisation process", by C. Swartenbroekx,
Document series, November 2007. 123. "Failure prediction models: Performance, disagreements, and internal rating systems", by J. Mitchell and
P. Van Roy, Research series, December 2007. 124. "Downward wage rigidity for different workers and firms: An evaluation for Belgium using the IWFP
procedure", by Ph. Du Caju, C. Fuss and L. Wintr, Research series, December 2007.
NBB WORKING PAPER No. 193 - JULY 2010 39
125. "Economic importance of Belgian transport logistics", by F. Lagneaux, Document series, January 2008. 126. "Some evidence on late bidding in eBay auctions", by L. Wintr, Research series, January 2008. 127. "How do firms adjust their wage bill in Belgium? A decomposition along the intensive and extensive
margins", by C. Fuss, Research series, January 2008. 128. "Exports and productivity – Comparable evidence for 14 countries", by The International Study Group on
Exports and Productivity, Research series, February 2008. 129. "Estimation of monetary policy preferences in a forward-looking model: A Bayesian approach", by
P. Ilbas, Research series, March 2008. 130. "Job creation, job destruction and firms' international trade involvement", by M. Pisu, Research series,
March 2008. 131. "Do survey indicators let us see the business cycle? A frequency decomposition", by L. Dresse and
Ch. Van Nieuwenhuyze, Research series, March 2008. 132. "Searching for additional sources of inflation persistence: The micro-price panel data approach", by
R. Raciborski, Research series, April 2008. 133. "Short-term forecasting of GDP using large monthly datasets - A pseudo real-time forecast evaluation
exercise", by K. Barhoumi, S. Benk, R. Cristadoro, A. Den Reijer, A. Jakaitiene, P. Jelonek, A. Rua, G. Rünstler, K. Ruth and Ch. Van Nieuwenhuyze, Research series, June 2008.
134. "Economic importance of the Belgian ports: Flemish maritime ports, Liège port complex and the port of Brussels - Report 2006", by S. Vennix, Document series, June 2008.
135. "Imperfect exchange rate pass-through: The role of distribution services and variable demand elasticity", by Ph. Jeanfils, Research series, August 2008.
136. "Multivariate structural time series models with dual cycles: Implications for measurement of output gap and potential growth", by Ph. Moës, Research series, August 2008.
137. "Agency problems in structured finance - A case study of European CLOs", by J. Keller, Document series, August 2008.
138. "The efficiency frontier as a method for gauging the performance of public expenditure: A Belgian case study", by B. Eugène, Research series, September 2008.
139. "Exporters and credit constraints. A firm-level approach", by M. Muûls, Research series, September 2008.
140. "Export destinations and learning-by-exporting: Evidence from Belgium", by M. Pisu, Research series, September 2008.
141. "Monetary aggregates and liquidity in a neo-Wicksellian framework", by M. Canzoneri, R. Cumby, B. Diba and D. López-Salido, Research series, October 2008.
142 "Liquidity, inflation and asset prices in a time-varying framework for the euro area, by Ch. Baumeister, E. Durinck and G. Peersman, Research series, October 2008.
143. "The bond premium in a DSGE model with long-run real and nominal risks", by G. D. Rudebusch and E. T. Swanson, Research series, October 2008.
144. "Imperfect information, macroeconomic dynamics and the yield curve: An encompassing macro-finance model", by H. Dewachter, Research series, October 2008.
145. "Housing market spillovers: Evidence from an estimated DSGE model", by M. Iacoviello and S. Neri, Research series, October 2008.
146. "Credit frictions and optimal monetary policy", by V. Cúrdia and M. Woodford, Research series, October 2008.
147. "Central Bank misperceptions and the role of money in interest rate rules", by G. Beck and V. Wieland, Research series, October 2008.
148. "Financial (in)stability, supervision and liquidity injections: A dynamic general equilibrium approach", by G. de Walque, O. Pierrard and A. Rouabah, Research series, October 2008.
149. "Monetary policy, asset prices and macroeconomic conditions: A panel-VAR study", by K. Assenmacher-Wesche and S. Gerlach, Research series, October 2008.
150. "Risk premiums and macroeconomic dynamics in a heterogeneous agent model", by F. De Graeve, M. Dossche, M. Emiris, H. Sneessens and R. Wouters, Research series, October 2008.
151. "Financial factors in economic fluctuations", by L. J. Christiano, R. Motto and M. Rotagno, Research series, to be published.
152. "Rent-sharing under different bargaining regimes: Evidence from linked employer-employee data", by M. Rusinek and F. Rycx, Research series, December 2008.
153. "Forecast with judgment and models", by F. Monti, Research series, December 2008. 154. "Institutional features of wage bargaining in 23 European countries, the US and Japan", by Ph. Du Caju,
E. Gautier, D. Momferatou and M. Ward-Warmedinger, Research series, December 2008. 155. "Fiscal sustainability and policy implications for the euro area", by F. Balassone, J. Cunha, G. Langenus,
B. Manzke, J Pavot, D. Prammer and P. Tommasino, Research series, January 2009.
NBB WORKING PAPER No. 193 - JULY 2010 40
156. "Understanding sectoral differences in downward real wage rigidity: Workforce composition, institutions, technology and competition", by Ph. Du Caju, C. Fuss and L. Wintr, Research series, February 2009.
157. "Sequential bargaining in a New Keynesian model with frictional unemployment and staggered wage negotiation", by G. de Walque, O. Pierrard, H. Sneessens and R. Wouters, Research series, February 2009.
158. "Economic importance of air transport and airport activities in Belgium", by F. Kupfer and F. Lagneaux, Document series, March 2009.
159. "Rigid labour compensation and flexible employment? Firm-Level evidence with regard to productivity for Belgium", by C. Fuss and L. Wintr, Research series, March 2009.
160. "The Belgian iron and steel industry in the international context", by F. Lagneaux and D. Vivet, Document series, March 2009.
161. "Trade, wages and productivity", by K. Behrens, G. Mion, Y. Murata and J. Südekum, Research series, March 2009.
162. "Labour flows in Belgium", by P. Heuse and Y. Saks, Research series, April 2009. 163. "The young Lamfalussy: An empirical and policy-oriented growth theorist", by I. Maes, Research series,
April 2009. 164. "Inflation dynamics with labour market matching: Assessing alternative specifications", by K. Christoffel,
J. Costain, G. de Walque, K. Kuester, T. Linzert, S. Millard and O. Pierrard, Research series, May 2009. 165. "Understanding inflation dynamics: Where do we stand?", by M. Dossche, Research series, June 2009. 166. "Input-output connections between sectors and optimal monetary policy", by E. Kara, Research series,
June 2009. 167. "Back to the basics in banking? A micro-analysis of banking system stability", by O. De Jonghe,
Research series, June 2009. 168. "Model misspecification, learning and the exchange rate disconnect puzzle", by V. Lewis and
A. Markiewicz, Research series, July 2009. 169. "The use of fixed-term contracts and the labour adjustment in Belgium", by E. Dhyne and B. Mahy,
Research series, July 2009. 170. "Analysis of business demography using markov chains – An application to Belgian data”, by F. Coppens
and F. Verduyn, Research series, July 2009. 171. "A global assessment of the degree of price stickiness - Results from the NBB business survey", by
E. Dhyne, Research series, July 2009. 172. "Economic importance of the Belgian ports: Flemish maritime ports, Liège port complex and the port of
Brussels - Report 2007", by C. Mathys, Document series, July 2009. 173. "Evaluating a monetary business cycle model with unemployment for the euro area", by N. Groshenny,
Research series, July 2009. 174. "How are firms' wages and prices linked: Survey evidence in Europe", by M. Druant, S. Fabiani and
G. Kezdi, A. Lamo, F. Martins and R. Sabbatini, Research series, August 2009. 175. "Micro-data on nominal rigidity, inflation persistence and optimal monetary policy", by E. Kara, Research
series, September 2009. 176. "On the origins of the BIS macro-prudential approach to financial stability: Alexandre Lamfalussy and
financial fragility", by I. Maes, Research series, October 2009. 177. "Incentives and tranche retention in securitisation: A screening model", by I. Fender and J. Mitchell,
Research series, October 2009. 178. "Optimal monetary policy and firm entry", by V. Lewis, Research series, October 2009. 179. "Staying, dropping, or switching: The impacts of bank mergers on small firms", by H. Degryse,
N. Masschelein and J. Mitchell, Research series, October 2009. 180. "Inter-industry wage differentials: How much does rent sharing matter?", by Ph. Du Caju, F. Rycx and
I. Tojerow, Research series, October 2009. 181. "Empirical evidence on the aggregate effects of anticipated and unanticipated US tax policy shocks", by
K. Mertens and M. O. Ravn, Research series, November 2009. 182. "Downward nominal and real wage rigidity: Survey evidence from European firms", by J. Babecký,
Ph. Du Caju, T. Kosma, M. Lawless, J. Messina and T. Rõõm, Research series, November 2009. 183. "The margins of labour cost adjustment: Survey evidence from European firms", by J. Babecký,
Ph. Du Caju, T. Kosma, M. Lawless, J. Messina and T. Rõõm, Research series, November 2009. 184. "Discriminatory fees, coordination and investment in shared ATM networks" by S. Ferrari, Research
series, January 2010. 185. "Self-fulfilling liquidity dry-ups", by F. Malherbe, Research series, March 2010. 186. "The development of monetary policy in the 20th century - some reflections", by O. Issing, Research
series, April 2010.

NBB WORKING PAPER No. 193 - JULY 2010 41
187. "Getting rid of Keynes? A survey of the history of macroeconomics from Keynes to Lucas and beyond", by M. De Vroey, Research series, April 2010.
188. "A century of macroeconomic and monetary thought at the National Bank of Belgium", by I. Maes, Research series, April 2010.
189. "Inter-industry wage differentials in EU countries: What do cross-country time-varying data add to the picture?", by Ph. Du Caju, G. Kátay, A. Lamo, D. Nicolitsas and S. Poelhekke, Research series, April 2010.
190. "What determines euro area bank CDS spreads?", by J. Annaert, M. De Ceuster, P. Van Roy and C. Vespro, Research series, May 2010.
191. "The incidence of nominal and real wage rigidity: An individual-based sectoral approach", by J. Messina, Ph. Du Caju, C. F. Duarte, N. L. Hansen, M. Izquierdo, Research series, June 2010.
192. "Economic importance of the Belgian ports: Flemish maritime ports, Liège port complex and the port of Brussels - Report 2008", by C. Mathys, Document series, July 2010.
193. "Wages, labor or prices: how do firs react to shocks?", by E. Dhyne and M. Druant, Research series, July 2010.
© Illustrations : gettyimages – PhotoDiscNational Bank of Belgium
Layout : NBB Microeconomic AnalysisCover : NBB TS – Prepress & Image
Published in July 2010
Editor
Jan SmetsMember of the board of Directors of the National Bank of Belgium
National Bank of Belgium Limited liability company RLP Brussels – Company’s number : 0203.201.340 Registered office : boulevard de Berlaimont 14 – BE -1000 Brussels www.nbb.be