Embed Size (px)
Citation preview
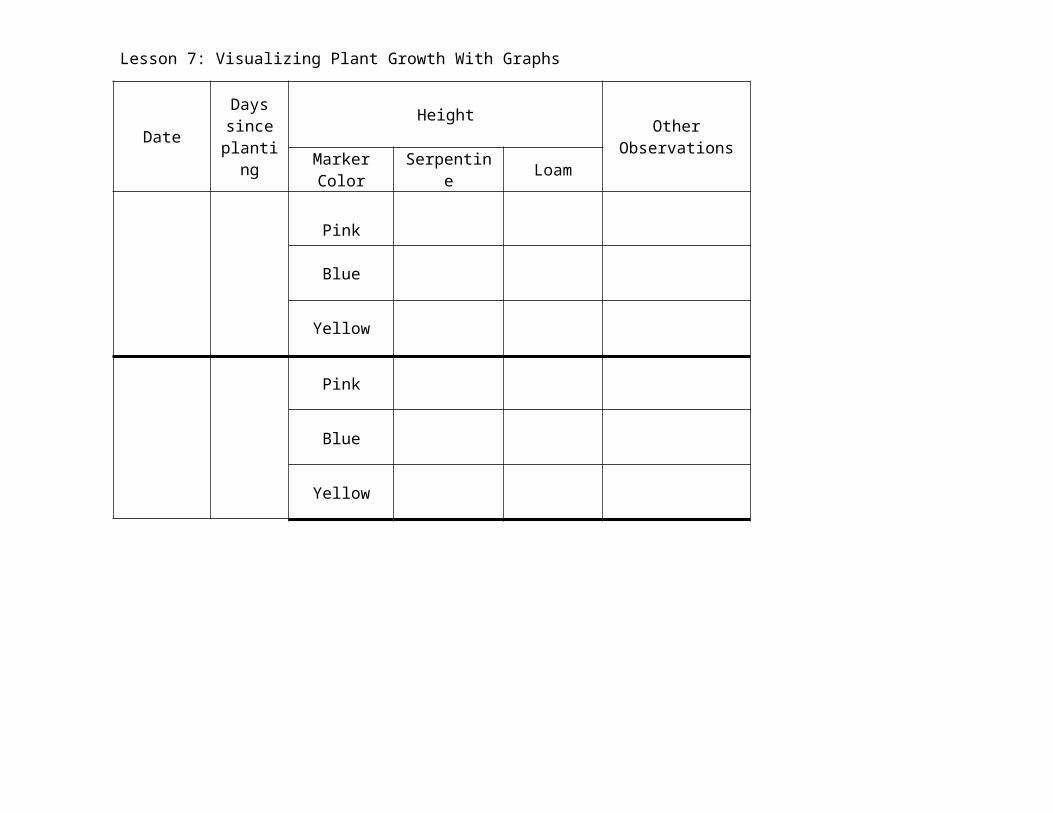
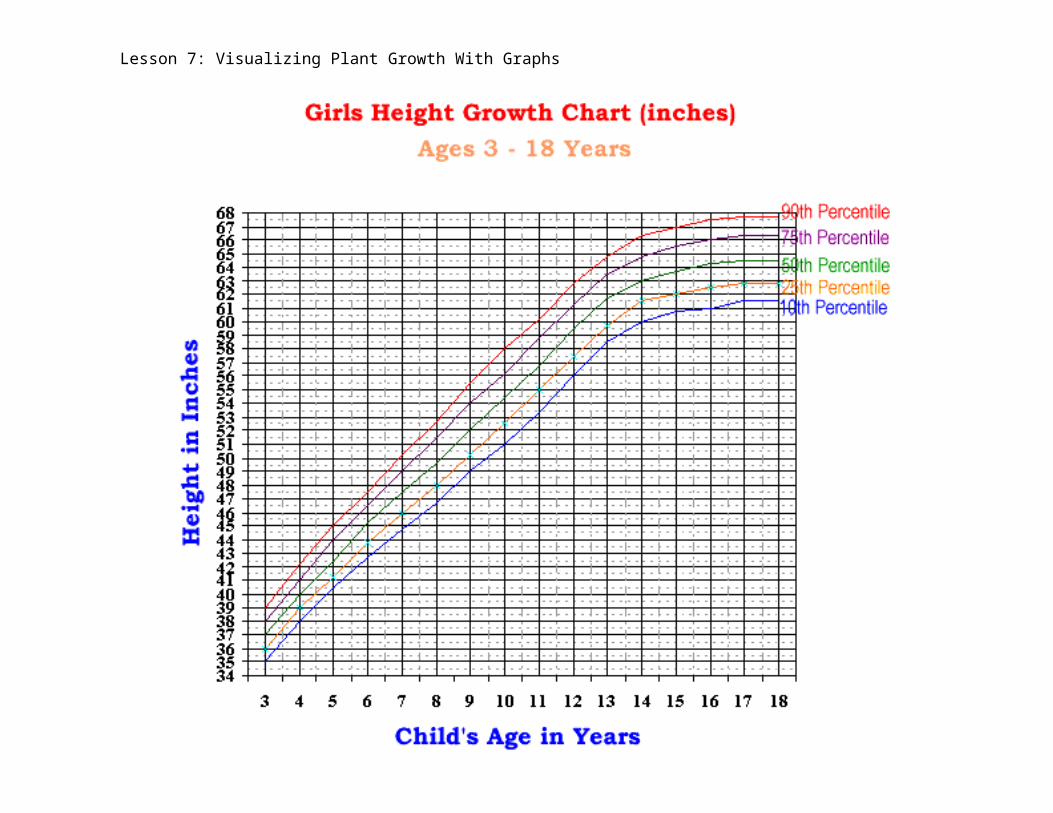
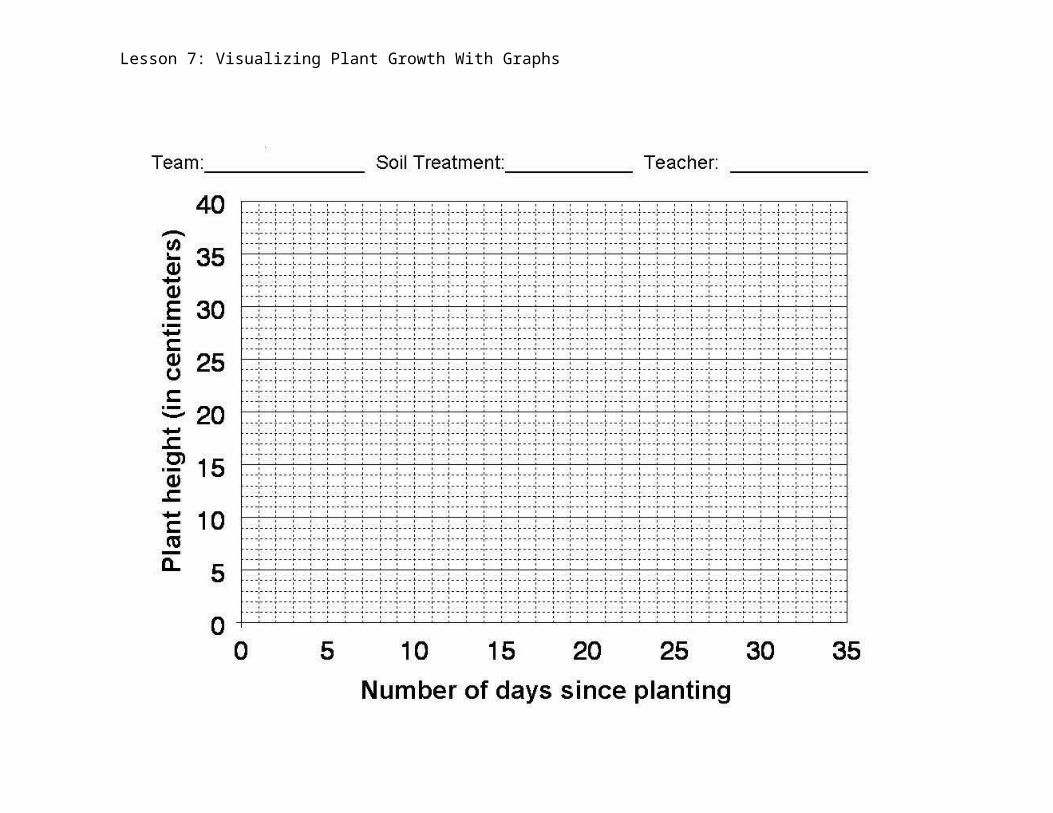
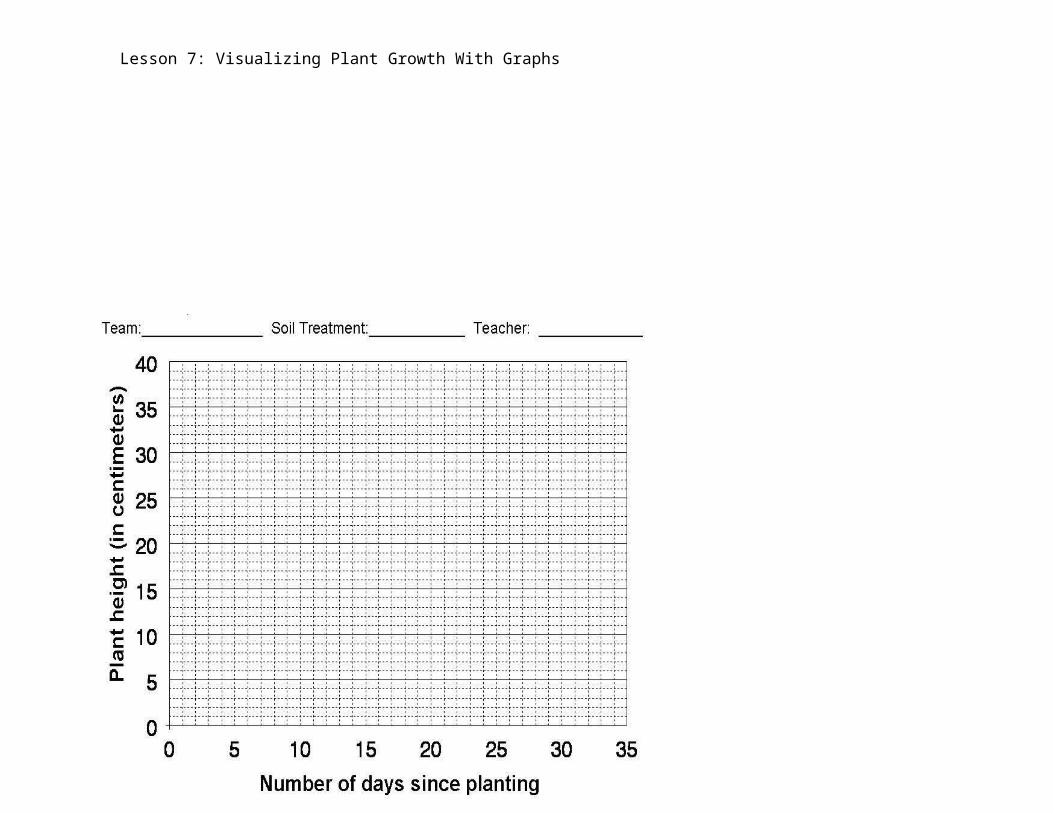
Lesson 7: Visualizing Plant Growth With Graphs
DateDays since
planting
HeightOther Observations
Marker Color Serpentine Loam
Pink
Blue
Yellow
Pink
Blue
Yellow
Lesson 7: Visualizing Plant Growth With Graphs
Lesson 7: Visualizing Plant Growth With Graphs
Lesson 7: Visualizing Plant Growth With Graphs
Lesson 7: Visualizing Plant Growth With Graphs

Lesson 7: Visualizing Plant Growth With Graphs
Lesson 7: Visualizing Plant Growth With Graphs
Lesson 7: Visualizing Plant Growth With Graphs
Lesson 7: Visualizing Plant Growth With Graphs
Date Day of Expt. Marker Serpentine Loam
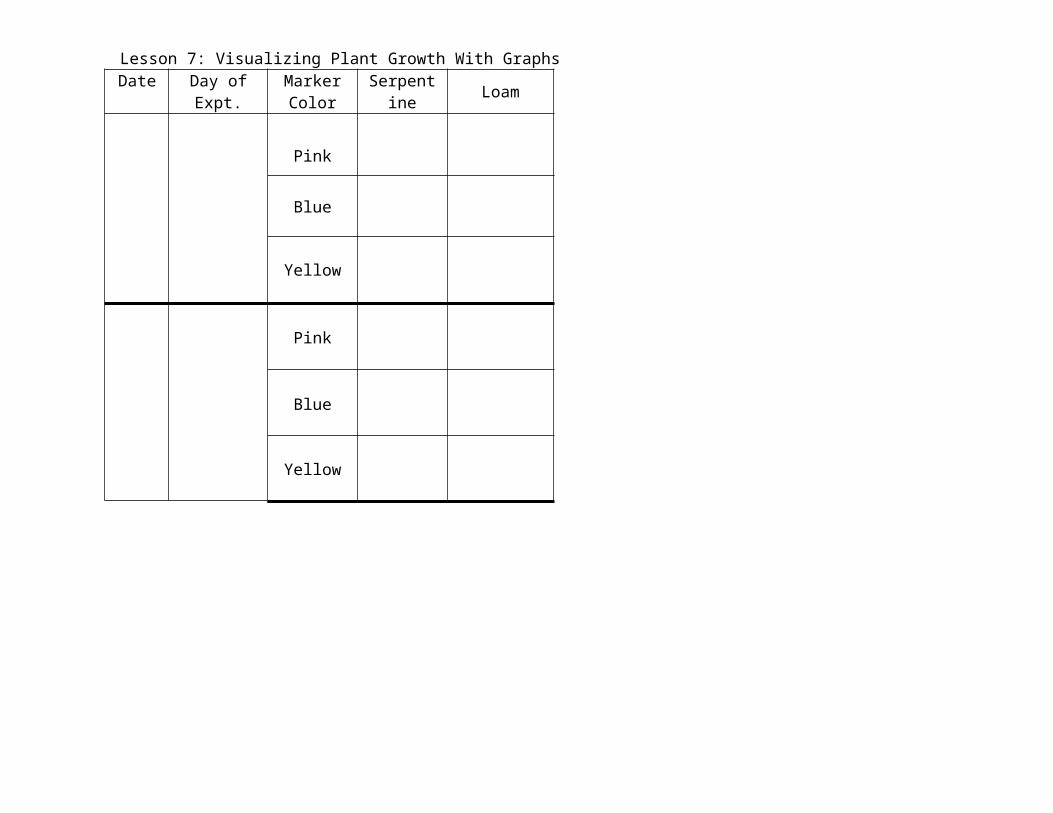
Lesson 7: Visualizing Plant Growth With GraphsColor
Pink
Blue
Yellow
Pink
Blue
Yellow