Embed Size (px)
Citation preview

Computer-Aided Design & Applications, 7(4), 2010, 533-546© 2010 CAD Solutions, LLC
533
Special Issue: CAD in the Arts
Kinetic Art Design System Comprising Rigid Body Simulation
Yohsuke Furuta1,2, Jun Mitani1,2, Takeo Igarashi1,3 and Yukio Fukui2
1Japan Science Technology Agency2University of Tsukuba
3The University of Tokyo
ABSTRACT
Kinetic art, such as mobile sculptures and balance toys, is art that involves movement.The design of original kinetic art is difficult because one must consider physics inorder to predict the result. Current computer aided design (CAD) and computer aidedengineering (CAE) tools are of limited use when designing such dynamic objectsbecause typically these systems are entirely separated. In this paper, we propose a newsystem for designing original kinetic art objects in which a three-dimensional (3D)geometrical modeling interface and a rigid body simulation are combined. In thisstudy, we introduce an implementation technique to achieve real-time responses andpresent a prototype system. To demonstrate the technique's effectiveness, we reportthe results of user studies and show several objects designed on the system.
Keywords: CAD, CAE, physical simulation, rigid body, kinetic art.DOI: 10.3722/cadaps.2010.533-546
1 INTRODUCTION
Kinetic art, such as mobile sculptures (Fig. 1) and balance toys, (Fig. 2) is art that involves movement.The designed motion can be produced by wind, flowing water or by observers. Numerous works of thistype have been created by artists [1][14] since the early 20th century. Movable objects attract people,but designing shapes that move as the designer intends is not always easy. In this paper, we propose acomputer system for use when designing “kinetic” art.
The use of computers for designing objects in the real world has become commonplace. Acomputer aided design (CAD) system is considered imperative for designing industrial products, anddesigning CAD user interfaces that are suitable for novice users has been a common topic of recentstudies [9][18][19]. By using a CAD system and a rapid prototyping system such as a three-dimensional(3D) printer that have dramatically decreased in cost recently, we can easily design actual objects thatare the intended shape.
However, current CAD systems can only be used for geometrical modeling and they do notevaluate the movement of designed objects. Even though it is possible to simulate and analyze objectswith a computer aided engineering (CAE) system, we have to return to the CAD system if the CAE

Computer-Aided Design & Applications, 7(4), 2010, 533-546© 2010 CAD Solutions, LLC
534
results are not satisfactory. Because current CAE systems are usually expensive and require knowledgeof numerical analysis in order to master them, they are not easy to use for non-specialists.Furthermore, it is inconvenient to go back and forth between separated CAD and CAE systems,especially since almost all kinetic art is created through trial and error.
Fig. 1: Examples of mobiles [14].
Fig. 2: Examples of balance toys (Left: Ishiguro Co., Ltd.).
In this paper, a 3D CAD system with rigid body simulation is proposed. To create this system, wecombined a 3D modeling application with a rigid body simulation engine in order to aid the designprocess of kinetic objects. The system continuously computes the motion of objects and presents theresults during a modeling operation. This allows the user to quickly execute many trial-and-errorexperiments. To provide quick response to operations, we present a new scheme in which the systemadjusts the tradeoff between accuracy and response time. The motions of the designed objects arevisualized as a set of wireframe models; and annotations, such as the colored arrows in the modelingwindow (Fig. 3(c)-(e)), convey the motion.
Our contributions are summarized as follows:
We propose a new 3D CAD system in which the rigid body simulation runs continuously duringgeometric modeling.
We introduce an implementation technique to provide real-time responses to user operations.The responses are achieved by adjusting the size of the simulation time steps depending onthe user operations.

Computer-Aided Design & Applications, 7(4), 2010, 533-546© 2010 CAD Solutions, LLC
535
We introduce a method for visualizing the motions of objects. This method does not useanimation; instead, in the modeling window, we show a set of wireframe models along withcolored arrows that indicate the predicted motions.
We developed a proposed application for designing kinetic objects that integrates the methodsdiscussed above. To demonstrate the effectiveness of our approach, we then conducted a userstudy and created several mobile objects.
In section 2, we introduce previous work related to our study. In section 3 we describe details ofour implementation. Then we show the results of our user study in section 4. Several objects designedwith our system are shown in section 5. Lastly we summarize results of our study in section 6.
2 RELATED WORK
The graphics community in general has had a long-standing interest in the design and simulation ofobjects and systems that behave in a physically realistic manner. Mitani [9] developed a system thatgenerates a paper craft toy design from a given 3D model, and Weyrich presented a system forcreating bas-relief sculpture [18]. Other studies have developed specialized modeling systems that arecapable of designing physical objects from scratch. For example, Mori presented a system fordesigning an original plush toy by sketching [19]. In our system, we assist the user in designingphysical objects by using rigid body simulation and applying the result to the design of kinetic art.
Rigid body simulation is now commonly used in video games, and some recent systems haveintegrated such simulation into geometric modeling. ASSIST (A Shrewd Sketch Interpretation andSimulation Tool) [2] and Phun [5] integrate rigid body simulation with geometric modeling based onsketches. The user draws shapes of rigid body primitives on the screen, after which the systemimmediately runs a simulation based on them. SketchyPhysics [6] is a 3D rigid body simulation pluginfor Google SketchUp [7]. The user can make interesting and realistic 3D animation easily with thesystem. Prometech Software developed a similar system named PhysiCafe [16] that combines ageometric modeling interface with a particle-based fluid simulation. However, these systems stillrequire the user to complete the geometric modeling and then view an animation sequence in order toobserve the consequences. Our approach pursues tighter integration of simulation and modeling. Thesystem runs a simulation in the background during interactive modeling performed by draggingselected features with the mouse, and continuously shows the resulting motions as visual annotationas the scene is edited. Umetani developed a system named DelFEM [12] that combines an CADinterface with a FEM simulation. We can design the shape of object while viewing the FEM analysis. Butthe system doesn’t support shape dynamically transformed.
The technique for sacrificing visual quality during user interaction is often used for quickresponse. For example, Tang et al. proposed a method to get a quick visual feedback by omittingcomplex objects from rendering [17]. On the other hand, our approach adjusts simulation quality bycontinuously changing the size of the time step.
Continuous presentation of the results of a rigid-body simulation during direct manipulation wasexamined by Popovic et al. [8] in their animation authoring system. The user interactively specifies thedesired target configuration during which the system runs an optimization to obtain appropriateparameters such as the initial position and velocity. In our proposal, we borrowed the idea ofpresenting the simulation result as visual annotations and applied this idea to the geometric design ofactual physical systems comprising multiple objects.
Our work also evolves from various visualization methods for moving images and objects. Forexample, Goldman et al. generated a storyboard from a video sequence in order to visualize motion[3]. Nienhaus et al. proposed dynamic glyphs that visualize motions of objects in static media [10].Paths, arrows, and texts are used for representing motions and collisions in the system. We referred tothis idea for our 3D dynamic system. Needham et al. visualized the predicted movements of billiardballs on real pool table using a projector [11]. The system analyzes positions of balls and direction ofthe queue from images and estimates their motions. A common point with our system is that user canadjust the initial position by seeing the simulated results.

Computer
3 SYSTEM OVERVIEW
Figure 3 shows an example of a modeling sequence andof “Art of Illusion 2.6.1” (AOI) [15], a 3D modeling application written in Java whose source code isdistributed under the General Public License (GPL). Although this application does not have theadvanced functions seen in recent CAD systems, users can design simple objects using its intuitiveinterface. We first added a new function that connects two objects by a string so that the users candesign mobiles or balance toys. We used “NVIDIA PhysX 2.8.1”3D virtual space. This library is a widely used 3D rigid body simulator, and some NVDIA’s GPU cantake advantage of it. This library supports many functions like rigid body simulation and collisiondetection, advanced character control, kinetics for vehicle, fluid simulation, cloth simulation, soft bodysimulation, force field, and so on. Because AOI is written in Java and PhysX is provided in native code,we modified AOI to call PhysX’s API through Java Native Interfacefunction of rigid body simulation and collision detection of PhysX.
(a) Create shapes and connect them with strings.
(c) Start a simulation.
Computer-Aided Design & Applications, 7(4), 2010, 533-546© 2010 CAD Solutions, LLC
536
an example of a modeling sequence and GUI of our system. The system is an extension, a 3D modeling application written in Java whose source code is
distributed under the General Public License (GPL). Although this application does not have thenctions seen in recent CAD systems, users can design simple objects using its intuitive
interface. We first added a new function that connects two objects by a string so that the users candesign mobiles or balance toys. We used “NVIDIA PhysX 2.8.1” [13] to simulate the object behaviors in3D virtual space. This library is a widely used 3D rigid body simulator, and some NVDIA’s GPU cantake advantage of it. This library supports many functions like rigid body simulation and collision
haracter control, kinetics for vehicle, fluid simulation, cloth simulation, soft bodysimulation, force field, and so on. Because AOI is written in Java and PhysX is provided in native code,we modified AOI to call PhysX’s API through Java Native Interface (JNI). And in our system we use thefunction of rigid body simulation and collision detection of PhysX.
(a) Create shapes and connect them with strings. (b) Set shape properties to “dynamic”.
(d) Adjust the shapes by observing the simulationresults.
546CAD Solutions, LLC
536
GUI of our system. The system is an extension, a 3D modeling application written in Java whose source code is
distributed under the General Public License (GPL). Although this application does not have thenctions seen in recent CAD systems, users can design simple objects using its intuitive
interface. We first added a new function that connects two objects by a string so that the users canto simulate the object behaviors in
3D virtual space. This library is a widely used 3D rigid body simulator, and some NVDIA’s GPU cantake advantage of it. This library supports many functions like rigid body simulation and collision
haracter control, kinetics for vehicle, fluid simulation, cloth simulation, soft bodysimulation, force field, and so on. Because AOI is written in Java and PhysX is provided in native code,
(JNI). And in our system we use the
shapes by observing the simulation
Computer
(e) Main screen. User edits shapes and positions of objects. The result ofsuperposed. (A) Tool buttons. (B) Amount of total movement of objectsin Section 4. (C) Object list. (D) Properties of the selected object
Fig. 3: An example of a modeling session and
The user can create spheres, cubes, and flat boards with simple mouse operations in 3D space.The objects are represented as a set of triangles. The user can edit the details of the shape by draggingvertices. Further, the user can connect two objects withmovement,” i.e. the summed up distances of allused for evaluation in Section 4). To realize a modeling system that was tightly combined with aphysical simulator, we added properties such as direction, density, and attribution to each object. Theattribution has three possible states: “dynamic”, “static” and “nonphysical”. The behaviors of thedynamic objects are calculated by the simulator. The static objaffect other dynamic models when they collide. The nonphysical objects are temporarily excludedfrom the simulation. Other properties are shown in Tablethe size of the time step because this affects both the accuracy of the simulation and the responsedelay. In the next subsection, we discuss two schemes used to decide the size of the time step.
Object type
SphereCube
Flat boardTriangle mesh
Tab. 1: Objet types and their
Computer-Aided Design & Applications, 7(4), 2010, 533-546© 2010 CAD Solutions, LLC
537
Main screen. User edits shapes and positions of objects. The result of physical simulation istotal movement of objects. This value is used for evaluation
of the selected object.
Fig. 3: An example of a modeling session and of the user interface of our system.
The user can create spheres, cubes, and flat boards with simple mouse operations in 3D space.The objects are represented as a set of triangles. The user can edit the details of the shape by draggingvertices. Further, the user can connect two objects with a string by a dragging operation. The “total
all the vertices moved, is displayed on the screen (this isused for evaluation in Section 4). To realize a modeling system that was tightly combined with a
imulator, we added properties such as direction, density, and attribution to each object. Theattribution has three possible states: “dynamic”, “static” and “nonphysical”. The behaviors of thedynamic objects are calculated by the simulator. The static objects do not move, although they doaffect other dynamic models when they collide. The nonphysical objects are temporarily excludedfrom the simulation. Other properties are shown in Table 1. One of the most important parameters is
because this affects both the accuracy of the simulation and the responsedelay. In the next subsection, we discuss two schemes used to decide the size of the time step.
Properties
RadiusWidth, height, and depth
Thickness, 2D vertices of stroke3D vertices, triangle indices
Objet types and their properties and parameters.
546CAD Solutions, LLC
537
simulation isused for evaluation
The user can create spheres, cubes, and flat boards with simple mouse operations in 3D space.The objects are represented as a set of triangles. The user can edit the details of the shape by dragging
dragging operation. The “totalvertices moved, is displayed on the screen (this is
used for evaluation in Section 4). To realize a modeling system that was tightly combined with aimulator, we added properties such as direction, density, and attribution to each object. The
attribution has three possible states: “dynamic”, “static” and “nonphysical”. The behaviors of theects do not move, although they do
affect other dynamic models when they collide. The nonphysical objects are temporarily excluded. One of the most important parameters is
because this affects both the accuracy of the simulation and the response

Computer-Aided Design & Applications, 7(4), 2010, 533-546© 2010 CAD Solutions, LLC
538
The positions and properties of the objects are automatically passed to the physical simulator fromthe modeling system via JNI. In the simulation, we used the following material properties for allobjects: density 1, elasticity 0.4, static friction 0.5, and dynamic friction 0.5.
The results returned from the simulator contain the positions of the objects after a specified timestep has past. Collisions between objects can also be detected from the results. For each collision, thesimulator returns the collision position and the IDs of the two objects involved in the collision.
3.1 Responsive Physical Simulation
Physical simulation requires significant computational resources. These include not only the cost ofthe simulation itself (which causes response delays) but also the cost of initialization. Initializationincludes the division of objects into convex polyhedra, computing a convex hull, re-indexing thevertices, and so on for improving the speed of the collision tests. To reduce the computational time, weintroduced the following schemes:
We perform initialization only for objects whose shape has been changed. We change the size of the time step of the simulation (Δt) dynamically based on the user
operation.
The second scheme is based on the concept that when a user is changing the position of an object,a rapid response is more important than the accuracy of the simulation. Conversely, when a user stopsan operation, the simulation should be sufficiently accurate because the user is inspecting the resulton the screen. We therefore introduce the following approach.
We first use a large Δt in order to show the approximate result quickly. If the simulation endswithout any changes of the object states such as position or shape, the Δt is set to half its previoussize, then the simulation is executed again. This makes the result more accurate. If, however, any ofthe object states are changed, the simulation is re-started with a twice Δt. This realizes quick responseof the simulation in exchange for accuracy. Since this Δt adjustment is performed automatically by thesystem, the user does not need to suggest an interval (Fig. 4).
Fig. 4: The interval of the simulation is changed dynamically and automatically. The Δt of the left andright figures are 100msec and 5msec respectably. The simulated period is 10 sec.
Computer
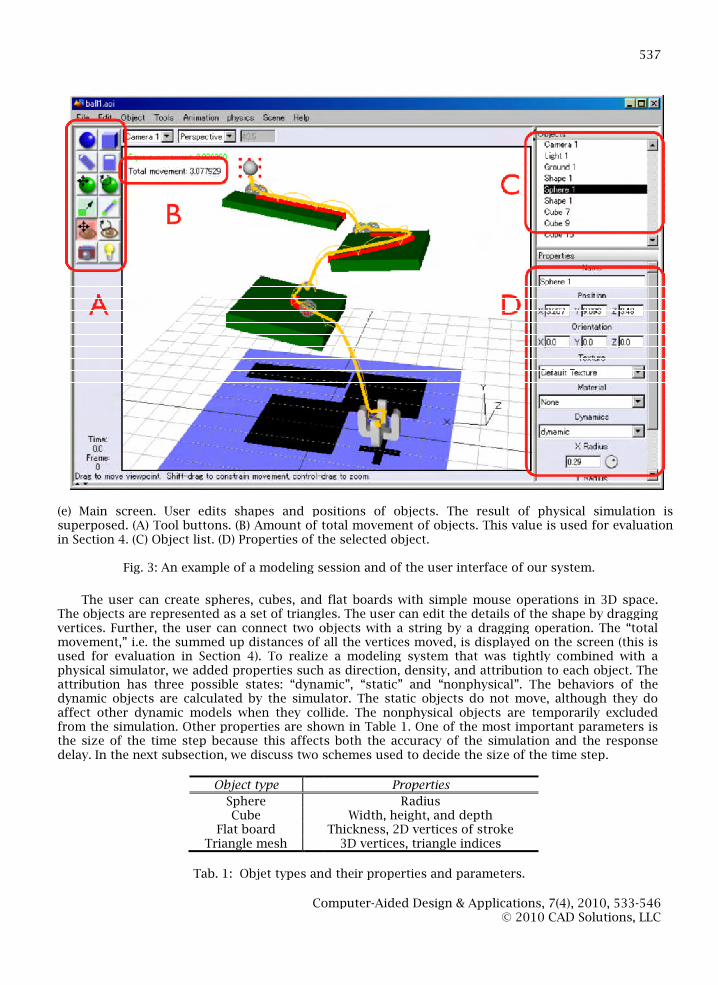
3.2 Visualization of the Simulation Results
As a result of the physical simulation, the system obtains matrices containing information of theorientations and positions of the objects. By iterating the simulation at a specified timemotion of an object can be expressed as an array of matrices. Now, the problem is how to show themotion to the user.
If the system displays wireframe model drawings at every time step, as shown in Figsometimes difficult to visualize behavior because the screen becomes too cluttered, especially whennumerous objects exist in a single scene or when the number of iterations is large. To avoid thisproblem, the system only draws objects located at positions where the direction of thechanged.
(a)
Fig. 5: The differences in the drawing that a pendulum smashing into a stack of two bricks: (a) drawingthe object at all positions computed by the simulator, (b) drawing the positions where the direction ofthe motion is changed, (c) drawing the trajectory of the center and the mostball rotates after the smashing, two curves above and below the trajectory of the center are shown.
Specifically, we identify the position where the sign ofnegative.
vt
a t
dt
Where Mtis an rigid-body transformation matrix of the object at time
simulator, and p = (x, y, z) is the centroid, i.e., mean position of all the vertices of the object. Figure5(b) shows the result of adopting this approach. We can see that objects are displayed only at thepositions where the direction of the motions has been changed.
To clarify the behaviors of objects, we also display two loci for each object. One is the locus of thecenter of the object and the other is the vertextime step. To find the longest incremental motion, the systemsimulation. We can see that the locus of the center shows the locus of the motion, and the locus of thevertex shows the rotational behavior. Figurepositions where collisions occur are visualized as red points, as shown in Figusers to more easily comprehend the motions of objects in a single image.
Computer-Aided Design & Applications, 7(4), 2010, 533-546© 2010 CAD Solutions, LLC
539
Visualization of the Simulation Results
As a result of the physical simulation, the system obtains matrices containing information of theorientations and positions of the objects. By iterating the simulation at a specified time step, themotion of an object can be expressed as an array of matrices. Now, the problem is how to show the
If the system displays wireframe model drawings at every time step, as shown in Figure 5(a), it isize behavior because the screen becomes too cluttered, especially when
numerous objects exist in a single scene or when the number of iterations is large. To avoid thisproblem, the system only draws objects located at positions where the direction of the motion has
(b) (c)
Fig. 5: The differences in the drawing that a pendulum smashing into a stack of two bricks: (a) drawingthe object at all positions computed by the simulator, (b) drawing the positions where the direction of
motion is changed, (c) drawing the trajectory of the center and the most-moving vertex. Since theball rotates after the smashing, two curves above and below the trajectory of the center are shown.
Specifically, we identify the position where the sign of dt
in the following equations becomes
t M tp Mt1p
t vt vt1
dt a t a t1
body transformation matrix of the object at time t, which is computed by the, i.e., mean position of all the vertices of the object. Figure
(b) shows the result of adopting this approach. We can see that objects are displayed only at thepositions where the direction of the motions has been changed.
jects, we also display two loci for each object. One is the locus of thecenter of the object and the other is the vertex which has the longest incremental motion in the last
the longest incremental motion, the system traces all loci of vertices duringWe can see that the locus of the center shows the locus of the motion, and the locus of the
vertex shows the rotational behavior. Figure 5(c) shows the result of this feature. Furthermore, thee visualized as red points, as shown in Figure 6. These features help
users to more easily comprehend the motions of objects in a single image.
546CAD Solutions, LLC
539
As a result of the physical simulation, the system obtains matrices containing information of thestep, the
motion of an object can be expressed as an array of matrices. Now, the problem is how to show the
(a), it isize behavior because the screen becomes too cluttered, especially when
numerous objects exist in a single scene or when the number of iterations is large. To avoid thismotion has
Fig. 5: The differences in the drawing that a pendulum smashing into a stack of two bricks: (a) drawingthe object at all positions computed by the simulator, (b) drawing the positions where the direction of
Since the
in the following equations becomes
, which is computed by the, i.e., mean position of all the vertices of the object. Figure
(b) shows the result of adopting this approach. We can see that objects are displayed only at the
jects, we also display two loci for each object. One is the locus of thethe longest incremental motion in the last
vertices duringWe can see that the locus of the center shows the locus of the motion, and the locus of the
(c) shows the result of this feature. Furthermore, the. These features help

Computer
Fig. 6: A box falling onto the edge of an obstacle (Collision points are expressed as red dots).
3.3 Visualization of Stationary Objects
The visualization mentioned in the previous subsection works well for designing objects in which thetrajectories have meaning. However, motion trajectory itself is not so important when we design abalance toy because our concern is whether the objects are stable. Accordingly, we added an optionthat can be used to switch the display of the object's motion. In the newly added display mode, thelocus of the center of the object and the locus of the longest vertex are first calculatIf the center is almost stable, the object is considered to be rotating. Then, two magenta arrows aredisplayed to indicate the rotation direction, as shown on the left in Figthe same, the object is considered to be moving without rotation. If that occurs, a blue arrow thatshows the movement of the object is displayed, as shown on the right in Figuse two yellow arrows that show loci as mentioned in section
Fig. 7: Representation of rotation (left) and parallel translation (right).
4 SYSTEM EVALUATION
We asked 6 test users to carry out two different tasks with and without the proposed interface. Withthe proposed interface, the physical simulation runs in the backgroundshown to the user as a static visualization during editing. Without the proposed interface, the userexplicitly runs a simulation by pressing a button and the result is shown as an animation. Therefore,test user completed two tasks. All users were university students who were familiar with computersbut who had no experiences in designing 3D models with CAD.
Computer-Aided Design & Applications, 7(4), 2010, 533-546© 2010 CAD Solutions, LLC
540
Fig. 6: A box falling onto the edge of an obstacle (Collision points are expressed as red dots).
The visualization mentioned in the previous subsection works well for designing objects in which thetrajectories have meaning. However, motion trajectory itself is not so important when we design a
is whether the objects are stable. Accordingly, we added an optionthat can be used to switch the display of the object's motion. In the newly added display mode, thelocus of the center of the object and the locus of the longest vertex are first calculated for each object.If the center is almost stable, the object is considered to be rotating. Then, two magenta arrows aredisplayed to indicate the rotation direction, as shown on the left in Figure 7. If the two loci are almost
sidered to be moving without rotation. If that occurs, a blue arrow thatshows the movement of the object is displayed, as shown on the right in Figure 7. In other cases, we
that show loci as mentioned in section 3.2.
epresentation of rotation (left) and parallel translation (right).
We asked 6 test users to carry out two different tasks with and without the proposed interface. Withthe proposed interface, the physical simulation runs in the background and the result is continuouslyshown to the user as a static visualization during editing. Without the proposed interface, the userexplicitly runs a simulation by pressing a button and the result is shown as an animation. Therefore,
wo tasks. All users were university students who were familiar with computersbut who had no experiences in designing 3D models with CAD.
546CAD Solutions, LLC
540
The visualization mentioned in the previous subsection works well for designing objects in which thetrajectories have meaning. However, motion trajectory itself is not so important when we design a
is whether the objects are stable. Accordingly, we added an optionthat can be used to switch the display of the object's motion. In the newly added display mode, the
ed for each object.If the center is almost stable, the object is considered to be rotating. Then, two magenta arrows are
7. If the two loci are almostsidered to be moving without rotation. If that occurs, a blue arrow that
, we
We asked 6 test users to carry out two different tasks with and without the proposed interface. Withand the result is continuously
shown to the user as a static visualization during editing. Without the proposed interface, the userexplicitly runs a simulation by pressing a button and the result is shown as an animation. Therefore,
wo tasks. All users were university students who were familiar with computers

Computer
Before executing a task, they were instructed on how to use our system and were given practicetime and a practice task. The practice task was to adjuststring to make a mobile sculpture stable (Fig. 8
A test covering the same task with a different interface was given on a different day. And the testenvironment was as follows:
Model: Dell Precision T5400
CPU: Intel Xeon E5430 2.66 GHz (FSB: 1333 MHz)
RAM: 4 GB FB-DIMM with ECC 667 MHz
VGA: NVIDIA Quadro FX 4600 (VRAM: 768 MB)
Misc: Microsoft Vista sp1, Java 1.6.0_16 + JOGL 1.1.1
Fig. 8: Practicing to use our system.
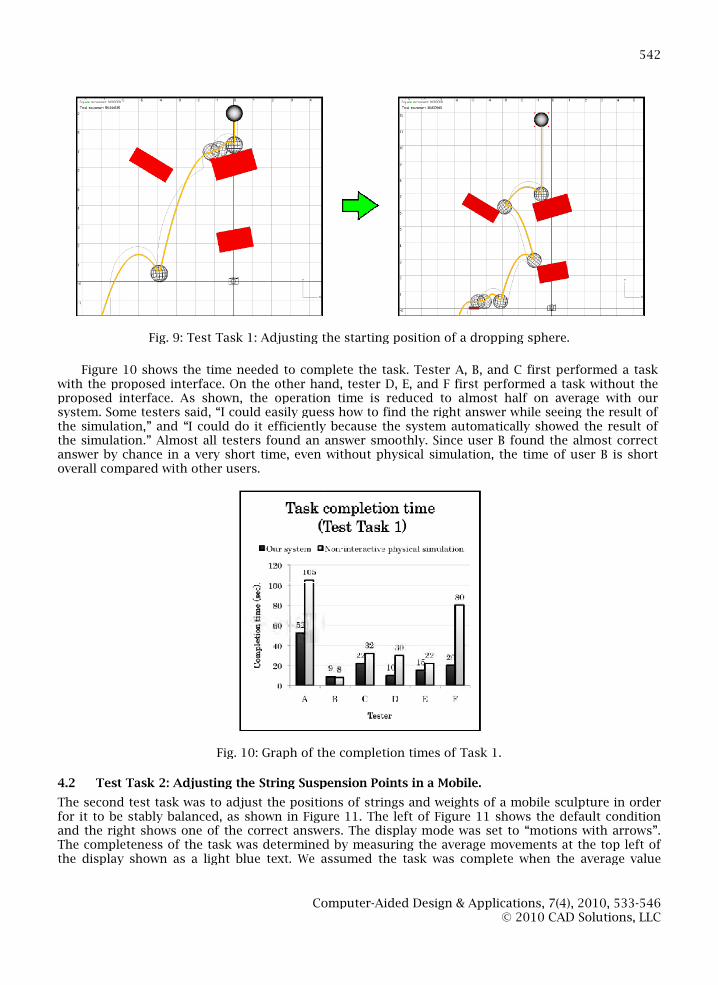
4.1 Test Task 1: Adjusting the Starting Position of a Dropping S
The first test task was to find an appropriate initial position of a sphere where it touches three boxeswhile dropping down to the floor, as shown in Figcondition and the right shows one of the correct answerloci”.
This task is regarded as the process of designing bagatelles (toys that involve the rolling of balls)or Corinth games (games in which objects collide) [4]
Computer-Aided Design & Applications, 7(4), 2010, 533-546© 2010 CAD Solutions, LLC
541
Before executing a task, they were instructed on how to use our system and were given practicetask was to adjust the position of a small pink sphere and
8).A test covering the same task with a different interface was given on a different day. And the test
Intel Xeon E5430 2.66 GHz (FSB: 1333 MHz)
DIMM with ECC 667 MHz
NVIDIA Quadro FX 4600 (VRAM: 768 MB)
Microsoft Vista sp1, Java 1.6.0_16 + JOGL 1.1.1
Fig. 8: Practicing to use our system.
Test Task 1: Adjusting the Starting Position of a Dropping Sphere.
The first test task was to find an appropriate initial position of a sphere where it touches three boxeswhile dropping down to the floor, as shown in Figure 9. The left of Figure 9 shows the default
one of the correct answers. The display mode was set to “motions with
This task is regarded as the process of designing bagatelles (toys that involve the rolling of balls)bjects collide) [4]
546CAD Solutions, LLC
541
Before executing a task, they were instructed on how to use our system and were given practicesmall pink sphere and a
A test covering the same task with a different interface was given on a different day. And the test
The first test task was to find an appropriate initial position of a sphere where it touches three boxesthe default
motions with
This task is regarded as the process of designing bagatelles (toys that involve the rolling of balls)
Computer
Fig. 9: Test Task 1: Adjusting the starting position of a dropping sphere.
Figure 10 shows the time needed to complete the task. Tester A, B, and Cwith the proposed interface. On the other hand, tester D, E, and Fproposed interface. As shown, the operation time is reduced tosystem. Some testers said, “I could easily guess how to find the rigthe simulation,” and “I could do it efficiently because the system automatically showed the result ofthe simulation.” Almost all testers found an answer smoothly.answer by chance in a very short time, even without physical simulation, the time of user B is shortoverall compared with other users.
Fig. 10: Graph of the completion times of Task 1.
4.2 Test Task 2: Adjusting the String Suspension Points in a M
The second test task was to adjust the positions of strings and weights of a mobile sculpture in orderfor it to be stably balanced, as shown in Figureand the right shows one of the correct answerThe completeness of the task was determined by measuring the average movements at the top left ofthe display shown as a light blue text. We assumed the task was complete when the average value
Computer-Aided Design & Applications, 7(4), 2010, 533-546© 2010 CAD Solutions, LLC
542
Fig. 9: Test Task 1: Adjusting the starting position of a dropping sphere.
shows the time needed to complete the task. Tester A, B, and C first performed a taskproposed interface. On the other hand, tester D, E, and F first performed a task without the
proposed interface. As shown, the operation time is reduced to almost half on average with oursystem. Some testers said, “I could easily guess how to find the right answer while seeing the result ofthe simulation,” and “I could do it efficiently because the system automatically showed the result ofthe simulation.” Almost all testers found an answer smoothly. Since user B found the almost correct
even without physical simulation, the time of user B is short
Fig. 10: Graph of the completion times of Task 1.
Test Task 2: Adjusting the String Suspension Points in a Mobile.
task was to adjust the positions of strings and weights of a mobile sculpture in orderure 11. The left of Figure 11 shows the default condition
ect answers. The display mode was set to “motions with arrowsThe completeness of the task was determined by measuring the average movements at the top left ofthe display shown as a light blue text. We assumed the task was complete when the average value
546CAD Solutions, LLC
542
a taskthe
half on average with ourht answer while seeing the result of
the simulation,” and “I could do it efficiently because the system automatically showed the result ofSince user B found the almost correct
even without physical simulation, the time of user B is short
task was to adjust the positions of strings and weights of a mobile sculpture in orderthe default condition
arrows”.The completeness of the task was determined by measuring the average movements at the top left ofthe display shown as a light blue text. We assumed the task was complete when the average value

Computer
became less than 1 mm/sec. The test users were allowed to move the positions of the strings, the grayspherical weights and the red spherical fulcrum.
Fig. 11: Test Task 2: Adjusting the string suspension points in a mobile.
Figure 12 shows the time needed to complete the second task. Tester A, B, and Ctask with the proposed interface. On the other hand, tester D, E, and Fthe proposed interface. As shown, the testers could reduce the tthird (on average) with our system. And we obtained thesee and understand the behavior.”
Fig. 12: Graph of the completion times of Task 2.
One test user moved the central sphere to the right side, as shown in Figbalanced, but we did not anticipate this answer. This showunanticipated alternatives to a particular solutionhelp users find valid solutions quickly, our system enables users to discover new alternatives.
Computer-Aided Design & Applications, 7(4), 2010, 533-546© 2010 CAD Solutions, LLC
543
e test users were allowed to move the positions of the strings, the grayspherical weights and the red spherical fulcrum.
Fig. 11: Test Task 2: Adjusting the string suspension points in a mobile.
shows the time needed to complete the second task. Tester A, B, and C first performedproposed interface. On the other hand, tester D, E, and F first performed a task without
proposed interface. As shown, the testers could reduce the task completion time to less than oneobtained the comment that our interface made it “easy to
Fig. 12: Graph of the completion times of Task 2.
central sphere to the right side, as shown in Figure 13. The result wasbut we did not anticipate this answer. This shows that our system can help find several
solution. Even though some optimization approaches couldhelp users find valid solutions quickly, our system enables users to discover new alternatives.
546CAD Solutions, LLC
543
e test users were allowed to move the positions of the strings, the gray
aa task without
ask completion time to less than onecomment that our interface made it “easy to
. The result washelp find several
roaches could

Computer
Fig. 13: Another solution to test task 2.
5 DESIGN RESULTS
The authors of this system designed and created several balance toys with our system. Figureprovides an example. It was difficult to balance this mobile because the user must not only design “theshape of kinetic objects” but also their suspension and/connected parts. However, we completed the design in approximately 15 minutes, after which we useda laser cutter to fabricate components for an actual model out of 5 mm acrylic resin board. Figureshows another example. This one was also difficult to design without our system because it has a 3Dconfiguration.
Fig. 14: Example of a mobile.
Computer-Aided Design & Applications, 7(4), 2010, 533-546© 2010 CAD Solutions, LLC
544
Fig. 13: Another solution to test task 2.
The authors of this system designed and created several balance toys with our system. Figure 14provides an example. It was difficult to balance this mobile because the user must not only design “theshape of kinetic objects” but also their suspension and/or contact points, and it incorporates a loop ofconnected parts. However, we completed the design in approximately 15 minutes, after which we useda laser cutter to fabricate components for an actual model out of 5 mm acrylic resin board. Figure 15
another example. This one was also difficult to design without our system because it has a 3D
Fig. 14: Example of a mobile.
546CAD Solutions, LLC
544
14provides an example. It was difficult to balance this mobile because the user must not only design “the
or contact points, and it incorporates a loop ofconnected parts. However, we completed the design in approximately 15 minutes, after which we used
15another example. This one was also difficult to design without our system because it has a 3D

Computer
Fig. 15: A second example of a mobile.
Figure 16 shows an example designed by a test user. We providminutes of instruction at the beginning of the session. After that, we did not put any limits on herdesign time. We also provided guidance on the use of the software, as required, during her designwork. It took approximately one hour to complete her design. She reported that she successfullycreated the shape she desired. She also identified some limitationslack of an undo function and the need for a way to add holes to
Fig. 16: Example of a mobile created by a test user.
6 CONCLUSIONS AND FUTURE WORK
We propose a system that integrates geometric modeling and physical simulation in order to designthe shapes of kinetic objects. We have presented an implementation techniquadjusts the time step for simulations, based on user operations. The results of a simulation arevisualized in the modeling window. After wecould design kinetic objects with our system more efficiently than could be accomplished with othercurrent systems. We also created actual mobile sculptures using our system and observed that theywere well balanced.
Although our system worked well for designing simple kinetic objects, some limitidentified. Our system makes it easy to understand the motions of objects by displaying wireframesand colored arrows, but the visualization becomes too complex when the number of objects on thescreen increases substantially. We plan to add a
Computer-Aided Design & Applications, 7(4), 2010, 533-546© 2010 CAD Solutions, LLC
545
Fig. 15: A second example of a mobile.
shows an example designed by a test user. We provided her with approximately fiveminutes of instruction at the beginning of the session. After that, we did not put any limits on herdesign time. We also provided guidance on the use of the software, as required, during her design
y one hour to complete her design. She reported that she successfullycreated the shape she desired. She also identified some limitations of the current system, such as thelack of an undo function and the need for a way to add holes to some parts.
Fig. 16: Example of a mobile created by a test user.
a system that integrates geometric modeling and physical simulation in order to designpresented an implementation technique that automatically
adjusts the time step for simulations, based on user operations. The results of a simulation arevisualized in the modeling window. After we had implemented the system, we demonstrated that we
em more efficiently than could be accomplished with othercurrent systems. We also created actual mobile sculptures using our system and observed that they
Although our system worked well for designing simple kinetic objects, some limitations wereidentified. Our system makes it easy to understand the motions of objects by displaying wireframesand colored arrows, but the visualization becomes too complex when the number of objects on the
ally. We plan to add a function that enables the user to select target objects
546CAD Solutions, LLC
545
ed her with approximately fiveminutes of instruction at the beginning of the session. After that, we did not put any limits on herdesign time. We also provided guidance on the use of the software, as required, during her design
y one hour to complete her design. She reported that she successfullythe current system, such as the
a system that integrates geometric modeling and physical simulation in order to designe that automatically
adjusts the time step for simulations, based on user operations. The results of a simulation areimplemented the system, we demonstrated that we
em more efficiently than could be accomplished with othercurrent systems. We also created actual mobile sculptures using our system and observed that they
ations wereidentified. Our system makes it easy to understand the motions of objects by displaying wireframesand colored arrows, but the visualization becomes too complex when the number of objects on the
function that enables the user to select target objects

Computer-Aided Design & Applications, 7(4), 2010, 533-546© 2010 CAD Solutions, LLC
546
to show their motion. Then we would like to try to design more complex kinetic systems that involve alot of collisions and complicated motions.
Because an object that is almost unstable is more fun than one that is perfectly stable, the usermay wish to intentionally design objects that move widely due to minor influences while remaining“balanced” in the long run. However, currently there is no way to tell the difference between thesetypes of objects in our system. Supporting the design of balanced but almost unstable objects will bean interesting subject of future work. Slow oscillation frequencies might be a good criterion to indicatethe near-instabilities of balancing toys.
Integration of the modeling interface and of the simulation engine is expected to be useful formore general systems. In the future, we plan to test various simulation methods, such as fluidsimulation and finite element methods, which support a greater variety of objects. The key challengesare increasing the speed of the simulation and presenting the simulation results in a way that does notoverwhelm the user. In summary, the methods presented in this paper can be useful in many domains.
REFERENCES
[1] Frank, B.: Kineticus, http://www.kineticus.com/.[2] Alvarado, C.; Davis, R.: Resolving ambiguities to create a natural computer-based sketching
environment, In Proceedings of the Seventeenth International Joint Conference on ArtificialIntelligence, Seattle, Washington, 2001, 1365-1371.
[3] Goldman, D. B.; Curless, B.; Salesin, D.; Seitz, S. M.: Schematic storyboarding for videovisualization and editing, ACM Trans. Graph., 25(3), 2006, 862–871.
[4] Reed, D.: A little about the machines; Faculty.ccp.edu,http://faculty.ccp.edu/faculty/dreed/Campingart/pachinko/about.htm.
[5] Ernerfeldt, E.: Phun, http://www.phunland.com/wiki/Home.[6] DarthGak: sketchyphysics - Physics plugin for Sketchup,
http://code.google.com/p/sketchyphysics/.[7] Google Inc.: SketchUp, http://sketchup.google.com/.[8] Popovic, J.; Seitz, S. M.; Erdmann, M.; Popovic, Z.; Witkin, A.: Interactive manipulation of rigid
body simulations, In SIGGRAPH ’00: Proceedings of the 27th annual conference on Computergraphics and interactive techniques, 2000, 209–217.
[9] Mitani, J.; Suzuki, H.: Making papercraft toys from meshes using strip-based approximateunfolding, ACM Trans. Graph., 23(3), 2004, 259–263.
[10] Nienhaus, M.; Dollner, J.: Dynamic Glyphs – Depicting Dynamics in Images of 3D Scenes, InProceedings of Third International Symposium on Smart Graphics, 2003, 102–111.
[11] Straub, M.; Needham, J.: Digitally assisted billiards. http://hackaday.com/2008/12/10/digitally-assisted-billiards/.
[12] Umetani, N.; Development of integrated design analysis software with interactive UI, InProceedings of the 50th Symposium of IPS Japan, 2009, 105-110.
[13] NVIDIA corp.: Physx 2.8.1, http://developer.nvidia.com/ob ject/physx.html.[14] Ole Flensted: Bauhaus mobile, Flowing rhythm,
http://www.flensted-mobiles.com/images/thumbnls/thumbs0.htm.[15] Eastman, P.: Art of illusion, http://www.artofillusion.org/.[16] Prometech Software: PhysiCafe, http://www.prometech.co.jp/products/physicafe.html.[17] Tang, S. H.; Linton, M. A.: Pacers: Time-elastic Objects, ACM Symposium on User Interface
Software and Technology, 1993, 35-43.[18] Weyrich, T.; Deng, J.; Barnes, C.; Rusinkiewicz, S.; Finkelstein, A.: Digital bas-relief from 3D
scenes, ACM Transactions on Graphics (Proc. SIGGRAPH), 26(3), 2007.[19] Mori, Y.; Igarashi, T.: Pillow: interactive pattern design for stuffed animals, In SIGGRAPH ’06:
ACM SIGGRAPH 2006 Sketches, 74.