Embed Size (px)
Citation preview
PROCEEDINGS, Thirty-Eighth Workshop on Geothermal Reservoir Engineering
Stanford University, Stanford, California, February 11-13, 2013
SGP-TR-198
KINETICS OF THE GELATION OF COLLOIDAL SILICA AT GEOTHERMAL CONDITIONS,
AND IMPLICATIONS FOR RESERVOIR MODIFICATION AND MANAGEMENT
Jonathan D. Hunt, Souheil M. Ezzedine, William Bourcier, Sarah Roberts
Lawrence Livermore National Laboratory
7000 East Avenue
Livermore, CA 94550
e-mail: [email protected]
ABSTRACT
Gel deployments to divert, direct and control fluid
flow have been extensively and successfully used in
the oil and gas industries for enhanced oil recovery,
and for the containment of radioactive and toxic
wastes. However, to the best of our knowledge, gels
have not been applied to hydrothermal systems to
enhance heat extraction. The ability to divert and
control fluid flow in the subsurface would be
extremely useful to the geothermal industry. Gels
may be able to block hydraulic short circuits,
minimize losses of injected geothermal fluid to the
surrounding formation, and divert working fluids to
the hotter regions of a formation. These applications
will all in turn maximize heat extraction from a
geothermal reservoir and therefore maximize the
longevity and the economic potential of the reservoir.
Inorganic, non-toxic gels, such as colloidal silica
gels, may be ideal blocking agents for geothermal
systems if suitable gelation times and control of
gelation behavior can be achieved. In the current
study, we detail colloidal silica gelation times,
behavior, and gel stability as a function of silica
concentration, pH, salt concentration, and
temperature up to 300 °C. Results indicate that while
colloidal silica gels will have limited use in high-
temperature geothermal systems (T > 200 °C) due to
fast gelation times and lack of long-term thermal
stability of silica gels at such high temperatures,
colloidal silica gels are generally well-behaved at
lower temperatures, with a large range of predictable
gel times. Colloidal silica gels may therefore have
broad application to lower-temperature (T ≤ 200 °C)
geothermal systems and regions of lower temperature
within hotter systems.
INTRODUCTION
In enhanced geothermal systems (EGS) the reservoir
permeability is often enhanced or created using
hydraulic fracturing. In hydraulic fracturing, high
fluid pressures are applied to confined zones in the
subsurface usually using packers to fracture the host
rock. This enhances rock permeability and therefore
conductive heat transfer to the circulating geothermal
fluid (e.g. water or supercritical carbon dioxide). The
ultimate
goal is to increase or improve the thermal energy
production from the subsurface by either optimal
designs of injection and production wells or by
altering the fracture permeability to create different
zones of circulation that can be exploited in
geothermal heat extraction. Moreover, hydraulic
fracturing can lead to the creation of undesirable
short-circuits or fast flow-paths between the injection
and extraction wells leading to a short thermal
residence time, low heat recovery, and thus a short-
life of the EGS.
A potential remedy to these problems is to deploy a
cementing (blocking, diverting) agent to minimize
short-cuts and/or create new circulation cells for heat
extraction. A potential diverting agent is the
colloidal silica by-product that can be co-produced
from geothermal fluids. Silica gels are abundant in
various surface and subsurface applications, yet they
have not been evaluated for EGS applications. In this
study we are investigating the benefits of silica gel
deployment on thermal response of an EGS, either by
blocking short-circuiting undesirable pathways as a
result of diverting the geofluid to other fractures; or
creating, within fractures, new circulation cells for
harvesting heat through newly active surface area
contact. A significant advantage of colloidal silica is
that it can be co-produced from geothermal fluids
using an inexpensive membrane-based separation
technology that was developed previously (Bourcier
et al., 2008).
This co-produced silica has properties that potentially
make it useful as a fluid diversion agent for
subsurface applications. Colloidal silica solutions
exist as low-viscosity fluids during their “induction
period” but then undergo a rapid increase in viscosity
(gelation) to form a solid gel. The length of the
induction period can be manipulated by varying the
properties of the solution, such as silica concentration
and colloid size. We believe it is possible to produce
colloidal silica solutions suitable for use as diverting
agents for blocking undesirable fast-paths which
result in short-circuiting the EGS once hydraulic
fracturing has been deployed. In addition, the gels
could be used in conventional geothermal fields to
increase overall energy recovery by modifying flow.
We believe there may be additional advantages for
using colloidal silica as blocking agents. It can be
inexpensively produced on site or at other geothermal
sites (Figure 1); it is inorganic and environmentally
friendly as opposed to organic gels often used in
oil/gas industry, and unlike conventional blocking
agents, the gel material might be hydraulically
removed after emplacement if needed. Furthermore,
colloidal silica gelation can be triggered externally,
for example by mixing with salt solutions or
changing the pH, there should be fewer
environmental restrictions and permitting
requirements for its use given that the material
originates in the same place it is to be injected, and
silica removal in itself benefits the power plant in
terms of silica scale control.
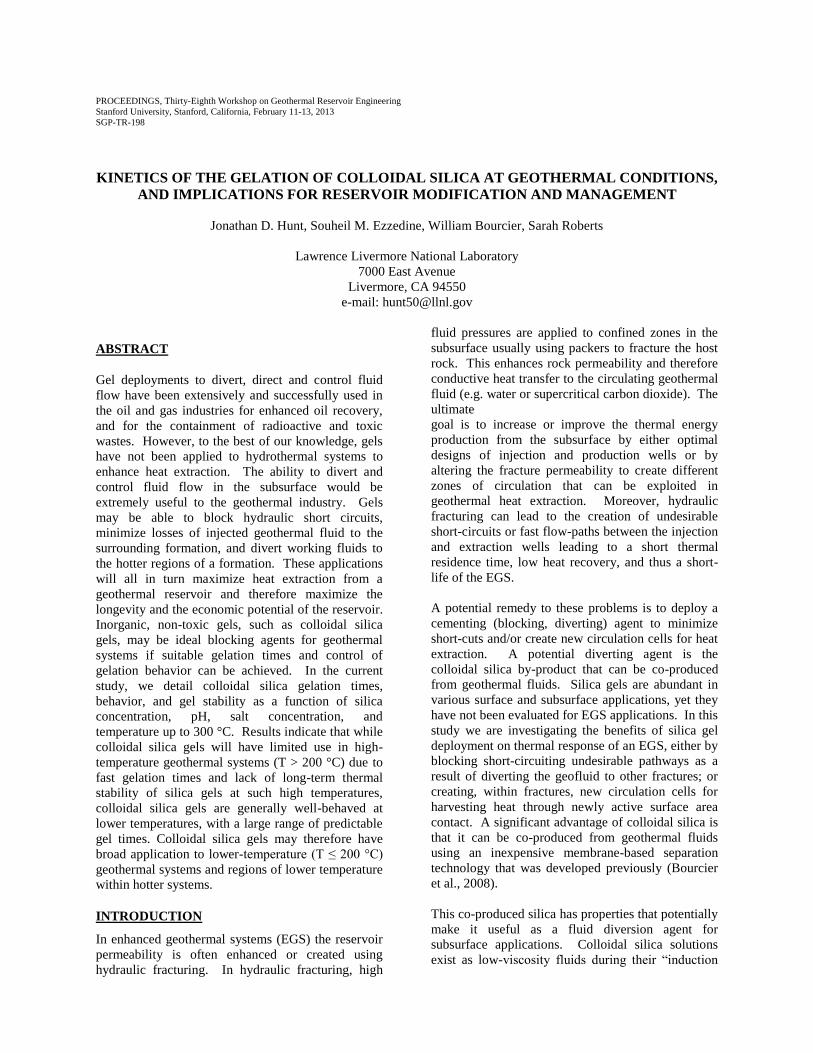
Figure 1: Silica gel produced from the Mammoth
Lakes geothermal fluid. The gel is made
up of a network of 10nm silica colloids
(Bourcier, 2008).
To accurately predict when an injected geothermal
fluid will set up and turn to gel, a quantitative
understanding of the kinetics of silica gelation is
required. Although silica gelation has been studied
for decades, even the most comprehensive resources
(Iler, 1979; Bergna and Roberts, 2006) provide only a
qualitative understanding of the various factors (pH,
salt concentration, temperature, colloid diameter,
SiO2 concentration, etc.) that influence gelation
times. Furthermore, much of the research on
colloidal silica has been performed by the oil and gas
and other industries (e.g., Jurinak and Summers,
1991; Vossoughi, 1999), and is therefore mostly
proprietary. We did not find any quantitative method
or model for predicting gel times from colloidal silica
compositions. Such a method is needed to develop
formulations for colloidal silica solutions for given
geothermal applications. In addition, there is very
little information on gel times at elevated
temperatures. Because of these needs, we began an
effort to acquire additional data that could be
combined with the existing data to develop a more
comprehensive quantitative model for use in our
geothermal application.
METHODS
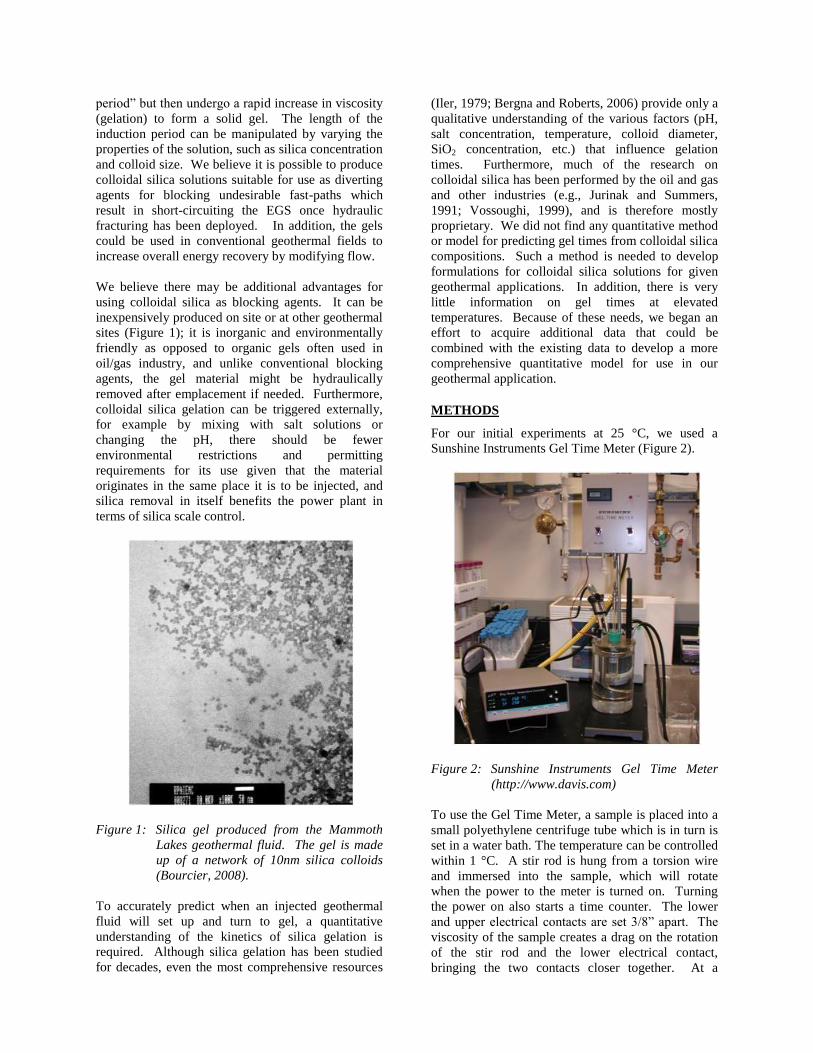
For our initial experiments at 25 °C, we used a
Sunshine Instruments Gel Time Meter (Figure 2).
Figure 2: Sunshine Instruments Gel Time Meter
(http://www.davis.com)
To use the Gel Time Meter, a sample is placed into a
small polyethylene centrifuge tube which is in turn is
set in a water bath. The temperature can be controlled
within 1 °C. A stir rod is hung from a torsion wire
and immersed into the sample, which will rotate
when the power to the meter is turned on. Turning
the power on also starts a time counter. The lower
and upper electrical contacts are set 3/8” apart. The
viscosity of the sample creates a drag on the rotation
of the stir rod and the lower electrical contact,
bringing the two contacts closer together. At a
certain threshold viscosity, the electrical contacts
touch and the meter and counter shut off, recording
the number of seconds between turning the meter on
and reaching the threshold viscosity. This provides
an accurate report of the gelation time of aqueous
silica sols. The water bath can be used to bring the
samples above ambient temperature, but because the
stir rod must be lowered into the sample for the
duration of the test, the water in the sample may
escape due to evaporation or boiling.
The second instrument used in our experiments is a
PVS rheometer from Brookfield Engineering, for
experiments at elevated conditions (Figure 3). The
PVS rheometer has an enclosed sample chamber,
preventing sample boil-off. It can be operated up to
~200 °C and 1000 psi, and can provide an accurate,
quantitative measure of sample viscosity as a
function of time and/or shear rate, by measuring the
torque exerted on an inner cylinder inside the sample
chamber. The gel time meter provided only the time
to gel formation and no viscosity vs. time data. The
instrument enables measurement of both simple
gelation times as well as non-Newtonian behavior,
e.g., thixotropy, of colloidal silica sols and gels.
Figure 3: PVS Rheometer from Brookfield
Engineering
(http://www.brookfieldengineering.com)
RESULTS AND DISCUSSION
25 °C Model (Gel Time Meter)
The gel time meter was used to quantitatively
determine the effects of SiO2 concentration, pH, and
salt concentration on the gelation time of colloidal
silica sols made with commercially available
LUDOX SM-30 at 25 °C, to provide a foundation for
experiments at higher temperature. The major
finding of this investigation is that there is a simple
and clear relationship between gelation time and SiO2
concentration. Previous investigations varied SiO2
concentration while keeping pH and NaCl
concentration constant. However, if the dilution is
done by adding different amounts of water to
identical mixtures of colloidal silica sol, NaCl, and
HCl, a linear relationship arises between the
logarithm of gelation time and the logarithm of the
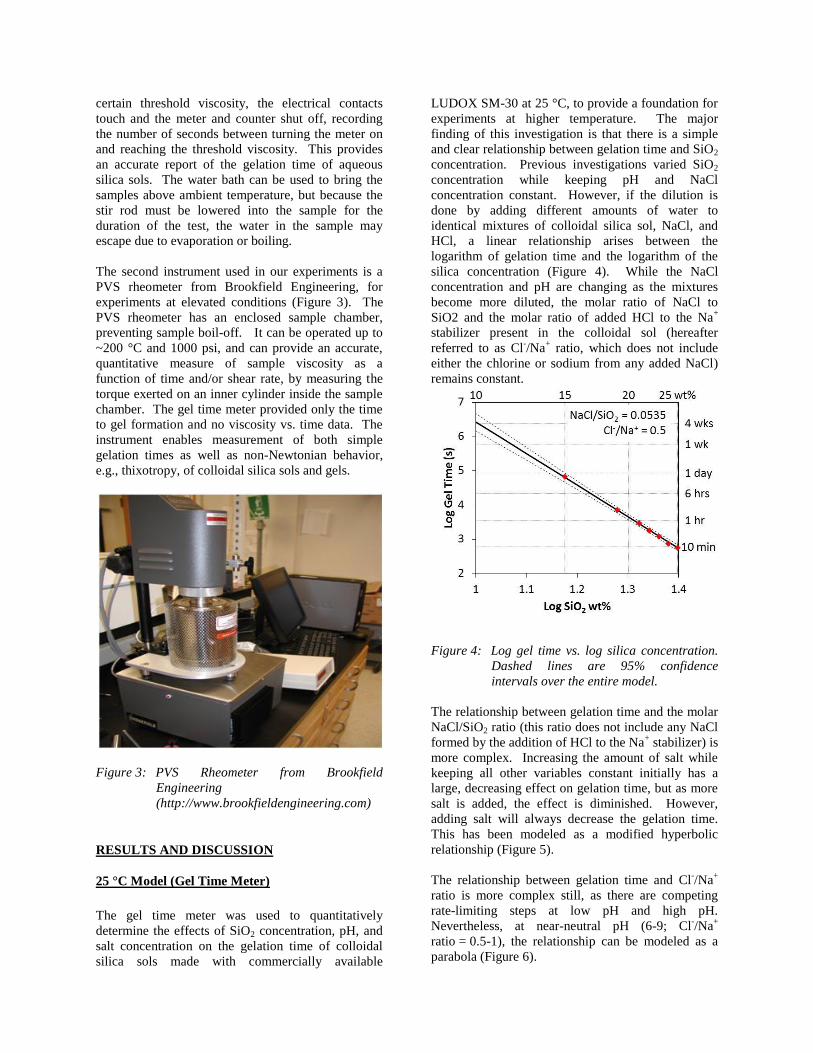
silica concentration (Figure 4). While the NaCl
concentration and pH are changing as the mixtures
become more diluted, the molar ratio of NaCl to
SiO2 and the molar ratio of added HCl to the Na+
stabilizer present in the colloidal sol (hereafter
referred to as Cl-/Na
+ ratio, which does not include
either the chlorine or sodium from any added NaCl)
remains constant.
Figure 4: Log gel time vs. log silica concentration.
Dashed lines are 95% confidence
intervals over the entire model.
The relationship between gelation time and the molar
NaCl/SiO2 ratio (this ratio does not include any NaCl
formed by the addition of HCl to the Na+ stabilizer) is
more complex. Increasing the amount of salt while
keeping all other variables constant initially has a
large, decreasing effect on gelation time, but as more
salt is added, the effect is diminished. However,
adding salt will always decrease the gelation time.
This has been modeled as a modified hyperbolic
relationship (Figure 5).
The relationship between gelation time and Cl-/Na
+
ratio is more complex still, as there are competing
rate-limiting steps at low pH and high pH.
Nevertheless, at near-neutral pH (6-9; Cl-/Na
+
ratio = 0.5-1), the relationship can be modeled as a
parabola (Figure 6).
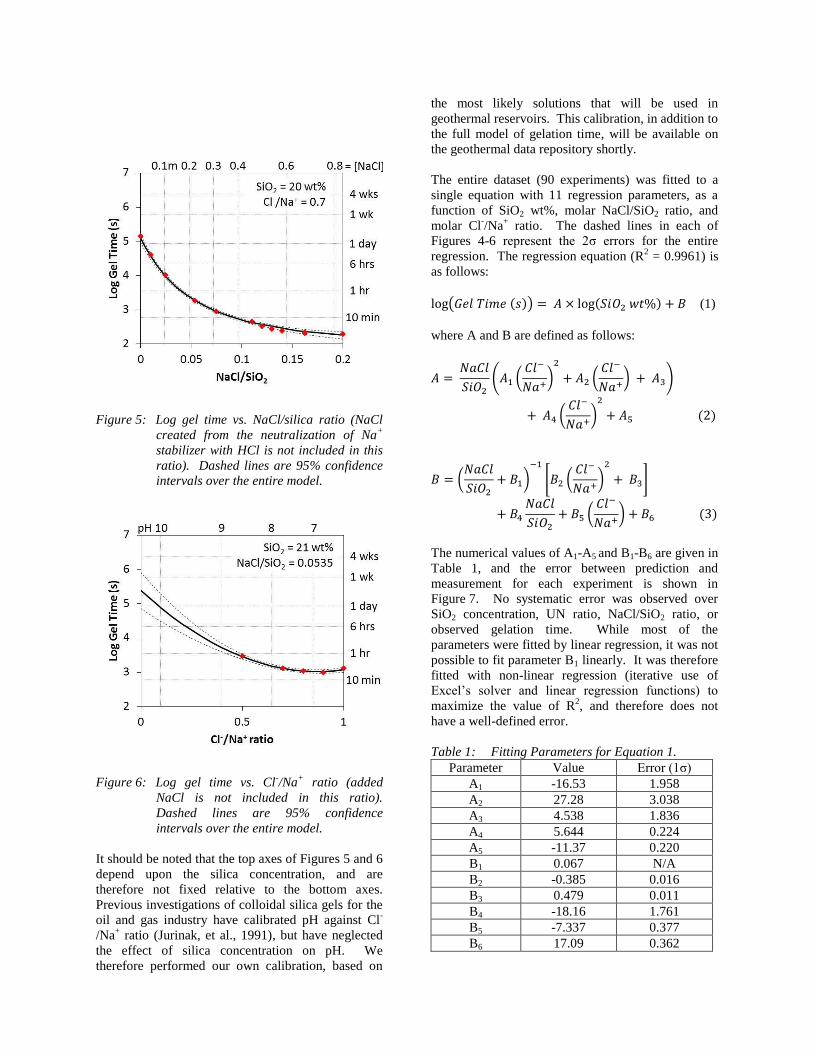
Figure 5: Log gel time vs. NaCl/silica ratio (NaCl
created from the neutralization of Na+
stabilizer with HCl is not included in this
ratio). Dashed lines are 95% confidence
intervals over the entire model.
Figure 6: Log gel time vs. Cl-/Na
+ ratio (added
NaCl is not included in this ratio).
Dashed lines are 95% confidence
intervals over the entire model.
It should be noted that the top axes of Figures 5 and 6
depend upon the silica concentration, and are
therefore not fixed relative to the bottom axes.
Previous investigations of colloidal silica gels for the
oil and gas industry have calibrated pH against Cl-
/Na+ ratio (Jurinak, et al., 1991), but have neglected
the effect of silica concentration on pH. We
therefore performed our own calibration, based on
the most likely solutions that will be used in
geothermal reservoirs. This calibration, in addition to
the full model of gelation time, will be available on
the geothermal data repository shortly.
The entire dataset (90 experiments) was fitted to a
single equation with 11 regression parameters, as a
function of SiO2 wt%, molar NaCl/SiO2 ratio, and
molar Cl-/Na
+ ratio. The dashed lines in each of
Figures 4-6 represent the 2σ errors for the entire
regression. The regression equation (R2 = 0.9961) is
as follows:
( ( )) ( ) (1)
where A and B are defined as follows:
( (
)
(
) )
(
)
( )
(
)
* (
)
+
(
) ( )
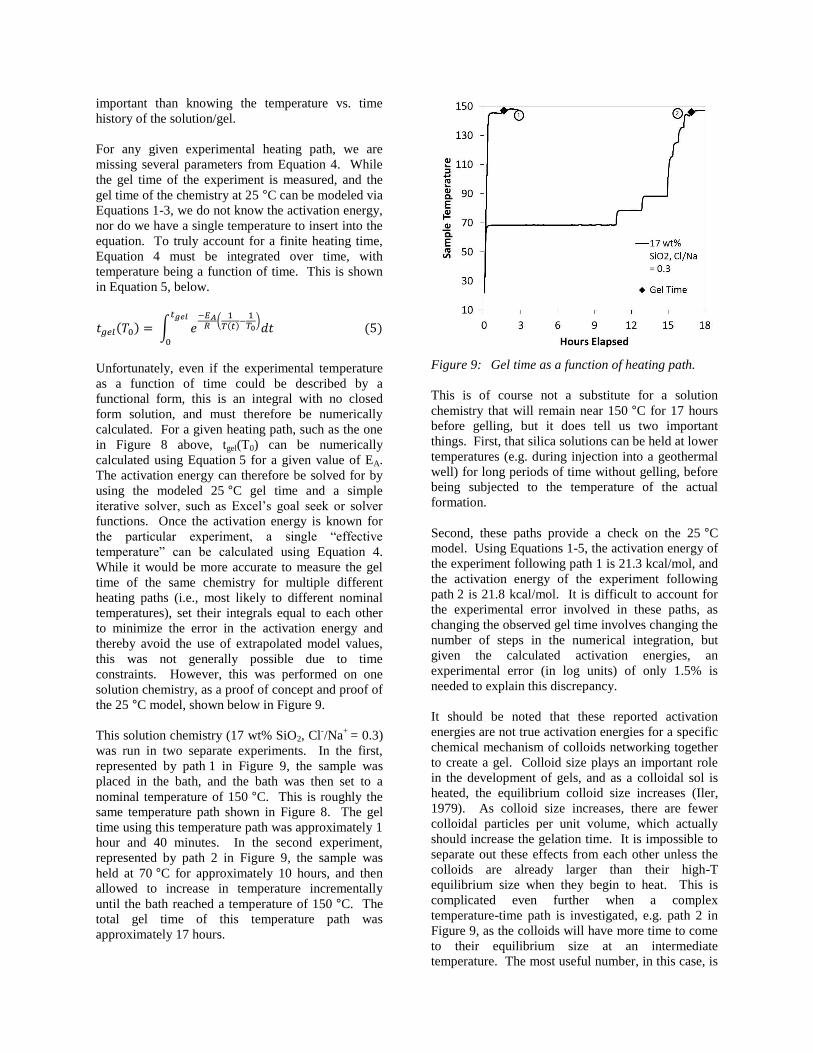
The numerical values of A1-A5 and B1-B6 are given in
Table 1, and the error between prediction and
measurement for each experiment is shown in
Figure 7. No systematic error was observed over
SiO2 concentration, UN ratio, NaCl/SiO2 ratio, or
observed gelation time. While most of the
parameters were fitted by linear regression, it was not
possible to fit parameter B1 linearly. It was therefore
fitted with non-linear regression (iterative use of
Excel’s solver and linear regression functions) to
maximize the value of R2, and therefore does not
have a well-defined error.
Table 1: Fitting Parameters for Equation 1.
Parameter Value Error (1σ)
A1 -16.53 1.958
A2 27.28 3.038
A3 4.538 1.836
A4 5.644 0.224
A5 -11.37 0.220
B1 0.067 N/A
B2 -0.385 0.016
B3 0.479 0.011
B4 -18.16 1.761
B5 -7.337 0.377
B6 17.09 0.362
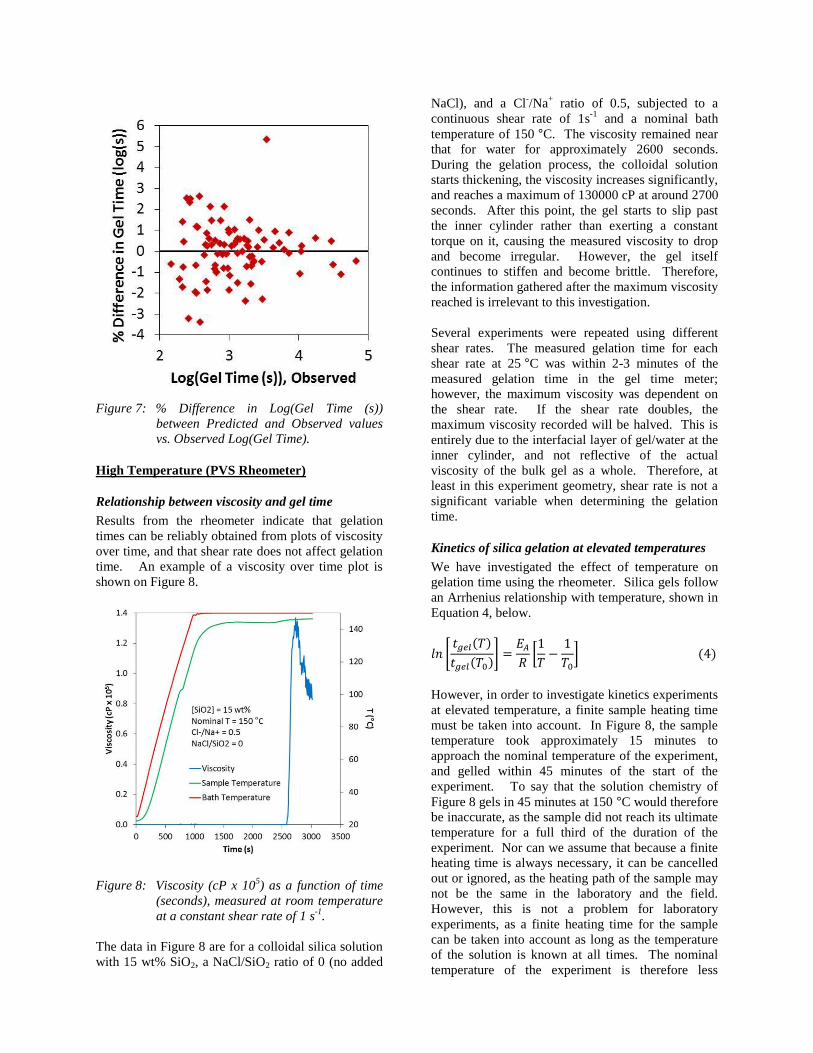
Figure 7: % Difference in Log(Gel Time (s))
between Predicted and Observed values
vs. Observed Log(Gel Time).
High Temperature (PVS Rheometer)
Relationship between viscosity and gel time
Results from the rheometer indicate that gelation
times can be reliably obtained from plots of viscosity
over time, and that shear rate does not affect gelation
time. An example of a viscosity over time plot is
shown on Figure 8.
Figure 8: Viscosity (cP x 105) as a function of time
(seconds), measured at room temperature
at a constant shear rate of 1 s-1
.
The data in Figure 8 are for a colloidal silica solution
with 15 wt% SiO2, a NaCl/SiO2 ratio of 0 (no added
NaCl), and a Cl-/Na
+ ratio of 0.5, subjected to a
continuous shear rate of 1s-1
and a nominal bath
temperature of 150 °C. The viscosity remained near
that for water for approximately 2600 seconds.
During the gelation process, the colloidal solution
starts thickening, the viscosity increases significantly,
and reaches a maximum of 130000 cP at around 2700
seconds. After this point, the gel starts to slip past
the inner cylinder rather than exerting a constant
torque on it, causing the measured viscosity to drop
and become irregular. However, the gel itself
continues to stiffen and become brittle. Therefore,
the information gathered after the maximum viscosity
reached is irrelevant to this investigation.
Several experiments were repeated using different
shear rates. The measured gelation time for each
shear rate at 25 °C was within 2-3 minutes of the
measured gelation time in the gel time meter;
however, the maximum viscosity was dependent on
the shear rate. If the shear rate doubles, the
maximum viscosity recorded will be halved. This is
entirely due to the interfacial layer of gel/water at the
inner cylinder, and not reflective of the actual
viscosity of the bulk gel as a whole. Therefore, at
least in this experiment geometry, shear rate is not a
significant variable when determining the gelation
time.
Kinetics of silica gelation at elevated temperatures
We have investigated the effect of temperature on
gelation time using the rheometer. Silica gels follow
an Arrhenius relationship with temperature, shown in
Equation 4, below.
* ( )
( )+
[
] ( )
However, in order to investigate kinetics experiments
at elevated temperature, a finite sample heating time
must be taken into account. In Figure 8, the sample
temperature took approximately 15 minutes to
approach the nominal temperature of the experiment,
and gelled within 45 minutes of the start of the
experiment. To say that the solution chemistry of
Figure 8 gels in 45 minutes at 150 °C would therefore
be inaccurate, as the sample did not reach its ultimate
temperature for a full third of the duration of the
experiment. Nor can we assume that because a finite
heating time is always necessary, it can be cancelled
out or ignored, as the heating path of the sample may
not be the same in the laboratory and the field.
However, this is not a problem for laboratory
experiments, as a finite heating time for the sample
can be taken into account as long as the temperature
of the solution is known at all times. The nominal
temperature of the experiment is therefore less
important than knowing the temperature vs. time
history of the solution/gel.
For any given experimental heating path, we are
missing several parameters from Equation 4. While
the gel time of the experiment is measured, and the
gel time of the chemistry at 25 °C can be modeled via
Equations 1-3, we do not know the activation energy,
nor do we have a single temperature to insert into the
equation. To truly account for a finite heating time,
Equation 4 must be integrated over time, with
temperature being a function of time. This is shown
in Equation 5, below.
( ) ∫ ( ( )
)
( )
Unfortunately, even if the experimental temperature
as a function of time could be described by a
functional form, this is an integral with no closed
form solution, and must therefore be numerically
calculated. For a given heating path, such as the one
in Figure 8 above, tgel(T0) can be numerically
calculated using Equation 5 for a given value of EA.
The activation energy can therefore be solved for by
using the modeled 25 °C gel time and a simple
iterative solver, such as Excel’s goal seek or solver
functions. Once the activation energy is known for
the particular experiment, a single “effective
temperature” can be calculated using Equation 4.
While it would be more accurate to measure the gel
time of the same chemistry for multiple different
heating paths (i.e., most likely to different nominal
temperatures), set their integrals equal to each other
to minimize the error in the activation energy and
thereby avoid the use of extrapolated model values,
this was not generally possible due to time
constraints. However, this was performed on one
solution chemistry, as a proof of concept and proof of
the 25 °C model, shown below in Figure 9.
This solution chemistry (17 wt% SiO2, Cl-/Na
+ = 0.3)
was run in two separate experiments. In the first,
represented by path 1 in Figure 9, the sample was
placed in the bath, and the bath was then set to a
nominal temperature of 150 °C. This is roughly the
same temperature path shown in Figure 8. The gel
time using this temperature path was approximately 1
hour and 40 minutes. In the second experiment,
represented by path 2 in Figure 9, the sample was
held at 70 °C for approximately 10 hours, and then
allowed to increase in temperature incrementally
until the bath reached a temperature of 150 °C. The
total gel time of this temperature path was
approximately 17 hours.
Figure 9: Gel time as a function of heating path.
This is of course not a substitute for a solution
chemistry that will remain near 150 °C for 17 hours
before gelling, but it does tell us two important
things. First, that silica solutions can be held at lower
temperatures (e.g. during injection into a geothermal
well) for long periods of time without gelling, before
being subjected to the temperature of the actual
formation.
Second, these paths provide a check on the 25 °C
model. Using Equations 1-5, the activation energy of
the experiment following path 1 is 21.3 kcal/mol, and
the activation energy of the experiment following
path 2 is 21.8 kcal/mol. It is difficult to account for
the experimental error involved in these paths, as
changing the observed gel time involves changing the
number of steps in the numerical integration, but
given the calculated activation energies, an
experimental error (in log units) of only 1.5% is
needed to explain this discrepancy.
It should be noted that these reported activation
energies are not true activation energies for a specific
chemical mechanism of colloids networking together
to create a gel. Colloid size plays an important role
in the development of gels, and as a colloidal sol is
heated, the equilibrium colloid size increases (Iler,
1979). As colloid size increases, there are fewer
colloidal particles per unit volume, which actually
should increase the gelation time. It is impossible to
separate out these effects from each other unless the
colloids are already larger than their high-T
equilibrium size when they begin to heat. This is
complicated even further when a complex
temperature-time path is investigated, e.g. path 2 in
Figure 9, as the colloids will have more time to come
to their equilibrium size at an intermediate
temperature. The most useful number, in this case, is
the observed activation energy of the overall process,
which is reported here and can be used to predict
gelation times given a starting chemistry and
temperature-time path.
There is no observed effect of pressure on the
gelation time, based on the fact that measurements
conducted below 100 °C, without additional pressure,
and measurements above 100 °C with 600 psi of N2
gas pressure to keep the sample from boiling fell on
the same Arrhenius line within error. Pressure may
have an effect if the density of water deviates
significantly from 1 g/cc, but this is unlikely to occur
in geothermal reservoirs short of boiling, which,
based on early tests above 100 °C without additional
pressure, will significantly affect gelation. If the
water boils, the concentration of silica in the
remaining water will increase significantly, and will
promote immediate local gelation and/or scale
deposition at the water-steam interface.
Thermostability and avoiding precipitation
The work in the PVS rheometer has been limited to
approximately 150-200 °C. It is certainly possible,
however, to create colloidal silica gels at higher
temperatures – Figure 10 shows a 15 wt% SiO2 gel
that was produced in a 300 °C oven, in a Swagelok
capsule to keep water from escaping. These oven
and capsule tests must be manually checked for the
formation of a gel, so gel times cannot be precisely
measured, but can be bracketed.
Figure 10: Gel (right) produced in a 300 °C oven.
Water was prevented from escaping by
sealing the colloidal solution in a
Swagelok capsule (left). The shape of the
gel reflects the internal geometry of the
capsule.
The nominal temperature of the experiment was
300 °C, but it is unclear what the temperature vs.
time history of the gelation process was. It is doubtful
that the actual temperature of gelation was 300 °C,
because this process was completed within ten
minutes.
After twenty minutes in a 300 °C oven, the gel still
retained its solidity, but had turned white. In a gel,
the silica network forms without changing local
density: in other words, the silica particles do not
aggregate and separate themselves from the water. A
white “gel” indicates that the silica is in the process
of aggregating, so that light can scatter off the
regions of higher and lower density. After four
hours, the gel had completely decomposed into a
milky fluid, and over the next several days, the silica
particles grew, separated from the water and settled
down to the bottom of the capsule. This process is
shown in Figure 11.
Figure 11: Above: Gel after 20 minutes at 300 °C.
Below: Gel after 4 hours (left), 18 hours
(center), and 72 hours (right).
This experiment was carried out at 200 °C as well,
where the gel was stable for between 1 and 2 weeks.
This large dependence on temperature implies that
gels will be stable for months to years at even lower
temperatures. The observed thermal stability does
not appear to be dependent on silica concentration, as
gels with 10 and 20 wt% SiO2 also decomposed
within several hours at 300 °C. It is therefore
unlikely that colloidal silica gels will remain intact at
such high temperatures for long periods of time. We
therefore recommend that silica gels be used in low
to medium temperature (<200 °C) geothermal
reservoirs, though the amorphous silica created via
decomposition of silica gel may also reduce fracture
permeability. In that case the gel time serves to
emplace the silica at the desired location. Later
decomposition to crystalline silica would maintain
the reduced fracture permeability as desired.
One issue that arose in the course of our investigation
at high temperature was that in some cases the silica
precipitated on the walls of the sample chamber at the
air/water interface as scale, instead of forming a
continuous gel. While silica scale deposition at the
interface was determined not to preclude the gelation
of the bulk solution at a later time, a transition
between regions of gelation to non-gelation does
exist. Figure 12 shows a standard linear trend of gel
time as a function of silica concentration. At 15 and
15.5 wt% SiO2, a typical brittle gel forms. At 14.5
wt% SiO2, though a well-defined gelation time exists,
a ductile paste is formed instead of a brittle gel,
denoted by the red outline on the data point. This
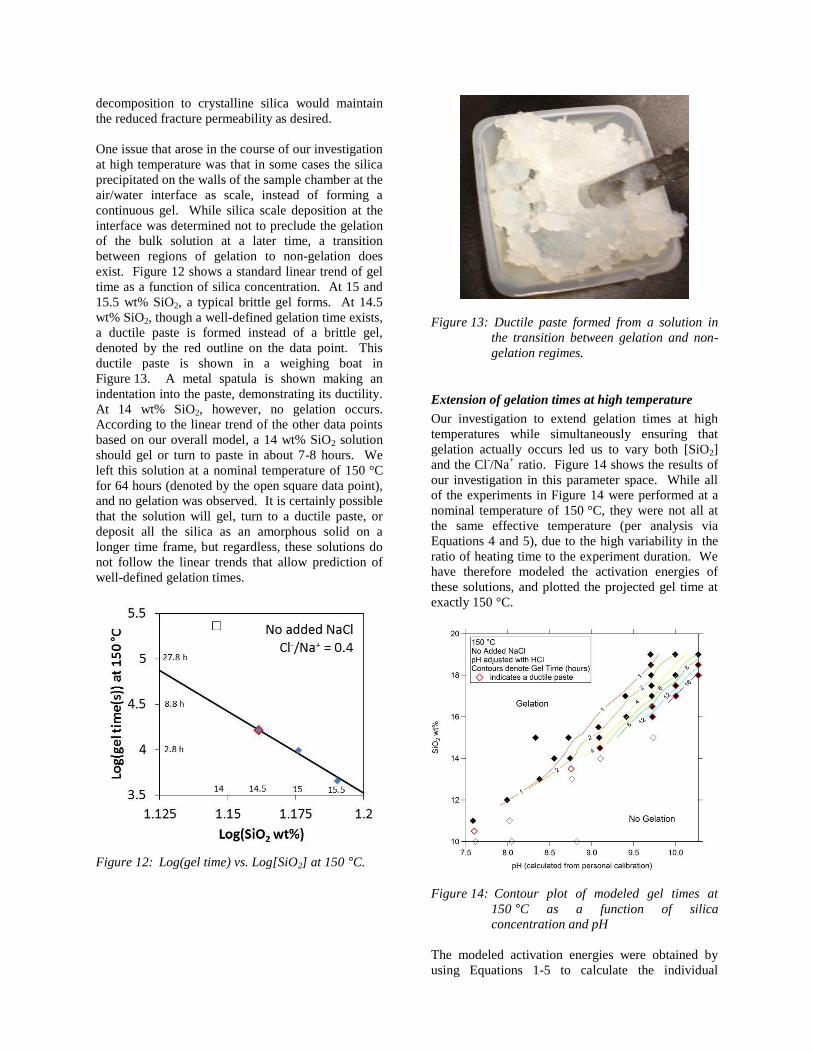
ductile paste is shown in a weighing boat in
Figure 13. A metal spatula is shown making an
indentation into the paste, demonstrating its ductility.
At 14 wt% SiO2, however, no gelation occurs.
According to the linear trend of the other data points
based on our overall model, a 14 wt% SiO2 solution
should gel or turn to paste in about 7-8 hours. We
left this solution at a nominal temperature of 150 °C
for 64 hours (denoted by the open square data point),
and no gelation was observed. It is certainly possible
that the solution will gel, turn to a ductile paste, or
deposit all the silica as an amorphous solid on a
longer time frame, but regardless, these solutions do
not follow the linear trends that allow prediction of
well-defined gelation times.
Figure 12: Log(gel time) vs. Log[SiO2] at 150 °C.
Figure 13: Ductile paste formed from a solution in
the transition between gelation and non-
gelation regimes.
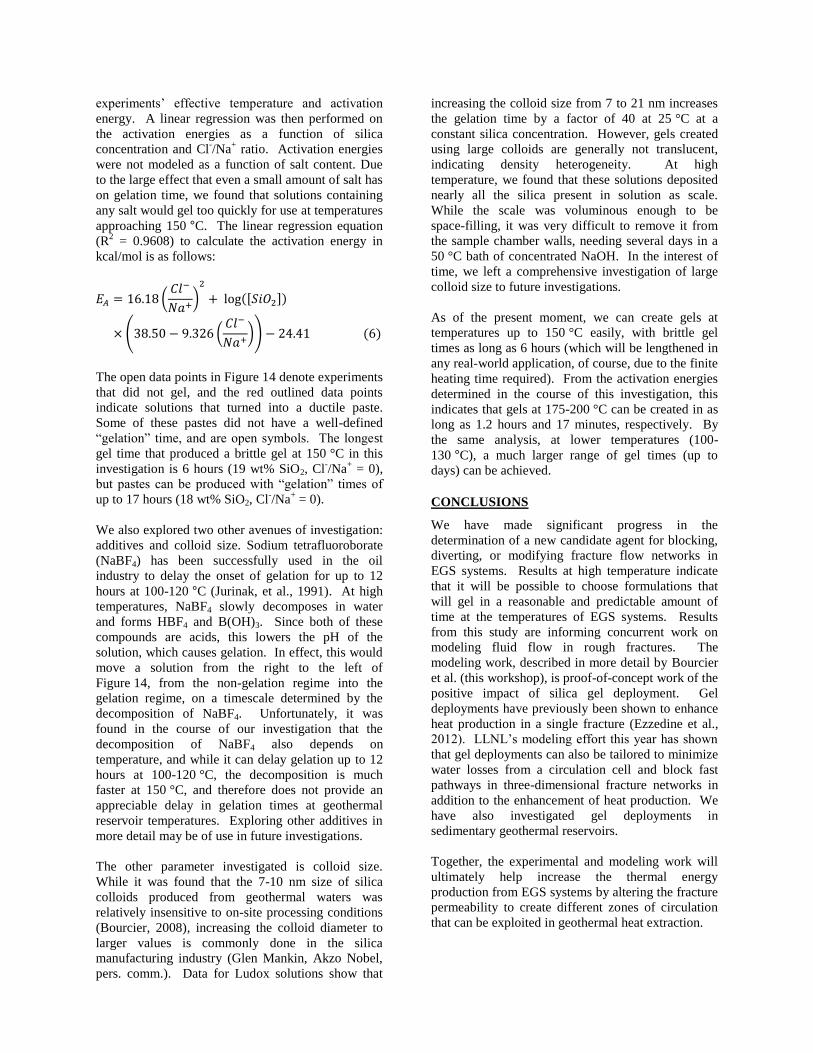
Extension of gelation times at high temperature
Our investigation to extend gelation times at high
temperatures while simultaneously ensuring that
gelation actually occurs led us to vary both [SiO2]
and the Cl-/Na
+ ratio. Figure 14 shows the results of
our investigation in this parameter space. While all
of the experiments in Figure 14 were performed at a
nominal temperature of 150 °C, they were not all at
the same effective temperature (per analysis via
Equations 4 and 5), due to the high variability in the
ratio of heating time to the experiment duration. We
have therefore modeled the activation energies of
these solutions, and plotted the projected gel time at
exactly 150 °C.
Figure 14: Contour plot of modeled gel times at
150 °C as a function of silica
concentration and pH
The modeled activation energies were obtained by
using Equations 1-5 to calculate the individual
experiments’ effective temperature and activation
energy. A linear regression was then performed on
the activation energies as a function of silica
concentration and Cl-/Na
+ ratio. Activation energies
were not modeled as a function of salt content. Due
to the large effect that even a small amount of salt has
on gelation time, we found that solutions containing
any salt would gel too quickly for use at temperatures
approaching 150 °C. The linear regression equation
(R2 = 0.9608) to calculate the activation energy in
kcal/mol is as follows:
(
)
([ ])
( (
)) ( )
The open data points in Figure 14 denote experiments
that did not gel, and the red outlined data points
indicate solutions that turned into a ductile paste.
Some of these pastes did not have a well-defined
“gelation” time, and are open symbols. The longest
gel time that produced a brittle gel at 150 °C in this
investigation is 6 hours (19 wt% SiO2, Cl-/Na
+ = 0),
but pastes can be produced with “gelation” times of
up to 17 hours (18 wt% SiO2, Cl-/Na
+ = 0).
We also explored two other avenues of investigation:
additives and colloid size. Sodium tetrafluoroborate
(NaBF4) has been successfully used in the oil
industry to delay the onset of gelation for up to 12
hours at 100-120 °C (Jurinak, et al., 1991). At high
temperatures, NaBF4 slowly decomposes in water
and forms HBF4 and B(OH)3. Since both of these
compounds are acids, this lowers the pH of the
solution, which causes gelation. In effect, this would
move a solution from the right to the left of
Figure 14, from the non-gelation regime into the
gelation regime, on a timescale determined by the
decomposition of NaBF4. Unfortunately, it was
found in the course of our investigation that the
decomposition of NaBF4 also depends on
temperature, and while it can delay gelation up to 12
hours at 100-120 °C, the decomposition is much
faster at 150 °C, and therefore does not provide an
appreciable delay in gelation times at geothermal
reservoir temperatures. Exploring other additives in
more detail may be of use in future investigations.
The other parameter investigated is colloid size.
While it was found that the 7-10 nm size of silica
colloids produced from geothermal waters was
relatively insensitive to on-site processing conditions
(Bourcier, 2008), increasing the colloid diameter to
larger values is commonly done in the silica
manufacturing industry (Glen Mankin, Akzo Nobel,
pers. comm.). Data for Ludox solutions show that
increasing the colloid size from 7 to 21 nm increases
the gelation time by a factor of 40 at 25 °C at a
constant silica concentration. However, gels created
using large colloids are generally not translucent,
indicating density heterogeneity. At high
temperature, we found that these solutions deposited
nearly all the silica present in solution as scale.
While the scale was voluminous enough to be
space-filling, it was very difficult to remove it from
the sample chamber walls, needing several days in a
50 °C bath of concentrated NaOH. In the interest of
time, we left a comprehensive investigation of large
colloid size to future investigations.
As of the present moment, we can create gels at
temperatures up to 150 °C easily, with brittle gel
times as long as 6 hours (which will be lengthened in
any real-world application, of course, due to the finite
heating time required). From the activation energies
determined in the course of this investigation, this
indicates that gels at 175-200 °C can be created in as
long as 1.2 hours and 17 minutes, respectively. By
the same analysis, at lower temperatures (100-
130 °C), a much larger range of gel times (up to
days) can be achieved.
CONCLUSIONS
We have made significant progress in the
determination of a new candidate agent for blocking,
diverting, or modifying fracture flow networks in
EGS systems. Results at high temperature indicate
that it will be possible to choose formulations that
will gel in a reasonable and predictable amount of
time at the temperatures of EGS systems. Results
from this study are informing concurrent work on
modeling fluid flow in rough fractures. The
modeling work, described in more detail by Bourcier
et al. (this workshop), is proof-of-concept work of the
positive impact of silica gel deployment. Gel
deployments have previously been shown to enhance
heat production in a single fracture (Ezzedine et al.,
2012). LLNL’s modeling effort this year has shown
that gel deployments can also be tailored to minimize
water losses from a circulation cell and block fast
pathways in three-dimensional fracture networks in
addition to the enhancement of heat production. We
have also investigated gel deployments in
sedimentary geothermal reservoirs.
Together, the experimental and modeling work will
ultimately help increase the thermal energy
production from EGS systems by altering the fracture
permeability to create different zones of circulation
that can be exploited in geothermal heat extraction.
ACKNOWLEDGEMENT
This work was performed under the auspices of the
US Department of Energy by Lawrence Livermore
National Laboratory under Contract DE-AC52-
07NA27344. The authors gratefully acknowledge the
Geothermal Technologies Program of the US
Department of Energy for support of this work under
the Enhanced Geothermal Systems Program.
REFERENCES
Bergna H. E., and Roberts W. O., 2006. Colloidal
Silica Fundamentals and Applications. Taylor and
Francis.
Bourcier, W. L., Bruton, C. J. and Gutierrez, P.
(2008) Pilot-scale Geothermal Silica Recovery at
Mammoth Lakes, California Energy Commission
(CEC) PIER Final Report, Contract PIR-04-003.
Bourcier, W., Ezzedine, S. M., Hunt, J. D., Roberts,
S. K., and Roberts, J., 2013. Maximizing heat
extraction and minimizing water losses in
hydrothermal systems: A numerical investigation.
Stanford, Stanford Geothermal Workshop, February
11-13.
Ezzedine, S. M., Hunt, J. D., Bourcier, W., Roberts,
S. K., and Roberts, J., 2012. Impact of Silica Gel
Deployment on Subsurface Flow and Heat Extraction
from Enhanced Geothermal Systems, Stanford
Geothermal Workshop, Stanford, Feb 2012.
Iler R. K., 1979. The Chemistry of Silica. Wiley.
Jurinak, J. J., and Summers, L. E., 1991. Oilfield
Applications of Colloidal Silica Gel. SPE Production
Engineering, 6, 406-412.
Vossoughi, S., 2000. Profile modification using in
situ gelation technology – a review. Journal of
Petroleum Science and Engineering, 26, 199-209.


![Which salt solution has the greatest concentration? [ ] is a measure of the amount of solute in a given amount of solution Beaker A 3 molecules 100 mL](https://img.pdfslide.net/doc/110x75/551b1c925503462e578b60be/which-salt-solution-has-the-greatest-concentration-is-a-measure-of-the-amount-of-solute-in-a-given-amount-of-solution-beaker-a-3-molecules-100-ml.jpg)