Embed Size (px)
Citation preview
Kink Band Instability in Layered Structures
M. Ahmer Wadee?, G. W. Hunt†, and M. A. Peletier‡
?Department of Civil & Environmental Engineering,
Imperial College of Science, Technology & Medicine, London SW7 2AZ, UK.
Email: [email protected]
†Centre for Nonlinear Mechanics, University of Bath, Bath BA2 7AY, UK.
Email: [email protected]
‡Centrum voor Wiskunde en Informatica, Amsterdam, The Netherlands.
Email: [email protected]
Keywords
(A) Kink Banding; (B) Layered Material; Structures; (C) Energy Methods;Stability and Bifurcation
Abstract
A recent two-dimensional prototype model for the initiation of kink banding in com-pressed layered structures is extended to embrace the two propagation mechanismsof band broadening and band progression. As well as interlayer friction, overburdenpressure and layer bending energy, the characteristics of transverse layer compress-ibility and foundation stiffness are now included. Experiments on constrained layersof paper show good agreement with the predictions of angle of orientation, kinkband width and post-kink load-deflection response obtained from the model.
1 Introduction
Kink banding is a phenomenon seen on a variety of scales across the physicalsciences. It should be considered as a potential failure mode for any layered orfibrous material, held together by external pressure or some form of internal
Preprint submitted to J. Mech. Phys. Solids (Revised) 15 September 2003
“glue”, and subjected to layer-parallel compression. Examples can be foundin the deformation of geological strata (Anderson, 1964; Hobbs et al., 1976;Price & Cosgrove, 1990), wood and fibre composites (Kyriakides et al., 1995;Reid & Peng, 1997; Fleck, 1997; Hull & Clyne, 1996; Byskov et al., 2002;Vogler & Kyriakides, 2001), and internally in wire and fibre ropes (Hobbset al., 2000). There have been many attempts to reproduce kink banding the-oretically, from early mechanical models (Rosen, 1965; Argon, 1972), to moresophisticated formulations coming from both continuum mechanics (Budian-sky, 1983) and numerical perspectives (Vogler et al., 2001). Notable work onlayered structures include the theoretical models of Johnson (1995), and theexperiments of Ghosh (1968).
Perhaps because composite materials have had such a high profile, most for-mulations to date have been aimed at fibrous rather than layered structures.Extra problems are then encountered in the modelling process. First, althoughtwo dimensional models are commonly employed (Budiansky et al., 1998),modelling into the third dimension adds a significant extra component. Itnecessarily involves a mix of fibres and either voids or matrix material, andusually has to be handled by some kind of smeared approximation. Secondly,failure is likely to be governed by plastic shear in the matrix material (Fleck,1997), and this is considerably less easy to measure or control than the com-bination of overburden pressure and friction considered here.
The formulation follows naturally from earlier work (Hunt et al., 2000; Huntet al., 2001), with a shift of emphasis from initial instability to subsequentpropagation. The motivation is found in structural geology, specifically in theformation of kink bands and related chevron folding in compressed sedimentaryrocks, as seen for example in the exposed cliff face at Millook Haven in Corn-wall, just south of Bude. Insight into such mechanisms can be obtained fromlaboratory experiments on layers of paper constrained by transversely-appliedoverburden pressure and compressed in one of the layer-parallel directions in aloading device. The inclusion of transverse compressibility has added a signif-icant new component to the formulation; the suggestion is made for instance,that release of the initial compression caused by the overburden pressure isinstrumental in selecting the orientation of the band across the specimen.
For comparison with experiments, quantitative measures of the coefficient offriction, overburden pressure and compressive load are easy to obtain. Moredifficult is the extra resistance to band formation coming from the stiffness ofthe supporting foundation, but this is usefully inferred from the experimen-tal transverse load response. The bending energy incorporated in the layers isagain difficult to measure; bands form with near-straight limbs and near-sharpcorners, and the curvature of the corner is chosen as a compromise betweenwork done in bending and against overburden pressure. A tailored “corneranalysis”, based on minimizing the energy contribution of this compromise,
2
allows the distributed corner energy to be replaced with an equivalent rota-tional spring. Experimental and theoretical loading curves are then found toagree well over the full loading range.
The paper starts with a description of the loading history of a typical experi-ment, involving both the initial formation and subsequent propagation of kinkbands. This is followed by identification of the significant components of eitherenergy or pseudo-energy (Hunt et al., 2000) that make up the full nonlinearpotential function. The experimental response has two distinct phases, insta-bility and propagation, and each is fully reflected in the nonlinear responsethat follows from the potential energy description. Both kink band rotationand kink band width are included as degrees of freedom, and two differentforms of propagation are thus identified, band broadening and band progres-sion. At the point of instability, there is a sudden appearance of a kink bandof non-zero width, which broadens under increasing load until formation of asecond band, then a third and so on, with progression continuing as new bandsform in zig-zag fashion along the length. The body of the paper is devoted toextensions to the mechanical model, and it closes with comparison betweenthe resulting predictions and a few simple experiments.
2 A typical experiment
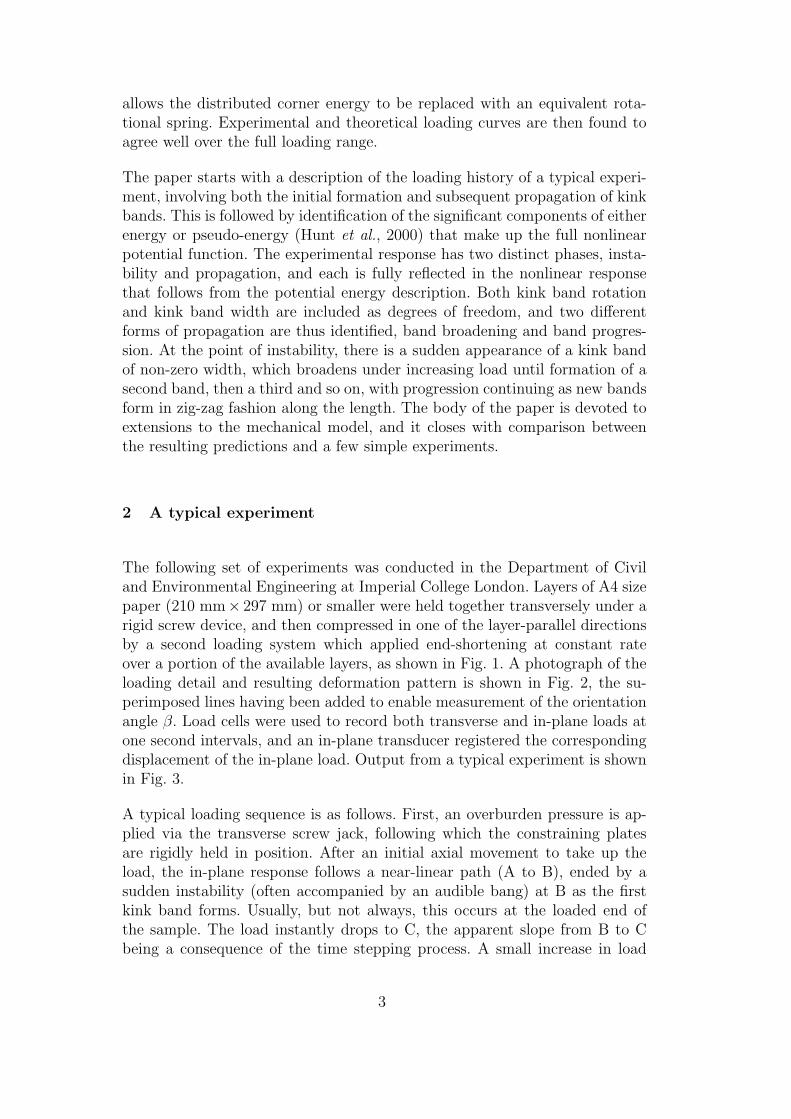
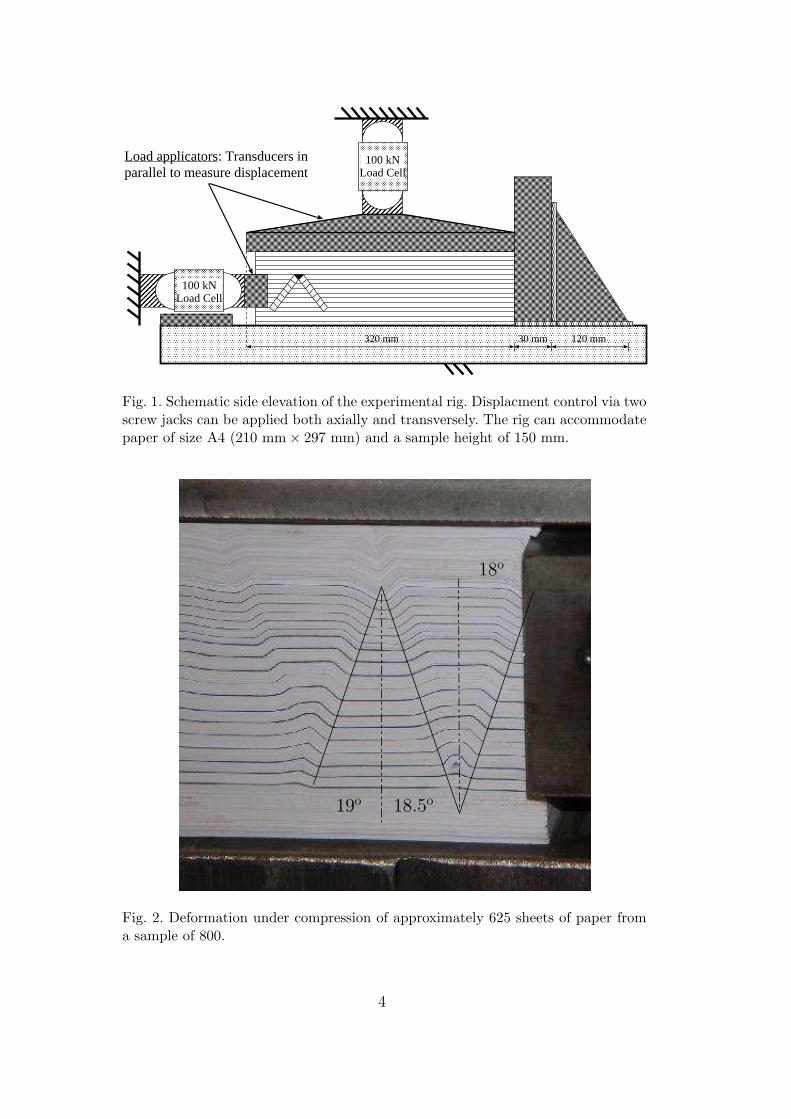
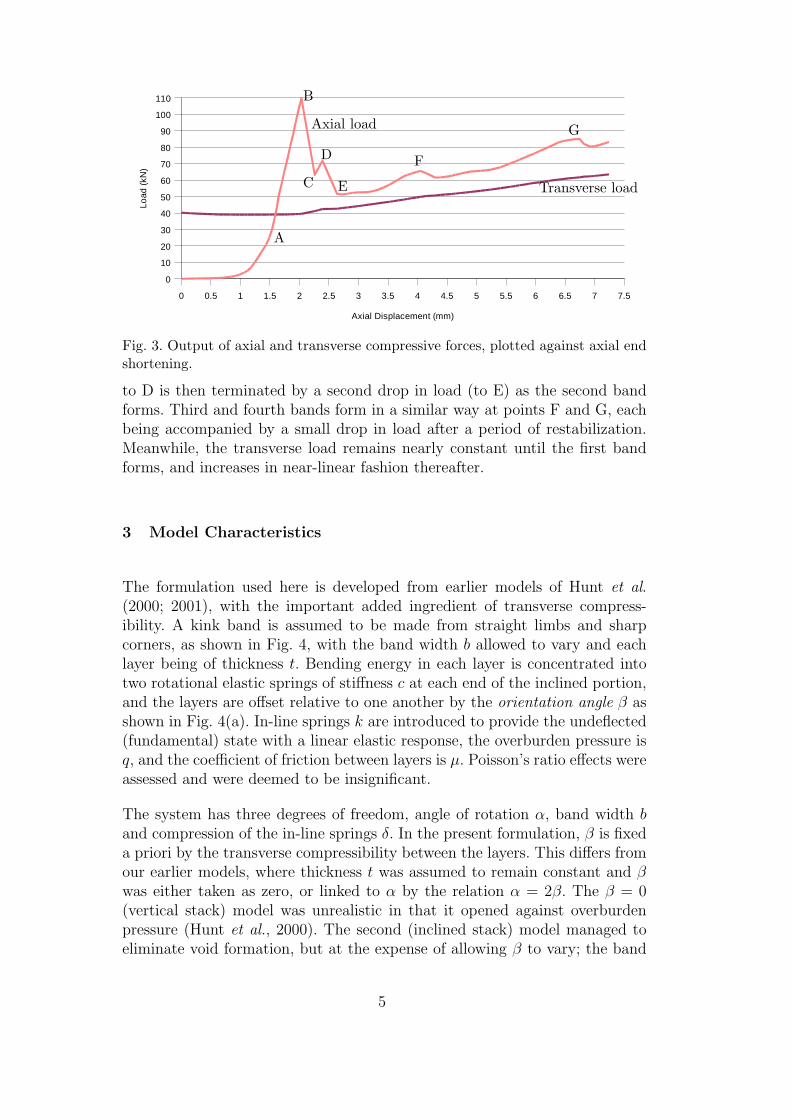
The following set of experiments was conducted in the Department of Civiland Environmental Engineering at Imperial College London. Layers of A4 sizepaper (210 mm× 297 mm) or smaller were held together transversely under arigid screw device, and then compressed in one of the layer-parallel directionsby a second loading system which applied end-shortening at constant rateover a portion of the available layers, as shown in Fig. 1. A photograph of theloading detail and resulting deformation pattern is shown in Fig. 2, the su-perimposed lines having been added to enable measurement of the orientationangle β. Load cells were used to record both transverse and in-plane loads atone second intervals, and an in-plane transducer registered the correspondingdisplacement of the in-plane load. Output from a typical experiment is shownin Fig. 3.
A typical loading sequence is as follows. First, an overburden pressure is ap-plied via the transverse screw jack, following which the constraining platesare rigidly held in position. After an initial axial movement to take up theload, the in-plane response follows a near-linear path (A to B), ended by asudden instability (often accompanied by an audible bang) at B as the firstkink band forms. Usually, but not always, this occurs at the loaded end ofthe sample. The load instantly drops to C, the apparent slope from B to Cbeing a consequence of the time stepping process. A small increase in load
3
120 mm30 mm320 mm
Load applicators: Transducers inparallel to measure displacement
100 kNLoad Cell
100 kNLoad Cell
Fig. 1. Schematic side elevation of the experimental rig. Displacment control via twoscrew jacks can be applied both axially and transversely. The rig can accommodatepaper of size A4 (210 mm × 297 mm) and a sample height of 150 mm.
19o 18.5o
18o
Fig. 2. Deformation under compression of approximately 625 sheets of paper froma sample of 800.
4
0 0.5 1 1.5 2 2.5 3 3.5 4 4.5 5 5.5 6 6.5 7 7.5
0
10
20
30
40
50
60
70
80
90
100
110
Axial Displacement (mm)
Load
(kN
)
A
B
C
D
E
F
GAxial load
Transverse load
Fig. 3. Output of axial and transverse compressive forces, plotted against axial endshortening.
to D is then terminated by a second drop in load (to E) as the second bandforms. Third and fourth bands form in a similar way at points F and G, eachbeing accompanied by a small drop in load after a period of restabilization.Meanwhile, the transverse load remains nearly constant until the first bandforms, and increases in near-linear fashion thereafter.
3 Model Characteristics
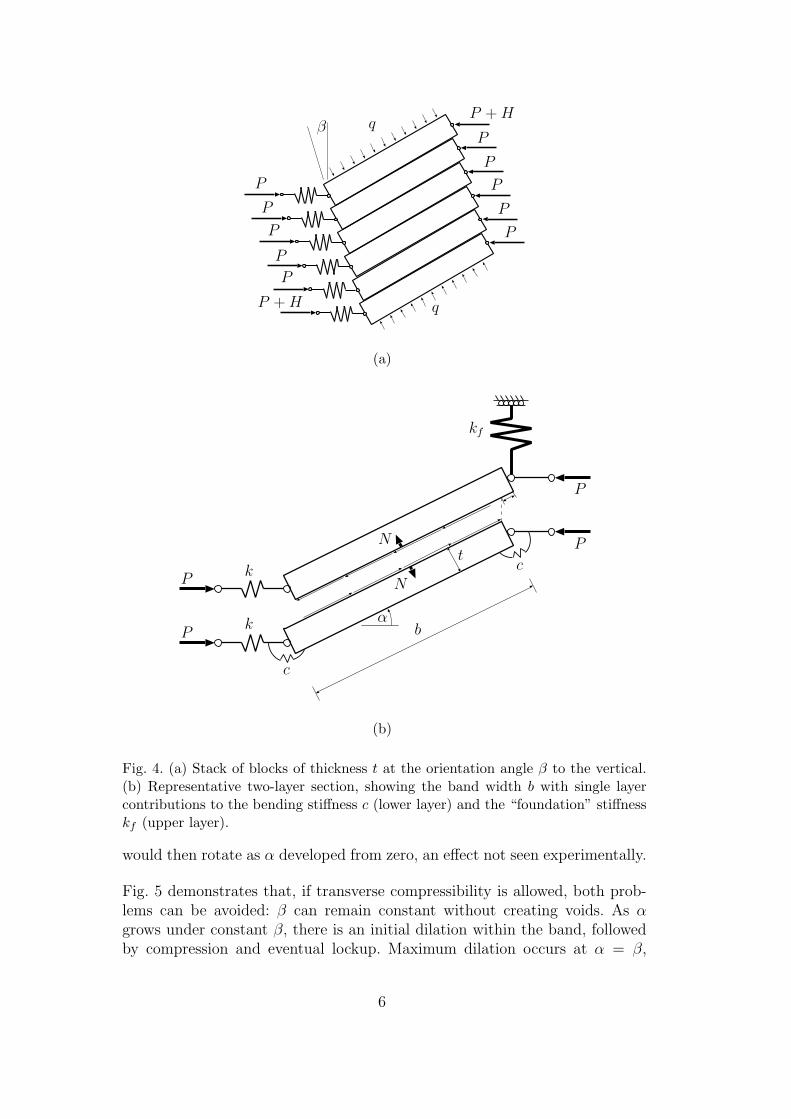
The formulation used here is developed from earlier models of Hunt et al.(2000; 2001), with the important added ingredient of transverse compress-ibility. A kink band is assumed to be made from straight limbs and sharpcorners, as shown in Fig. 4, with the band width b allowed to vary and eachlayer being of thickness t. Bending energy in each layer is concentrated intotwo rotational elastic springs of stiffness c at each end of the inclined portion,and the layers are offset relative to one another by the orientation angle β asshown in Fig. 4(a). In-line springs k are introduced to provide the undeflected(fundamental) state with a linear elastic response, the overburden pressure isq, and the coefficient of friction between layers is µ. Poisson’s ratio effects wereassessed and were deemed to be insignificant.
The system has three degrees of freedom, angle of rotation α, band width band compression of the in-line springs δ. In the present formulation, β is fixeda priori by the transverse compressibility between the layers. This differs fromour earlier models, where thickness t was assumed to remain constant and βwas either taken as zero, or linked to α by the relation α = 2β. The β = 0(vertical stack) model was unrealistic in that it opened against overburdenpressure (Hunt et al., 2000). The second (inclined stack) model managed toeliminate void formation, but at the expense of allowing β to vary; the band
5
P + H
P
P
P
P
P
P
P
P
P
P
P + H
qβ
q
(a)
P
P
P
P
N
N
αk
k
kf
c
c
b
t
(b)
Fig. 4. (a) Stack of blocks of thickness t at the orientation angle β to the vertical.(b) Representative two-layer section, showing the band width b with single layercontributions to the bending stiffness c (lower layer) and the “foundation” stiffnesskf (upper layer).
would then rotate as α developed from zero, an effect not seen experimentally.
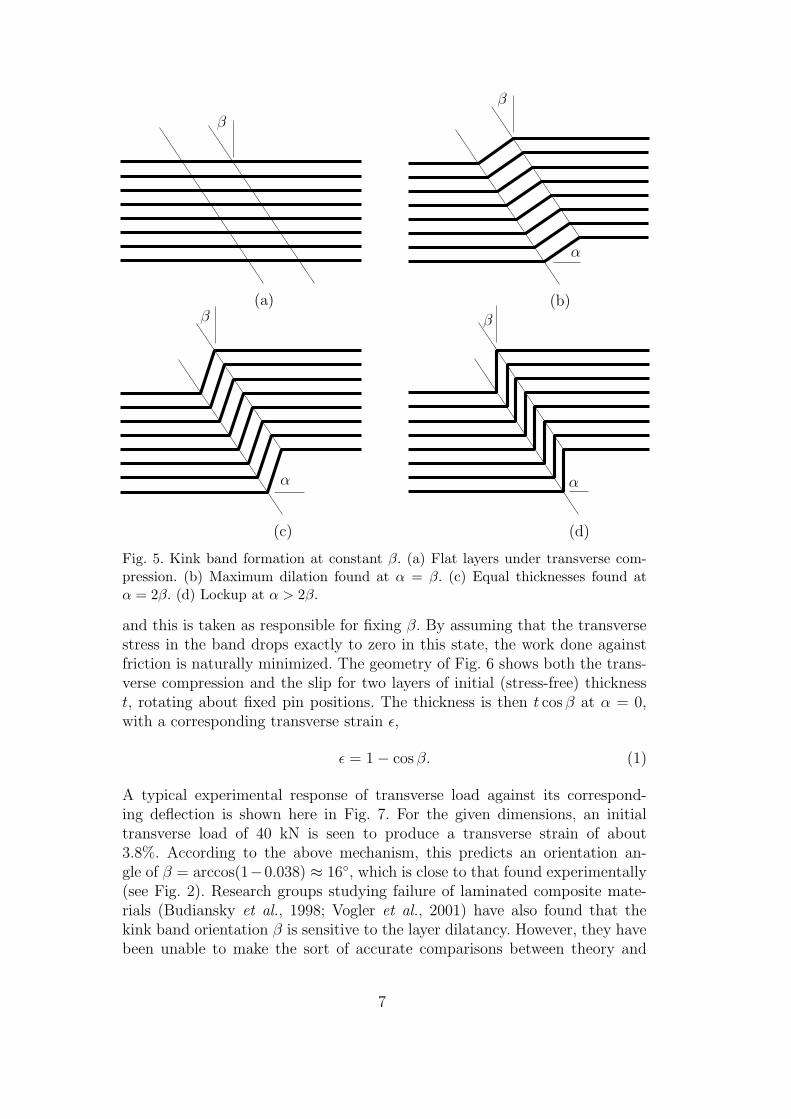
Fig. 5 demonstrates that, if transverse compressibility is allowed, both prob-lems can be avoided: β can remain constant without creating voids. As αgrows under constant β, there is an initial dilation within the band, followedby compression and eventual lockup. Maximum dilation occurs at α = β,
6
β
(a)
β
α
(b)β
α
(c)
α
β
(d)
Fig. 5. Kink band formation at constant β. (a) Flat layers under transverse com-pression. (b) Maximum dilation found at α = β. (c) Equal thicknesses found atα = 2β. (d) Lockup at α > 2β.
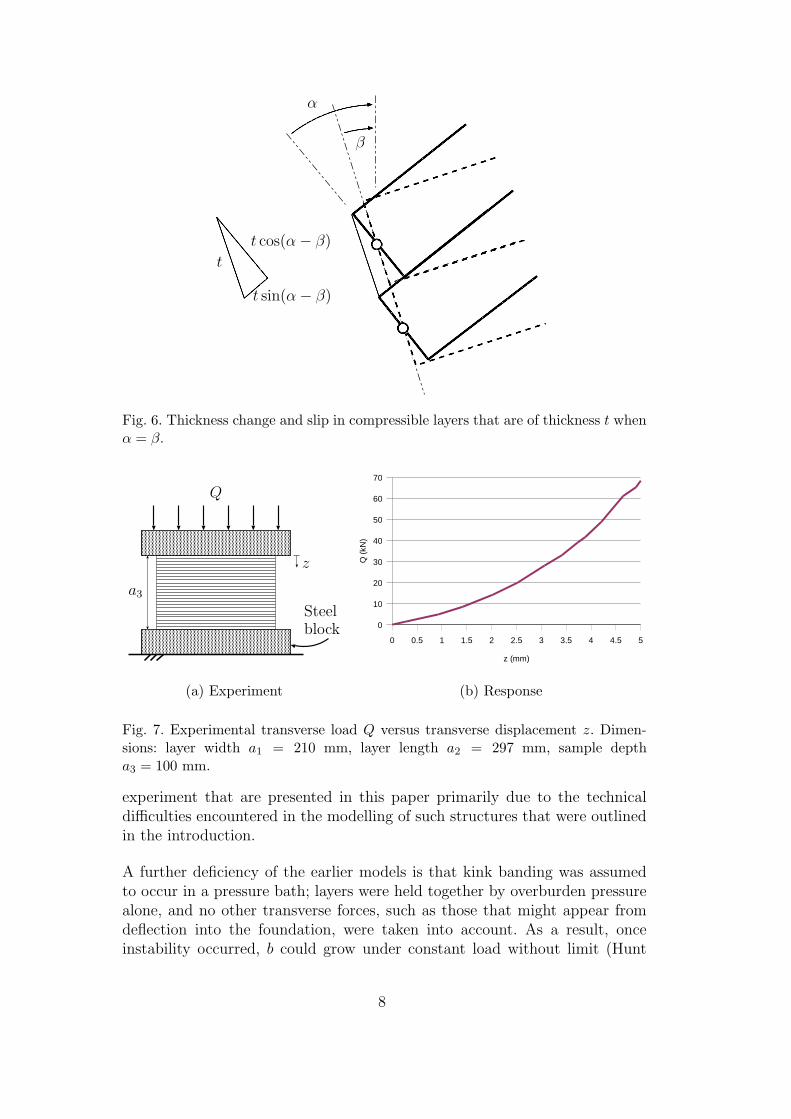
and this is taken as responsible for fixing β. By assuming that the transversestress in the band drops exactly to zero in this state, the work done againstfriction is naturally minimized. The geometry of Fig. 6 shows both the trans-verse compression and the slip for two layers of initial (stress-free) thicknesst, rotating about fixed pin positions. The thickness is then t cos β at α = 0,with a corresponding transverse strain ε,
ε = 1 − cos β. (1)
A typical experimental response of transverse load against its correspond-ing deflection is shown here in Fig. 7. For the given dimensions, an initialtransverse load of 40 kN is seen to produce a transverse strain of about3.8%. According to the above mechanism, this predicts an orientation an-gle of β = arccos(1−0.038) ≈ 16◦, which is close to that found experimentally(see Fig. 2). Research groups studying failure of laminated composite mate-rials (Budiansky et al., 1998; Vogler et al., 2001) have also found that thekink band orientation β is sensitive to the layer dilatancy. However, they havebeen unable to make the sort of accurate comparisons between theory and
7
t
t cos(α − β)
t sin(α − β)
β
α
Fig. 6. Thickness change and slip in compressible layers that are of thickness t whenα = β.
Steelblock
Q
a3
z
(a) Experiment
0 0.5 1 1.5 2 2.5 3 3.5 4 4.5 5
0
10
20
30
40
50
60
70
z (mm)
Q (
kN)
(b) Response
Fig. 7. Experimental transverse load Q versus transverse displacement z. Dimen-sions: layer width a1 = 210 mm, layer length a2 = 297 mm, sample deptha3 = 100 mm.
experiment that are presented in this paper primarily due to the technicaldifficulties encountered in the modelling of such structures that were outlinedin the introduction.
A further deficiency of the earlier models is that kink banding was assumedto occur in a pressure bath; layers were held together by overburden pressurealone, and no other transverse forces, such as those that might appear fromdeflection into the foundation, were taken into account. As a result, onceinstability occurred, b could grow under constant load without limit (Hunt
8

et al., 2001). In the reality of the experiments this growth would be resistedby the bed of layers outside the loaded regime, an effect which appears on thescale of the multi-layered sample, not that of the individual layers. Its influenceon a single layer, represented in Fig. 4(b) by the linear spring of stiffness kf ,is not easy to model from first principles, but can usefully be inferred fromthe experimental response of transverse load against end-shortening seen inFig. 3, as described in §5.3.
4 Total Potential Energy Function
The elements that make up the analytical tool of the total potential energyfunction are next introduced in turn. A similar set of energy contributions alsoappear in a recent two-layer model for the related problem of parallel folding
(Budd et al., 2003). The difference between the formulations lies primarily inthe assumption that all layers involved in kink banding behave identically;in parallel folding they necessarily deform to different curvatures. The gov-erning parameters in the energy contributions are also introduced, but theirexperimental evaluation is covered in §5.
The formulation is taken to be volume-preserving in and around the band, inthe sense that, with no movement of the transverse loading platens, no workis done with or against overburden pressure. This means that an increase inlayer thickness inside the band, as described in the previous section, must beoffset elsewhere by localized thinning. The only overall volume change thenrelates to the in-plane shortening of the springs k, which is necessary so thatthe system can store energy in the fundamental state.
4.1 Work done against friction
The earlier models assumed that the layers remain of constant thickness t,and took no account of spring kf . Vertical equilibrium of an incomplete stackof blocks of Fig. 4(a) in the critical slip condition then gave the relation
N =qb
1 − µ tan α, (2)
where N is the compressive force between the layers in the band, and q is theoverburden pressure. Note that N is only positive if α < arccot(µ), giving anatural limit to α where lockup occurs.
With the introduction of dilation in the band, expression (2) must be changed.As described above, we suppose that β is chosen such that N = 0 when α = β.
9
Also, when the layers both in and out of the band are of equal thickness, ie inthe two states α = 0 and α = 2β, we shall assume that expression (2) holds.In between these states N will be assumed to vary linearly with transversestrain. The mechanism of Fig. 6 then suggests that relation (2) should become,
N =qb[1 − cos(α − β)]
(1 − cos β)(1 − µ tan α). (3)
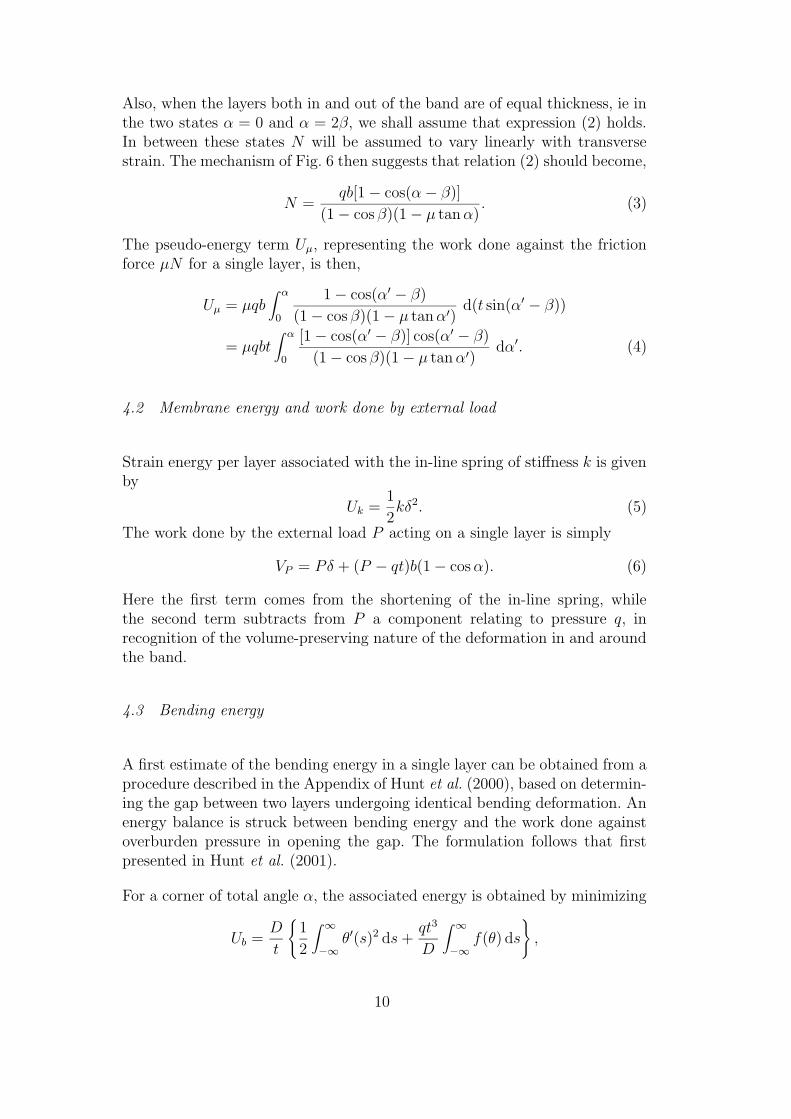
The pseudo-energy term Uµ, representing the work done against the frictionforce µN for a single layer, is then,
Uµ = µqb∫ α
0
1 − cos(α′ − β)
(1 − cos β)(1 − µ tan α′)d(t sin(α′ − β))
= µqbt∫ α
0
[1 − cos(α′ − β)] cos(α′ − β)
(1 − cos β)(1 − µ tan α′)dα′. (4)
4.2 Membrane energy and work done by external load
Strain energy per layer associated with the in-line spring of stiffness k is givenby
Uk =1
2kδ2. (5)
The work done by the external load P acting on a single layer is simply
VP = Pδ + (P − qt)b(1 − cos α). (6)
Here the first term comes from the shortening of the in-line spring, whilethe second term subtracts from P a component relating to pressure q, inrecognition of the volume-preserving nature of the deformation in and aroundthe band.
4.3 Bending energy
A first estimate of the bending energy in a single layer can be obtained from aprocedure described in the Appendix of Hunt et al. (2000), based on determin-ing the gap between two layers undergoing identical bending deformation. Anenergy balance is struck between bending energy and the work done againstoverburden pressure in opening the gap. The formulation follows that firstpresented in Hunt et al. (2001).
For a corner of total angle α, the associated energy is obtained by minimizing
Ub =D
t
{
1
2
∫ ∞
−∞θ′(s)2 ds +
qt3
D
∫ ∞
−∞f(θ) ds
}
,
10
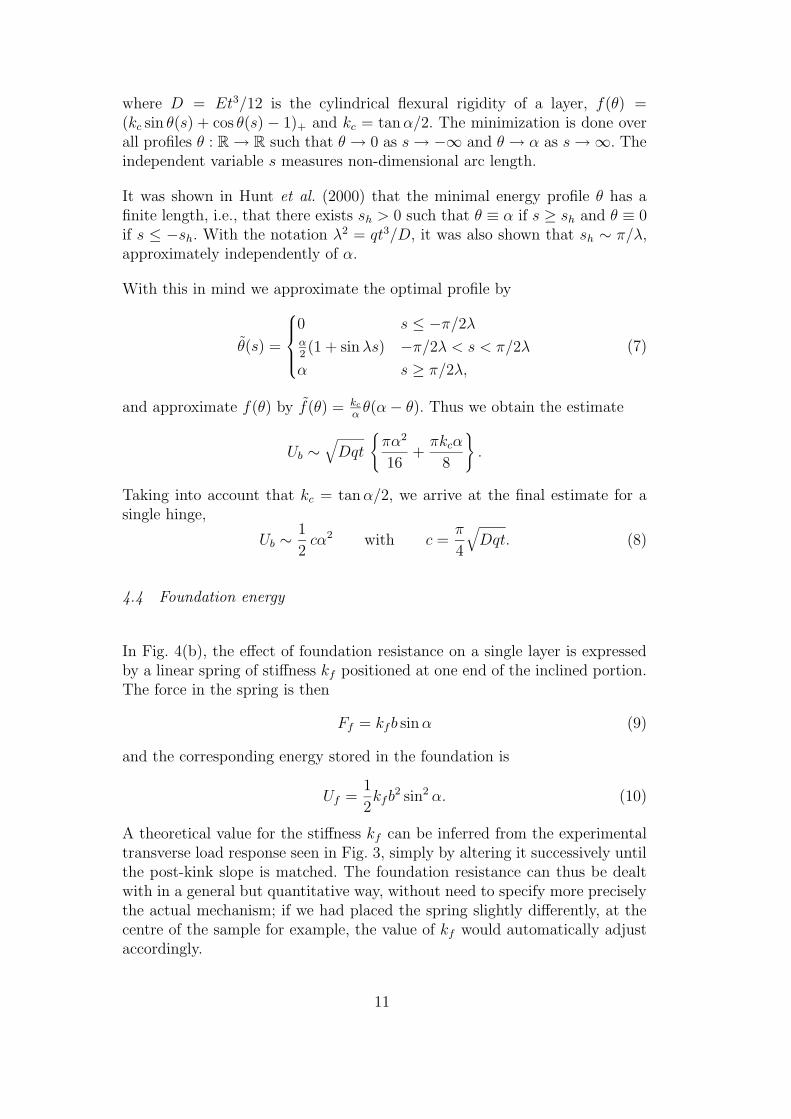
where D = Et3/12 is the cylindrical flexural rigidity of a layer, f(θ) =(kc sin θ(s) + cos θ(s) − 1)+ and kc = tan α/2. The minimization is done overall profiles θ : R → R such that θ → 0 as s → −∞ and θ → α as s → ∞. Theindependent variable s measures non-dimensional arc length.
It was shown in Hunt et al. (2000) that the minimal energy profile θ has afinite length, i.e., that there exists sh > 0 such that θ ≡ α if s ≥ sh and θ ≡ 0if s ≤ −sh. With the notation λ2 = qt3/D, it was also shown that sh ∼ π/λ,approximately independently of α.
With this in mind we approximate the optimal profile by
θ(s) =
0 s ≤ −π/2λα2(1 + sin λs) −π/2λ < s < π/2λ
α s ≥ π/2λ,
(7)
and approximate f(θ) by f(θ) = kc
αθ(α − θ). Thus we obtain the estimate
Ub ∼√
Dqt
{
πα2
16+
πkcα
8
}
.
Taking into account that kc = tan α/2, we arrive at the final estimate for asingle hinge,
Ub ∼1
2cα2 with c =
π
4
√
Dqt. (8)
4.4 Foundation energy
In Fig. 4(b), the effect of foundation resistance on a single layer is expressedby a linear spring of stiffness kf positioned at one end of the inclined portion.The force in the spring is then
Ff = kfb sin α (9)
and the corresponding energy stored in the foundation is
Uf =1
2kfb
2 sin2 α. (10)
A theoretical value for the stiffness kf can be inferred from the experimentaltransverse load response seen in Fig. 3, simply by altering it successively untilthe post-kink slope is matched. The foundation resistance can thus be dealtwith in a general but quantitative way, without need to specify more preciselythe actual mechanism; if we had placed the spring slightly differently, at thecentre of the sample for example, the value of kf would automatically adjustaccordingly.
11
4.5 Nondimensionalized potential function
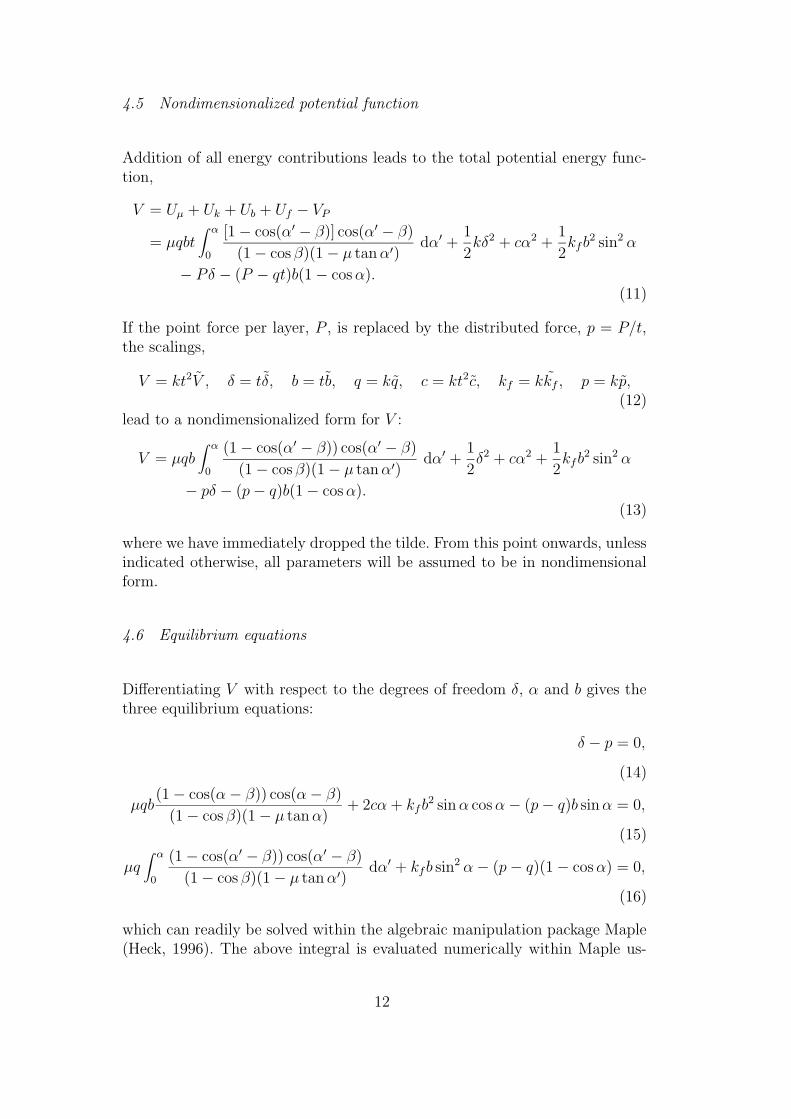
Addition of all energy contributions leads to the total potential energy func-tion,
V = Uµ + Uk + Ub + Uf − VP
= µqbt∫ α
0
[1 − cos(α′ − β)] cos(α′ − β)
(1 − cos β)(1 − µ tan α′)dα′ +
1
2kδ2 + cα2 +
1
2kfb
2 sin2 α
− Pδ − (P − qt)b(1 − cos α).(11)
If the point force per layer, P , is replaced by the distributed force, p = P/t,the scalings,
V = kt2V , δ = tδ, b = tb, q = kq, c = kt2c, kf = kkf , p = kp,(12)
lead to a nondimensionalized form for V :
V = µqb∫ α
0
(1 − cos(α′ − β)) cos(α′ − β)
(1 − cos β)(1 − µ tan α′)dα′ +
1
2δ2 + cα2 +
1
2kfb
2 sin2 α
− pδ − (p − q)b(1 − cos α).(13)
where we have immediately dropped the tilde. From this point onwards, unlessindicated otherwise, all parameters will be assumed to be in nondimensionalform.
4.6 Equilibrium equations
Differentiating V with respect to the degrees of freedom δ, α and b gives thethree equilibrium equations:
δ − p = 0,
(14)
µqb(1 − cos(α − β)) cos(α − β)
(1 − cos β)(1 − µ tan α)+ 2cα + kfb
2 sin α cos α − (p − q)b sin α = 0,
(15)
µq∫ α
0
(1 − cos(α′ − β)) cos(α′ − β)
(1 − cos β)(1 − µ tan α′)dα′ + kfb sin2 α − (p − q)(1 − cos α) = 0,
(16)
which can readily be solved within the algebraic manipulation package Maple(Heck, 1996). The above integral is evaluated numerically within Maple us-
12
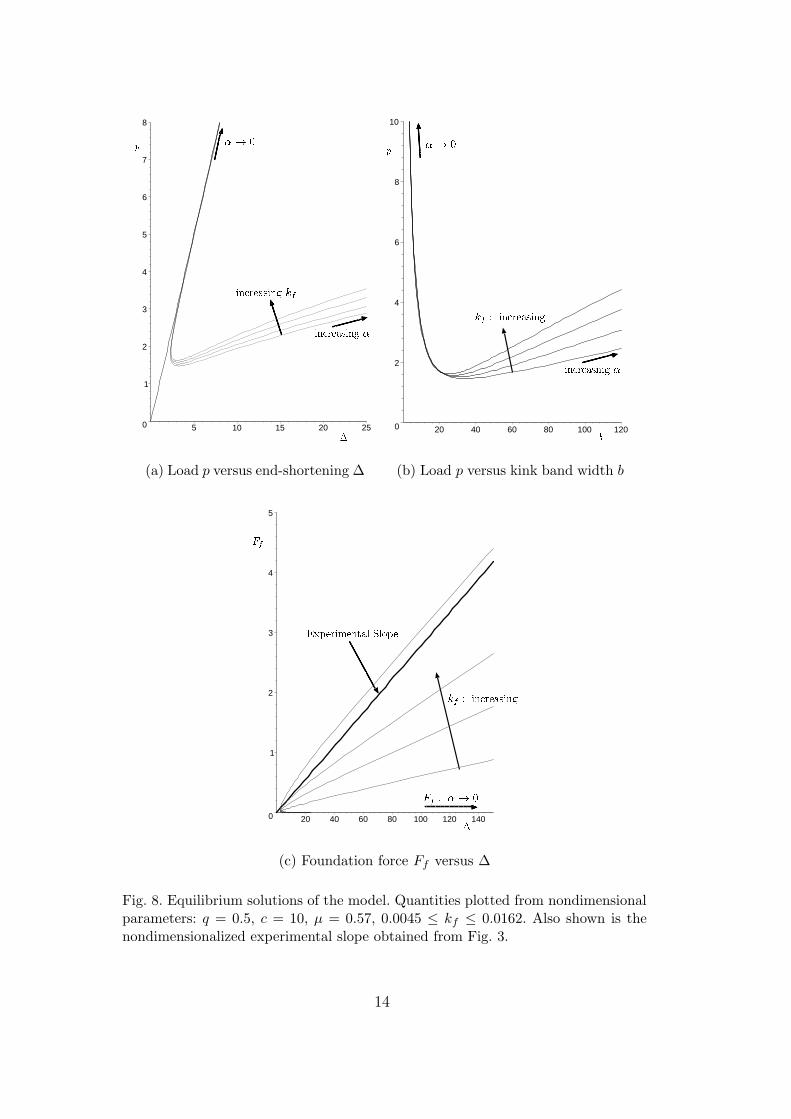
ing the Clenshaw–Curtis quadrature method. Fig. 8 shows some results fromthis computation, on plots of nondimensionalized axial load p and foundationspring force Ff against nondimensionalized total end shortening ∆, where:
∆ = δ + b(1 − cos α). (17)
Also plotted is the relationship between p and the nondimensional band widthb. Two separate solutions are obtained, the fundamental or pre-kinked solu-tion, α = 0, p = δ, and the post-kink solution for which α 6= 0. There are somenoteworthy points that are appropriate here:
(1) As α → 0 the post-kink equilibrium path only converges to the funda-mental path asymptotically implying that any linear eigenvalue analysisyields an infinite critical load (Hunt et al., 2000).
(2) The coefficient of friction µ determines the limiting value of α calculatedfrom eq. (2) where
α → αl = arccot µ. (18)
(3) If kf = 0 the axial load p tends to a constant as b increases indefinitely, asdescribed in Hunt et al. (2001) and outlined in §3; if however kf is positive,a restabilizing (positive) post-kink stiffness results and the growth in b isthen limited by the appearance, under increasing load, of the next bandto form.
5 Comparison with Experiments
A set of four experimental results from the rig of Fig. 1 is given in Table 1.Here Experiment 1 is that of Fig. 2, with the response shown in Fig. 3. Paperof grade 80 g/m2 was used in each case. Direct comparison with the modelrequires independent estimates of k,E, q, µ and kf , obtained in the followingmanner.
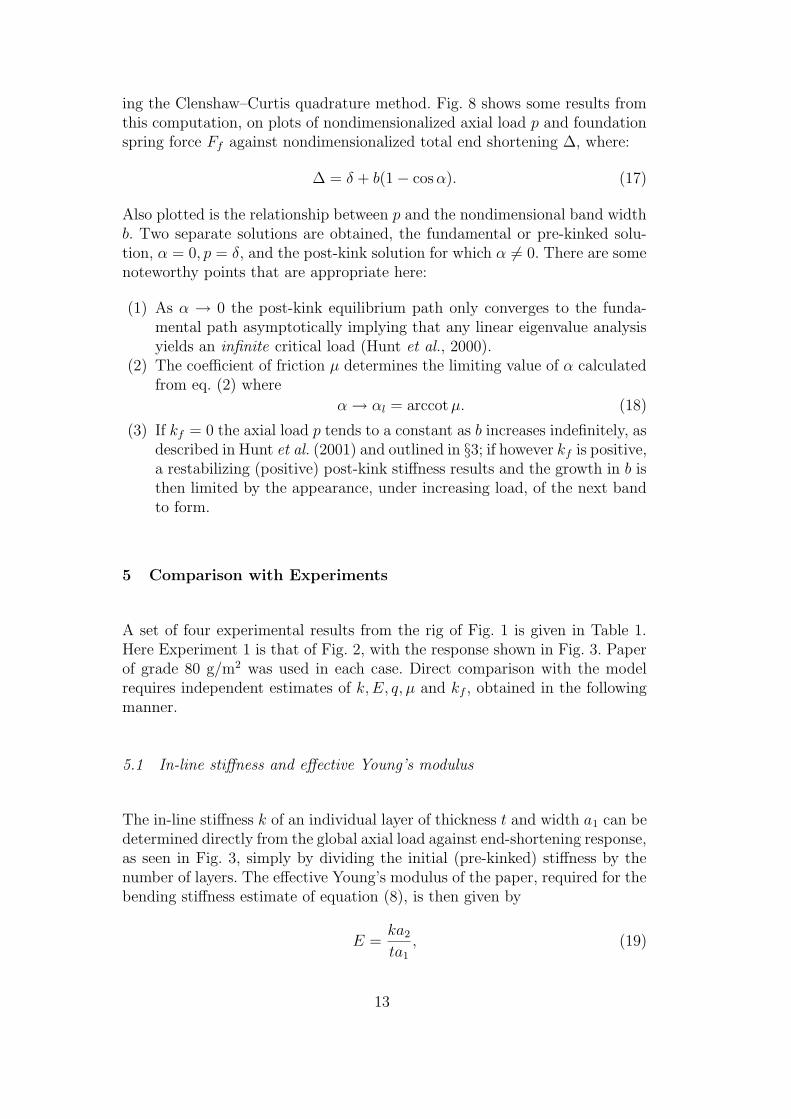
5.1 In-line stiffness and effective Young’s modulus
The in-line stiffness k of an individual layer of thickness t and width a1 can bedetermined directly from the global axial load against end-shortening response,as seen in Fig. 3, simply by dividing the initial (pre-kinked) stiffness by thenumber of layers. The effective Young’s modulus of the paper, required for thebending stiffness estimate of equation (8), is then given by
E =ka2
ta1
, (19)
13
�
� ����������� �� ����
�����
� ����������� � �"!$#
%0
1
2
3
4
5
6
7
8
5 10 15 20 25
(a) Load p versus end-shortening ∆
0
2
4
6
8
10
20 40 60 80 100 120
&�')(+* ,�-�.�/�0�1�* ,"2
3
4
5 6�7�8 9�:�;<5 6"=)>
?�@BA
(b) Load p versus kink band width b
CEDGFIH�J K L)H�MON�POQSR�Q TUFIH
V�W$X+Y Z�[�\ ]�^�_�Y Z"`
a
bIc
dfe$g)h�i�j
0
1
2
3
4
5
20 40 60 80 100 120 140
(c) Foundation force Ff versus ∆
Fig. 8. Equilibrium solutions of the model. Quantities plotted from nondimensionalparameters: q = 0.5, c = 10, µ = 0.57, 0.0045 ≤ kf ≤ 0.0162. Also shown is thenondimensionalized experimental slope obtained from Fig. 3.
14
Experiment
Quantity 1 2 3 4
a1 (mm) 210 210 105 105
a2 (mm) 297 297 297 297
a3 (mm) 50.0 50.0 20.2 20.2
t (mm) 0.08 0.08 0.08 0.08
k (N/mm) 259.8 169.4 145.3 124.4
E (N/mm2) 4593 2995 5139 4397
q 0.513 0.825 0.447 0.385
µ 0.57 0.57 0.57 0.57
c 9.90 12.55 9.24 8.57
kf (×10−2) 1.62 2.47 2.15 2.96
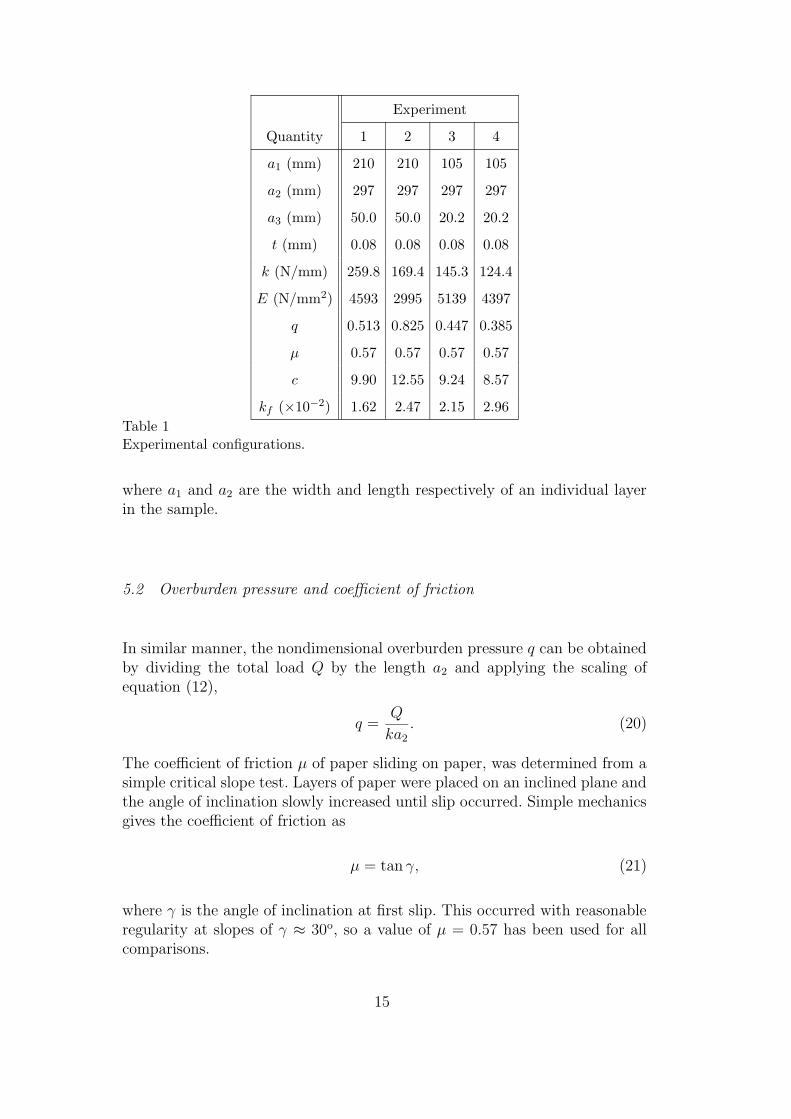
Table 1Experimental configurations.
where a1 and a2 are the width and length respectively of an individual layerin the sample.
5.2 Overburden pressure and coefficient of friction
In similar manner, the nondimensional overburden pressure q can be obtainedby dividing the total load Q by the length a2 and applying the scaling ofequation (12),
q =Q
ka2
. (20)
The coefficient of friction µ of paper sliding on paper, was determined from asimple critical slope test. Layers of paper were placed on an inclined plane andthe angle of inclination slowly increased until slip occurred. Simple mechanicsgives the coefficient of friction as
µ = tan γ, (21)
where γ is the angle of inclination at first slip. This occurred with reasonableregularity at slopes of γ ≈ 30o, so a value of µ = 0.57 has been used for allcomparisons.
15
5.3 Foundation stiffness
The foundation stiffness kf is less straightforward to estimate. For the model,Figs 8(a) and (b) show its effect on the load/end-shortening response and thefoundation spring force Ff , respectively. If the latter is taken as being solelyresponsible for the additional component of transverse load seen experimen-tally after the first kink has formed, a realistic value for kf can be inferred bydirectly comparing the slopes of Fig. 3 and the dimensional form of Fig. 8(b).A procedure of successive approximation is chosen in preference to any at-tempt to estimate dFf/ d∆ theoretically. We do, however, make the followingobservation.
Fig. 8(b) indicates that the slope represented by kf is effectively constant froman early stage in the deformation process until lockup. An estimated kf atlockup (α = αl) should therefore be applicable most of the range of deflection.It can be shown from equations (14)–(16) that b, δ, db/ dα and dδ/ dα allapproach infinity as α → αl = arccot µ. If b and δ reach this limiting valuemore slowly than their corresponding derivatives, then it can be shown thatthe following relation holds in the limit:
dFf
d∆= kf
(
sin αl
1 − cos αl
)
. (22)
This certainly is true for all cases considered here and we suspect it always tobe the case, although we have no general proof.
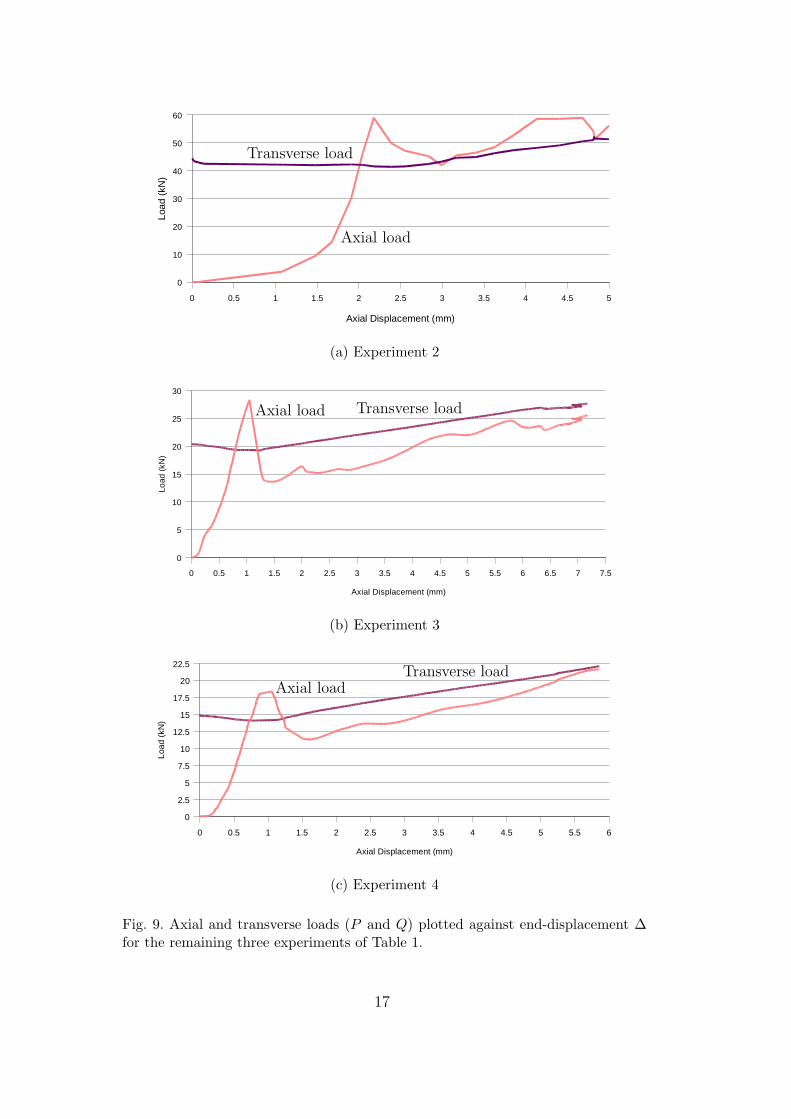
5.4 Final comparisons
This section presents direct comparisons between the experimental resultsfor the configurations of Table 1, and the suitably-dimensioned solutions ofequations (14)–(16). The raw experimental output of axial and transverseloads versus end-displacement ∆ was seen in Fig. 3 for the illustrative case ofExperiment 1; similar output for the remaining three experiments is given inFig. 9.
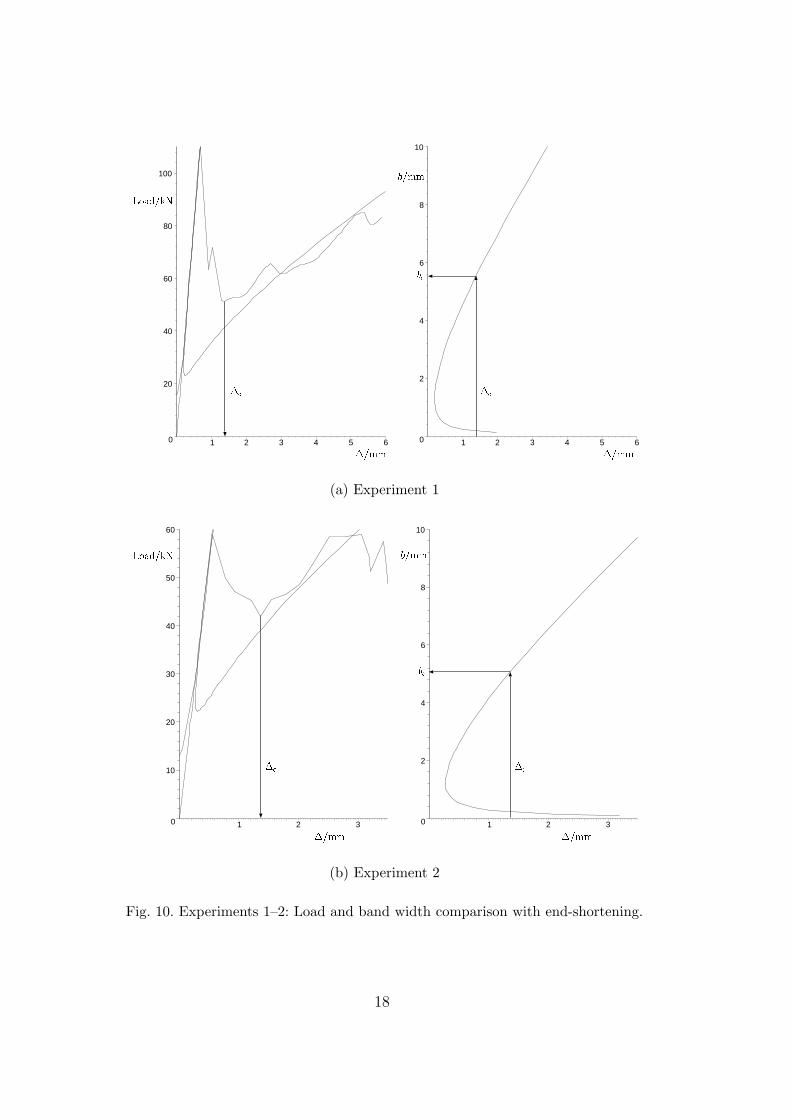
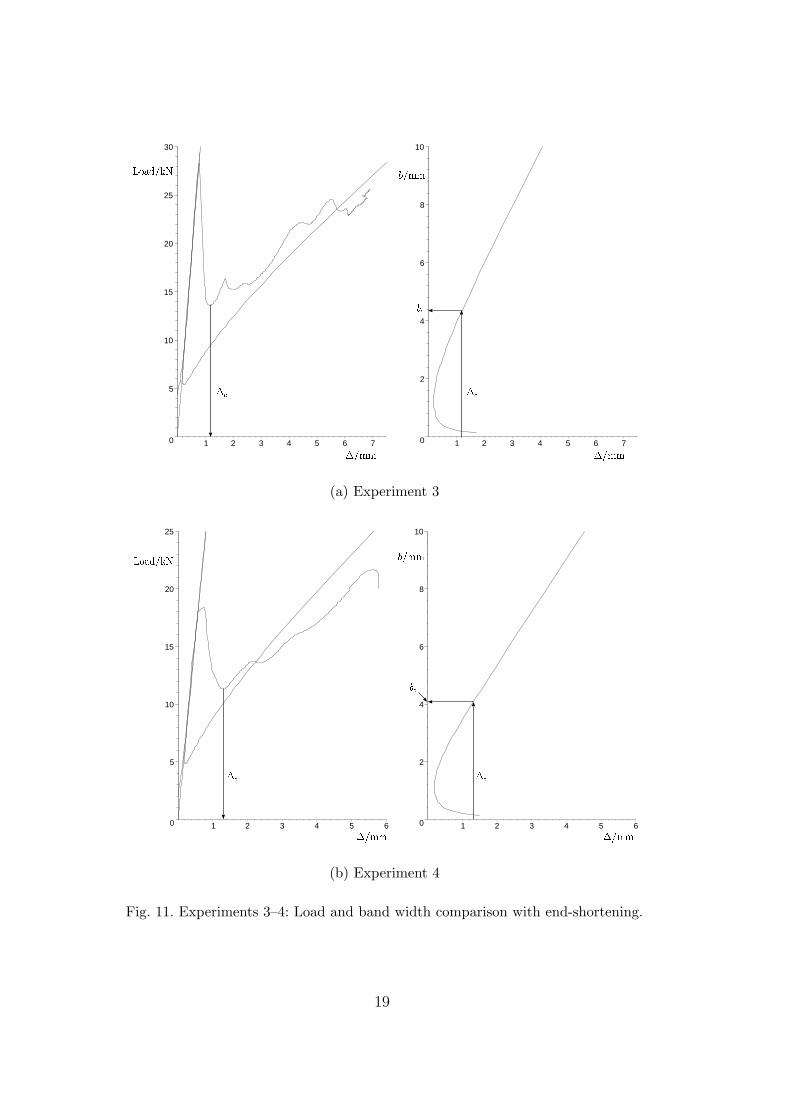
The experimental load–displacement curves plotted against their theoreticalcounterparts, and plots of kink band width b versus ∆, are shown in Figs. 10–11. Comparisons are also presented in Table 2 of the minimum post-kinkexperimental load level Pmin, which is the load at the experiment’s restabi-lization point, and kink band width bc at the applied displacement shown as∆c; the latter will be close to, but not necessarily at, the position of minimumexperimental load, the one second time interval in the logging sequence intro-ducing a small element of uncertainty. The comparisons are very encouraging.
16
0 0.5 1 1.5 2 2.5 3 3.5 4 4.5 5
0
10
20
30
40
50
60
Axial Displacement (mm)
Load
(kN
)
Axial load
Transverse load
(a) Experiment 2
0 0.5 1 1.5 2 2.5 3 3.5 4 4.5 5 5.5 6 6.5 7 7.5
0
5
10
15
20
25
30
Axial Displacement (mm)
Load
(kN
)
Axial load Transverse load
(b) Experiment 3
0 0.5 1 1.5 2 2.5 3 3.5 4 4.5 5 5.5 6
0
2.5
5
7.5
10
12.5
15
17.5
20
22.5
Axial Displacement (mm)
Load
(kN
)
Axial loadTransverse load
(c) Experiment 4
Fig. 9. Axial and transverse loads (P and Q) plotted against end-displacement ∆for the remaining three experiments of Table 1.
17
0
2
4
6
8
10
1 2 3 4 5 60
20
40
60
80
100
1 2 3 4 5 6
�������
������ ����
������� �������
��� ���
�!
(a) Experiment 1
0
2
4
6
8
10
1 2 30
10
20
30
40
50
60
1 2 3
"�#�$�$%�&'�(�)�*�+
,�-�.�. /�0�1�1
243 546
798
(b) Experiment 2
Fig. 10. Experiments 1–2: Load and band width comparison with end-shortening.
18
0
5
10
15
20
25
30
1 2 3 4 5 6 7 0
2
4
6
8
10
1 2 3 4 5 6 7
������������ �����
������� �������
��� ���
�!
(a) Experiment 3
0
5
10
15
20
25
1 2 3 4 5 6 0
2
4
6
8
10
1 2 3 4 5 6
"$#�%�%&('�)�*,+�-�.
/10�2�2 314�5�5
687 98:
;!<
(b) Experiment 4
Fig. 11. Experiments 3–4: Load and band width comparison with end-shortening.
19
Theoretical values Experimental values % difference
Expt β Load bc β Pmax Pmin b β Load b
(deg) (kN) (mm) (deg) (kN) (kN) (mm) (range)
1 15.8 41.5 5.5 18.0 109.9 51.3 4.5–5.6 13.9 23.6 −18.2 → +1.8
2 16.0 39.1 5.1 18.0 59.0 42.0 4.9–5.5 12.5 7.4 −3.9 → +7.8
3 15.6 9.54 4.3 15.0 28.2 13.6 4.1–4.7 3.8 42.6 −4.7 → +9.3
4 14.2 10.1 4.1 14.0 18.4 11.3 3.5–5.5 1.4 11.9 −14.6 → +34.1
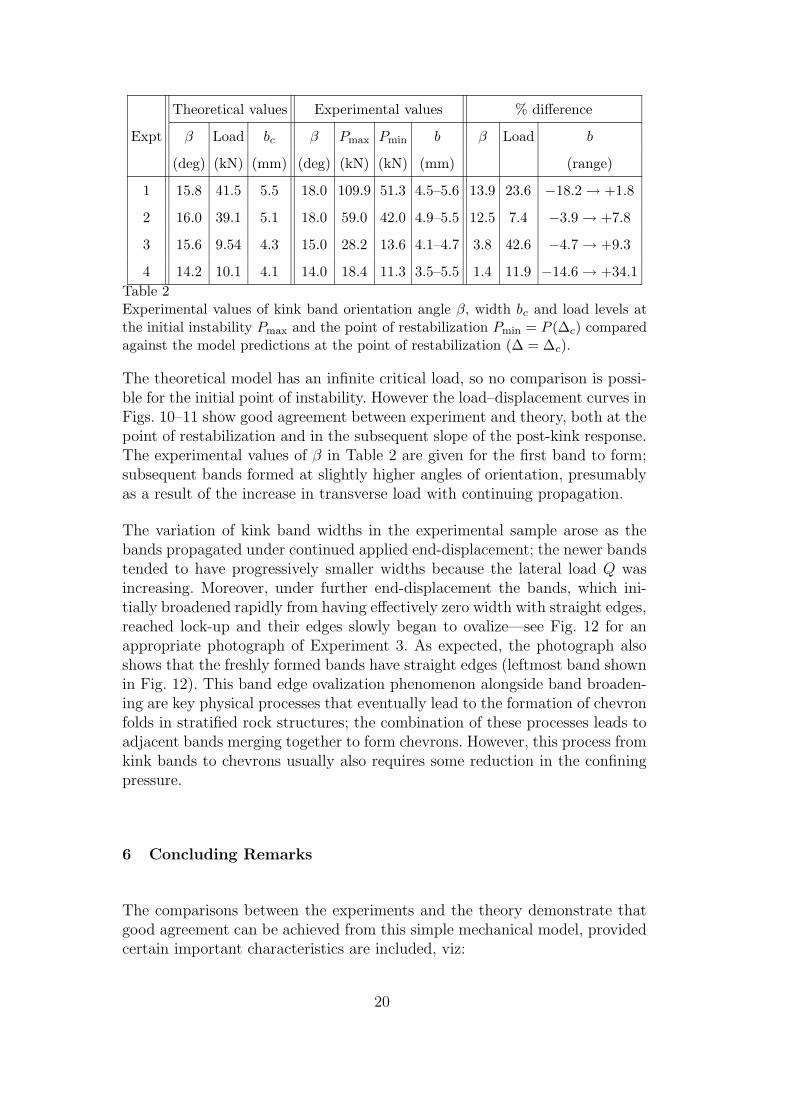
Table 2Experimental values of kink band orientation angle β, width bc and load levels atthe initial instability Pmax and the point of restabilization Pmin = P (∆c) comparedagainst the model predictions at the point of restabilization (∆ = ∆c).
The theoretical model has an infinite critical load, so no comparison is possi-ble for the initial point of instability. However the load–displacement curves inFigs. 10–11 show good agreement between experiment and theory, both at thepoint of restabilization and in the subsequent slope of the post-kink response.The experimental values of β in Table 2 are given for the first band to form;subsequent bands formed at slightly higher angles of orientation, presumablyas a result of the increase in transverse load with continuing propagation.
The variation of kink band widths in the experimental sample arose as thebands propagated under continued applied end-displacement; the newer bandstended to have progressively smaller widths because the lateral load Q wasincreasing. Moreover, under further end-displacement the bands, which ini-tially broadened rapidly from having effectively zero width with straight edges,reached lock-up and their edges slowly began to ovalize—see Fig. 12 for anappropriate photograph of Experiment 3. As expected, the photograph alsoshows that the freshly formed bands have straight edges (leftmost band shownin Fig. 12). This band edge ovalization phenomenon alongside band broaden-ing are key physical processes that eventually lead to the formation of chevronfolds in stratified rock structures; the combination of these processes leads toadjacent bands merging together to form chevrons. However, this process fromkink bands to chevrons usually also requires some reduction in the confiningpressure.
6 Concluding Remarks
The comparisons between the experiments and the theory demonstrate thatgood agreement can be achieved from this simple mechanical model, providedcertain important characteristics are included, viz:
20
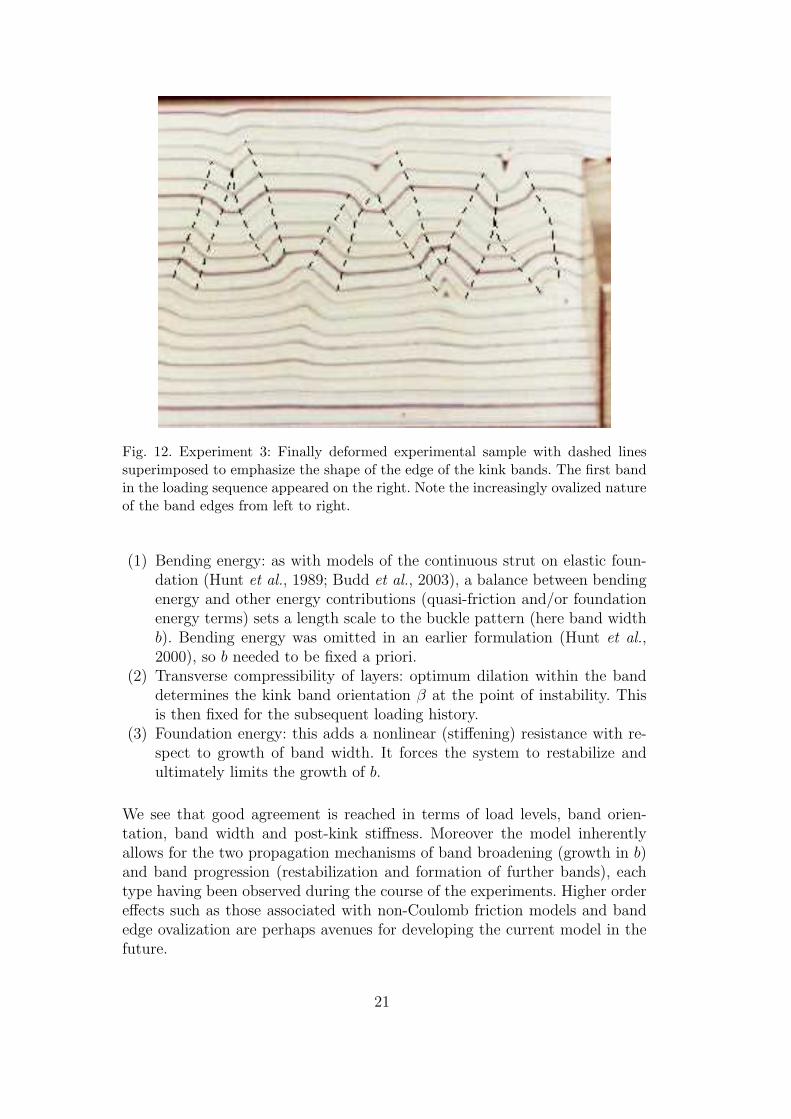
Fig. 12. Experiment 3: Finally deformed experimental sample with dashed linessuperimposed to emphasize the shape of the edge of the kink bands. The first bandin the loading sequence appeared on the right. Note the increasingly ovalized natureof the band edges from left to right.
(1) Bending energy: as with models of the continuous strut on elastic foun-dation (Hunt et al., 1989; Budd et al., 2003), a balance between bendingenergy and other energy contributions (quasi-friction and/or foundationenergy terms) sets a length scale to the buckle pattern (here band widthb). Bending energy was omitted in an earlier formulation (Hunt et al.,2000), so b needed to be fixed a priori.
(2) Transverse compressibility of layers: optimum dilation within the banddetermines the kink band orientation β at the point of instability. Thisis then fixed for the subsequent loading history.
(3) Foundation energy: this adds a nonlinear (stiffening) resistance with re-spect to growth of band width. It forces the system to restabilize andultimately limits the growth of b.
We see that good agreement is reached in terms of load levels, band orien-tation, band width and post-kink stiffness. Moreover the model inherentlyallows for the two propagation mechanisms of band broadening (growth in b)and band progression (restabilization and formation of further bands), eachtype having been observed during the course of the experiments. Higher ordereffects such as those associated with non-Coulomb friction models and bandedge ovalization are perhaps avenues for developing the current model in thefuture.
21
In a number of publications found in the fibre composite literature, (for ex-ample, Budiansky (1983) and Kyriakides et al (2001)) it is either stated orimplied that band orientation is notoriously hard to predict. Here a simplemodelling concept (optimum dilation/pressure release within the band) leadsto predictions which differ from those obtained experimentally by only 1 or 2degrees. Although it is interesting to speculate that a similar mechanism maybe in operation for the case of fibres within an enveloping matrix, we leavethe detailed development of such an argument to future work.
Finally we note that, except for the reorientation of the layers, the stressstate within the band is sometimes taken as being the same as that outside(Johnson, 1995). Our earlier constant thickness models (Hunt et al., 2000;Hunt et al., 2001) did reflect this assumption, but in the present model itis most definitely not the case. The dilation in the banded region leads to adrop in normal reaction between the layers, and orientates the band such thatfriction is minimised. As total volume is maintained over the instability, thisindicates an arching of compressive stress around the band; stresses withinthe band are reduced, while those just outside are increased. The combinedeffect leads to a linear growth in the total transverse load over multiple bandformation, as seen experimentally.
Acknowledgement
The authors would like to thank Ron Millward of the Structures Laboratory inthe Department of Civil and Environmental Engineering at Imperial CollegeLondon for constructing and helping to develop the testing rig. This workhas been supported by the UK Engineering and Physical Sciences ResearchCouncil (EPSRC) through grant GR/R37173.
References
Anderson, T. B. 1964. Kink-bands and related geological structures. Nature,202, 272–274.
Argon, A. S. 1972. Fracture of composites. Treatise Mater. Sci. Technol., 1,79–114.
Budd, C. J., Edmunds, R., & Hunt, G. W. 2003. A nonlinear model for parallelfolding with friction. Proc. R. Soc. Lond., A. In press.
Budiansky, B. 1983. Micromechanics. Comput. & Struct., 16, 3–12.Budiansky, B., Fleck, N. A., & Amazigo, J. C. 1998. On kink-band propagation
in fiber composites. J. Mech. Phys. Solids, 46, 1637–1653.Byskov, E., Christoffersen, J., Christensen, C. D., & Poulsen, J. S. 2002.
22
Kinkband formation in wood and fiber composites—morphology andanalysis. Int. J. Solids Struct., 39, 3649–3673.
Fleck, N. A. 1997. Compressive failure of fiber composites. Adv. Appl. Mech.,33, 43–117.
Ghosh, S. K. 1968. Experiments of buckling of multilayers which permit inter-layer gliding. Tectonophysics, 6, 207–249.
Heck, A. 1996. Introduction to Maple. New York: Springer.Hobbs, B. E., Means, W. D., & Williams, P. F. 1976. An outline of structural
geology. New York: Wiley.Hobbs, R. E., Overington, M. S., Hearle, J. W. S., & Banfield, S. J. 2000.
Buckling of fibres and yarns within ropes and other fibre assemblies. J.
Textile Inst., 91(3), 335–358.Hull, D., & Clyne, T. W. 1996. An introduction to composite materials. 2nd
edn. Cambridge Solid State Science Series. Cambridge University Press.Hunt, G. W., Bolt, H. M., & Thompson, J. M. T. 1989. Structural localization
phenomena and the dynamical phase-space analogy. Proc. R. Soc. Lond.,A 425, 245–267.
Hunt, G. W., Peletier, M. A., & Wadee, M. Ahmer. 2000. The Maxwellstability criterion in pseudo-energy models of kink banding. J. Struct.
Geol., 22(5), 667–679.Hunt, G. W., Wadee, M. Ahmer, & Peletier, M. A. 2001. Friction models
of kink-banding in compressed layered structures. In: Muhlhaus, H.-B.,Dyskin, A. V., & Pasternak, E. (eds), Proceedings of the international
workshop on bifurcation and localisation in geomechanics 1999. Lisse:Swets & Zeitlinger.
Johnson, A. M. 1995. Orientations of faults determined by premonditory shearzones. Tectonophysics, 247, 161–238.
Kyriakides, S., Arseculeratine, R., Perry, E. J., & Liechti, K. M. 1995. On thecompressive failure of fiber reinforced composites. Int. J. Solids Struct.,32, 689–738.
Price, N. J., & Cosgrove, J. W. 1990. Analysis of geological structures. Cam-bridge University Press.
Reid, S. R., & Peng, C. 1997. Dynamic uniaxial crushing of wood. Int. J.
Impact Eng., 19, 531–570.Rosen, B. W. 1965. Mechanics of composite strengthening. Chap. 3, pages
37–75 of: Bush, S. H. (ed), Fiber composite materials. American Societyof Metals.
Vogler, T.J., & Kyriakides, S. 2001. On the initiation and growth of kinkbands in fiber composites. Part I: experiments. Int. J. Solids Struct., 38,2639–2651.
Vogler, T.J., Hsu, S.-Y., & Kyriakides, S. 2001. On the initiation and growthof kink bands in fiber composites. Part II: analysis. Int. J. Solids Struct.,38, 2653–2682.
23