Embed Size (px)
Citation preview
1
KLM cargo flow allocation optimization at Schiphol A scenario analysis performed with a decision support system on an optimal allocation of KLM and Martinair cargo flows between KLM and Menzies warehouses at Schiphol
PUBLIC
Author: Michiel Bronsing Faculty: Technology, Policy & Management Master: Systems Engineering, Policy Analysis & Management Company: KLM Cargo University: Delft University of Technology Date: December 2013

2
3
Public version
Report information
Title: KLM cargo flow allocation optimization at Schiphol
Version: Final Report Master Thesis
Date: December 2013
Author: Michiel Bronsing
Student number: 1366696
University information
University: Delft University of Technology
Faculty: Technology, Policy & Management
Master: Systems Engineering, Policy Analysis & Management
Domain: Transport & Logistics
Course: SPM5910 – Master’s Thesis Project
Company: KLM Cargo
Thesis committee
Chairman: Prof. dr. ir. L.A. Tavasszy Faculty of TPM - Transport & logistics section
First supervisor: Dr. H. van Ham Faculty of TPM - Transport & logistics section
Second supervisor: Dr. M. Oey Faculty of TPM - Systems Engineering section
Third supervisor: Dr. S.W. Cunningham Faculty of TPM - Policy Analysis section
External supervisor: B. Krol KLM Cargo Operations

4
5
Preface This report is written for the final course of the two year master program: Systems Engineering, Policy Analysis & Management (SEPAM), at Delft University of Technology. The purpose of this course is to individually perform a research of which the knowledge can contribute to science. During my internship at KLM Cargo Operations I found that the knowledge I gained during the bachelor ‘Technology, Policy & Management’ and the master SEPAM were valuable in structuring business problems and processes.
My parents work more than 30 years at KLM. Therefore, it was a dream for me to do my graduation internship at KLM. It was a great honor and a great learning experience to work for one of the best airlines in the world. I am confident that I added some valuable knowledge to this company in order to contribute to the company results in this difficult economic period.
The quality of this thesis is definitely improved with the help of several people. Therefore I would like to thank all people at KLM Cargo who were always well willing to answer my questions. Especially my supervisor at KLM Cargo Operations, Bart Krol, provided a lot of useful knowledge about how to perform a research in a large company. Furthermore, my thesis committee always provided valuable insights to improve the quality of this research.
Michiel Bronsing, December 2013.

6
7
Executive summary Research context Martinair is fully owned by the KLM Group and contributes to approximately 25% of the cargo handling activities for KLM Cargo at Schiphol. The KLM cargo handling warehouse is not sufficient for handling cargo of both operating carriers. Since Martinair Cargo does not own a cargo handling warehouse, KLM needs to outsource a part of the cargo handling to a third party. Menzies Aviation is contracted by KLM Cargo for handling cargo of Martinair at Schiphol. Problem, need, objective and scope KLM Cargo Operations, the problem owner, wants to optimally allocate the cargo flows between the KLM and Menzies warehouses to improve business results. KLM is not able to make a well structured decision on how to optimally allocate cargo, because KLM does not know what the consequences are on the Key Performance Indicators (KPIs), actors and operational processes. KLM Cargo Operations is in need of a Decision Support System (DSS), which presents the consequences of cargo flow allocation adjustments. In economic difficult times, the maximization of revenues and the minimization of cost are the most important goals for KLM Cargo. Therefore, minimizing the net costs is considered the main objective of this research. The net costs are calculated by the costs of a cargo flow minus the revenues of that particular flow. A scenario analysis provided useful insight in the most optimal cargo flow allocation at Schiphol. The following objective was established:
‘Minimize the net costs of the KLM and Martinair cargo flow allocation between the Menzies and KLM warehouses at Schiphol, by performing a scenario analysis for KLM Cargo Operations with the help of a Decision Support System.’
In this thesis important assumptions are made. No permanent KLM employees are fired. The current cooperation with Menzies will remain and the capacity of the KLM Cargo warehouse will remain unchanged at the same location. This thesis focuses on the allocation of airplanes to and from the two warehouses at Schiphol. The handling processes of KLM Freight Building 1 are considered out of scope. Research approach This research is separated in five phases. The problem analysis, process analysis, design, evaluation and conclusion phase. Process analysis phase In chapter 2 is presented that Menzies and customers are important actors for this research. This is because, the processes of Menzies and customers are influenced by a cargo flow allocation adjustment. In addition, Menzies and customers have the power to negatively affect the KLM Cargo business results. In the chapter 3, the processes are elaborated which are influenced by a cargo flow allocation on Schiphol. First, the processes within the KLM warehouses depend on the type of flow. Import and export flows require less handling processes than transit flows. Second, transport between the two warehouses is called ‘lateral transport’. This is an important process because it negatively influences all KLM KPIs. This process is time consuming and is vulnerable for failures.
8
Design phase In a literature review on decisions support systems in chapter 5 is concluded that Linear Programming (LP) is a suitable methodology for the business problem. The conceptual model presented in chapter 4 is translated into a LP model, designed in a spreadsheet environment with the help of Microsoft Excel. After a verification and validation performed in chapter 6 is concluded that the DSS is a reliable tool that provides realistic and relevant results. To allocate cargo flows between the two warehouses, the marginal handling costs at the KLM warehouse need to be compared with the handling tariff of Menzies. The KLM warehouse will remain. Therefore, the fixed cost of cargo handling are not taken into account. The Menzies handling tariff is a flat price for each kilogram handled at Menzies. Evaluation phase In chapter 7, an extensive scenario analysis is performed. Three scenarios are elaborated in depth on their impact on the KLM KPIs and involved actors. Results The most optimal scenario results in a net cost reduction of 17%. The LP model allocates most KLM inbound flows to the KLM warehouse and outbound KLM flows to the Menzies warehouse. All Martinair outbound flows are allocated to Menzies. Interesting result, the inbound Martinair flights from Asia are allocated to Menzies. In May 2013 this flow was allocated to the KLM warehouse. The inbound Martinair flights from the Americas and Africa are allocated to the KLM warehouse. These flows are known as large import flows which contain mostly flowers for one customer, J. van de Put Fresh Cargo Handling. Currently, a cargo flow allocation in which all KLM flows are allocated to KLM is preferred. Therefore, a scenario is optimized in which all KLM flows are handled at KLM. This results in a situation in which the inbound Martinair flights from the Americas and Africa are allocated to KLM. In addition, it is beneficial to handle other Martinair flights at Menzies. This results in a net cost reduction of 9%. Main conclusions In this research an answer is searched for the following main research question:
How could the net costs for KLM Cargo Operations be minimized by adjusting the cargo flow allocation of KLM and Martinair cargo flows between KLM and Menzies warehouses at Schiphol?
Value cooperation with Menzies Seen from a financial perspective, the cooperation with Menzies can contribute to significant cost reductions. The handling tariff of Menzies is competitive compared to the marginal handling costs of KLM Cargo. Therefore, KLM should remain a good relationship with Menzies. Handle KLM flows at Menzies Currently all KLM flights are handled in the KLM warehouse. Cost reductions can be obtained by handling KLM flights at the Menzies warehouse. This adjustment will have a large impact on KLM processes, Menzies and customers. When Menzies handles KLM flows, an additional process should be established to transport cargo between the KLM airplanes and Menzies warehouse. Menzies is not allowed to transport cargo to or from the KLM airplanes. Type of flow The type of flow influences the optimal allocation of a cargo flows. At the KLM warehouse, transit flows on Delta Airlines flights, import and export flows are preferred. Financially it is beneficial to handle
9
transit flows on Europe trucks at the Menzies warehouse. So, the KLM handling process of transit flows on Europe trucks is financially not competitive towards the handling tariff of Menzies. Recommendations This research presents valuable recommendations for KLM Cargo Operations. Handle Martinair ‘flower flights’ at KLM Inbound Martinair flights from the Americas and Africa are financially beneficial to handle at KLM. These flows are known as the ‘flower flights’, since these flights contain mostly flowers with destination Amsterdam. Therefore, these flights are large import flows and attractive for KLM. Besides financial benefits, these flows contain relatively low labor intensive work. Therefore, these flows improve the productivity of the KLM warehouse. When these flows are allocated to KLM, this will result in resistance from Menzies and J. van de Put. Handle Martinair inbound flows from Asia at Menzies Interesting result from this research, the inbound Martinair flights from Asia are financially beneficial to handle at Menzies. This flow is currently handled by KLM. Allocating this flow to Menzies will negatively influence the KLM productivity. The relationship with Menzies could be improved because Menzies prefers to handle these flights. The impact on customers is also considered positive. Handle KLM flows at Menzies Cost reductions can be obtained by allocating KLM flows to Menzies. KLM Cargo Operations should be aware of the impact it will have on the organization. The productivity of the KLM warehouse will decrease if KLM cargo flows are allocated to Menzies. This could result that marginal handling costs of KLM become even higher. Furthermore, a significant cargo flow allocation towards Menzies can cause internal social unrest about labor security. A cargo flow allocation of KLM flights to Menzies is preferred by Menzies. The productivity and revenues will increase. Transparent cargo flow allocation KLM Cargo Operations should be aware that an allocation of KLM flows at KLM and Menzies could worsen the cargo flow transparency. This could increase trucking problems of KLM trucks and trucks of customers. These trucking problems should be avoided because it could negatively influence the customer satisfaction. Recommendations for future research From the analysis some valuable recommendations on future research are identified. Redesign internal costs calculation In this research is questioned if the internal cost calculation between import, export and transit flows is valid. In some cases an additional palletizing process is required for transit flows. Therefore the higher handling costs can be explained. Nevertheless, in some cases the handling costs of a transit flow are even lower than handling import or export flows. Trucking optimization In this research is focused on the cargo flow allocation to and from airplanes. The allocation of trucks could also be taken into account in order to optimize the trucking allocation in combination with the flight allocation. Synergy effects can be obtained by combining these optimization objectives. Impact on non-financial KPIs This research focused on the impact of different scenarios on the financial KLM KPIs. Future research on the impact on non-financial KPIs can provide valuable information for KLM Cargo Operations, to make decisions on cargo flow allocation adjustments at Schiphol.
10
Contents Preface ..................................................................................................................................................... 5
Executive summary ................................................................................................................................. 7
List of abbreviations .............................................................................................................................. 15
1. Introduction ....................................................................................................................................... 17
1.1 Background information .............................................................................................................. 17
1.2 Problem description..................................................................................................................... 18
1.3 Need of KLM Cargo Operations ................................................................................................... 19
1.4 Objective description ................................................................................................................... 19
1.5 Scope of research......................................................................................................................... 20
1.6 Literature review on problem context ......................................................................................... 22
1.7 Research questions and methodologies ...................................................................................... 25
1.8 Outline of thesis ........................................................................................................................... 27
2. Actor analysis ..................................................................................................................................... 29
2.1 Internal actors .............................................................................................................................. 29
2.2 External actors ............................................................................................................................. 31
2.3 Preliminary conclusions ............................................................................................................... 34
3. Process analysis ................................................................................................................................. 35
3.1 Processes influenced by cargo flow allocation ............................................................................ 35
3.2 Cargo handling processes at Schiphol ......................................................................................... 37
3.3 Cost allocation ............................................................................................................................. 42
3.4 Cargo flow allocation constraints ................................................................................................ 43
3.5 Cargo flow allocation implementation pitfalls ............................................................................ 45
3.6 Preliminary conclusions ............................................................................................................... 45
4. Conceptual model ............................................................................................................................. 47
4.1 Graphical and mathematical formulation ................................................................................... 47
4.2 Objective ...................................................................................................................................... 50
4.3 Decision variables ........................................................................................................................ 50
4.4 Parameters ................................................................................................................................... 51
4.5 Constraints ................................................................................................................................... 54
4.6 Input Data .................................................................................................................................... 54
4.7 Preliminary conclusions ............................................................................................................... 55
5. Design of a decision support system ................................................................................................. 57
5.1 Requirements of DSS ................................................................................................................... 57
5.2 Selecting a LP tool as DSS............................................................................................................. 58
5.3 Design of LP model ...................................................................................................................... 60
5.4 Preliminary conclusions ............................................................................................................... 60
11
6. Model validation & verification ........................................................................................................ 61
6.1 Methodology on validation.......................................................................................................... 61
6.2 Verification ................................................................................................................................... 62
6.3 Validation ..................................................................................................................................... 66
6.4 Preliminary conclusions ............................................................................................................... 69
7. Scenario analysis ............................................................................................................................... 71
7.1 Scenario analysis methodology ................................................................................................... 71
7.2 Scenario 0: Current ...................................................................................................................... 74
7.3 Scenario 1: Optimal cargo flow allocation ................................................................................... 76
7.4 Scenario 2: Optimal +11.000 ton/week at KLM ........................................................................... 79
7.5 Scenario 3: Martinair flow(s) at KLM ........................................................................................... 81
7.6 Comparison of scenarios.............................................................................................................. 83
7.7 Limitations of DSS ........................................................................................................................ 84
7.8 Valuable learnings from extensive scenario analysis .................................................................. 85
7.9 Preliminary conclusions ............................................................................................................... 87
8. Conclusions & recommendations ...................................................................................................... 91
8.1 Conclusions .................................................................................................................................. 91
8.2 Recommendations ....................................................................................................................... 94
8.3 Reflection ..................................................................................................................................... 96
References ............................................................................................................................................. 98
Appendix Content ............................................................................................................................ 105
Appendix A: Scientific article ........................................................................................................... 106
Appendix B: Initial project description ............................................................................................ 113
Appendix C: Literature review on optimization methods ............................................................... 114
Appendix D: KPI Analysis.................................................................................................................. 117
Appendix E: Internal actor analysis.................................................................................................. 119
Appendix F: KLM handling processes in freight buildings ............................................................... 123
Appendix G: Handling processes in Menzies warehouse ................................................................ 127
Appendix H: Nearby solution tests .................................................................................................. 129
Appendix I: Data file selection ......................................................................................................... 133
Appendix J: Model specification ...................................................................................................... 137
Appendix K: Data validation............................................................................................................. 139
Appendix L: Verification & validation .............................................................................................. 143
Appendix M: Query of Revenue Management database ................................................................ 145
Appendix N: Data analysis of Martinair cargo flows ........................................................................ 148
Appendix O: Marginal costs calculation at KLM .............................................................................. 151
Appendix P: Capacity constraints .................................................................................................... 154
12
Appendix Q: Sensitivity Analysis ...................................................................................................... 155
Appendix R: Martinair Flight Schedule ............................................................................................ 156
Appendix S: Unit Load Device (ULD) ................................................................................................ 161
Appendix T: Scenario Analysis ......................................................................................................... 162
List of figures Figure 1. Cargo flows through the warehouses at Schiphol. ................................................................. 21
Figure 2. General air Cargo Handling Process (Petersen, 2007, p. 7) .................................................... 23
Figure 3. Research framework. ............................................................................................................. 27
Figure 4. Interest stakeholder map (Maylor, 2010, p. 108). ................................................................. 32
Figure 5. Causal analysis; processes that affect KLM KPIs..................................................................... 35
Figure 6. Cargo flows within KLM warehouse. ...................................................................................... 37
Figure 7. Cargo flows within Menzies warehouse. ................................................................................ 39
Figure 8. Cargo flows between KLM and Menzies. ............................................................................... 42
Figure 9. Graphical representation of KLM Cargo business problem. .................................................. 47
Figure 10. Graphical representation in one larger assignment problem. ............................................. 48
Figure 11. Phases of modeling and the role of V&V (Oberkampf, Trucano, & Hirsch, 2002). .............. 61
Figure 12. Graphical representation. .................................................................................................. 110
Figure 13. Flow system research and analysis methods (Savrasov, 2008). ......................................... 114
Figure 14. Five management processes of SCOR (Supply Chain Council, 2010). ................................ 116
Figure 15. Internal actors KLM Cargo. ................................................................................................. 119
Figure 16. Cargo flows within Freight building 1, 2 and 3. .................................................................. 123
Figure 17. KLM cargo handling process freight building 2. ................................................................. 124
Figure 18. KLM cargo handling process freight building 3. ................................................................. 126
Figure 19. Export handling process Menzies. ...................................................................................... 127
Figure 20. Import handling process Menzies. ..................................................................................... 127
Figure 21. Presentation of LP model. .................................................................................................. 138
Figure 22. Cost calculation of cargo flows. .......................................................................................... 138
List of tables
Table 1. Methodologies uses in research. ............................................................................................. 26
Table 2. How to manage stakeholders in this research. ....................................................................... 34
Table 3. Decision variables 1-4. ............................................................................................................. 51
Table 4. Decision variables 5-8. ............................................................................................................. 51
Table 5. Marginal costs of cargo handling at the KLM warehouse, presented for different flows. ...... 52
Table 6. Handling tariff of cargo handling at the Menzies warehouse, presented for different flows. 52
Table 7. Comparison of LP tools on DSS requirements ......................................................................... 58
Table 8. Results of sensitivity analysis on KLM cargo marginal handling costs..................................... 64
Table 9. Results of sensitivity analysis on Menzies handling tariff. ...................................................... 64
Table 10. Output of DSS; current situation. .......................................................................................... 67
Table 11. Impact of cargo allocation in May 2013 on financial KLM KPIs. ............................................ 74
Table 12. Impact of cargo allocation in May 2013 on non-financial KPIs. ............................................ 74
13
Table 13. Impact of cargo allocation in May 2013 on Menzies KPIs. .................................................... 75
Table 14. Cargo flow allocation for scenario 1. ..................................................................................... 76
Table 15. Impact of scenario 1 on financial KPIs. .................................................................................. 77
Table 16. Impact of scenario 1 on non-financial KPIs............................................................................ 77
Table 17. Impact of scenario 1 on Menzies KPIs. .................................................................................. 78
Table 18. Cargo flow allocation of scenario 2. ...................................................................................... 79
Table 19. Impact of scenario 2 on financial KLM KPIs. .......................................................................... 79
Table 20. Impact of scenario 2 on non-financial KLM KPIs. .................................................................. 79
Table 21. Impact of scenario 2 on Menzies KPIs. .................................................................................. 80
Table 22. Impact of scenario 3 on the net costs at Schiphol. ................................................................ 81
Table 23. Impact of scenario 3 on financial KLM KPIs. .......................................................................... 81
Table 24. Impact of scenario 3 on non-financial KLM KPIs. .................................................................. 82
Table 25. Impact of scenario 3 on Menzies KPIs. .................................................................................. 83
Table 26. Comparison of cargo flow scenarios on KLM KPIs. ................................................................ 83
Table 27. Comparison of scenarios on actors. ...................................................................................... 84
Table 28. Impact on total net costs of handling outbound Martinair flows at KLM warehouse and
inbound Martinair flows at Menzies. .................................................................................................... 85
Table 29. Impact on total net costs of handling outbound Martinair flows at KLM warehouse and
inbound Asia flow at KLM. ..................................................................................................................... 85
Table 30. Optimal use of KLM Cargo handling capacity. ....................................................................... 86
Table 31. Impact of handling outbound KLM flows at Menzies. ........................................................... 87
Table 32. Optimal cargo flow allocation if revenues are not included. ................................................ 87
Table 33. Distinguishing criteria for OpenSolver. ................................................................................ 111
Table 34. Results of optimal scenario with -4% marginal handling costs. .......................................... 129
Table 35. Results of optimal situation with +10% Menzies handling tariff. ........................................ 130
Table 36. Results of optimal situation with lateral transport cost of 0,005€/kg. ............................... 131
Table 37. Results of optimal scenario with lateral transport cost from Menzies to KLM of 0,007€/kg.
............................................................................................................................................................. 132
Table 38. Data source selection on data file requirements. ............................................................... 135
Table 39. Example of content data file. ............................................................................................... 135
Table 40. Comparison of RM and Operations data based on Menzies export handling. ................... 141
Table 41. Parameters for handling flights and trucks. ........................................................................ 143

14
15
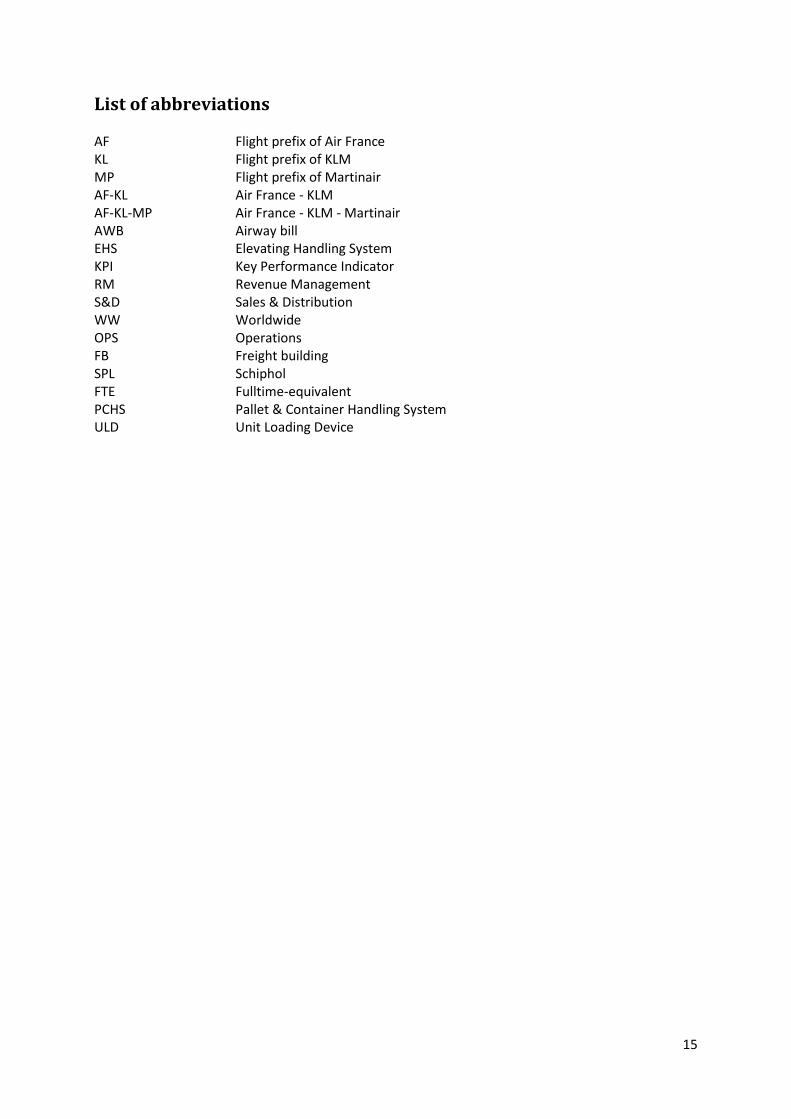
List of abbreviations AF Flight prefix of Air France KL Flight prefix of KLM MP Flight prefix of Martinair AF-KL Air France - KLM AF-KL-MP Air France - KLM - Martinair AWB Airway bill EHS Elevating Handling System KPI Key Performance Indicator RM Revenue Management S&D Sales & Distribution WW Worldwide OPS Operations FB Freight building SPL Schiphol FTE Fulltime-equivalent PCHS Pallet & Container Handling System ULD Unit Loading Device

16
Part 1: Problem exploration
17
1. Introduction In this chapter the need of the problem owner, KLM Cargo Operations, is introduced. Since this problem is rather complex, essential background information on the problem context is provided. A literature review is performed in order to gain knowledge about the air cargo market. The objective of this thesis is derived from problem and need of KLM. The scope presents the focus of this research.
1.1 Background information In this section some general information and context information is presented on the business problem of KLM Cargo Operations. This information is essential to understand certain decisions throughout this thesis.
1.1.1 General introduction of KLM Royal Dutch Airlines In 1919 KLM Royal Dutch Airlines was founded to serve the Netherlands and its colonies. KLM has developed to a respected airline divided into three divisions: Passenger Business, Cargo and Engineering & Maintenance. The KLM Group, of which KLM is the core, includes the wholly-owned subsidiaries: Transavia.com, KLM Cityhopper and Martinair. Martinair became a subsidiary company of KLM in 2008. The passenger division of Martinair was integrated into KLM and therefore only the Cargo and Engineering & Maintenance divisions are still operating under its original name (Martinair, 2013). Since the merger with Air France in 2004, KLM has been part of the Air France-KLM (AF-KL) Group. The overall concept of the Air France-KLM Group is: one holding, two airlines and three businesses (AF-KL-MP Cargo, 2013). Goal of this concept is to combine strengths while keeping the best of both worlds (AF-KL Cargo Web Academy, 2013). The three businesses: Passenger Business, Cargo and Engineering & Maintenance are heavily dependent on each other. By carrying 1.5 million ton annually, Air France-KLM-Martinair (AF-KL-MP) Cargo is one of the largest air cargo carriers in the world (AF-KL-MP Cargo, 2013). Thereof, KL-MP Cargo transports about 540,000 tons a year (KLM, 2013). In October 2005 the cargo divisions of KLM and Air France took the first step in integrating a large part of the organization (AF-KL-MP Cargo, 2013). Every year integration between Air France, KLM and Martinair Cargo is intensified to make optimal use of their resources. AF-KL-MP Cargo operates in a global network in 170 countries with more than 350 destinations (KLM, 2013). Air France operates from their hub Charles De Gaulle in Paris. KLM and Martinair Cargo operate from their hub on Amsterdam Schiphol Airport for all their worldwide cargo activities.
1.1.2 Current situation Martinair Cargo only operates full freighter airplanes which are fully committed to transporting cargo. In contrary to Martinair, KLM Cargo only transports cargo in combination with transporting passengers. Two different combined passenger/cargo flights are used: ‘combined’ and ‘pax’. In a ‘combined’-flight the airplane is separated in half, whereby the front is used for passengers and in the back a large amount of cargo can be carried (d'Engelbronner, 2012). For each ‘pax’ flight the upper deck is used for passengers. In addition, it carries relative small amounts of cargo in the lower deck (belly). Besides Martinair and KLM as operating carriers, an important stakeholder for this project needs to be introduced: Menzies Aviation. Cargo handling of Martinair is outsourced to this company. So, Martinair does not operate their own warehouse. Martinair Cargo Operations office is located in the warehouse of Menzies to be able to easily communicate with Menzies. The warehouse of Menzies is located at
18
Schiphol East, just as most cargo handlers. The warehouse of KLM is located at Schiphol center. Schiphol Center and the warehouse of Menzies are separated by airway strips.
1.1.3 Context of thesis The purchase of Martinair, resulted in an increase of approximately 25% of cargo activities for KLM Cargo at Schiphol. Currently, the KLM warehouse is not sufficient for handling cargo of both operating airlines. In addition, the financial resources are too limited for building another larger warehouse or enlarging the current capacity of the KLM Cargo warehouse. Since Martinair Cargo does not have their own cargo handling warehouse, KLM and Martinair need to outsource a part of their cargo handling to a third party. Menzies Aviation is contracted by KLM Cargo for handling the full freighters of Martinair. For each kilogram cargo handled by Menzies, KLM pays a flat tariff to Menzies. This tariff is based on a minimum of cargo handling at Menzies. In July 2013 a heavy discussion between KLM and Menzies arose because the amount of Martinair cargo handled at Menzies was below expectations for 2013. KLM Cargo had two options. One is to pay a fine as defined in the contract at the end of the year. Or, KLM could compensate Menzies by allocating additional cargo at Menzies in order to reach the minimum. A good relationship with Menzies is of major importance to ensure a healthy cooperation where both parties are satisfied and well willing to help each other (Krol, 2013). Therefore, KLM preferred a situation where additional cargo was allocated to Menzies. The decision on which cargo flows to allocate to Menzies was difficult because there is little experience in cargo flow allocation adjustments between KLM and Menzies. A cargo flow is defined as cargo from an origin to a destination.
1.2 Problem description Currently all cargo carried by KLM, is handled at the KLM cargo handling warehouse. Before the first of May 2013 all Martinair cargo was handled at Menzies. After the first of May, KLM handled cargo of all incoming Martinair flights from Asia. This resulted in a decrease of cargo handling at Menzies and an increase of cargo handling at KLM. KLM Cargo expects that a cargo flow allocation adjustment could positively influence the business results. Currently KLM Cargo Operations does not know what the impact is on the KLM Key Performance Indicators (KPIs) of a cargo flow allocation adjustment at Schiphol. Furthermore, KLM does not know if the current cargo flow allocation is the most optimal situation. Based on certain cargo flow characteristics, cargo could be optimally allocated between the two warehouses at Schiphol. Currently the allocation of flights is based on origin, destination and operating carrier. The operating carriers of KLM Cargo are KLM and Martinair. A cargo flow allocation adjustment based on the current or other characteristics could influence the KPIs of KLM, Menzies and other involved actors. Problem definition Due to the capacity constraints of the KLM warehouses, KLM Cargo needs to make use of the cargo handling services of Menzies. KLM wants to optimally allocate cargo flows between KLM and Menzies warehouses. Currently, KLM is not able to make a well structured decision on how to optimally allocate cargo. This is because KLM does not know what the consequences of a changing cargo flow allocation are on KPIs, actors and operational processes.
19
1.3 Need of KLM Cargo Operations Because of the intensified cooperation between Menzies and KLM, the current cargo flow allocation at Schiphol could be adjusted. By allocating the cargo flows in the most optimal way over two warehouses, synergy effects and cost reductions can be obtained. Adjusting the allocation comes not without consequences. Handling certain cargo flows could impact the current working processes and the KPIs of KLM Cargo. Currently decisions on cargo flow allocation between KLM and Menzies are made more-less on common sense. Therefore KLM Cargo is in need of an overview of the consequences of different cargo flow allocation scenarios between KLM and Menzies. Since KLM is operating in economical difficult times, KLM Cargo Operations would like to know if a cargo flow allocation adjustment could improve the business results. Business results could be improved by maximizing the revenues and minimizing the costs involved in cargo handling. These consequences of different scenarios can be presented with the help of a Decision Support System (DSS). A DSS can be defined as an: “Interactive computer-based systems that aid users in judgment and choice activities” (Druzdzel & Flynn, 2002, p. 3). The use of DSS could increase efficiency, productivity and effectiveness in many business problems (Druzdzel & Flynn, 2002). Optimal choices can be made in technological environment taken into account the factors that influence these processes. Need In order to make well-structured decisions on an optimal cargo flow allocation at Schiphol, KLM Cargo Operations is in need of an overview of the consequences of cargo flow allocation adjustments. With the help of a DSS, multiple scenarios should be compared on the impact on the financial KLM KPIs. A scenario analysis should provide useful insight in the most optimal cargo flow allocation at Schiphol. In addition, the DSS should provide valuable insight on the impact for involved actors and the non-financial KLM KPIs.
1.4 Objective description From the need and problem definition of KLM Cargo Operations can be derived that KLM is not able to make a well-structured decision on how cargo flows could be optimally allocated between the KLM and Menzies warehouses. In the current economic difficult times, the maximization of revenues and minimization of cargo handling costs are the most important objectives of KLM. Net costs for a cargo flow are obtained by subtracting the revenues from the costs. Therefore, the research objective centralized in this research is:
‘Minimize the net costs of the KLM and Martinair cargo flow allocation between the Menzies and KLM warehouses at Schiphol, by performing a scenario analysis for KLM Cargo Operations with the help of a Decision Support System.’
A DSS could calculate the impact of different scenarios on the financial KLM Cargo KPIs. In addition, the DSS should provide valuable insight on the impact for involved actors and the non-financial KLM KPIs. A few questions are defined for which KLM is in need of reliable information of the impact on the KLM KPIs:
- What is the optimal cargo flow allocation at Schiphol? - Which Martinair flows are beneficial to handle at the KLM cargo warehouse? - Which KLM flows are beneficial to handle at the Menzies warehouse?
20
Deliverables The deliverable of this thesis is threefold. First an analysis on the consequences of cargo flow allocation adjustments between KLM and Menzies should be presented. Thereafter a Decision Support System (DSS) should be designed that presents the impact of cargo flow allocation adjustments on KPIs. Third, a scenario analysis performed with a DSS should present the consequences of different cargo flow allocation adjustments. The scenario analysis should provide valuable information on the most optimal cargo flow allocation at Schiphol.
1.5 Scope of research In this section the scope of this research is elaborated. This research is delineated physically and from a managerial perspective.
1.5.1. Managerial scope Management positions can be identified in three managerial levels; top, middle and lower level (Bucur, 2013). Top level managers develop the strategy of an organization. Middle level managers are the link between the top level and low level managers. They need to translate the strategy into the organization. A middle level manager has an organizational function by implementing the strategy of higher management. The lower level managers are the operational managers and make sure the production of a company is running. This master thesis is written for the middle level, organizational, managers of KLM Cargo Operations. Strategic and operational decisions are considered out of scope. This research is focused on an organizational optimization. To be aware of this management level is important while reading this thesis. Some operational improvements opportunities require too detailed information or even a different plan of approach for this research. Some decisions cannot be influenced by organizational managers because of the strategy defined by the top level management of KLM Cargo. The strategic boundaries for this thesis are elaborated in section 2.1.1 of the actor analysis. In short, in this thesis will be assumed that no permanent KLM employees are fired. The current cooperation with Menzies will remain and the capacity of the KLM Cargo warehouse will remain unchanged at the same location. In a large organization as KLM, overlap exists between the three management levels. Therefore this research could discover some strategic and operational improvements. These opportunities will be reported for future research but not influence the recommendations of this research. The time scope of the recommendations provided in this research are valid for about one year.
21
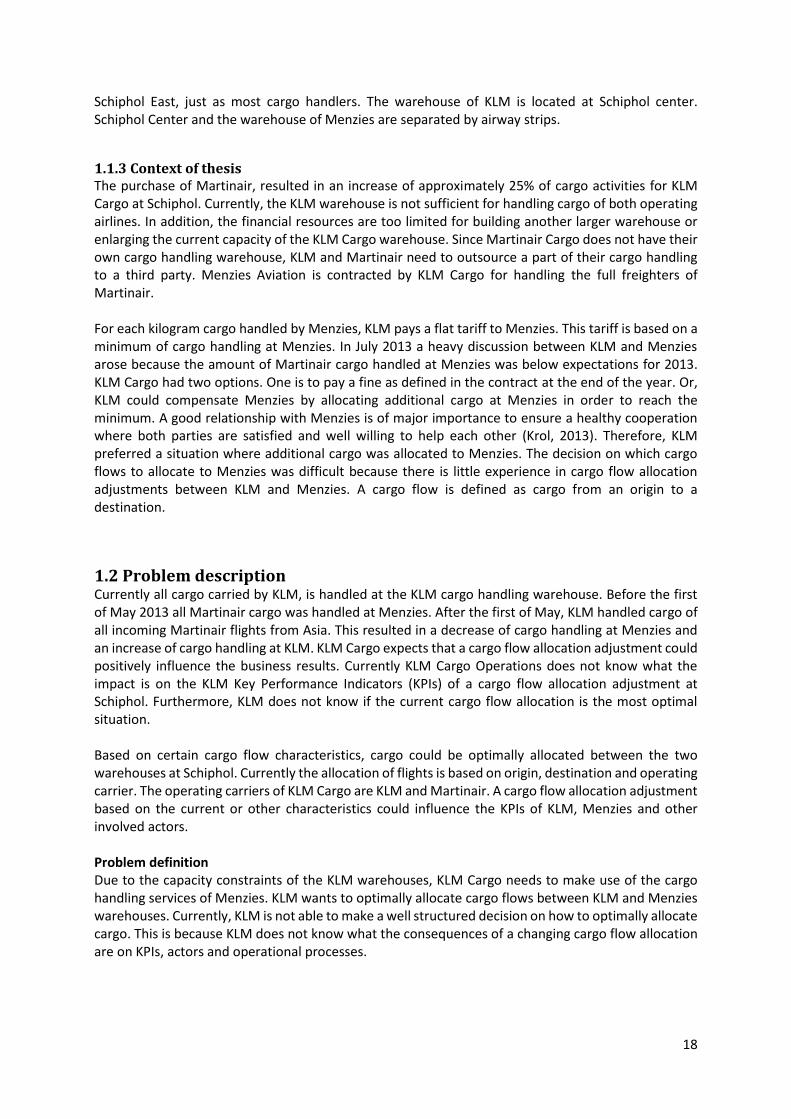
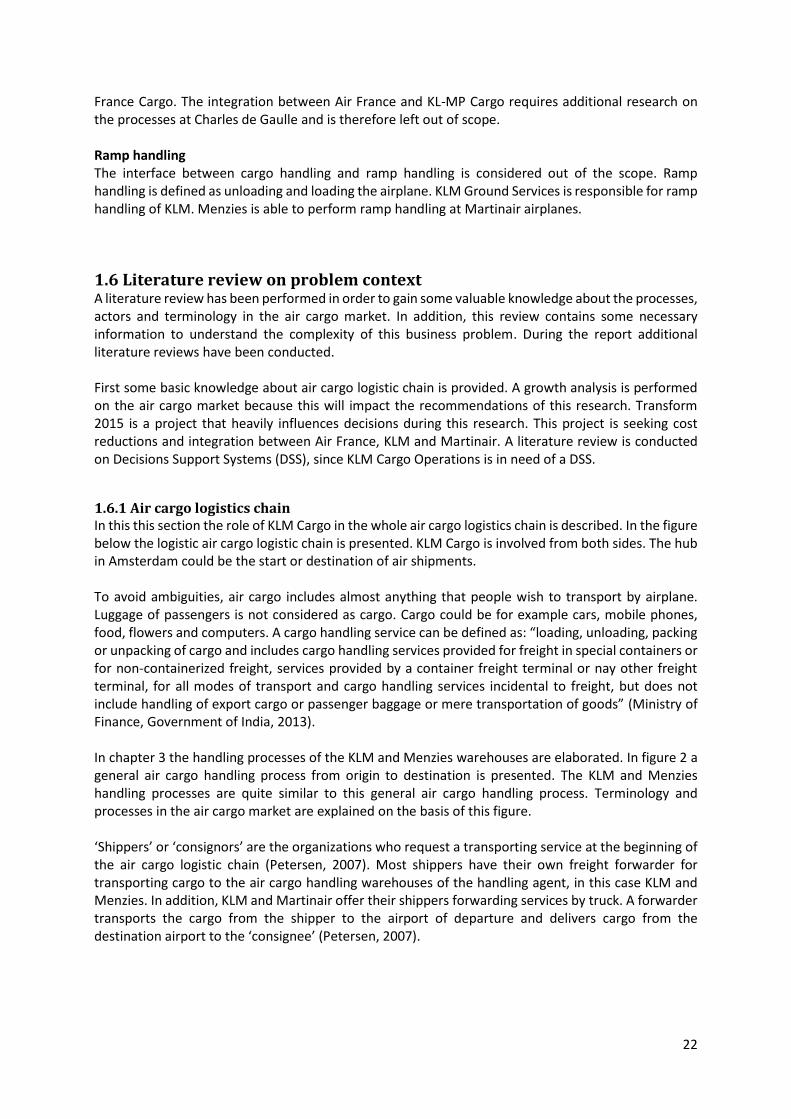
1.5.2 Physical scope During this project only allocation scenarios of cargo flows between Menzies and KLM on Amsterdam Schiphol Airport are analyzed. The cargo flows analyzed in this research are presented in the figure below. Cargo flow allocation of airplanes In figure 1 all cargo flows analyzed in this research are presented. Menzies and KLM Cargo handle incoming and outgoing flights and trucks in their warehouses. Figure 1 presents the possible cargo flows to and from the warehouses. This thesis focuses on allocating the cargo flows between the two
warehouses and airplanes. In figure 1, the airplane with ‘out’ presents an airplane which will depart. Trucks deliver and pick up their cargo from the warehouse where the involved airplane arrives or departs. The trucking schedule follows the flight schedule and the cargo flow allocation of airplanes (Krol, 2013). Warehouse capacity and location Current warehouse capacity of KLM is too limited to handle both KLM and Martinair. In the coming years it will be out of the question to enlarge the KLM warehouse capacity or to relocate the KLM warehouse. A discussion is being held between Schiphol and KLM about a relocation of the KLM warehouse to Schiphol East. Nevertheless with the current economic situation a relocation is not expected in the coming years (Krol, 2013). Freight building 1 In Freight Building (FB) 1 of KLM Cargo, variation cargo is handled that requires dedicated cargo handling. These different products are labor intensive and therefore customers pay a higher tariff for cargo handling. Due to the dedicated
cargo handling the internal handling costs at FB1 are higher than FB2&FB3. To give an example, according to Philip-Jan Peper (2013), International Sales Manager Variation Live Horses, requires a horse special attention from animal experts before, during and after the flight. FB1 is specially organized in a way for handling special cargo. The processes in FB1 are considered out of scope for this research. Martinair Cargo carries mostly ‘general cargo’ that does not require special dedicated cargo handling. Because the Martinair cargo flows are compared with the KLM cargo flows this thesis will focus on general cargo. Since general cargo is only handled in FB2&3, the processes of FB1 are considered out of scope. Currently cooperation between FB1 and FB2, FB3 and Menzies occurs smoothly. Norman Aipassa (2013), Head of Flow FB1, expects that a cargo flow allocation adjustment would not negatively influence the processes in FB1. Information on the products and processes in FB1 are shown in appendix F. Air France The vision of AF-KL-MP Cargo is to combine strengths of the airlines in the most efficient way (AF-KL Cargo Web Academy, 2013). For commercial side, this means ‘one face to the customer’. Integration with Martinair at Schiphol is the first step before KL-MP Cargo could intensify cooperation with Air
Figure 1. Cargo flows through the warehouses at
Schiphol.
22
France Cargo. The integration between Air France and KL-MP Cargo requires additional research on the processes at Charles de Gaulle and is therefore left out of scope. Ramp handling The interface between cargo handling and ramp handling is considered out of the scope. Ramp handling is defined as unloading and loading the airplane. KLM Ground Services is responsible for ramp handling of KLM. Menzies is able to perform ramp handling at Martinair airplanes.
1.6 Literature review on problem context A literature review has been performed in order to gain some valuable knowledge about the processes, actors and terminology in the air cargo market. In addition, this review contains some necessary information to understand the complexity of this business problem. During the report additional literature reviews have been conducted. First some basic knowledge about air cargo logistic chain is provided. A growth analysis is performed on the air cargo market because this will impact the recommendations of this research. Transform 2015 is a project that heavily influences decisions during this research. This project is seeking cost reductions and integration between Air France, KLM and Martinair. A literature review is conducted on Decisions Support Systems (DSS), since KLM Cargo Operations is in need of a DSS.
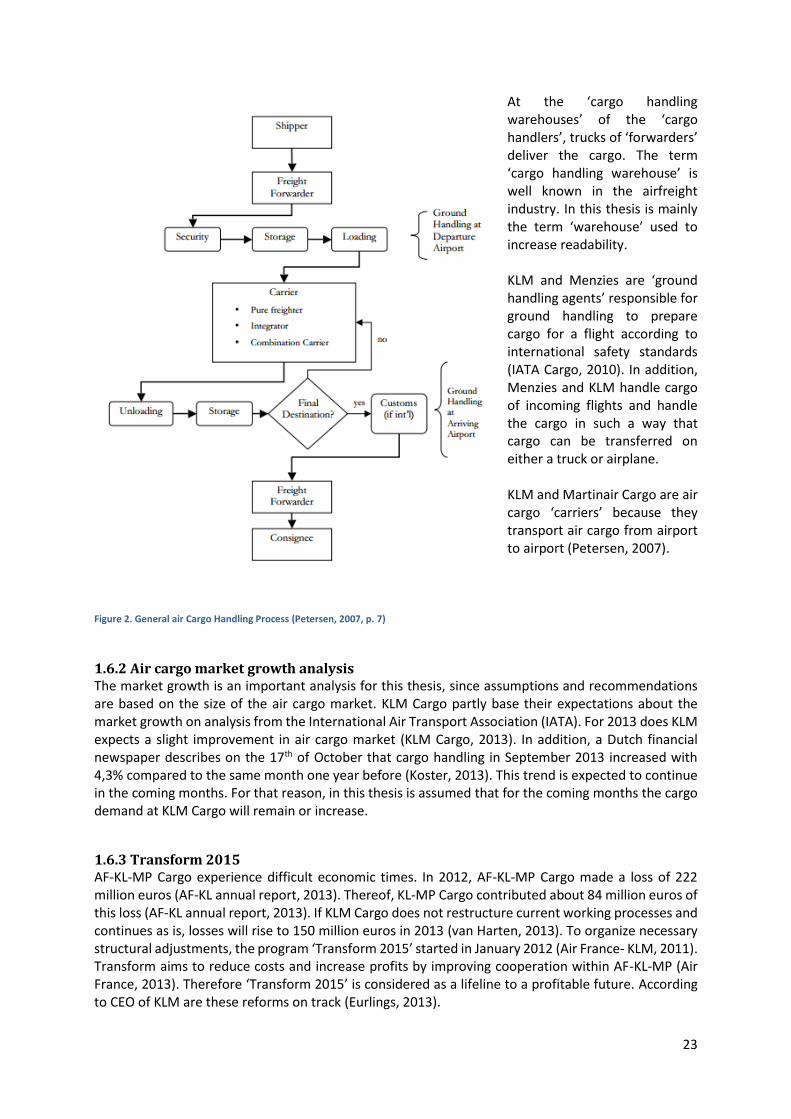
1.6.1 Air cargo logistics chain In this this section the role of KLM Cargo in the whole air cargo logistics chain is described. In the figure below the logistic air cargo logistic chain is presented. KLM Cargo is involved from both sides. The hub in Amsterdam could be the start or destination of air shipments. To avoid ambiguities, air cargo includes almost anything that people wish to transport by airplane. Luggage of passengers is not considered as cargo. Cargo could be for example cars, mobile phones, food, flowers and computers. A cargo handling service can be defined as: “loading, unloading, packing or unpacking of cargo and includes cargo handling services provided for freight in special containers or for non-containerized freight, services provided by a container freight terminal or nay other freight terminal, for all modes of transport and cargo handling services incidental to freight, but does not include handling of export cargo or passenger baggage or mere transportation of goods” (Ministry of Finance, Government of India, 2013). In chapter 3 the handling processes of the KLM and Menzies warehouses are elaborated. In figure 2 a general air cargo handling process from origin to destination is presented. The KLM and Menzies handling processes are quite similar to this general air cargo handling process. Terminology and processes in the air cargo market are explained on the basis of this figure. ‘Shippers’ or ‘consignors’ are the organizations who request a transporting service at the beginning of the air cargo logistic chain (Petersen, 2007). Most shippers have their own freight forwarder for transporting cargo to the air cargo handling warehouses of the handling agent, in this case KLM and Menzies. In addition, KLM and Martinair offer their shippers forwarding services by truck. A forwarder transports the cargo from the shipper to the airport of departure and delivers cargo from the destination airport to the ‘consignee’ (Petersen, 2007).
23
At the ‘cargo handling warehouses’ of the ‘cargo handlers’, trucks of ‘forwarders’ deliver the cargo. The term ‘cargo handling warehouse’ is well known in the airfreight industry. In this thesis is mainly the term ‘warehouse’ used to increase readability. KLM and Menzies are ‘ground handling agents’ responsible for ground handling to prepare cargo for a flight according to international safety standards (IATA Cargo, 2010). In addition, Menzies and KLM handle cargo of incoming flights and handle the cargo in such a way that cargo can be transferred on either a truck or airplane. KLM and Martinair Cargo are air cargo ‘carriers’ because they transport air cargo from airport to airport (Petersen, 2007).
1.6.2 Air cargo market growth analysis The market growth is an important analysis for this thesis, since assumptions and recommendations are based on the size of the air cargo market. KLM Cargo partly base their expectations about the market growth on analysis from the International Air Transport Association (IATA). For 2013 does KLM expects a slight improvement in air cargo market (KLM Cargo, 2013). In addition, a Dutch financial newspaper describes on the 17th of October that cargo handling in September 2013 increased with 4,3% compared to the same month one year before (Koster, 2013). This trend is expected to continue in the coming months. For that reason, in this thesis is assumed that for the coming months the cargo demand at KLM Cargo will remain or increase.
1.6.3 Transform 2015 AF-KL-MP Cargo experience difficult economic times. In 2012, AF-KL-MP Cargo made a loss of 222 million euros (AF-KL annual report, 2013). Thereof, KL-MP Cargo contributed about 84 million euros of this loss (AF-KL annual report, 2013). If KLM Cargo does not restructure current working processes and continues as is, losses will rise to 150 million euros in 2013 (van Harten, 2013). To organize necessary structural adjustments, the program ‘Transform 2015’ started in January 2012 (Air France- KLM, 2011). Transform aims to reduce costs and increase profits by improving cooperation within AF-KL-MP (Air France, 2013). Therefore ‘Transform 2015’ is considered as a lifeline to a profitable future. According to CEO of KLM are these reforms on track (Eurlings, 2013).
Figure 2. General air Cargo Handling Process (Petersen, 2007, p. 7)
24
One of the Transform 2015 project had an influence on this research. The ‘One Airway Bill’ project was introduced on the first of May 2013. From then the financial, commercial and operational processes of KLM and Martinair Cargo are almost completely integrated and aligned. Martinair will operate according to the KLM processes and work with the KLM ICT systems (Spoor, 2013). From the first of May, customers could only book at KLM Cargo. ‘One face to the customer’ is the idea (AF-KL Cargo Web Academy, 2013). Bart Krol (2013), project manager KLM Cargo, explains that this has advantages for the commercial departments of KLM Cargo. This ‘One Airway Bill’ project resulted that KLM could decide to transport cargo on the flights which are beneficial for KLM. For this change, Menzies had to adjust processes as well. The Menzies ICT systems are aligned to the KLM systems and processes. Furthermore, Dutch customs recognize the both warehouse locations are one customs area whereby KL-MP Cargo can transfer cargo between KLM and Menzies freely without many time consuming documentation requirements to customs as before the first of May. Although customers can only book at KLM Cargo, Martinair Cargo remains an operating carrier. This is because Martinair has the vested right to transport cargo between two foreign airports other than Schiphol. In contrary, KLM can transport cargo to and from Schiphol only.
1.6.4 Decision Support Systems
KLM Cargo is in need of Decision Support System (DSS) to support decisions on cargo flow allocations at Schiphol. In this section a literature review on these systems is presented. A DSS is one of the Decision Making Support Systems (DMSS) that: “interactively support the decision making process of individuals and groups in life, public, and private organizations, and other entities” (Zaraté, 2013). DSS can be roughly defined as: “interactive computer-based systems that aid users in judgment and choice activities” (Druzdzel & Flynn, 2002, p. 3). Because of the integrated computing environment it could help in complex decision making. Druzdzel & Flynnn (2002) describe that a DSS is especially valuable in situations where the amount and complexity of information is hard to structure in a way that a human can make a well-structured decision. The need to improve human decision making resulted in a variety of modeling tools in different disciplines as operations research, decision analysis, economics and decision theory (Druzdzel & Flynn, 2002). Modeling tools in these disciplines are based on mathematical methods. Variables of the system are expressed by formulas. KLM Cargo Operations is in need of a scenario analysis. A scenario analysis is seen as a method of economics and operations research (Druzdzel & Flynn, 2002). Operations research (OR) emerged due to rising complexity and specialization in organizations (Hillier & Lieberman, 2009). According to Reeb and Leavengood (1998, p. 1) is OR “concerned with scientifically deciding how to best design and operate man-machine systems, usually under conditions requiring the allocation of scarce resources”. Linear Programming (LP) is a popular DSS. LP is an optimal decision making tool in which the objective is a linear function and the constraints on the optimal decision problem are linear equalities and inequalities (Hillier & Lieberman, 2009). From the mathematical formulation of the business problem in chapter 4 can be derived that the business problem of KLM Cargo Operations could be described with linear functions. A LP model that consist of this linear functions, could contribute to valuable insights on the impact on financial KLM KPIs of different cargo flow allocation scenarios. Therefore, LP is selected in this research as methodology to present the scenario analysis. In appendix C multiple methodologies that could be applicable for these research but are not selected are elaborated.
25
1.7 Research questions and methodologies In order to achieve the objective of this research, a main research question and research questions are established. The structure of this research will make use of a bottom-up approach. As can be seen in the figure below observations from the project at KLM Cargo are used to develop a scientific theory on the optimal cargo allocation at Schiphol.
1.7.1 Research questions In this part the main research and research questions are presented. The research questions are answered in the preliminary conclusion of each chapter. The main research question of this research is:
MRQ: How could the net costs for KLM Cargo Operations be minimized by adjusting the cargo flow allocation of KLM and Martinair cargo flows between KLM and Menzies warehouses at Schiphol?
Chapter 2: Actor analysis The important actors for this business problem are presented. By answering the following question the actors that require close attention are defined.
RQ: Which actors require close attention while adjusting the current cargo flow allocation at Schiphol?
Chapter 3: Cargo handling process at KLM Cargo A cargo flow allocation adjustment could affect processes in the cargo handling warehouses at Schiphol. In this chapter all interfaces with a cargo flow allocation at Schiphol are elaborated.
RQ: Which processes are influenced by a cargo flow allocation adjustment at Schiphol? Chapter 4: Conceptual model The structure of the model is presented in this chapter.
RQ: How could the business problem of KLM Cargo Operations be presented in a Linear Programming problem?
Chapter 5: Designing a Decision Support System Based on the KLM business problem and a literature review on DSS, a tool is selected.
RQ: Which DSS is preferred for the scenario analysis of KLM Cargo Operations? Chapter 6: Model Validation & Verification Before the scenario analysis can be performed this research question needs to be answered:
RQ: To which extent does the model present a valid representation of the reality? Chapter 7: Scenario analysis In this chapter multiple cargo flow allocation scenarios are compared.
RQ: How could the current cargo flow allocation between KLM and Menzies be optimized according to the DSS, taken into account the impact on external actors?
26
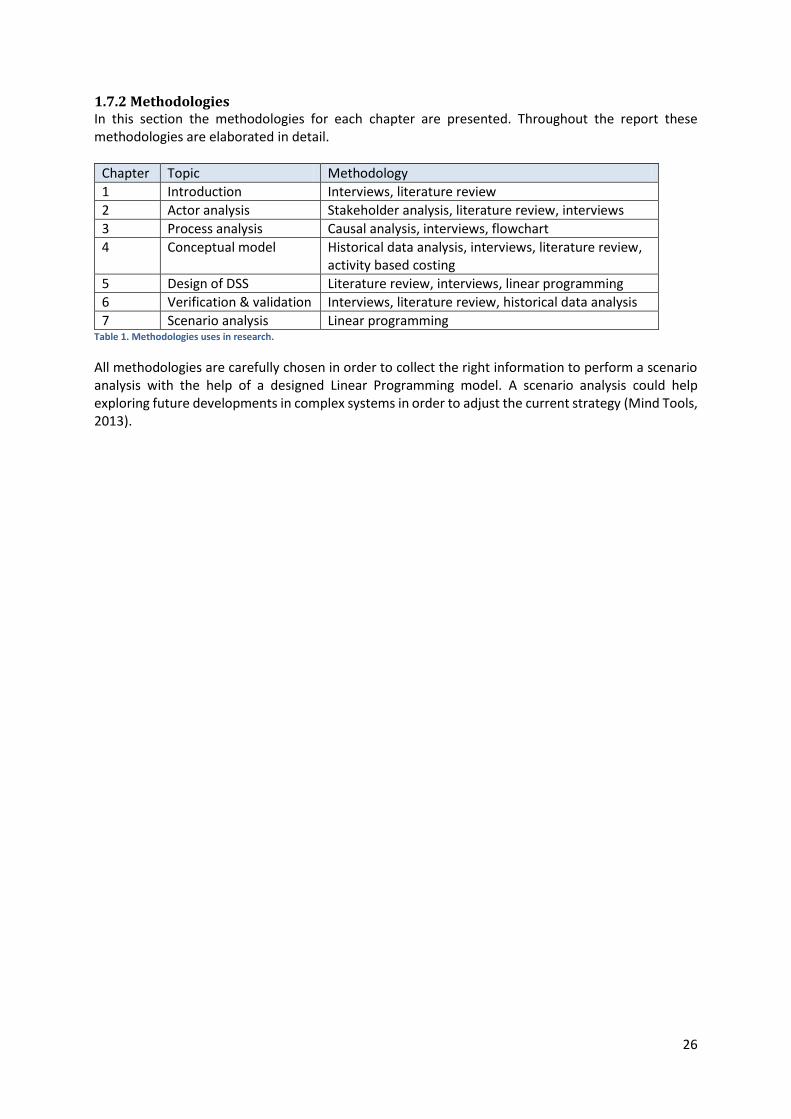
1.7.2 Methodologies In this section the methodologies for each chapter are presented. Throughout the report these methodologies are elaborated in detail.
Chapter Topic Methodology
1 Introduction Interviews, literature review
2 Actor analysis Stakeholder analysis, literature review, interviews
3 Process analysis Causal analysis, interviews, flowchart
4 Conceptual model Historical data analysis, interviews, literature review, activity based costing
5 Design of DSS Literature review, interviews, linear programming
6 Verification & validation Interviews, literature review, historical data analysis
7 Scenario analysis Linear programming Table 1. Methodologies uses in research.
All methodologies are carefully chosen in order to collect the right information to perform a scenario analysis with the help of a designed Linear Programming model. A scenario analysis could help exploring future developments in complex systems in order to adjust the current strategy (Mind Tools, 2013).
27
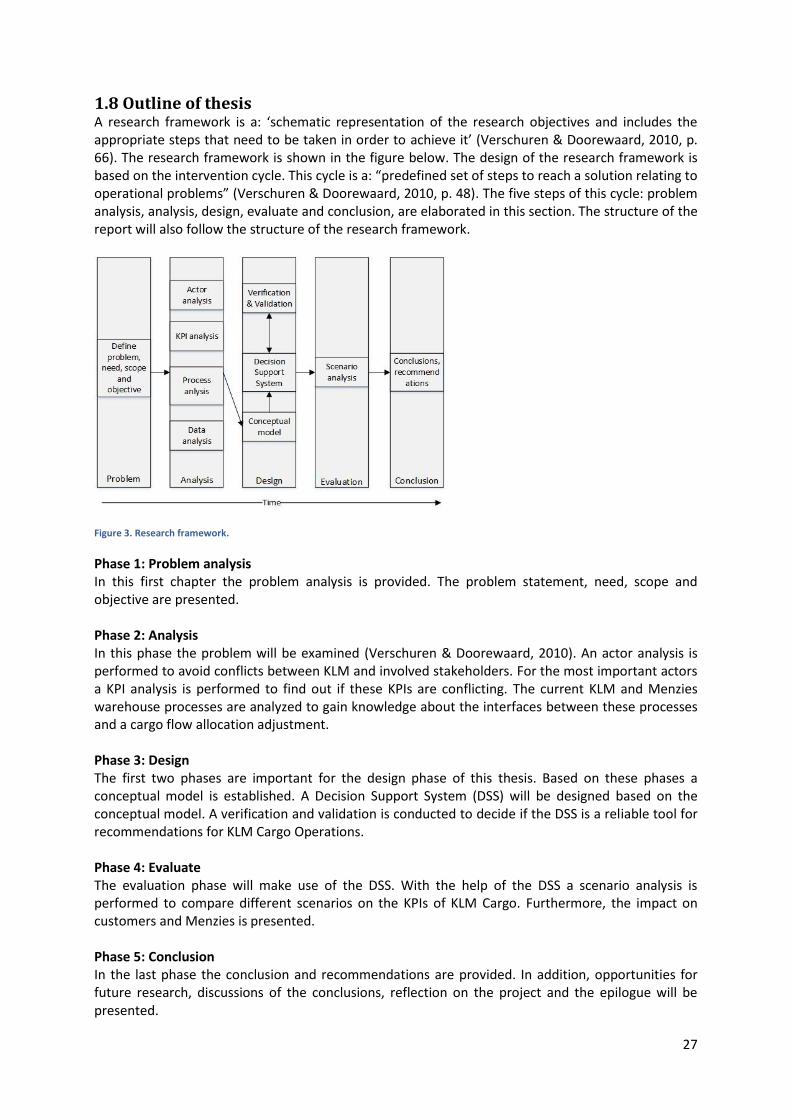
1.8 Outline of thesis A research framework is a: ‘schematic representation of the research objectives and includes the appropriate steps that need to be taken in order to achieve it’ (Verschuren & Doorewaard, 2010, p. 66). The research framework is shown in the figure below. The design of the research framework is based on the intervention cycle. This cycle is a: “predefined set of steps to reach a solution relating to operational problems” (Verschuren & Doorewaard, 2010, p. 48). The five steps of this cycle: problem analysis, analysis, design, evaluate and conclusion, are elaborated in this section. The structure of the report will also follow the structure of the research framework.
Figure 3. Research framework.
Phase 1: Problem analysis In this first chapter the problem analysis is provided. The problem statement, need, scope and objective are presented. Phase 2: Analysis In this phase the problem will be examined (Verschuren & Doorewaard, 2010). An actor analysis is performed to avoid conflicts between KLM and involved stakeholders. For the most important actors a KPI analysis is performed to find out if these KPIs are conflicting. The current KLM and Menzies warehouse processes are analyzed to gain knowledge about the interfaces between these processes and a cargo flow allocation adjustment. Phase 3: Design The first two phases are important for the design phase of this thesis. Based on these phases a conceptual model is established. A Decision Support System (DSS) will be designed based on the conceptual model. A verification and validation is conducted to decide if the DSS is a reliable tool for recommendations for KLM Cargo Operations. Phase 4: Evaluate The evaluation phase will make use of the DSS. With the help of the DSS a scenario analysis is performed to compare different scenarios on the KPIs of KLM Cargo. Furthermore, the impact on customers and Menzies is presented. Phase 5: Conclusion In the last phase the conclusion and recommendations are provided. In addition, opportunities for future research, discussions of the conclusions, reflection on the project and the epilogue will be presented.

28
Part 2: Analysis
29
2. Actor analysis In this chapter the involved actors of the KLM business problem are described. First the intern actors are elaborated. External actors could use blocking power when changing processes do not match their interest. The way these external actors could influence the success of the project depends on the extent of power they have. To ensure that eventual problems are avoided in advance, the external actors: Menzies Aviation, customers and Dutch customs are analyzed in depth by a stakeholder analysis. Schiphol is not considered as a stakeholder in this problem. Schiphol does not have interest in the KL-MP cargo flow allocation or the power to influence these cargo flows. In this chapter the following research question is answered:
Which actors require close attention while adjusting the current cargo flow allocation at Schiphol?
2.1 Internal actors A cargo flow allocation adjustment impacts the working processes of the intern actors. The goals, activities and interest of intern actors on the cargo flow allocation are described in appendix E. These actors serve the interest of KLM. Therefore it is assumed that these actors have the same interest and will not use blocking power if processes need to be adjusted. For this research it is not essential to know the processes of different departments in depth. In this section the strategic influence of the KLM Group on the KLM Cargo Operations department is described. Thereafter, the Key Performance Indicators (KPIs) of KLM Cargo Operations are described.
2.1.1 KLM Group As described in the managerial scope, strategic influences of top level management are taken as is. In this part these influences of the KLM Group strategy on this research are described. ‘Keeping the family together’ As mentioned in the introduction is KLM operating in economic difficult times. KLM tries to limit the impact on the social dimension due the credit crisis. “Keeping the family together” is the motto used by KLM (2013). KLM prevents for forced lay-offs in the organization of 32.000 people. By not extending temporary contracts and natural attrition, is the organization becoming smaller. Vacancies are only filled internally and no people are hired from outside the company (KLM, 2013). In addition, KLM call for help at operational jobs with internal KLM staff to reduce cots to temporary staff. “Keeping the family together” impacts this research, since the recommendations of this research will not include a reduction in permanent KLM labor. Contribution of KLM and Martinair Cargo to the KLM Group According to the annual report of 2012 equals the loss of KLM Cargo 84 million in 2012. Nonetheless, KLM Cargo contributes to the positive business results of the Passenger business of KLM. Because KLM can transport cargo on each flight the Cargo business contributes to the Passenger business. Destinations flown with combined flights result that these flights are already full with half of the passengers. Furthermore, KLM could increase the frequency to certain destinations. Some destinations could be unprofitable if KLM could only fill the airplane with passengers. So despite the fact that Cargo makes losses, KLM Cargo does also contribute to profits at the Passenger business.
30
The freighter operation is important to be a serious player in the cargo market (Krol, 2013). Some cargo can only be sent with a freighter due to the size or weight of the shipments. It is important to keep the full freighter airplanes of Martinair Cargo in order to offer the customers freighter capacity. Mission of KLM Group In cooperation with Air France is KLM a leader in the European airline industry. Besides profit, the KLM Group strive for economic, social and community developments (KLM, 2013). Growth opportunities for Schiphol, quality for customers by offering a worldwide network and the local environment are also important aspects for the KLM Group to take into account. Vision of KLM Group KLM strives to be an innovative airline to fulfill customers’ needs before competitors do this (KLM, 2013). Strategic partnerships are chosen to effectively respond to market changes.
2.1.2 KPIs of KLM Cargo Operations
In this section the KPIs of KLM Cargo Operations are presented. KPIs can be defined as: “Both financial and non-financial, are an important component of the information needed to explain a company’s progress towards its stated goals, for all of these types of narrative reporting” (PriceWaterhouseCoopers, 2013, p. 3). The KPIs are important for multiple decisions in these research. The scenario analysis uses the KPIs to compared and score different cargo flow allocations. A cargo flow allocation adjustment will not impact all KPIs. Therefore only the KPIs that could be influenced by a cargo flow adjustment are presented. In appendix D, the KPIs are presented which are not influenced by a cargo flow allocation. Financial perspective KLM Cargo Operations is managed on costs. This means that KLM Cargo Sales is pursuing revenues and KLM Cargo Operations is trying to minimize costs. This is an interesting field of tension since Operations is often required to make higher costs in order to gain higher revenues for the Sales department. The KPI that is affected by a cargo flow allocation adjustment from a financial perspective is: ‘Cost price FB2&3 (inclusive revenues)’. KLM Cargo Operations can only obtain revenues by handling import cargo. On import flows import charges can be invoiced. Load factor fleet The load factor of the total fleet is an important KPI for KLM Cargo Operations. The load factor presents the percentage of cargo capacity used of an airplane. KLM Cargo Operations could contribute to an optimal load factor by optimally building Unit Load Devices (ULDs). People & internal processes The ‘people & internal processes’ are separated in ten KPIs. For the cargo allocation problem, only one KPI is important: ‘Productivity of labor’. The productivity of the employees can be influenced by a different cargo flow allocation. This impact is presented in a causal analysis in chapter 3.1.The other nine KPIs are presented in appendix D. Customer Quality Customer quality is an important focus of KLM (AF-KL-MP Cargo, 2013). KLM wants to distinguish them from competitors on quality. The quality of cargo handling within the warehouse is based on the delivery as promised to customers. So, is the cargo delivered on time at the right place in the right condition? KPIs from a customer quality perspective are:
Flown as planned
Delivered as promised
31
A shipment is flown as planned (FAP) if the shipments is carried on the airplane as promised to the customer. A shipment is delivered as promised (DAP) if the shipment is delivered at the right place and the right location as promised to the customer. According to Jos Bakker (2013), Quality Manager at KLM Cargo Operations, could a cargo flow allocation adjustment impact the FAP and DAP. This could be explained by increasing complexity or additional processes in the normal working environment by a cargo flow allocation adjustment.
2.2 External actors In this section an actor analysis is performed on the extern actors involved with the business problem. This analysis is important to foresee eventual conflicts with actors caused by adjustments in current working processes. The extern actors require a more in depth analysis than the intern actors since resistance from these extern actors could result in severe consequences for the KLM business results. Therefore, in this section is also described how these eventual conflicts could be avoided.
2.2.1 Literature review: Actor analysis methodology Many different actor analyses methods are available to gain understanding about involved actors. Hermans & Thissen (2009) elaborate on different actor analysis methods to help public policy analyst to choose a methodology applicable to their problem. They stress that there are important differences between the methods and therefore a methodology should be carefully chosen for each problem. The actor analysis methodology should present the essential elements of multi-actor processes without unnecessary difficult or complex techniques.
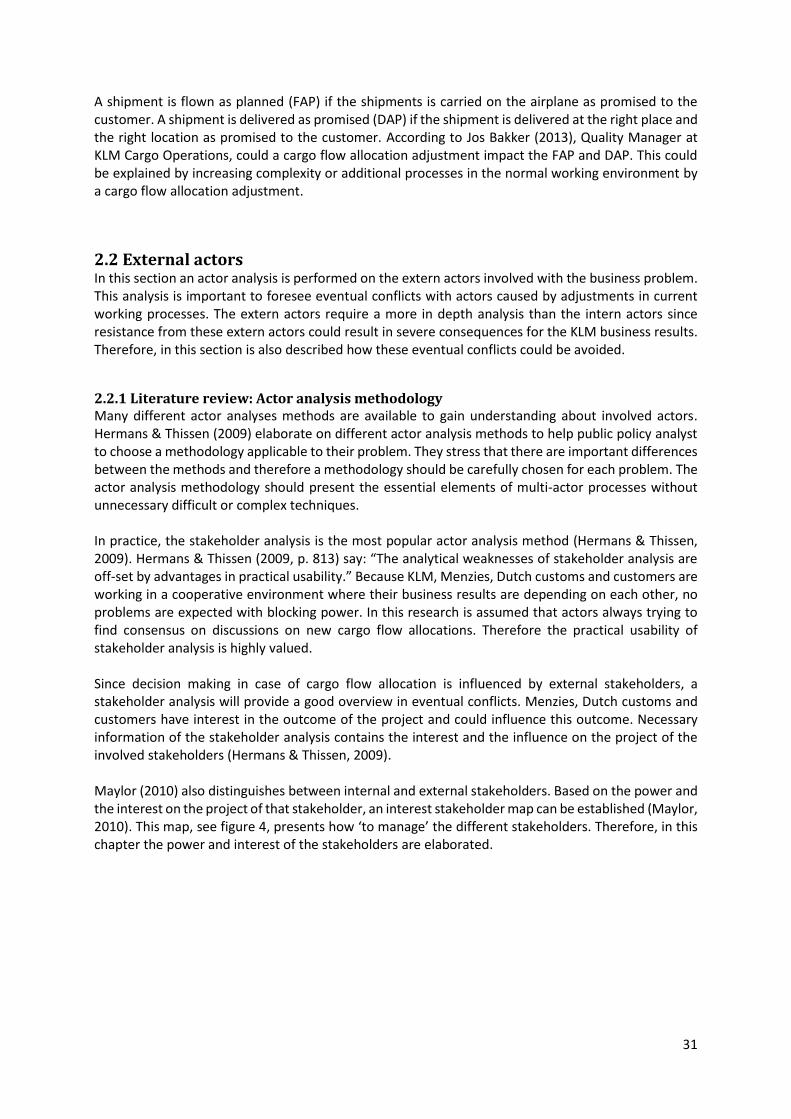
In practice, the stakeholder analysis is the most popular actor analysis method (Hermans & Thissen, 2009). Hermans & Thissen (2009, p. 813) say: “The analytical weaknesses of stakeholder analysis are off-set by advantages in practical usability.” Because KLM, Menzies, Dutch customs and customers are working in a cooperative environment where their business results are depending on each other, no problems are expected with blocking power. In this research is assumed that actors always trying to find consensus on discussions on new cargo flow allocations. Therefore the practical usability of stakeholder analysis is highly valued. Since decision making in case of cargo flow allocation is influenced by external stakeholders, a stakeholder analysis will provide a good overview in eventual conflicts. Menzies, Dutch customs and customers have interest in the outcome of the project and could influence this outcome. Necessary information of the stakeholder analysis contains the interest and the influence on the project of the involved stakeholders (Hermans & Thissen, 2009). Maylor (2010) also distinguishes between internal and external stakeholders. Based on the power and the interest on the project of that stakeholder, an interest stakeholder map can be established (Maylor, 2010). This map, see figure 4, presents how ‘to manage’ the different stakeholders. Therefore, in this chapter the power and interest of the stakeholders are elaborated.
32
Figure 4. Interest stakeholder map (Maylor, 2010, p. 108).
From this literature review can be derived that for this business problem a stakeholder analysis would be an interesting method to analyze the actor field. Since blocking power of extern actors is not expected the practical usability of the stakeholder analysis is highly valued. For Menzies, Customers and Dutch customs the power and interest are analyzed.
2.2.2 Menzies Aviation When KLM in 2008 became the sole shareholder of Martinair, Menzies was already the cargo handler of Martinair. As described before is the cargo handling capacity of KLM Cargo not sufficient for handling cargo of both KLM and Martinair. Since KLM wants to maintain the same or larger market share and do not want to expand their warehouse capacity, KLM is in need of a third party for cargo handling. Air Menzies International is trustworthy cargo handler with a worldwide network of 132 stations in 30 countries (Menzies Aviation, 2013). At Schiphol Airport, Menzies handles cargo of 60 different air cargo carriers (Menzies Aviation NL, 2013). Thereof is Martinair Cargo one of the biggest customers for Menzies with handling 3.500 tons/week in July 2013 (Out, 2013). Because of the large worldwide network, Menzies is an interesting strategic partner for KLM Cargo. By cooperation at the hub in the Netherlands, price agreements can be made for outstations over the world as well. If KLM cooperates with one strategic partner cost reductions can be obtained worldwide (Krol, 2013). Menzies is responsible of handling AF-KL-MP Cargo flights in multiple outstations. KPIs of Menzies The KPIs of Menzies Aviation concerned with ground handling are derived from the annual report 2010 of Menzies (John Menzies plc, 2010). The KPIs of Menzies concerned with ground handling are:
1. Ground handling- labor hours per turn 2. Ground handling- on-time-performance 3. Cargo handling- tonnage per FTE
Setting a high priority to on-time-performance could ensure a reliable cargo handling. Because agreements on processes are contracted, little problems are expected on quality with cargo handling at Menzies (Krol, 2013). So, there can be assumed that the quality of cargo handling at Menzies equals the quality of handling cargo in the KLM warehouse. Reducing labor hours per turn and tonnage per Fulltime-Equivalent (FTE) could impact the quality of cargo handling at Menzies. These KPIs could be summarized as KPIs for: ‘productivity’. Menzies favors a situation in which less employees are required for the same amount of cargo handling. A cargo flow
33
allocation adjustment could affect the productivity of Menzies. The total amount of handled cargo at Menzies and the ease of handling this amount of cargo, will affect the productivity. In appendix D, the KPIs of the Menzies group are presented. Obviously an important KPI concerned with a cargo flow allocation adjustment is: ‘revenues’. Revenues at Menzies are obtained by additional cargo handling, additional import flows and a higher handling tariff. A higher productivity at Menzies will indirectly influence the revenues. Power According to Jan Schroder (2013), Controller Martinair, is the take-over of Martinair seen by Menzies as a threat. Before the takeover was Martinair for 100% handled at Menzies. The allocation adjustment of the inbound MP Asia flight, resulted in a significant loss of handled cargo at Menzies. Because Martinair is the largest customer of Menzies, KLM has a relatively high power in negotiations. Nevertheless, the relationship between KLM and Menzies is important for KLM Cargo because of two reasons. First the processes of Martinair and Menzies are interwoven and therefore is this partnership not easily ended. Second, KLM wants to establish a long term relationship with Menzies worldwide in order to improve quality. Menzies is aware of these two aspects and is therefore not powerless. Interest The interest of Menzies in a cargo flow allocation is high. Since Martinair is the largest customer of Menzies these changes could have major impact on the KPIs of Menzies.
2.2.3 Customers Menzies cargo handling warehouse is located at Schiphol East. The warehouse of KLM Cargo is located at Schiphol center. A cargo flow allocation adjustment could influences the handling processes of customers since customers, agents and other involved actors are mostly located at Schiphol East. KLM and Menzies could transport cargo over the platform in 35 minutes (Osinga, 2013). Customers are not allowed to drive on the platform and should therefore drive on public roads which takes almost two hours. There are many different customers with all different processes. The impact of a cargo flow allocation could differ for every customer. How these adjustment impact the customers requires a lot of additional research. Therefore, additional research needs to be conducted on the impact of different cargo flow allocations on customers. Power Customers are powerful because multiple air cargo carriers can be selected to carry their air freight. Interest Most customers of KL-MP Cargo are located at Schiphol East. A cargo flow allocation to Menzies could be beneficial for most customers. A cargo flow allocation to KLM could be negative for most customers. The interest about a cargo flow allocation could differ for the customers. The cargo flow allocation of the inbound Martinair flights from Asia resulted in a heavy discussion with a customer, DHL. To avoid this kind of problems, the interest of customers is considered high in this research.
34
2.2.4 Dutch customs For the analysis of customs is Maarten Blasse, Customs Compliance Manager at KLM Cargo, questioned. From of the first of May 2013 is KL-MP Cargo allowed to freely transfer cargo between the KLM and Menzies warehouse (Blasse, 2013). Important is lateral transport is only allowed if cargo continues on a connecting flight. So cargo handled at the Menzies warehouse could not be transported to the KLM warehouse to continue on a truck. Power If a cargo flow allocation is not preferred by Customs this could result in problems. Since customs is the ‘license to operate’ of KLM a good relation with customs is very important. Therefore the power on cargo flow allocation of Customs is considered high. Interest For customs it is important that they could check cargo if they want to (Blasse, 2013). So for them the communication about the location of cargo is the most important. If KLM Cargo ensures that customs can easily locate the cargo, no problems are expected. Therefore, the interest on how a cargo flow allocation is organized is low.
2.2.5 How to manage? In the table below the results of the stakeholder analysis are summarized. The priority and how to manage these actors are derived from the stakeholder map presented in figure 4 (Maylor, 2010).
Actor Power Interest Priority How to manage?
Menzies Medium High Highest Manage closely
Customers High High Highest Manage closely
Customs High Low Moderate Keep satisfied Table 2. How to manage stakeholders in this research.
From the stakeholder analysis can be derived that a cargo flow allocation could impact the processes of Menzies, customers and Dutch customs. If customs is informed well, there are no conflicts expected with this actor. As can be seen in the table above, Menzies and Customers have a high priority to keep satisfied. Therefore, the impact of a cargo flow allocation on these actors are described for each scenario in chapter 7.
2.3 Preliminary conclusions This section will answer the research question of this chapter:
Which actors require close attention while adjusting the current cargo flow allocation at Schiphol?
From the actor analysis can be derived that customers and Menzies need special attention if the current cargo flow allocation at Schiphol is adjusted. A cargo allocation adjustment can impact their business results and processes. Furthermore, they have the power to impact the KLM KPIs. Therefore, it is important for KLM to keep these actors satisfied.
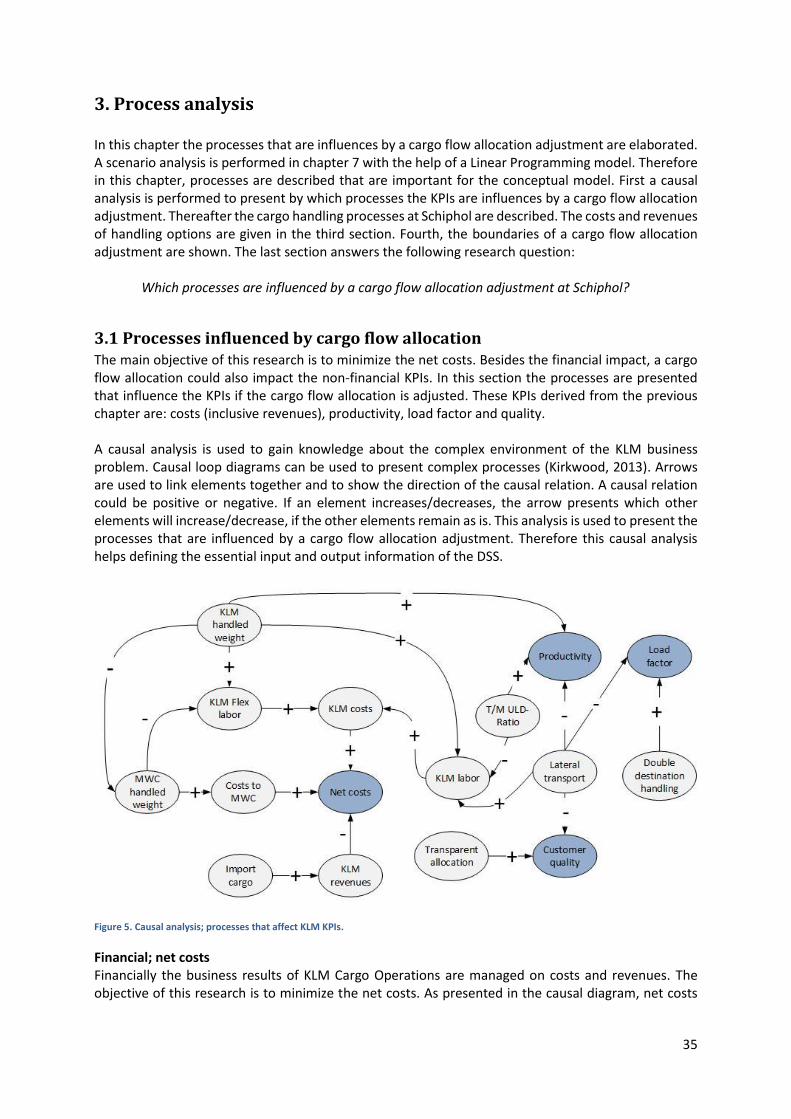
35
3. Process analysis In this chapter the processes that are influences by a cargo flow allocation adjustment are elaborated. A scenario analysis is performed in chapter 7 with the help of a Linear Programming model. Therefore in this chapter, processes are described that are important for the conceptual model. First a causal analysis is performed to present by which processes the KPIs are influences by a cargo flow allocation adjustment. Thereafter the cargo handling processes at Schiphol are described. The costs and revenues of handling options are given in the third section. Fourth, the boundaries of a cargo flow allocation adjustment are shown. The last section answers the following research question:
Which processes are influenced by a cargo flow allocation adjustment at Schiphol?
3.1 Processes influenced by cargo flow allocation The main objective of this research is to minimize the net costs. Besides the financial impact, a cargo flow allocation could also impact the non-financial KPIs. In this section the processes are presented that influence the KPIs if the cargo flow allocation is adjusted. These KPIs derived from the previous chapter are: costs (inclusive revenues), productivity, load factor and quality. A causal analysis is used to gain knowledge about the complex environment of the KLM business problem. Causal loop diagrams can be used to present complex processes (Kirkwood, 2013). Arrows are used to link elements together and to show the direction of the causal relation. A causal relation could be positive or negative. If an element increases/decreases, the arrow presents which other elements will increase/decrease, if the other elements remain as is. This analysis is used to present the processes that are influenced by a cargo flow allocation adjustment. Therefore this causal analysis helps defining the essential input and output information of the DSS.
Figure 5. Causal analysis; processes that affect KLM KPIs.
Financial; net costs Financially the business results of KLM Cargo Operations are managed on costs and revenues. The objective of this research is to minimize the net costs. As presented in the causal diagram, net costs
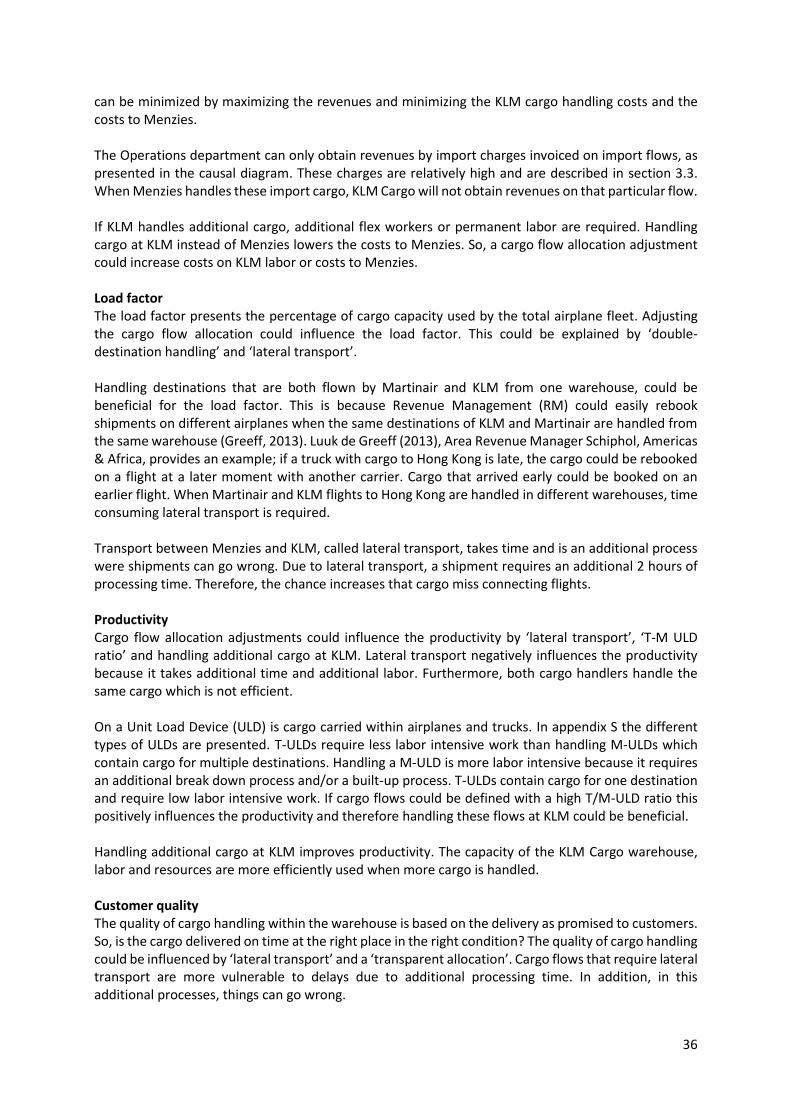
36
can be minimized by maximizing the revenues and minimizing the KLM cargo handling costs and the costs to Menzies. The Operations department can only obtain revenues by import charges invoiced on import flows, as presented in the causal diagram. These charges are relatively high and are described in section 3.3. When Menzies handles these import cargo, KLM Cargo will not obtain revenues on that particular flow. If KLM handles additional cargo, additional flex workers or permanent labor are required. Handling cargo at KLM instead of Menzies lowers the costs to Menzies. So, a cargo flow allocation adjustment could increase costs on KLM labor or costs to Menzies. Load factor The load factor presents the percentage of cargo capacity used by the total airplane fleet. Adjusting the cargo flow allocation could influence the load factor. This could be explained by ‘double- destination handling’ and ‘lateral transport’. Handling destinations that are both flown by Martinair and KLM from one warehouse, could be beneficial for the load factor. This is because Revenue Management (RM) could easily rebook shipments on different airplanes when the same destinations of KLM and Martinair are handled from the same warehouse (Greeff, 2013). Luuk de Greeff (2013), Area Revenue Manager Schiphol, Americas & Africa, provides an example; if a truck with cargo to Hong Kong is late, the cargo could be rebooked on a flight at a later moment with another carrier. Cargo that arrived early could be booked on an earlier flight. When Martinair and KLM flights to Hong Kong are handled in different warehouses, time consuming lateral transport is required. Transport between Menzies and KLM, called lateral transport, takes time and is an additional process were shipments can go wrong. Due to lateral transport, a shipment requires an additional 2 hours of processing time. Therefore, the chance increases that cargo miss connecting flights. Productivity Cargo flow allocation adjustments could influence the productivity by ‘lateral transport’, ‘T-M ULD ratio’ and handling additional cargo at KLM. Lateral transport negatively influences the productivity because it takes additional time and additional labor. Furthermore, both cargo handlers handle the same cargo which is not efficient. On a Unit Load Device (ULD) is cargo carried within airplanes and trucks. In appendix S the different types of ULDs are presented. T-ULDs require less labor intensive work than handling M-ULDs which contain cargo for multiple destinations. Handling a M-ULD is more labor intensive because it requires an additional break down process and/or a built-up process. T-ULDs contain cargo for one destination and require low labor intensive work. If cargo flows could be defined with a high T/M-ULD ratio this positively influences the productivity and therefore handling these flows at KLM could be beneficial. Handling additional cargo at KLM improves productivity. The capacity of the KLM Cargo warehouse, labor and resources are more efficiently used when more cargo is handled. Customer quality The quality of cargo handling within the warehouse is based on the delivery as promised to customers. So, is the cargo delivered on time at the right place in the right condition? The quality of cargo handling could be influenced by ‘lateral transport’ and a ‘transparent allocation’. Cargo flows that require lateral transport are more vulnerable to delays due to additional processing time. In addition, in this additional processes, things can go wrong.
37
Customers need to deliver their cargo at the warehouse where the airplane departs and pick-up cargo from the warehouse where the airplane arrives. A non-transparent allocation could increase trucking problems. Trucking problems could have a negative impact on the load factor if cargo is delivered after the deadline. In addition, customer satisfaction will decrease. Customers are used that all KLM flights arrive and depart from the KLM cargo warehouse. If this situation changes this could increase confusion among customers.
3.2 Cargo handling processes at Schiphol A cargo flow could be allocated to KLM, Menzies or both. To understand the consequences of cargo flow allocations, more insight on the handling processes within the warehouse is presented. In addition cooperation between Menzies and KLM cargo handling warehouses is shown.
3.2.1 KLM cargo handling warehouse
In this section the processes in the warehouse of KLM Cargo at Schiphol are described. In appendix F the processes in these buildings are elaborated in depth. In this section the most important findings from the process handling analysis are presented. In Freight Building (FB) 2, cargo is handled from an airplane into a truck into Europe, called ‘Europort’. At FB3 trucks deliver their cargo which is carried by airplane into the world, called ‘Worldport’. KLM Cargo freight buildings are not separated by a wall and therefore cargo can be easily transported between the buildings. Import, export and transit flows The different type of flows are presented in the figure below. In this part the differences between these flows are elaborated. Cargo that arrives at the warehouse by airplane or truck is called inbound cargo. Cargo that is handled in a warehouse and continues on an airplane or truck is called outbound cargo.
Import flow All cargo with destination ‘Amsterdam’ and transported from out of the Netherlands is considered ‘import’. If the destination is ‘Amsterdam’ this means that cargo is collected by the customer at the KLM cargo handling warehouse. Export flow All cargo that is delivered by the customer at the KLM warehouse and with a destination out of the Netherlands is considered ‘export’. Transit flow on trucks As can be seen in figure 6, KLM makes a distinction between Europe trucks and Amsterdam trucks. Transit flows on a truck involves a KLM truck to or from an origin or
destination in Europe. KLM is responsible for this transport within Europe because the cargo is carried in trucks of KLM Cargo. Because KLM wants to optimize the processes of the Europe truck fleet, additional processes within the warehouse are often required. Therefore, transit flows on trucks are considered more labor intensive work than import and export flows.
Figure 6. Cargo flows within KLM warehouse.
38
Transit flow on airplanes Transit cargo flows are flows with an origin and destination that is not Amsterdam. A cargo flow that arrives at FB2 and continues on an airplane handled by FB3 is defined as a transit cargo flow on airplanes. Because both FB2 and FB3 handle the cargo, this flow is considered more labor intensive work than import and export flows. Cargo handling at KLM KLM Cargo warehouse is built for handling two types of ULDs: Throughput (T)-ULDs and Mixed (M) - ULDs. In this section the involved processes are elaborated. In addition, the distinction between handled and carried tons is elaborated. Handling Mixed-ULDs M-ULDs contain cargo for multiple destinations (d'Engelbronner, 2012). An outstation was not able to build one ULD for one destination. Mixed ULDs need to be broken down when arriving at the warehouse because of the multiple destinations on one ULD. The break-down and built-up process are shown in figure 6. In a break-down process are different shipments are separated from an ULD into ‘loose cargo’. The different shipments are placed at a buffer for its destination. When the cargo continues on an airplane or Europe truck, a new ULD need to be built. In a built-up process is loose cargo collected and built-up on an ULD. These processes are only applicable when an ULD contains cargo for multiple destinations. Handling Throughput-ULDs T-ULDs are optimally built according to the dimension restrictions of KLM Cargo. A T-ULD does not need to be broken down when arriving at the warehouse and build up again when leaving the warehouse. When a T-ULD arrives, this ULD does not require handling in the warehouse and goes through the Pallet & Container Handling System (PCHS). FB2 and FB3 are vertically divided in cargo handling by employees on the ground and the PCHS in the roof. The PCHS is a large storage room for ULDs ready for transport by truck or airplane. Automatically a trigger is send when a truck or airplane departs so that an ULD needs to go out of the system. These T-ULDs are beneficial for the productivity of the KLM warehouse because this process is less labor intensive than the break-down and built-up of Mixed ULDs. Handled and carried tons In the KLM warehouse the term ‘handled tons’ is used to define the workload of the KLM warehouse. Import flows only require break down process of ULDs. Export flows only require a built-up process of ULDs. Transit flows could require both break-down and built-up processes. Therefore, handling a transit flow is considered more labor intensive work than handling import and export flows. To calculate the handled tons, the transit flows are twice the actual carried tons. The handled tons of import and export flows equal the amount of carried tons. Combined-flight handling Cargo handling of a combined-flight has two consequences that differ from full freighter cargo handling. Combined passenger/cargo flights have a strict flight schedule and stricter safety requirements compared to full-freighters. Flight schedule Flying according to a strict flight schedule has a few advantages. For KLM Cargo Operations it creates transparency for all departments. To give an example, planners of a flight may assume that flights arrive on time and could therefore already plan cargo on connection flights. For full freighters the chance on delay is higher and requires that employees are aware of these potential delays.
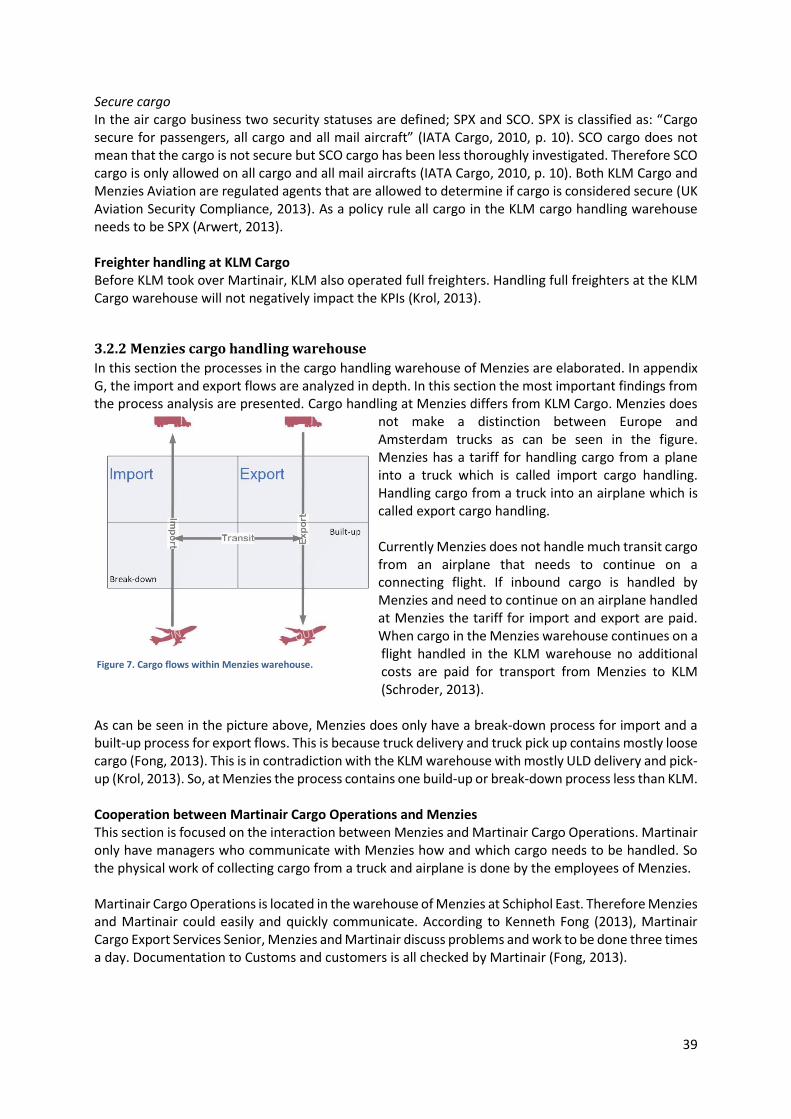
39
Secure cargo In the air cargo business two security statuses are defined; SPX and SCO. SPX is classified as: “Cargo secure for passengers, all cargo and all mail aircraft” (IATA Cargo, 2010, p. 10). SCO cargo does not mean that the cargo is not secure but SCO cargo has been less thoroughly investigated. Therefore SCO cargo is only allowed on all cargo and all mail aircrafts (IATA Cargo, 2010, p. 10). Both KLM Cargo and Menzies Aviation are regulated agents that are allowed to determine if cargo is considered secure (UK Aviation Security Compliance, 2013). As a policy rule all cargo in the KLM cargo handling warehouse needs to be SPX (Arwert, 2013). Freighter handling at KLM Cargo Before KLM took over Martinair, KLM also operated full freighters. Handling full freighters at the KLM Cargo warehouse will not negatively impact the KPIs (Krol, 2013).
3.2.2 Menzies cargo handling warehouse
In this section the processes in the cargo handling warehouse of Menzies are elaborated. In appendix G, the import and export flows are analyzed in depth. In this section the most important findings from the process analysis are presented. Cargo handling at Menzies differs from KLM Cargo. Menzies does
not make a distinction between Europe and Amsterdam trucks as can be seen in the figure. Menzies has a tariff for handling cargo from a plane into a truck which is called import cargo handling. Handling cargo from a truck into an airplane which is called export cargo handling. Currently Menzies does not handle much transit cargo from an airplane that needs to continue on a connecting flight. If inbound cargo is handled by Menzies and need to continue on an airplane handled at Menzies the tariff for import and export are paid. When cargo in the Menzies warehouse continues on a flight handled in the KLM warehouse no additional costs are paid for transport from Menzies to KLM (Schroder, 2013).
As can be seen in the picture above, Menzies does only have a break-down process for import and a built-up process for export flows. This is because truck delivery and truck pick up contains mostly loose cargo (Fong, 2013). This is in contradiction with the KLM warehouse with mostly ULD delivery and pick-up (Krol, 2013). So, at Menzies the process contains one build-up or break-down process less than KLM. Cooperation between Martinair Cargo Operations and Menzies This section is focused on the interaction between Menzies and Martinair Cargo Operations. Martinair only have managers who communicate with Menzies how and which cargo needs to be handled. So the physical work of collecting cargo from a truck and airplane is done by the employees of Menzies. Martinair Cargo Operations is located in the warehouse of Menzies at Schiphol East. Therefore Menzies and Martinair could easily and quickly communicate. According to Kenneth Fong (2013), Martinair Cargo Export Services Senior, Menzies and Martinair discuss problems and work to be done three times a day. Documentation to Customs and customers is all checked by Martinair (Fong, 2013).
Figure 7. Cargo flows within Menzies warehouse.
40
Truck handling Agreements with trucking and airfield outstations is coordinated from KLM Cargo. For Martinair flights at Menzies the delivery and pick-up with trucks is mostly loose cargo. Menzies is able to handle palletized cargo as well. If Martinair flights are handled at the KLM Cargo warehouse the outstations preferable change their delivery and receiving process into ULD handling. Menzies score on ‘Load factor’ The load factor of airplanes handled by Menzies cannot be contributed to Menzies (van Zijl, 2013). This is because Martinair Cargo Operations communicates to Menzies which cargo needs to be built upon a ULD. Martinair decides which cargo is send with the airplane. Since Menzies is good in building ULDs, the load factor is fully contributed to Martinair. Therefore can be assumed that handling cargo at Menzies will not negatively influence the load factor of airplanes. The full freighter airplanes of Martinair carry much more cargo than the combined-flights of KLM. Because of this larger volume there is a larger playing field to optimize a flight. So could some ULDs be heavier than restricted if other ULDs are below the guidelines (Fong, 2013). According to Kenneth Fong (2013), Export Services Senior, it could be beneficial to handle all freighters from one location in order to become an expert in the optimization of the load factor of a full freighter. Menzies score on ‘Quality’ The delivery of cargo before departure at Menzies is three hours longer than at KLM. The processing time of KLM is faster and therefore customers could deliver their cargo at a later moment than at Menzies. Menzies is not a cargo carrier and therefore it does not contain information on the FAP and DAP (Todtenhaupt, 2013). An agreement between Menzies and Martinair is a maximum failure rate of 1% (Fong, 2013). This means that 1 out of 100 shipments could go wrong. This failure rate is acceptable because this failures also occur in the KLM Cargo warehouse (Krol, 2013). Combined passenger/cargo flights at Menzies Menzies is not allowed to pick up cargo from a KLM flight (Blasse, 2013).When Menzies would handle KLM flights at their warehouse, KLM should transport the cargo from the KLM airplane to Menzies. Or when an outbound KLM flight is handled at Menzies, KLM should transport the ULDs to the airplane. So, handling KLM flights at Menzies requires an additional process of transport cargo to and from Menzies. Freighter specialization at Menzies Martinair freighters are parked in front of the Menzies warehouse. Therefore, cargo could be quickly accepted at the Menzies warehouse. Handling the full freighters at Menzies has a few advantages. Unreliable flight schedules Martinair Cargo is able to adjust departure times, routes or could even cancel a flight when a flight turns out to be unprofitable (van Zijl, 2013). Therefore, Martinair could quickly respond to wishes from customers controlled from a central freighter desk (Martinair Cargo, 2013). Although these ad hoc decisions could raise profits and reduce costs, it has downsides for an organization as well. These changes could negatively affect the customer satisfaction. Ad hoc decisions could result in adjusted flight schedules. The Martinair organization is always aware of these potential changes. The organizational structure of Martinair is more flexible towards adjustments than KLM (van Zijl, 2013). Departments of KLM Cargo Operations do not expect these changes and could therefore result in problems with customers when they are not informed about ad hoc changes. Due to the size and the more clustered structure of KLM these changes need to be
41
informed to more departments. Therefore the chance of quality loss rises when these ad hoc decisions influence the normal working processes. Unsecure cargo As described in xx, should all cargo handled at KLM warehouse be secure. Cargo carried with Martinair freighters is not obliged to be SPX, but could be SCO (IATA Cargo, 2010). Unsecure cargo requires less costly checks and therefore it could be an advantage to keep all unsecure cargo at one warehouse. Currently most cargo through the Menzies warehouse is secure because outstations and Menzies check cargo on SPX level (Fong, 2013). KLM safety measures are stricter than safety measures of Martinair. This is because Martinair uses the handling books of airplane builders as Boeing and McDonnell Douglas (Fong, 2013). KLM develops their own handling books derived from the handling books of the construction companies. On each safety measure KLM uses an additional marge to be sure. Martinair uses all space available at an airplane to optimize the load factor. Labor KLM Cargo wants to deploy their employment optimally. The amount of labor is adjusted to the demand (de Jong, 2013). Because freighters could be delayed a lot of cargo could enter the warehouse on times labor is not sufficient. To keep this uncertainty at a third party creates less risk in deploying too much or to less employees at times a freighter is delayed. Martinair Cargo KLM Cargo offers point-to-point air cargo transport. This means flights from Amsterdam and back. Martinair offers shipments between airfield outstations. KLM Cargo as operating carrier is not allowed to offer these kind of shipments (Krol, 2013). All flights of Martinair contain three to six stops at multiple airfields. Between these airfields is cargo transported as well. In this research the focus is on which and from which origins and destinations the cargo arrives in Amsterdam.
3.2.3 Lateral Transport
KLM transports cargo to Menzies four times a day at set times, called ‘slots’ (Osinga, 2013). Head of KLM Cargo Transport, Merel Osinga (2013), explains that additional slots are not often required and only needed when cargo has a short connection time on a Martinair flight. A ride from KLM to Menzies and back takes about 35 minutes. The distance to Menzies is about the same as transport to an airplane of KLM. Although a ride from KLM to Menzies takes only 35 minutes, KLM assumes that lateral transport takes two hours (Osinga, 2013). Cargo that requires lateral transport is more sensitive for delays and could therefore impact the load factor (Greeff, 2013).
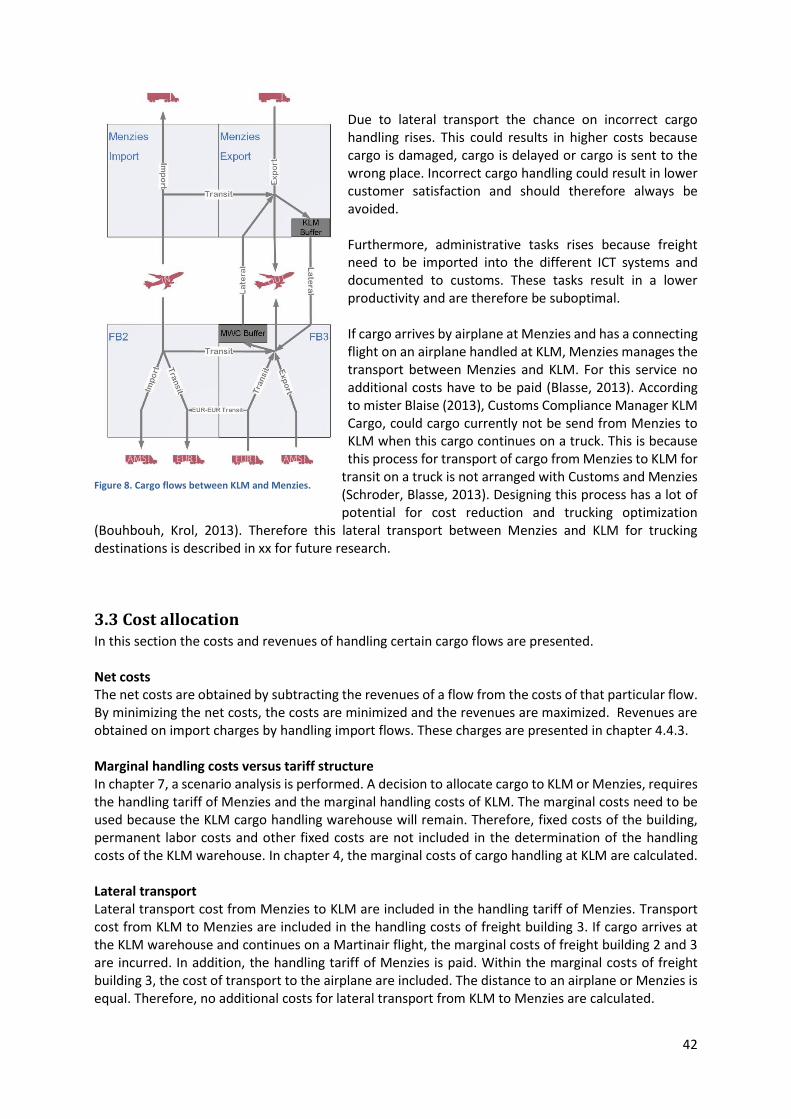
42
Due to lateral transport the chance on incorrect cargo handling rises. This could results in higher costs because cargo is damaged, cargo is delayed or cargo is sent to the wrong place. Incorrect cargo handling could result in lower customer satisfaction and should therefore always be avoided. Furthermore, administrative tasks rises because freight need to be imported into the different ICT systems and documented to customs. These tasks result in a lower productivity and are therefore be suboptimal. If cargo arrives by airplane at Menzies and has a connecting flight on an airplane handled at KLM, Menzies manages the transport between Menzies and KLM. For this service no additional costs have to be paid (Blasse, 2013). According to mister Blaise (2013), Customs Compliance Manager KLM Cargo, could cargo currently not be send from Menzies to KLM when this cargo continues on a truck. This is because this process for transport of cargo from Menzies to KLM for
transit on a truck is not arranged with Customs and Menzies (Schroder, Blasse, 2013). Designing this process has a lot of potential for cost reduction and trucking optimization
(Bouhbouh, Krol, 2013). Therefore this lateral transport between Menzies and KLM for trucking destinations is described in xx for future research.
3.3 Cost allocation In this section the costs and revenues of handling certain cargo flows are presented. Net costs The net costs are obtained by subtracting the revenues of a flow from the costs of that particular flow. By minimizing the net costs, the costs are minimized and the revenues are maximized. Revenues are obtained on import charges by handling import flows. These charges are presented in chapter 4.4.3. Marginal handling costs versus tariff structure In chapter 7, a scenario analysis is performed. A decision to allocate cargo to KLM or Menzies, requires the handling tariff of Menzies and the marginal handling costs of KLM. The marginal costs need to be used because the KLM cargo handling warehouse will remain. Therefore, fixed costs of the building, permanent labor costs and other fixed costs are not included in the determination of the handling costs of the KLM warehouse. In chapter 4, the marginal costs of cargo handling at KLM are calculated. Lateral transport Lateral transport cost from Menzies to KLM are included in the handling tariff of Menzies. Transport cost from KLM to Menzies are included in the handling costs of freight building 3. If cargo arrives at the KLM warehouse and continues on a Martinair flight, the marginal costs of freight building 2 and 3 are incurred. In addition, the handling tariff of Menzies is paid. Within the marginal costs of freight building 3, the cost of transport to the airplane are included. The distance to an airplane or Menzies is equal. Therefore, no additional costs for lateral transport from KLM to Menzies are calculated.
Figure 8. Cargo flows between KLM and Menzies.
43
Transport on platform When Menzies handles KLM flows, an additional process needs to be designed in order to transport cargo between the KLM airplane and the Menzies warehouse. This is because Menzies is not allowed to transport cargo to a KLM airplane.
3.4 Cargo flow allocation constraints In this section the limits of a cargo flow allocation are presented. The cargo flow allocation opportunities are bounded by a few factors. First, the capacity limits of KLM and Menzies are described. Thereafter is described why Delta Airlines needs to be handled at KLM and why one flight can only allocated to one warehouse.
3.4.1 Cargo flow allocation criteria
In this section the cargo flow allocation criteria are presented. A cargo flow is defined as cargo from an origin to a destination. All cargo that arrives at Schiphol continues to a destination. Transport modality Within this research two transport modalities are important, airplanes and trucks. In agreement with customers, cargo by truck is delivered at the warehouse where the involved flight departs and cargo is collected cargo from the warehouse where a flight arrives. According to Mouhsine Bouhbouh (2013), Manager Regional Truck Planning Europe of KLM Cargo, is it possible that shipments of KLM and Martinair are transported in one truck. If a truck contains cargo for both carriers, currently these trucks have to stop at the KLM warehouse and Menzies warehouse. This is because, Dutch customs does not allow lateral transport for cargo where one of the stretches is carried by truck. So, lateral transport is only allowed when cargo arrives and departs by airplane. In contrary to truck handling, one airplane could only be handled by one cargo handler. So if an airplane arrives, it is not possible that a part of the cargo is handled by KLM and another part by Menzies. Operating carrier The allocation of outbound cargo flights is based on operating carrier. All outbound flights of Martinair are handled at Menzies. All outbound flights of KLM and partners are handled in the KLM warehouse. Partners are: Air France, Delta Airlines, Alitalia Airlines and other members of the SkyTeam alliance. These carriers should always be handled at KLM because of contracts between KLM and their partners (Blasse, 2013). From the partners is Delta Airlines an important actor since about 10% of cargo handling at the KLM Cargo warehouse contains Delta Airlines flights. Origin and destination Inbound flights are allocated between the two warehouses based on carrier and origin. All incoming KLM flights are handled at KLM cargo handling warehouse. All freighters of Martinair are handled at Menzies. Nevertheless on the first of May 2013 the inbound flights from Asia are handled at KLM. Therefore is the cargo allocation for inbound flights also based on origin.
3.4.2 Capacity limit of KLM cargo handling warehouse
According to Emiel Out, Controller Hub, the capacity of the KLM Cargo warehouse is based on ‘handled’ tons instead of actual ‘carried’ tons that have been gone through the warehouse. The carried tons of import and export cargo flows are equal to the handled tons. For all transit cargo flows, the ‘carried’ tons are calculated twice to obtain the ‘handled’ tons. This is because all transit flows are invoiced twice by accounting of KLM (Out, 2013). So, for example cargo arrives from an airplane at FB2 and continues on a truck into Europe. The actual carried tons are calculated twice because the
44
management of KLM Cargo Operations assumes that transit cargo flows require more labor intensive work than import or export cargo flows (Krol, 2013) (Out, 2013). So, in this case the handled tons equal twice the carried tons. Invoicing and defining the maximum capacity of the KLM warehouse is based on handled tons per week. Based on experience can be said that between 19.000 and 20.000 handled tons per week the KLM cargo warehouse reaches its maximum (Krol, Out, Hamerslag, 2013). The capacity of the warehouse is being determined by three bottlenecks; capacity limits on ground, capacity limits in PCHS and capacity limit of the EHS (Krol, Troost, 2013). These bottlenecks are elaborated in this section. Capacity limits on ground As can be seen in figure x do employees of KLM Cargo need to break-down and build-up ULDs. Before a ULD can be build, the cargo is stored in a ‘buffer’ for a destination of a flight. These processes are labor intensive and require space on the ground to store cargo and to build these ULDs. The space available at KLM is not sufficient for buffers for all destinations of KLM flights. Therefore, these buffers change into different destinations after a departed flight. This results that cargo sometimes need to be stored for a period before a buffer is opened (Cornelissen, 2013). Due to the space capacity limit, cargo that cannot be placed at a buffer is stored in vertical warehouse rack. According to John Cornelissen (2013), Head of FB2, is storage in a warehouse rack inefficient. Employees at KLM perform an additional handling because they need to make an additional ride to bring the cargo from the rack to the buffer at a later moment. If more than 20.000 tons a week are handled the capacity limit of these racks will be exceeded (Cornelissen, 2013). Furthermore, the ground capacity will not be large enough to store the cargo. Capacity limit of PCHS The PCHS is a full automated system were ULDs are stored before a flight or truck departs. Both FB2 & FB3 use this system to store ULDs that are ready but do need to wait before loading into the airplane or truck. An ULD will be triggered before a truck or flight departs. When KLM handles more than 20.000 tons a week the ULDs can be delayed because the system cannot handle that many ULDs in time (Krol, 2013). So handling more tons at the KLM Cargo handling warehouse would result in congestion in the PCHS. Capacity limit of the EHS The Elevating Handling System (EHS) is a bottleneck for loading ULDs in trucks. ULDs stored in the PCHS are automatically loaded in a truck by this system. This system performs well until 20.000 tons a week (Troost, 2013). Handling more tons at KLM would cause congestion effects which results in delaying trucks. Capacity of Menzies cargo handling warehouse The cargo handling capacity of Menzies depends on the demand of other cargo carriers. This is because, Menzies is responsible for handling multiple air cargo carriers at Schiphol. In this research is assumed that the maximum cargo handling capacity equals 8.000 ton/week. Delta Airlines Delta Airlines is an important customer for KLM Cargo Operations since this is amounts about 10% of the handled tons at Schiphol (van Duuren, 2013). Only KLM Cargo is allowed to handle cargo of Delta Airlines as contracted (Bakker, 2013). Therefore the DVs for flows with Delta Airlines flights should be bounded to the KLM warehouse. KLM and Martinair flights can both be handled by either KLM or Menzies.
45
The origins and destinations of Delta Airlines are all destinations in the United States of America and Canada. In addition, KLM handles cargo from Delta Airlines flights to and from Bombay in India. According to Jos Bakker, Quality Manager KLM Cargo Operations, have KLM and Delta Airlines an agreement on these flights. The capacity of these flights are used by both KLM and Delta Airlines (Bakker, 2013).
3.5 Cargo flow allocation implementation pitfalls From the conducted process analysis some valuable cargo flow allocation implementation pitfalls are derived. In this section recommendations are provided about the implementation of a cargo flow allocation adjustment. Communication Systems and processes are interwoven into the whole company. Adjustments in the allocation of cargo flows between Menzies and KLM affect processes in other departments of KLM and Martinair Cargo. In addition, customers are affected by these adjustments. Therefore these adjustments need to be clearly communicated with all involved actors and tested to avoid failures while implementing adjustments. Awareness needs to be created about the adjustments so actors could adjust current processes on time. Window of opportunity Adjustments in cargo allocation between KLM and Menzies on a daily or weekly basis would raise a lot of non-transparency within the organization. A window of opportunity is defined by Hans de Bruijn and Ernst ten Heuvelhof (2008, p. 64) as: “the moment when the chance of support for the problem formulation is sufficient.” A great window of opportunity to adjust cargo allocation would be, the change in summer and winter flight schedule. At two days of the year the flight schedule is adjusted and origins and destinations are changed in the flight schedule. Therefore, a lot of adjustments in working processes have to be made by all involved actors. Combining these adjustments with the adjustment of the cargo flow allocation creates a situation where non-transparency is raised only twice a year. During these periods actors are more alert and therefore failures can be avoided.
3.6 Preliminary conclusions In this section the research question of this chapter is answered:
Which processes are influenced by a cargo flow allocation adjustment? Processes within the KLM warehouse are based on the different types of cargo flows: import, export, transit on trucks or transit on airplanes. Transit flows on Europe trucks require additional handling within the warehouse compared to import and export flows. When KLM flows are allocated to Menzies, an additional process needs to be established to transport cargo between the KLM airplanes and the Menzies warehouse. Menzies is not allowed to transport cargo to or from the KLM airplanes. Transport between KLM and Menzies is called lateral transport and an important process for this research. It negatively influences the KLM KPIs because it is time consuming and vulnerable to failures.

46
Part 3: Design
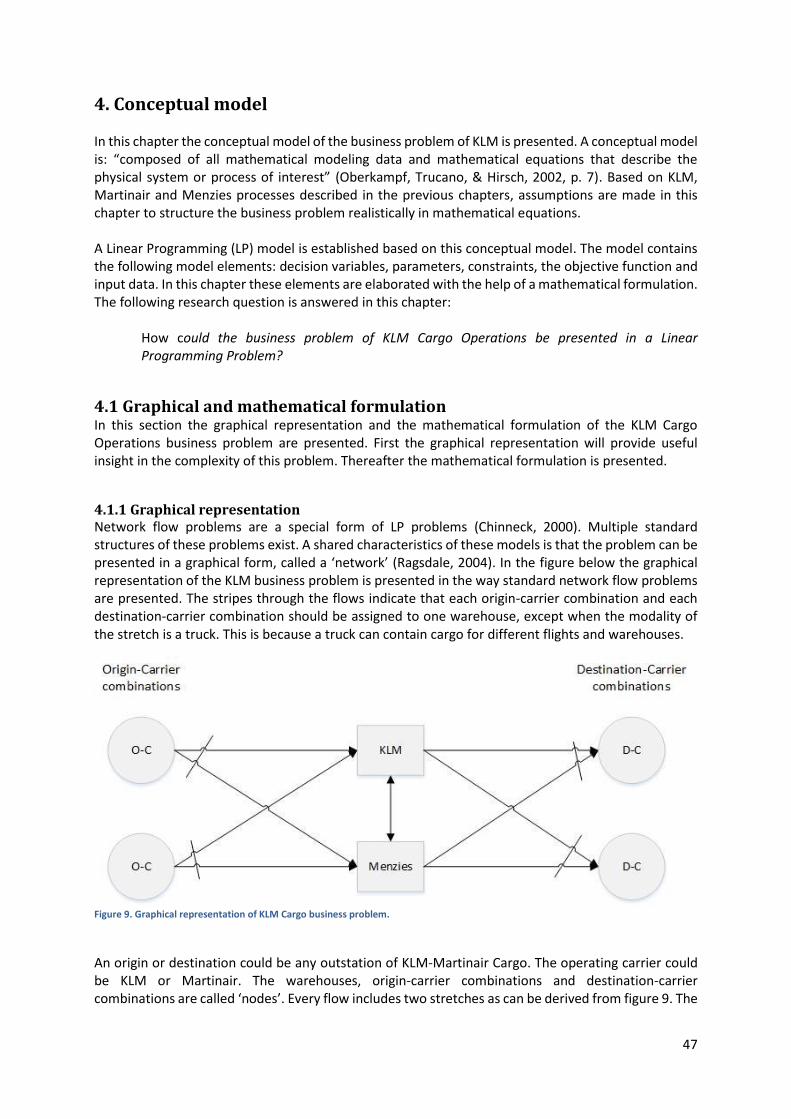
47
4. Conceptual model In this chapter the conceptual model of the business problem of KLM is presented. A conceptual model is: “composed of all mathematical modeling data and mathematical equations that describe the physical system or process of interest” (Oberkampf, Trucano, & Hirsch, 2002, p. 7). Based on KLM, Martinair and Menzies processes described in the previous chapters, assumptions are made in this chapter to structure the business problem realistically in mathematical equations. A Linear Programming (LP) model is established based on this conceptual model. The model contains the following model elements: decision variables, parameters, constraints, the objective function and input data. In this chapter these elements are elaborated with the help of a mathematical formulation. The following research question is answered in this chapter:
How could the business problem of KLM Cargo Operations be presented in a Linear Programming Problem?
4.1 Graphical and mathematical formulation In this section the graphical representation and the mathematical formulation of the KLM Cargo Operations business problem are presented. First the graphical representation will provide useful insight in the complexity of this problem. Thereafter the mathematical formulation is presented.
4.1.1 Graphical representation Network flow problems are a special form of LP problems (Chinneck, 2000). Multiple standard structures of these problems exist. A shared characteristics of these models is that the problem can be presented in a graphical form, called a ‘network’ (Ragsdale, 2004). In the figure below the graphical representation of the KLM business problem is presented in the way standard network flow problems are presented. The stripes through the flows indicate that each origin-carrier combination and each destination-carrier combination should be assigned to one warehouse, except when the modality of the stretch is a truck. This is because a truck can contain cargo for different flights and warehouses.
Figure 9. Graphical representation of KLM Cargo business problem.
An origin or destination could be any outstation of KLM-Martinair Cargo. The operating carrier could be KLM or Martinair. The warehouses, origin-carrier combinations and destination-carrier combinations are called ‘nodes’. Every flow includes two stretches as can be derived from figure 9. The
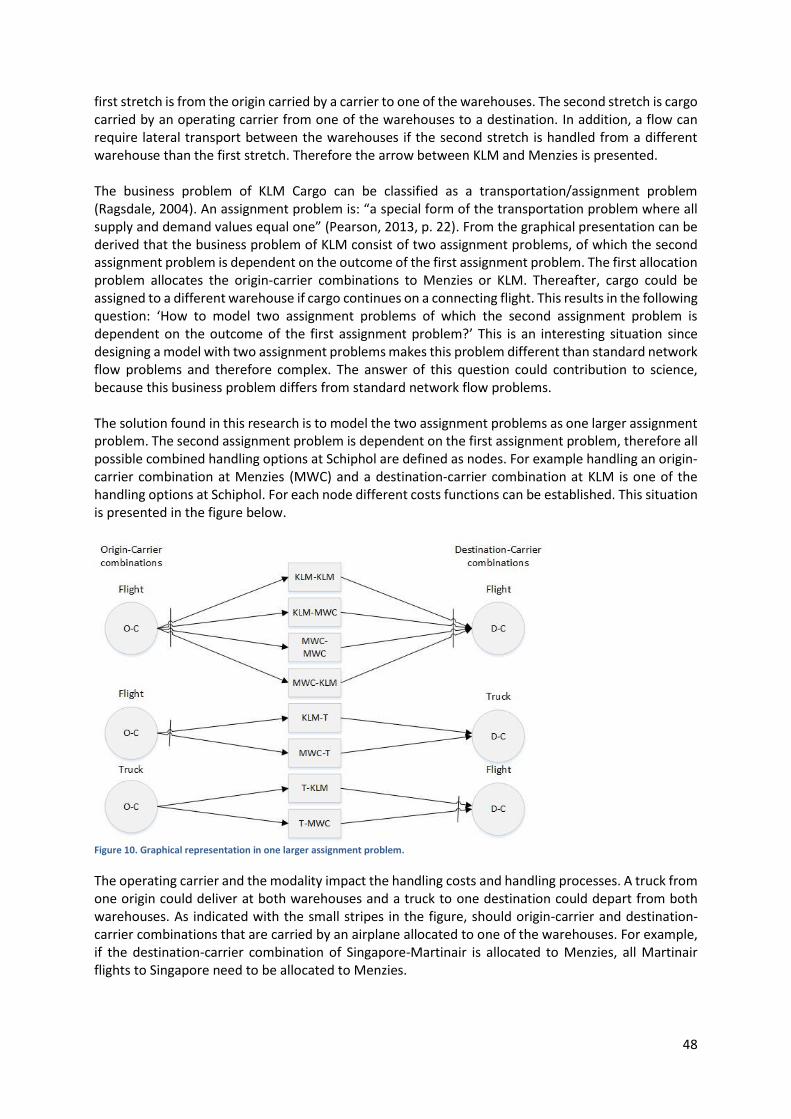
48
first stretch is from the origin carried by a carrier to one of the warehouses. The second stretch is cargo carried by an operating carrier from one of the warehouses to a destination. In addition, a flow can require lateral transport between the warehouses if the second stretch is handled from a different warehouse than the first stretch. Therefore the arrow between KLM and Menzies is presented. The business problem of KLM Cargo can be classified as a transportation/assignment problem (Ragsdale, 2004). An assignment problem is: “a special form of the transportation problem where all supply and demand values equal one” (Pearson, 2013, p. 22). From the graphical presentation can be derived that the business problem of KLM consist of two assignment problems, of which the second assignment problem is dependent on the outcome of the first assignment problem. The first allocation problem allocates the origin-carrier combinations to Menzies or KLM. Thereafter, cargo could be assigned to a different warehouse if cargo continues on a connecting flight. This results in the following question: ‘How to model two assignment problems of which the second assignment problem is dependent on the outcome of the first assignment problem?’ This is an interesting situation since designing a model with two assignment problems makes this problem different than standard network flow problems and therefore complex. The answer of this question could contribution to science, because this business problem differs from standard network flow problems. The solution found in this research is to model the two assignment problems as one larger assignment problem. The second assignment problem is dependent on the first assignment problem, therefore all possible combined handling options at Schiphol are defined as nodes. For example handling an origin-carrier combination at Menzies (MWC) and a destination-carrier combination at KLM is one of the handling options at Schiphol. For each node different costs functions can be established. This situation is presented in the figure below.
Figure 10. Graphical representation in one larger assignment problem.
The operating carrier and the modality impact the handling costs and handling processes. A truck from one origin could deliver at both warehouses and a truck to one destination could depart from both warehouses. As indicated with the small stripes in the figure, should origin-carrier and destination-carrier combinations that are carried by an airplane allocated to one of the warehouses. For example, if the destination-carrier combination of Singapore-Martinair is allocated to Menzies, all Martinair flights to Singapore need to be allocated to Menzies.
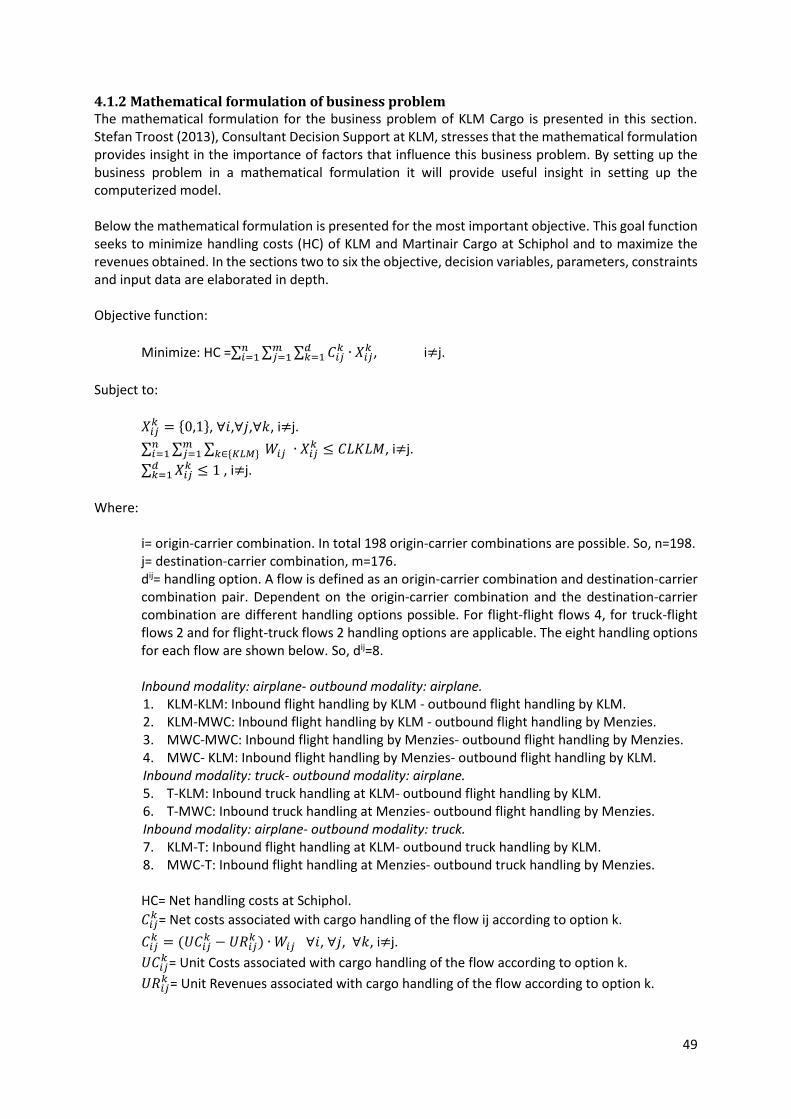
49
4.1.2 Mathematical formulation of business problem The mathematical formulation for the business problem of KLM Cargo is presented in this section. Stefan Troost (2013), Consultant Decision Support at KLM, stresses that the mathematical formulation provides insight in the importance of factors that influence this business problem. By setting up the business problem in a mathematical formulation it will provide useful insight in setting up the computerized model. Below the mathematical formulation is presented for the most important objective. This goal function seeks to minimize handling costs (HC) of KLM and Martinair Cargo at Schiphol and to maximize the revenues obtained. In the sections two to six the objective, decision variables, parameters, constraints and input data are elaborated in depth. Objective function:
Minimize: HC =∑ ∑ ∑ 𝐶𝑖𝑗𝑘 ∙ 𝑋𝑖𝑗
𝑘𝑑𝑘=1
𝑚𝑗=1
𝑛𝑖=1 , i≠j.
Subject to:
𝑋𝑖𝑗𝑘 = {0,1}, ∀𝑖,∀𝑗,∀𝑘, i≠j.
∑ ∑ ∑ 𝑊𝑖𝑗 ∙ 𝑋𝑖𝑗𝑘 ≤ 𝐶𝐿𝐾𝐿𝑀𝑘∈{𝐾𝐿𝑀}
𝑚𝑗=1
𝑛𝑖=1 , i≠j.
∑ 𝑋𝑖𝑗𝑘𝑑
𝑘=1 ≤ 1 , i≠j.
Where:
i= origin-carrier combination. In total 198 origin-carrier combinations are possible. So, n=198. j= destination-carrier combination, m=176. dij= handling option. A flow is defined as an origin-carrier combination and destination-carrier combination pair. Dependent on the origin-carrier combination and the destination-carrier combination are different handling options possible. For flight-flight flows 4, for truck-flight flows 2 and for flight-truck flows 2 handling options are applicable. The eight handling options for each flow are shown below. So, dij=8. Inbound modality: airplane- outbound modality: airplane. 1. KLM-KLM: Inbound flight handling by KLM - outbound flight handling by KLM. 2. KLM-MWC: Inbound flight handling by KLM - outbound flight handling by Menzies. 3. MWC-MWC: Inbound flight handling by Menzies- outbound flight handling by Menzies. 4. MWC- KLM: Inbound flight handling by Menzies- outbound flight handling by KLM. Inbound modality: truck- outbound modality: airplane. 5. T-KLM: Inbound truck handling at KLM- outbound flight handling by KLM. 6. T-MWC: Inbound truck handling at Menzies- outbound flight handling by Menzies. Inbound modality: airplane- outbound modality: truck. 7. KLM-T: Inbound flight handling at KLM- outbound truck handling by KLM. 8. MWC-T: Inbound flight handling at Menzies- outbound truck handling by Menzies.
HC= Net handling costs at Schiphol.
𝐶𝑖𝑗𝑘 = Net costs associated with cargo handling of the flow ij according to option k.
𝐶𝑖𝑗𝑘 = (𝑈𝐶𝑖𝑗
𝑘 − 𝑈𝑅𝑖𝑗𝑘 ) ∙ 𝑊𝑖𝑗 ∀𝑖, ∀𝑗, ∀𝑘, i≠j.
𝑈𝐶𝑖𝑗𝑘 = Unit Costs associated with cargo handling of the flow according to option k.
𝑈𝑅𝑖𝑗𝑘 = Unit Revenues associated with cargo handling of the flow according to option k.
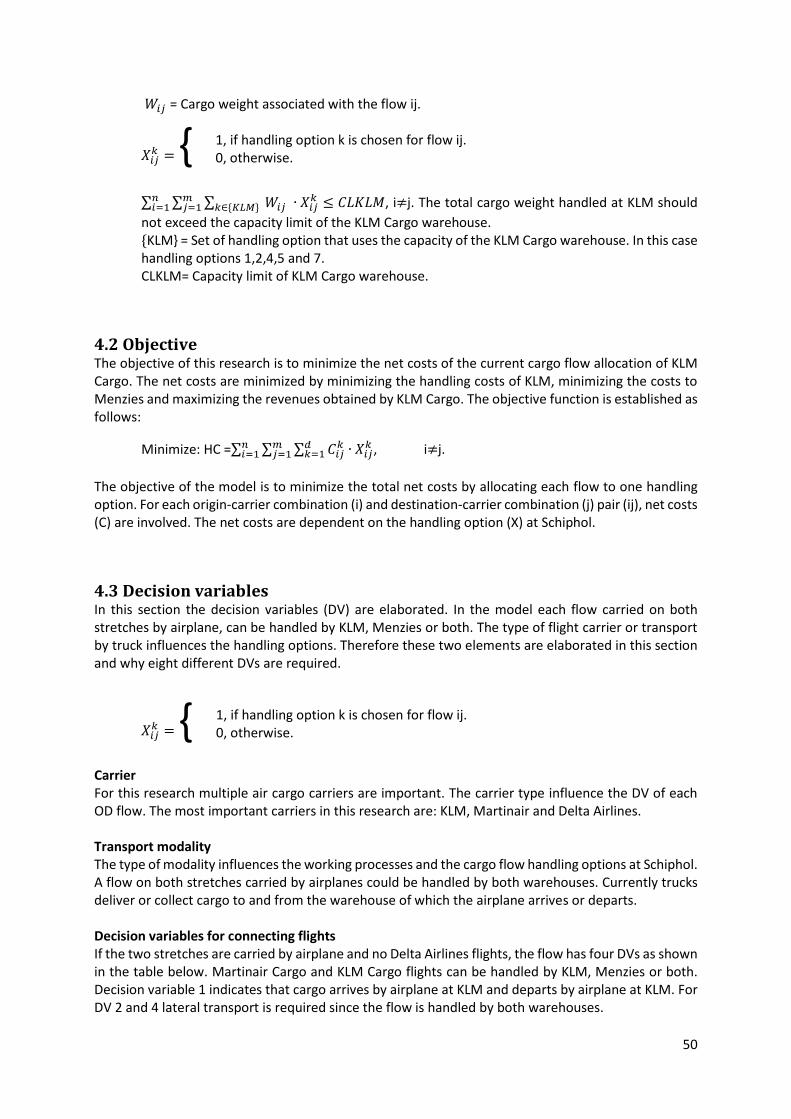
50
𝑊𝑖𝑗 = Cargo weight associated with the flow ij.
𝑋𝑖𝑗𝑘 = {
∑ ∑ ∑ 𝑊𝑖𝑗 ∙ 𝑋𝑖𝑗𝑘 ≤ 𝐶𝐿𝐾𝐿𝑀𝑘∈{𝐾𝐿𝑀}
𝑚𝑗=1
𝑛𝑖=1 , i≠j. The total cargo weight handled at KLM should
not exceed the capacity limit of the KLM Cargo warehouse. {KLM} = Set of handling option that uses the capacity of the KLM Cargo warehouse. In this case handling options 1,2,4,5 and 7.
CLKLM= Capacity limit of KLM Cargo warehouse.
4.2 Objective The objective of this research is to minimize the net costs of the current cargo flow allocation of KLM Cargo. The net costs are minimized by minimizing the handling costs of KLM, minimizing the costs to Menzies and maximizing the revenues obtained by KLM Cargo. The objective function is established as follows:
Minimize: HC =∑ ∑ ∑ 𝐶𝑖𝑗𝑘 ∙ 𝑋𝑖𝑗
𝑘𝑑𝑘=1
𝑚𝑗=1
𝑛𝑖=1 , i≠j.
The objective of the model is to minimize the total net costs by allocating each flow to one handling option. For each origin-carrier combination (i) and destination-carrier combination (j) pair (ij), net costs (C) are involved. The net costs are dependent on the handling option (X) at Schiphol.
4.3 Decision variables In this section the decision variables (DV) are elaborated. In the model each flow carried on both stretches by airplane, can be handled by KLM, Menzies or both. The type of flight carrier or transport by truck influences the handling options. Therefore these two elements are elaborated in this section and why eight different DVs are required.
𝑋𝑖𝑗𝑘 = {
Carrier For this research multiple air cargo carriers are important. The carrier type influence the DV of each OD flow. The most important carriers in this research are: KLM, Martinair and Delta Airlines. Transport modality The type of modality influences the working processes and the cargo flow handling options at Schiphol. A flow on both stretches carried by airplanes could be handled by both warehouses. Currently trucks deliver or collect cargo to and from the warehouse of which the airplane arrives or departs. Decision variables for connecting flights If the two stretches are carried by airplane and no Delta Airlines flights, the flow has four DVs as shown in the table below. Martinair Cargo and KLM Cargo flights can be handled by KLM, Menzies or both. Decision variable 1 indicates that cargo arrives by airplane at KLM and departs by airplane at KLM. For DV 2 and 4 lateral transport is required since the flow is handled by both warehouses.
1, if handling option k is chosen for flow ij. 0, otherwise.
1, if handling option k is chosen for flow ij. 0, otherwise.
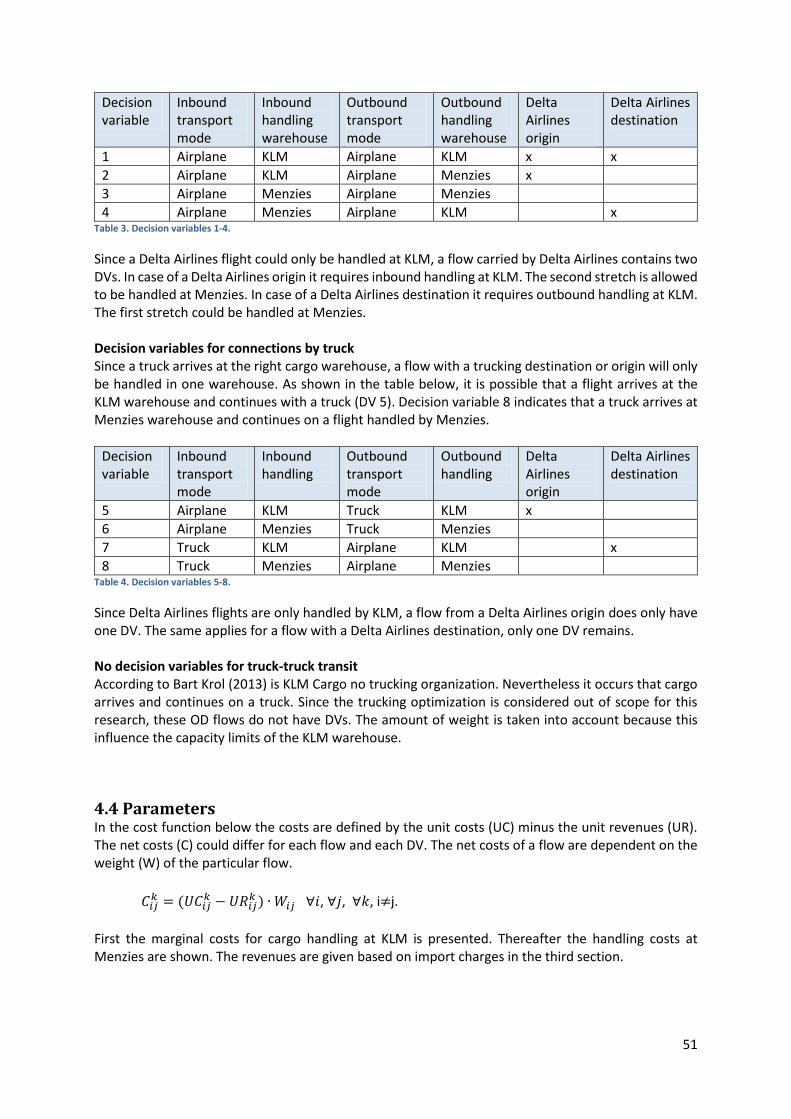
51
Decision variable
Inbound transport mode
Inbound handling warehouse
Outbound transport mode
Outbound handling warehouse
Delta Airlines origin
Delta Airlines destination
1 Airplane KLM Airplane KLM x x
2 Airplane KLM Airplane Menzies x
3 Airplane Menzies Airplane Menzies
4 Airplane Menzies Airplane KLM x Table 3. Decision variables 1-4.
Since a Delta Airlines flight could only be handled at KLM, a flow carried by Delta Airlines contains two DVs. In case of a Delta Airlines origin it requires inbound handling at KLM. The second stretch is allowed to be handled at Menzies. In case of a Delta Airlines destination it requires outbound handling at KLM. The first stretch could be handled at Menzies. Decision variables for connections by truck Since a truck arrives at the right cargo warehouse, a flow with a trucking destination or origin will only be handled in one warehouse. As shown in the table below, it is possible that a flight arrives at the KLM warehouse and continues with a truck (DV 5). Decision variable 8 indicates that a truck arrives at Menzies warehouse and continues on a flight handled by Menzies.
Decision variable
Inbound transport mode
Inbound handling
Outbound transport mode
Outbound handling
Delta Airlines origin
Delta Airlines destination
5 Airplane KLM Truck KLM x
6 Airplane Menzies Truck Menzies
7 Truck KLM Airplane KLM x
8 Truck Menzies Airplane Menzies Table 4. Decision variables 5-8.
Since Delta Airlines flights are only handled by KLM, a flow from a Delta Airlines origin does only have one DV. The same applies for a flow with a Delta Airlines destination, only one DV remains. No decision variables for truck-truck transit According to Bart Krol (2013) is KLM Cargo no trucking organization. Nevertheless it occurs that cargo arrives and continues on a truck. Since the trucking optimization is considered out of scope for this research, these OD flows do not have DVs. The amount of weight is taken into account because this influence the capacity limits of the KLM warehouse.
4.4 Parameters In the cost function below the costs are defined by the unit costs (UC) minus the unit revenues (UR). The net costs (C) could differ for each flow and each DV. The net costs of a flow are dependent on the weight (W) of the particular flow.
𝐶𝑖𝑗𝑘 = (𝑈𝐶𝑖𝑗
𝑘 − 𝑈𝑅𝑖𝑗𝑘 ) ∙ 𝑊𝑖𝑗 ∀𝑖, ∀𝑗, ∀𝑘, i≠j.
First the marginal costs for cargo handling at KLM is presented. Thereafter the handling costs at Menzies are shown. The revenues are given based on import charges in the third section.
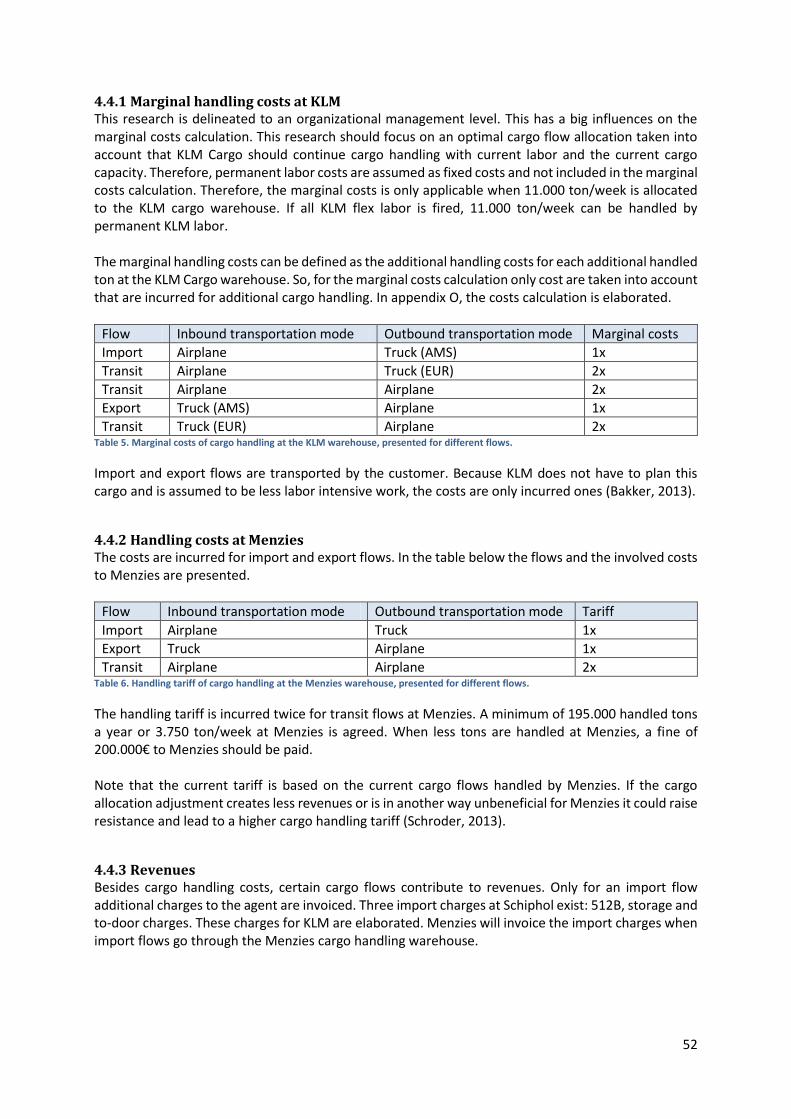
52
4.4.1 Marginal handling costs at KLM This research is delineated to an organizational management level. This has a big influences on the marginal costs calculation. This research should focus on an optimal cargo flow allocation taken into account that KLM Cargo should continue cargo handling with current labor and the current cargo capacity. Therefore, permanent labor costs are assumed as fixed costs and not included in the marginal costs calculation. Therefore, the marginal costs is only applicable when 11.000 ton/week is allocated to the KLM cargo warehouse. If all KLM flex labor is fired, 11.000 ton/week can be handled by permanent KLM labor. The marginal handling costs can be defined as the additional handling costs for each additional handled ton at the KLM Cargo warehouse. So, for the marginal costs calculation only cost are taken into account that are incurred for additional cargo handling. In appendix O, the costs calculation is elaborated.
Flow Inbound transportation mode Outbound transportation mode Marginal costs
Import Airplane Truck (AMS) 1x
Transit Airplane Truck (EUR) 2x
Transit Airplane Airplane 2x
Export Truck (AMS) Airplane 1x
Transit Truck (EUR) Airplane 2x Table 5. Marginal costs of cargo handling at the KLM warehouse, presented for different flows.
Import and export flows are transported by the customer. Because KLM does not have to plan this cargo and is assumed to be less labor intensive work, the costs are only incurred ones (Bakker, 2013).
4.4.2 Handling costs at Menzies The costs are incurred for import and export flows. In the table below the flows and the involved costs to Menzies are presented.
Flow Inbound transportation mode Outbound transportation mode Tariff
Import Airplane Truck 1x
Export Truck Airplane 1x
Transit Airplane Airplane 2x Table 6. Handling tariff of cargo handling at the Menzies warehouse, presented for different flows.
The handling tariff is incurred twice for transit flows at Menzies. A minimum of 195.000 handled tons a year or 3.750 ton/week at Menzies is agreed. When less tons are handled at Menzies, a fine of 200.000€ to Menzies should be paid. Note that the current tariff is based on the current cargo flows handled by Menzies. If the cargo allocation adjustment creates less revenues or is in another way unbeneficial for Menzies it could raise resistance and lead to a higher cargo handling tariff (Schroder, 2013).
4.4.3 Revenues Besides cargo handling costs, certain cargo flows contribute to revenues. Only for an import flow additional charges to the agent are invoiced. Three import charges at Schiphol exist: 512B, storage and to-door charges. These charges for KLM are elaborated. Menzies will invoice the import charges when import flows go through the Menzies cargo handling warehouse.
53
512B charges These 512B charges are invoiced to the agent for cargo handling at Schiphol. These charges are 0,041€/kg for cargo on ULDs and 0,07€/kg for loose cargo. For weeks 25 to 28 2013 the percentage of loose cargo of the total import flow was 22%. Therefore the 512B charges for import flows per kilogram are approximately: (0,22*0,07) + (0,78*0,041)= 0,04738 €/kg. Storage charges When agents do not pick up their cargo at agreed time the cargo is stored in the KLM warehouse. After three days of cargo storage, the agents are fined with storage charges per kilo per day. For each additional kilogram of import cargo, the chance on storage charges rises. From the weekly KPI Logistics dashboard can be derived, the total amount of invoiced storage charges are 4.122 euros per week. The total import flow per week in this month was 3.713.443 kg/week. Therefore, an average of 0, 00111 €/kg for storage charges on import cargo is invoiced. This could be used as a rule of thumb in the DSS. To-door charge Every day 6 to 8 trucks deliver cargo from Schiphol to destinations in Amsterdam or the Netherlands to deliver cargo from customers ‘to the door’. For this service agents pay a tariff. Emiel Out, controller Operations Hub, monitors this charges and costs. The revenues for week 19 to 23 2013 were on average 14.369 €/week (Out, 2013). Divided by the total amount of import of 3.713.443 kg/week, an average of 0,00387 €/kg for to-door charges are invoiced on import flows.
4.4.4 Other costs Besides costs to Menzies, marginal cargo handling costs of KLM and revenues, are other costs important to take into account during this research. Cargo handling of a KLM flight at Menzies requires an additional handling. Since Menzies is not allowed to pick up cargo from a KLM flight, KLM should transport cargo from the airplane to Menzies. Lateral transport Menzies to KLM Transportation costs from Menzies to KLM equal zero. When cargo arrives at Menzies and the connection flight is handled at KLM, Menzies delivers this cargo at KLM freight building 3. These costs are already included in the tariff of Menzies (Schroder, 2013). Lateral transport KLM to Menzies Lateral transport costs from KLM to MWC are considered null. The handling costs of FB3 include the transportation from FB3 to the airplane. Because the distance and time for delivery from FB3 to the airplanes or to Menzies is almost equal, the transportation costs are the same. Notice that lateral transport always result in additional handling costs. Lateral transport from KLM to MWC may be considered zero but handling costs are paid twice. Marginal costs at the KLM warehouse and the Menzies tariff. Transport on platform If Menzies would handle a KLM flight, KLM needs to pick up cargo at Menzies and transport it to the airplane. According to Maarten Blasse (2013), Customs Compliance Manager at KLM Cargo, is Menzies not allowed to deliver or to collect cargo from an airplane of KLM Cargo. So when Menzies builds up ULDs for a KLM flight, KLM should provide the transportation of cargo from the Menzies warehouse to the airplane. This would costs about 35 minutes. In appendix O the calculations for the costs of transport on platform by KLM transport are presented. By rule of thumb this would be equal to 0,00214 €/kg.
54
4.5 Constraints Constraints are necessary to test different scenarios. In this section the constraints are elaborated which apply in every scenario. The three important constraints in this business problem are:
1. 𝑋𝑖𝑗𝑘 = {0,1}, ∀𝑖, ∀𝑗, ∀𝑘, i≠j.
2. ∑ ∑ ∑ 𝑊𝑖𝑗 ∙ 𝑋𝑖𝑗𝑘 ≤ 𝐶𝐿𝐾𝐿𝑀𝑘∈{𝐾𝐿𝑀}
𝑚𝑗=1
𝑛𝑖=1 , i≠j.
3. ∑ 𝑋𝑖𝑗𝑘𝑑
𝑘=1 ≤ 1 , i≠j.
1. Integrality In practice a flight from Hong Kong on Monday can be handled at KLM and the next flight on Tuesday can be handled at Menzies. Nevertheless, as a result of the data file based on origin and destination, cargo cannot be assigned to a specific flight. Therefore the model should constrain that all cargo with an origin-carrier combination or destination-carrier combination is allocated to either KLM or Menzies. Therefore the integrality constraint is presented. 2. Capacity limit In chapter 3.4.2, the capacity limits of the KLM Cargo warehouse are presented. The model should be able to provide recommendations without exceeding the capacity limit of the KLM cargo warehouse. 3. One handling option The third constraint makes sure that a flow could not choose more than one DV.
4.6 Input Data In this section, the availability and the quality of the input data is described.
4.6.1 Content of input file
Information on cargo flows can be obtained from three departments of KLM Cargo: Operations, Sales & Distribution (S&D) and Revenue Management (RM). In appendix I the decision to select the RM data base is elaborated. The RM database is based on information from the S&D and Operations department. In cooperation with Adri van der Ben, Project Manager Development & Process Support at RM, a data file is derived from the RM database. The data file is obtained by establishing a query in the RM database. In appendix M the query for this data file is provided in order to retrieve the data file again. The data file retrieved from the RM database is based on an ‘origin-carrier combination and destination-carrier combination’ structure in a spreadsheet of Microsoft Excel. So, cargo from on origin carried by an operating carrier to a destination carried with an operating carrier are combined. Each record in the input data file contains the following information:
- Flight information about date of departure - Operating carrier for each stretch - Carried weight per flow - Type of transport mode; truck or type of airplane
Because the origin of a shipment could differ from the station of department, the station of department is chosen as ‘origin’. For instance a shipment from Vietnam carried by Air France could arrive at the Schiphol hub by truck from the Air France hub in Paris. The origin of the shipment is Vietnam but the relevant board station is Charles de Gaulle in Paris.
55
4.6.2 Reliability of data
Recent data from week 23 to 33 of 2013 is used as input for the DSS. Data before week 23 is not reliable due to the implementation of the One Airway bill project on the first of May 2013 (van der Ben, 2013). Therefore the most recent 11 weeks are selected. The data file contains some errors that cannot be influenced by adjusting the query. In this section the results of a reliability check described in appendix K are presented. The data file holds a small bias towards Martinair. About 0,19% of the cargo carried by KLM is shown in the data file as cargo flown with Martinair. So, cargo carried by KLM is 0,19% lower than reality and 0,19% of KLM cargo contributed to Martinair cargo. Some of the Martinair flows are presented twice in the data file. On average the Martinair data contains 0,22% more carried weight than reality due to this error. In the data file, 3,4% of the input is uncertain because the board station or off point station is not presented in the data file. In this case the origin equals the board station and the destination equals the off point station. Van der Ben (2013) expects that this assumption would be correct in 95% of the cases. Therefore 0,17% of origin-carrier or destination-carrier combinations could be wrong.
4.7 Preliminary conclusions In this chapter the following research question is answered:
How could the business problem of KLM Cargo Operations be presented in a Linear Programming Problem?
The KLM business problem differs from the standard network flow problems. In this research an optimal allocation at Schiphol depends on the allocation of two stretches. In this chapter is described how the following question could be tackled: ‘How to model two assignment problems of which the second assignment problem is dependent on the outcome of the first assignment problem?’ By combining the handling options, the business problem is formulated in one larger assignment problem. The knowledge on structuring two assignment problems into one larger assignment problem could contribute to science. In this chapter the objective function and parameters are established linearly. Therefore, the Decision Support System could be modeled as a Linear Programming problem. The marginal handling costs of KLM are based on a minimum of cargo handling of 11.000 ton/week at the KLM warehouse.

56
57
5. Design of a decision support system In section 1.6.4, LP is chosen as a valuable method for this research. This chapter elaborates on the decision for a Linear Programming (LP) tool for the scenario analysis. First the requirements of a DSS are presented. Thereafter, a free Excel add-in is compared to dedicated LP software, in order to select a LP tool. Before the research question is answered, the design of the DSS is presented.
RQ: Which DSS is preferred for the scenario analysis of KLM Cargo Operations?
5.1 Requirements of DSS In this section the requirements for a DSS are presented. KLM Cargo Operations is in need of a support system that provides valuable insight in the consequences of cargo flow allocation adjustments at Schiphol. The requirements can be divided into two subjects; impact on KPIs and usability for KLM Cargo Operations. First the DSS should provide reliable and valuable insight of different cargo flow allocation scenarios on the KLM KPIs. Second, an important requirement of the DSS should be the usability and maintainability for KLM Cargo Operations. Cargo flows and flight schedules change over time. Therefore the management of KLM Cargo Operations prefers a DSS that could be used on a regular basis. To ensure that the DSS could contribute to valuable information in the future, the following requirements are established in co-operation with KLM Cargo Operations (Krol, 2013):
- Completeness - Complexity handling - Robustness - User friendliness - Affordability
First it is important that the DSS is able to model the whole business problem. The DSS should be able to extract valuable results from a data file of about 5.000 Excel records. Besides that this business problem of KLM is rather large, it is also complex. The DSS is therefore required of handling a large complex problem.
The DSS should be robust towards future changes in business processes, changing cargo flows or changing origins and destinations. In addition, when different processes between Menzies and KLM change this should be able to adjust in the DSS.
Since managers at KLM Cargo Operations want to conduct analyses on their own, the user friendliness is of great importance. So, a DSS should be selected that takes the knowledge of the managers at KLM Cargo Operations into account.
Although this research could contribute to improving business results, the affordability of the DSS is required. This means that the DSS should be low in purchase and license costs.
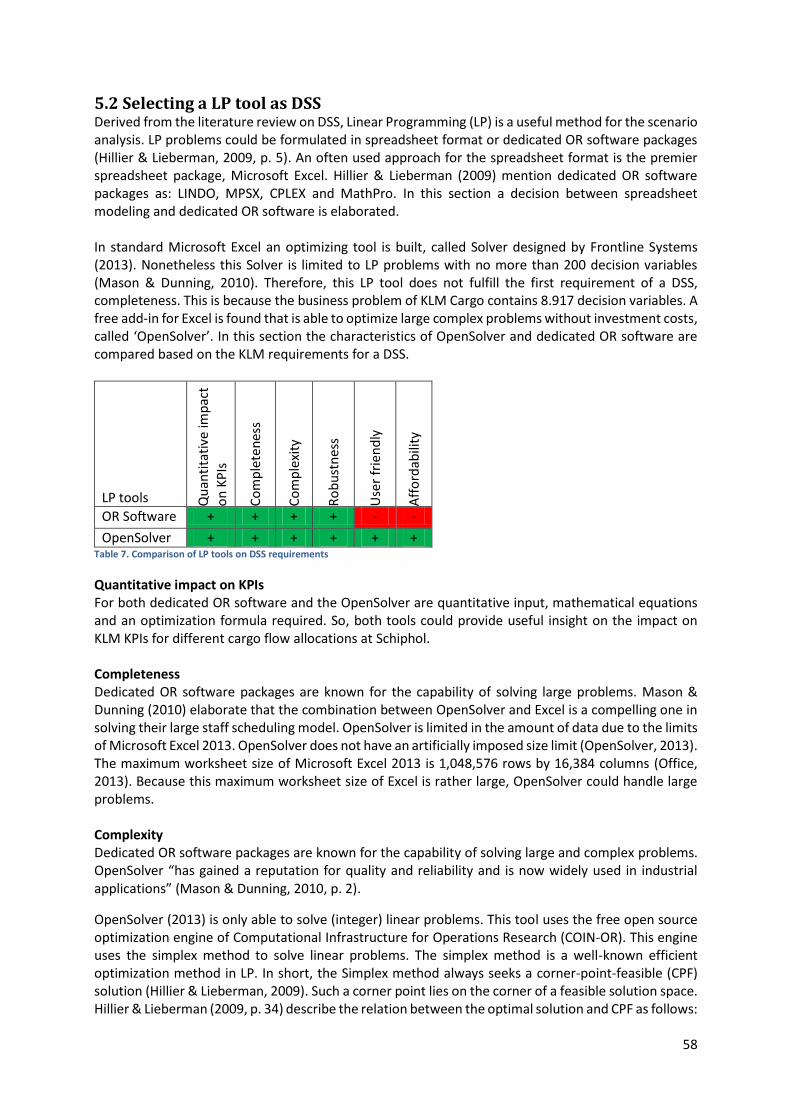
58
5.2 Selecting a LP tool as DSS Derived from the literature review on DSS, Linear Programming (LP) is a useful method for the scenario analysis. LP problems could be formulated in spreadsheet format or dedicated OR software packages (Hillier & Lieberman, 2009, p. 5). An often used approach for the spreadsheet format is the premier spreadsheet package, Microsoft Excel. Hillier & Lieberman (2009) mention dedicated OR software packages as: LINDO, MPSX, CPLEX and MathPro. In this section a decision between spreadsheet modeling and dedicated OR software is elaborated. In standard Microsoft Excel an optimizing tool is built, called Solver designed by Frontline Systems (2013). Nonetheless this Solver is limited to LP problems with no more than 200 decision variables (Mason & Dunning, 2010). Therefore, this LP tool does not fulfill the first requirement of a DSS, completeness. This is because the business problem of KLM Cargo contains 8.917 decision variables. A free add-in for Excel is found that is able to optimize large complex problems without investment costs, called ‘OpenSolver’. In this section the characteristics of OpenSolver and dedicated OR software are compared based on the KLM requirements for a DSS.
LP tools Q
uan
tita
tive
imp
act
on
KP
Is
Co
mp
lete
nes
s
Co
mp
lexi
ty
Ro
bu
stn
ess
Use
r fr
ien
dly
Aff
ord
abili
ty
OR Software + + + + - -
OpenSolver + + + + + + Table 7. Comparison of LP tools on DSS requirements
Quantitative impact on KPIs For both dedicated OR software and the OpenSolver are quantitative input, mathematical equations and an optimization formula required. So, both tools could provide useful insight on the impact on KLM KPIs for different cargo flow allocations at Schiphol. Completeness Dedicated OR software packages are known for the capability of solving large problems. Mason & Dunning (2010) elaborate that the combination between OpenSolver and Excel is a compelling one in solving their large staff scheduling model. OpenSolver is limited in the amount of data due to the limits of Microsoft Excel 2013. OpenSolver does not have an artificially imposed size limit (OpenSolver, 2013). The maximum worksheet size of Microsoft Excel 2013 is 1,048,576 rows by 16,384 columns (Office, 2013). Because this maximum worksheet size of Excel is rather large, OpenSolver could handle large problems. Complexity Dedicated OR software packages are known for the capability of solving large and complex problems. OpenSolver “has gained a reputation for quality and reliability and is now widely used in industrial applications” (Mason & Dunning, 2010, p. 2).
OpenSolver (2013) is only able to solve (integer) linear problems. This tool uses the free open source optimization engine of Computational Infrastructure for Operations Research (COIN-OR). This engine uses the simplex method to solve linear problems. The simplex method is a well-known efficient optimization method in LP. In short, the Simplex method always seeks a corner-point-feasible (CPF) solution (Hillier & Lieberman, 2009). Such a corner point lies on the corner of a feasible solution space. Hillier & Lieberman (2009, p. 34) describe the relation between the optimal solution and CPF as follows:
59
“Consider any linear programming problem with feasible solutions and a bounded feasible region. The problem must possess CPF solutions and at least one optimal solution. Furthermore, the best CPF solution must be an optimal solution. Thus, if a problem has exactly one optimal solution, it must be a CPF solution. If the problem has multiple optimal solutions, at least two must be CPF solutions”. Since the simplex method is considered as a reliable optimization method, could be assumed that the OpenSolver program would provide reliable results. Aeschbacher compared the results of OpenSolver with a conventional GAMS-model for his master thesis at the University of Zurich. He concluded that both GAMS and OpenSolver provide high quality results (Aeschbacher , 2012). Robustness According to Ron van Duin (2013), is most OR software closely related to the mathematical formulation of the business problem. Ron van Duin is a researcher at the TU Delft and often does research in the field of improving quality of decision making in logistic environments. On this requirement, dedicated OR software score better than OpenSolver because mathematical equations are easier to adjust than a structure in Excel (van Duin, 2013). For small process adjustments the model could be adjusted in Excel. This will only be more time consuming than dedicated OR software. User friendly At KLM Cargo Operations no employees work with skills with dedicated software. Some of the employees have experience with small optimizations problems in Excel. Solving LP problems with the help of OpenSolver: “makes solving optimization problems a fairly simple task and it is more useful for students who do not have strong mathematics background” (Chandrakantha, 2013, p. 43). The development of OpenSolver was initially intended as a tool that could be used by a range of different users (Mason & Dunning, 2010). Handling a DSS with OpenSolver definitely requires some background on LP and Excel. For KLM Cargo Operations this tool is considered as a useful tool that could be handled by employees of this department (Krol, 2013). Affordability Many student versions exist for dedicated OR software. Unfortunately for companies there is often a high tariff involved when using OR software. For instance, AIMMS (2013) basic version costs about 6.000€/year. The OpenSolver add-in is free open source software and therefore a big advantage for KLM Cargo Operations. Alan S. Abrahams & Cliff T. Ragsdale describe in their article about DSSs the reasons for using Excel instead of dedicated OR software. Their objective was to design a DSS in an affordable, accessible and familiar software platform (Abrahams & Ragsdale, 2012). Selection of LP tool Spreadsheet modeling is not specifically designed for these kinds of large problems but has some valuable advantages for KLM Cargo Operations. Therefore, the KLM Cargo business problem is modeled in Excel using OpenSolver. Employees are not dependent on operations researchers, students or external people with dedicated OR software skills. To make sure people can easily repeat the analysis a toolkit will be established with all important design steps.
60
5.3 Design of LP model In order to rebuild the LP model, the model specification is elaborated. In appendix J, the model is presented in detail. In this section a valuable learning from this research is presented; structure the input file in order to simply the model. By structuring the input file, costs functions are simplified and less decision variables are required. Input data By structuring the input file a few advantages are obtained that improve the solving time of the model and the chance on modeling failures. In addition, less constraints are needed, cost functions are simplified and less decision variables are modeled. Based on Delta Airlines flights (DF), KLM or Martinair flights (F), Europe trucks (T(EU)) and Amsterdam trucks (T(AMS)) the data file is structured. These characteristics result in different processes, decision variables and costs functions. The data file is structured as presented below: - DF-F; Delta Airlines origin to KLM or Martinair destination - F-DF; KLM or Martinair origin to Delta Airlines destination - F-F; KLM or Martinair origin to KLM or Martinair destination - DF-T(AMS); Import flow from Delta Airlines origins - DF-T(EU); Delta Airlines origin to trucking destination in Europe - F –T(AMS); Import flow from KLM or Martinair origins - F-T(EU); KLM or Martinair origin to trucking destination in Europe - T(AMS)-DF; export flow to Delta Airlines destination - T(EU)-DF; trucking origin in Europe to a Delta Airlines Destination - T(AMS)-F; export flow to a KLM or Martinair destination - T(EU)-F; trucking origin in Europe to a KLM or Martinair destination Decision variables Decision variables (DV) differ for different flows. For Delta Airlines origins and destinations less DVs are possible (chapter 4.3). The input file is structured in a way that DVs which are not possible are not provided in the model. Hereby, the chance on model failures decrease and the solving time improves. In appendix J is elaborated how each cargo flow is assigned to a DV. Cost functions Cost could differ because of transport modality and operating carrier. Therefore, the data file is structured based on transport modality and operating carrier. For operating carrier is the distinction made between Delta Airlines or KLM and Martinair. A different cost function applies for instance for import flows. Revenues can only be obtained on import flows. Therefore, the revenues are only included in the cost function for import flows. An import flow is defined as cargo flow of which the second stretch contains an Amsterdam truck.
5.4 Preliminary conclusions In this section the following research question is answered:
Which DSS is preferred for the scenario analysis of KLM Cargo Operations? Based on the requirements of the DSS, Linear Programming is considered as a high valued method in scenario analysis. OpenSolver as optimization tool, meets all requirements of KLM Cargo Operations.
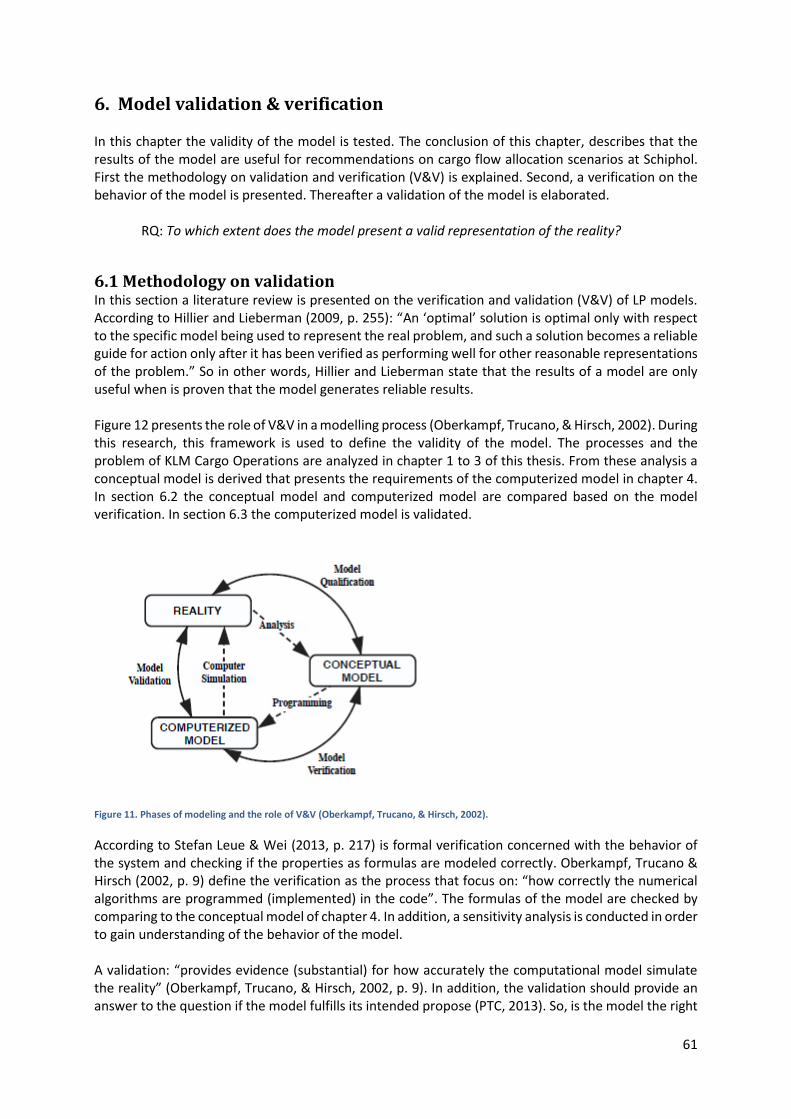
61
6. Model validation & verification In this chapter the validity of the model is tested. The conclusion of this chapter, describes that the results of the model are useful for recommendations on cargo flow allocation scenarios at Schiphol. First the methodology on validation and verification (V&V) is explained. Second, a verification on the behavior of the model is presented. Thereafter a validation of the model is elaborated.
RQ: To which extent does the model present a valid representation of the reality?
6.1 Methodology on validation In this section a literature review is presented on the verification and validation (V&V) of LP models. According to Hillier and Lieberman (2009, p. 255): “An ‘optimal’ solution is optimal only with respect to the specific model being used to represent the real problem, and such a solution becomes a reliable guide for action only after it has been verified as performing well for other reasonable representations of the problem.” So in other words, Hillier and Lieberman state that the results of a model are only useful when is proven that the model generates reliable results. Figure 12 presents the role of V&V in a modelling process (Oberkampf, Trucano, & Hirsch, 2002). During this research, this framework is used to define the validity of the model. The processes and the problem of KLM Cargo Operations are analyzed in chapter 1 to 3 of this thesis. From these analysis a conceptual model is derived that presents the requirements of the computerized model in chapter 4. In section 6.2 the conceptual model and computerized model are compared based on the model verification. In section 6.3 the computerized model is validated.
Figure 11. Phases of modeling and the role of V&V (Oberkampf, Trucano, & Hirsch, 2002).
According to Stefan Leue & Wei (2013, p. 217) is formal verification concerned with the behavior of the system and checking if the properties as formulas are modeled correctly. Oberkampf, Trucano & Hirsch (2002, p. 9) define the verification as the process that focus on: “how correctly the numerical algorithms are programmed (implemented) in the code”. The formulas of the model are checked by comparing to the conceptual model of chapter 4. In addition, a sensitivity analysis is conducted in order to gain understanding of the behavior of the model. A validation: “provides evidence (substantial) for how accurately the computational model simulate the reality” (Oberkampf, Trucano, & Hirsch, 2002, p. 9). In addition, the validation should provide an answer to the question if the model fulfills its intended propose (PTC, 2013). So, is the model the right
62
tool for the business problem of KLM Cargo Operations? The validity of the model is checked in 6.3 by comparing the reality with the results of the model and the properties of the model.
6.2 Verification This section is concerned with the question if the model is correctly specified. In the verification, the conceptual model of chapter 4 is compared to the computerized model. In this section the formulas of the objective function, decision variables, parameters and constraints are checked. A sensitivity analysis is conducted in order to learn about the behavior of the model.
6.2.1 Objective The objective of this research is to minimize the total handling costs at Schiphol by a cargo flow allocation. The objective cell multiplies the decision variables and the net costs of the handling options. Each flow is assigned to one handling option. So, only one handling option contributes to the total net costs of a cargo flow allocation scenario. The Simplex algorithm presents a global optimum. This means that the optimum presented can be assumed to be the best solution available. Since no nearby solution report is provided by OpenSolver, tests on the optimality are manually conducted. The most important findings of appendix H are described in this section. By adjusting the parameters is found how much these values could increase or decrease before the optimal solution changes. From the sensitivity analysis in section 6.2.4, is found that the impact on the model is larger when the difference between the marginal handling costs and the Menzies tariff becomes enlarges. Therefore, the effect of decreasing the marginal handling costs and increasing the Menzies handling tariff is presented. KLM marginal handling costs By decreasing the marginal handling costs with 4%, the inbound KLM flights from Bahrain are allocated to KLM instead of Menzies. When the marginal handling costs decrease with 7%, a larger adjustment is involved. The inbound Martinair flights from Asia are assigned to KLM (appendix H). Menzies tariff An increase of the Menzies tariff influences the optimal solution. By increasing the tariff with 6%, the optimal solution allocates one additional inbound KLM flow to KLM and one additional outbound flow to KLM. Increasing the handling tariff with 8%, the handled tons at KLM increase with 4%. An increase of the handling tariff of 10%, result in an increase of 7% of additional KLM cargo to the KLM warehouse. Lateral transport costs The lateral transport costs are considered null. In appendix H, tests on the optimal solution are performed by increasing the costs of lateral transport. By rule of thumb the lateral transportation costs equal the transport cost on the platform, which are calculated to be 0,002 €/kg. The model provides the function to assign costs for lateral transport from KLM to Menzies and from Menzies to KLM. Lateral transport costs KLM to Menzies Lateral transport costs from KLM to Menzies of 0,004€/kg does not impact the optimal solution. When lateral transport cost increases to 0,005€/kg, one additional KLM destination is allocated to the KLM warehouse. Lateral transport costs Menzies to KLM Lateral transport costs from Menzies to KLM of 0,006€/kg does not impact the optimal solution. When these costs equal 0,007€/kg, one additional origin is allocated to KLM.
63
Lateral transport cost The costs for lateral transport could rise to 0,004 €/kg without changing the optimal solution. From 0,005 €/kg the optimal solution changes because one additional destination is allocated to KLM. Increasing the lateral cost to 0,009€/kg result that one additional origin and destination is allocated to KLM. Market growth The DSS provides the function to increase the weight of cargo flows. For instance, cargo flows from Asia to Africa could be increased by a certain percentage. For this analysis all cargo flows are increased by 50%, 75% and 100%. Market growth will not impact the optimal cargo flow allocation. Nearby solutions From this analysis on the nearby solutions can be concluded, KLM flows are sensitive for increasing the handling tariff or decreasing the marginal costs. The marginal costs should decrease with 7% before the inbound Martinair flow from Asia is assigned to KLM. The handling tariff can increase with 10% without allocating Martinair flows to KLM. Cost for lateral transport cost can increase significantly before its influences the optimal solution. Lateral transport cost could be set to 0,005€/kg before it impacts the optimal cargo flow allocation. Note that this is a large adjustment, because these costs for lateral transport are estimated to be 0,002€/kg.
6.2.2 Decision variables A flow could be assigned to different decision variables (DV). How many DVs are applicable to a flow is dependent on the type of flow. In this section is elaborated how each flow is assigned to one handling option. In the model no integer constraints are set. The fact that the model presents a solution with only integers can be explained by the ‘integer solution property’. The objective is calculated with the Simplex algorithm. “If you use the simplex method to solve any minimum cost network flow model having integer constraints RHS values, then the optimal solution automatically assumes integer values” (Ragsdale, 2004, p. 197). The integer solution can also be explained as: “assuming that the upper and lower bounds on the variables are integers and the right-hand-side values for the flow-balance equations are integers, the values of the basic variables are also integers when the non-basic variables are set to their upper or lower bounds” (Winston & Venkataramanan, 2002, p. 254). Since the lower and upper bound are constraint to be 0 and 1, the optimal solution will be presented with integers. Since all DVs in this model should equal one or zero this LP can be qualified as pure Integer Linear Programming: ILP (Taylor 3, 2007).
6.2.3 Costs functions The parameters defined in chapter 4.4 are used to calculate the net costs for each flow. In the next section, the sensitivity of these parameters are elaborated. In this section is tested if the costs functions are modeled correctly. The net costs are dependent on the operating carrier, the cargo handling warehouse, the type of flow and the transport modality. In appendix L, the costs functions are presented in detail. To verify if the formulas are modeled correctly, the help of experts was requested. Emiel Out, Controller Hub, and Bart Krol, project manager at KLM Cargo Operations, agreed upon the specification of the formulas. Mark van Zijl of Martinair Cargo Operations, concluded that the model is modeled correctly according to Martinair and Menzies processes.
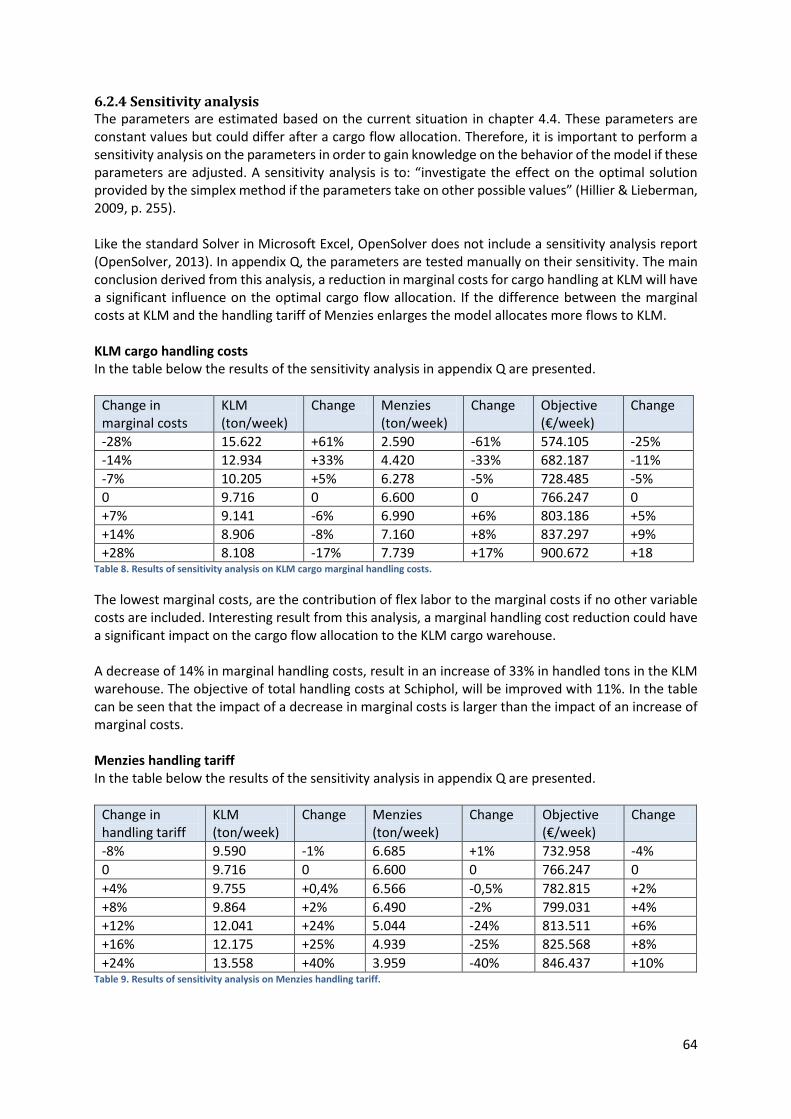
64
6.2.4 Sensitivity analysis The parameters are estimated based on the current situation in chapter 4.4. These parameters are constant values but could differ after a cargo flow allocation. Therefore, it is important to perform a sensitivity analysis on the parameters in order to gain knowledge on the behavior of the model if these parameters are adjusted. A sensitivity analysis is to: “investigate the effect on the optimal solution provided by the simplex method if the parameters take on other possible values” (Hillier & Lieberman, 2009, p. 255). Like the standard Solver in Microsoft Excel, OpenSolver does not include a sensitivity analysis report (OpenSolver, 2013). In appendix Q, the parameters are tested manually on their sensitivity. The main conclusion derived from this analysis, a reduction in marginal costs for cargo handling at KLM will have a significant influence on the optimal cargo flow allocation. If the difference between the marginal costs at KLM and the handling tariff of Menzies enlarges the model allocates more flows to KLM. KLM cargo handling costs In the table below the results of the sensitivity analysis in appendix Q are presented.
Change in marginal costs
KLM (ton/week)
Change Menzies (ton/week)
Change Objective (€/week)
Change
-28% 15.622 +61% 2.590 -61% 574.105 -25%
-14% 12.934 +33% 4.420 -33% 682.187 -11%
-7% 10.205 +5% 6.278 -5% 728.485 -5%
0 9.716 0 6.600 0 766.247 0
+7% 9.141 -6% 6.990 +6% 803.186 +5%
+14% 8.906 -8% 7.160 +8% 837.297 +9%
+28% 8.108 -17% 7.739 +17% 900.672 +18 Table 8. Results of sensitivity analysis on KLM cargo marginal handling costs.
The lowest marginal costs, are the contribution of flex labor to the marginal costs if no other variable costs are included. Interesting result from this analysis, a marginal handling cost reduction could have a significant impact on the cargo flow allocation to the KLM cargo warehouse. A decrease of 14% in marginal handling costs, result in an increase of 33% in handled tons in the KLM warehouse. The objective of total handling costs at Schiphol, will be improved with 11%. In the table can be seen that the impact of a decrease in marginal costs is larger than the impact of an increase of marginal costs. Menzies handling tariff In the table below the results of the sensitivity analysis in appendix Q are presented.
Change in handling tariff
KLM (ton/week)
Change Menzies (ton/week)
Change Objective (€/week)
Change
-8% 9.590 -1% 6.685 +1% 732.958 -4%
0 9.716 0 6.600 0 766.247 0
+4% 9.755 +0,4% 6.566 -0,5% 782.815 +2%
+8% 9.864 +2% 6.490 -2% 799.031 +4%
+12% 12.041 +24% 5.044 -24% 813.511 +6%
+16% 12.175 +25% 4.939 -25% 825.568 +8%
+24% 13.558 +40% 3.959 -40% 846.437 +10% Table 9. Results of sensitivity analysis on Menzies handling tariff.
65
KLM pays a higher average costs per kilogram to Menzies. The reason for these higher cost are unknown for the financial department of KLM Cargo Operations. Therefore, a sensitivity analysis is performed with a higher Menzies handling tariff. An increase of the handling tariff has a large impact on the cargo flow allocation. In table 8 is shown, the LP model is sensitive for increasing the Menzies handling tariff. The impact of an increase of 8% remains low. But increasing the handling tariff even more with 12% and 16%, result in large impact on the model allocation. From this sensitivity analysis can be concluded that the model is sensitive for an increasing difference between the Menzies handling tariff and the KLM marginal handling costs.
6.2.5 Constraint setting The model works correctly if constraints are set. In this section the test that are preformed are elaborated. Origin-carrier and destination-carrier combinations The data file contains origin-carrier combination and destination-carrier combination in multiple rows. If these combinations are carried by airplane, the same origin-carrier combinations and destination-carrier combinations are constrained to be assigned to KLM or Menzies. In an overview is presented in the model that this constraints are met. Flows of Martinair are divided into: Africa, Americas and Asia. A Martinair flight contains cargo of multiple origins or destinations. If these origins and destinations are handled by different cargo handlers, it creates a situation where one flights is handled by two cargo handles at Schiphol. The DSS is modelled in such a way that cargo handling of one flight by two cargo handlers is avoided. The function is provided to constrain these flows to Menzies or KLM. These constraints are presented in a clear overview. KLM Cargo as operating carrier is not allowed to transport cargo between outstations. So only point-to-point connections. This implies that an origin-carrier combination is carried by one KLM flight. Therefore could KLM origins and destinations assigned to KLM or Menzies and are these origins and destination not divided into larger flows. These constraints are presented in a clear overview. Capacity constraint A capacity constraint per week is taken as the capacity constraint of the KLM Cargo warehouse. An adjustment of the cargo flow allocation could result in a change of the arrival and departure of flights. If these capacity constraints are set, the model still works correctly. How these capacity constraints are calculated are presented in appendix P. When scenarios are tested that constrain the solution space, for example when a capacity limit of the KLM warehouse is set, the ‘integer solution property’ does not hold. When scenarios are tested with capacity constraints the decision variables should be constrained with integers. Without integer constraints the solution provided by the model will contain non-integer decision variables.
66
6.2.6 Input data In this section the adjustments to the data file to obtain the input file are presented. In addition, is described that the input of the model equals the output. Focus on allocating large flows A reduction of total records and decision variables could contribute to the solving time of OpenSolver. The large flows will probably remain stable. The small flows could be confusing for recommendations and could be based on more ad hoc shipments. Therefore this model focusses on allocating the large cargo flows by excluding the smallest flows which amount of 5% of the data. Market developments As described in the literature review is KLM Cargo Operations operating in a dynamic market with changing market conditions. For KLM it could be very useful if the DSS can test different future scenarios. Therefore, if a certain cargo flow to a market area is expected to grow the DSS provides the function to increase these flows. The output of this model remain the same as the input. Input equals output Multiple test are conducted to verify if the output equals the input of the model. Since the problem is converted to an integer problem, the output equals the input if each flow is assigned to exactly one handling option. Each flow is constraint to be assigned to one handling option. Therefore, the output of the model equals the input of the model.
6.3 Validation In the previous section, the conceptual model is compared with the computerized model. In this section is tested if the computerized model simulates the reality. First the outcome of the model is compared to the initial main research question of this thesis. Thereafter the relevancy and limitations of the model for the business problem is elaborated.
6.3.1 Intended purpose In this section the intended purpose of the DSS is elaborated. The main research question of this research is:
How could the net costs for KLM Cargo Operations be minimized by adjusting the cargo flow allocation of KLM and Martinair cargo flows between KLM and Menzies warehouses at Schiphol?
In this section the results of the DSS are presented. If these results could contribute to an answer to the research question is described. Thereafter is described if these results and the cargo flow allocation present the reality. Outcome of DSS Besides the information on the net costs, non-financial KPIs are presented. From the KPI analysis in chapter 2 can be derived that the following KPIs are important for KLM Cargo Operations: costs, load factor, customer quality and productivity. With the help of a causal analysis in chapter 3.1, the elements are presented that influence these KPIs. In addition, valuable insights on the impact on involved actors; Menzies (MWC) and customers are presented. These elements are shown in the outcome of the DSS. In the table below, the results of the scenario that modelled the current scenario are presented.
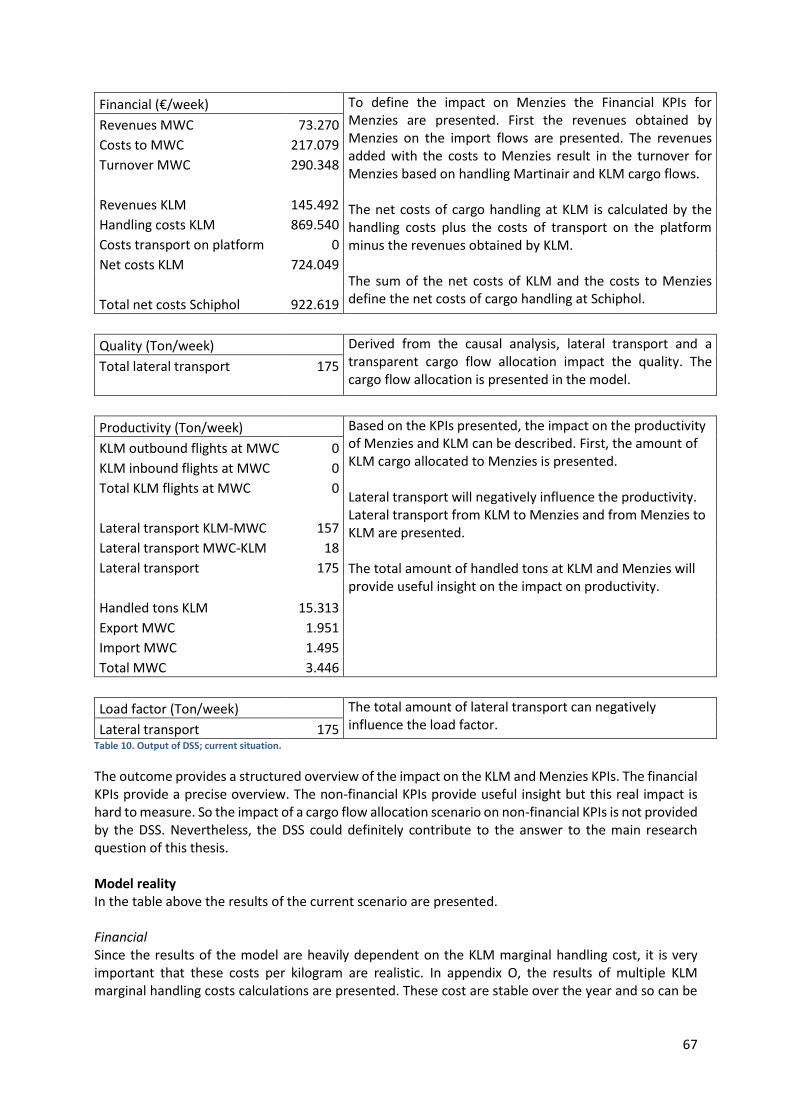
67
Financial (€/week) To define the impact on Menzies the Financial KPIs for Menzies are presented. First the revenues obtained by Menzies on the import flows are presented. The revenues added with the costs to Menzies result in the turnover for Menzies based on handling Martinair and KLM cargo flows. The net costs of cargo handling at KLM is calculated by the handling costs plus the costs of transport on the platform minus the revenues obtained by KLM. The sum of the net costs of KLM and the costs to Menzies define the net costs of cargo handling at Schiphol.
Revenues MWC 73.270
Costs to MWC 217.079
Turnover MWC 290.348
Revenues KLM 145.492
Handling costs KLM 869.540
Costs transport on platform 0
Net costs KLM 724.049
Total net costs Schiphol 922.619
Quality (Ton/week) Derived from the causal analysis, lateral transport and a transparent cargo flow allocation impact the quality. The cargo flow allocation is presented in the model.
Total lateral transport 175
Productivity (Ton/week) Based on the KPIs presented, the impact on the productivity of Menzies and KLM can be described. First, the amount of KLM cargo allocated to Menzies is presented. Lateral transport will negatively influence the productivity. Lateral transport from KLM to Menzies and from Menzies to KLM are presented. The total amount of handled tons at KLM and Menzies will provide useful insight on the impact on productivity.
KLM outbound flights at MWC 0
KLM inbound flights at MWC 0
Total KLM flights at MWC 0
Lateral transport KLM-MWC 157
Lateral transport MWC-KLM 18
Lateral transport 175
Handled tons KLM 15.313
Export MWC 1.951
Import MWC 1.495
Total MWC 3.446
Load factor (Ton/week) The total amount of lateral transport can negatively influence the load factor. Lateral transport 175
Table 10. Output of DSS; current situation.
The outcome provides a structured overview of the impact on the KLM and Menzies KPIs. The financial KPIs provide a precise overview. The non-financial KPIs provide useful insight but this real impact is hard to measure. So the impact of a cargo flow allocation scenario on non-financial KPIs is not provided by the DSS. Nevertheless, the DSS could definitely contribute to the answer to the main research question of this thesis. Model reality In the table above the results of the current scenario are presented. Financial Since the results of the model are heavily dependent on the KLM marginal handling cost, it is very important that these costs per kilogram are realistic. In appendix O, the results of multiple KLM marginal handling costs calculations are presented. These cost are stable over the year and so can be
68
concluded that the parameter used in the LP model is realistic. The Menzies handling tariff is contracted and therefore no deviation for this parameter is expected. Lateral transport The amount of lateral transport presented by the LP model is compared with data from ‘Chain Data warehouse’ data base. Results of the Chain Data warehouse present the same amount of lateral transport for the same weeks as the input data of the LP model. Handled tons KLM & Menzies The cargo allocation between KLM and Menzies equals the cargo allocation in reality only if the data reduction of 5% is taken into account. To improve the solving time and the design of the DSS, the decision is taken to focus on the large cargo flows by excluding the smallest 5% of cargo flows. The data reduction results that the total amount of handled tons at KLM and Menzies is lower than reality. Furthermore, the data reduction of 5% contained ‘carried tons’, the effect on ‘handled tons’ is even larger. Therefore, in reality the amount of handled tons is between 7% and 8% higher than the results of the model.
6.3.2 Relevance for business problem In this section the relevance of the DSS for the business problem is presented. Costs versus quality The DSS especially provides useful information on the financial KPIs. Since KLM Cargo operate in difficult economic times, this DSS could contribute to an improvement in profit and loses. A cargo flow allocation could have large impact on the current organization processes and non-financial KPIs. Therefore, a decision on a cargo flow allocation requires more analysis than provided by the DSS. Results should carefully be interpreted because these non-financial KPIs are also important. Social relevance of model Menzies is chosen by KLM Cargo as a long term strategic partner. The DSS could help in defining the most beneficial allocation between KLM and Menzies. Good relationship with Menzies In July a heavy discussion between KLM and Menzies was being held because cargo handling at Menzies was behind on schedule of the target of 195.00 ton/year. This DSS could have provided useful insight for the discussion with Menzies. The DSS provides specific information on the financial Menzies KPIs. Therefore, the DSS could provide valuable information on maintaining a good relationship with Menzies. Process improvements The model presents in which flows KLM is competitive compared to Menzies. So, the model presents in which processes KLM should improve. Negotiations with Menzies In future negotiations with Menzies, the DSS could improve the quality of information available for KLM Cargo. Scenarios can be tested on their profitability before a new contract is signed. To give an example, KLM wants to allocate a particular Martinair flow to the KLM warehouse. Menzies demands an increase in handling tariff for the remaining cargo handled by Menzies. The DSS could help in calculating the break-even point of the cargo flow allocation adjustment and the increasing Menzies handling tariff. So, KLM could agree upon an increase of Menzies handling tariff to maintain a good relationship and still know that the cargo flow allocation to KLM would be beneficial for the KLM business results.
69
New KLM warehouse For many years a negotiation between the Schiphol Group and KLM is being held about a relocation of the KLM cargo handling warehouse. The model could help defining the optimal cargo capacity available for a new KLM warehouse.
6.4 Preliminary conclusions In this section the following research question is answered:
Does the model present a valid representation of the reality? Verification A verification on the model elements, conclude that the mathematical formulations of the DSS are modelled correctly. So, the translation of the conceptual model into a computerized model is approved. A sensitivity analysis and an analysis on the nearby solutions of the optimal scenario, present an expected behavior of the model. Interesting result is that the optimal scenario changes if the differences between the KLM marginal handling costs and the Menzies handling tariff increases. If the difference decreases, the impact on the optimal scenario remains low. Validation The results presented by the DSS, include the information which was initially preferred by KLM Cargo Operations. The DSS presents the impact on financial KPIs and provides useful indicators of the impact on non-financial KLM KPIs. The results of the DSS present the business problem realistically.

70
Part 4: Evaluation
71
7. Scenario analysis In this chapter different cargo flow allocation scenarios are tested with the help of a designed Decision Support System (DSS). Scenarios are compared on KPIs, based on quantitative results presented by the model. In addition, the impact on customers and Menzies is described based on the cargo flow allocation and results from the model. From the actor analysis is derived that these two external actors have the highest interest in the outcome of this research. Therefore, the following research question is established for this chapter:
How could the current cargo flow allocation between KLM and Menzies be optimized according to the DSS, taken into account the impact on external actors?
The first section elaborates on the scenario analysis methodology and introduces the scenarios. The results of the scenario analysis are presented in section two to five. These scenarios are compared in section six. The most valuable results from an extensive scenario analysis are presented in section seven. The results and limitations of the LP model are discussed in section eight. The final section answers the research questions of this chapter.
7.1 Scenario analysis methodology With the help of the LP model, different cargo flow allocation scenarios are compared. The reasons for the selected scenarios to be presented in this chapter are described. Thereafter, the elements on which the scenarios are compared are elaborated. In this chapter, the scenarios are described based on: results of LP model, impact on KLM KPIs, impact on customers and the impact on Menzies.
7.1.1 Scenarios
Throughout this research multiple interesting cargo flow allocation opportunities are found. In section seven the most important results from an extensive scenario analysis are presented. In this chapter only the scenarios that provide insight on high level are described:
Scenario 0: Current Scenario 1: Optimal Scenario 2: Optimal + 11.000 ton/week at KLM Scenario 3: Martinair flows at KLM
In scenario 0 the current situation is modeled. The current situation is compared to the situation before the first of May 2013 where all Martinair Cargo was handled by Menzies. The current scenario will be used as base to compare the impact of different scenarios. The first and second scenario will provide insight in the most optimal cargo flow allocation at Schiphol. In scenario 1, the LP provides a cargo flow allocation in which the total amount of handled cargo at KLM is below 11.000 tons/week. Since permanent KLM labor could handle 11.000 ton/week, a situation is presented with a minimum of 11.000 ton/week at KLM in scenario 2. The marginal handling costs of KLM are based on a situation in which KLM handles more than 11.000 ton/week, because the layoff of permanent KLM labor is considered out of scope for this research. Currently, KLM prefers a situation where all KLM cargo is handled at the KLM cargo warehouse. Taken this constraint into account, this situation is optimized in the third scenario.
7.1.2 Cargo flow allocation The cargo flow allocation presented by the DSS is presented for each scenario. Inbound KLM flights from 52 origins can be allocated to KLM or Menzies. Outbound KLM flights to 52 destinations can be
72
handled at KLM or Menzies. All flights of KLM within Europe are assigned to KLM. These flights are often small airplanes which mostly carry equation cargo. Equation cargo is handled by Freight Building (FB) 1. In this process, time is essential because of short delivery time before departure. For future research cooperation between FB1 and Menzies could be interesting but left out of scope in this research. Martinair flows to or from the Americas, Asia and Africa can be allocated between Menzies and KLM. Martinair flights always stop at multiple destinations in these areas. So flights from these areas contain cargo of multiple destinations. Since cargo handling of one flight by two cargo handlers should be avoided, flights of these areas should be allocated to either KLM or Menzies. In appendix R, the flight schedule of Martinair is presented. As described in chapter 3, the total capacity of the KLM and Menzies warehouse is defined in handled tons. KLM Cargo makes a distinction between ‘Europe trucks’ and ‘Amsterdam trucks’. Menzies does not make this distinction. This results that a cargo flow into Europe or from Europe is calculated twice at KLM, and not at Menzies. So, the total amount of handled tons differ for each scenario.
7.1.3 Impact on KLM KPIs For these research the impact of a cargo flow allocation adjustment affects the KLM Key Performance Indicators (KPIs). The impact on costs, productivity, quality and the load factor is elaborated. The measurements that affect these KPIs are derived from the causal analysis in chapter 3.1. Financial KPIs The costs to Menzies, revenues obtained by import charges and the handling costs at KLM define the total net costs of cargo handling for KLM Cargo. Since the revenues obtained are subtracted from the handling costs in the KLM warehouse and the costs to Menzies, the total net costs of cargo handling at Schiphol are derived. Non-financial KPIs The LP model can provide valuable insights on the non-financial KPIs, but the model cannot define how much the KPIs will increase or decrease. In this section, the processes or changes that affect these KPIs are presented. One process will affect all three non-financial KPIs. The total amount of lateral transport will affect the productivity, quality and load factor. Currently 175 ton/week is transported between KLM and Menzies. Merel Osinga (2013), Head of Transport, does not expect an influence on the KPIs before 500 ton/week. Although the lateral transports affect these KPIs, is assumed that this impact will be minim before exceeding 500 ton/week. Productivity The productivity of KLM Cargo Operations is affected by lateral transport, the handled tons at KLM and the labor intensity of a cargo flow. If more tons are handled at KLM compared to the current situation, the productivity increases. If a cargo flow contains low labor intensive work, this could positively influence the productivity. Load factor According to the Revenue Management (RM) department of KLM Cargo, it would be beneficial for the load factor if shared KLM and Martinair destinations were handled at one warehouse. This is because RM could easily rebook shipments on different airplanes when the same destinations of KLM and Martinair are handled from the same warehouse.
73
Quality The quality of cargo handling is important for KLM. In this thesis is assumed that the quality of cargo handling at Menzies equals the cargo handling at KLM. So, additional cargo handling at Menzies will not impact the quality.
7.1.4 Impact on customers Each flow contains cargo of multiple customers. Customers for particular flows could change over time. A cargo flow allocation adjustment could impact some of the customers. To define the real impact on customers, additional research needs to be conducted. It could be interesting to know which customers transport cargo on which flows. Hereby, the processes of the particular customers could be taken into account when the cargo flow allocation is adjusted. In this chapter is described, the impact that is expected for the majority of the customers. Processing time of Menzies From the process analysis can be derived that the delivery time before departure of Menzies is three hours earlier than at the KLM Cargo warehouse. A longer processing time at Menzies could result that cargo misses connecting flights. In addition, the total time of cargo transport will increase with three hours. This could negatively impact customer satisfaction. Transparency A transparent cargo flow allocation at Schiphol, is important for the customer satisfaction. Currently the cargo flow allocation at Schiphol is relatively transparent because all KLM flights are handled at KLM and Martinair flows at Menzies except for the inbound Asia flow. A nontransparent cargo flow allocation could increase trucking problems. When for instance different KLM flows are handled at both KLM and Menzies, the customer needs to be alert when delivering cargo for multiple KLM destinations. Clear communication with customers is therefore important so customers know where and when to deliver their cargo. J. van de Put Fresh Cargo Handling For Martinair Cargo one important customer is defined; J. van de Put Fresh Cargo Handling. Martinair flows from Americas and Africa mostly contain flowers. From the data analysis of Martinair cargo flows is derived, about 95% of the Africa flow contains flowers (appendix N). The Americas flow contains approximately 55% of flowers (appendix N). For most ULDs of these flights, Menzies provides airside delivery to van de Put. Handling these flows for Menzies is beneficial because it contains low labor intensive work. In addition, these flows are large import flows, so important charges are invoiced. J. van de Put and Menzies established a long term relationship on handling the ‘flower flights’. When these flows are allocated to KLM, this should be clearly communicated with J. van de Put to avoid resistance.
7.1.5 Impact on Menzies From the Menzies KPI analysis in chapter 2 is derived that, ‘productivity’ and ‘revenues’ are the most important KPIs for Menzies that could be affected by a cargo flow allocation adjustment. Productivity can be improved by handling additional cargo at Menzies. In addition, handling ULDs that require low labor intensive work improve the productivity. Revenues can be increased by handling additional cargo and handling additional import cargo at Menzies. In this research is assumed that handling additional cargo at Menzies is the most preferred by Menzies, because this could improve productivity and revenues.
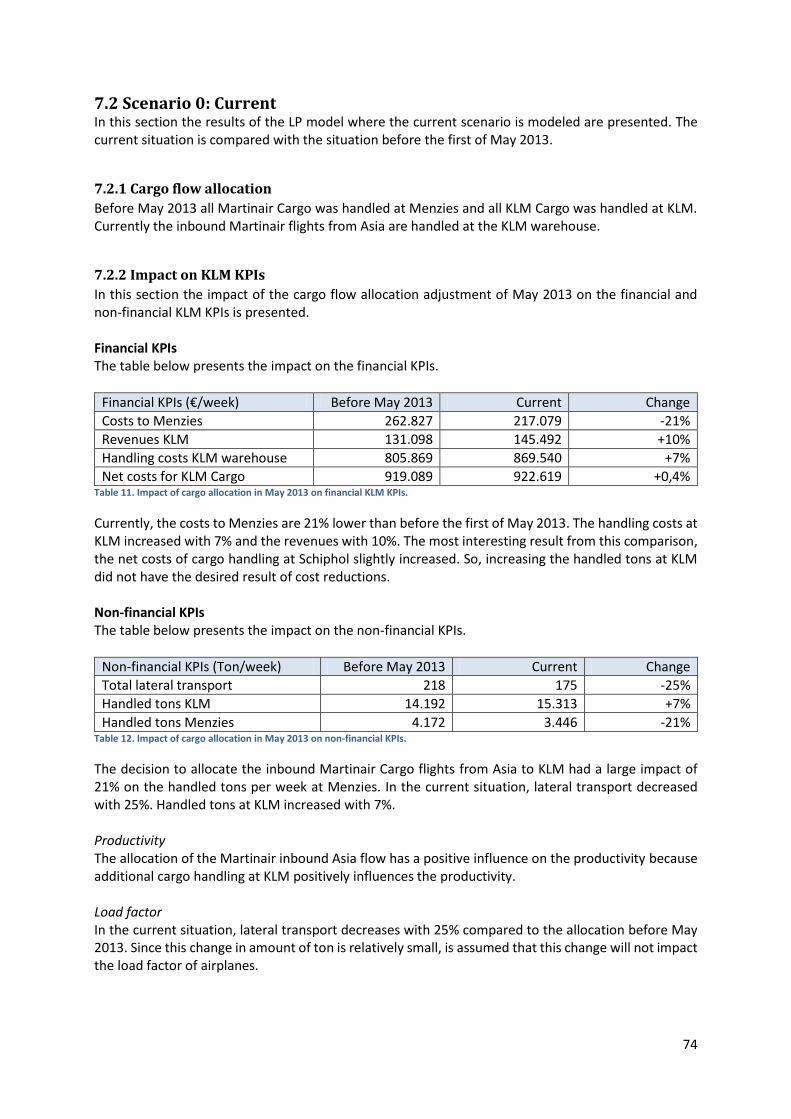
74
7.2 Scenario 0: Current In this section the results of the LP model where the current scenario is modeled are presented. The current situation is compared with the situation before the first of May 2013.
7.2.1 Cargo flow allocation
Before May 2013 all Martinair Cargo was handled at Menzies and all KLM Cargo was handled at KLM. Currently the inbound Martinair flights from Asia are handled at the KLM warehouse.
7.2.2 Impact on KLM KPIs
In this section the impact of the cargo flow allocation adjustment of May 2013 on the financial and non-financial KLM KPIs is presented. Financial KPIs The table below presents the impact on the financial KPIs.
Financial KPIs (€/week) Before May 2013 Current Change
Costs to Menzies 262.827 217.079 -21%
Revenues KLM 131.098 145.492 +10%
Handling costs KLM warehouse 805.869 869.540 +7%
Net costs for KLM Cargo 919.089 922.619 +0,4% Table 11. Impact of cargo allocation in May 2013 on financial KLM KPIs.
Currently, the costs to Menzies are 21% lower than before the first of May 2013. The handling costs at KLM increased with 7% and the revenues with 10%. The most interesting result from this comparison, the net costs of cargo handling at Schiphol slightly increased. So, increasing the handled tons at KLM did not have the desired result of cost reductions. Non-financial KPIs The table below presents the impact on the non-financial KPIs.
Non-financial KPIs (Ton/week) Before May 2013 Current Change
Total lateral transport 218 175 -25%
Handled tons KLM 14.192 15.313 +7%
Handled tons Menzies 4.172 3.446 -21% Table 12. Impact of cargo allocation in May 2013 on non-financial KPIs.
The decision to allocate the inbound Martinair Cargo flights from Asia to KLM had a large impact of 21% on the handled tons per week at Menzies. In the current situation, lateral transport decreased with 25%. Handled tons at KLM increased with 7%. Productivity The allocation of the Martinair inbound Asia flow has a positive influence on the productivity because additional cargo handling at KLM positively influences the productivity. Load factor In the current situation, lateral transport decreases with 25% compared to the allocation before May 2013. Since this change in amount of ton is relatively small, is assumed that this change will not impact the load factor of airplanes.
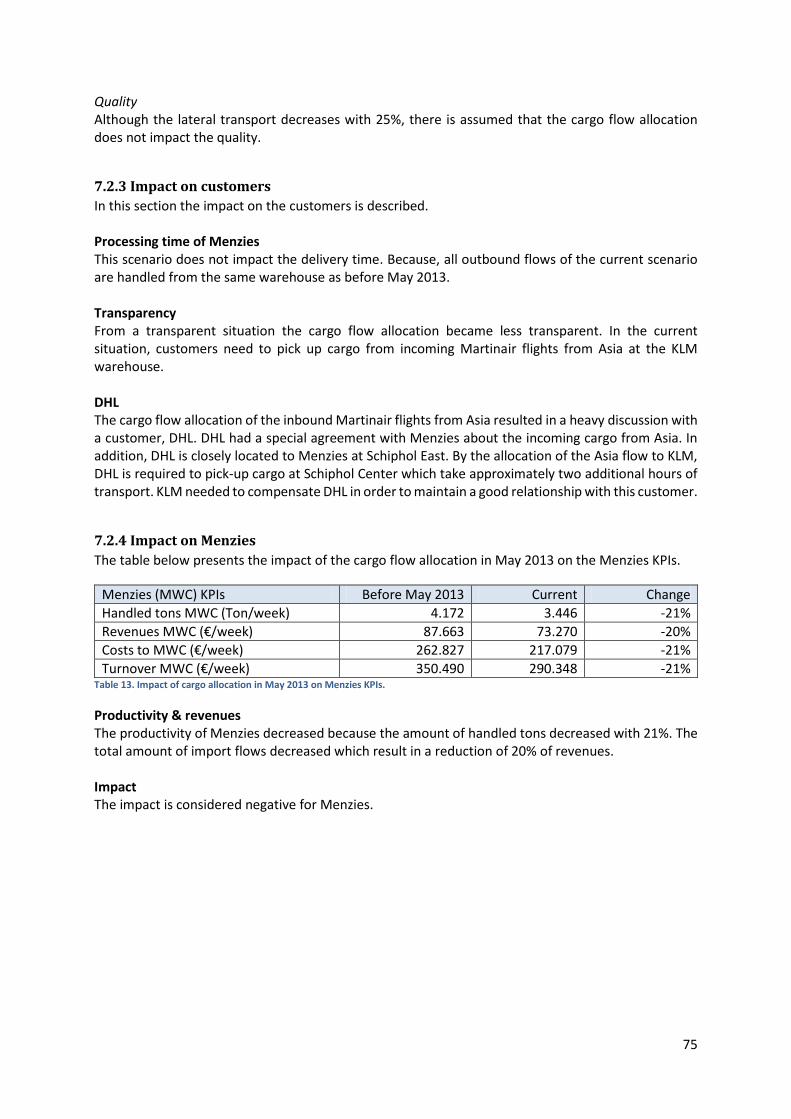
75
Quality Although the lateral transport decreases with 25%, there is assumed that the cargo flow allocation does not impact the quality.
7.2.3 Impact on customers
In this section the impact on the customers is described. Processing time of Menzies This scenario does not impact the delivery time. Because, all outbound flows of the current scenario are handled from the same warehouse as before May 2013. Transparency From a transparent situation the cargo flow allocation became less transparent. In the current situation, customers need to pick up cargo from incoming Martinair flights from Asia at the KLM warehouse. DHL The cargo flow allocation of the inbound Martinair flights from Asia resulted in a heavy discussion with a customer, DHL. DHL had a special agreement with Menzies about the incoming cargo from Asia. In addition, DHL is closely located to Menzies at Schiphol East. By the allocation of the Asia flow to KLM, DHL is required to pick-up cargo at Schiphol Center which take approximately two additional hours of transport. KLM needed to compensate DHL in order to maintain a good relationship with this customer.
7.2.4 Impact on Menzies
The table below presents the impact of the cargo flow allocation in May 2013 on the Menzies KPIs.
Menzies (MWC) KPIs Before May 2013 Current Change
Handled tons MWC (Ton/week) 4.172 3.446 -21%
Revenues MWC (€/week) 87.663 73.270 -20%
Costs to MWC (€/week) 262.827 217.079 -21%
Turnover MWC (€/week) 350.490 290.348 -21% Table 13. Impact of cargo allocation in May 2013 on Menzies KPIs.
Productivity & revenues The productivity of Menzies decreased because the amount of handled tons decreased with 21%. The total amount of import flows decreased which result in a reduction of 20% of revenues. Impact The impact is considered negative for Menzies.
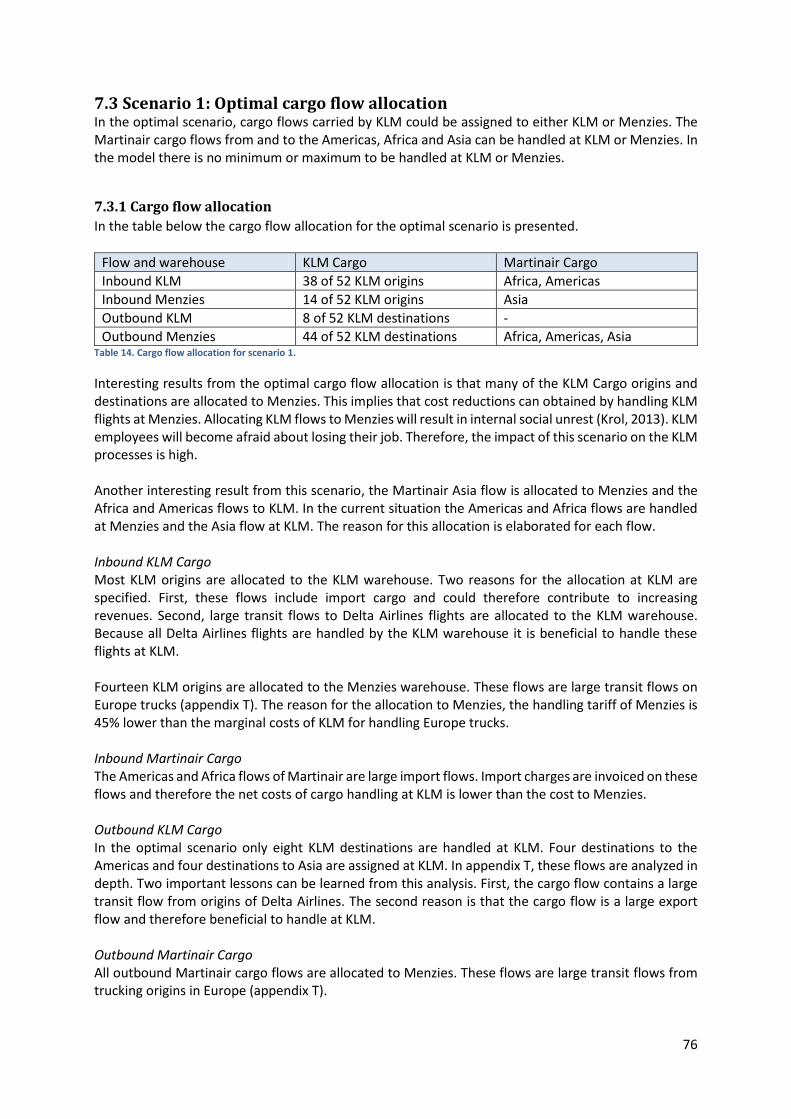
76
7.3 Scenario 1: Optimal cargo flow allocation In the optimal scenario, cargo flows carried by KLM could be assigned to either KLM or Menzies. The Martinair cargo flows from and to the Americas, Africa and Asia can be handled at KLM or Menzies. In the model there is no minimum or maximum to be handled at KLM or Menzies.
7.3.1 Cargo flow allocation
In the table below the cargo flow allocation for the optimal scenario is presented.
Flow and warehouse KLM Cargo Martinair Cargo
Inbound KLM 38 of 52 KLM origins Africa, Americas
Inbound Menzies 14 of 52 KLM origins Asia
Outbound KLM 8 of 52 KLM destinations -
Outbound Menzies 44 of 52 KLM destinations Africa, Americas, Asia Table 14. Cargo flow allocation for scenario 1.
Interesting results from the optimal cargo flow allocation is that many of the KLM Cargo origins and destinations are allocated to Menzies. This implies that cost reductions can obtained by handling KLM flights at Menzies. Allocating KLM flows to Menzies will result in internal social unrest (Krol, 2013). KLM employees will become afraid about losing their job. Therefore, the impact of this scenario on the KLM processes is high. Another interesting result from this scenario, the Martinair Asia flow is allocated to Menzies and the Africa and Americas flows to KLM. In the current situation the Americas and Africa flows are handled at Menzies and the Asia flow at KLM. The reason for this allocation is elaborated for each flow. Inbound KLM Cargo Most KLM origins are allocated to the KLM warehouse. Two reasons for the allocation at KLM are specified. First, these flows include import cargo and could therefore contribute to increasing revenues. Second, large transit flows to Delta Airlines flights are allocated to the KLM warehouse. Because all Delta Airlines flights are handled by the KLM warehouse it is beneficial to handle these flights at KLM. Fourteen KLM origins are allocated to the Menzies warehouse. These flows are large transit flows on Europe trucks (appendix T). The reason for the allocation to Menzies, the handling tariff of Menzies is 45% lower than the marginal costs of KLM for handling Europe trucks. Inbound Martinair Cargo The Americas and Africa flows of Martinair are large import flows. Import charges are invoiced on these flows and therefore the net costs of cargo handling at KLM is lower than the cost to Menzies. Outbound KLM Cargo In the optimal scenario only eight KLM destinations are handled at KLM. Four destinations to the Americas and four destinations to Asia are assigned at KLM. In appendix T, these flows are analyzed in depth. Two important lessons can be learned from this analysis. First, the cargo flow contains a large transit flow from origins of Delta Airlines. The second reason is that the cargo flow is a large export flow and therefore beneficial to handle at KLM. Outbound Martinair Cargo All outbound Martinair cargo flows are allocated to Menzies. These flows are large transit flows from trucking origins in Europe (appendix T).
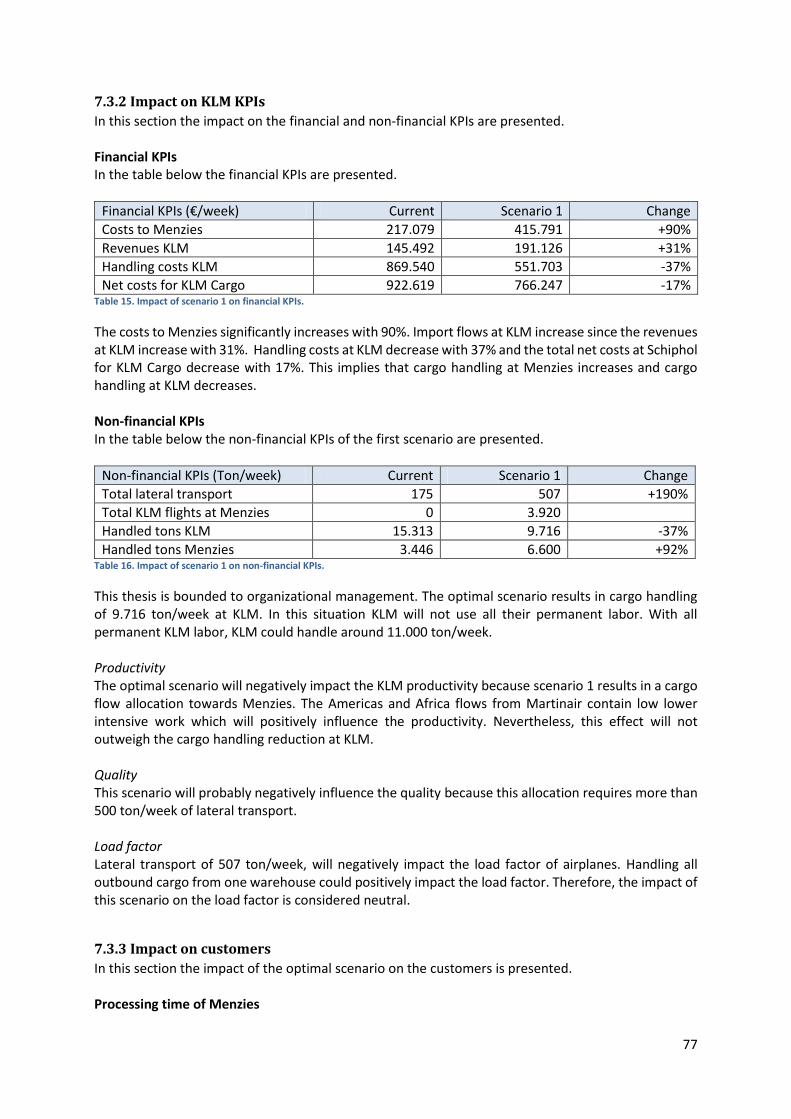
77
7.3.2 Impact on KLM KPIs
In this section the impact on the financial and non-financial KPIs are presented. Financial KPIs In the table below the financial KPIs are presented.
Financial KPIs (€/week) Current Scenario 1 Change
Costs to Menzies 217.079 415.791 +90%
Revenues KLM 145.492 191.126 +31%
Handling costs KLM 869.540 551.703 -37%
Net costs for KLM Cargo 922.619 766.247 -17% Table 15. Impact of scenario 1 on financial KPIs.
The costs to Menzies significantly increases with 90%. Import flows at KLM increase since the revenues at KLM increase with 31%. Handling costs at KLM decrease with 37% and the total net costs at Schiphol for KLM Cargo decrease with 17%. This implies that cargo handling at Menzies increases and cargo handling at KLM decreases. Non-financial KPIs In the table below the non-financial KPIs of the first scenario are presented.
Non-financial KPIs (Ton/week) Current Scenario 1 Change
Total lateral transport 175 507 +190%
Total KLM flights at Menzies 0 3.920
Handled tons KLM 15.313 9.716 -37%
Handled tons Menzies 3.446 6.600 +92% Table 16. Impact of scenario 1 on non-financial KPIs.
This thesis is bounded to organizational management. The optimal scenario results in cargo handling of 9.716 ton/week at KLM. In this situation KLM will not use all their permanent labor. With all permanent KLM labor, KLM could handle around 11.000 ton/week. Productivity The optimal scenario will negatively impact the KLM productivity because scenario 1 results in a cargo flow allocation towards Menzies. The Americas and Africa flows from Martinair contain low lower intensive work which will positively influence the productivity. Nevertheless, this effect will not outweigh the cargo handling reduction at KLM. Quality This scenario will probably negatively influence the quality because this allocation requires more than 500 ton/week of lateral transport. Load factor Lateral transport of 507 ton/week, will negatively impact the load factor of airplanes. Handling all outbound cargo from one warehouse could positively impact the load factor. Therefore, the impact of this scenario on the load factor is considered neutral.
7.3.3 Impact on customers
In this section the impact of the optimal scenario on the customers is presented. Processing time of Menzies
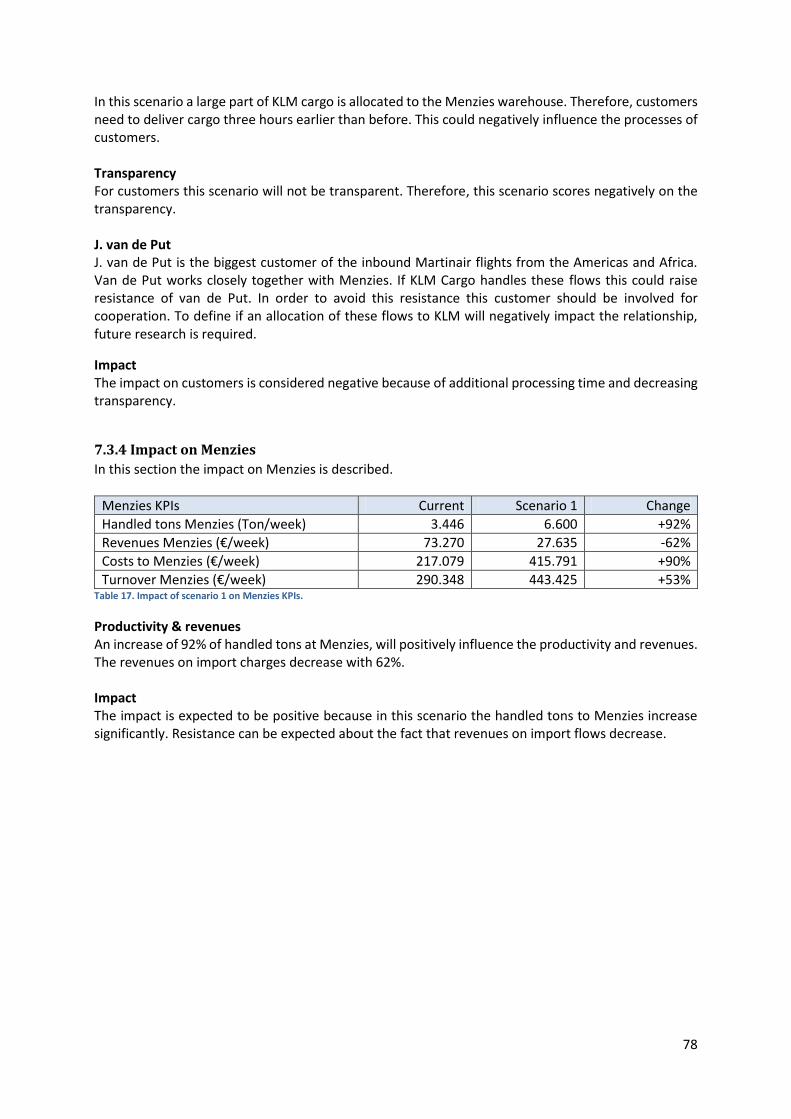
78
In this scenario a large part of KLM cargo is allocated to the Menzies warehouse. Therefore, customers need to deliver cargo three hours earlier than before. This could negatively influence the processes of customers. Transparency For customers this scenario will not be transparent. Therefore, this scenario scores negatively on the transparency. J. van de Put J. van de Put is the biggest customer of the inbound Martinair flights from the Americas and Africa. Van de Put works closely together with Menzies. If KLM Cargo handles these flows this could raise resistance of van de Put. In order to avoid this resistance this customer should be involved for cooperation. To define if an allocation of these flows to KLM will negatively impact the relationship, future research is required.
Impact The impact on customers is considered negative because of additional processing time and decreasing transparency.
7.3.4 Impact on Menzies
In this section the impact on Menzies is described.
Menzies KPIs Current Scenario 1 Change
Handled tons Menzies (Ton/week) 3.446 6.600 +92%
Revenues Menzies (€/week) 73.270 27.635 -62%
Costs to Menzies (€/week) 217.079 415.791 +90%
Turnover Menzies (€/week) 290.348 443.425 +53% Table 17. Impact of scenario 1 on Menzies KPIs.
Productivity & revenues An increase of 92% of handled tons at Menzies, will positively influence the productivity and revenues. The revenues on import charges decrease with 62%. Impact The impact is expected to be positive because in this scenario the handled tons to Menzies increase significantly. Resistance can be expected about the fact that revenues on import flows decrease.
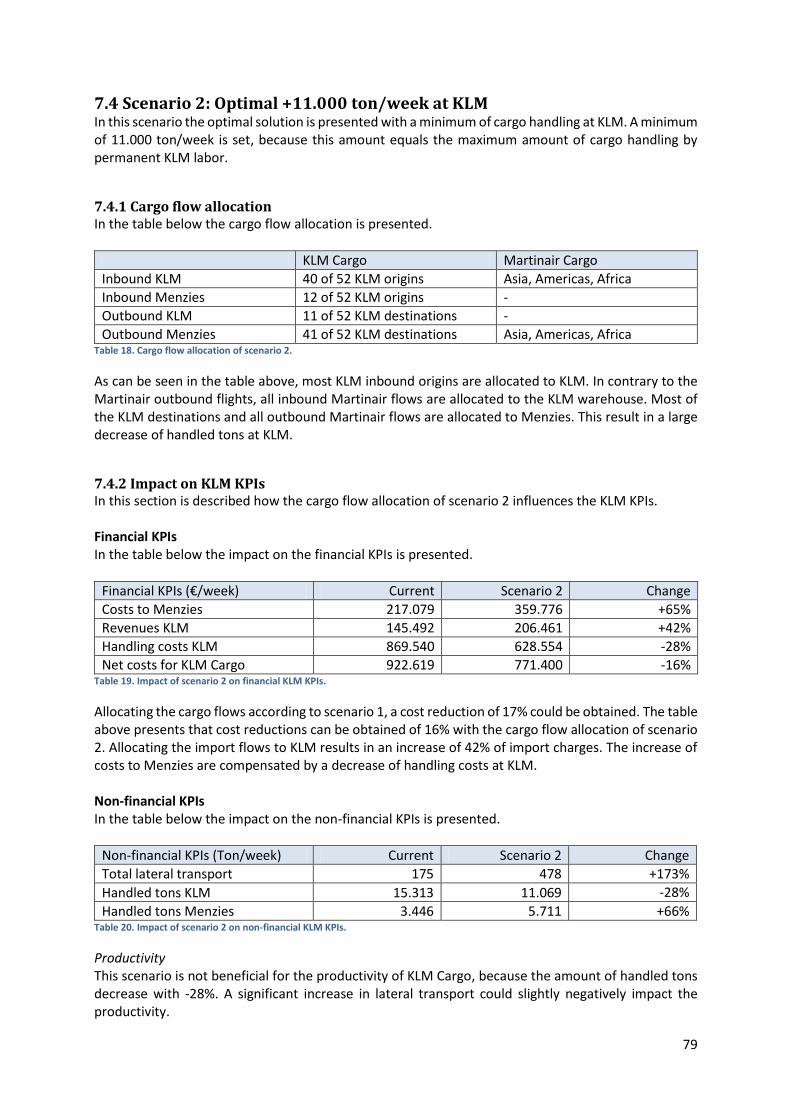
79
7.4 Scenario 2: Optimal +11.000 ton/week at KLM In this scenario the optimal solution is presented with a minimum of cargo handling at KLM. A minimum of 11.000 ton/week is set, because this amount equals the maximum amount of cargo handling by permanent KLM labor.
7.4.1 Cargo flow allocation In the table below the cargo flow allocation is presented.
KLM Cargo Martinair Cargo
Inbound KLM 40 of 52 KLM origins Asia, Americas, Africa
Inbound Menzies 12 of 52 KLM origins -
Outbound KLM 11 of 52 KLM destinations -
Outbound Menzies 41 of 52 KLM destinations Asia, Americas, Africa Table 18. Cargo flow allocation of scenario 2.
As can be seen in the table above, most KLM inbound origins are allocated to KLM. In contrary to the Martinair outbound flights, all inbound Martinair flows are allocated to the KLM warehouse. Most of the KLM destinations and all outbound Martinair flows are allocated to Menzies. This result in a large decrease of handled tons at KLM.
7.4.2 Impact on KLM KPIs In this section is described how the cargo flow allocation of scenario 2 influences the KLM KPIs. Financial KPIs In the table below the impact on the financial KPIs is presented.
Financial KPIs (€/week) Current Scenario 2 Change
Costs to Menzies 217.079 359.776 +65%
Revenues KLM 145.492 206.461 +42%
Handling costs KLM 869.540 628.554 -28%
Net costs for KLM Cargo 922.619 771.400 -16% Table 19. Impact of scenario 2 on financial KLM KPIs.
Allocating the cargo flows according to scenario 1, a cost reduction of 17% could be obtained. The table above presents that cost reductions can be obtained of 16% with the cargo flow allocation of scenario 2. Allocating the import flows to KLM results in an increase of 42% of import charges. The increase of costs to Menzies are compensated by a decrease of handling costs at KLM. Non-financial KPIs In the table below the impact on the non-financial KPIs is presented.
Non-financial KPIs (Ton/week) Current Scenario 2 Change
Total lateral transport 175 478 +173%
Handled tons KLM 15.313 11.069 -28%
Handled tons Menzies 3.446 5.711 +66% Table 20. Impact of scenario 2 on non-financial KLM KPIs.
Productivity This scenario is not beneficial for the productivity of KLM Cargo, because the amount of handled tons decrease with -28%. A significant increase in lateral transport could slightly negatively impact the productivity.
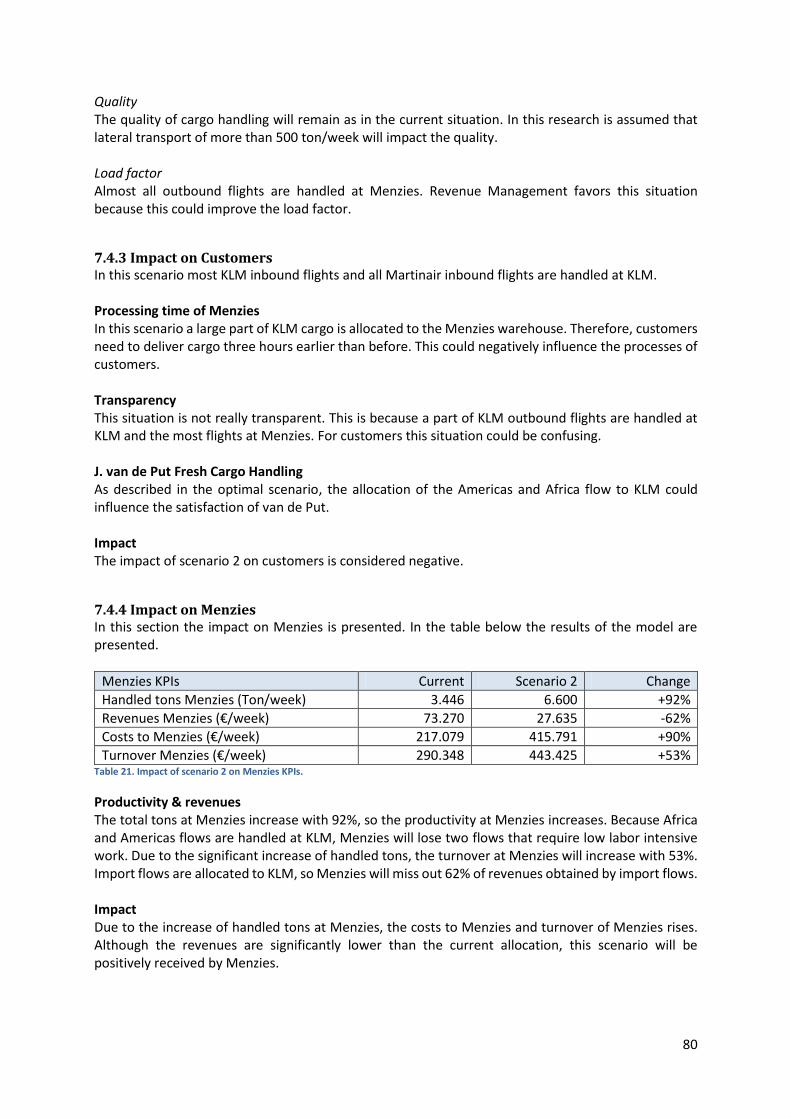
80
Quality The quality of cargo handling will remain as in the current situation. In this research is assumed that lateral transport of more than 500 ton/week will impact the quality. Load factor Almost all outbound flights are handled at Menzies. Revenue Management favors this situation because this could improve the load factor.
7.4.3 Impact on Customers In this scenario most KLM inbound flights and all Martinair inbound flights are handled at KLM. Processing time of Menzies In this scenario a large part of KLM cargo is allocated to the Menzies warehouse. Therefore, customers need to deliver cargo three hours earlier than before. This could negatively influence the processes of customers. Transparency This situation is not really transparent. This is because a part of KLM outbound flights are handled at KLM and the most flights at Menzies. For customers this situation could be confusing. J. van de Put Fresh Cargo Handling As described in the optimal scenario, the allocation of the Americas and Africa flow to KLM could influence the satisfaction of van de Put. Impact The impact of scenario 2 on customers is considered negative.
7.4.4 Impact on Menzies In this section the impact on Menzies is presented. In the table below the results of the model are presented.
Menzies KPIs Current Scenario 2 Change
Handled tons Menzies (Ton/week) 3.446 6.600 +92%
Revenues Menzies (€/week) 73.270 27.635 -62%
Costs to Menzies (€/week) 217.079 415.791 +90%
Turnover Menzies (€/week) 290.348 443.425 +53% Table 21. Impact of scenario 2 on Menzies KPIs.
Productivity & revenues The total tons at Menzies increase with 92%, so the productivity at Menzies increases. Because Africa and Americas flows are handled at KLM, Menzies will lose two flows that require low labor intensive work. Due to the significant increase of handled tons, the turnover at Menzies will increase with 53%. Import flows are allocated to KLM, so Menzies will miss out 62% of revenues obtained by import flows. Impact Due to the increase of handled tons at Menzies, the costs to Menzies and turnover of Menzies rises. Although the revenues are significantly lower than the current allocation, this scenario will be positively received by Menzies.
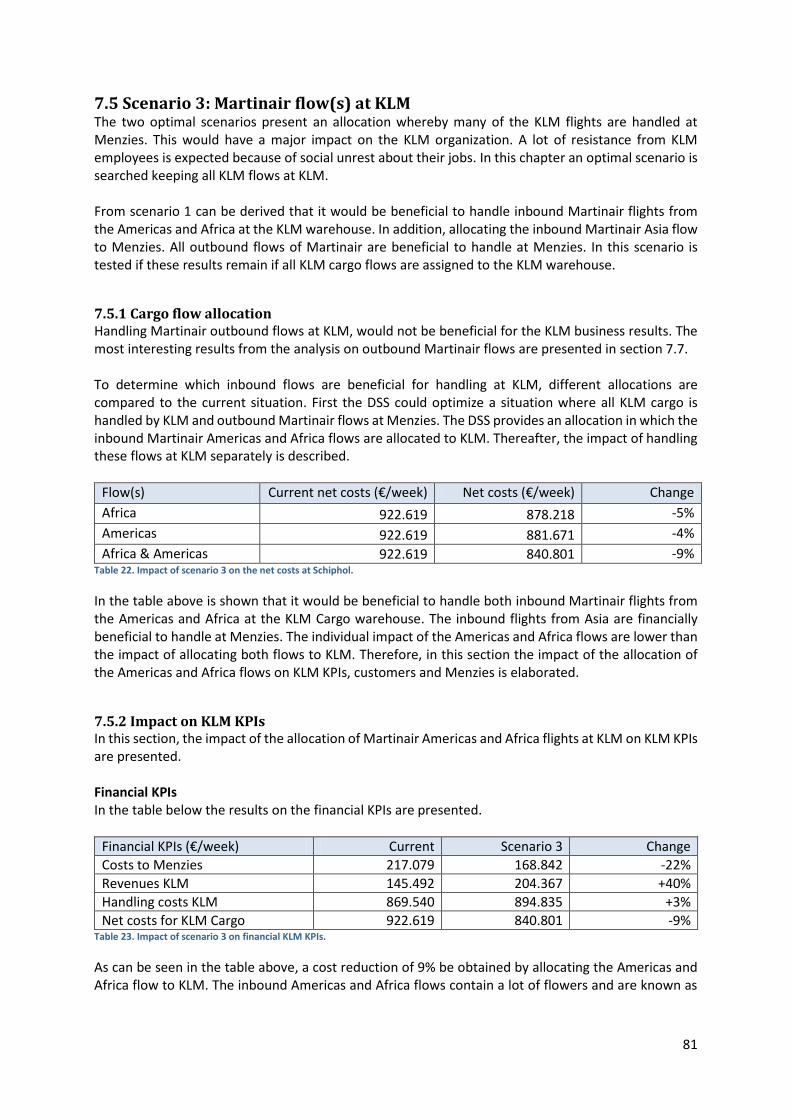
81
7.5 Scenario 3: Martinair flow(s) at KLM The two optimal scenarios present an allocation whereby many of the KLM flights are handled at Menzies. This would have a major impact on the KLM organization. A lot of resistance from KLM employees is expected because of social unrest about their jobs. In this chapter an optimal scenario is searched keeping all KLM flows at KLM. From scenario 1 can be derived that it would be beneficial to handle inbound Martinair flights from the Americas and Africa at the KLM warehouse. In addition, allocating the inbound Martinair Asia flow to Menzies. All outbound flows of Martinair are beneficial to handle at Menzies. In this scenario is tested if these results remain if all KLM cargo flows are assigned to the KLM warehouse.
7.5.1 Cargo flow allocation Handling Martinair outbound flows at KLM, would not be beneficial for the KLM business results. The most interesting results from the analysis on outbound Martinair flows are presented in section 7.7. To determine which inbound flows are beneficial for handling at KLM, different allocations are compared to the current situation. First the DSS could optimize a situation where all KLM cargo is handled by KLM and outbound Martinair flows at Menzies. The DSS provides an allocation in which the inbound Martinair Americas and Africa flows are allocated to KLM. Thereafter, the impact of handling these flows at KLM separately is described.
Flow(s) Current net costs (€/week) Net costs (€/week) Change
Africa 922.619 878.218 -5%
Americas 922.619 881.671 -4%
Africa & Americas 922.619 840.801 -9% Table 22. Impact of scenario 3 on the net costs at Schiphol.
In the table above is shown that it would be beneficial to handle both inbound Martinair flights from the Americas and Africa at the KLM Cargo warehouse. The inbound flights from Asia are financially beneficial to handle at Menzies. The individual impact of the Americas and Africa flows are lower than the impact of allocating both flows to KLM. Therefore, in this section the impact of the allocation of the Americas and Africa flows on KLM KPIs, customers and Menzies is elaborated.
7.5.2 Impact on KLM KPIs In this section, the impact of the allocation of Martinair Americas and Africa flights at KLM on KLM KPIs are presented. Financial KPIs In the table below the results on the financial KPIs are presented.
Financial KPIs (€/week) Current Scenario 3 Change
Costs to Menzies 217.079 168.842 -22%
Revenues KLM 145.492 204.367 +40%
Handling costs KLM 869.540 894.835 +3%
Net costs for KLM Cargo 922.619 840.801 -9% Table 23. Impact of scenario 3 on financial KLM KPIs.
As can be seen in the table above, a cost reduction of 9% be obtained by allocating the Americas and Africa flow to KLM. The inbound Americas and Africa flows contain a lot of flowers and are known as
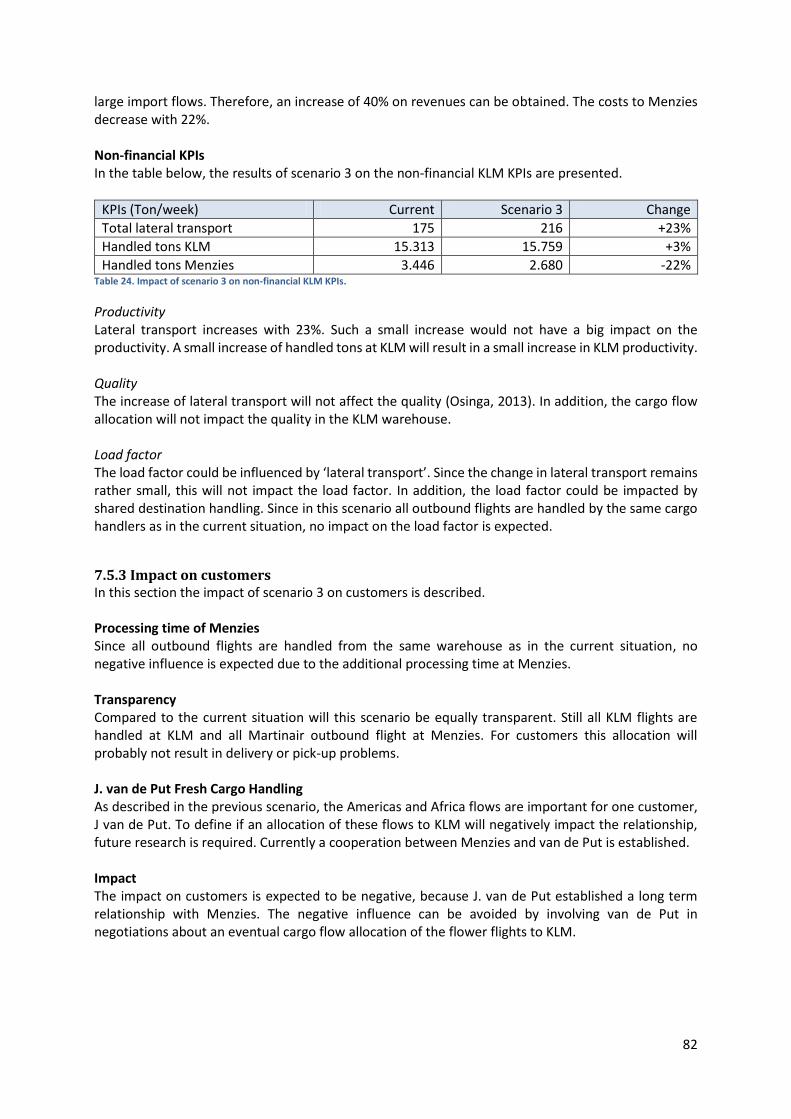
82
large import flows. Therefore, an increase of 40% on revenues can be obtained. The costs to Menzies decrease with 22%. Non-financial KPIs In the table below, the results of scenario 3 on the non-financial KLM KPIs are presented.
KPIs (Ton/week) Current Scenario 3 Change
Total lateral transport 175 216 +23%
Handled tons KLM 15.313 15.759 +3%
Handled tons Menzies 3.446 2.680 -22% Table 24. Impact of scenario 3 on non-financial KLM KPIs.
Productivity Lateral transport increases with 23%. Such a small increase would not have a big impact on the productivity. A small increase of handled tons at KLM will result in a small increase in KLM productivity. Quality The increase of lateral transport will not affect the quality (Osinga, 2013). In addition, the cargo flow allocation will not impact the quality in the KLM warehouse. Load factor The load factor could be influenced by ‘lateral transport’. Since the change in lateral transport remains rather small, this will not impact the load factor. In addition, the load factor could be impacted by shared destination handling. Since in this scenario all outbound flights are handled by the same cargo handlers as in the current situation, no impact on the load factor is expected.
7.5.3 Impact on customers In this section the impact of scenario 3 on customers is described. Processing time of Menzies Since all outbound flights are handled from the same warehouse as in the current situation, no negative influence is expected due to the additional processing time at Menzies. Transparency Compared to the current situation will this scenario be equally transparent. Still all KLM flights are handled at KLM and all Martinair outbound flight at Menzies. For customers this allocation will probably not result in delivery or pick-up problems. J. van de Put Fresh Cargo Handling As described in the previous scenario, the Americas and Africa flows are important for one customer, J van de Put. To define if an allocation of these flows to KLM will negatively impact the relationship, future research is required. Currently a cooperation between Menzies and van de Put is established. Impact The impact on customers is expected to be negative, because J. van de Put established a long term relationship with Menzies. The negative influence can be avoided by involving van de Put in negotiations about an eventual cargo flow allocation of the flower flights to KLM.
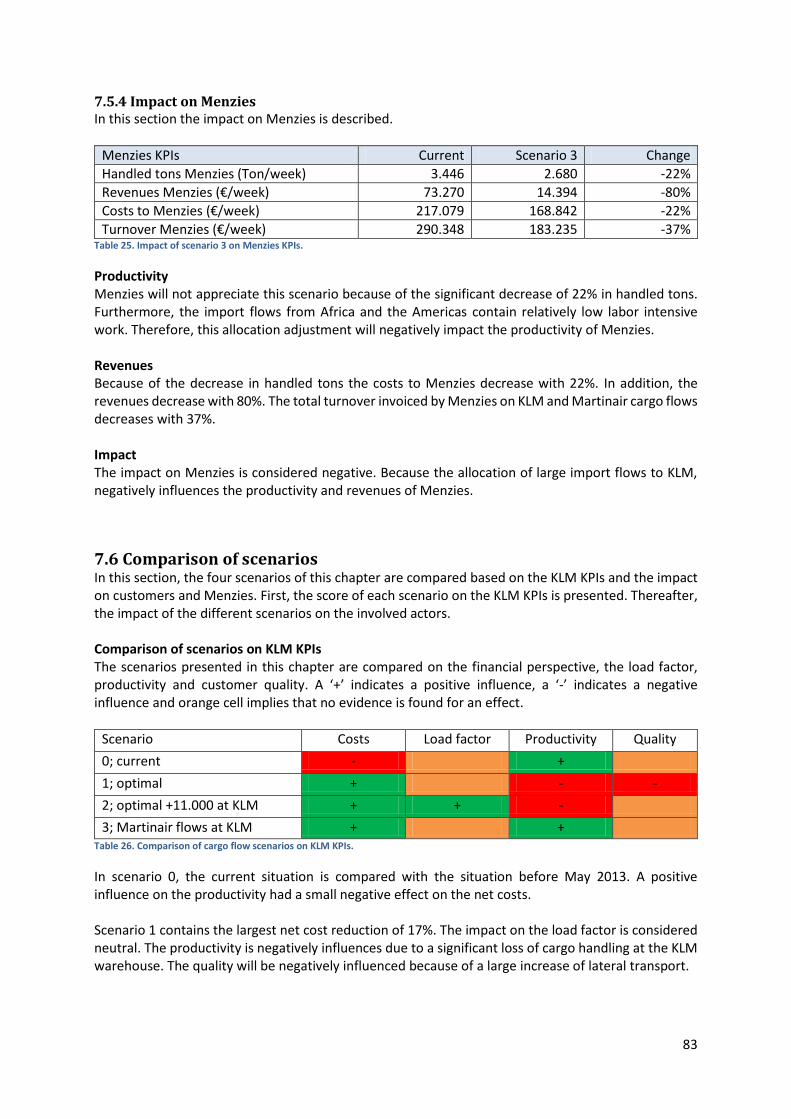
83
7.5.4 Impact on Menzies In this section the impact on Menzies is described.
Menzies KPIs Current Scenario 3 Change
Handled tons Menzies (Ton/week) 3.446 2.680 -22%
Revenues Menzies (€/week) 73.270 14.394 -80%
Costs to Menzies (€/week) 217.079 168.842 -22%
Turnover Menzies (€/week) 290.348 183.235 -37% Table 25. Impact of scenario 3 on Menzies KPIs.
Productivity Menzies will not appreciate this scenario because of the significant decrease of 22% in handled tons. Furthermore, the import flows from Africa and the Americas contain relatively low labor intensive work. Therefore, this allocation adjustment will negatively impact the productivity of Menzies. Revenues Because of the decrease in handled tons the costs to Menzies decrease with 22%. In addition, the revenues decrease with 80%. The total turnover invoiced by Menzies on KLM and Martinair cargo flows decreases with 37%. Impact The impact on Menzies is considered negative. Because the allocation of large import flows to KLM, negatively influences the productivity and revenues of Menzies.
7.6 Comparison of scenarios In this section, the four scenarios of this chapter are compared based on the KLM KPIs and the impact on customers and Menzies. First, the score of each scenario on the KLM KPIs is presented. Thereafter, the impact of the different scenarios on the involved actors. Comparison of scenarios on KLM KPIs The scenarios presented in this chapter are compared on the financial perspective, the load factor, productivity and customer quality. A ‘+’ indicates a positive influence, a ‘-’ indicates a negative influence and orange cell implies that no evidence is found for an effect.
Scenario Costs Load factor Productivity Quality
0; current - +
1; optimal + - -
2; optimal +11.000 at KLM + + -
3; Martinair flows at KLM + + Table 26. Comparison of cargo flow scenarios on KLM KPIs.
In scenario 0, the current situation is compared with the situation before May 2013. A positive influence on the productivity had a small negative effect on the net costs. Scenario 1 contains the largest net cost reduction of 17%. The impact on the load factor is considered neutral. The productivity is negatively influences due to a significant loss of cargo handling at the KLM warehouse. The quality will be negatively influenced because of a large increase of lateral transport.
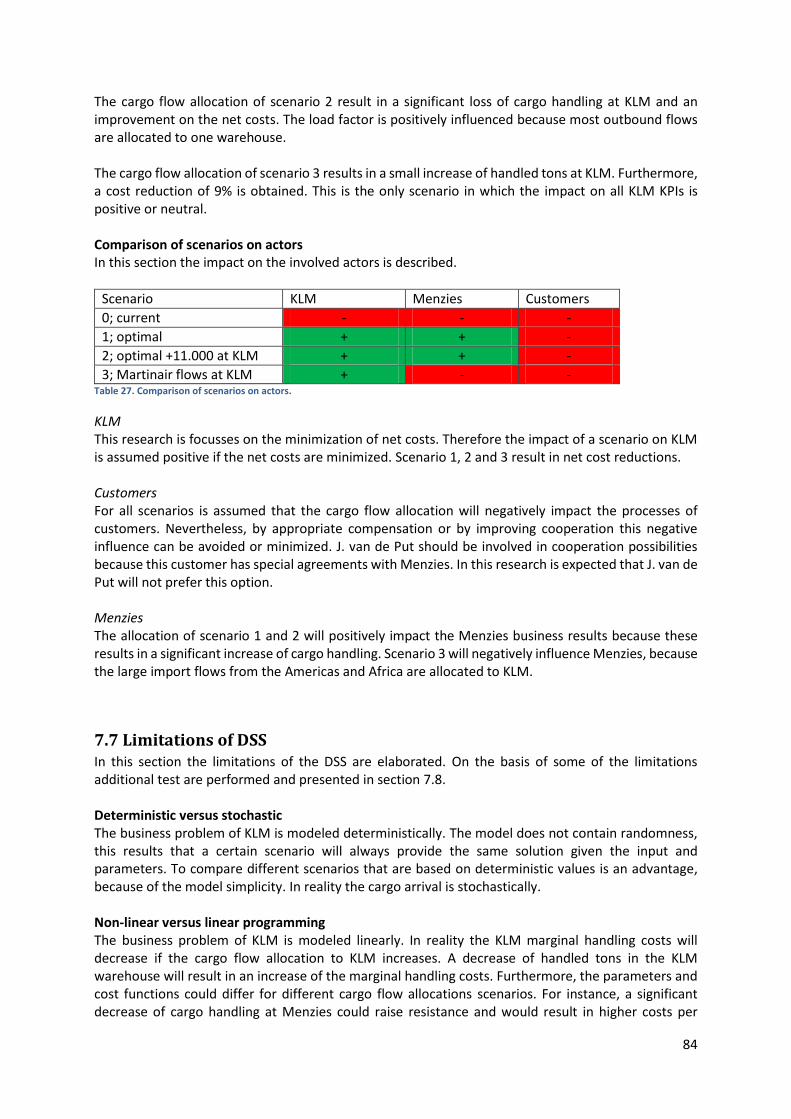
84
The cargo flow allocation of scenario 2 result in a significant loss of cargo handling at KLM and an improvement on the net costs. The load factor is positively influenced because most outbound flows are allocated to one warehouse. The cargo flow allocation of scenario 3 results in a small increase of handled tons at KLM. Furthermore, a cost reduction of 9% is obtained. This is the only scenario in which the impact on all KLM KPIs is positive or neutral. Comparison of scenarios on actors In this section the impact on the involved actors is described.
Scenario KLM Menzies Customers
0; current - - -
1; optimal + + -
2; optimal +11.000 at KLM + + -
3; Martinair flows at KLM + - - Table 27. Comparison of scenarios on actors.
KLM This research is focusses on the minimization of net costs. Therefore the impact of a scenario on KLM is assumed positive if the net costs are minimized. Scenario 1, 2 and 3 result in net cost reductions. Customers For all scenarios is assumed that the cargo flow allocation will negatively impact the processes of customers. Nevertheless, by appropriate compensation or by improving cooperation this negative influence can be avoided or minimized. J. van de Put should be involved in cooperation possibilities because this customer has special agreements with Menzies. In this research is expected that J. van de Put will not prefer this option. Menzies The allocation of scenario 1 and 2 will positively impact the Menzies business results because these results in a significant increase of cargo handling. Scenario 3 will negatively influence Menzies, because the large import flows from the Americas and Africa are allocated to KLM.
7.7 Limitations of DSS In this section the limitations of the DSS are elaborated. On the basis of some of the limitations additional test are performed and presented in section 7.8. Deterministic versus stochastic The business problem of KLM is modeled deterministically. The model does not contain randomness, this results that a certain scenario will always provide the same solution given the input and parameters. To compare different scenarios that are based on deterministic values is an advantage, because of the model simplicity. In reality the cargo arrival is stochastically. Non-linear versus linear programming The business problem of KLM is modeled linearly. In reality the KLM marginal handling costs will decrease if the cargo flow allocation to KLM increases. A decrease of handled tons in the KLM warehouse will result in an increase of the marginal handling costs. Furthermore, the parameters and cost functions could differ for different cargo flow allocations scenarios. For instance, a significant decrease of cargo handling at Menzies could raise resistance and would result in higher costs per
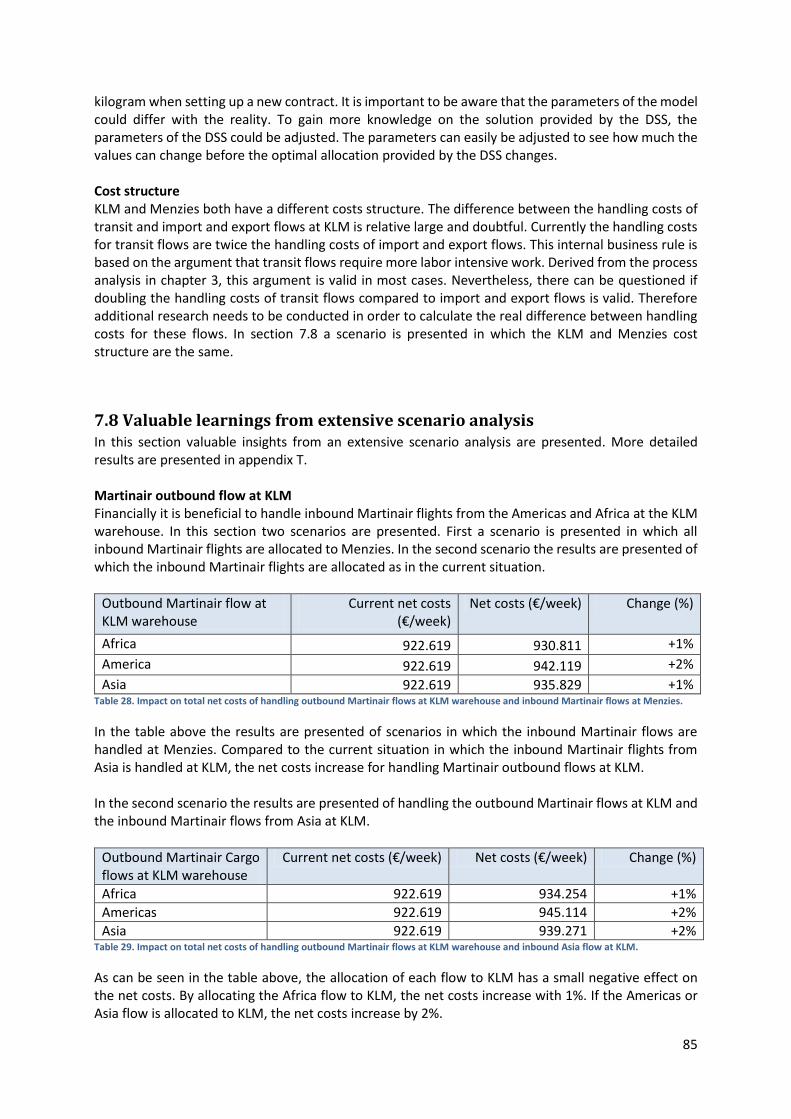
85
kilogram when setting up a new contract. It is important to be aware that the parameters of the model could differ with the reality. To gain more knowledge on the solution provided by the DSS, the parameters of the DSS could be adjusted. The parameters can easily be adjusted to see how much the values can change before the optimal allocation provided by the DSS changes. Cost structure KLM and Menzies both have a different costs structure. The difference between the handling costs of transit and import and export flows at KLM is relative large and doubtful. Currently the handling costs for transit flows are twice the handling costs of import and export flows. This internal business rule is based on the argument that transit flows require more labor intensive work. Derived from the process analysis in chapter 3, this argument is valid in most cases. Nevertheless, there can be questioned if doubling the handling costs of transit flows compared to import and export flows is valid. Therefore additional research needs to be conducted in order to calculate the real difference between handling costs for these flows. In section 7.8 a scenario is presented in which the KLM and Menzies cost structure are the same.
7.8 Valuable learnings from extensive scenario analysis In this section valuable insights from an extensive scenario analysis are presented. More detailed results are presented in appendix T. Martinair outbound flow at KLM Financially it is beneficial to handle inbound Martinair flights from the Americas and Africa at the KLM warehouse. In this section two scenarios are presented. First a scenario is presented in which all inbound Martinair flights are allocated to Menzies. In the second scenario the results are presented of which the inbound Martinair flights are allocated as in the current situation.
Outbound Martinair flow at KLM warehouse
Current net costs (€/week)
Net costs (€/week) Change (%)
Africa 922.619 930.811 +1%
America 922.619 942.119 +2%
Asia 922.619 935.829 +1% Table 28. Impact on total net costs of handling outbound Martinair flows at KLM warehouse and inbound Martinair flows at Menzies.
In the table above the results are presented of scenarios in which the inbound Martinair flows are handled at Menzies. Compared to the current situation in which the inbound Martinair flights from Asia is handled at KLM, the net costs increase for handling Martinair outbound flows at KLM. In the second scenario the results are presented of handling the outbound Martinair flows at KLM and the inbound Martinair flows from Asia at KLM.
Outbound Martinair Cargo flows at KLM warehouse
Current net costs (€/week) Net costs (€/week) Change (%)
Africa 922.619 934.254 +1%
Americas 922.619 945.114 +2%
Asia 922.619 939.271 +2% Table 29. Impact on total net costs of handling outbound Martinair flows at KLM warehouse and inbound Asia flow at KLM.
As can be seen in the table above, the allocation of each flow to KLM has a small negative effect on the net costs. By allocating the Africa flow to KLM, the net costs increase with 1%. If the Americas or Asia flow is allocated to KLM, the net costs increase by 2%.
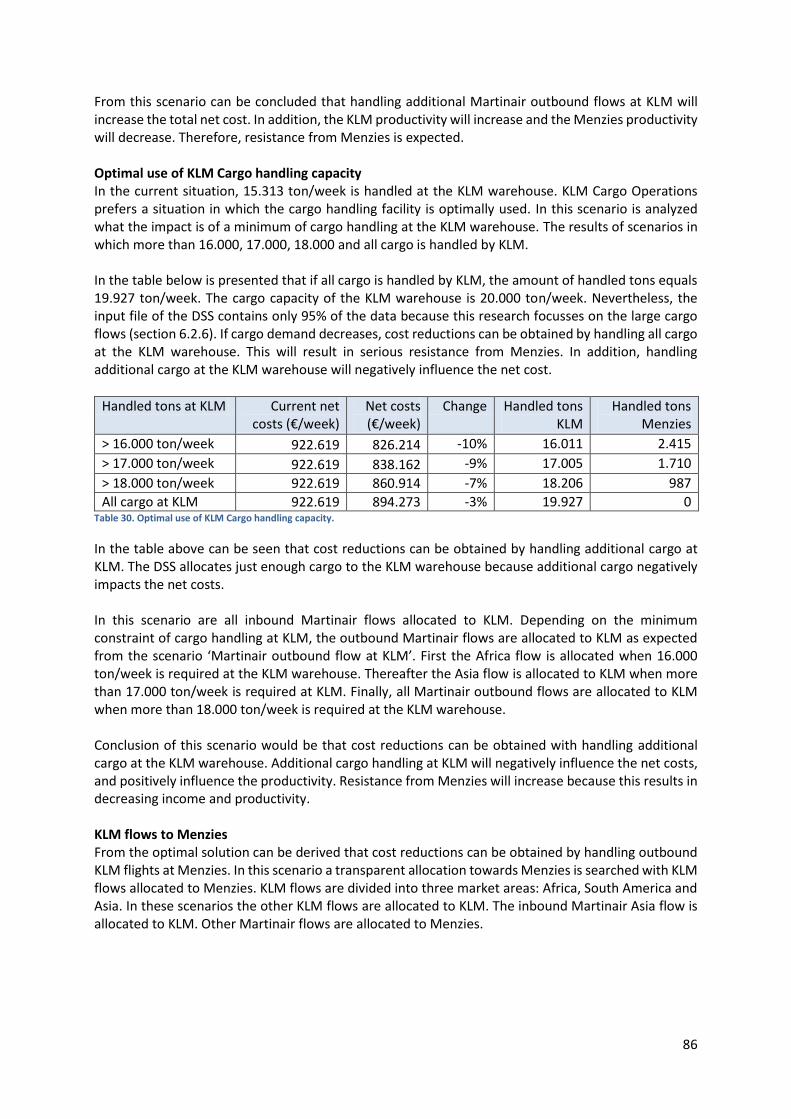
86
From this scenario can be concluded that handling additional Martinair outbound flows at KLM will increase the total net cost. In addition, the KLM productivity will increase and the Menzies productivity will decrease. Therefore, resistance from Menzies is expected. Optimal use of KLM Cargo handling capacity In the current situation, 15.313 ton/week is handled at the KLM warehouse. KLM Cargo Operations prefers a situation in which the cargo handling facility is optimally used. In this scenario is analyzed what the impact is of a minimum of cargo handling at the KLM warehouse. The results of scenarios in which more than 16.000, 17.000, 18.000 and all cargo is handled by KLM. In the table below is presented that if all cargo is handled by KLM, the amount of handled tons equals 19.927 ton/week. The cargo capacity of the KLM warehouse is 20.000 ton/week. Nevertheless, the input file of the DSS contains only 95% of the data because this research focusses on the large cargo flows (section 6.2.6). If cargo demand decreases, cost reductions can be obtained by handling all cargo at the KLM warehouse. This will result in serious resistance from Menzies. In addition, handling additional cargo at the KLM warehouse will negatively influence the net cost.
Handled tons at KLM Current net costs (€/week)
Net costs (€/week)
Change Handled tons KLM
Handled tons Menzies
> 16.000 ton/week 922.619 826.214 -10% 16.011 2.415
> 17.000 ton/week 922.619 838.162 -9% 17.005 1.710
> 18.000 ton/week 922.619 860.914 -7% 18.206 987
All cargo at KLM 922.619 894.273 -3% 19.927 0 Table 30. Optimal use of KLM Cargo handling capacity.
In the table above can be seen that cost reductions can be obtained by handling additional cargo at KLM. The DSS allocates just enough cargo to the KLM warehouse because additional cargo negatively impacts the net costs. In this scenario are all inbound Martinair flows allocated to KLM. Depending on the minimum constraint of cargo handling at KLM, the outbound Martinair flows are allocated to KLM as expected from the scenario ‘Martinair outbound flow at KLM’. First the Africa flow is allocated when 16.000 ton/week is required at the KLM warehouse. Thereafter the Asia flow is allocated to KLM when more than 17.000 ton/week is required at KLM. Finally, all Martinair outbound flows are allocated to KLM when more than 18.000 ton/week is required at the KLM warehouse. Conclusion of this scenario would be that cost reductions can be obtained with handling additional cargo at the KLM warehouse. Additional cargo handling at KLM will negatively influence the net costs, and positively influence the productivity. Resistance from Menzies will increase because this results in decreasing income and productivity. KLM flows to Menzies From the optimal solution can be derived that cost reductions can be obtained by handling outbound KLM flights at Menzies. In this scenario a transparent allocation towards Menzies is searched with KLM flows allocated to Menzies. KLM flows are divided into three market areas: Africa, South America and Asia. In these scenarios the other KLM flows are allocated to KLM. The inbound Martinair Asia flow is allocated to KLM. Other Martinair flows are allocated to Menzies.
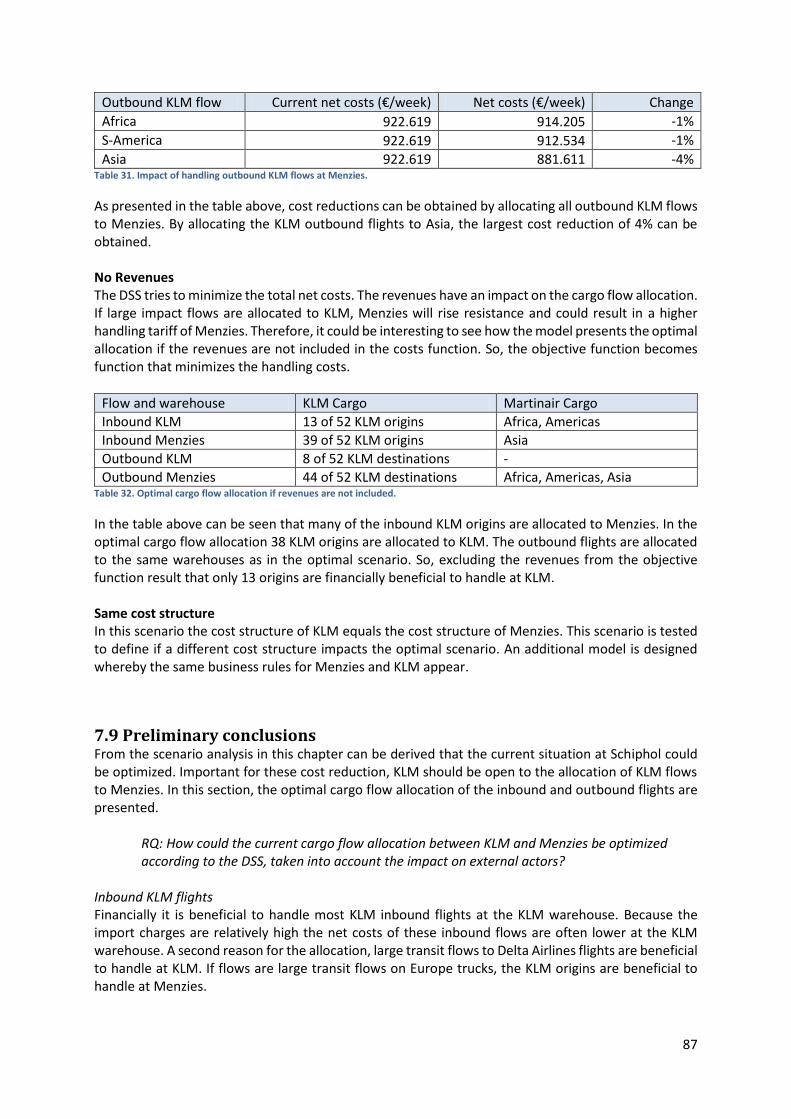
87
Outbound KLM flow Current net costs (€/week) Net costs (€/week) Change
Africa 922.619 914.205 -1%
S-America 922.619 912.534 -1%
Asia 922.619 881.611 -4% Table 31. Impact of handling outbound KLM flows at Menzies.
As presented in the table above, cost reductions can be obtained by allocating all outbound KLM flows to Menzies. By allocating the KLM outbound flights to Asia, the largest cost reduction of 4% can be obtained. No Revenues The DSS tries to minimize the total net costs. The revenues have an impact on the cargo flow allocation. If large impact flows are allocated to KLM, Menzies will rise resistance and could result in a higher handling tariff of Menzies. Therefore, it could be interesting to see how the model presents the optimal allocation if the revenues are not included in the costs function. So, the objective function becomes function that minimizes the handling costs.
Flow and warehouse KLM Cargo Martinair Cargo
Inbound KLM 13 of 52 KLM origins Africa, Americas
Inbound Menzies 39 of 52 KLM origins Asia
Outbound KLM 8 of 52 KLM destinations -
Outbound Menzies 44 of 52 KLM destinations Africa, Americas, Asia Table 32. Optimal cargo flow allocation if revenues are not included.
In the table above can be seen that many of the inbound KLM origins are allocated to Menzies. In the optimal cargo flow allocation 38 KLM origins are allocated to KLM. The outbound flights are allocated to the same warehouses as in the optimal scenario. So, excluding the revenues from the objective function result that only 13 origins are financially beneficial to handle at KLM. Same cost structure In this scenario the cost structure of KLM equals the cost structure of Menzies. This scenario is tested to define if a different cost structure impacts the optimal scenario. An additional model is designed whereby the same business rules for Menzies and KLM appear.
7.9 Preliminary conclusions From the scenario analysis in this chapter can be derived that the current situation at Schiphol could be optimized. Important for these cost reduction, KLM should be open to the allocation of KLM flows to Menzies. In this section, the optimal cargo flow allocation of the inbound and outbound flights are presented.
RQ: How could the current cargo flow allocation between KLM and Menzies be optimized according to the DSS, taken into account the impact on external actors?
Inbound KLM flights Financially it is beneficial to handle most KLM inbound flights at the KLM warehouse. Because the import charges are relatively high the net costs of these inbound flows are often lower at the KLM warehouse. A second reason for the allocation, large transit flows to Delta Airlines flights are beneficial to handle at KLM. If flows are large transit flows on Europe trucks, the KLM origins are beneficial to handle at Menzies.

88
Inbound Martinair flights Currently, the inbound Asia flow is handled at the KLM warehouse. Interesting result from the scenario analysis, handling the incoming flights from Asia at Menzies is beneficial because this flow is a large transit flow on Europe trucks. Menzies will appreciate this flow because it increases productivity and revenues. Outbound KLM flights Most KLM destinations are financially beneficial to handle at Menzies. On these outbound flows no revenues are obtained. If these flow contain large export cargo and low transit cargo of Europe trucks, the flows are beneficial to allocate to KLM. In addition, cargo flows including large transit flows from Delta Airlines origins, are financially beneficial to handle at KLM. Outbound Martinair flights Just as the current situation, outbound Martinair flights are beneficial to handle at Menzies.

89

90
Part 5: Conclusions
91
8. Conclusions & recommendations In this final chapter the conclusion and recommendations on a cargo flow allocation at Schiphol are presented. The problem researched in this thesis, KLM Cargo Operations is not able to make a well structured decision on how to optimally allocate KLM and Martinair cargo flows between the KLM and Menzies cargo handling warehouses at Schiphol. With the help of the designed Decision Support System (DSS), multiple cargo flow allocation scenarios are compared on the impact on the KLM KPIs and the impact on the involved actors. Research is conducted based on the following research objective:
‘Minimize the net costs of KLM and Martinair cargo flow allocation between Menzies and KLM warehouses at Schiphol, by performing a scenario analysis for KLM Cargo Operations with the help of a Decision Support System.’
First the conclusions of this research are presented. Thereafter the recommendations for KLM Cargo Operations are provided. Third, a reflection of the author on the conducted research is given.
8.1 Conclusions In this section the conclusions are presented. First, the interesting conclusions on the research questions of each chapter are presented. Thereafter, the main research question of this thesis is answered. In the third and fourth section, the theoretical contribution and societal relevance are elaborated. The fifth section describes the limitations of this research and the designed DSS.
8.1.1 Discussion on research questions At the end of each chapter preliminary conclusions of that particular chapter are described. In this section the most important conclusions are presented.
Problem analysis phase
Chapter 2: Which actors require close attention while adjusting the current cargo flow allocation at Schiphol? Chapter 3: Which processes are influenced by a cargo flow allocation adjustment at Schiphol? Design phase Chapter 4: How could the business problem of KLM Cargo Operations be presented in a Linear Programming problem? Chapter 5: Which DSS is preferred for the scenario analysis of KLM Cargo Operations? Chapter 6: To which extent does the model present a valid representation of the reality? Evaluation phase Chapter 7: How could the current cargo flow allocation between KLM and Menzies be optimized according to the DSS, taken into account the impact on external actors?
Problem analysis phase In chapter 2 is concluded, Menzies and customers are important actors which could be influenced by a cargo flow allocation at Schiphol. In addition, Menzies and customers need to stay satisfied because they have the power to negatively affect the KLM Cargo business results. In chapter 3 the processes that are influenced by a cargo flow allocation are described. Within the warehouse processes multiple processes are affected. The type of flow; import, export or transit, determines the handling process within the warehouse. Import and export flows are considered less
92
labor intensive work. The marginal handling costs of transit flows are twice the cost for handling import and export flows. Menzies does not make a distinction between ‘Europe trucks’ and ‘Amsterdam trucks’. Therefore, the handling tariff of Menzies is 45% lower than the marginal handling costs of KLM for ‘Europe trucks’. Lateral transport contains cargo from Menzies to KLM or vice versa. This process is important for a cargo flow allocation because an increase in lateral transport negatively impacts the non-financial KLM KPIs. The KLM warehouse is capable of handling Martinair cargo flows. Menzies is also able to handle KLM cargo flows. Although, Menzies is not allowed to transport cargo to or from the KLM airplane. Therefore, an additional transport process should be established when Menzies handles cargo of KLM. Design phase In chapter 4, a conceptual model is established in order to present the KLM business problem into a Linear Programming (LP) model. In this chapter is concluded, the business processes and costs functions could be modelled linearly. In chapter 5 is described that spreadsheet modelling is preferred above dedicated Operations Research (OR) software because this could easier be maintained by the Operations department of KLM Cargo. Therefore, the conceptual model is translated into a computerized model in a spreadsheet environment. In chapter 6 is concluded that the designed LP model is a reliable tool that models the business problem realistically. Evaluation phase In chapter 7, an extensive scenario analysis is performed. Three high level scenarios present that Menzies handling tariff is competitive towards the marginal handling costs of KLM. Cost reductions can be obtained by handling cargo flows at the Menzies warehouse. Organizational recommendations on how cost reductions cab be obtained are presented in section 8.2.
8.1.2 Discussion on main research questions
In economic difficult times, the minimization of costs and the maximization of revenues is the most important objective of KLM Cargo Operations. Therefore, in this research the following main research question is centralized:
How could the net costs for KLM Cargo Operations be minimized by adjusting the cargo flow allocation of KLM and Martinair cargo flows between KLM and Menzies warehouses at Schiphol?
Value cooperation with Menzies From the scenario analysis is derived that KLM Cargo should value the cooperation with Menzies. Seen from a financial perspective, this cooperation could contribute to significant cost reductions. The tariff of Menzies is competitive towards the marginal handling costs of KLM cargo. So, KLM Cargo Operations should value and maintain the long term relationship with Menzies. KLM flows at Menzies Currently all KLM flights are handled at the KLM warehouse. According to the scenario analysis, cost reductions can be obtained by the allocation of KLM flights to the Menzies warehouse. Since minimizing the net costs is the main objective for this research, this allocation towards Menzies is preferred. So to realize these cost reductions, KLM Cargo Operations should adjust the current cargo flow allocation by the allocation of KLM flows at Menzies. However, KLM Cargo Operations should be aware of the negative effects of this allocation in order to avoid internal and external conflicts.
93
Type of flow impact the cargo flow allocation The type of flow impacts the cargo handling warehouse processes. Furthermore, the handling costs are determined by the type of flow. Transit flows on airplanes Flows that contain a large amount of cargo from Delta Airlines origins or to Delta Airlines destinations are beneficial to handle at the KLM warehouse. This is because all Delta Airlines flights are constrained to be handled at KLM. Transit flows on ‘Europe trucks’ Cargo handling of a ‘Europe truck’ is relatively expensive in the KLM warehouse compared to the Menzies warehouse. Therefore, large transit flows on Europe trucks are financially beneficial to handle at Menzies. Import flows Import flows are financially beneficial to handle at the KLM warehouse. The revenues obtained on import charges are relatively high. Export flows Export flows require low labor intensive work at the KLM warehouse. Since most outbound flows contain many transit cargo from origins out of Europe, only eight export flows are defined.
8.1.3 Theoretical contribution The research conducted is oriented practically towards the business problem of KLM Cargo Operations. Nevertheless, a valuable lesson can be learned that could contribute to science. The KLM business problem differs from standard network flow problems because it contains two assignment problems of which the second assignment problem is dependent on the outcome of the first assignment. This results in the following question: ‘How to model two assignment problems of which the second assignment problem is dependent on the outcome of the first assignment problem?’ This research describes how such a problem can be tackled. The key learning point is that all possible routes of the two assignment problems need to be combined into one larger assignment problem.
8.1.4 Societal relevance In this section the societal relevance of the conducted research is presented. Examples are presented in which cases the research and the designed LP model could be valuable. Flow allocation optimization between multiple warehouses Besides the KLM Cargo business case, this DSS could be valuable in other cases with the same kind of problem structure. This is because this research report describes how a more complex problem network flow problem could be structured into a LP model. This LP model could even be applied to an organization with more than two warehouses. Such a problem could also be tackled by structuring the assignment problems as one large assignment problem by combining all possible routes into decision variables. Paris – Amsterdam Martinair and KLM Cargo are increasing integration. The allocation of Martinair and KLM cargo flows between the Menzies and KLM warehouse is a result of this integration. In addition, KLM Cargo is increasing integration with Air France Cargo. The designed DSS could provide useful insight in an optimal cargo flow allocation between Paris and Amsterdam. The model could be adjusted in a way
94
that lateral transport does not occur between KLM and Menzies, but between Charles de Gaulle and Schiphol. Relocation of KLM Cargo warehouse For more than ten years a discussion between the Schiphol Group and KLM is being held on the relocation of the KLM cargo handling warehouse. In this research this possibility is left out of scope because a relocation is currently out of the question. In case Schiphol and KLM reach consensus on a relocation, the LP model could provide useful information on the size of the new warehouse and the associated preferred cargo flow allocation at Schiphol. Open source spreadsheet optimization Solving large complex linear programming (LP) problems without investment costs and extensive knowledge about LP could help managers making the right decisions. Modelling the business problem of KLM Cargo Operations in Excel with the help of OpenSolver created useful and reliable results. This research could help other managers in using this free open source software.
8.1.5 Limitations of research
In this section, the limitations of this research and the designed DSS are elaborated. Furthermore, how to coop with these limitations is presented. Linear versus non-linear problem The business problem of KLM Cargo Operations is modelled linearly. In practice the parameters will react non-linear. KLM should be aware that the parameters could differ for different cargo flow allocations. Impact on non-financial KPIs The DSS provides useful insight in financial KPIs and the cargo flow allocation. The DSS does not provide high quality information on the impact of a cargo flow allocation on the non-financial KPIs. Before a decision on a cargo flow allocation is taken, the impact on the non-financial KPIs need to be discussed. Labor Since no flight information as time of departure or arrival is taken into account, the model does not provide insight on the peak levels of cargo delivery and pick-up. These levels could have a major impact on the productivity and handling costs at the KLM Cargo warehouse. The preferred allocation scenarios should be checked on this peak levels by an internal available system on employee scheduling.
8.2 Recommendations In this section recommendations and recommendations for future research are presented.
8.2.1 Recommendations
From the process analysis and the scenario analysis valuable recommendations are derived. Handle Martinair ‘flower flights’ at KLM Inbound Martinair flights from the Americas and Africa are financially beneficial to handle at KLM. These flows are known as the ‘flower flights’, since these flights contain mostly flowers with destination Amsterdam. Therefore, these flights are large import flows and attractive for KLM. Besides financial benefits, these flows contain relatively low labor intensive work. Therefore, these flows improve the productivity of the KLM warehouse.
95
J. van de Put Fresh cargo handling is an important customer of these flower flights. Van de Put is located next to Menzies and established a good relationship with Menzies. When these flows are allocated to KLM, this could raise resistance from both Menzies and J. van de Put. To ensure a good relationship with J. van de Put, cooperation should be discussed in an early stage. Handle Martinair inbound flows from Asia at Menzies Interesting result from this research, the inbound Martinair flights from Asia are financially beneficial to handle at Menzies. This flow is currently handled by KLM. Allocating this flow to Menzies will negatively influence the KLM productivity. The relationship with Menzies will be improved because Menzies prefers to handle these flights from Asia. The impact on customers is also considered positive. Handle KLM flows at Menzies As concluded in the conclusion in section 8.1.2, cost reductions can be obtained by allocating KLM flows to Menzies. KLM Cargo Operations should be aware of the impact it will have on the organization. The productivity of the KLM warehouse will decrease if KLM cargo flows are allocated to Menzies. This could result that marginal handling costs of KLM become even higher. Furthermore, a significant cargo flow allocation towards Menzies can cause internal social unrest about labor security. A cargo flow allocation to Menzies is preferred by Menzies. The productivity and revenues can increase. When Menzies handles KLM cargo, an additional process should be established to transport cargo between the KLM airplanes and the Menzies warehouse. Transparent cargo flow allocation KLM Cargo Operations should be aware that an allocation of KLM flows at KLM and Menzies could worsen the cargo flow transparency. This could increase trucking problems of KLM trucks and trucks of customers. These trucking problems should be avoided because it could negatively influence the customer satisfaction.
8.2.2 Recommendations for future research
In this section recommendations for future research are presented. Redesign internal costs calculation In this research is questioned if the internal costs calculation is valid. The internal business rule at KLM Cargo Operations calculates the actual carried tons twice for transit flows. Therefore, handling costs of transit flows double the handling costs of import and export flows. In some cases an additional palletizing process is required for transit flows and therefore the higher handling costs could be explained. Nevertheless, in some cases the handling costs of a transit flow are even lower than the handling costs of import flows. Therefore future research could define if these handling costs are really double the handling costs of import and export flows. Trucking optimization In the current situation, lateral transport is not allowed between KLM and Menzies when cargo continues on an outbound truck. When Dutch customs and KLM agree upon a situation where this process is allowed, the scope of this research could be enlarged. Instead of focusing on the allocation of flights, the allocation of trucks could also be taken into account in order to optimize the trucking allocation in combination with the flight allocation.
96
Define impact on non-financial KPIs The DSS does not provide high quality information on the impact of a cargo flow allocation on the non-financial KPIs. By additional research, rule of thumbs can be established on how certain cargo flow allocations impact the non-financial KPIs. Information on: customers, products, T/M-ratios and flight details could provide useful information on the impact on non-financial KPIs. Cost reduction research on transit flows on ‘Europe trucks’ The DSS shows that the transit flows on ‘Europe trucks’ are beneficial to handle at the Menzies warehouse. KLM could investigate how these handling costs at KLM could be reduced in order to become competitive towards the handling tariff of Menzies.
8.3 Reflection In this section a helicopter view on this research is presented. Based on experiences during this research a reflection on important decisions and developments are described. Complexity The cargo flow allocation optimization problem is an actual problem for KLM Cargo Operations. Changes in cargo flow allocation at Schiphol are possible from of the first of May 2013. This research provides the first results and insights on an optimal cargo flow allocation. Therefore, it provides valuable insights on the opportunities and consequences for KLM Cargo Operations and involved actors. Within this report many opportunities are not described because it is considered out of scope. To give an example of an opportunity that is left out of scope. KLM Cargo owns land at Schiphol East. This land is located next to J. van de Put Fresh Cargo Handling and is intended for the new location of the KLM cargo handling warehouse. On this land, a small warehouse can be build that focuses on the flower flights and the cooperation between J. van de Put and KLM Cargo. Like this example, there are more examples of how this research contributes to defining opportunities for improving the business results of KLM Cargo. Research progress This research is conducted in about 10 months in total. Multiple factors have causes a delay in the research progress. These causes are elaborated in this part. Problem analysis From of the start of this research in February 2013 till the first of May a reorganization between KLM, Martinair and Menzies was executed. The result of this reorganization had a large influence on the scope and possibilities of this research. Because the situation on the first of May remained unsecure the problem statement and the scope of the research could be precisely defined in May. Data gathering Within this research three data sources are used. Already in the beginning was found that data of the Operations department was incomplete. In April the data file of the Sales & Distribution (S&D) department was used as input file for the already constructed LP model. After the reorganization in May, this data file became useless for this research after June 2013. An important decision had to be made between two options. First, recommendations could have been made on the available data before May 2013. The consequence would be that KLM Cargo Operations could not maintain the LP model because this model was based on the input file derived from the S&D department. Therefore the second option was chosen, to search for another data source to ensure that KLM could use the model in a later stage with actual data.
97
From the beginning of June a new data file was derived from the data source of Revenue Management (RM). This data file was established manually by developing a query. Due to holidays, the dependency on one employee of revenue management and the data validation, it took more than two months before this data file was defined as reliable and useful. The data file is specially constructed for this KLM business problem, which results in a few advantages compared to the general S&D file. The data file is relatively easy to implement in the LP model and contains all relevant information for this business problem. Afterwards, can be concluded that this decision had a large impact on the project progress. Nevertheless, this data file ensures that KLM Cargo Operations could repeat the tests on a regular basis. So, the designed LP model could help improving the decision making on cargo flow allocations at Schiphol in the future. The maintainability and robustness of the decision support system were highly valued personal goals for this thesis.
98
References Abrahams, A., & Ragsdale, C. (2012). A Decision Support System for patient scheduling in travel
vaccine administration. Decision Support Sytems 54, 215-225.
Aeschbacher , B. (2012). Solving a Large Scale Integer Program with Open-Source-Software . Zurich:
University of Zurich .
AFKL Cargo. (2013, September 2). KLM Cargo. Retrieved from KLM Cargo:
http://myafklcgo.airfrance.fr/afklcgo/en/
AF-KL Cargo. (2013, March 22). Products and services. Retrieved March 22, 2013, from AF-KL.com:
http://www.af-
klm.com/cargo/b2b/wps/portal/b2b/kcxml/04_Sj9SPykssy0xPLMnMz0vM0Y_QjzKLN4o3NPN
xAsmB2GZGAfqRmIL-mILGTuYuEFGjkDBzuFJjPySlvh75uan6Qfre-
gH6BbmhoaER5Y4A7I2kJw!!/delta/base64xml/L3dJdyEvd0ZNQUFzQUMvNElVRS82XzJfNjg4
AF-KL Cargo Web Academy. (2013, 06 27). AF-KL Cargo Web Academy. Retrieved 06 27, 2013, from
AF-KL Cargo Web Academy: http://afklcargo.stoas.nl/
AF-KL-MP Cargo. (2013, March 6). AF-KL-MP Cargo Storyline. Retrieved March 6, 2013, from Brand
box: http://brandbox.myafklcargo.org/index.cfm/site/AF-KL%20Cargo/pageid/D482896F-
9022-3EA8-F91333EEF395FB1C/index.cfm
Agentschap NL. (2012, December 16). Cross Chain Control Centers. Retrieved December 16, 2012,
from Agentschap NL: http://www.agentschapnl.nl/programmas-regelingen/cross-chain-
control-center
AIMMS. (2013, October 25). AIMMS Pricing. Retrieved from AIMMS: http://www.aimms.com
Aipassa, N. (2013, 04 10). Special cargo handling FB1. (M. Bronsing, Interviewer)
Air Cargo News. (2013, 05 09). AF-KL-MP Cargo invest in sniffer dogs at Schipol hub. Retrieved 06 25,
2013, from Air Cargo News: http://www.aircargonews.net/news/single-view/news/af-kl-mp-
cargo-invest-in-sniffer-dogs-at-schipol-hub.html
Air Cargo World. (2012, December 13). Cargo and passenger markets have diverged. Retrieved
December 16, 2012, from Air Cargo World: http://www.aircargoworld.com/Air-Cargo-
News/2012/12/profits-up-but-airfreight-trails-passenger-growth/1311314
Air France. (2013, January 23). The conditions for success of Transform 2015. Retrieved January 23,
2013, from Air France:
http://corporate.airfrance.com/en/strategy/transform2015/conditions-for-success/
Air France. (2013, March 7). Transform 2015. Retrieved March 7, 2013, from Air France Corporate:
http://corporate.airfrance.com/en/strategy/transform2015/
Air France- KLM. (2011). The Group in 2011; Annual Report. Paris: Air France- KLM.
Arwert, M. (2013, July 10). Executive Assistant. (M. Bronsing, Interviewer)
99
Awad, H., & Nassar, M. (2010). Supply Chain Integration: Definition and Challenges. Proceedings of
the international MultiConference of Engineers and Computer Scientists, 17-26.
Bakker, J. (2013, April 15). Quality Manager. (M. Bronsing, Interviewer)
Banks, J., & Carson, J. (2010). Discrete-event System Simulation. New Jersey: Prentice Hall.
Blasse, M. (2013, 06 26). Customs at Schiphol. (M. Bronsing, Interviewer)
Boeing. (2010). World Air Cargo Forecast 10/11. Seattle: The Boeing Company.
Borshchev, A., & Filippov, A. (2004). From System Dynamics and Discrete Event to Practical Agent
Based Modelling: Reasons, Techniques, Tools. In Oxford.
Bouhbouh, M. (2013, 06 03). Truck planning in Europe. (M. Bronsing, Interviewer)
Bronsing, M. (2013). Cooperation between air cargo warehouses. TU Delft, 1-12.
Bucur, I. (2013, April 30). Managerial Core Competencies as Predictors of Managerial Performance,
on Different Levels of Management. Procedia - Social and Behavioral Sciences 78, pp. 365-
369.
Chandrakantha, L. (2013, October 25). Using Excel Solver in Optimization Problems. Retrieved from
Mathematics and Computer Science Department:
http://archives.math.utk.edu/ICTCM/VOL23/C006/paper.pdf
Chinneck, J. (2000). Practical Optimization: a Gentle Introduction. Ottawa: Carleton University.
COIN-OR. (2013, October 31). COIN-OR Projects. Retrieved from COIN-OR: http://www.coin-
or.org/projects/Osi.xml
Cornelissen, J. (2013, May 22). Head of Europort. (M. Bronsing, Interviewer)
Cunha Pereira, J. (2012, November 13). Introduction in freight building 2. (M. Bronsing, Interviewer)
Damme, D. v. (2000). Distributielogistiek & Financiële informatie. Eindhoven: Kluwer.
de Bruijn, H., & ten Heuvelhof, E. (2008). Management in Networks. London: Routledge.
de Jong, J. (2013, 04 03). Labor and rosters at KLM cargo handling warehouse. (M. Bronsing,
Interviewer)
Dekker, H. (2013, 06 27). Alliance with Delta Airlines. (M. Bronsing, Interviewer)
d'Engelbronner, R. (2012). Air Cargo Handling Demand Forecasting. Delft: Delft University of
Technology.
Dinalog. (2012, December 16). 4C: Cross Chain Control Centers. Retrieved December 16, 2012, from
Dinalog: http://www.dinalog.nl/nl/themes/4c__cross_chain_control_center/
Druzdzel, M., & Flynn, R. (2002). Decision Support System. In A. Kent, Encyclopedia of Library and
Information Science (pp. 1-12). New York: Marcel Dekker, Inc.
100
Dym, c., & Little, P. (2009). Introduction to designing multi-actor systems. John Wiley & Sons.
Elimam, A., & Dodin, B. (2012). Project Scheduling in optimizing integrated supply chain operations.
European Journal of Operational Research, 530-541.
Eurlings, C. (2013, July 16). Het hele interview met Camiel Eurlings - KLM. (R. Nieuws, Interviewer)
Fong, K. (2013, Februari 5). Cooperation between Menzies and Martinair. (M. Bronsing, Interviewer)
Frontline Systems. (2013, September 13). Analytical Solver Platform. Retrieved from Solver:
http://www.solver.com/catalog/excel-products
Greeff, L. (2013, July 19). Revenue Management perception on cargo flow allocation. (M. Bronsing,
Interviewer)
Heide, L. v. (2008, December 17). Kroes akkoord met overname Martinair door KLM. NRC, pp. 23-24.
Hermans, L., & Thissen, W. (2009). Actor analysis methods and their use for public policy analysts.
European Journal of Operational Research 196, 808-818.
Hillier, F., & Lieberman, G. (2009). Introduction to Operations Research. New York: Mcgraw-Hill
Professional.
Holsboer, B. (2013, March 13). Costs structure at Schiphol. (M. Bronsing, Interviewer)
Huo, B. (2012). The impact of supply chain integration on company performance: an organizational
capability perspective. Supply Chain Management: An Internal Journal, 596-610.
IATA. (2013, January 30). Cargo Analysis Archive. Retrieved January 30, 2013, from IATA:
http://www.iata.org/publications/economics/Pages/caarchives.aspx
IATA Cargo. (2010, 09 20). Electronic Cargo Security Declaration. Retrieved 06 25, 2013, from IATA
Cargo: http://www.iata.org/whatwedo/cargo/security/Documents/e-securitydec-functional-
specs.pdf
Imperial College London. (2013, March 7). Linear Programming. Retrieved from Imperial College
London: http://www.doc.ic.ac.uk/~br/berc/linearprog.pdf
John Menzies plc. (2010). Annual Report 2010 . Edinburgh: John Menzies plc.
Jong, J. (2013, May 16). Marginal costs KLM. (M. Bronsing, Interviewer)
Kirkwood, C. (2013). System Dynamics Methods: A Quick Introduction. Phoenix: Arizona State
University .
KLM. (2013, April 10). Bedrijfsprofiel. Retrieved from KLM: http://www.klm.com/corporate/nl/about-
klm/profile/index.html
KLM. (2013, June 06). Cargo transport. Retrieved 06 26, 2013, from KLM Corporate:
http://www.klm.com/corporate/en/about-klm/information-school-talks/cargo-
transport.html
101
KLM. (2013, September 3). Keeping the family together. Retrieved from KLM:
http://www.klm.com/csr/en/workforce/keeping_the_family_together.html
KLM Cargo. (2012, Novemeber 1). Hoe gaat het met Air France-KLM-Martinair Cargo. Cargo Carrier,
pp. 1-2.
KLM Cargo. (2013, August 1). Cargo Carrier. Verdeling van vracht tussen Menzies en de KLM-hub.
Amsterdam, North-Holland, Netherlands: KLM Cargo.
KLM Cargo. (2013, April 12). Groei in markt. Wolkenridder. Amsterdam, Noord-Holland, Nederland:
KLM Cargo.
Koster, B. (2013, October 17). De groei van vracht op Schiphol zet door. Financieele Dagblad.
Amsterdam, Noord-Holland, Netherlands: Financieele Dagblad.
Krol, B. (2013, February 12). Introduction. (M. Bronsing, Interviewer)
Leue, S., & Wei, W. (2013). Integer Linear Programming-Based Property Checking for Asynchronous
Reactive Systems. IEEE Transactions on software engineering, 216-236.
Marinov, M., & Viegas, J. (2011). A mesoscopic simulation modelling methodology for analyzing and
evaluating freight train operations in a rail network. Simulation Modelling Practice and
Theory, 516-539.
Martinair. (2013, March 12). Business. Retrieved March 12, 2013, from Martinair:
http://www.martinair.nl/businesses/
Martinair Cargo. (2013, 1 16). Martinair Cargo. Retrieved 1 16, 2013, from Martinair Cargo:
http://www.martinaircargo.com/
Mason, A. (2012). OpenSolver - An Open Source Add-in to Solve Linear and Integer Progammes in
Excel. International Conference on Operations Research (pp. 401-406). Zurich: Springer Berlin
Heidelberg.
Mason, A., & Dunning, I. (2010). OpenSolver: Open source optimisation for Excel. Annual Conference
of the ORSNZ. New Zealand: University of Auckland.
Maylor, H. (2010). Project Management. England: Pearson.
Menzies Aviation. (2013, 06 25). Cargo Forwarding. Retrieved 06 25, 2013, from Menzies Aviation:
http://www.menziesaviation.com/item/list/p/12/ref/Cargo-Forwarding
Menzies Aviation NL. (2013, 06 25). Menzies Aviation NL. Retrieved 06 25, 2013, from Menzies
Aviation NL: http://www1.menziesaviation.nl/ams_about_us_cargo.htm
Mind Tools. (2013, October 10). Flow Chart. Retrieved from Mind Tools:
http://www.mindtools.com/pages/article/newTMC_97.htm#sthash.44Rhc9Eo.dpuf
Mind Tools. (2013, October 28). Scenario Analysis. Retrieved from Mind Tools:
http://www.mindtools.com/pages/article/newSTR_98.htm
102
Ministry of Finance, Government of India. (2013, June 12). Cargo Handling Service. Retrieved from
Service tax: http://www.servicetax.gov.in/st-profiles/cargo-handling.htm
MIT. (2013, October 28). Network Models. Retrieved from MIT: web.mit.edu/15.053/www/AMP-
Chapter-08.pdf
Morecroft, J., & Robinson, S. (2005). Explaining Puzzling Dynamics: Comparing the Use of System
Dynamics and Discrete-event Simulation. Proceedings of the 23rd International Conference of
the System Dynamics Society, 1-32.
NOS. (2004, September 30). NOS. Retrieved January 23, 2013, from NOS:
http://nos.nl/archief/2004/nieuws/index.html#@http://nos.nl/archief/2004/nieuws/financie
el/2003/september/300903/klm.html
Oberkampf, W., Trucano, T., & Hirsch, C. (2002). Verification, Validation, and Predictive Capability in
Computational Engineering and Physics. Maryland: Johns Hopkins University/Applied Physics
Laboratory Laurel.
Office. (2013, 10 25). Excel specifications and limits. Retrieved from Office:
http://office.microsoft.com/en-us/excel-help/excel-specifications-and-limits-
HA103980614.aspx?redir=0
OpenSolver. (2013, 10 3). OpenSolver. Retrieved from OpenSolver: http://opensolver.org/resources/
Osinga, M. (2013, 06 11). Transport from KLM to Menzies. (M. Bronsing, Interviewer)
Out, E. (2013, May 22). Costs and revenues for KLM cargo handling. (M. Bronsing, Interviewer)
Pearl, J. (1995). Causal diagrams for empirical research. Biometrika, 669-710.
Pearson. (2013, October 28). Transportation and assignment Solution Methods. Retrieved from
Pearson:
http://wps.pearsoned.co.uk/wps/media/objects/14803/15159200/online_modules/taylor_i
ms11_module_B.pdf
Peper, P.-J. (2013, 04 09). Variation Live; Horse. (M. Bronsing, Interviewer)
Petersen, J. (2007). Air Freight Industry - White Paper. Georgia: The Supply Chain and Logistics
Institute.
PriceWaterhouseCoopers. (2013, October 14). Guide to Key Performance Indicators. Retrieved from
Corporate reporting: http://www.pwc.com/gx/en/corporate-
reporting/assets/pdfs/uk_kpi_guide.pdf
PTC. (2013, September 21). Verification and Validation. Retrieved from PTC:
http://www.ptc.com/WCMS/files/43562/en/VV2089_v3.pdf
Ragsdale, C. (2004). Spreadsheet Modeling & Decision Analysis. Cengage Learning.
Reeb, J., & Leavengood, S. (1998). Using the Simplex Method to Solve Linear Programming
Maximization Problems. Acts of Congress (pp. 1-28). Oregon: Oregon State University.
103
Savrasov, M. (2008). Flow systems analysis: methods and approaches. Computer Modelling and New
Technologies vol 12, 7-15.
Scholl, H. (2001). Agent-‐based and System Dynamics Modelling: A Call for Cross Study and Joint
Research. System Sciences, 8-10.
Schroder, J. (2013, May 16). Cargo handling tariff of Menzies. (M. Bronsing, Interviewer)
SER Brabant. (2011). Brabant logistieke topregio 2030. Den Bosch: Kernteam BLTR 2030.
Shobrys, D., & White, D. (2000). Planning, Scheduling and control systems: why can they not work
together. Computers and Chemical Engineering, 163-173.
SkyTeam Cargo. (2012, October 13). China Airlines wordt officieel lid van SkyTeam Cargo. Retrieved
December 25, 2012, from Skyteamcargo.com: http://www.skyteamcargo.com/nl/About-
us/Media-center/China-Airlines-wordt-officieel-lid-van-SkyTeam-Cargo/
Spoor, S. (2013). One Airway Bill; One system. One Airway Bill Meeting (pp. 13-14). Amstelveen: KLM
Cargo.
Supply Chain Council. (2010). Supply-chain operations reference-model, SCOR overview version 10.0.
Cypress: Supply Chain Council.
Tang, S., Wang, D., & Ding, F. (2012). A new process-based cost estimation and pricing model
considering the influences of indirect consumption relationships and quality factors. Elsevier,
985-993.
Taylor 3, B. (2007). Introduction to Management Science . Upper Saddle River: Pearson Prentice Hall.
Tilburg, R. (2013, March 21). Processes at KLM Animal Hotel. (M. Bronsing, Interviewer)
TNT. (2013, October 1). Warehousing in our VAS centers. Retrieved from TNT: Warehousing in our
VAS Centres
Todtenhaupt, M. (2013, March 21). Data of Menzies cargo handling. (M. Bronsing, Interviewer)
Transport Nieuwsblad. (2012, August 3). Transport Nieuwsblad. Retrieved December 16, 2012, from
Transport Nieuwsblad:
http://www.nieuwsbladtransport.nl/Edition/tabid/321/ArticleID/6794/PageID/2755/PageTitl
e/15/EditionID/149/Default.aspx?ArticleTitle=Zwaar+verlies+KLM+Cargo&EditionTitle=Editie
+31
Troost, S. (2013, April 10). Consultant Decision Support. (M. Bronsing, Interviewer)
UK Aviation Security Compliance. (2013, 06 18). Department for Transport - List of DfT Regulated
Agents. Retrieved 06 25, 2013, from Aviation Security Compliance:
https://www.gov.uk/government/uploads/system/uploads/attachment_data/file/207675/re
gulated-agents.pdf
van der Ben, A. (2013, July 16). Project Manager Development & Process Support at RM. (M.
Bronsing, Interviewer)
104
van Duin, J. (2013, April 5). Dedicated OR software versus OpenSolver. (M. Bronsing, Interviewer)
van Zijl, M. (2013, 05 14). Cooperation between Martinair, Menzies and KLM. (M. Bronsing,
Interviewer)
Verschuren, P., & Doorewaard, H. (2010). Designing a Reaseach Project. The Hague: Eleven
International Publishing.
Wever, L. (2013, May 22). Import charges. (M. Bronsing, Interviewer)
Winston, W., & Venkataramanan, M. (2002). Introduction to Mathematical Programming: Operations
Research. Stamford: Cengage Learning.
Zaraté, P. (2013, September 16). International Journal of Decision Support System Technology.
Retrieved from International Journal of Decision Support System Technology: http://www.igi-
global.com/journal/international-journal-decision-support-system/1120
Zeng, S., Xie, X., & Tam, C. (2010). Relationships between cooperation networks and innovation
performance of SMEs. Technovation volume 30, 181-194.
105
Appendix Content Appendix A: Scientific article Appendix B: Initial project description Appendix C: Literature review on optimization methods Appendix D: KPI Analysis Appendix E: Internal actor analysis Appendix F: KLM handling processes in freight buildings Appendix G: Handling processes in Menzies warehouse Appendix H: Nearby solution tests Appendix I: Data file selection Appendix J: Model specification Appendix K: Data validation Appendix L: Verification & Validation Appendix M: Query of Revenue Management data base Appendix N: Data analysis of Martinair cargo flows Appendix O: Marginal costs calculation at KLM Appendix P: Constraints Appendix Q: Sensitivity Analysis Appendix R: Martinair Flight Schedule Appendix S: Unit Load Device (ULD) Appendix T: Scenario analysis
106
Appendix A: Scientific article
OpenSolver; a reliable and user friendly alternative for OR software
Learnings from a literature review and a case study at KLM Cargo of an optimal cargo flow allocation between the KLM warehouse and a third party air cargo handler
Michiel Bronsing December 2013
Delft University of Technology Faculty of Technology, Policy & Management
Words: 3.070
Abstract
It is possible to conduct an extensive research on complex real life problems without extensive knowledge on Operations Research (OR)! In this paper the boundaries of the free Microsoft Excel add-in, OpenSolver, are presented by answering the following research question: ‘How could a situation generally be characterized in which the help of OpenSolver provide useful recommendations on OR problems?’ A literature review is conducted to elaborate on the advantages and drawbacks of OpenSolver. Thereafter valuable learnings from a case study at KLM Cargo Operations are presented. In this case study, an assignment problem is tackled which includes a third party cargo handler. From the literature review and case study can be derived that the problem type, size and complexity influence the usability of OpenSolver. Based on these criteria could general managers decide if OpenSolver could be helpful for their OR problems. Key words: Optimization, (Integer) Linear Programming, OpenSolver, Assignment problem, Air cargo handling
107
1. Introduction Is it possible to conduct an extensive research on complex real life problems without extensive knowledge on Operations Research (OR)? OR could be defined as: “the effective use of scarce resources under dynamic and uncertain conditions (Eisner, 2004, p. 1)”. OR emerged due to rising complexity and specialization in organizations (Hillier & Lieberman, 2009). Due to the rising complexity, it becomes more difficult for managers to make well-structured decisions on defining the most optimal situation for their organization. This paper is written for general managers with a basic degree of knowledge about math, Microsoft Excel and OR and wish to improve decision making with the help of OR. OR experts make use of dedicated OR software for optimization and simulation. One of the major drawbacks for non-OR experts is that these software packages require extensive knowledge on OR and about their programming language. Furthermore, these packages are expensive which results that most managers not even think about a purchase. In this paper a free OR tool is described that could support general managers in large complex problems without extensive knowledge on OR and programming. OpenSolver is a free Microsoft Excel add-in that contains a more powerful engine than the standard Solver of Excel (Mason & Dunning, 2010). But the question remains if this tool is powerful enough to be qualified as a reliable substitute of dedicated OR software. In this paper the following hypothesis is validated: ‘OpenSolver is a user friendly and reliable alternative for dedicated OR software.’ If this hypothesis is answered with a yes, it could be valuable for managers to have an overview of criteria in which situations the OpenSolver is a user friendly and reliable alternative for dedicated OR software. This paper searches for the boundaries of the OpenSolver, so managers could define if an optimization with OpenSolver is possible for their business problem. The hypothesis is partly validated with answering the following research question: ‘How could a situation generally be characterized in which the help of
OpenSolver provide useful recommendations on OR problems?’ In order to answer the research question a literature review is conducted on the (dis)advantages of OpenSolver. In addition, a case study is performed in order to present the usability of OpenSolver in practice. This case study is performed at KLM Cargo Operations in the Netherlands. Middle-level managers were in need of a Decision Support System (DSS) that provide useful insight in the optimization of a cargo flow allocation at Schiphol Airport. The aim of this paper is to introduce general managers with OpenSolver, so problems in companies or organizations could be solved without external help. Since the use of OpenSolver could be time-consuming, is in this paper the situation described in which OpenSolver could contribute to valuable recommendations. This is to avoid unnecessary work of managers. First a literature review on OR and the (dis)advantages of OpenSolver is performed. Thereafter the case study at KLM Cargo Operations is introduced. In the fourth section valuable lessons from this case study are presented. In the fifth section the learnings about OpenSolver from this study are presented. In section 6, the criteria that characterize a situation in which OpenSolver could provide useful recommendations are presented. At last the conclusions are provided. 2. Literature review In this section a literature review is conducted to elaborate on the advantages and drawbacks of OpenSolver. OpenSolver is free add-in for Microsoft Excel that contains an open source optimization engine of the Computational Infrastructure for Operations Research, COIN-OR (2013). In this section is OpenSolver compared to dedicated OR software. Hillier & Lieberman (2009) mention dedicated OR software packages as: LINDO, MPSX, CPLEX and MathPro. OpenSolver and dedicated OR software are compared on different criteria;
108
problem type, problem size, user interface, results and robustness. These criteria were derived from the case study performed at KLM Cargo Operations. Alan S. Abrahams & Cliff T. Ragsdale describe in their article about DSSs the reasons for using Excel instead of dedicated OR software. Their objective was to design a DSS in an affordable, accessible and familiar software platform (Abrahams & Ragsdale, 2012). These requirements are quite similar to the requirements of KLM Cargo. Before the comparison on these requirements, a literature review on OR and Open source software developments are presented. 2.1 Open source software developments Open source software developments are a result of the need for reliable and easy accessible analysis. Protecode (2013) elaborates on trends in the open source market. Investments in open source projects in the US increased with 49% in 2011 to $674.9 million compared to the year before (Protecode, 2013). Practically in cloud computing, big data and mobile sectors, open source software contribute to major innovations (Protecode, 2013). The Information Society Directorate General of the European Commission initiated a working group on software. This working group elaborates on the history of open source software. Open source software increased rapidly after the development of the Linux platform in 1993 (Working Group on Libre Software, 2013). One of the advantages of open source software could be explained by the ‘Linus law’, named after the developer of Linux: “given enough eyeballs, all bugs are shallow” (Princeton, 2013). This means that if enough developers can test the code, all problems can quickly be found and solved. In addition, people believe that the quality and security can be improved when every developer can adjust the code. 2.2 Operations research According to Reeb and Leavengood (1998, p. 1) is OR “concerned with scientifically deciding how to best design and operate man-machine systems, usually under conditions requiring the allocation of scarce resources”. OR can
contribute to improving business results or more efficient processes. Using OR software could increase the quality of information as input for decisions. In this kind of situations they are called; Decision Support Systems (DSS). These systems could be very useful in complex problems where optimality is of great importance (Druzdzel & Flynn, 2002).
2.3 Problem type OpenSolver (2013) is able to model linear and integer problems. So, a disadvantage of OpenSolver is that non-linear problems could not be solved. Integer Linear Program differs from Linear Programming (LP) because the decision variables are integers. Integer problems require different algorithms (Taylor, 2006). LP is a very popular tool in many OR problems (Hillier & Lieberman, 2009). The imperial college of London (2003, p.2) defines LP as “an optimal decision making tool in which the objective is a linear function and the constraints on the optimal decision problem are linear equalities and inequalities.” LP problems could be formulated in spreadsheet format or dedicated OR software packages (Hillier & Lieberman, 2009, p. 5). An often used approach for the spreadsheet format is the premier spreadsheet package, Microsoft Excel. 2.4 Size of problem In Excel a standard Solver is provided that is very useful for small OR problems. The standard Solver is not able to coop with problems with more than 200 decision variables and constraints (Mason & Dunning, 2010). For larger complex problems is dedicated OR software often required, or the expansion of Excel Solver is available for $5.495 (Frontline Solver, 2013). The free OpenSolver add-in does not have an artificial limit and therefore capable of modelling large problems (OpenSolver, 2013). Nevertheless some disadvantages become clear when the problem size increases. The size influences error solving and robustness. When the spreadsheets size increases it is hard to keep track on changes and errors (Aeschbacher , 2012). Despite of the function that highlights the decision variables, constraints and objective cell in OpenSolver (2013), it remains
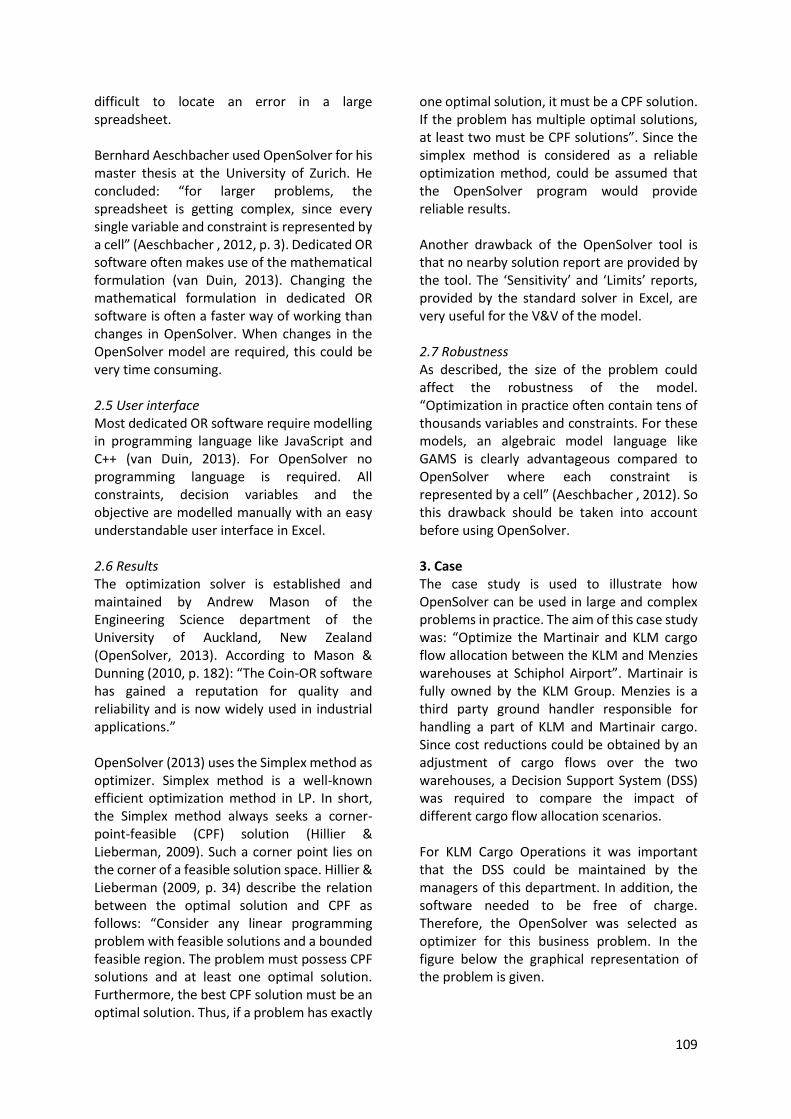
109
difficult to locate an error in a large spreadsheet. Bernhard Aeschbacher used OpenSolver for his master thesis at the University of Zurich. He concluded: “for larger problems, the spreadsheet is getting complex, since every single variable and constraint is represented by a cell” (Aeschbacher , 2012, p. 3). Dedicated OR software often makes use of the mathematical formulation (van Duin, 2013). Changing the mathematical formulation in dedicated OR software is often a faster way of working than changes in OpenSolver. When changes in the OpenSolver model are required, this could be very time consuming. 2.5 User interface Most dedicated OR software require modelling in programming language like JavaScript and C++ (van Duin, 2013). For OpenSolver no programming language is required. All constraints, decision variables and the objective are modelled manually with an easy understandable user interface in Excel. 2.6 Results The optimization solver is established and maintained by Andrew Mason of the Engineering Science department of the University of Auckland, New Zealand (OpenSolver, 2013). According to Mason & Dunning (2010, p. 182): “The Coin-OR software has gained a reputation for quality and reliability and is now widely used in industrial applications.” OpenSolver (2013) uses the Simplex method as optimizer. Simplex method is a well-known efficient optimization method in LP. In short, the Simplex method always seeks a corner-point-feasible (CPF) solution (Hillier & Lieberman, 2009). Such a corner point lies on the corner of a feasible solution space. Hillier & Lieberman (2009, p. 34) describe the relation between the optimal solution and CPF as follows: “Consider any linear programming problem with feasible solutions and a bounded feasible region. The problem must possess CPF solutions and at least one optimal solution. Furthermore, the best CPF solution must be an optimal solution. Thus, if a problem has exactly
one optimal solution, it must be a CPF solution. If the problem has multiple optimal solutions, at least two must be CPF solutions”. Since the simplex method is considered as a reliable optimization method, could be assumed that the OpenSolver program would provide reliable results. Another drawback of the OpenSolver tool is that no nearby solution report are provided by the tool. The ‘Sensitivity’ and ‘Limits’ reports, provided by the standard solver in Excel, are very useful for the V&V of the model. 2.7 Robustness As described, the size of the problem could affect the robustness of the model. “Optimization in practice often contain tens of thousands variables and constraints. For these models, an algebraic model language like GAMS is clearly advantageous compared to OpenSolver where each constraint is represented by a cell” (Aeschbacher , 2012). So this drawback should be taken into account before using OpenSolver. 3. Case The case study is used to illustrate how OpenSolver can be used in large and complex problems in practice. The aim of this case study was: “Optimize the Martinair and KLM cargo flow allocation between the KLM and Menzies warehouses at Schiphol Airport”. Martinair is fully owned by the KLM Group. Menzies is a third party ground handler responsible for handling a part of KLM and Martinair cargo. Since cost reductions could be obtained by an adjustment of cargo flows over the two warehouses, a Decision Support System (DSS) was required to compare the impact of different cargo flow allocation scenarios. For KLM Cargo Operations it was important that the DSS could be maintained by the managers of this department. In addition, the software needed to be free of charge. Therefore, the OpenSolver was selected as optimizer for this business problem. In the figure below the graphical representation of the problem is given.
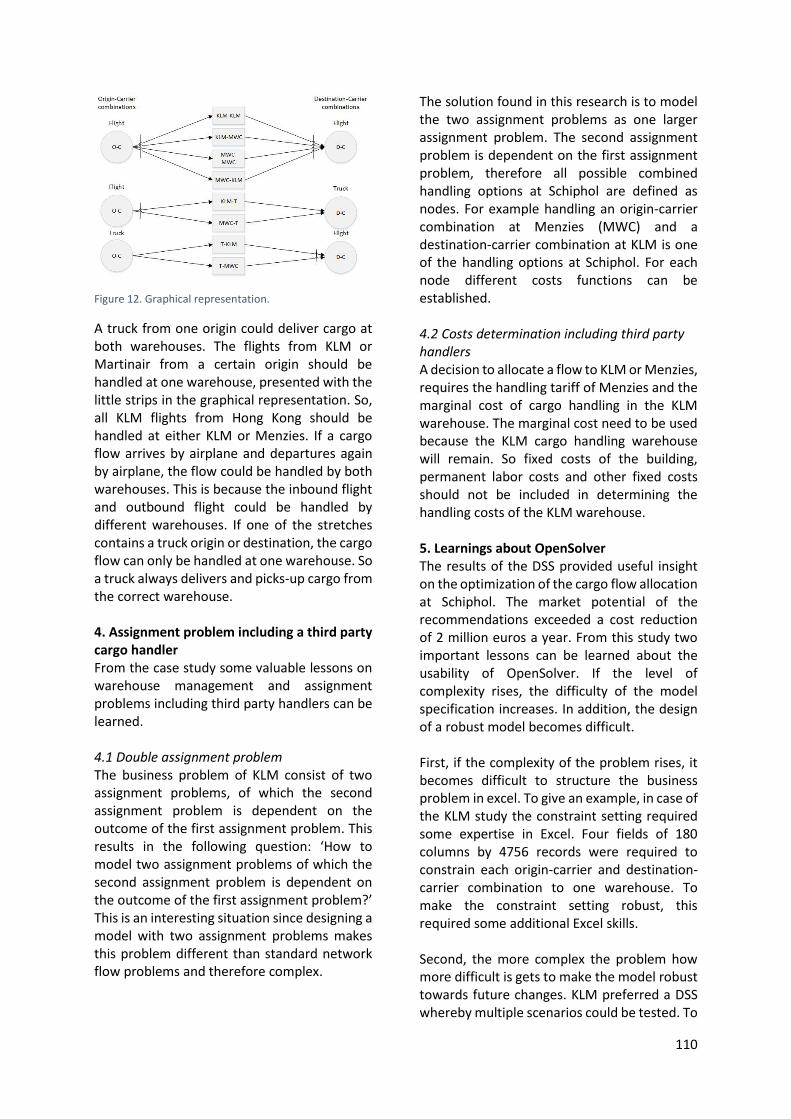
110
Figure 12. Graphical representation.
A truck from one origin could deliver cargo at both warehouses. The flights from KLM or Martinair from a certain origin should be handled at one warehouse, presented with the little strips in the graphical representation. So, all KLM flights from Hong Kong should be handled at either KLM or Menzies. If a cargo flow arrives by airplane and departures again by airplane, the flow could be handled by both warehouses. This is because the inbound flight and outbound flight could be handled by different warehouses. If one of the stretches contains a truck origin or destination, the cargo flow can only be handled at one warehouse. So a truck always delivers and picks-up cargo from the correct warehouse. 4. Assignment problem including a third party cargo handler From the case study some valuable lessons on warehouse management and assignment problems including third party handlers can be learned. 4.1 Double assignment problem The business problem of KLM consist of two assignment problems, of which the second assignment problem is dependent on the outcome of the first assignment problem. This results in the following question: ‘How to model two assignment problems of which the second assignment problem is dependent on the outcome of the first assignment problem?’ This is an interesting situation since designing a model with two assignment problems makes this problem different than standard network flow problems and therefore complex.
The solution found in this research is to model the two assignment problems as one larger assignment problem. The second assignment problem is dependent on the first assignment problem, therefore all possible combined handling options at Schiphol are defined as nodes. For example handling an origin-carrier combination at Menzies (MWC) and a destination-carrier combination at KLM is one of the handling options at Schiphol. For each node different costs functions can be established. 4.2 Costs determination including third party handlers A decision to allocate a flow to KLM or Menzies, requires the handling tariff of Menzies and the marginal cost of cargo handling in the KLM warehouse. The marginal cost need to be used because the KLM cargo handling warehouse will remain. So fixed costs of the building, permanent labor costs and other fixed costs should not be included in determining the handling costs of the KLM warehouse. 5. Learnings about OpenSolver The results of the DSS provided useful insight on the optimization of the cargo flow allocation at Schiphol. The market potential of the recommendations exceeded a cost reduction of 2 million euros a year. From this study two important lessons can be learned about the usability of OpenSolver. If the level of complexity rises, the difficulty of the model specification increases. In addition, the design of a robust model becomes difficult. First, if the complexity of the problem rises, it becomes difficult to structure the business problem in excel. To give an example, in case of the KLM study the constraint setting required some expertise in Excel. Four fields of 180 columns by 4756 records were required to constrain each origin-carrier and destination-carrier combination to one warehouse. To make the constraint setting robust, this required some additional Excel skills. Second, the more complex the problem how more difficult is gets to make the model robust towards future changes. KLM preferred a DSS whereby multiple scenarios could be tested. To
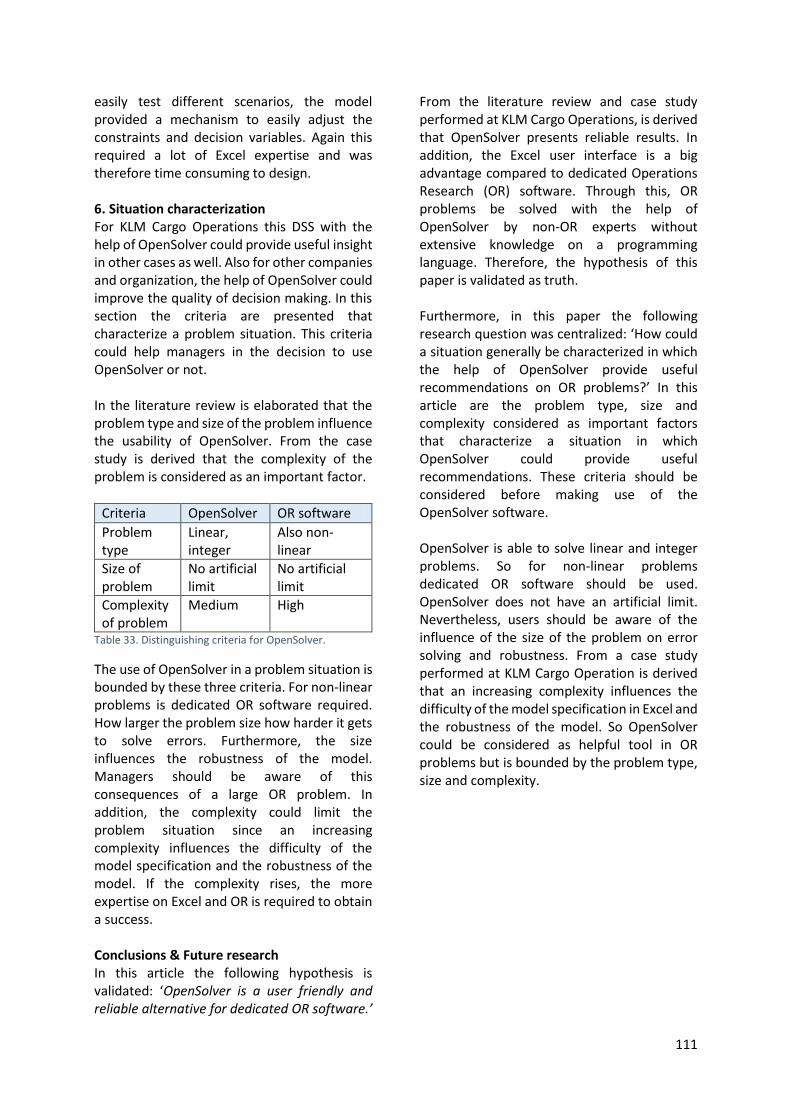
111
easily test different scenarios, the model provided a mechanism to easily adjust the constraints and decision variables. Again this required a lot of Excel expertise and was therefore time consuming to design. 6. Situation characterization For KLM Cargo Operations this DSS with the help of OpenSolver could provide useful insight in other cases as well. Also for other companies and organization, the help of OpenSolver could improve the quality of decision making. In this section the criteria are presented that characterize a problem situation. This criteria could help managers in the decision to use OpenSolver or not. In the literature review is elaborated that the problem type and size of the problem influence the usability of OpenSolver. From the case study is derived that the complexity of the problem is considered as an important factor.
Criteria OpenSolver OR software
Problem type
Linear, integer
Also non-linear
Size of problem
No artificial limit
No artificial limit
Complexity of problem
Medium High
Table 33. Distinguishing criteria for OpenSolver.
The use of OpenSolver in a problem situation is bounded by these three criteria. For non-linear problems is dedicated OR software required. How larger the problem size how harder it gets to solve errors. Furthermore, the size influences the robustness of the model. Managers should be aware of this consequences of a large OR problem. In addition, the complexity could limit the problem situation since an increasing complexity influences the difficulty of the model specification and the robustness of the model. If the complexity rises, the more expertise on Excel and OR is required to obtain a success. Conclusions & Future research In this article the following hypothesis is validated: ‘OpenSolver is a user friendly and reliable alternative for dedicated OR software.’
From the literature review and case study performed at KLM Cargo Operations, is derived that OpenSolver presents reliable results. In addition, the Excel user interface is a big advantage compared to dedicated Operations Research (OR) software. Through this, OR problems be solved with the help of OpenSolver by non-OR experts without extensive knowledge on a programming language. Therefore, the hypothesis of this paper is validated as truth. Furthermore, in this paper the following research question was centralized: ‘How could a situation generally be characterized in which the help of OpenSolver provide useful recommendations on OR problems?’ In this article are the problem type, size and complexity considered as important factors that characterize a situation in which OpenSolver could provide useful recommendations. These criteria should be considered before making use of the OpenSolver software. OpenSolver is able to solve linear and integer problems. So for non-linear problems dedicated OR software should be used. OpenSolver does not have an artificial limit. Nevertheless, users should be aware of the influence of the size of the problem on error solving and robustness. From a case study performed at KLM Cargo Operation is derived that an increasing complexity influences the difficulty of the model specification in Excel and the robustness of the model. So OpenSolver could be considered as helpful tool in OR problems but is bounded by the problem type, size and complexity.
112
References Abrahams, A., & Ragsdale, C. (2012). A
Decision Support System for patient
scheduling in travel vaccine
administration. Decision Support
Sytems 54, 215-225.
Aeschbacher , B. (2012). Solving a Large Scale
Integer Program with Open-Source-
Software . Zurich: University of Zurich
.
COIN-OR. (2013, November 5). OSI Project
destribtion. Retrieved from COIN-OR:
http://www.coin-
or.org/projects/Osi.xml
Druzdzel, M., & Flynn, R. (2002). Decision
Support System. In A. Kent,
Encyclopedia of Library and
Information Science (pp. 1-12). New
York: Marcel Dekker, Inc.
Eisner, M. (2004, 06 27). Operation everything.
Retrieved from The Boston Globe:
http://www.boston.com/news/globe/
ideas/articles/2004/06/27/operation_
everything?pg=full
Frontline Solver. (2013, September 13).
Analytical Solver Platform. Retrieved
from Solver:
http://www.solver.com/catalog/excel-
products
Hillier, F., & Lieberman, G. (2009). Introduction
to Operations Research. New York:
Mcgraw-Hill Professional.
Imperial College London. (2003, September
13). Operations research. Retrieved
from Imperial College London:
http://www.doc.ic.ac.uk/~br/berc/line
arprog.pdf
Martinair. (2013, March 12). Business.
Retrieved March 12, 2013, from
Martinair:
http://www.martinair.nl/businesses/
Mason, A., & Dunning, I. (2010). OpenSolver:
Open source optimisation for Excel.
Annual Conference of the ORSNZ. New
Zealand: University of Auckland.
OpenSolver. (2013, September 13).
OpenSolver for Excel. Retrieved from
OpenSolver for Excel:
http://opensolver.org/
Princeton. (2013, 12 7). Princeton. Retrieved
from Linus's law:
http://www.princeton.edu/~achaney/
tmve/wiki100k/docs/Linus_s_Law.htm
l
Protecode. (2013, 12 7). Open Source vs.
Proprietary Software: Trends in the
Market. Retrieved from Protecode:
http://info.protecode.com/bid/68365
/Open-Source-vs-Proprietary-
Software-Trends-in-the-Market
Taylor, B. (2006). Introduction to Managment
Science. Virgina: Prentice Hall.
van Duin, J. (2013, April 5). Dedicated OR
software versus OpenSolver. (M.
Bronsing, Interviewer)
Winston, W., & Venkataramanan, M. (2002).
Introduction to Mathematical
Programming: Operations Research.
Stamford: Cengage Learning.
Working Group on Libre Software. (2013,
December 7). EU Conecta. Retrieved
from Free Software/ Open Source:
Information Society Opportunities for
Europe: http://eu.conecta.it/paper/
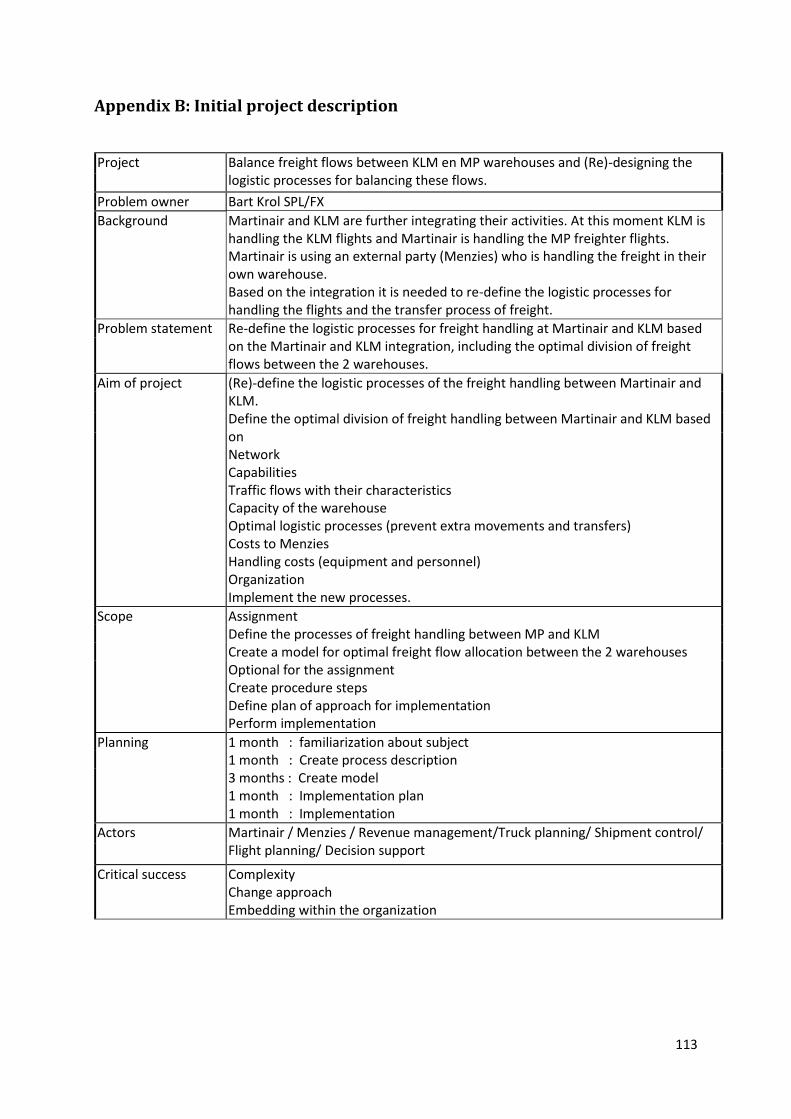
113
Appendix B: Initial project description
Project Balance freight flows between KLM en MP warehouses and (Re)-designing the logistic processes for balancing these flows.
Problem owner Bart Krol SPL/FX
Background Martinair and KLM are further integrating their activities. At this moment KLM is handling the KLM flights and Martinair is handling the MP freighter flights. Martinair is using an external party (Menzies) who is handling the freight in their own warehouse. Based on the integration it is needed to re-define the logistic processes for handling the flights and the transfer process of freight.
Problem statement Re-define the logistic processes for freight handling at Martinair and KLM based on the Martinair and KLM integration, including the optimal division of freight flows between the 2 warehouses.
Aim of project (Re)-define the logistic processes of the freight handling between Martinair and KLM. Define the optimal division of freight handling between Martinair and KLM based on Network Capabilities Traffic flows with their characteristics Capacity of the warehouse Optimal logistic processes (prevent extra movements and transfers) Costs to Menzies Handling costs (equipment and personnel) Organization Implement the new processes.
Scope Assignment Define the processes of freight handling between MP and KLM Create a model for optimal freight flow allocation between the 2 warehouses Optional for the assignment Create procedure steps Define plan of approach for implementation Perform implementation
Planning 1 month : familiarization about subject 1 month : Create process description 3 months : Create model 1 month : Implementation plan 1 month : Implementation
Actors Martinair / Menzies / Revenue management/Truck planning/ Shipment control/ Flight planning/ Decision support
Critical success Complexity Change approach Embedding within the organization
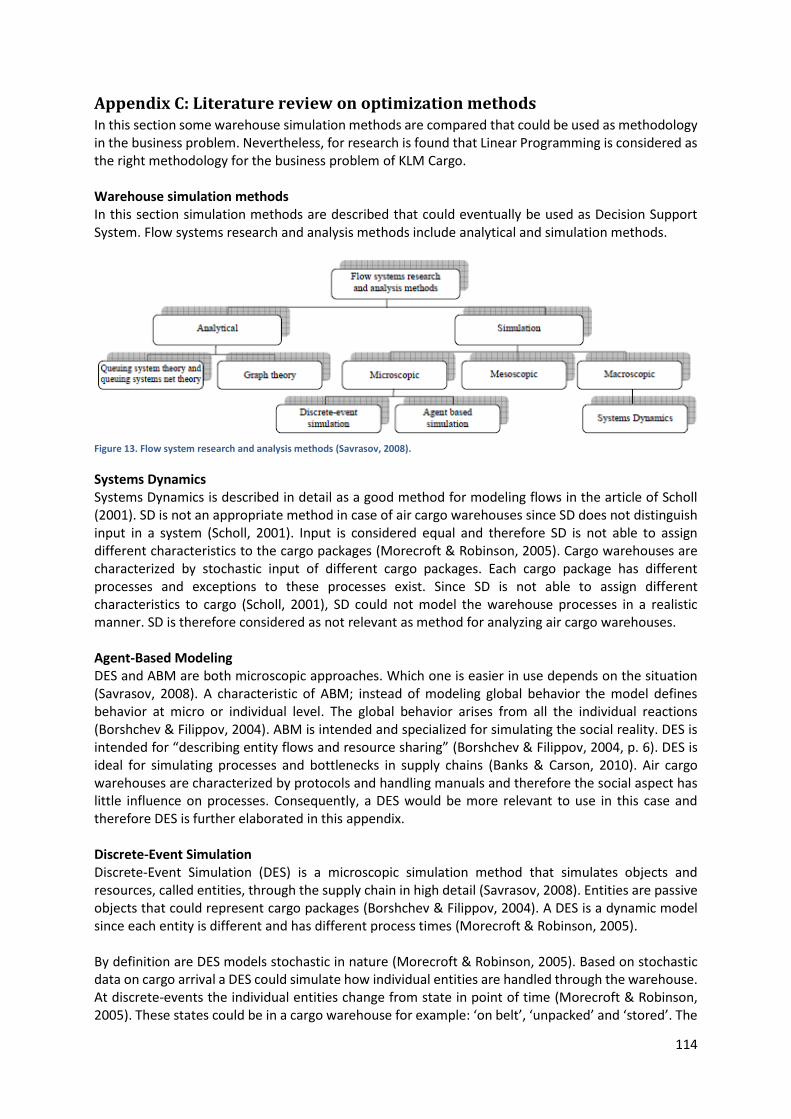
114
Appendix C: Literature review on optimization methods In this section some warehouse simulation methods are compared that could be used as methodology in the business problem. Nevertheless, for research is found that Linear Programming is considered as the right methodology for the business problem of KLM Cargo. Warehouse simulation methods In this section simulation methods are described that could eventually be used as Decision Support System. Flow systems research and analysis methods include analytical and simulation methods.
Figure 13. Flow system research and analysis methods (Savrasov, 2008).
Systems Dynamics Systems Dynamics is described in detail as a good method for modeling flows in the article of Scholl (2001). SD is not an appropriate method in case of air cargo warehouses since SD does not distinguish input in a system (Scholl, 2001). Input is considered equal and therefore SD is not able to assign different characteristics to the cargo packages (Morecroft & Robinson, 2005). Cargo warehouses are characterized by stochastic input of different cargo packages. Each cargo package has different processes and exceptions to these processes exist. Since SD is not able to assign different characteristics to cargo (Scholl, 2001), SD could not model the warehouse processes in a realistic manner. SD is therefore considered as not relevant as method for analyzing air cargo warehouses. Agent-Based Modeling DES and ABM are both microscopic approaches. Which one is easier in use depends on the situation (Savrasov, 2008). A characteristic of ABM; instead of modeling global behavior the model defines behavior at micro or individual level. The global behavior arises from all the individual reactions (Borshchev & Filippov, 2004). ABM is intended and specialized for simulating the social reality. DES is intended for “describing entity flows and resource sharing” (Borshchev & Filippov, 2004, p. 6). DES is ideal for simulating processes and bottlenecks in supply chains (Banks & Carson, 2010). Air cargo warehouses are characterized by protocols and handling manuals and therefore the social aspect has little influence on processes. Consequently, a DES would be more relevant to use in this case and therefore DES is further elaborated in this appendix. Discrete-Event Simulation Discrete-Event Simulation (DES) is a microscopic simulation method that simulates objects and resources, called entities, through the supply chain in high detail (Savrasov, 2008). Entities are passive objects that could represent cargo packages (Borshchev & Filippov, 2004). A DES is a dynamic model since each entity is different and has different process times (Morecroft & Robinson, 2005). By definition are DES models stochastic in nature (Morecroft & Robinson, 2005). Based on stochastic data on cargo arrival a DES could simulate how individual entities are handled through the warehouse. At discrete-events the individual entities change from state in point of time (Morecroft & Robinson, 2005). These states could be in a cargo warehouse for example: ‘on belt’, ‘unpacked’ and ‘stored’. The
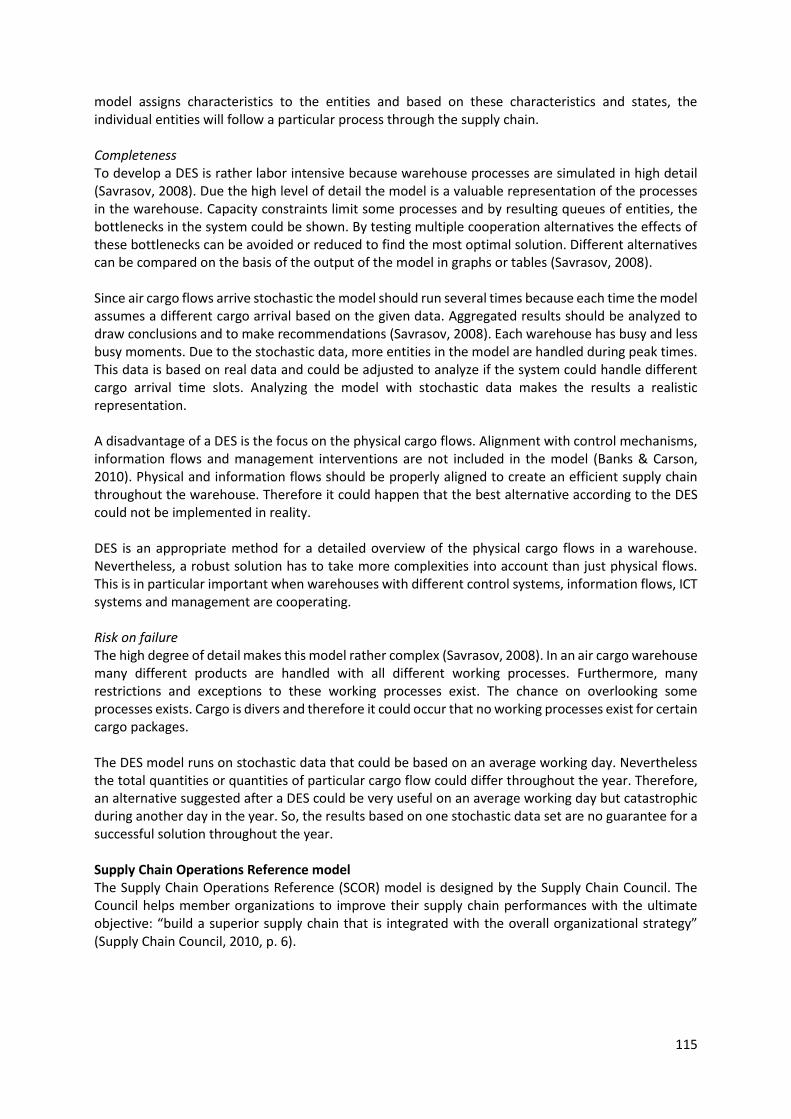
115
model assigns characteristics to the entities and based on these characteristics and states, the individual entities will follow a particular process through the supply chain. Completeness To develop a DES is rather labor intensive because warehouse processes are simulated in high detail (Savrasov, 2008). Due the high level of detail the model is a valuable representation of the processes in the warehouse. Capacity constraints limit some processes and by resulting queues of entities, the bottlenecks in the system could be shown. By testing multiple cooperation alternatives the effects of these bottlenecks can be avoided or reduced to find the most optimal solution. Different alternatives can be compared on the basis of the output of the model in graphs or tables (Savrasov, 2008). Since air cargo flows arrive stochastic the model should run several times because each time the model assumes a different cargo arrival based on the given data. Aggregated results should be analyzed to draw conclusions and to make recommendations (Savrasov, 2008). Each warehouse has busy and less busy moments. Due to the stochastic data, more entities in the model are handled during peak times. This data is based on real data and could be adjusted to analyze if the system could handle different cargo arrival time slots. Analyzing the model with stochastic data makes the results a realistic representation. A disadvantage of a DES is the focus on the physical cargo flows. Alignment with control mechanisms, information flows and management interventions are not included in the model (Banks & Carson, 2010). Physical and information flows should be properly aligned to create an efficient supply chain throughout the warehouse. Therefore it could happen that the best alternative according to the DES could not be implemented in reality. DES is an appropriate method for a detailed overview of the physical cargo flows in a warehouse. Nevertheless, a robust solution has to take more complexities into account than just physical flows. This is in particular important when warehouses with different control systems, information flows, ICT systems and management are cooperating. Risk on failure The high degree of detail makes this model rather complex (Savrasov, 2008). In an air cargo warehouse many different products are handled with all different working processes. Furthermore, many restrictions and exceptions to these working processes exist. The chance on overlooking some processes exists. Cargo is divers and therefore it could occur that no working processes exist for certain cargo packages. The DES model runs on stochastic data that could be based on an average working day. Nevertheless the total quantities or quantities of particular cargo flow could differ throughout the year. Therefore, an alternative suggested after a DES could be very useful on an average working day but catastrophic during another day in the year. So, the results based on one stochastic data set are no guarantee for a successful solution throughout the year. Supply Chain Operations Reference model The Supply Chain Operations Reference (SCOR) model is designed by the Supply Chain Council. The Council helps member organizations to improve their supply chain performances with the ultimate objective: “build a superior supply chain that is integrated with the overall organizational strategy” (Supply Chain Council, 2010, p. 6).
116
Figure 14. Five management processes of SCOR (Supply Chain Council, 2010).
As can be seen in the figure above, the Supply Chain Council (2010) describes five management processes: plan, source, make, deliver and return. The product delivery of one organization connects to the source of another organization. Thereafter, the ‘source’ should be in line with ‘make’ and subsequently with ‘deliver’. An organization should take two different types of ‘return’ into account. Their logistic processes should handle return to their supplier and thereby the return of products from their customer. ‘Plan’ is an important management process since this plan should make sure all the management processes are well fitted. Completeness To describe each management process from macroscopic to microscopic level the Supply Chain Council (2010) uses three levels in which high, medium and low management processes are elaborated. Therefore, the SCOR model connects all management levels and creates a solid alignment from high to low management level in the warehouse.
In contrary to the DES, the SCOR model does not give insight on the capacity of the physical cargo flows. Therefore the model cannot give valuable assumptions if certain flow alternatives can be handled by the warehouse. To gain insight if new cargo flows do not extend the capacity, knowledge of experts could be used. Risk on failure In figure 1 can be seen that the SCOR model is focused on the improvement of the interaction between ‘deliver’ and ‘source’. In other words, the SCOR model is intended for cooperation across the supply chain. When parts of cargo flows are integrated or synchronized, the ‘source’ of warehouse A should be aligned with the ‘source’ of Warehouse B. The same applies for the other four management processes. The SCOR model could be a helpful method, but is not intended for improving cooperation of warehouses. For cooperation between two supply chains, two SCOR models should be established that describe both supply chains in depth. This could help find similarities in management processes. A new SCOR model of the future situation should be conducted to see how a new supply chain with cooperation is designed. As said, the SCOR model does not taken into account the capacity of physical cargo flows. Therefore, a proposed cargo flow based on the SCOR model contains risk on failure. A solution described with the SCOR model does not give a valuable estimation on if the warehouse could handle the new cargo flows.
117
Appendix D: KPI Analysis In this appendix is additional information on the KPI analysis performed. KPI important for KLM Cargo Operations but could not be influenced by a cargo flow allocation are presented. Financial perspective The KPIs for KLM Cargo Operations from a financial perspective are:
1. Cost price WW-OPS (ex rox) 2. Cost price FB2&3 (incl. Revenues) 3. Cost price Areas OPS (ex rox) 4. Cost price Europe Trucking
The first, third and fourth KPI are described why do are not influenced by a cargo flow allocation. The first KPI is an indicator of the performance of KLM Cargo globally. Since this thesis is only focused at Schiphol is this KPI not important for comparison of scenarios. The third KPI is applicable to the area of KLM Cargo Operations in which Schiphol is an important station. Because this thesis is focused on the activities on the hub, this KPI is not used for comparison of the cargo allocation scenarios. The fourth KPI is used to steer on the operational performance of the trucking department of KLM Cargo. Truck optimization is considered out of scope for this research so therefore the fourth financial KPI is not used at the scenario analysis. Load factor KPIs of the load factor are specified as:
1. Outbound network 2. Inbound network 3. Combined flight punctuality arrival 4. Combined flight punctuality departure 5. Completion factor combined flight
The KPIs presented above could be influenced by a cargo flow allocation adjustment. Nevertheless an adjustment will not influence these KPIs directly. Since the load factor is an important overall KPI for KLM Cargo Operations is decided to assign the load factor as a KPI in the scenario analysis. People & Internal processes KPIs from a ‘people & internal processes’ perspective are:
1. FTE Worldwide-Operations 2. Absenteeism FB2&3 3. Absenteeism FB1 4. E-Freight 5. Trucking performance to SPL 6. Thefts SPL 7. Dangerous goods occurrences 8. Claims pilferage 9. Accidents SPL
118
FTE WW-OPS, absenteeism, E-freight, trucking performance, thefts, dangerous goods occurrences, claims pilferage and accidents SPL are not applicable to this business problem defined in this thesis. Notwithstanding that these indicators are important for the business results of KLM Cargo.
Customer quality The KPIs for customer quality are:
1. FAP cohesion 2. FAP equation 3. Penetration rate 4. WW- FAP EHC 5. WW- DAP EHC 6. Claims (10,000 shipments) 14,2 in December 2012.
Menzies KPIs The KPIs of Menzies (John Menzies plc, 2010) are:
Revenues
Underlying PBT
Free cash flow
Underlying EPS
Full-year dividend per share
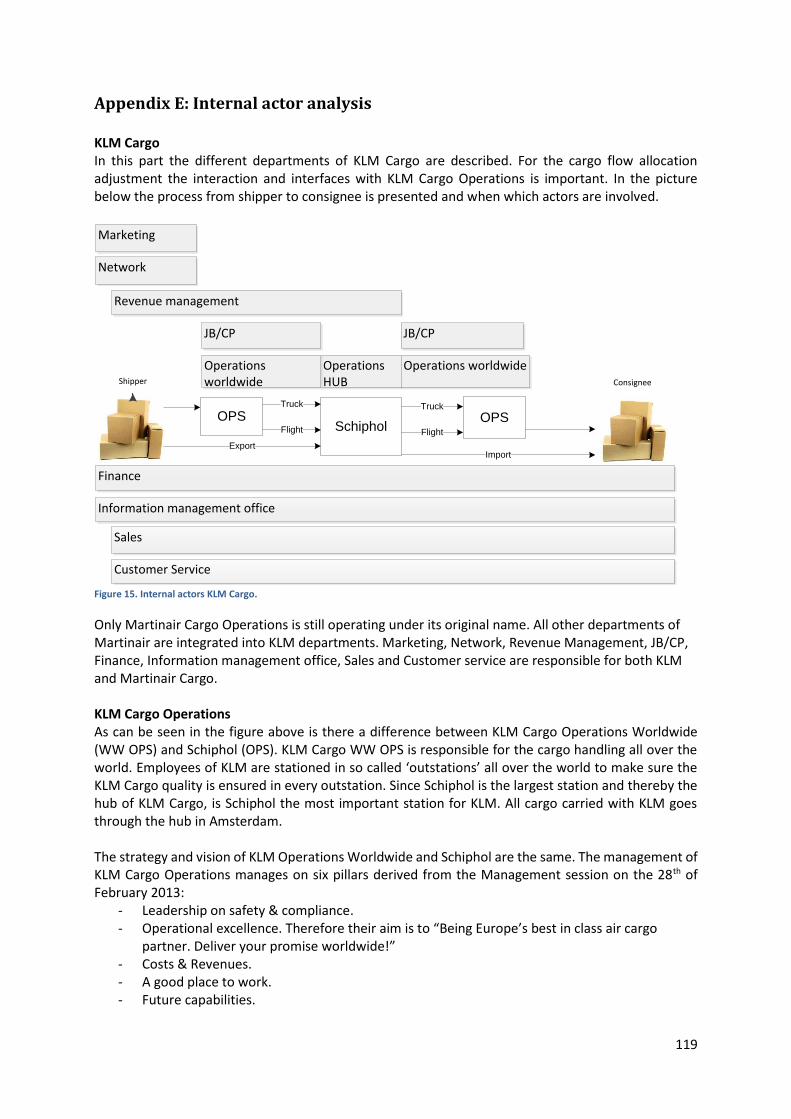
119
Appendix E: Internal actor analysis KLM Cargo In this part the different departments of KLM Cargo are described. For the cargo flow allocation adjustment the interaction and interfaces with KLM Cargo Operations is important. In the picture below the process from shipper to consignee is presented and when which actors are involved.
Marketing
Revenue management
Operations HUB
Customer Service
Sales
Information management office
Finance
Network
SchipholOPS
Truck
Flight
Export
OPS
Import
Truck
Flight
JB/CPJB/CP
ConsigneeShipper
Operations worldwide
Operations worldwide
Figure 15. Internal actors KLM Cargo.
Only Martinair Cargo Operations is still operating under its original name. All other departments of Martinair are integrated into KLM departments. Marketing, Network, Revenue Management, JB/CP, Finance, Information management office, Sales and Customer service are responsible for both KLM and Martinair Cargo. KLM Cargo Operations As can be seen in the figure above is there a difference between KLM Cargo Operations Worldwide (WW OPS) and Schiphol (OPS). KLM Cargo WW OPS is responsible for the cargo handling all over the world. Employees of KLM are stationed in so called ‘outstations’ all over the world to make sure the KLM Cargo quality is ensured in every outstation. Since Schiphol is the largest station and thereby the hub of KLM Cargo, is Schiphol the most important station for KLM. All cargo carried with KLM goes through the hub in Amsterdam. The strategy and vision of KLM Operations Worldwide and Schiphol are the same. The management of KLM Cargo Operations manages on six pillars derived from the Management session on the 28th of February 2013:
- Leadership on safety & compliance. - Operational excellence. Therefore their aim is to “Being Europe’s best in class air cargo
partner. Deliver your promise worldwide!” - Costs & Revenues. - A good place to work. - Future capabilities.
120
- Optimal cooperation with internal & external partners. JB/CP JB/CP is the department responsible for KLM and Martinair trucks in Europe. This department works closely together with Operations. A cargo flow allocation adjustment will definitely influence the processes at JB/CP, according to Mouhsine Bouhbouh (2013), Manager Regional Truck Planning Europe of KLM Cargo. When this adjustments are clearly communicated to JB/CP there are no problems expected (Bouhbouh, 2013). Truck planning of KLM and Martinair integrated into one department which results in economies of scale (Bouhbouh, 2013). Cargo of KLM and Martinair could be transported to the outstations in the same truck which result in a higher load factor of trucks. Network Revenue Management Marketing Network Revenue Management Marketing (NRM) is one department of KLM Cargo. Marketing and Network are departments which are not that much involved in the daily tasks of KLM Cargo Operations. Conflicts between RM and Operations occur daily (Krol, 2013). Network Network is responsible for network of KLM Cargo. Every half a year the flight schedule is adjusted and this department tries to forecast the important cargo destinations in coherence with Passenger Business. For this department an adjustment of a cargo flow allocation would have minimum effect on the business processes (Krol, 2013). Marketing The responsibility of the Marketing, Communication & E-commerce department is the branding of AF-KL Cargo. Their role is to: “better understand the evolution of the customers’ behavior, to identify their needs in order to better take advantage of our competitive assets” (AFKL Cargo, 2013). A cargo flow allocation adjustment would a have minimum impact on this department (Krol, 2013). Revenue Management The mission statement of Revenue Management (RM) is to: “optimize the group cargo capacity, short term and mid-term, aiming at maximal network shipment contribution. Balancing load factor, yield, variable costs and operational quality. Working together with Sales, Network and Operations” (AFKL Cargo, 2013). As can be derived from the mission statement, RM works together with KLM Cargo Operations. RM communicates to Operations if shipments are send on different flights. This could be done to fill the capacity of the whole network in the best way in order to optimize the margin of the full AF-KL-MP network (AFKL Cargo, 2013). A cargo flow allocation adjustment could affect RM processes according to Luuk de Greeff (2013), Area RM Schiphol, Americas & Africa. RM would favor a cargo flow allocation at Schiphol were RM could easily rebook shipments on different flights. If outgoing Martinair flights would be handled in the same warehouse as outgoing KLM flights, RM could easily exchange cargo between flights till the last moment before departure (Greeff, 2013). Sales & Customer Service Sales & Distribution and Customer Service are two departments concerned with customers of KLM and Martinair Cargo. After the Transform 2015 project a new commercial policy was launched. This policy aims to: “make our teams a professional reference with a view to winning our customers’ preferences in the long-term” (AFKL Cargo, 2013). The sales department is responsible for selling cargo capacity to customers. When capacity is sold ‘Customer service’ becomes the day-to-day contact of the customers. The mission of Customer Service is “to create professional direction and provide support to the development and the way of working of the commercial team” (AFKL Cargo, 2013). Since customer service is conserved with the day-to-day contact with customers, a cargo flow allocation adjustment
121
could impact their processes. If these adjustments are clearly communicated there are no problems expected (Krol, 2013). Finance & Information Management Office The Finance and Information Management Office are support departments of KLM Cargo. The Finance is responsible for the financial integrity of the operating companies (AFKL Cargo, 2013). The information Management Office (IMO) could be defined as the link between the IT and the Cargo businesses (AFKL Cargo, 2013). Their role is: “to support the businesses in their strategy by designing, implementing and maintaining the information systems that will meet their requirements” (AFKL Cargo, 2013). The IMO play an important role in the integration of AF-KL-MP Cargo. In 2015 one common system should be introduced that substitute the ICT systems of Martinair, Air France and KLM into one system. IMO is an important actor because adjustments in the ICT systems are expected while adjusting the cargo flow allocation. When Operations and the IMO work closely together as they already do no problems are expected for a cargo flow allocation adjustment (Krol, 2013). Martinair Cargo Operations From March 2013 Martinair has scheduled 33 flights a week to 28 destinations in North, Central and South America, Africa and the Middle and Far East. Martinair Cargo (2013) has on international reputation of one of the largest transporters of perishables. Mainly: vegetables, fruit and flowers. Martinair Cargo Operations is located in the warehouse of Menzies. Therefore can be easily communicated with Menzies about the tasks to be done. A cargo flow allocation adjustment would impact the processes of Martinair Cargo Operations. Currently all processes are fitted to the cooperation between Martinair and Menzies. Handling KLM flights would impact these daily operations. KLM cargo Worldwide Operations KLM Cargo Worldwide (WW) Operations (Ops) is responsible for all cargo handling over the world (Chapter 3). Besides the hub in Amsterdam, KLM Cargo WW Ops manages a high quality cargo handling in all ‘outstations’. The processes in these outstations are considered out of the scope for this project. Nevertheless the interface between outstations and the hub in Amsterdam is important for the quality of delivery and pick-up at the hub. In Europe these outstations are mostly stations for truck delivery and pick up (Bouhbouh, 2013). Outside Europe all outstations are specialized in handling KLM flights. In Europe, KLM Cargo cooperates with outstations in 21 countries. According to Mouhsine Bouhbouh (2013), Manager Regional Truck Planning Europe of KLM Cargo, these third party outstations handle cargo according to KLM Cargo requirements. Therefore cargo is delivered at the hub in such conditions that the cargo need as little as possible processing time in the hub. This is done by transporting cargo between the hub and these outstations on Unit Load Devices (ULDs). An ULD is a container or pallet in or on which cargo is transported (d'Engelbronner, 2012). The dimension of such a pallet is 3 by 2 meters and cargo send on these pallets is so called ‘palletized’ cargo (Krol, 2013). In the KLM warehouse ‘loose cargo’ is always transported on small wooden pallets. All KLM outstations are able to handle palletized cargo. This is an important interface since the delivery and pick-up of palletized cargo require a different process within the warehouse than ‘loose cargo’. For Martinair flights at Menzies the delivery and pick-up is mostly loose cargo but Menzies is able to handle palletized cargo as well. If Martinair flights are handled at the KLM Cargo warehouse the outstations preferable change their delivery and receiving process into ULD handling.
122
For all destinations of KLM and Martinair Cargo, KLM contracted third parties for handling cargo (Hans Dekker, 2013). According to Hans Dekker (2013), Head of Flow Freight Building 3, does KLM Cargo WW Ops makes sure that these outstations work according to KLM processes. When cargo is send from Amsterdam to these outstations, customers pick up their cargo at the airport or KLM offers a to-door service. For these outstations no impact is expected because these outstation will not experience the difference between ULDs built by Menzies or KLM. Communication about a cargo flow allocation adjustment to the outstations is important to avoid incorrect shipments (Krol, 2013). Thereby transparent processes are required to avoid trucking problems (Bouhbouh, 2013). On forehand, no impact on KPIs is expected for trucking or airport outstations. Nor impact on the KLM Cargo KPIs due to shipments sent from outstations.
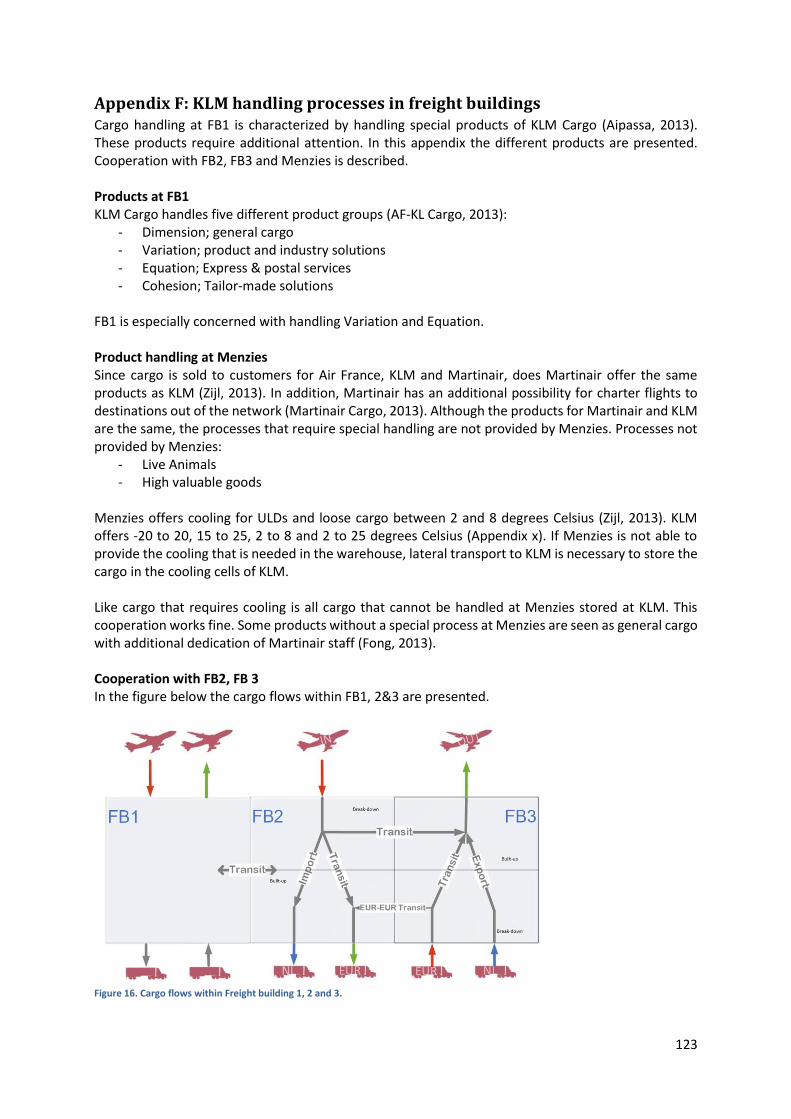
123
Appendix F: KLM handling processes in freight buildings Cargo handling at FB1 is characterized by handling special products of KLM Cargo (Aipassa, 2013). These products require additional attention. In this appendix the different products are presented. Cooperation with FB2, FB3 and Menzies is described. Products at FB1 KLM Cargo handles five different product groups (AF-KL Cargo, 2013):
- Dimension; general cargo - Variation; product and industry solutions - Equation; Express & postal services - Cohesion; Tailor-made solutions
FB1 is especially concerned with handling Variation and Equation. Product handling at Menzies Since cargo is sold to customers for Air France, KLM and Martinair, does Martinair offer the same products as KLM (Zijl, 2013). In addition, Martinair has an additional possibility for charter flights to destinations out of the network (Martinair Cargo, 2013). Although the products for Martinair and KLM are the same, the processes that require special handling are not provided by Menzies. Processes not provided by Menzies:
- Live Animals - High valuable goods
Menzies offers cooling for ULDs and loose cargo between 2 and 8 degrees Celsius (Zijl, 2013). KLM offers -20 to 20, 15 to 25, 2 to 8 and 2 to 25 degrees Celsius (Appendix x). If Menzies is not able to provide the cooling that is needed in the warehouse, lateral transport to KLM is necessary to store the cargo in the cooling cells of KLM. Like cargo that requires cooling is all cargo that cannot be handled at Menzies stored at KLM. This cooperation works fine. Some products without a special process at Menzies are seen as general cargo with additional dedication of Martinair staff (Fong, 2013). Cooperation with FB2, FB 3 In the figure below the cargo flows within FB1, 2&3 are presented.
Figure 16. Cargo flows within Freight building 1, 2 and 3.
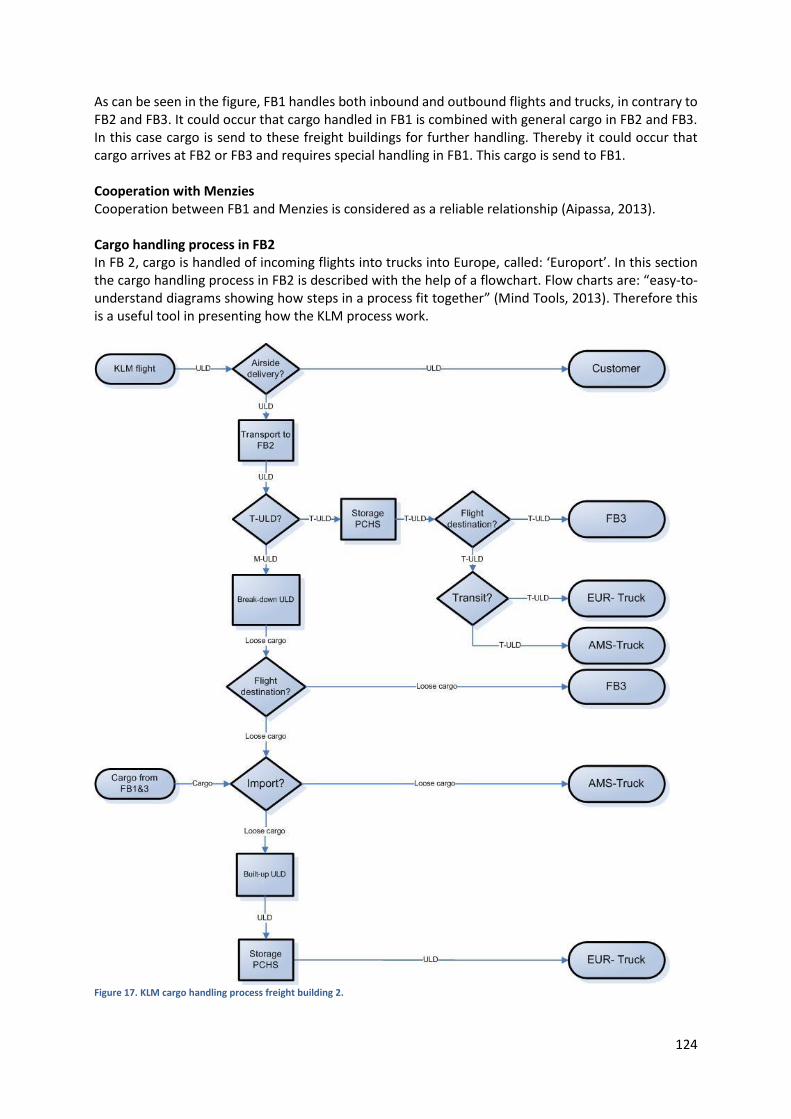
124
As can be seen in the figure, FB1 handles both inbound and outbound flights and trucks, in contrary to FB2 and FB3. It could occur that cargo handled in FB1 is combined with general cargo in FB2 and FB3. In this case cargo is send to these freight buildings for further handling. Thereby it could occur that cargo arrives at FB2 or FB3 and requires special handling in FB1. This cargo is send to FB1. Cooperation with Menzies Cooperation between FB1 and Menzies is considered as a reliable relationship (Aipassa, 2013). Cargo handling process in FB2 In FB 2, cargo is handled of incoming flights into trucks into Europe, called: ‘Europort’. In this section the cargo handling process in FB2 is described with the help of a flowchart. Flow charts are: “easy-to-understand diagrams showing how steps in a process fit together” (Mind Tools, 2013). Therefore this is a useful tool in presenting how the KLM process work.
Figure 17. KLM cargo handling process freight building 2.
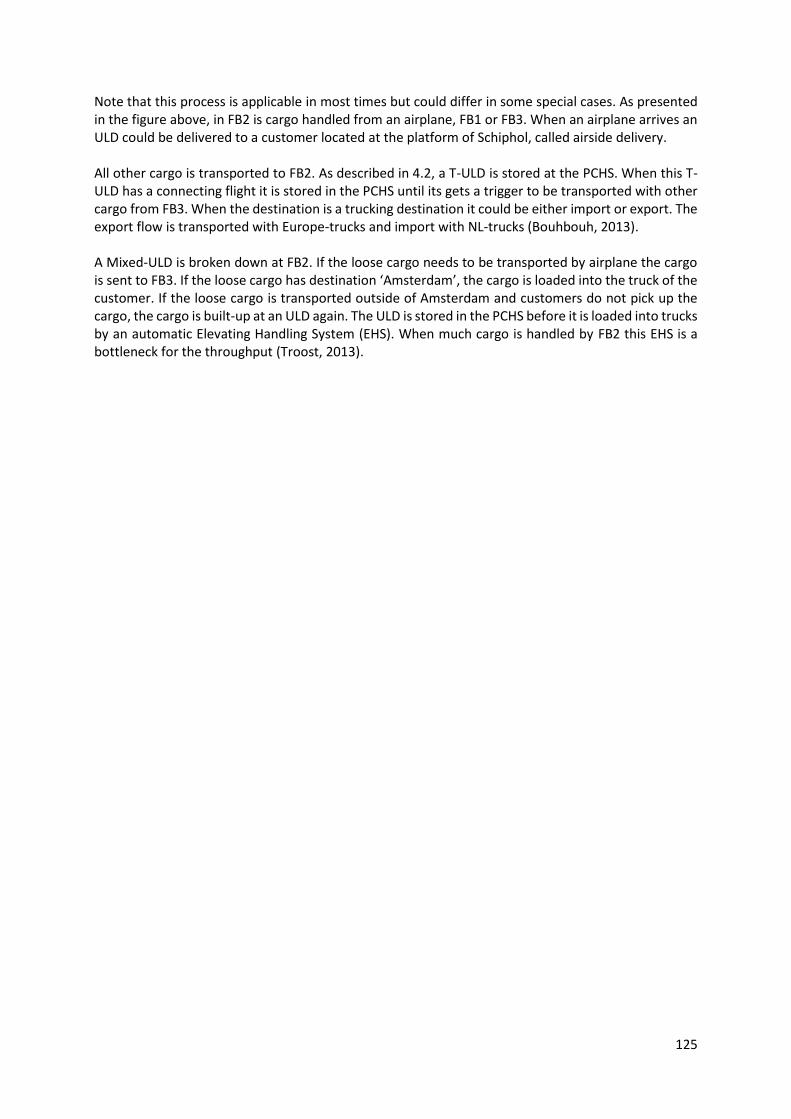
125
Note that this process is applicable in most times but could differ in some special cases. As presented in the figure above, in FB2 is cargo handled from an airplane, FB1 or FB3. When an airplane arrives an ULD could be delivered to a customer located at the platform of Schiphol, called airside delivery. All other cargo is transported to FB2. As described in 4.2, a T-ULD is stored at the PCHS. When this T-ULD has a connecting flight it is stored in the PCHS until its gets a trigger to be transported with other cargo from FB3. When the destination is a trucking destination it could be either import or export. The export flow is transported with Europe-trucks and import with NL-trucks (Bouhbouh, 2013). A Mixed-ULD is broken down at FB2. If the loose cargo needs to be transported by airplane the cargo is sent to FB3. If the loose cargo has destination ‘Amsterdam’, the cargo is loaded into the truck of the customer. If the loose cargo is transported outside of Amsterdam and customers do not pick up the cargo, the cargo is built-up at an ULD again. The ULD is stored in the PCHS before it is loaded into trucks by an automatic Elevating Handling System (EHS). When much cargo is handled by FB2 this EHS is a bottleneck for the throughput (Troost, 2013).
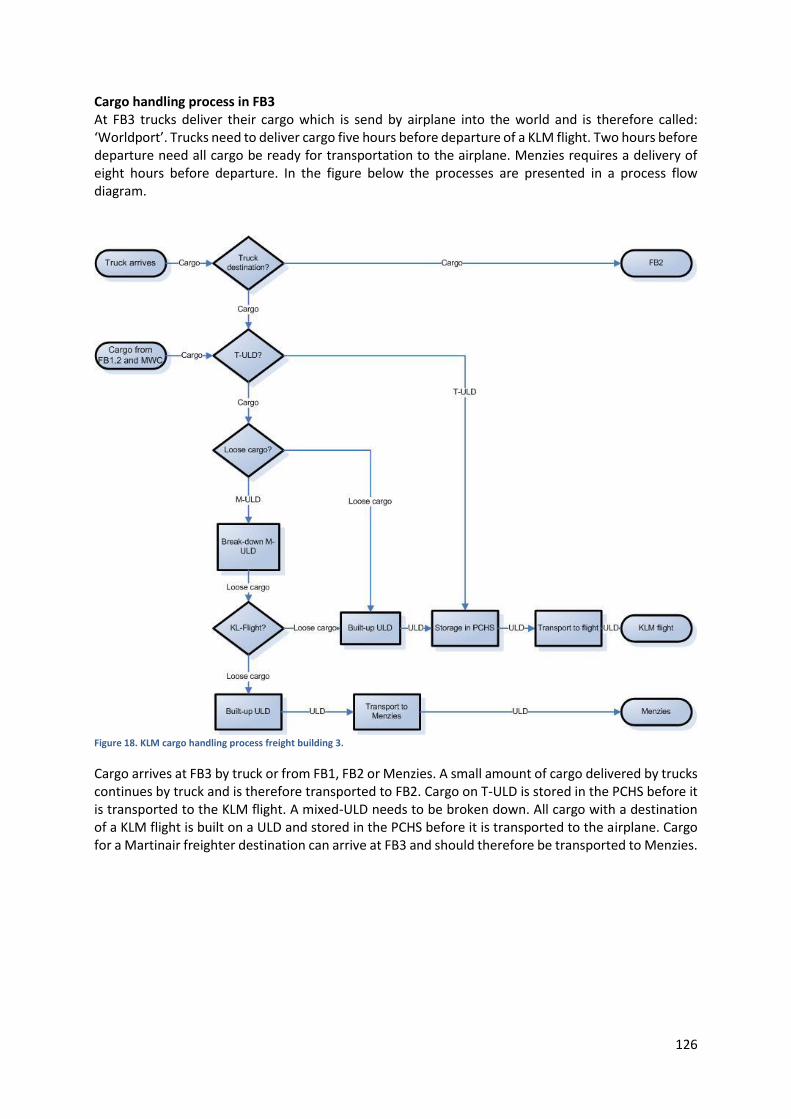
126
Cargo handling process in FB3 At FB3 trucks deliver their cargo which is send by airplane into the world and is therefore called: ‘Worldport’. Trucks need to deliver cargo five hours before departure of a KLM flight. Two hours before departure need all cargo be ready for transportation to the airplane. Menzies requires a delivery of eight hours before departure. In the figure below the processes are presented in a process flow diagram.
Figure 18. KLM cargo handling process freight building 3.
Cargo arrives at FB3 by truck or from FB1, FB2 or Menzies. A small amount of cargo delivered by trucks continues by truck and is therefore transported to FB2. Cargo on T-ULD is stored in the PCHS before it is transported to the KLM flight. A mixed-ULD needs to be broken down. All cargo with a destination of a KLM flight is built on a ULD and stored in the PCHS before it is transported to the airplane. Cargo for a Martinair freighter destination can arrive at FB3 and should therefore be transported to Menzies.
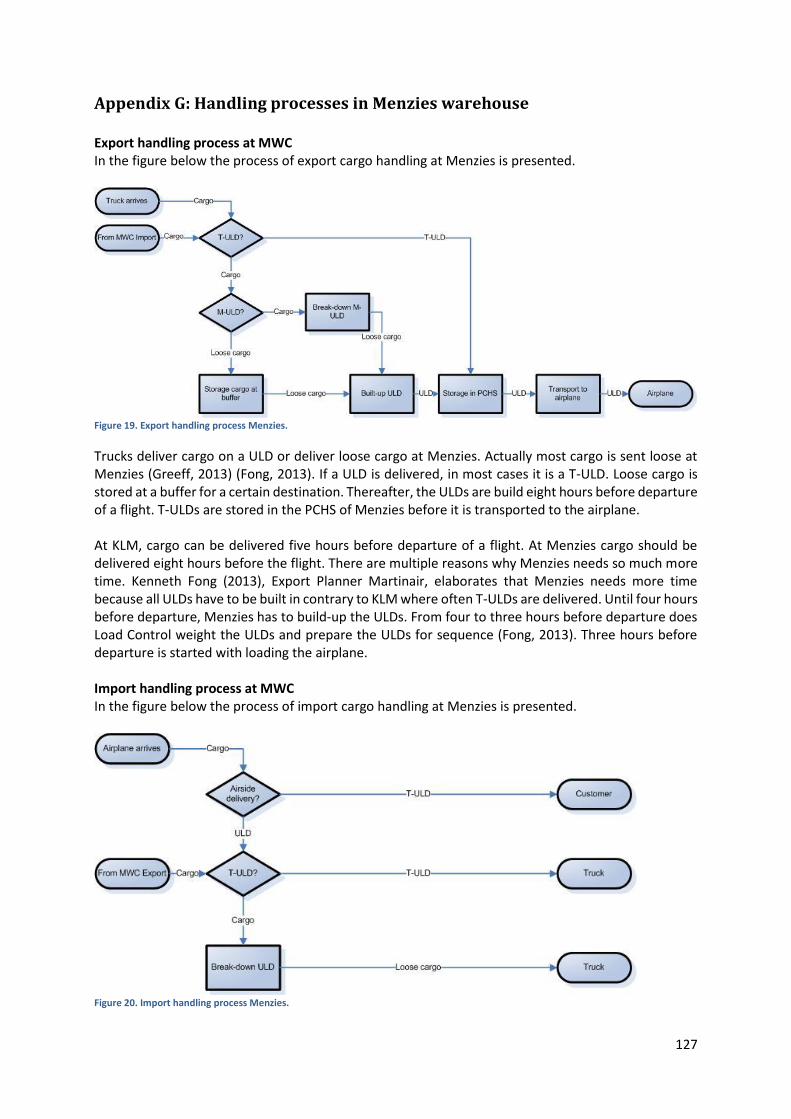
127
Appendix G: Handling processes in Menzies warehouse Export handling process at MWC In the figure below the process of export cargo handling at Menzies is presented.
Figure 19. Export handling process Menzies.
Trucks deliver cargo on a ULD or deliver loose cargo at Menzies. Actually most cargo is sent loose at Menzies (Greeff, 2013) (Fong, 2013). If a ULD is delivered, in most cases it is a T-ULD. Loose cargo is stored at a buffer for a certain destination. Thereafter, the ULDs are build eight hours before departure of a flight. T-ULDs are stored in the PCHS of Menzies before it is transported to the airplane. At KLM, cargo can be delivered five hours before departure of a flight. At Menzies cargo should be delivered eight hours before the flight. There are multiple reasons why Menzies needs so much more time. Kenneth Fong (2013), Export Planner Martinair, elaborates that Menzies needs more time because all ULDs have to be built in contrary to KLM where often T-ULDs are delivered. Until four hours before departure, Menzies has to build-up the ULDs. From four to three hours before departure does Load Control weight the ULDs and prepare the ULDs for sequence (Fong, 2013). Three hours before departure is started with loading the airplane. Import handling process at MWC In the figure below the process of import cargo handling at Menzies is presented.
Figure 20. Import handling process Menzies.
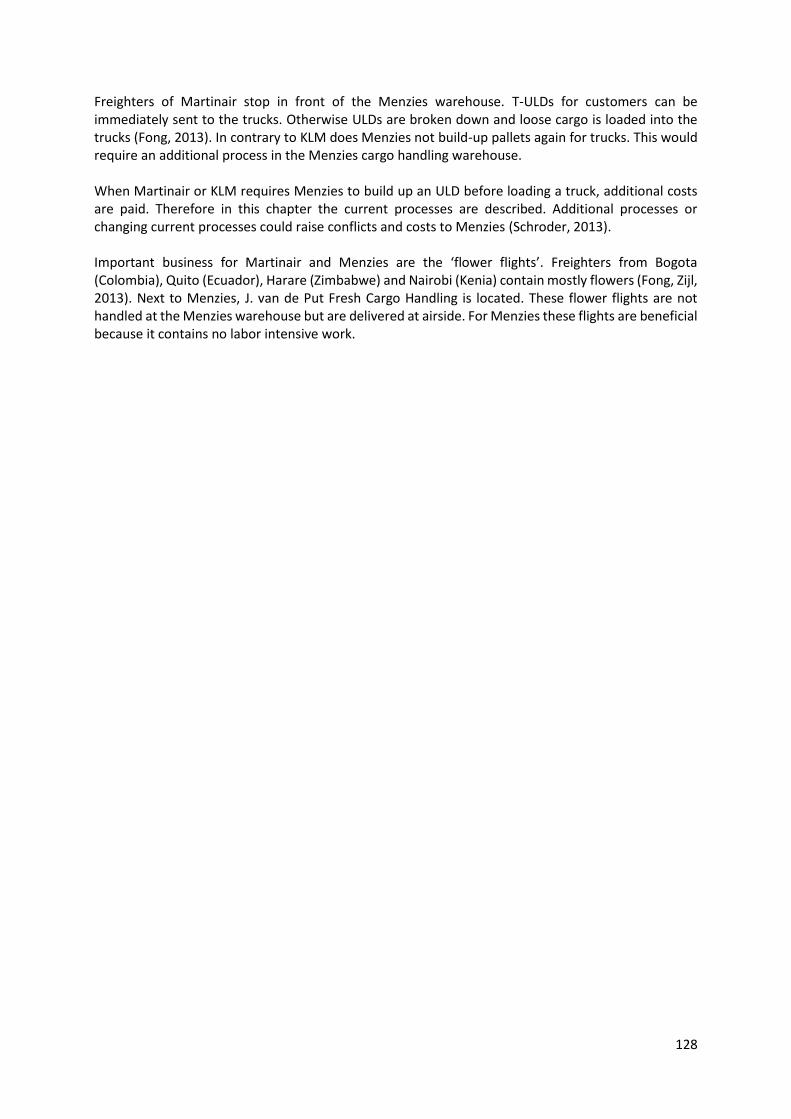
128
Freighters of Martinair stop in front of the Menzies warehouse. T-ULDs for customers can be immediately sent to the trucks. Otherwise ULDs are broken down and loose cargo is loaded into the trucks (Fong, 2013). In contrary to KLM does Menzies not build-up pallets again for trucks. This would require an additional process in the Menzies cargo handling warehouse. When Martinair or KLM requires Menzies to build up an ULD before loading a truck, additional costs are paid. Therefore in this chapter the current processes are described. Additional processes or changing current processes could raise conflicts and costs to Menzies (Schroder, 2013). Important business for Martinair and Menzies are the ‘flower flights’. Freighters from Bogota (Colombia), Quito (Ecuador), Harare (Zimbabwe) and Nairobi (Kenia) contain mostly flowers (Fong, Zijl, 2013). Next to Menzies, J. van de Put Fresh Cargo Handling is located. These flower flights are not handled at the Menzies warehouse but are delivered at airside. For Menzies these flights are beneficial because it contains no labor intensive work.
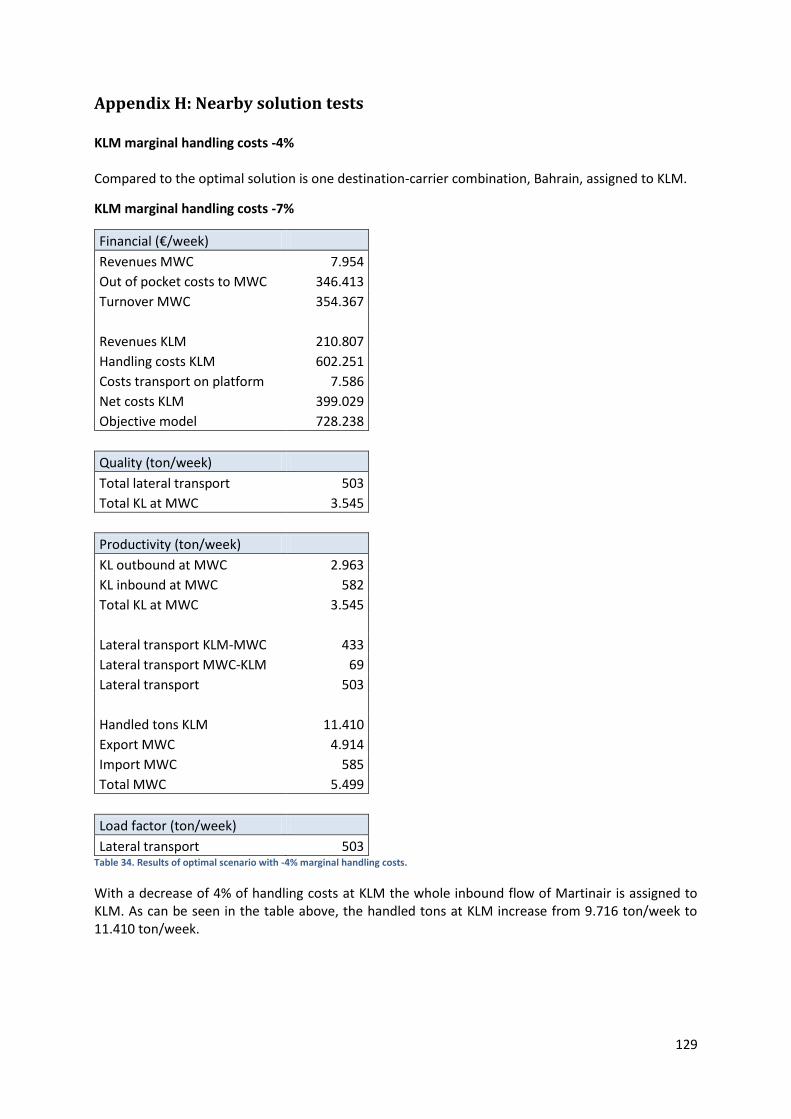
129
Appendix H: Nearby solution tests KLM marginal handling costs -4% Compared to the optimal solution is one destination-carrier combination, Bahrain, assigned to KLM.
KLM marginal handling costs -7%
Financial (€/week)
Revenues MWC 7.954
Out of pocket costs to MWC 346.413
Turnover MWC 354.367
Revenues KLM 210.807
Handling costs KLM 602.251
Costs transport on platform 7.586
Net costs KLM 399.029
Objective model 728.238
Quality (ton/week)
Total lateral transport 503
Total KL at MWC 3.545
Productivity (ton/week)
KL outbound at MWC 2.963
KL inbound at MWC 582
Total KL at MWC 3.545
Lateral transport KLM-MWC 433
Lateral transport MWC-KLM 69
Lateral transport 503
Handled tons KLM 11.410
Export MWC 4.914
Import MWC 585
Total MWC 5.499
Load factor (ton/week)
Lateral transport 503 Table 34. Results of optimal scenario with -4% marginal handling costs.
With a decrease of 4% of handling costs at KLM the whole inbound flow of Martinair is assigned to KLM. As can be seen in the table above, the handled tons at KLM increase from 9.716 ton/week to 11.410 ton/week.
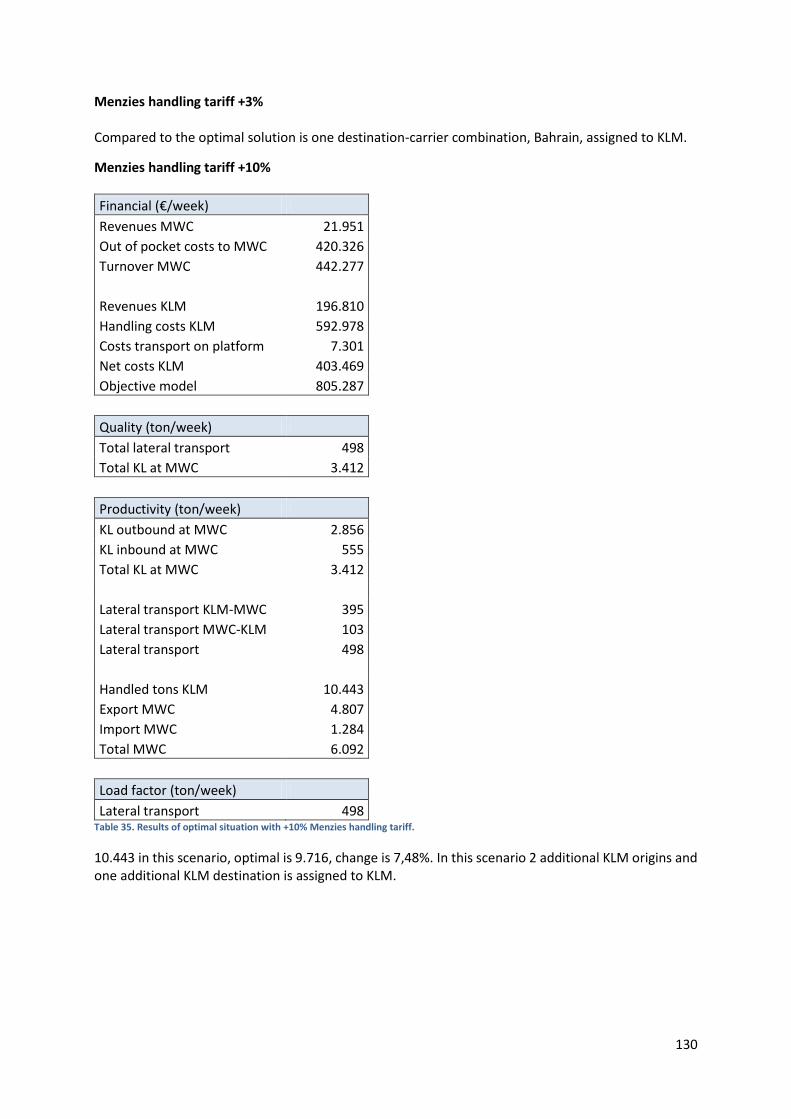
130
Menzies handling tariff +3% Compared to the optimal solution is one destination-carrier combination, Bahrain, assigned to KLM.
Menzies handling tariff +10%
Financial (€/week)
Revenues MWC 21.951
Out of pocket costs to MWC 420.326
Turnover MWC 442.277
Revenues KLM 196.810
Handling costs KLM 592.978
Costs transport on platform 7.301
Net costs KLM 403.469
Objective model 805.287
Quality (ton/week)
Total lateral transport 498
Total KL at MWC 3.412
Productivity (ton/week)
KL outbound at MWC 2.856
KL inbound at MWC 555
Total KL at MWC 3.412
Lateral transport KLM-MWC 395
Lateral transport MWC-KLM 103
Lateral transport 498
Handled tons KLM 10.443
Export MWC 4.807
Import MWC 1.284
Total MWC 6.092
Load factor (ton/week)
Lateral transport 498 Table 35. Results of optimal situation with +10% Menzies handling tariff.
10.443 in this scenario, optimal is 9.716, change is 7,48%. In this scenario 2 additional KLM origins and one additional KLM destination is assigned to KLM.
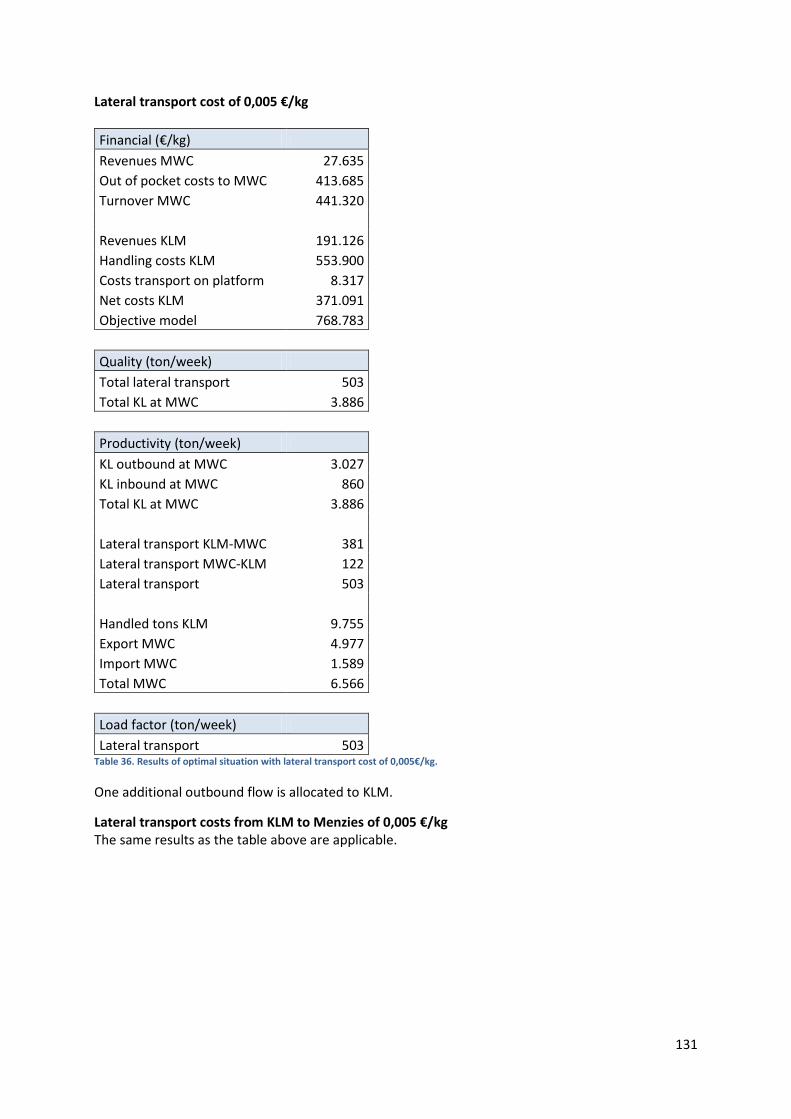
131
Lateral transport cost of 0,005 €/kg
Financial (€/kg)
Revenues MWC 27.635
Out of pocket costs to MWC 413.685
Turnover MWC 441.320
Revenues KLM 191.126
Handling costs KLM 553.900
Costs transport on platform 8.317
Net costs KLM 371.091
Objective model 768.783
Quality (ton/week)
Total lateral transport 503
Total KL at MWC 3.886
Productivity (ton/week)
KL outbound at MWC 3.027
KL inbound at MWC 860
Total KL at MWC 3.886
Lateral transport KLM-MWC 381
Lateral transport MWC-KLM 122
Lateral transport 503
Handled tons KLM 9.755
Export MWC 4.977
Import MWC 1.589
Total MWC 6.566
Load factor (ton/week)
Lateral transport 503 Table 36. Results of optimal situation with lateral transport cost of 0,005€/kg.
One additional outbound flow is allocated to KLM.
Lateral transport costs from KLM to Menzies of 0,005 €/kg The same results as the table above are applicable.
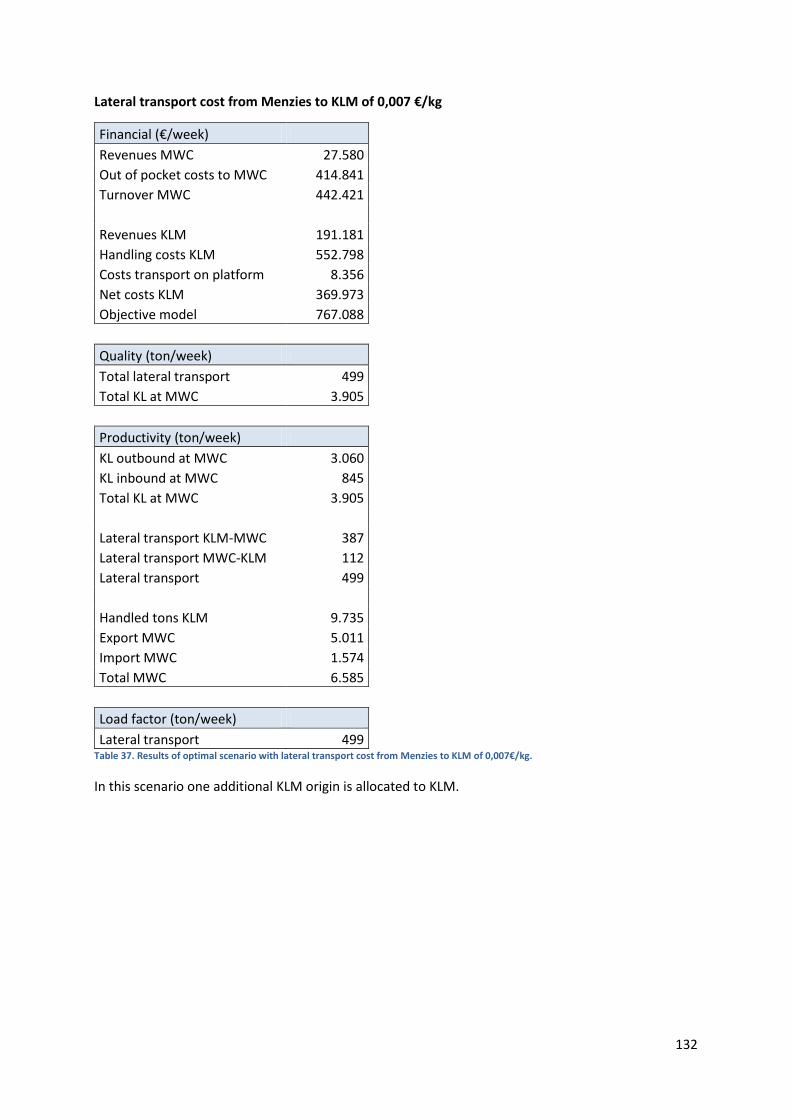
132
Lateral transport cost from Menzies to KLM of 0,007 €/kg
Financial (€/week)
Revenues MWC 27.580
Out of pocket costs to MWC 414.841
Turnover MWC 442.421
Revenues KLM 191.181
Handling costs KLM 552.798
Costs transport on platform 8.356
Net costs KLM 369.973
Objective model 767.088
Quality (ton/week)
Total lateral transport 499
Total KL at MWC 3.905
Productivity (ton/week)
KL outbound at MWC 3.060
KL inbound at MWC 845
Total KL at MWC 3.905
Lateral transport KLM-MWC 387
Lateral transport MWC-KLM 112
Lateral transport 499
Handled tons KLM 9.735
Export MWC 5.011
Import MWC 1.574
Total MWC 6.585
Load factor (ton/week)
Lateral transport 499 Table 37. Results of optimal scenario with lateral transport cost from Menzies to KLM of 0,007€/kg.
In this scenario one additional KLM origin is allocated to KLM.
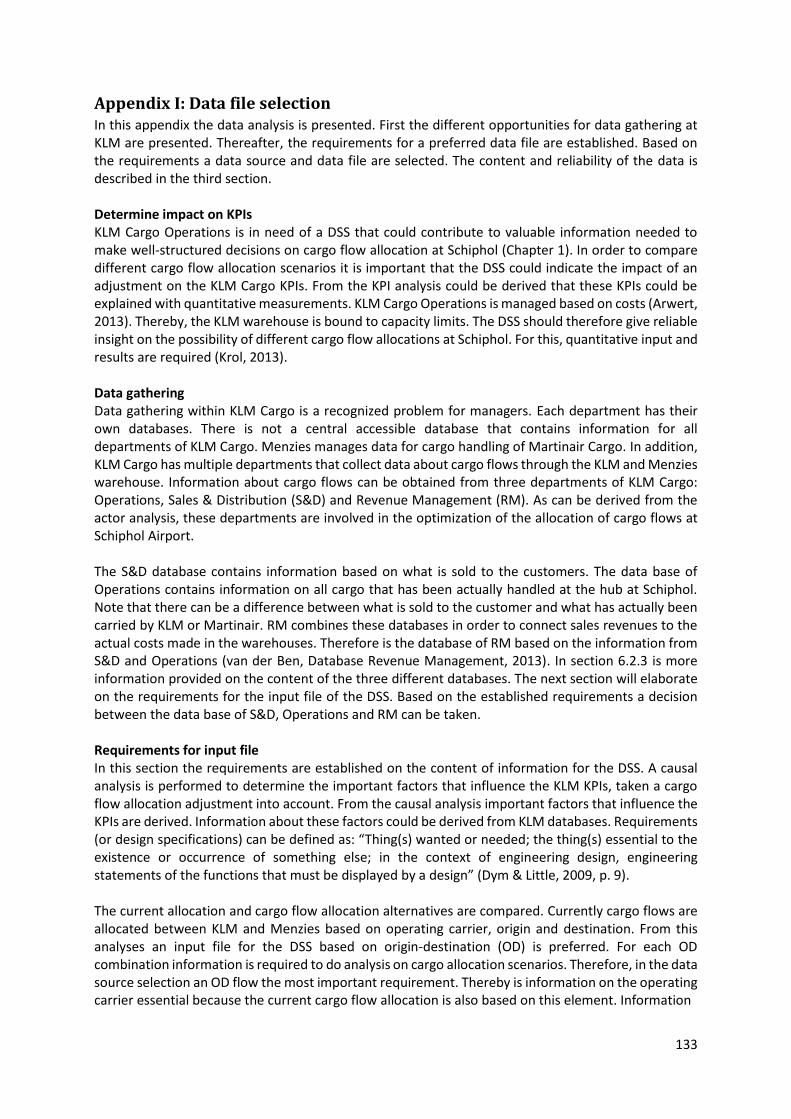
133
Appendix I: Data file selection In this appendix the data analysis is presented. First the different opportunities for data gathering at KLM are presented. Thereafter, the requirements for a preferred data file are established. Based on the requirements a data source and data file are selected. The content and reliability of the data is described in the third section. Determine impact on KPIs KLM Cargo Operations is in need of a DSS that could contribute to valuable information needed to make well-structured decisions on cargo flow allocation at Schiphol (Chapter 1). In order to compare different cargo flow allocation scenarios it is important that the DSS could indicate the impact of an adjustment on the KLM Cargo KPIs. From the KPI analysis could be derived that these KPIs could be explained with quantitative measurements. KLM Cargo Operations is managed based on costs (Arwert, 2013). Thereby, the KLM warehouse is bound to capacity limits. The DSS should therefore give reliable insight on the possibility of different cargo flow allocations at Schiphol. For this, quantitative input and results are required (Krol, 2013). Data gathering Data gathering within KLM Cargo is a recognized problem for managers. Each department has their own databases. There is not a central accessible database that contains information for all departments of KLM Cargo. Menzies manages data for cargo handling of Martinair Cargo. In addition, KLM Cargo has multiple departments that collect data about cargo flows through the KLM and Menzies warehouse. Information about cargo flows can be obtained from three departments of KLM Cargo: Operations, Sales & Distribution (S&D) and Revenue Management (RM). As can be derived from the actor analysis, these departments are involved in the optimization of the allocation of cargo flows at Schiphol Airport. The S&D database contains information based on what is sold to the customers. The data base of Operations contains information on all cargo that has been actually handled at the hub at Schiphol. Note that there can be a difference between what is sold to the customer and what has actually been carried by KLM or Martinair. RM combines these databases in order to connect sales revenues to the actual costs made in the warehouses. Therefore is the database of RM based on the information from S&D and Operations (van der Ben, Database Revenue Management, 2013). In section 6.2.3 is more information provided on the content of the three different databases. The next section will elaborate on the requirements for the input file of the DSS. Based on the established requirements a decision between the data base of S&D, Operations and RM can be taken. Requirements for input file In this section the requirements are established on the content of information for the DSS. A causal analysis is performed to determine the important factors that influence the KLM KPIs, taken a cargo flow allocation adjustment into account. From the causal analysis important factors that influence the KPIs are derived. Information about these factors could be derived from KLM databases. Requirements (or design specifications) can be defined as: “Thing(s) wanted or needed; the thing(s) essential to the existence or occurrence of something else; in the context of engineering design, engineering statements of the functions that must be displayed by a design” (Dym & Little, 2009, p. 9). The current allocation and cargo flow allocation alternatives are compared. Currently cargo flows are allocated between KLM and Menzies based on operating carrier, origin and destination. From this analyses an input file for the DSS based on origin-destination (OD) is preferred. For each OD combination information is required to do analysis on cargo allocation scenarios. Therefore, in the data source selection an OD flow the most important requirement. Thereby is information on the operating carrier essential because the current cargo flow allocation is also based on this element. Information
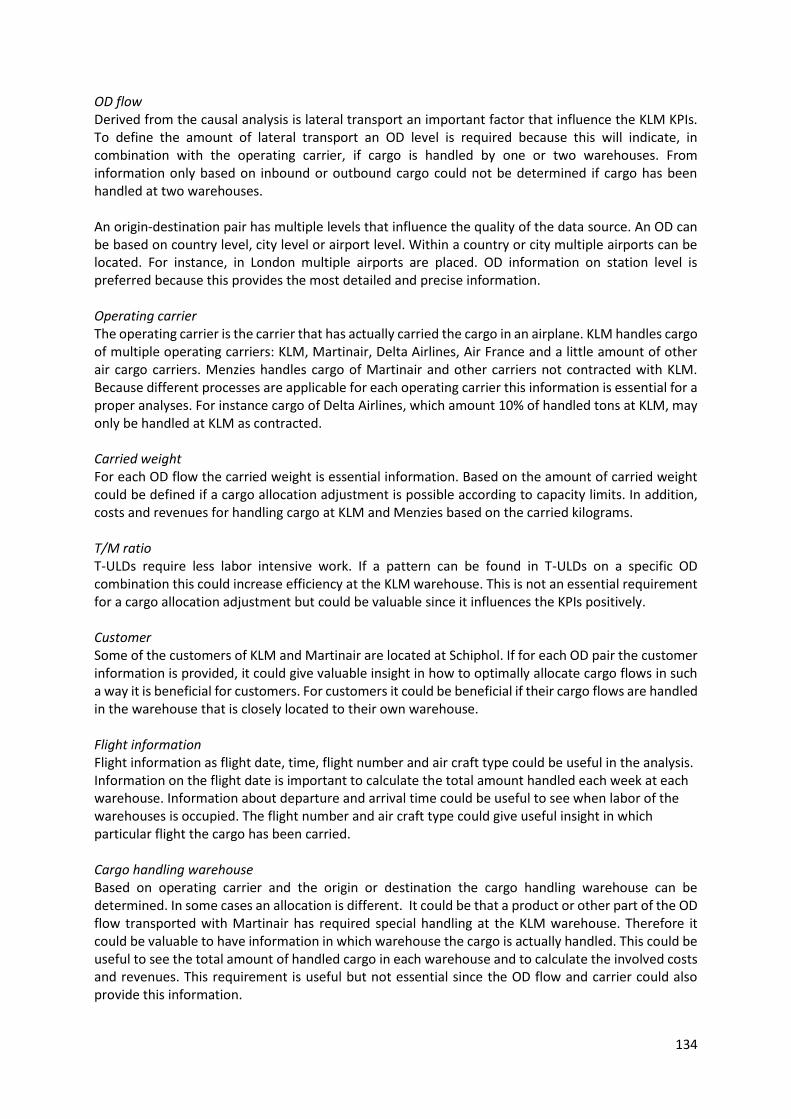
134
OD flow Derived from the causal analysis is lateral transport an important factor that influence the KLM KPIs. To define the amount of lateral transport an OD level is required because this will indicate, in combination with the operating carrier, if cargo is handled by one or two warehouses. From information only based on inbound or outbound cargo could not be determined if cargo has been handled at two warehouses. An origin-destination pair has multiple levels that influence the quality of the data source. An OD can be based on country level, city level or airport level. Within a country or city multiple airports can be located. For instance, in London multiple airports are placed. OD information on station level is preferred because this provides the most detailed and precise information. Operating carrier The operating carrier is the carrier that has actually carried the cargo in an airplane. KLM handles cargo of multiple operating carriers: KLM, Martinair, Delta Airlines, Air France and a little amount of other air cargo carriers. Menzies handles cargo of Martinair and other carriers not contracted with KLM. Because different processes are applicable for each operating carrier this information is essential for a proper analyses. For instance cargo of Delta Airlines, which amount 10% of handled tons at KLM, may only be handled at KLM as contracted. Carried weight For each OD flow the carried weight is essential information. Based on the amount of carried weight could be defined if a cargo allocation adjustment is possible according to capacity limits. In addition, costs and revenues for handling cargo at KLM and Menzies based on the carried kilograms. T/M ratio T-ULDs require less labor intensive work. If a pattern can be found in T-ULDs on a specific OD combination this could increase efficiency at the KLM warehouse. This is not an essential requirement for a cargo allocation adjustment but could be valuable since it influences the KPIs positively. Customer Some of the customers of KLM and Martinair are located at Schiphol. If for each OD pair the customer information is provided, it could give valuable insight in how to optimally allocate cargo flows in such a way it is beneficial for customers. For customers it could be beneficial if their cargo flows are handled in the warehouse that is closely located to their own warehouse. Flight information Flight information as flight date, time, flight number and air craft type could be useful in the analysis. Information on the flight date is important to calculate the total amount handled each week at each warehouse. Information about departure and arrival time could be useful to see when labor of the warehouses is occupied. The flight number and air craft type could give useful insight in which particular flight the cargo has been carried. Cargo handling warehouse Based on operating carrier and the origin or destination the cargo handling warehouse can be determined. In some cases an allocation is different. It could be that a product or other part of the OD flow transported with Martinair has required special handling at the KLM warehouse. Therefore it could be valuable to have information in which warehouse the cargo is actually handled. This could be useful to see the total amount of handled cargo in each warehouse and to calculate the involved costs and revenues. This requirement is useful but not essential since the OD flow and carrier could also provide this information.
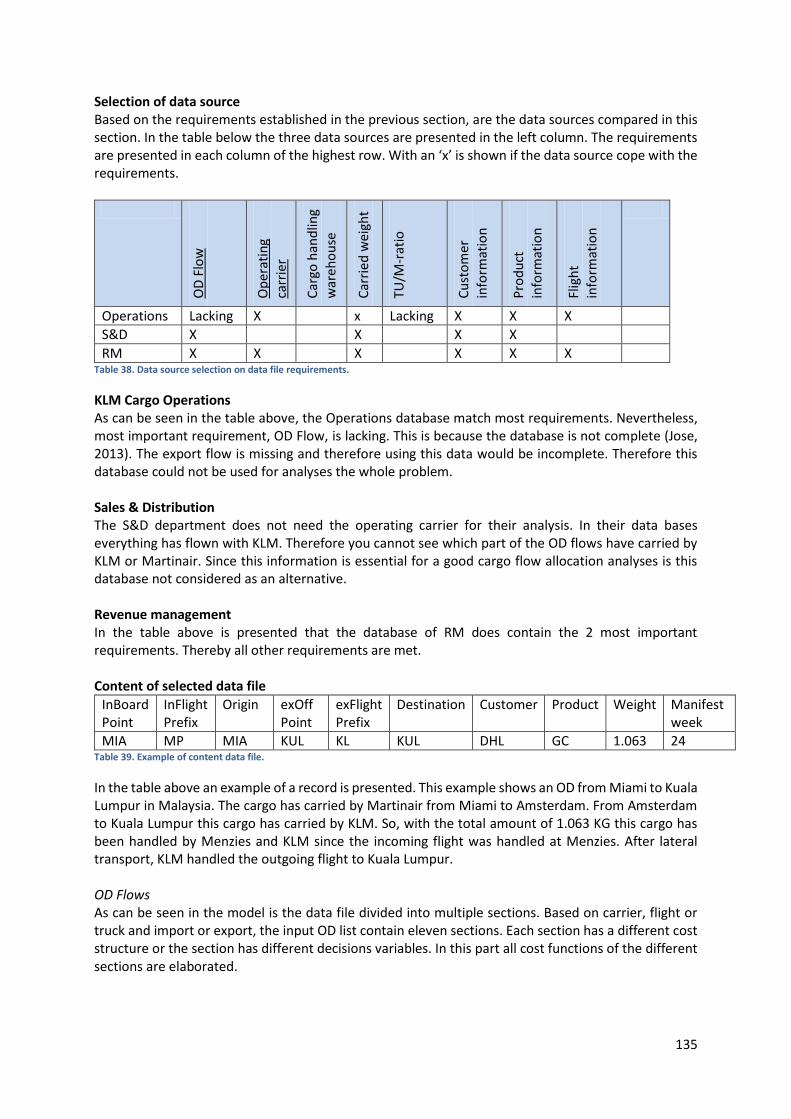
135
Selection of data source Based on the requirements established in the previous section, are the data sources compared in this section. In the table below the three data sources are presented in the left column. The requirements are presented in each column of the highest row. With an ‘x’ is shown if the data source cope with the requirements.
O
D F
low
Op
erat
ing
carr
ier
Car
go h
and
ling
war
eho
use
Car
ried
wei
ght
TU/M
-rat
io
Cu
sto
mer
in
form
atio
n
Pro
du
ct
info
rmat
ion
Flig
ht
info
rmat
ion
Operations Lacking X x Lacking X X X
S&D X X X X
RM X X X X X X Table 38. Data source selection on data file requirements.
KLM Cargo Operations As can be seen in the table above, the Operations database match most requirements. Nevertheless, most important requirement, OD Flow, is lacking. This is because the database is not complete (Jose, 2013). The export flow is missing and therefore using this data would be incomplete. Therefore this database could not be used for analyses the whole problem. Sales & Distribution The S&D department does not need the operating carrier for their analysis. In their data bases everything has flown with KLM. Therefore you cannot see which part of the OD flows have carried by KLM or Martinair. Since this information is essential for a good cargo flow allocation analyses is this database not considered as an alternative. Revenue management In the table above is presented that the database of RM does contain the 2 most important requirements. Thereby all other requirements are met. Content of selected data file
InBoard Point
InFlight Prefix
Origin exOff Point
exFlight Prefix
Destination Customer Product Weight Manifest week
MIA MP MIA KUL KL KUL DHL GC 1.063 24 Table 39. Example of content data file.
In the table above an example of a record is presented. This example shows an OD from Miami to Kuala Lumpur in Malaysia. The cargo has carried by Martinair from Miami to Amsterdam. From Amsterdam to Kuala Lumpur this cargo has carried by KLM. So, with the total amount of 1.063 KG this cargo has been handled by Menzies and KLM since the incoming flight was handled at Menzies. After lateral transport, KLM handled the outgoing flight to Kuala Lumpur. OD Flows As can be seen in the model is the data file divided into multiple sections. Based on carrier, flight or truck and import or export, the input OD list contain eleven sections. Each section has a different cost structure or the section has different decisions variables. In this part all cost functions of the different sections are elaborated.
136
Carrier At the hub at Amsterdam Schiphol three carriers are handled by two cargo handling warehouses. Delta Airlines, KLM Cargo and Martinair Cargo make use of the cargo handling services of KLM Cargo and Menzies. KLM and Delta Airlines have a partnership in handling cargo and passengers according to Jos Bakker (2013), quality assurance manager of KLM Cargo. Cargo of Delta Airlines should always be handled at KLM Cargo because of…
Origins and Destinations of Delta Airlines are all destinations in the United States of America and Canada. In addition, KLM handles one flight to and from India, Bombay, for Delta Airlines. Because of the partnership, KLM could also make use of the available capacity in all Origins and Destinations of Delta Airlines. This is very positive for the total network of KLM Cargo. On the other hand, Delta Airlines could make use of the network of KLM Cargo. This results in higher load factors of both companies.
Flight or truck Each origin and destination is a trucking or flight destination. Outside Europe all destinations are flight destinations. Within Europe a few stations exist were KLM does fly and truck. For these stations the decision is made to define it as a trucking stations since all heavy cargo in Europe is transported by truck. In Europe KLM operates only small airplanes and therefore only little capacity for cargo is available.
With customers of KLM and Martinair is agreed that they should deliver or pick-up their cargo at the warehouse where the airplane departs or arrives. This is on forehand communicated. This implies that customers sometimes need to deliver or pick up their cargo from both warehouses. In the model an OD flow with flight origin-truck destination and flight destination-truck origin only have two decision variables.
Since Delta Airlines could only be handled at KLM Cargo does cargo from a Delta Origin always continues on a truck at KLM Cargo and cargo for a Delta destination from a trucking origin need to departure at KLM. Therefore these OD flows only have one decision variable. For the output of the model it is good to take this into account.
Netherlands and Europe trucks The distinction between Netherlands and Europe trucks is important for two reasons. For import flows additional important charges are invoiced by Menzies or KLM to the cargo forwarder? These charges are not paid by the customer. Import flows have a destination in the Netherlands. So based on the fact that a destination is in the Netherlands the import flow can be defined.
The second reason is that cargo handling for Europe trucks is considered more labor intensive work. Cargo in Netherlands trucks are often delivered or picked up loose and Europe trucks on ULDs. Building up and breaking down the ULDs is one additional process and therefore a customer pays twice the cargo handling tariff at KLM.
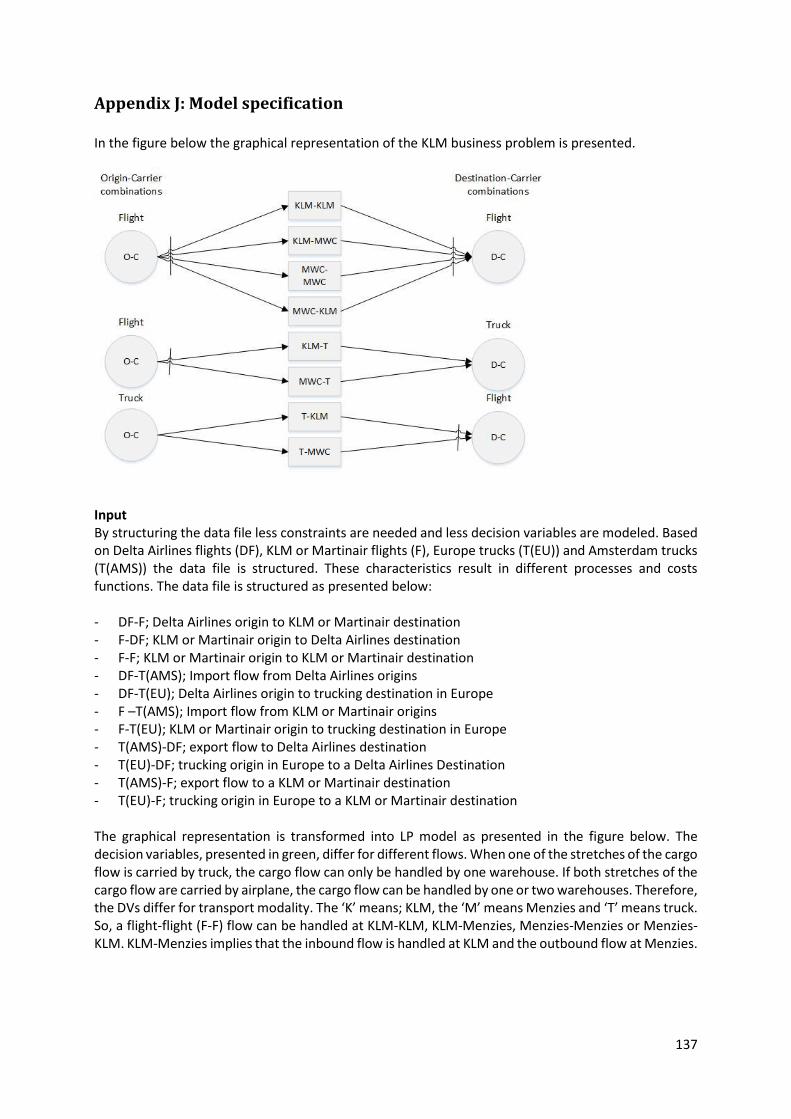
137
Appendix J: Model specification In the figure below the graphical representation of the KLM business problem is presented.
Input By structuring the data file less constraints are needed and less decision variables are modeled. Based on Delta Airlines flights (DF), KLM or Martinair flights (F), Europe trucks (T(EU)) and Amsterdam trucks (T(AMS)) the data file is structured. These characteristics result in different processes and costs functions. The data file is structured as presented below: - DF-F; Delta Airlines origin to KLM or Martinair destination - F-DF; KLM or Martinair origin to Delta Airlines destination - F-F; KLM or Martinair origin to KLM or Martinair destination - DF-T(AMS); Import flow from Delta Airlines origins - DF-T(EU); Delta Airlines origin to trucking destination in Europe - F –T(AMS); Import flow from KLM or Martinair origins - F-T(EU); KLM or Martinair origin to trucking destination in Europe - T(AMS)-DF; export flow to Delta Airlines destination - T(EU)-DF; trucking origin in Europe to a Delta Airlines Destination - T(AMS)-F; export flow to a KLM or Martinair destination - T(EU)-F; trucking origin in Europe to a KLM or Martinair destination The graphical representation is transformed into LP model as presented in the figure below. The decision variables, presented in green, differ for different flows. When one of the stretches of the cargo flow is carried by truck, the cargo flow can only be handled by one warehouse. If both stretches of the cargo flow are carried by airplane, the cargo flow can be handled by one or two warehouses. Therefore, the DVs differ for transport modality. The ‘K’ means; KLM, the ‘M’ means Menzies and ‘T’ means truck. So, a flight-flight (F-F) flow can be handled at KLM-KLM, KLM-Menzies, Menzies-Menzies or Menzies-KLM. KLM-Menzies implies that the inbound flow is handled at KLM and the outbound flow at Menzies.
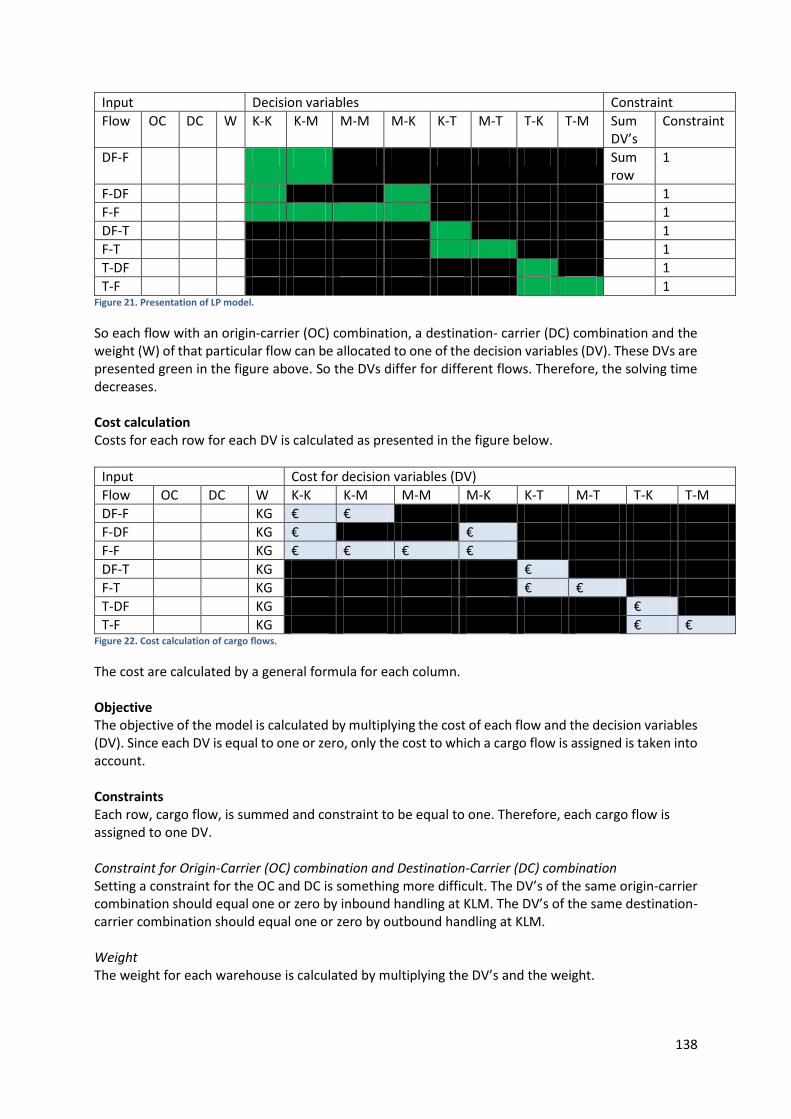
138
Input Decision variables Constraint
Flow OC DC W K-K K-M M-M M-K K-T M-T T-K T-M Sum DV’s
Constraint
DF-F Sum row
1
F-DF 1
F-F 1
DF-T 1
F-T 1
T-DF 1
T-F 1 Figure 21. Presentation of LP model.
So each flow with an origin-carrier (OC) combination, a destination- carrier (DC) combination and the weight (W) of that particular flow can be allocated to one of the decision variables (DV). These DVs are presented green in the figure above. So the DVs differ for different flows. Therefore, the solving time decreases. Cost calculation Costs for each row for each DV is calculated as presented in the figure below.
Input Cost for decision variables (DV)
Flow OC DC W K-K K-M M-M M-K K-T M-T T-K T-M
DF-F KG € €
F-DF KG € €
F-F KG € € € €
DF-T KG €
F-T KG € €
T-DF KG €
T-F KG € € Figure 22. Cost calculation of cargo flows.
The cost are calculated by a general formula for each column. Objective The objective of the model is calculated by multiplying the cost of each flow and the decision variables (DV). Since each DV is equal to one or zero, only the cost to which a cargo flow is assigned is taken into account. Constraints Each row, cargo flow, is summed and constraint to be equal to one. Therefore, each cargo flow is assigned to one DV. Constraint for Origin-Carrier (OC) combination and Destination-Carrier (DC) combination Setting a constraint for the OC and DC is something more difficult. The DV’s of the same origin-carrier combination should equal one or zero by inbound handling at KLM. The DV’s of the same destination-carrier combination should equal one or zero by outbound handling at KLM. Weight The weight for each warehouse is calculated by multiplying the DV’s and the weight.
139
Appendix K: Data validation To analyze the errors more in depth a new query is established with only shipments that contain errors. This query can be found in appendix M. In this section the errors of this query are elaborated. Blanks The data file derived from the RM database contains blank cells. These cells could be blank due to; system failure, employee failure or a conscious action. This blank cell is consciously blank if the customer delivers or picks up the cargo from the warehouse. A system failure could occur in many ways and is hard to describe when and why this happens (Ben, 2013). A blank cell could also be the result of an employee who did not fill the systems correctly or did not fill in the cell because of multiple reasons. Due to system failure and employee failure, wrong information could be included in the data file. When customers pick up or deliver cargo at a warehouse in Amsterdam, the inBoardPoint or exOffPoint, prefix, flight number and aircraft type are blank. This is because this transport is not managed by KLM and therefore this information is not included in the systems. The origin or destination, Amsterdam, is given so you know that these flows are started or ended at Schiphol. These blank inBoardPoint and exOffPoint can be filled with Amsterdam. From the data analysis can be derived that 3,4% of the data are blank cells that are probably a cause of system failure or employee failure. In agreement with Adri van der Ben is the assumption taken to equal the origin to the inBoardPoint or exOffPoint.
Inboard station Origin Sum of weight % of total data
Blank Not AMS 9.488.610 3,11%
Offpoint station Destination Sum of weight % of total data
Blank Not AMS 1.033.810 0,34%
Data adjustments:
- InboardPoint = blank = origin - exOffPoint = blank = destination - InPrefix= blank = exprefix
According to experts, Adri van der Ben and Bart Krol these adjustments are valid. Part shipment on one operating carrier A shipment contains all cargo from one customer from an origin to a destination (literature review). A part shipment occurs when a shipment is sent on two different flights. An example would be, a shipment on two KLM flights from Shanghai to Amsterdam. In the data file this shipment on this OD is stored under one record. In the data file you only find one record from Shanghai to Amsterdam with the total amount of weight for the shipment on one flight (Ben, 2013). So it looks like on a specific date cargo is missing and on another date cargo is extensive. The total amount of carried weight by KLM from Shanghai to Amsterdam remain the same. So in this case, this error of a part shipment on one operating carrier does not influence the total carried weight of an operating carrier on an OD level. Of all carried weight is 4,7% part shipped on one operating carrier (Appendix x). Because this part shipments remain at the same operating carrier and same OD this will not influence the total carried weight of a carrier or influence the total weight carried on one OD.
140
Part shipment on two operating carriers It could also occur that a shipment is sent on two flights of two different operating carriers. For instance, cargo from a customer is transported partly on the KLM flight from Hong Kong, and partly with the freighter of Martinair, to Amsterdam. Also in this case, the data file shows one record of both flights from Hong Kong to Amsterdam. The total amount of weight of the shipment is assigned to one carrier in an alphabetical way. This is because this decision must be defined in the query of RM (Ben, 2013). If a shipment is part shipped on KLM and Martinair, the data file will only show one record of Martinair since the letter ‘M’ is higher in the alphabet than the letter ‘K’. This will affect the results because the data file contains less carried weight of KLM flights and more of Martinair. In appendix x is presented that part shipments between two operating carriers only occur between KLM and Martinair. With other operating carriers, Air France and Delta Airlines, is not part shipped. From all shipments is 0,38% part shipped between KLM and Martinair (Appendix x). This causes that 0,38% of the weight carried by KLM and Martinair are assigned to Martinair. So this is a bias towards Martinair. From the data file cannot be derived how much of the 0,38% of cargo has actually has been carried by KLM. Assumed in this research is that about 0,19% of the cargo carried by KLM is shown in the data file as cargo flown with Martinair. Double counting for Martinair flights Martinair uses two different flight numbers: commercial rotation flight numbers and operational flight numbers. This is because Martinair stops at multiple destinations during one flight. It occurs that both operational and rotation flight numbers are shown in the data file due to a system failure. An explanation for this system failure is not easy. Van der Ben (2013) expects that it could go wrong when stations are using Air France cargo handling systems. A consequence of this problem is that the data file contains the double amount of carried weight for some OD pairs carried by Martinair. This has an impact on the result. For 0,44% is Martinair cargo double counted. This occurs only on incoming Martinair flights. This causes that Martinair data should be 0,22% higher than the reality. Conclusion Important conclusions about the reliability of the data can be derived from this section. Analyzing the data from week 23 to 33 gave insight in the errors of the data file of RM. The blanks causes by system failure or employee failure result in a 3,4% uncertainty. Part shipments on one operating carrier does not have an impact for analysis. Part shipments on two operating carriers result that 0,38% of all carried weight carried by KLM and Martinair is assigned to Martinair. Therefore a maximum of 0,38% of the total carried cargo is missing at KLM and is added to Martinair flows. Thereby do system failures resulted in an extensive weight to Martinair of 0,22%. Blanks In appendix can be found that 3,4% of the data are blank cells that are probably a cause of system
failure or employee failure. These cells do not have an origin or destination in the Netherlands. In
agreement with Ben is the assumption made to equal the origin to the inBoardPoint or exOffPoint.
Part shipment on one operating carrier Of all carried weight is 4,7% part shipped on one operating carrier (Appendix x). Because this part shipments remain at the same operating carrier and same OD this will not influence the total carried weight of a carrier or influence the total weight carried on one OD. Part shipment on two operating carriers In appendix x is presented that part shipments between two operating carriers only occur between KLM and Martinair. With other operating carriers, Air France and Delta Airlines, is not part shipped.
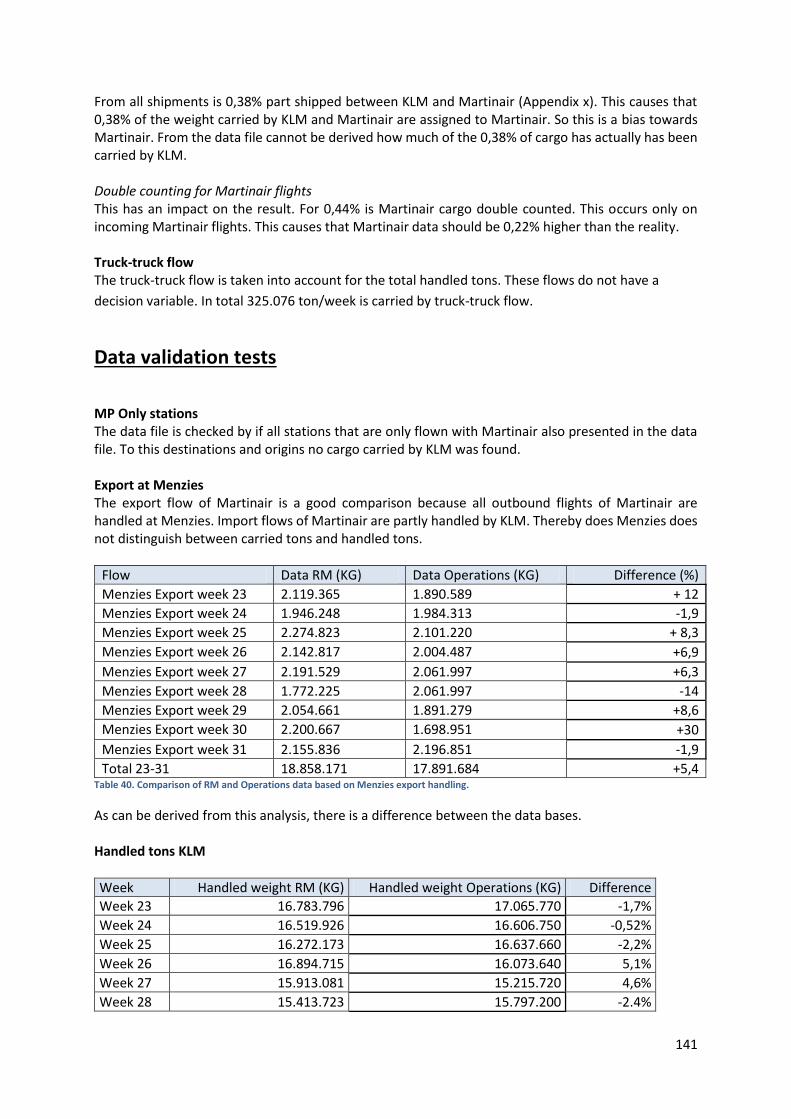
141
From all shipments is 0,38% part shipped between KLM and Martinair (Appendix x). This causes that 0,38% of the weight carried by KLM and Martinair are assigned to Martinair. So this is a bias towards Martinair. From the data file cannot be derived how much of the 0,38% of cargo has actually has been carried by KLM. Double counting for Martinair flights This has an impact on the result. For 0,44% is Martinair cargo double counted. This occurs only on incoming Martinair flights. This causes that Martinair data should be 0,22% higher than the reality. Truck-truck flow The truck-truck flow is taken into account for the total handled tons. These flows do not have a
decision variable. In total 325.076 ton/week is carried by truck-truck flow.
Data validation tests
MP Only stations The data file is checked by if all stations that are only flown with Martinair also presented in the data file. To this destinations and origins no cargo carried by KLM was found. Export at Menzies The export flow of Martinair is a good comparison because all outbound flights of Martinair are handled at Menzies. Import flows of Martinair are partly handled by KLM. Thereby does Menzies does not distinguish between carried tons and handled tons.
Flow Data RM (KG) Data Operations (KG) Difference (%)
Menzies Export week 23 2.119.365 1.890.589 + 12
Menzies Export week 24 1.946.248 1.984.313 -1,9
Menzies Export week 25 2.274.823 2.101.220 + 8,3
Menzies Export week 26 2.142.817 2.004.487 +6,9
Menzies Export week 27 2.191.529 2.061.997 +6,3
Menzies Export week 28 1.772.225 2.061.997 -14
Menzies Export week 29 2.054.661 1.891.279 +8,6
Menzies Export week 30 2.200.667 1.698.951 +30
Menzies Export week 31 2.155.836 2.196.851 -1,9
Total 23-31 18.858.171 17.891.684 +5,4 Table 40. Comparison of RM and Operations data based on Menzies export handling.
As can be derived from this analysis, there is a difference between the data bases. Handled tons KLM
Week Handled weight RM (KG) Handled weight Operations (KG) Difference
Week 23 16.783.796 17.065.770 -1,7%
Week 24 16.519.926 16.606.750 -0,52%
Week 25 16.272.173 16.637.660 -2,2%
Week 26 16.894.715 16.073.640 5,1%
Week 27 15.913.081 15.215.720 4,6%
Week 28 15.413.723 15.797.200 -2.4%
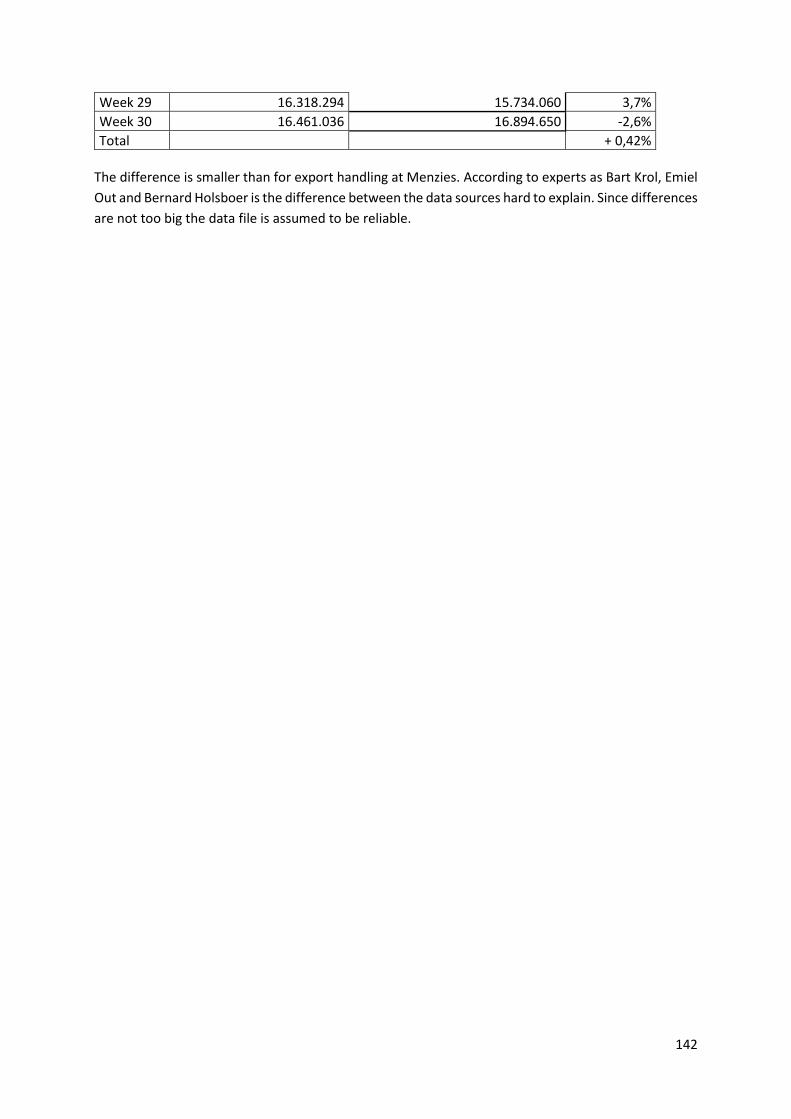
142
Week 29 16.318.294 15.734.060 3,7%
Week 30 16.461.036 16.894.650 -2,6%
Total + 0,42%
The difference is smaller than for export handling at Menzies. According to experts as Bart Krol, Emiel
Out and Bernard Holsboer is the difference between the data sources hard to explain. Since differences
are not too big the data file is assumed to be reliable.
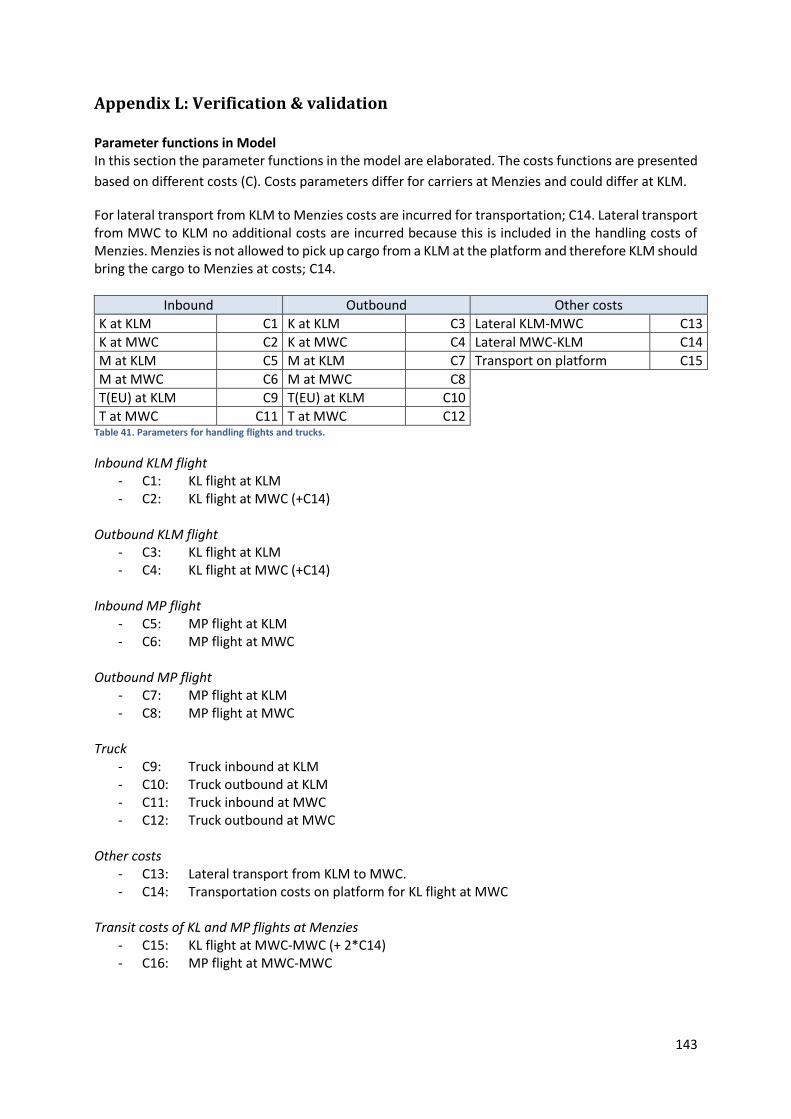
143
Appendix L: Verification & validation Parameter functions in Model In this section the parameter functions in the model are elaborated. The costs functions are presented
based on different costs (C). Costs parameters differ for carriers at Menzies and could differ at KLM.
For lateral transport from KLM to Menzies costs are incurred for transportation; C14. Lateral transport from MWC to KLM no additional costs are incurred because this is included in the handling costs of Menzies. Menzies is not allowed to pick up cargo from a KLM at the platform and therefore KLM should bring the cargo to Menzies at costs; C14.
Inbound Outbound Other costs
K at KLM C1 K at KLM C3 Lateral KLM-MWC C13
K at MWC C2 K at MWC C4 Lateral MWC-KLM C14
M at KLM C5 M at KLM C7 Transport on platform C15
M at MWC C6 M at MWC C8
T(EU) at KLM C9 T(EU) at KLM C10
T at MWC C11 T at MWC C12 Table 41. Parameters for handling flights and trucks.
Inbound KLM flight - C1: KL flight at KLM - C2: KL flight at MWC (+C14)
Outbound KLM flight
- C3: KL flight at KLM - C4: KL flight at MWC (+C14)
Inbound MP flight
- C5: MP flight at KLM - C6: MP flight at MWC
Outbound MP flight
- C7: MP flight at KLM - C8: MP flight at MWC
Truck
- C9: Truck inbound at KLM - C10: Truck outbound at KLM - C11: Truck inbound at MWC - C12: Truck outbound at MWC
Other costs
- C13: Lateral transport from KLM to MWC. - C14: Transportation costs on platform for KL flight at MWC
Transit costs of KL and MP flights at Menzies
- C15: KL flight at MWC-MWC (+ 2*C14) - C16: MP flight at MWC-MWC
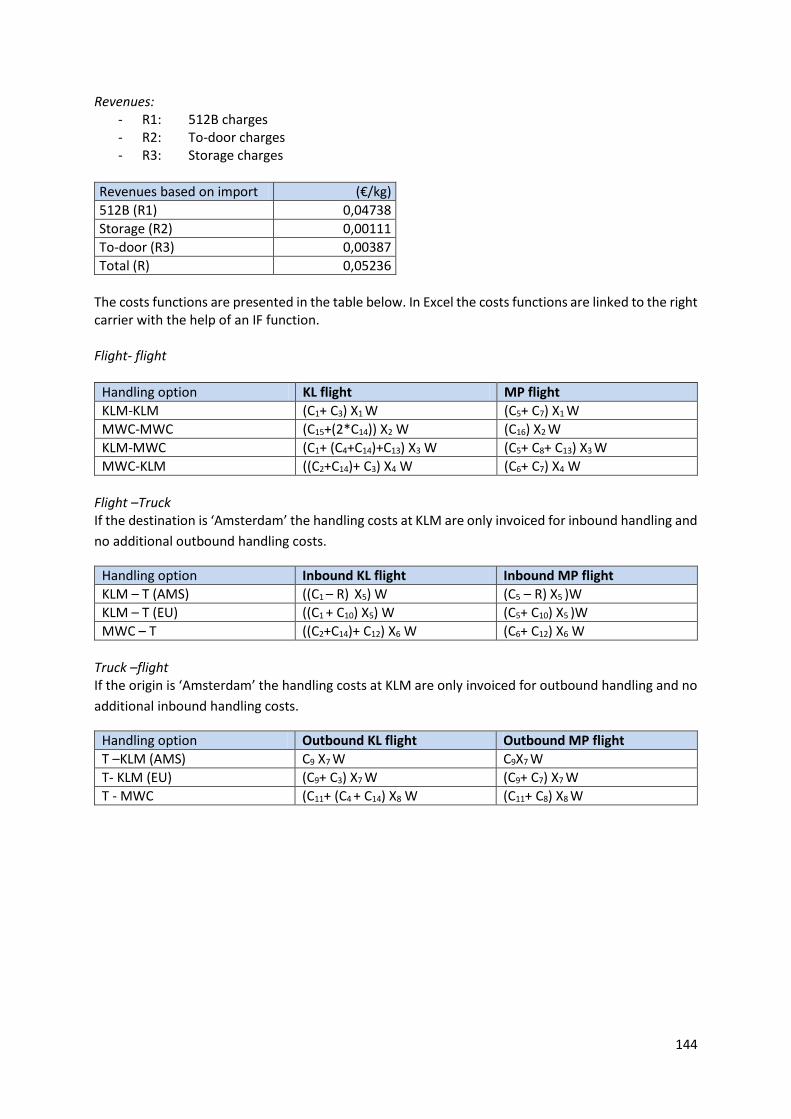
144
Revenues: - R1: 512B charges - R2: To-door charges - R3: Storage charges
Revenues based on import (€/kg)
512B (R1) 0,04738
Storage (R2) 0,00111
To-door (R3) 0,00387
Total (R) 0,05236
The costs functions are presented in the table below. In Excel the costs functions are linked to the right carrier with the help of an IF function. Flight- flight
Handling option KL flight MP flight
KLM-KLM (C1+ C3) X1 W (C5+ C7) X1 W
MWC-MWC (C15+(2*C14)) X2 W (C16) X2 W
KLM-MWC (C1+ (C4+C14)+C13) X3 W (C5+ C8+ C13) X3 W
MWC-KLM ((C2+C14)+ C3) X4 W (C6+ C7) X4 W
Flight –Truck If the destination is ‘Amsterdam’ the handling costs at KLM are only invoiced for inbound handling and
no additional outbound handling costs.
Handling option Inbound KL flight Inbound MP flight
KLM – T (AMS) ((C1 – R) X5) W (C5 – R) X5 )W
KLM – T (EU) ((C1 + C10) X5) W (C5+ C10) X5 )W
MWC – T ((C2+C14)+ C12) X6 W (C6+ C12) X6 W
Truck –flight If the origin is ‘Amsterdam’ the handling costs at KLM are only invoiced for outbound handling and no
additional inbound handling costs.
Handling option Outbound KL flight Outbound MP flight
T –KLM (AMS) C9 X7 W C9X7 W
T- KLM (EU) (C9+ C3) X7 W (C9+ C7) X7 W
T - MWC (C11+ (C4 + C14) X8 W (C11+ C8) X8 W
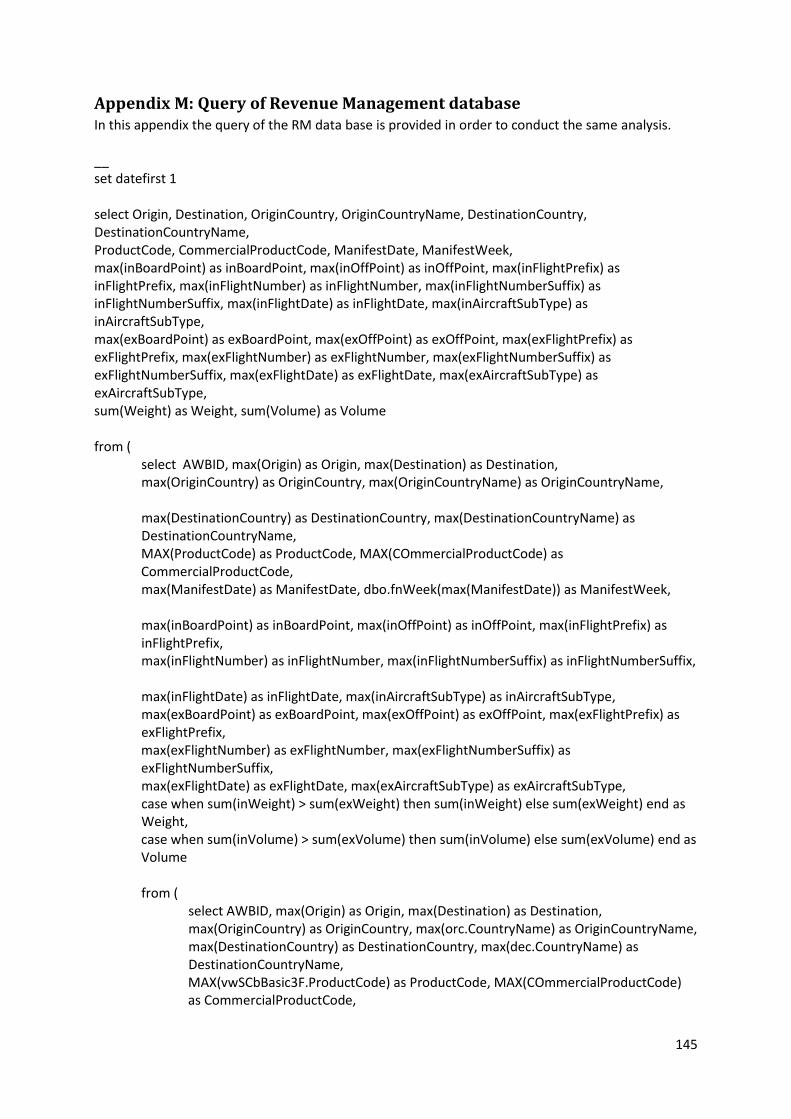
145
Appendix M: Query of Revenue Management database In this appendix the query of the RM data base is provided in order to conduct the same analysis. __ set datefirst 1 select Origin, Destination, OriginCountry, OriginCountryName, DestinationCountry, DestinationCountryName, ProductCode, CommercialProductCode, ManifestDate, ManifestWeek, max(inBoardPoint) as inBoardPoint, max(inOffPoint) as inOffPoint, max(inFlightPrefix) as inFlightPrefix, max(inFlightNumber) as inFlightNumber, max(inFlightNumberSuffix) as inFlightNumberSuffix, max(inFlightDate) as inFlightDate, max(inAircraftSubType) as inAircraftSubType, max(exBoardPoint) as exBoardPoint, max(exOffPoint) as exOffPoint, max(exFlightPrefix) as exFlightPrefix, max(exFlightNumber) as exFlightNumber, max(exFlightNumberSuffix) as exFlightNumberSuffix, max(exFlightDate) as exFlightDate, max(exAircraftSubType) as exAircraftSubType, sum(Weight) as Weight, sum(Volume) as Volume from ( select AWBID, max(Origin) as Origin, max(Destination) as Destination, max(OriginCountry) as OriginCountry, max(OriginCountryName) as OriginCountryName,
max(DestinationCountry) as DestinationCountry, max(DestinationCountryName) as DestinationCountryName, MAX(ProductCode) as ProductCode, MAX(COmmercialProductCode) as CommercialProductCode,
max(ManifestDate) as ManifestDate, dbo.fnWeek(max(ManifestDate)) as ManifestWeek,
max(inBoardPoint) as inBoardPoint, max(inOffPoint) as inOffPoint, max(inFlightPrefix) as inFlightPrefix,
max(inFlightNumber) as inFlightNumber, max(inFlightNumberSuffix) as inFlightNumberSuffix, max(inFlightDate) as inFlightDate, max(inAircraftSubType) as inAircraftSubType,
max(exBoardPoint) as exBoardPoint, max(exOffPoint) as exOffPoint, max(exFlightPrefix) as exFlightPrefix, max(exFlightNumber) as exFlightNumber, max(exFlightNumberSuffix) as exFlightNumberSuffix,
max(exFlightDate) as exFlightDate, max(exAircraftSubType) as exAircraftSubType, case when sum(inWeight) > sum(exWeight) then sum(inWeight) else sum(exWeight) end as Weight, case when sum(inVolume) > sum(exVolume) then sum(inVolume) else sum(exVolume) end as Volume
from ( select AWBID, max(Origin) as Origin, max(Destination) as Destination, max(OriginCountry) as OriginCountry, max(orc.CountryName) as OriginCountryName,
max(DestinationCountry) as DestinationCountry, max(dec.CountryName) as DestinationCountryName, MAX(vwSCbBasic3F.ProductCode) as ProductCode, MAX(COmmercialProductCode) as CommercialProductCode,
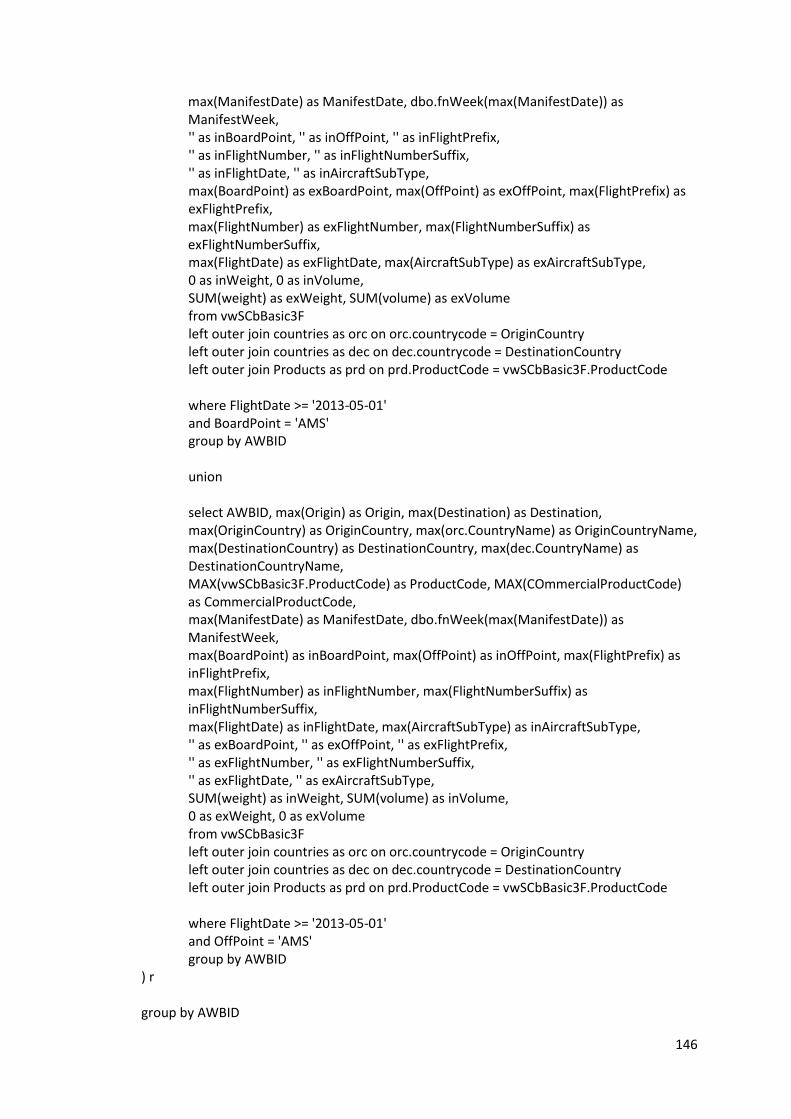
146
max(ManifestDate) as ManifestDate, dbo.fnWeek(max(ManifestDate)) as ManifestWeek,
'' as inBoardPoint, '' as inOffPoint, '' as inFlightPrefix, '' as inFlightNumber, '' as inFlightNumberSuffix, '' as inFlightDate, '' as inAircraftSubType,
max(BoardPoint) as exBoardPoint, max(OffPoint) as exOffPoint, max(FlightPrefix) as exFlightPrefix, max(FlightNumber) as exFlightNumber, max(FlightNumberSuffix) as exFlightNumberSuffix,
max(FlightDate) as exFlightDate, max(AircraftSubType) as exAircraftSubType, 0 as inWeight, 0 as inVolume, SUM(weight) as exWeight, SUM(volume) as exVolume from vwSCbBasic3F left outer join countries as orc on orc.countrycode = OriginCountry left outer join countries as dec on dec.countrycode = DestinationCountry left outer join Products as prd on prd.ProductCode = vwSCbBasic3F.ProductCode where FlightDate >= '2013-05-01' and BoardPoint = 'AMS' group by AWBID union select AWBID, max(Origin) as Origin, max(Destination) as Destination, max(OriginCountry) as OriginCountry, max(orc.CountryName) as OriginCountryName,
max(DestinationCountry) as DestinationCountry, max(dec.CountryName) as DestinationCountryName, MAX(vwSCbBasic3F.ProductCode) as ProductCode, MAX(COmmercialProductCode) as CommercialProductCode, max(ManifestDate) as ManifestDate, dbo.fnWeek(max(ManifestDate)) as ManifestWeek, max(BoardPoint) as inBoardPoint, max(OffPoint) as inOffPoint, max(FlightPrefix) as inFlightPrefix, max(FlightNumber) as inFlightNumber, max(FlightNumberSuffix) as inFlightNumberSuffix,
max(FlightDate) as inFlightDate, max(AircraftSubType) as inAircraftSubType, '' as exBoardPoint, '' as exOffPoint, '' as exFlightPrefix, '' as exFlightNumber, '' as exFlightNumberSuffix, '' as exFlightDate, '' as exAircraftSubType, SUM(weight) as inWeight, SUM(volume) as inVolume, 0 as exWeight, 0 as exVolume from vwSCbBasic3F left outer join countries as orc on orc.countrycode = OriginCountry left outer join countries as dec on dec.countrycode = DestinationCountry left outer join Products as prd on prd.ProductCode = vwSCbBasic3F.ProductCode where FlightDate >= '2013-05-01' and OffPoint = 'AMS' group by AWBID ) r group by AWBID

147
) s group by OriginCountry, DestinationCountry, Origin, Destination, OriginCountryName, DestinationCountryName, ProductCode, CommercialProductCode, inBoardPoint, inOffPoint, exBoardPoint, exOffPoint, inFlightPrefix, exFlightPrefix, inFlightNumber, exFlightNumber, ManifestWeek, ManifestDate order by OriginCountry, DestinationCountry, Origin, Destination, ProductCode, inBoardPoint, inOffPoint, exBoardPoint, exOffPoint, inFlightPrefix, exFlightPrefix, inFlightNumber, exFlightNumber, ManifestWeek, ManifestDate
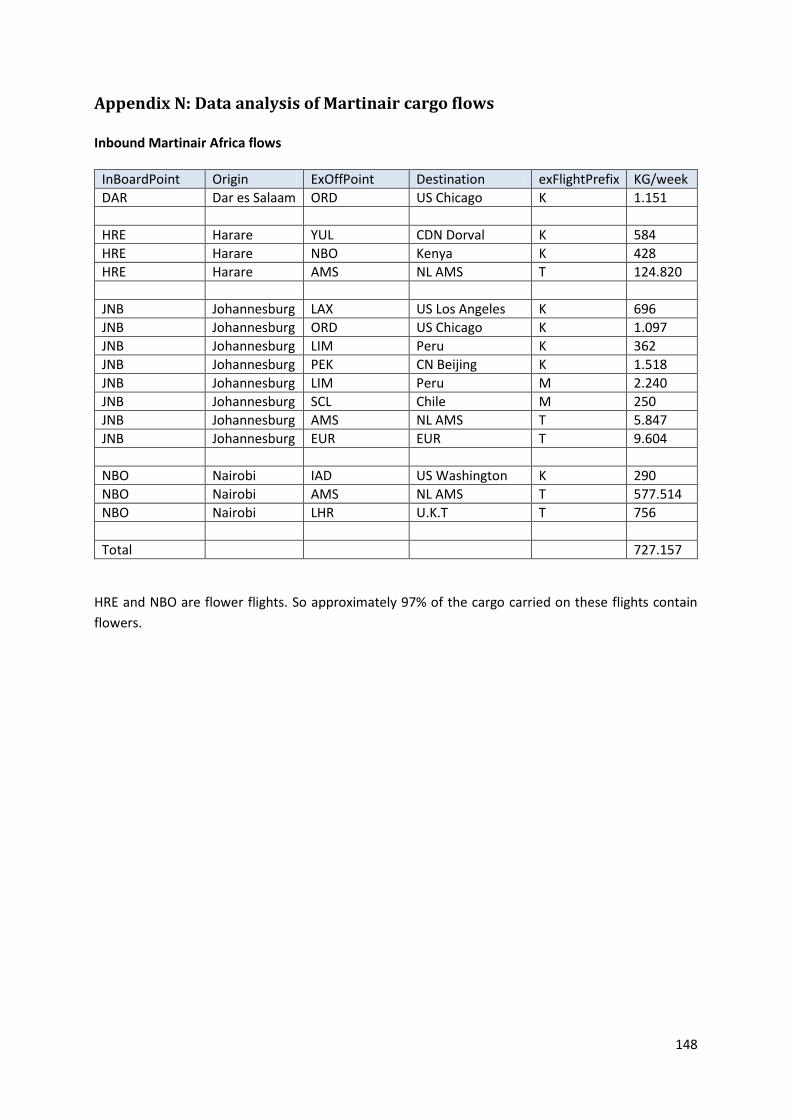
148
Appendix N: Data analysis of Martinair cargo flows Inbound Martinair Africa flows
InBoardPoint Origin ExOffPoint Destination exFlightPrefix KG/week
DAR Dar es Salaam ORD US Chicago K 1.151
HRE Harare YUL CDN Dorval K 584
HRE Harare NBO Kenya K 428
HRE Harare AMS NL AMS T 124.820
JNB Johannesburg LAX US Los Angeles K 696
JNB Johannesburg ORD US Chicago K 1.097
JNB Johannesburg LIM Peru K 362
JNB Johannesburg PEK CN Beijing K 1.518
JNB Johannesburg LIM Peru M 2.240
JNB Johannesburg SCL Chile M 250
JNB Johannesburg AMS NL AMS T 5.847
JNB Johannesburg EUR EUR T 9.604
NBO Nairobi IAD US Washington K 290
NBO Nairobi AMS NL AMS T 577.514
NBO Nairobi LHR U.K.T T 756
Total 727.157
HRE and NBO are flower flights. So approximately 97% of the cargo carried on these flights contain
flowers.
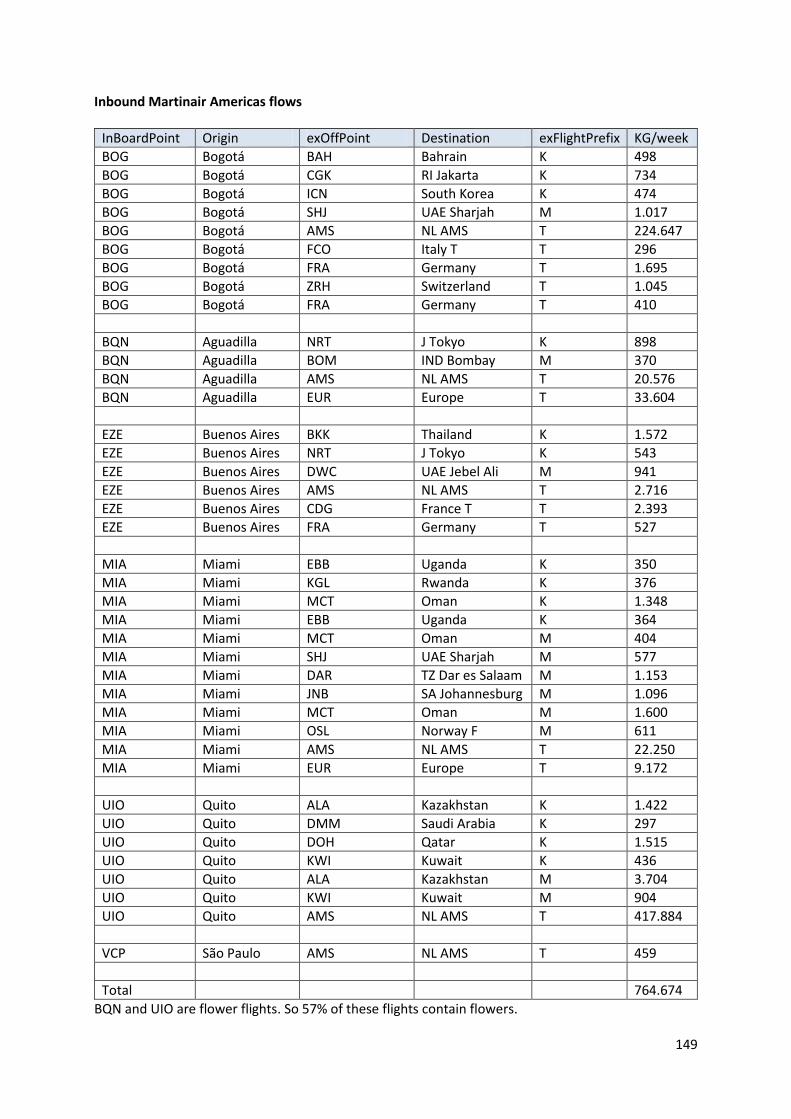
149
Inbound Martinair Americas flows
InBoardPoint Origin exOffPoint Destination exFlightPrefix KG/week
BOG Bogotá BAH Bahrain K 498
BOG Bogotá CGK RI Jakarta K 734
BOG Bogotá ICN South Korea K 474
BOG Bogotá SHJ UAE Sharjah M 1.017
BOG Bogotá AMS NL AMS T 224.647
BOG Bogotá FCO Italy T T 296
BOG Bogotá FRA Germany T 1.695
BOG Bogotá ZRH Switzerland T 1.045
BOG Bogotá FRA Germany T 410
BQN Aguadilla NRT J Tokyo K 898
BQN Aguadilla BOM IND Bombay M 370
BQN Aguadilla AMS NL AMS T 20.576
BQN Aguadilla EUR Europe T 33.604
EZE Buenos Aires BKK Thailand K 1.572
EZE Buenos Aires NRT J Tokyo K 543
EZE Buenos Aires DWC UAE Jebel Ali M 941
EZE Buenos Aires AMS NL AMS T 2.716
EZE Buenos Aires CDG France T T 2.393
EZE Buenos Aires FRA Germany T 527
MIA Miami EBB Uganda K 350
MIA Miami KGL Rwanda K 376
MIA Miami MCT Oman K 1.348
MIA Miami EBB Uganda K 364
MIA Miami MCT Oman M 404
MIA Miami SHJ UAE Sharjah M 577
MIA Miami DAR TZ Dar es Salaam M 1.153
MIA Miami JNB SA Johannesburg M 1.096
MIA Miami MCT Oman M 1.600
MIA Miami OSL Norway F M 611
MIA Miami AMS NL AMS T 22.250
MIA Miami EUR Europe T 9.172
UIO Quito ALA Kazakhstan K 1.422
UIO Quito DMM Saudi Arabia K 297
UIO Quito DOH Qatar K 1.515
UIO Quito KWI Kuwait K 436
UIO Quito ALA Kazakhstan M 3.704
UIO Quito KWI Kuwait M 904
UIO Quito AMS NL AMS T 417.884
VCP São Paulo AMS NL AMS T 459
Total 764.674
BQN and UIO are flower flights. So 57% of these flights contain flowers.
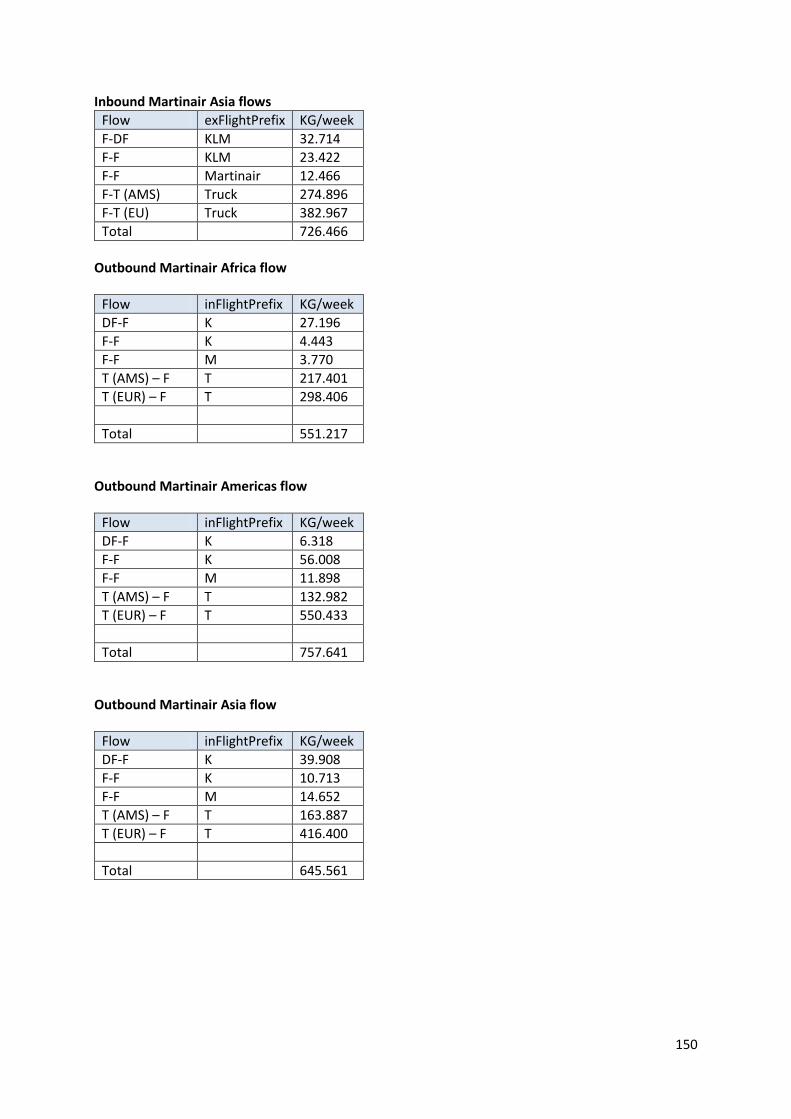
150
Inbound Martinair Asia flows
Flow exFlightPrefix KG/week
F-DF KLM 32.714
F-F KLM 23.422
F-F Martinair 12.466
F-T (AMS) Truck 274.896
F-T (EU) Truck 382.967
Total 726.466
Outbound Martinair Africa flow
Flow inFlightPrefix KG/week
DF-F K 27.196
F-F K 4.443
F-F M 3.770
T (AMS) – F T 217.401
T (EUR) – F T 298.406
Total 551.217
Outbound Martinair Americas flow
Flow inFlightPrefix KG/week
DF-F K 6.318
F-F K 56.008
F-F M 11.898
T (AMS) – F T 132.982
T (EUR) – F T 550.433
Total 757.641
Outbound Martinair Asia flow
Flow inFlightPrefix KG/week
DF-F K 39.908
F-F K 10.713
F-F M 14.652
T (AMS) – F T 163.887
T (EUR) – F T 416.400
Total 645.561
151
Appendix O: Marginal costs calculation at KLM In this chapter the costs for handling cargo at KLM Cargo warehouse are calculated. Defining particular costs to be fixed or variable depends on the managerial level of this research. As described in the scope, the managerial scope of this research is the organizational managers of KLM Cargo Operations. In the optimization model, cost is an important parameter that has a big influence on the outcome of the model. The handling costs of KLM Cargo can be derived in multiple ways. Since this research is organizational oriented the costs calculation should take some strategically boundaries into account. There is no doubt of stopping the Cargo business at Schiphol. In addition, KLM’s strategy to keep the family together is important because this implies that no employees will be fired. Literature review on activity based costing The business case could make use of Activity Based Costing (ABC). ABC is a common technique used particular in logistic organizations (Damme, 2000). To improve competitiveness of an organization and to achieve better customer satisfaction, the need for reasonable pricing and accurate cost estimation has increased in recent years (Tang, Wang, & Ding, 2012). Therefore new analyzing techniques are developed by researchers. Dick van Damme (2000) created a new ABC method: Activity Based Costing and Decision (ABCD) support model. The ABCD-method: “consist of a model for financial information and an implementation plan to realize the information supply” (Damme, 2000, p. 185). This model fulfills six functions: cost insight, process diagnostics, tariffs setting, profitability analysis and decision support and evaluation (Damme, 2000). These six functions could be of great value for the business case for KLM Cargo and therefore this ABCD model could be very useful during this thesis. Cargo handling costs at KLM In the table below the costs are presented for handling cargo at KLM Cargo Operations in FB2 and FB3. As can be derived from chapter 5, Menzies does not offer the same processes as KLM. According to Julius de Jong, formal controller KLM Cargo Worldwide Operations, the costs of FB1 should not be included in the calculation of the marginal costs (Jong, 2013). The processes in FB1 require more dedication of employees. Therefore the productivity in FB1 is lower than FB2 & 3. On the other hand these processes contribute to more revenues due to a higher tariff for customers. Menzies does not offer or is not allowed to handle most products that are handled in FB1. When an allocation decision between KLM and Menzies should be made the costs of handling cargo at FB2 and FB3 need to be compared with tariff of Menzies. Since the tariff of Menzies is based on handling general cargo the handling costs of KLM should also be based on general cargo. What is included in these costs are described here. Which costs are included are derived from Emiel Out, Controller Hub Operations, and Martijn Hamerslag, Controller Hub Operations & Trucking. Salary costs The total salary costs are divided into salary costs own staff, hired staff and additional costs of staff. The costs of own staff contain the wages paid to employees. Costs of hired staff are only wages paid to flex employees hired by an external company. Additional costs of staff mostly consist of travel allowance to employees. Vehicles, maintenance & repair The vehicles used by KLM Cargo Operations as forklifts and other vehicles are leased from a third party. Therefore KLM Cargo is flexible towards fluctuations in the market. Thereby, these costs are dependent on how much cargo is handled in the warehouses. These costs linearly grow with the amount of cargo handled. More handled tons will require more maintenance and repair of the vehicles.
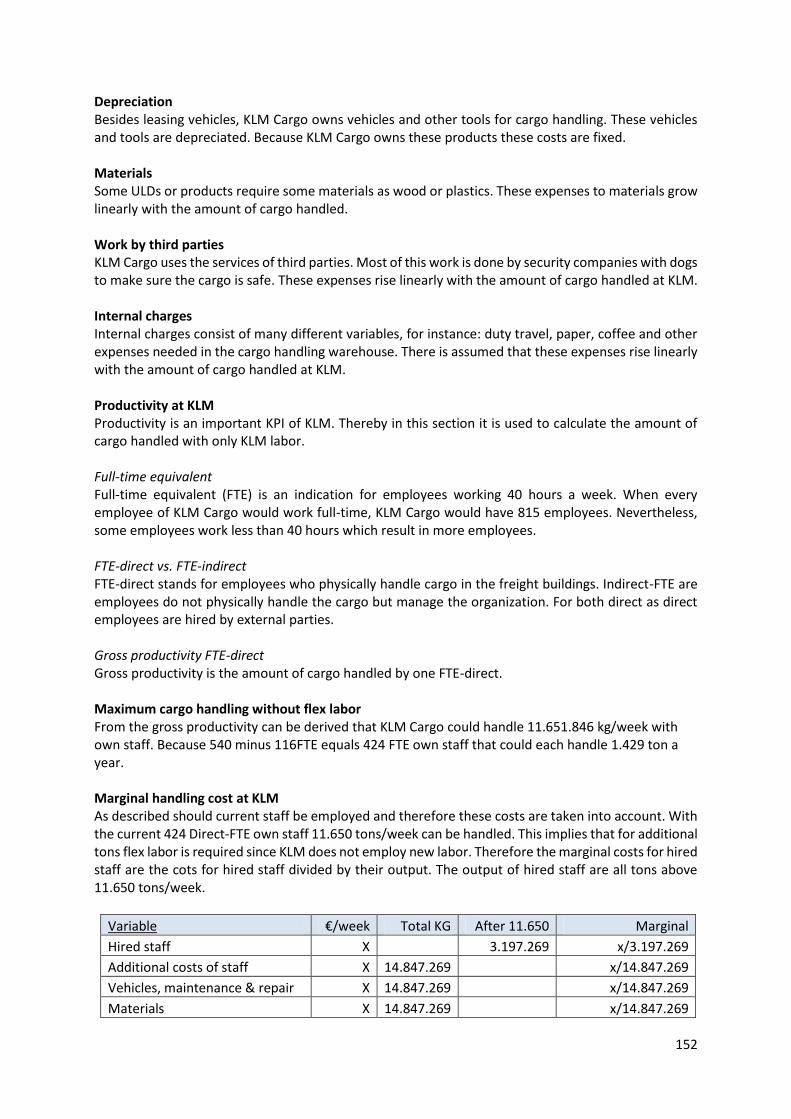
152
Depreciation Besides leasing vehicles, KLM Cargo owns vehicles and other tools for cargo handling. These vehicles and tools are depreciated. Because KLM Cargo owns these products these costs are fixed. Materials Some ULDs or products require some materials as wood or plastics. These expenses to materials grow linearly with the amount of cargo handled. Work by third parties KLM Cargo uses the services of third parties. Most of this work is done by security companies with dogs to make sure the cargo is safe. These expenses rise linearly with the amount of cargo handled at KLM. Internal charges Internal charges consist of many different variables, for instance: duty travel, paper, coffee and other expenses needed in the cargo handling warehouse. There is assumed that these expenses rise linearly with the amount of cargo handled at KLM. Productivity at KLM Productivity is an important KPI of KLM. Thereby in this section it is used to calculate the amount of cargo handled with only KLM labor. Full-time equivalent Full-time equivalent (FTE) is an indication for employees working 40 hours a week. When every employee of KLM Cargo would work full-time, KLM Cargo would have 815 employees. Nevertheless, some employees work less than 40 hours which result in more employees. FTE-direct vs. FTE-indirect FTE-direct stands for employees who physically handle cargo in the freight buildings. Indirect-FTE are employees do not physically handle the cargo but manage the organization. For both direct as direct employees are hired by external parties. Gross productivity FTE-direct Gross productivity is the amount of cargo handled by one FTE-direct. Maximum cargo handling without flex labor From the gross productivity can be derived that KLM Cargo could handle 11.651.846 kg/week with own staff. Because 540 minus 116FTE equals 424 FTE own staff that could each handle 1.429 ton a year. Marginal handling cost at KLM As described should current staff be employed and therefore these costs are taken into account. With the current 424 Direct-FTE own staff 11.650 tons/week can be handled. This implies that for additional tons flex labor is required since KLM does not employ new labor. Therefore the marginal costs for hired staff are the cots for hired staff divided by their output. The output of hired staff are all tons above 11.650 tons/week.
Variable €/week Total KG After 11.650 Marginal
Hired staff X 3.197.269 x/3.197.269
Additional costs of staff X 14.847.269 x/14.847.269
Vehicles, maintenance & repair X 14.847.269 x/14.847.269
Materials X 14.847.269 x/14.847.269
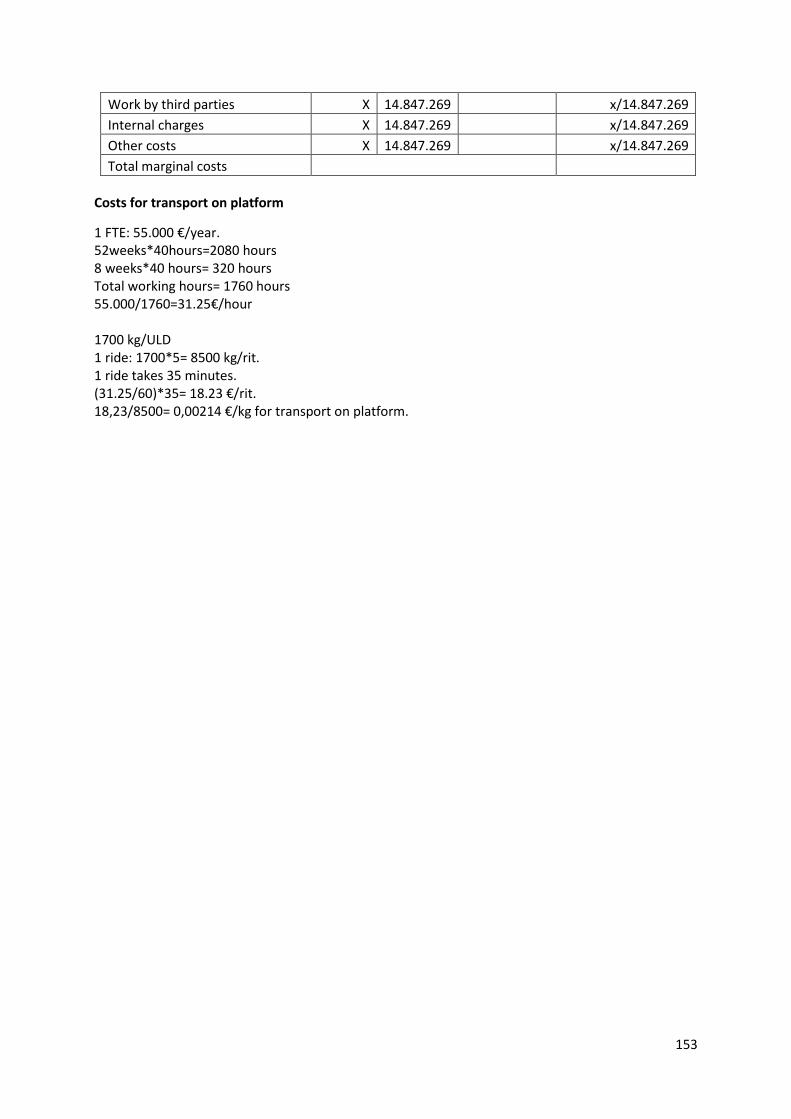
153
Work by third parties X 14.847.269 x/14.847.269
Internal charges X 14.847.269 x/14.847.269
Other costs X 14.847.269 x/14.847.269
Total marginal costs
Costs for transport on platform
1 FTE: 55.000 €/year. 52weeks*40hours=2080 hours 8 weeks*40 hours= 320 hours Total working hours= 1760 hours 55.000/1760=31.25€/hour 1700 kg/ULD 1 ride: 1700*5= 8500 kg/rit. 1 ride takes 35 minutes. (31.25/60)*35= 18.23 €/rit. 18,23/8500= 0,00214 €/kg for transport on platform.
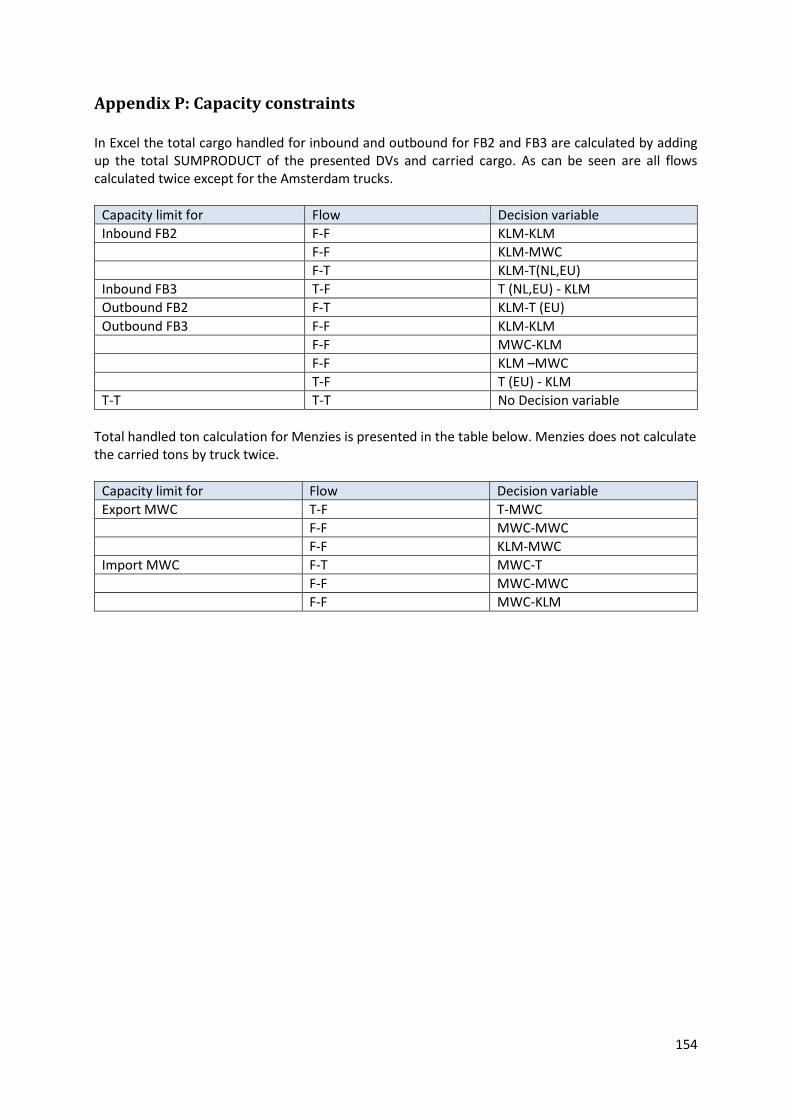
154
Appendix P: Capacity constraints In Excel the total cargo handled for inbound and outbound for FB2 and FB3 are calculated by adding up the total SUMPRODUCT of the presented DVs and carried cargo. As can be seen are all flows calculated twice except for the Amsterdam trucks.
Capacity limit for Flow Decision variable
Inbound FB2 F-F KLM-KLM
F-F KLM-MWC
F-T KLM-T(NL,EU)
Inbound FB3 T-F T (NL,EU) - KLM
Outbound FB2 F-T KLM-T (EU)
Outbound FB3 F-F KLM-KLM
F-F MWC-KLM
F-F KLM –MWC
T-F T (EU) - KLM
T-T T-T No Decision variable
Total handled ton calculation for Menzies is presented in the table below. Menzies does not calculate the carried tons by truck twice.
Capacity limit for Flow Decision variable
Export MWC T-F T-MWC
F-F MWC-MWC
F-F KLM-MWC
Import MWC F-T MWC-T
F-F MWC-MWC
F-F MWC-KLM
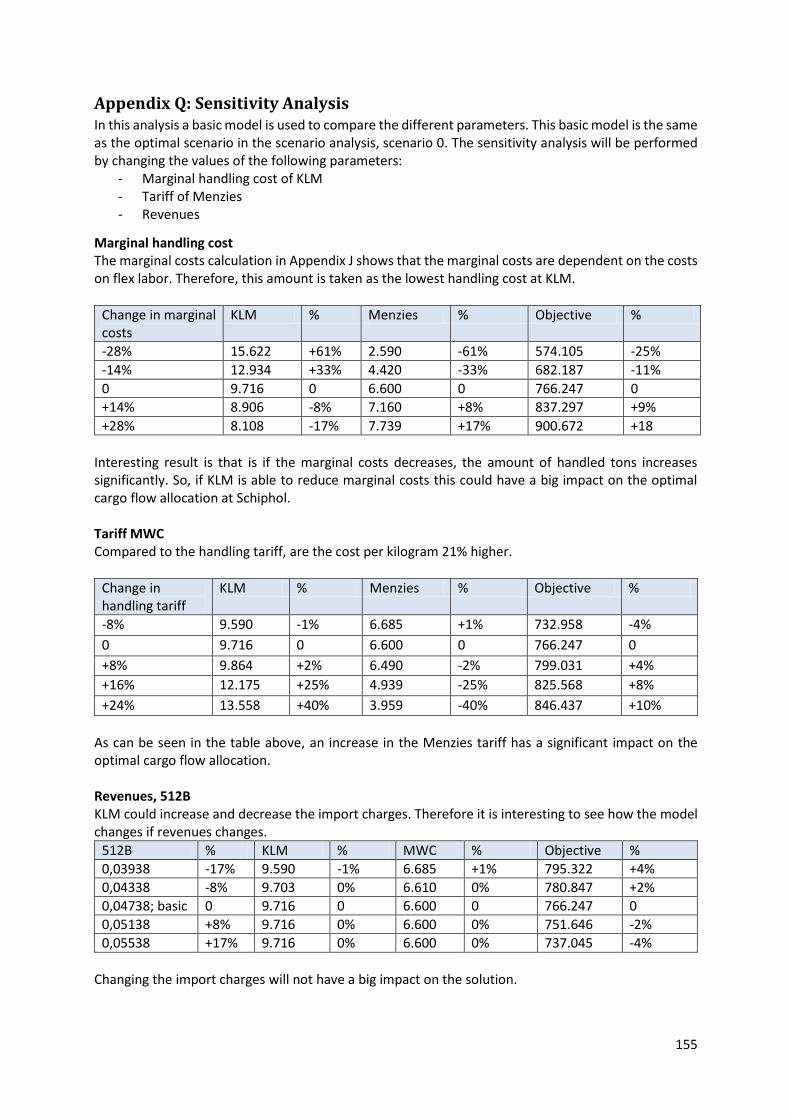
155
Appendix Q: Sensitivity Analysis In this analysis a basic model is used to compare the different parameters. This basic model is the same as the optimal scenario in the scenario analysis, scenario 0. The sensitivity analysis will be performed by changing the values of the following parameters:
- Marginal handling cost of KLM - Tariff of Menzies - Revenues
Marginal handling cost The marginal costs calculation in Appendix J shows that the marginal costs are dependent on the costs on flex labor. Therefore, this amount is taken as the lowest handling cost at KLM.
Change in marginal costs
KLM % Menzies % Objective %
-28% 15.622 +61% 2.590 -61% 574.105 -25%
-14% 12.934 +33% 4.420 -33% 682.187 -11%
0 9.716 0 6.600 0 766.247 0
+14% 8.906 -8% 7.160 +8% 837.297 +9%
+28% 8.108 -17% 7.739 +17% 900.672 +18
Interesting result is that is if the marginal costs decreases, the amount of handled tons increases significantly. So, if KLM is able to reduce marginal costs this could have a big impact on the optimal cargo flow allocation at Schiphol. Tariff MWC Compared to the handling tariff, are the cost per kilogram 21% higher.
Change in handling tariff
KLM % Menzies % Objective %
-8% 9.590 -1% 6.685 +1% 732.958 -4%
0 9.716 0 6.600 0 766.247 0
+8% 9.864 +2% 6.490 -2% 799.031 +4%
+16% 12.175 +25% 4.939 -25% 825.568 +8%
+24% 13.558 +40% 3.959 -40% 846.437 +10%
As can be seen in the table above, an increase in the Menzies tariff has a significant impact on the optimal cargo flow allocation. Revenues, 512B KLM could increase and decrease the import charges. Therefore it is interesting to see how the model changes if revenues changes.
512B % KLM % MWC % Objective %
0,03938 -17% 9.590 -1% 6.685 +1% 795.322 +4%
0,04338 -8% 9.703 0% 6.610 0% 780.847 +2%
0,04738; basic 0 9.716 0 6.600 0 766.247 0
0,05138 +8% 9.716 0% 6.600 0% 751.646 -2%
0,05538 +17% 9.716 0% 6.600 0% 737.045 -4%
Changing the import charges will not have a big impact on the solution.
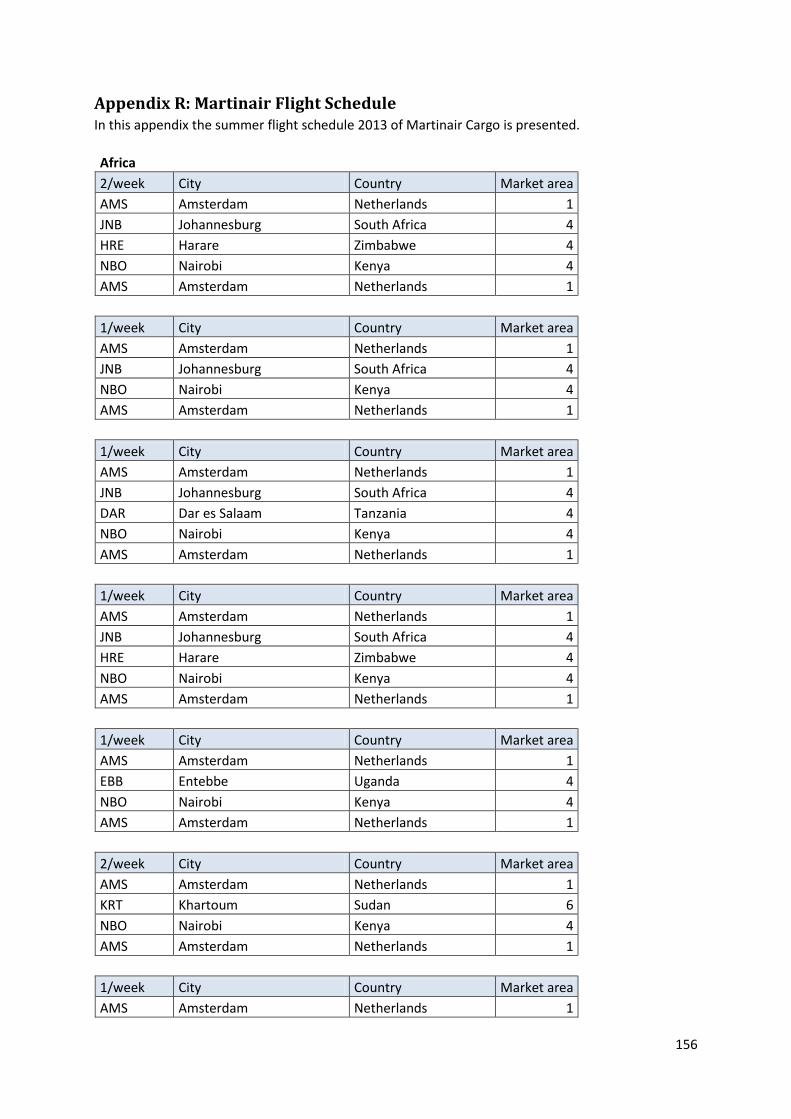
156
Appendix R: Martinair Flight Schedule In this appendix the summer flight schedule 2013 of Martinair Cargo is presented.
Africa
2/week City Country Market area
AMS Amsterdam Netherlands 1
JNB Johannesburg South Africa 4
HRE Harare Zimbabwe 4
NBO Nairobi Kenya 4
AMS Amsterdam Netherlands 1
1/week City Country Market area
AMS Amsterdam Netherlands 1
JNB Johannesburg South Africa 4
NBO Nairobi Kenya 4
AMS Amsterdam Netherlands 1
1/week City Country Market area
AMS Amsterdam Netherlands 1
JNB Johannesburg South Africa 4
DAR Dar es Salaam Tanzania 4
NBO Nairobi Kenya 4
AMS Amsterdam Netherlands 1
1/week City Country Market area
AMS Amsterdam Netherlands 1
JNB Johannesburg South Africa 4
HRE Harare Zimbabwe 4
NBO Nairobi Kenya 4
AMS Amsterdam Netherlands 1
1/week City Country Market area
AMS Amsterdam Netherlands 1
EBB Entebbe Uganda 4
NBO Nairobi Kenya 4
AMS Amsterdam Netherlands 1
2/week City Country Market area
AMS Amsterdam Netherlands 1
KRT Khartoum Sudan 6
NBO Nairobi Kenya 4
AMS Amsterdam Netherlands 1
1/week City Country Market area
AMS Amsterdam Netherlands 1
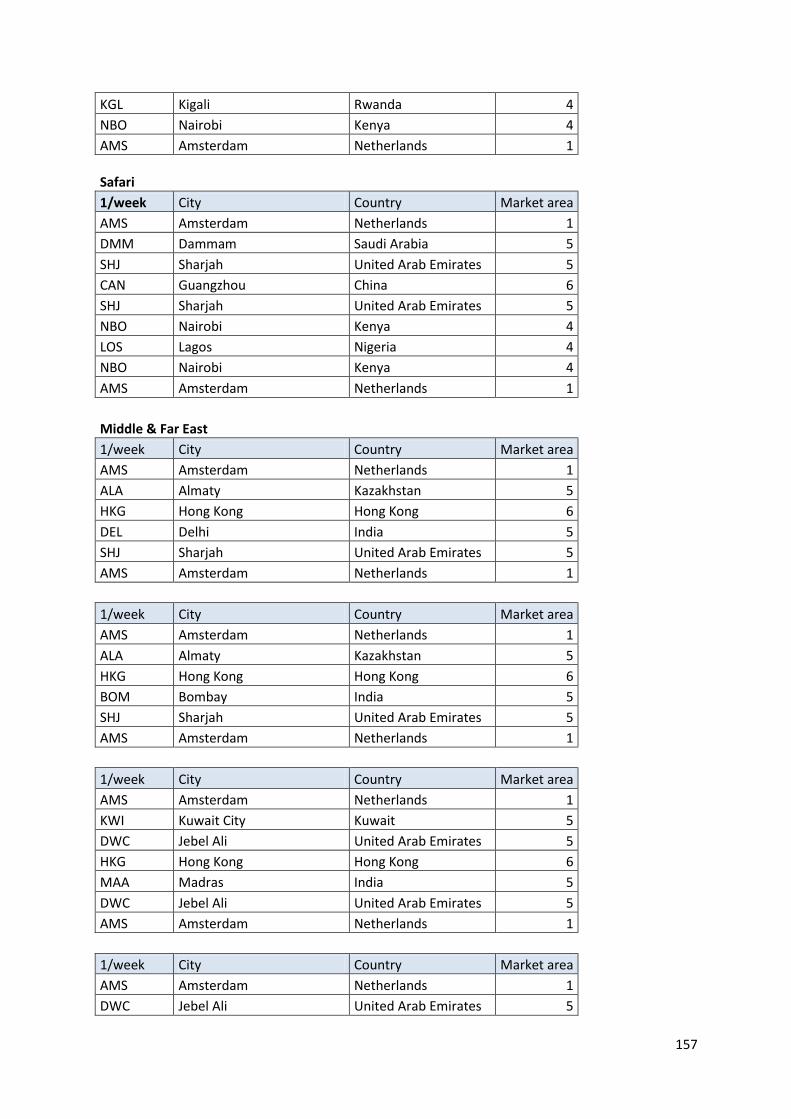
157
KGL Kigali Rwanda 4
NBO Nairobi Kenya 4
AMS Amsterdam Netherlands 1
Safari
1/week City Country Market area
AMS Amsterdam Netherlands 1
DMM Dammam Saudi Arabia 5
SHJ Sharjah United Arab Emirates 5
CAN Guangzhou China 6
SHJ Sharjah United Arab Emirates 5
NBO Nairobi Kenya 4
LOS Lagos Nigeria 4
NBO Nairobi Kenya 4
AMS Amsterdam Netherlands 1
Middle & Far East
1/week City Country Market area
AMS Amsterdam Netherlands 1
ALA Almaty Kazakhstan 5
HKG Hong Kong Hong Kong 6
DEL Delhi India 5
SHJ Sharjah United Arab Emirates 5
AMS Amsterdam Netherlands 1
1/week City Country Market area
AMS Amsterdam Netherlands 1
ALA Almaty Kazakhstan 5
HKG Hong Kong Hong Kong 6
BOM Bombay India 5
SHJ Sharjah United Arab Emirates 5
AMS Amsterdam Netherlands 1
1/week City Country Market area
AMS Amsterdam Netherlands 1
KWI Kuwait City Kuwait 5
DWC Jebel Ali United Arab Emirates 5
HKG Hong Kong Hong Kong 6
MAA Madras India 5
DWC Jebel Ali United Arab Emirates 5
AMS Amsterdam Netherlands 1
1/week City Country Market area
AMS Amsterdam Netherlands 1
DWC Jebel Ali United Arab Emirates 5
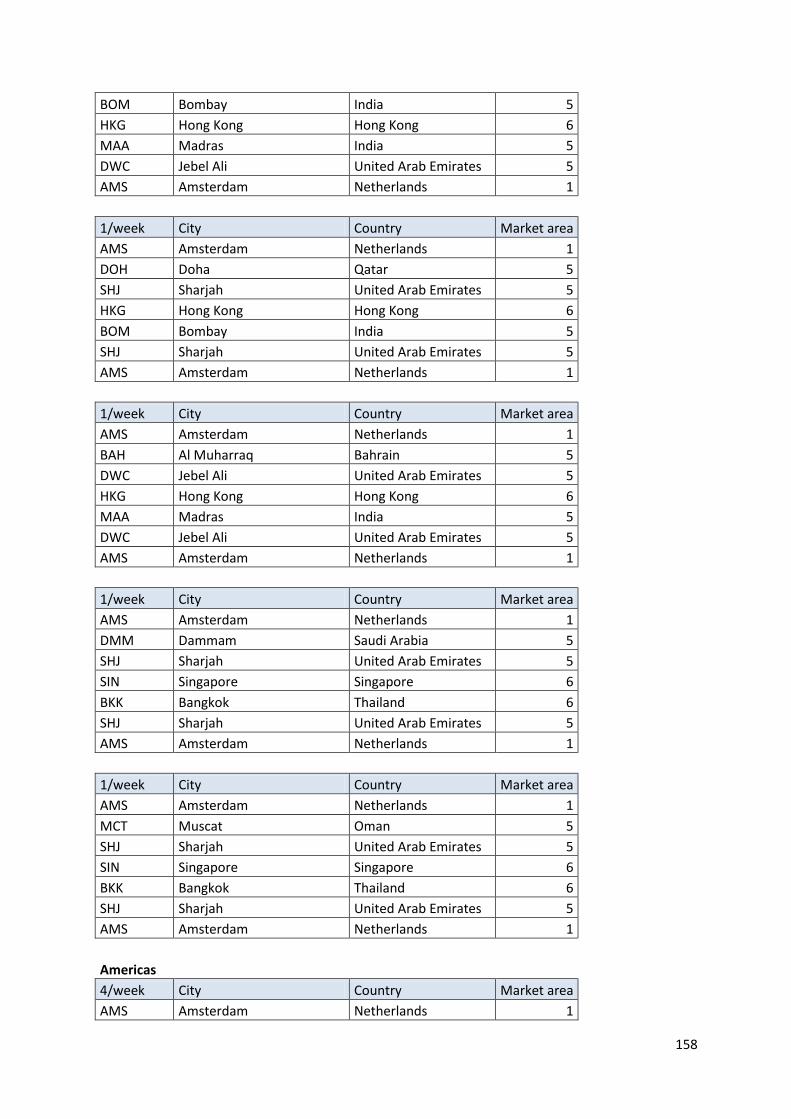
158
BOM Bombay India 5
HKG Hong Kong Hong Kong 6
MAA Madras India 5
DWC Jebel Ali United Arab Emirates 5
AMS Amsterdam Netherlands 1
1/week City Country Market area
AMS Amsterdam Netherlands 1
DOH Doha Qatar 5
SHJ Sharjah United Arab Emirates 5
HKG Hong Kong Hong Kong 6
BOM Bombay India 5
SHJ Sharjah United Arab Emirates 5
AMS Amsterdam Netherlands 1
1/week City Country Market area
AMS Amsterdam Netherlands 1
BAH Al Muharraq Bahrain 5
DWC Jebel Ali United Arab Emirates 5
HKG Hong Kong Hong Kong 6
MAA Madras India 5
DWC Jebel Ali United Arab Emirates 5
AMS Amsterdam Netherlands 1
1/week City Country Market area
AMS Amsterdam Netherlands 1
DMM Dammam Saudi Arabia 5
SHJ Sharjah United Arab Emirates 5
SIN Singapore Singapore 6
BKK Bangkok Thailand 6
SHJ Sharjah United Arab Emirates 5
AMS Amsterdam Netherlands 1
1/week City Country Market area
AMS Amsterdam Netherlands 1
MCT Muscat Oman 5
SHJ Sharjah United Arab Emirates 5
SIN Singapore Singapore 6
BKK Bangkok Thailand 6
SHJ Sharjah United Arab Emirates 5
AMS Amsterdam Netherlands 1
Americas
4/week City Country Market area
AMS Amsterdam Netherlands 1
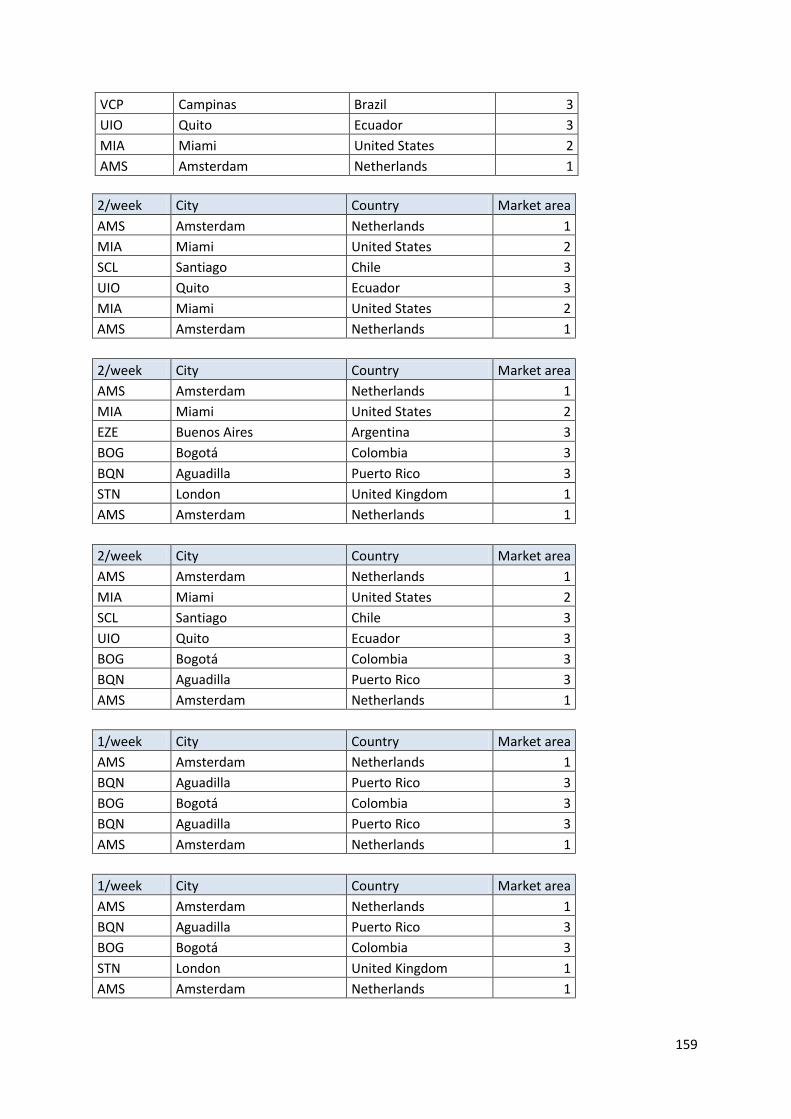
159
VCP Campinas Brazil 3
UIO Quito Ecuador 3
MIA Miami United States 2
AMS Amsterdam Netherlands 1
2/week City Country Market area
AMS Amsterdam Netherlands 1
MIA Miami United States 2
SCL Santiago Chile 3
UIO Quito Ecuador 3
MIA Miami United States 2
AMS Amsterdam Netherlands 1
2/week City Country Market area
AMS Amsterdam Netherlands 1
MIA Miami United States 2
EZE Buenos Aires Argentina 3
BOG Bogotá Colombia 3
BQN Aguadilla Puerto Rico 3
STN London United Kingdom 1
AMS Amsterdam Netherlands 1
2/week City Country Market area
AMS Amsterdam Netherlands 1
MIA Miami United States 2
SCL Santiago Chile 3
UIO Quito Ecuador 3
BOG Bogotá Colombia 3
BQN Aguadilla Puerto Rico 3
AMS Amsterdam Netherlands 1
1/week City Country Market area
AMS Amsterdam Netherlands 1
BQN Aguadilla Puerto Rico 3
BOG Bogotá Colombia 3
BQN Aguadilla Puerto Rico 3
AMS Amsterdam Netherlands 1
1/week City Country Market area
AMS Amsterdam Netherlands 1
BQN Aguadilla Puerto Rico 3
BOG Bogotá Colombia 3
STN London United Kingdom 1
AMS Amsterdam Netherlands 1
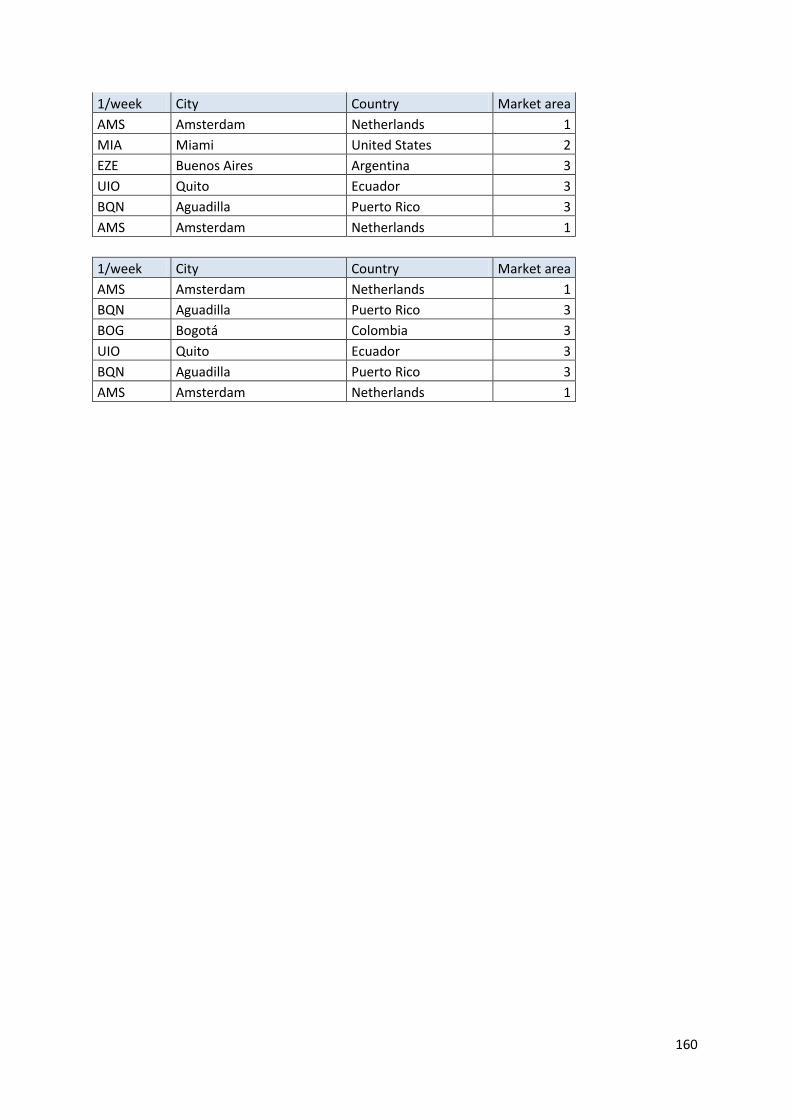
160
1/week City Country Market area
AMS Amsterdam Netherlands 1
MIA Miami United States 2
EZE Buenos Aires Argentina 3
UIO Quito Ecuador 3
BQN Aguadilla Puerto Rico 3
AMS Amsterdam Netherlands 1
1/week City Country Market area
AMS Amsterdam Netherlands 1
BQN Aguadilla Puerto Rico 3
BOG Bogotá Colombia 3
UIO Quito Ecuador 3
BQN Aguadilla Puerto Rico 3
AMS Amsterdam Netherlands 1
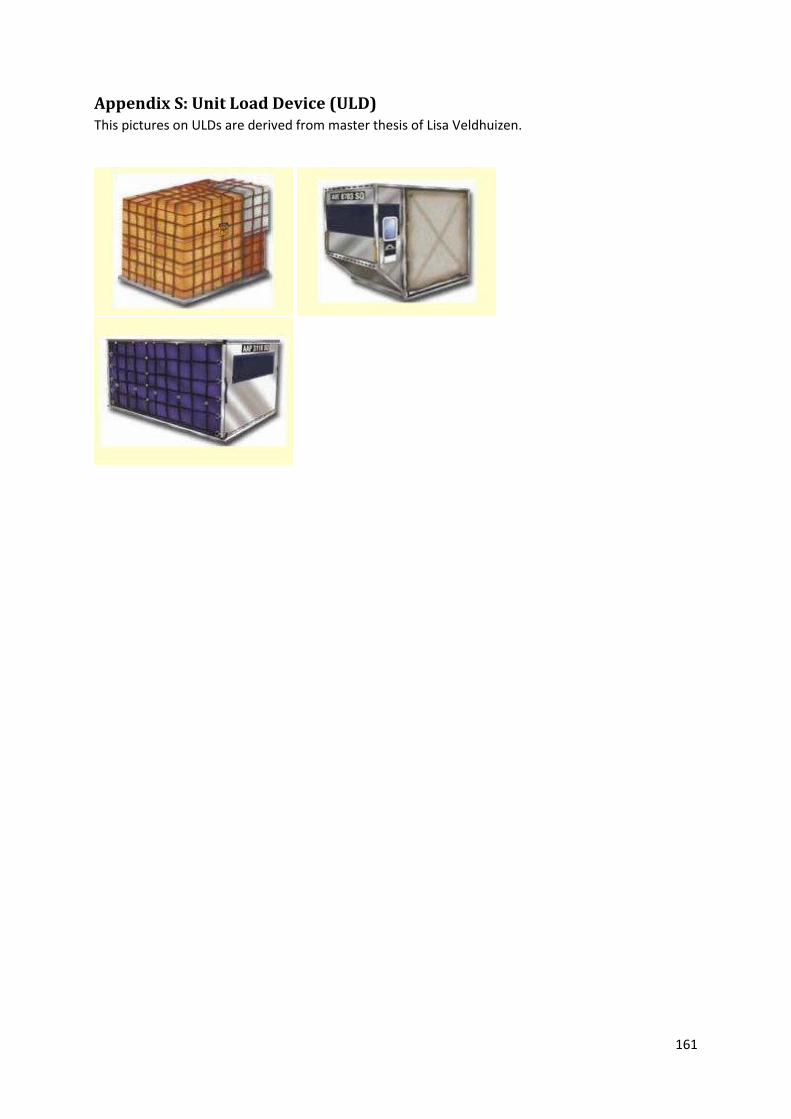
161
Appendix S: Unit Load Device (ULD) This pictures on ULDs are derived from master thesis of Lisa Veldhuizen.
162
Appendix T: Scenario Analysis The scenarios tested in this scenario analyses are:
Scenario 0: Current Scenario 1: Optimal Scenario 2: Optimal +11.000 ton/week at KLM Scenario 3: Martinair flow(s) at KLM Scenario 4: Optimal use of KLM Cargo handling capacity Scenario 5: Which KLM flow to Menzies? Scenario 6: No revenues Scenario 7: Same costs structure as Menzies Scenario 8: Transparent optimal cargo flow allocation
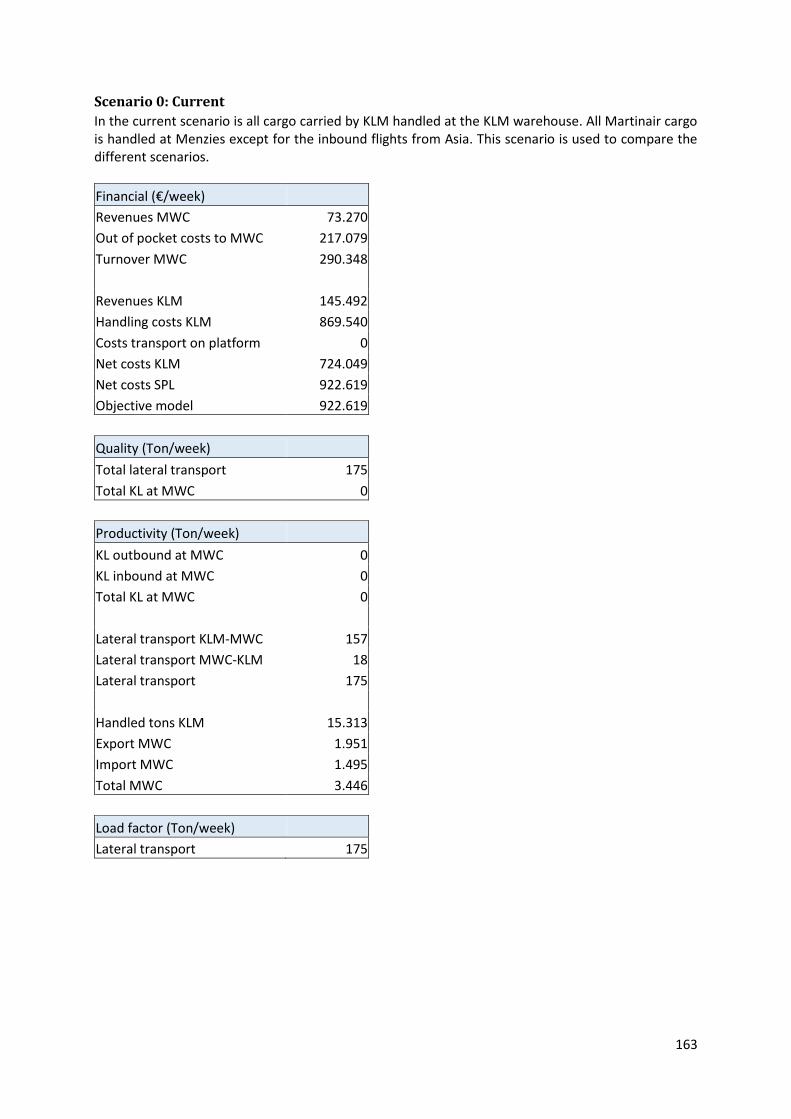
163
Scenario 0: Current
In the current scenario is all cargo carried by KLM handled at the KLM warehouse. All Martinair cargo is handled at Menzies except for the inbound flights from Asia. This scenario is used to compare the different scenarios.
Financial (€/week)
Revenues MWC 73.270
Out of pocket costs to MWC 217.079
Turnover MWC 290.348
Revenues KLM 145.492
Handling costs KLM 869.540
Costs transport on platform 0
Net costs KLM 724.049
Net costs SPL 922.619
Objective model 922.619
Quality (Ton/week)
Total lateral transport 175
Total KL at MWC 0
Productivity (Ton/week)
KL outbound at MWC 0
KL inbound at MWC 0
Total KL at MWC 0
Lateral transport KLM-MWC 157
Lateral transport MWC-KLM 18
Lateral transport 175
Handled tons KLM 15.313
Export MWC 1.951
Import MWC 1.495
Total MWC 3.446
Load factor (Ton/week)
Lateral transport 175
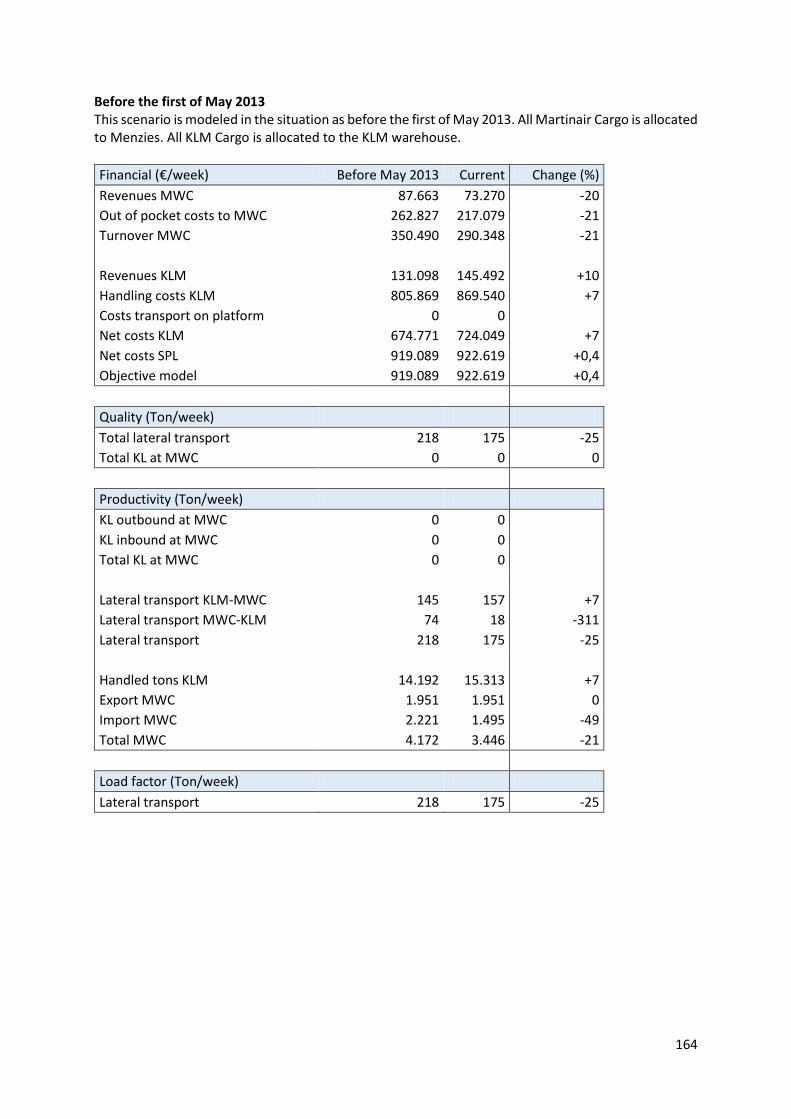
164
Before the first of May 2013 This scenario is modeled in the situation as before the first of May 2013. All Martinair Cargo is allocated to Menzies. All KLM Cargo is allocated to the KLM warehouse.
Financial (€/week) Before May 2013 Current Change (%)
Revenues MWC 87.663 73.270 -20
Out of pocket costs to MWC 262.827 217.079 -21
Turnover MWC 350.490 290.348 -21
Revenues KLM 131.098 145.492 +10
Handling costs KLM 805.869 869.540 +7
Costs transport on platform 0 0
Net costs KLM 674.771 724.049 +7
Net costs SPL 919.089 922.619 +0,4
Objective model 919.089 922.619 +0,4
Quality (Ton/week)
Total lateral transport 218 175 -25
Total KL at MWC 0 0 0
Productivity (Ton/week)
KL outbound at MWC 0 0
KL inbound at MWC 0 0
Total KL at MWC 0 0
Lateral transport KLM-MWC 145 157 +7
Lateral transport MWC-KLM 74 18 -311
Lateral transport 218 175 -25
Handled tons KLM 14.192 15.313 +7
Export MWC 1.951 1.951 0
Import MWC 2.221 1.495 -49
Total MWC 4.172 3.446 -21
Load factor (Ton/week)
Lateral transport 218 175 -25
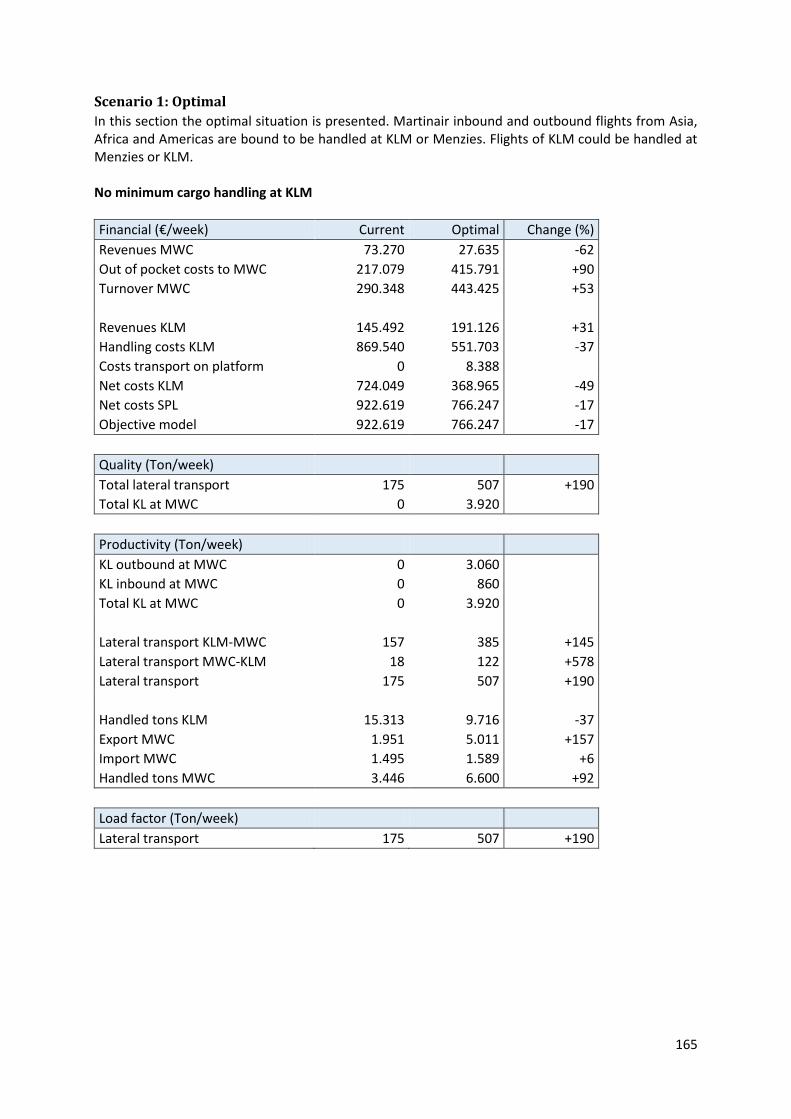
165
Scenario 1: Optimal
In this section the optimal situation is presented. Martinair inbound and outbound flights from Asia, Africa and Americas are bound to be handled at KLM or Menzies. Flights of KLM could be handled at Menzies or KLM. No minimum cargo handling at KLM
Financial (€/week) Current Optimal Change (%)
Revenues MWC 73.270 27.635 -62
Out of pocket costs to MWC 217.079 415.791 +90
Turnover MWC 290.348 443.425 +53
Revenues KLM 145.492 191.126 +31
Handling costs KLM 869.540 551.703 -37
Costs transport on platform 0 8.388
Net costs KLM 724.049 368.965 -49
Net costs SPL 922.619 766.247 -17
Objective model 922.619 766.247 -17
Quality (Ton/week)
Total lateral transport 175 507 +190
Total KL at MWC 0 3.920
Productivity (Ton/week)
KL outbound at MWC 0 3.060
KL inbound at MWC 0 860
Total KL at MWC 0 3.920
Lateral transport KLM-MWC 157 385 +145
Lateral transport MWC-KLM 18 122 +578
Lateral transport 175 507 +190
Handled tons KLM 15.313 9.716 -37
Export MWC 1.951 5.011 +157
Import MWC 1.495 1.589 +6
Handled tons MWC 3.446 6.600 +92
Load factor (Ton/week)
Lateral transport 175 507 +190
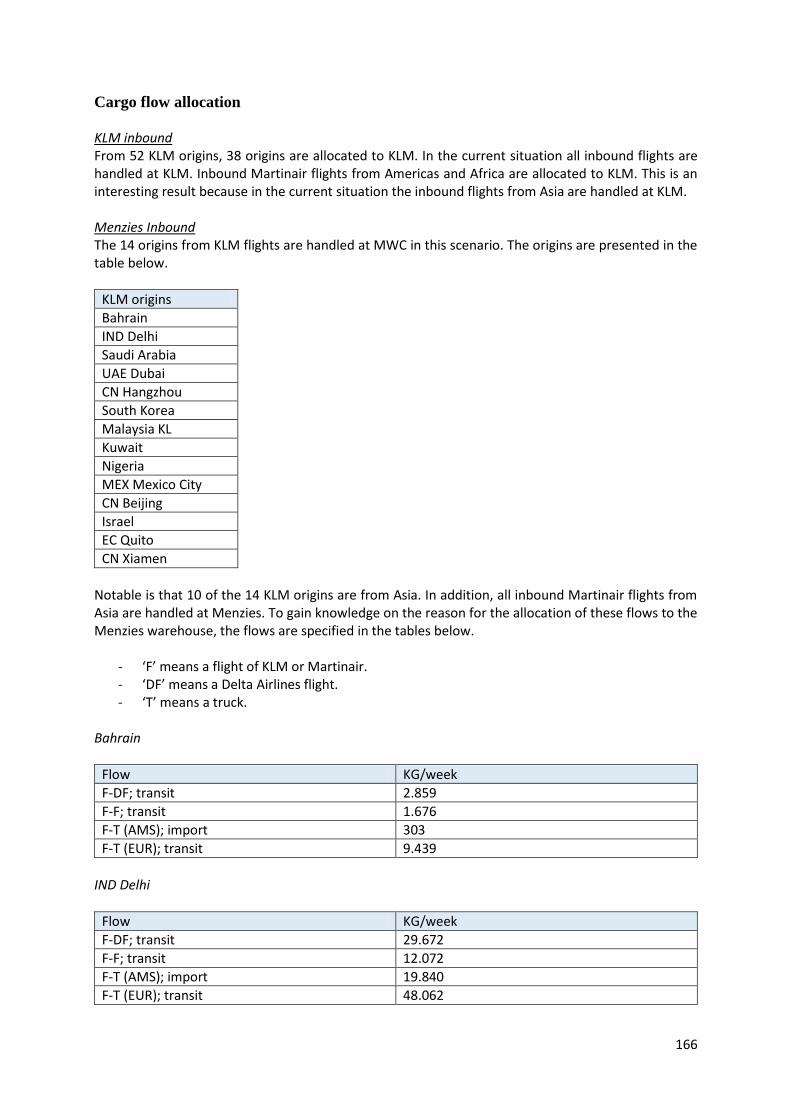
166
Cargo flow allocation KLM inbound From 52 KLM origins, 38 origins are allocated to KLM. In the current situation all inbound flights are handled at KLM. Inbound Martinair flights from Americas and Africa are allocated to KLM. This is an interesting result because in the current situation the inbound flights from Asia are handled at KLM. Menzies Inbound The 14 origins from KLM flights are handled at MWC in this scenario. The origins are presented in the table below.
KLM origins
Bahrain
IND Delhi
Saudi Arabia
UAE Dubai
CN Hangzhou
South Korea
Malaysia KL
Kuwait
Nigeria
MEX Mexico City
CN Beijing
Israel
EC Quito
CN Xiamen
Notable is that 10 of the 14 KLM origins are from Asia. In addition, all inbound Martinair flights from Asia are handled at Menzies. To gain knowledge on the reason for the allocation of these flows to the Menzies warehouse, the flows are specified in the tables below.
- ‘F’ means a flight of KLM or Martinair. - ‘DF’ means a Delta Airlines flight. - ‘T’ means a truck.
Bahrain
Flow KG/week
F-DF; transit 2.859
F-F; transit 1.676
F-T (AMS); import 303
F-T (EUR); transit 9.439
IND Delhi
Flow KG/week
F-DF; transit 29.672
F-F; transit 12.072
F-T (AMS); import 19.840
F-T (EUR); transit 48.062
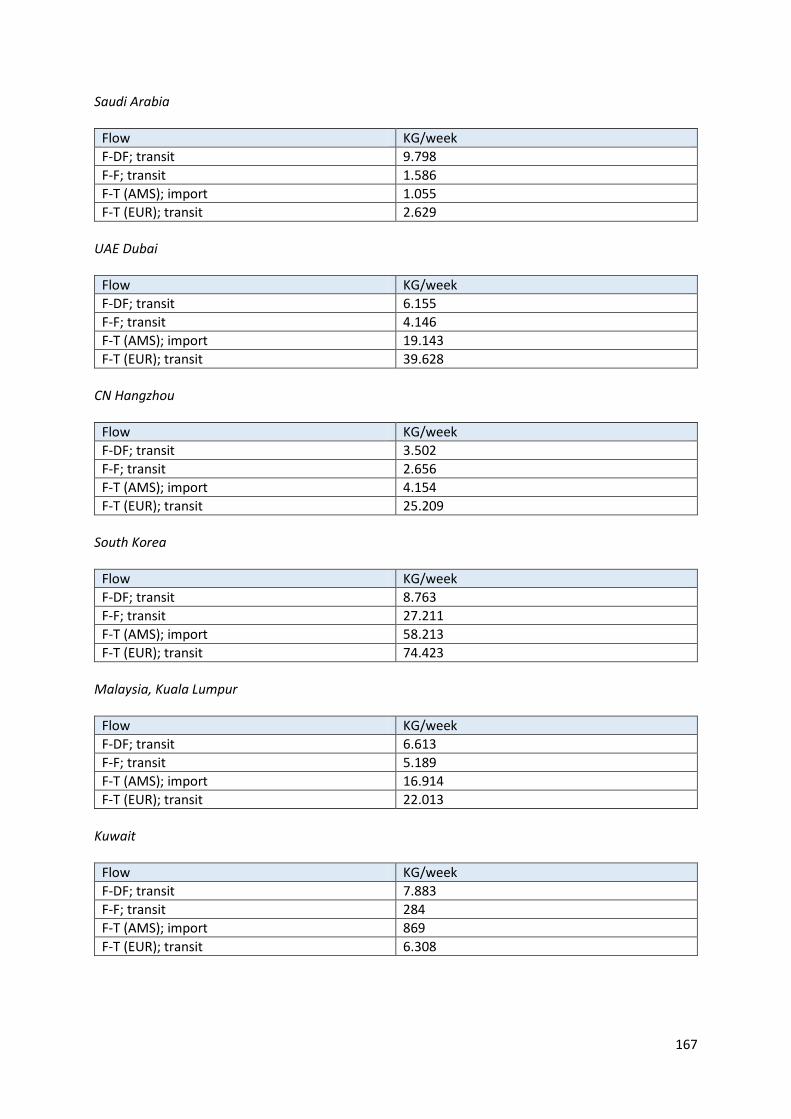
167
Saudi Arabia
Flow KG/week
F-DF; transit 9.798
F-F; transit 1.586
F-T (AMS); import 1.055
F-T (EUR); transit 2.629
UAE Dubai
Flow KG/week
F-DF; transit 6.155
F-F; transit 4.146
F-T (AMS); import 19.143
F-T (EUR); transit 39.628
CN Hangzhou
Flow KG/week
F-DF; transit 3.502
F-F; transit 2.656
F-T (AMS); import 4.154
F-T (EUR); transit 25.209
South Korea
Flow KG/week
F-DF; transit 8.763
F-F; transit 27.211
F-T (AMS); import 58.213
F-T (EUR); transit 74.423
Malaysia, Kuala Lumpur
Flow KG/week
F-DF; transit 6.613
F-F; transit 5.189
F-T (AMS); import 16.914
F-T (EUR); transit 22.013
Kuwait
Flow KG/week
F-DF; transit 7.883
F-F; transit 284
F-T (AMS); import 869
F-T (EUR); transit 6.308
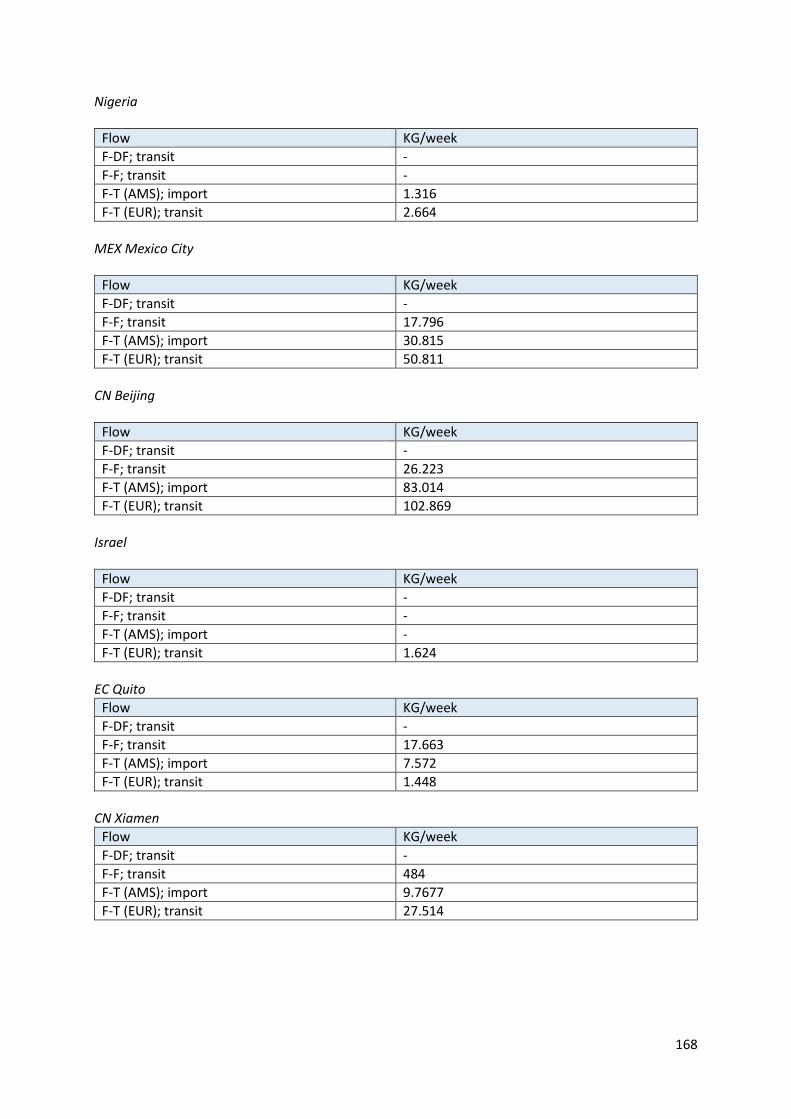
168
Nigeria
Flow KG/week
F-DF; transit -
F-F; transit -
F-T (AMS); import 1.316
F-T (EUR); transit 2.664
MEX Mexico City
Flow KG/week
F-DF; transit -
F-F; transit 17.796
F-T (AMS); import 30.815
F-T (EUR); transit 50.811
CN Beijing
Flow KG/week
F-DF; transit -
F-F; transit 26.223
F-T (AMS); import 83.014
F-T (EUR); transit 102.869
Israel
Flow KG/week
F-DF; transit -
F-F; transit -
F-T (AMS); import -
F-T (EUR); transit 1.624
EC Quito
Flow KG/week
F-DF; transit -
F-F; transit 17.663
F-T (AMS); import 7.572
F-T (EUR); transit 1.448
CN Xiamen
Flow KG/week
F-DF; transit -
F-F; transit 484
F-T (AMS); import 9.7677
F-T (EUR); transit 27.514
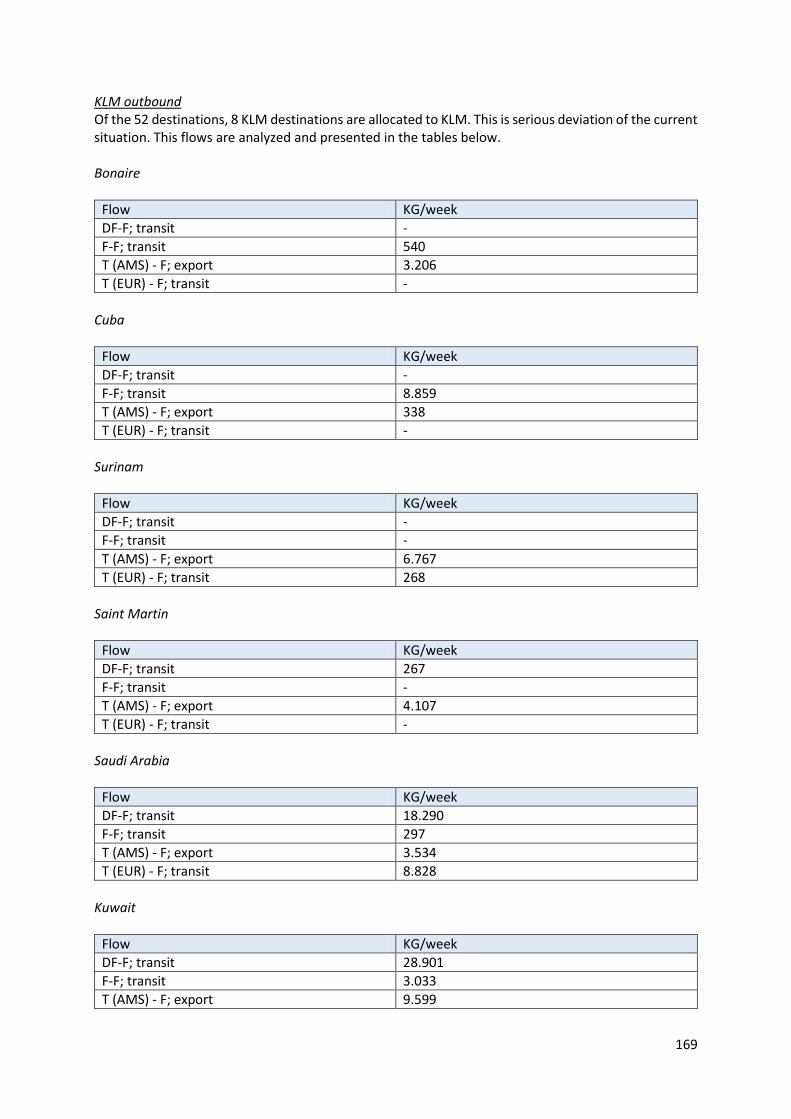
169
KLM outbound Of the 52 destinations, 8 KLM destinations are allocated to KLM. This is serious deviation of the current situation. This flows are analyzed and presented in the tables below. Bonaire
Flow KG/week
DF-F; transit -
F-F; transit 540
T (AMS) - F; export 3.206
T (EUR) - F; transit -
Cuba
Flow KG/week
DF-F; transit -
F-F; transit 8.859
T (AMS) - F; export 338
T (EUR) - F; transit -
Surinam
Flow KG/week
DF-F; transit -
F-F; transit -
T (AMS) - F; export 6.767
T (EUR) - F; transit 268
Saint Martin
Flow KG/week
DF-F; transit 267
F-F; transit -
T (AMS) - F; export 4.107
T (EUR) - F; transit -
Saudi Arabia
Flow KG/week
DF-F; transit 18.290
F-F; transit 297
T (AMS) - F; export 3.534
T (EUR) - F; transit 8.828
Kuwait
Flow KG/week
DF-F; transit 28.901
F-F; transit 3.033
T (AMS) - F; export 9.599
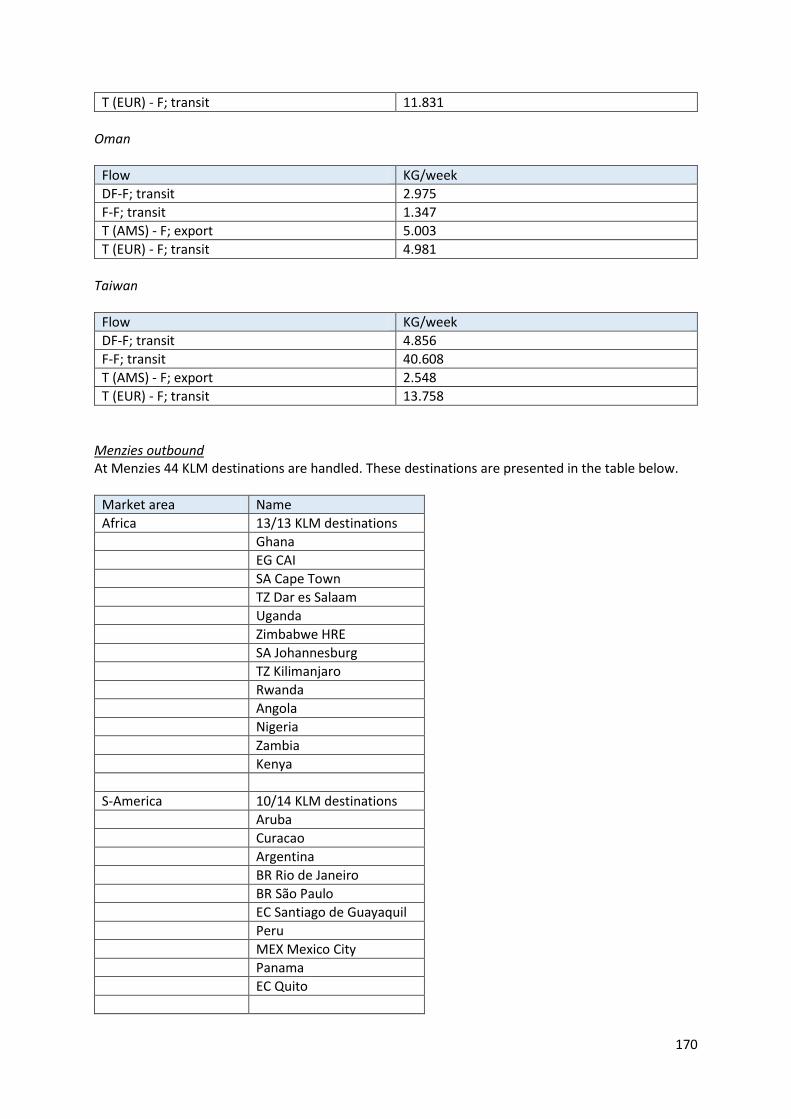
170
T (EUR) - F; transit 11.831
Oman
Flow KG/week
DF-F; transit 2.975
F-F; transit 1.347
T (AMS) - F; export 5.003
T (EUR) - F; transit 4.981
Taiwan
Flow KG/week
DF-F; transit 4.856
F-F; transit 40.608
T (AMS) - F; export 2.548
T (EUR) - F; transit 13.758
Menzies outbound At Menzies 44 KLM destinations are handled. These destinations are presented in the table below.
Market area Name
Africa 13/13 KLM destinations
Ghana
EG CAI
SA Cape Town
TZ Dar es Salaam
Uganda
Zimbabwe HRE
SA Johannesburg
TZ Kilimanjaro
Rwanda
Angola
Nigeria
Zambia
Kenya
S-America 10/14 KLM destinations
Aruba
Curacao
Argentina
BR Rio de Janeiro
BR São Paulo
EC Santiago de Guayaquil
Peru
MEX Mexico City
Panama
EC Quito
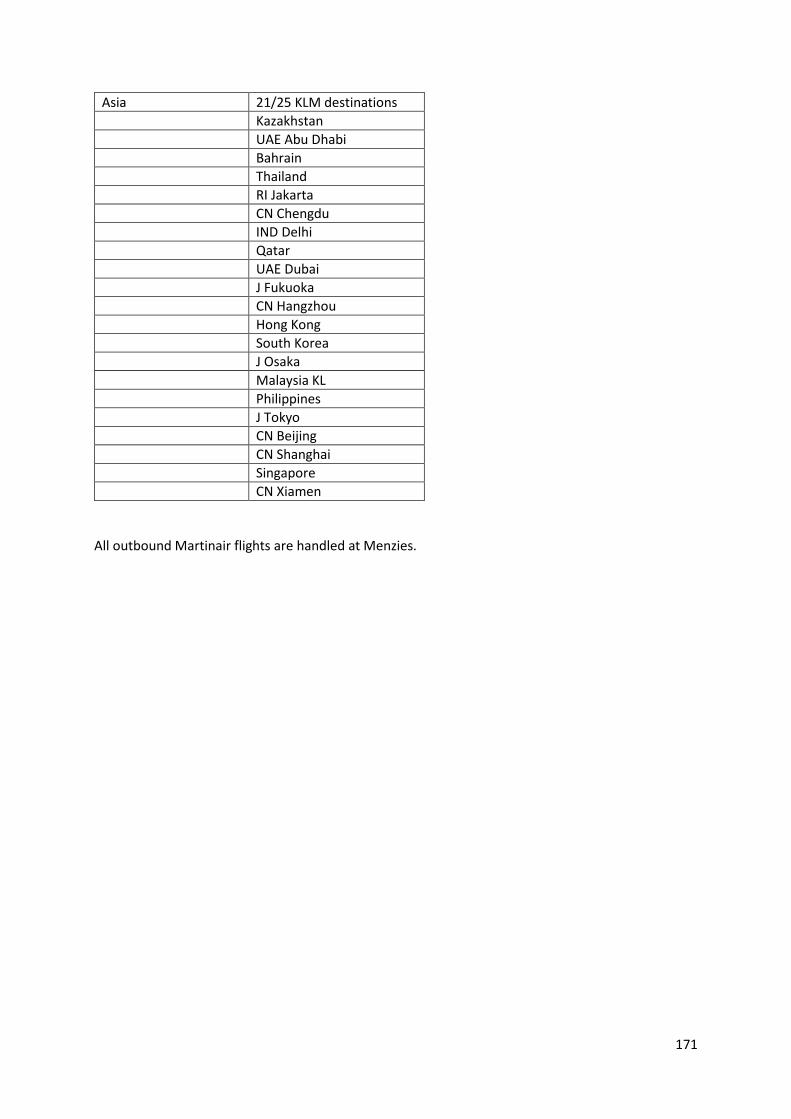
171
Asia 21/25 KLM destinations
Kazakhstan
UAE Abu Dhabi
Bahrain
Thailand
RI Jakarta
CN Chengdu
IND Delhi
Qatar
UAE Dubai
J Fukuoka
CN Hangzhou
Hong Kong
South Korea
J Osaka
Malaysia KL
Philippines
J Tokyo
CN Beijing
CN Shanghai
Singapore
CN Xiamen
All outbound Martinair flights are handled at Menzies.
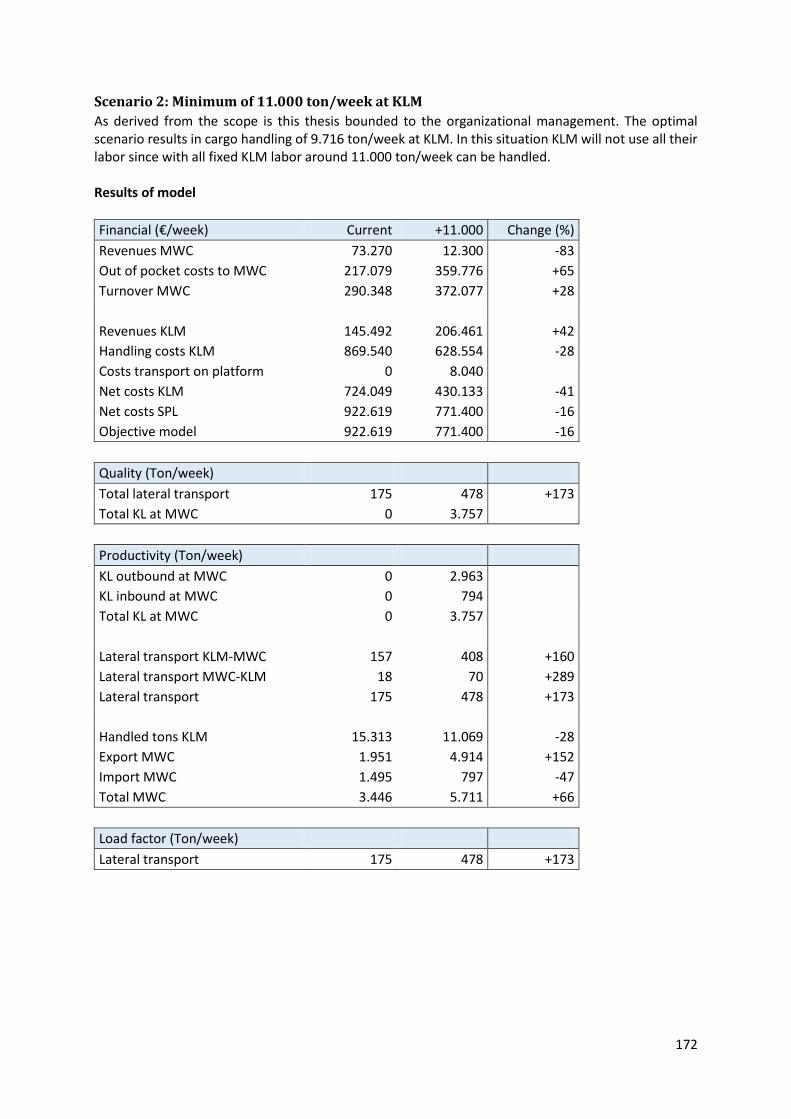
172
Scenario 2: Minimum of 11.000 ton/week at KLM
As derived from the scope is this thesis bounded to the organizational management. The optimal scenario results in cargo handling of 9.716 ton/week at KLM. In this situation KLM will not use all their labor since with all fixed KLM labor around 11.000 ton/week can be handled. Results of model
Financial (€/week) Current +11.000 Change (%)
Revenues MWC 73.270 12.300 -83
Out of pocket costs to MWC 217.079 359.776 +65
Turnover MWC 290.348 372.077 +28
Revenues KLM 145.492 206.461 +42
Handling costs KLM 869.540 628.554 -28
Costs transport on platform 0 8.040
Net costs KLM 724.049 430.133 -41
Net costs SPL 922.619 771.400 -16
Objective model 922.619 771.400 -16
Quality (Ton/week)
Total lateral transport 175 478 +173
Total KL at MWC 0 3.757
Productivity (Ton/week)
KL outbound at MWC 0 2.963
KL inbound at MWC 0 794
Total KL at MWC 0 3.757
Lateral transport KLM-MWC 157 408 +160
Lateral transport MWC-KLM 18 70 +289
Lateral transport 175 478 +173
Handled tons KLM 15.313 11.069 -28
Export MWC 1.951 4.914 +152
Import MWC 1.495 797 -47
Total MWC 3.446 5.711 +66
Load factor (Ton/week)
Lateral transport 175 478 +173
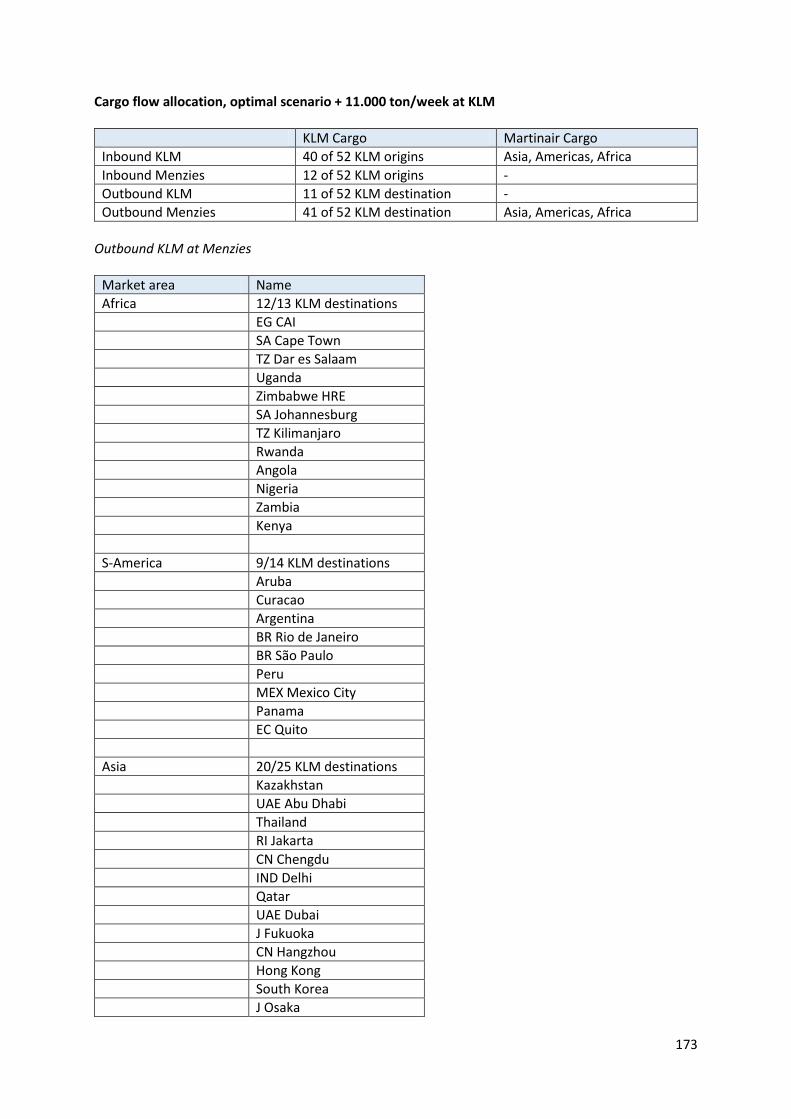
173
Cargo flow allocation, optimal scenario + 11.000 ton/week at KLM
KLM Cargo Martinair Cargo
Inbound KLM 40 of 52 KLM origins Asia, Americas, Africa
Inbound Menzies 12 of 52 KLM origins -
Outbound KLM 11 of 52 KLM destination -
Outbound Menzies 41 of 52 KLM destination Asia, Americas, Africa
Outbound KLM at Menzies
Market area Name
Africa 12/13 KLM destinations
EG CAI
SA Cape Town
TZ Dar es Salaam
Uganda
Zimbabwe HRE
SA Johannesburg
TZ Kilimanjaro
Rwanda
Angola
Nigeria
Zambia
Kenya
S-America 9/14 KLM destinations
Aruba
Curacao
Argentina
BR Rio de Janeiro
BR São Paulo
Peru
MEX Mexico City
Panama
EC Quito
Asia 20/25 KLM destinations
Kazakhstan
UAE Abu Dhabi
Thailand
RI Jakarta
CN Chengdu
IND Delhi
Qatar
UAE Dubai
J Fukuoka
CN Hangzhou
Hong Kong
South Korea
J Osaka
174
Malaysia KL
Philippines
J Tokyo
CN Beijing
CN Shanghai
Singapore
CN Xiamen
Interesting results of optimal scenario + 11.000 ton/week at KLM Inbound
- 12 KLM origins at Menzies - Inbound MP Americas and Africa at KLM - Inbound MP Asia at MWC
Outbound
- 41 KLM destinations at Menzies - All MP outbound at Menzies
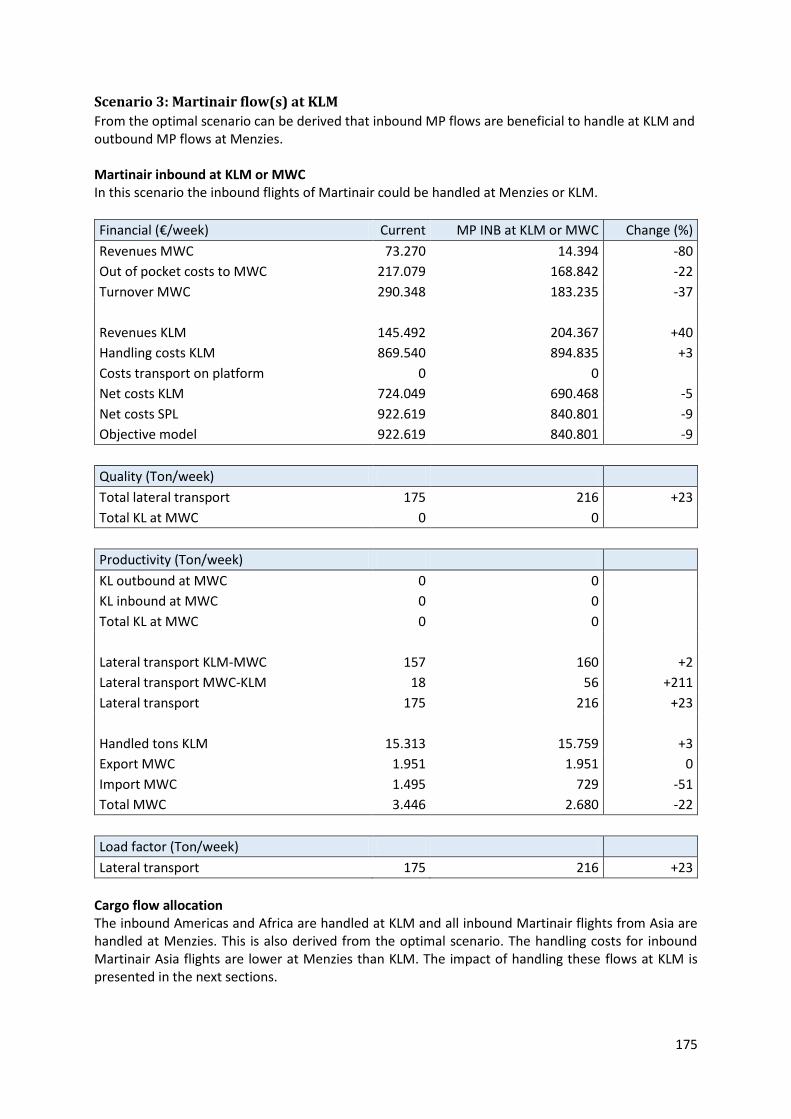
175
Scenario 3: Martinair flow(s) at KLM
From the optimal scenario can be derived that inbound MP flows are beneficial to handle at KLM and outbound MP flows at Menzies. Martinair inbound at KLM or MWC In this scenario the inbound flights of Martinair could be handled at Menzies or KLM.
Financial (€/week) Current MP INB at KLM or MWC Change (%)
Revenues MWC 73.270 14.394 -80
Out of pocket costs to MWC 217.079 168.842 -22
Turnover MWC 290.348 183.235 -37
Revenues KLM 145.492 204.367 +40
Handling costs KLM 869.540 894.835 +3
Costs transport on platform 0 0
Net costs KLM 724.049 690.468 -5
Net costs SPL 922.619 840.801 -9
Objective model 922.619 840.801 -9
Quality (Ton/week)
Total lateral transport 175 216 +23
Total KL at MWC 0 0
Productivity (Ton/week)
KL outbound at MWC 0 0
KL inbound at MWC 0 0
Total KL at MWC 0 0
Lateral transport KLM-MWC 157 160 +2
Lateral transport MWC-KLM 18 56 +211
Lateral transport 175 216 +23
Handled tons KLM 15.313 15.759 +3
Export MWC 1.951 1.951 0
Import MWC 1.495 729 -51
Total MWC 3.446 2.680 -22
Load factor (Ton/week)
Lateral transport 175 216 +23
Cargo flow allocation The inbound Americas and Africa are handled at KLM and all inbound Martinair flights from Asia are handled at Menzies. This is also derived from the optimal scenario. The handling costs for inbound Martinair Asia flights are lower at Menzies than KLM. The impact of handling these flows at KLM is presented in the next sections.
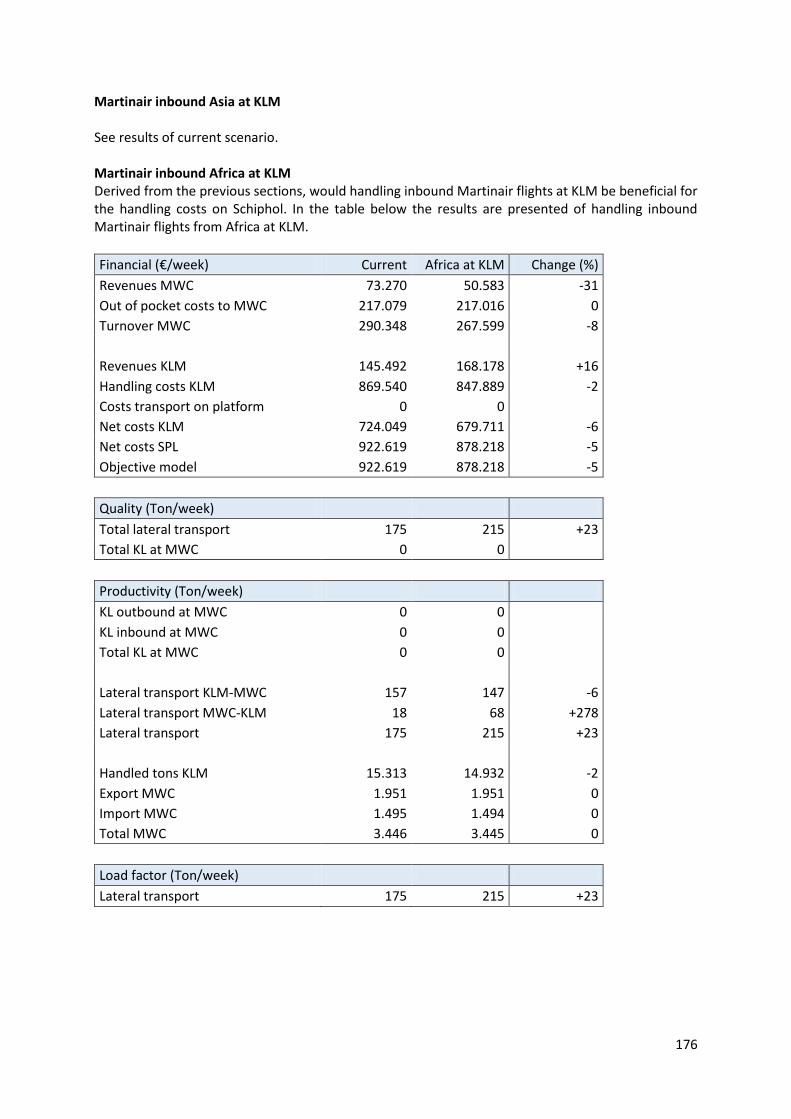
176
Martinair inbound Asia at KLM See results of current scenario. Martinair inbound Africa at KLM Derived from the previous sections, would handling inbound Martinair flights at KLM be beneficial for the handling costs on Schiphol. In the table below the results are presented of handling inbound Martinair flights from Africa at KLM.
Financial (€/week) Current Africa at KLM Change (%)
Revenues MWC 73.270 50.583 -31
Out of pocket costs to MWC 217.079 217.016 0
Turnover MWC 290.348 267.599 -8
Revenues KLM 145.492 168.178 +16
Handling costs KLM 869.540 847.889 -2
Costs transport on platform 0 0
Net costs KLM 724.049 679.711 -6
Net costs SPL 922.619 878.218 -5
Objective model 922.619 878.218 -5
Quality (Ton/week)
Total lateral transport 175 215 +23
Total KL at MWC 0 0
Productivity (Ton/week)
KL outbound at MWC 0 0
KL inbound at MWC 0 0
Total KL at MWC 0 0
Lateral transport KLM-MWC 157 147 -6
Lateral transport MWC-KLM 18 68 +278
Lateral transport 175 215 +23
Handled tons KLM 15.313 14.932 -2
Export MWC 1.951 1.951 0
Import MWC 1.495 1.494 0
Total MWC 3.446 3.445 0
Load factor (Ton/week)
Lateral transport 175 215 +23
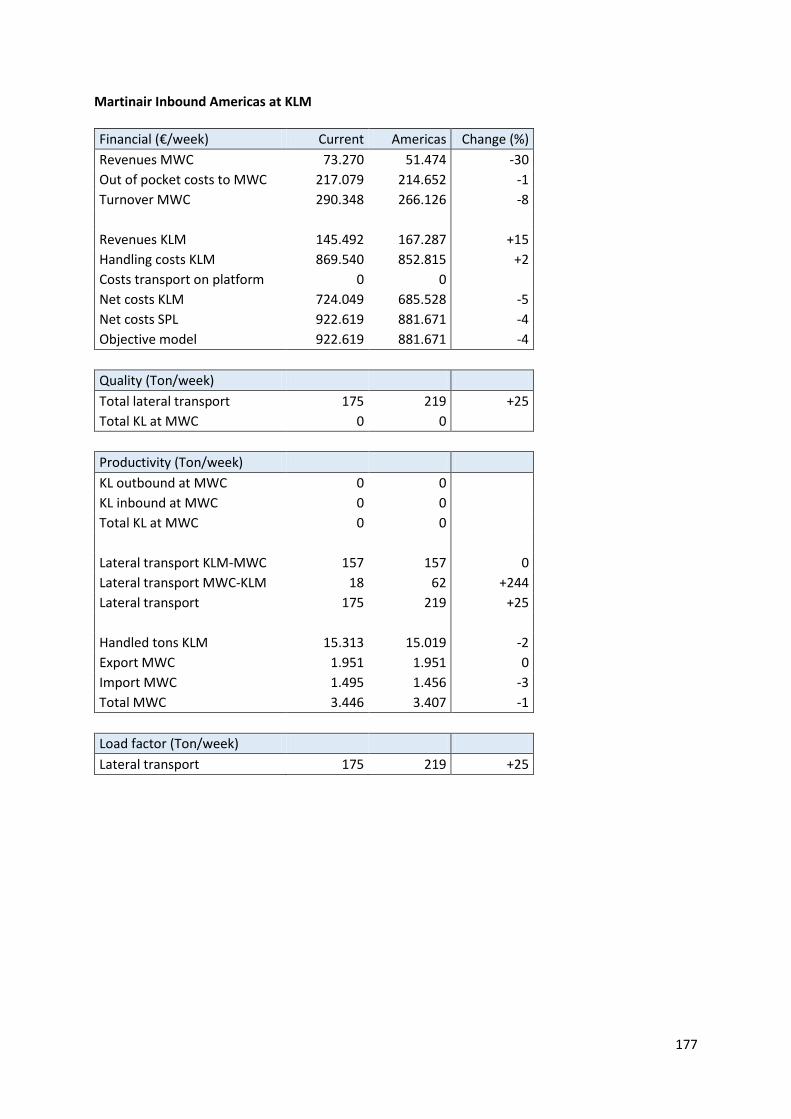
177
Martinair Inbound Americas at KLM
Financial (€/week) Current Americas Change (%)
Revenues MWC 73.270 51.474 -30
Out of pocket costs to MWC 217.079 214.652 -1
Turnover MWC 290.348 266.126 -8
Revenues KLM 145.492 167.287 +15
Handling costs KLM 869.540 852.815 +2
Costs transport on platform 0 0
Net costs KLM 724.049 685.528 -5
Net costs SPL 922.619 881.671 -4
Objective model 922.619 881.671 -4
Quality (Ton/week)
Total lateral transport 175 219 +25
Total KL at MWC 0 0
Productivity (Ton/week)
KL outbound at MWC 0 0
KL inbound at MWC 0 0
Total KL at MWC 0 0
Lateral transport KLM-MWC 157 157 0
Lateral transport MWC-KLM 18 62 +244
Lateral transport 175 219 +25
Handled tons KLM 15.313 15.019 -2
Export MWC 1.951 1.951 0
Import MWC 1.495 1.456 -3
Total MWC 3.446 3.407 -1
Load factor (Ton/week)
Lateral transport 175 219 +25
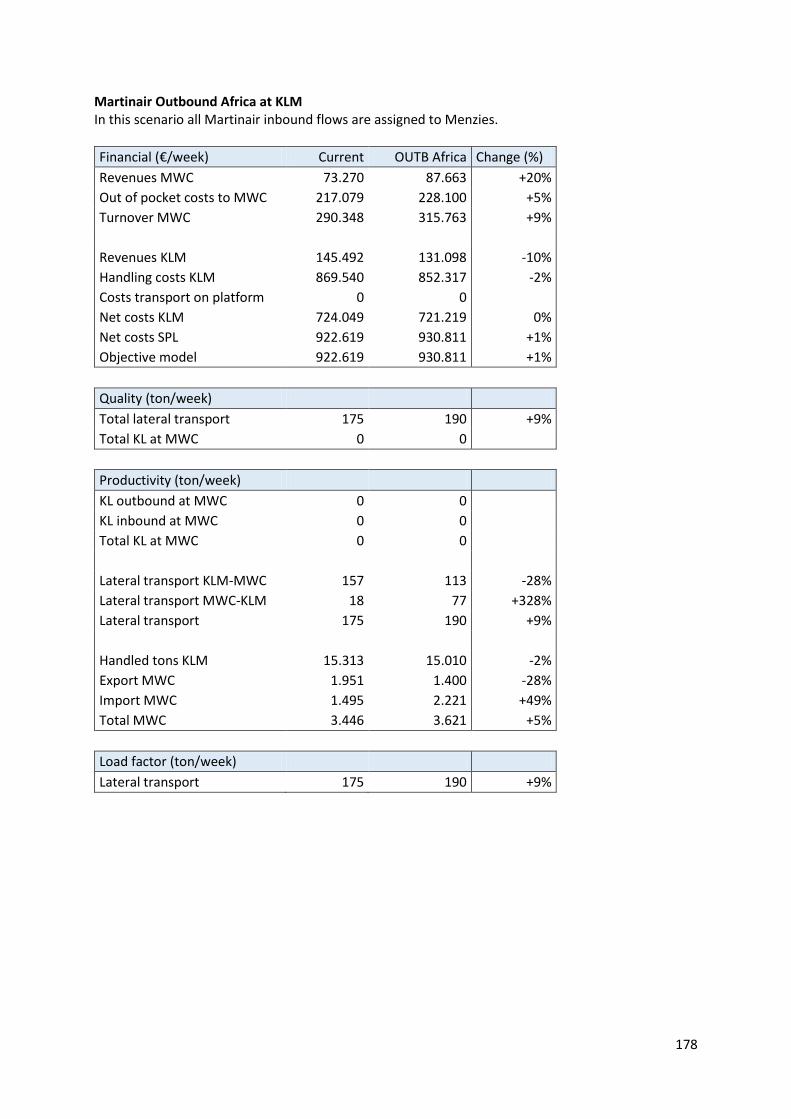
178
Martinair Outbound Africa at KLM In this scenario all Martinair inbound flows are assigned to Menzies.
Financial (€/week) Current OUTB Africa Change (%)
Revenues MWC 73.270 87.663 +20%
Out of pocket costs to MWC 217.079 228.100 +5%
Turnover MWC 290.348 315.763 +9%
Revenues KLM 145.492 131.098 -10%
Handling costs KLM 869.540 852.317 -2%
Costs transport on platform 0 0
Net costs KLM 724.049 721.219 0%
Net costs SPL 922.619 930.811 +1%
Objective model 922.619 930.811 +1%
Quality (ton/week)
Total lateral transport 175 190 +9%
Total KL at MWC 0 0
Productivity (ton/week)
KL outbound at MWC 0 0
KL inbound at MWC 0 0
Total KL at MWC 0 0
Lateral transport KLM-MWC 157 113 -28%
Lateral transport MWC-KLM 18 77 +328%
Lateral transport 175 190 +9%
Handled tons KLM 15.313 15.010 -2%
Export MWC 1.951 1.400 -28%
Import MWC 1.495 2.221 +49%
Total MWC 3.446 3.621 +5%
Load factor (ton/week)
Lateral transport 175 190 +9%
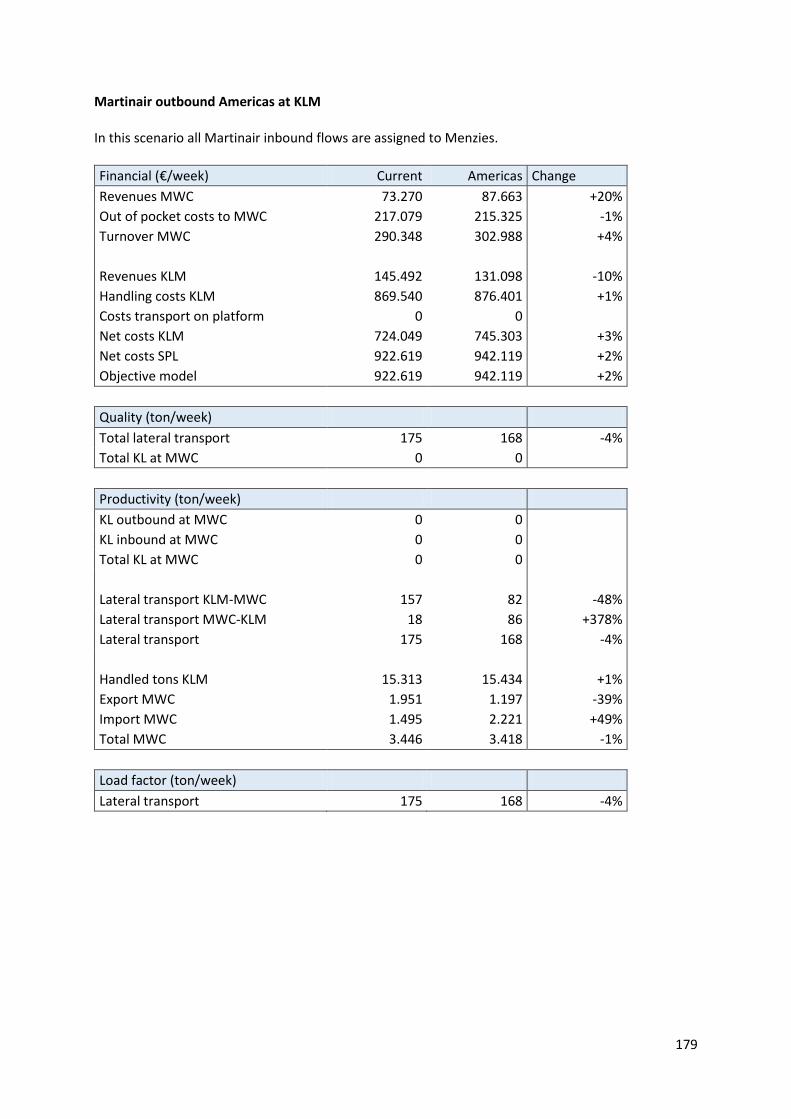
179
Martinair outbound Americas at KLM
In this scenario all Martinair inbound flows are assigned to Menzies.
Financial (€/week) Current Americas Change
Revenues MWC 73.270 87.663 +20%
Out of pocket costs to MWC 217.079 215.325 -1%
Turnover MWC 290.348 302.988 +4%
Revenues KLM 145.492 131.098 -10%
Handling costs KLM 869.540 876.401 +1%
Costs transport on platform 0 0
Net costs KLM 724.049 745.303 +3%
Net costs SPL 922.619 942.119 +2%
Objective model 922.619 942.119 +2%
Quality (ton/week)
Total lateral transport 175 168 -4%
Total KL at MWC 0 0
Productivity (ton/week)
KL outbound at MWC 0 0
KL inbound at MWC 0 0
Total KL at MWC 0 0
Lateral transport KLM-MWC 157 82 -48%
Lateral transport MWC-KLM 18 86 +378%
Lateral transport 175 168 -4%
Handled tons KLM 15.313 15.434 +1%
Export MWC 1.951 1.197 -39%
Import MWC 1.495 2.221 +49%
Total MWC 3.446 3.418 -1%
Load factor (ton/week)
Lateral transport 175 168 -4%
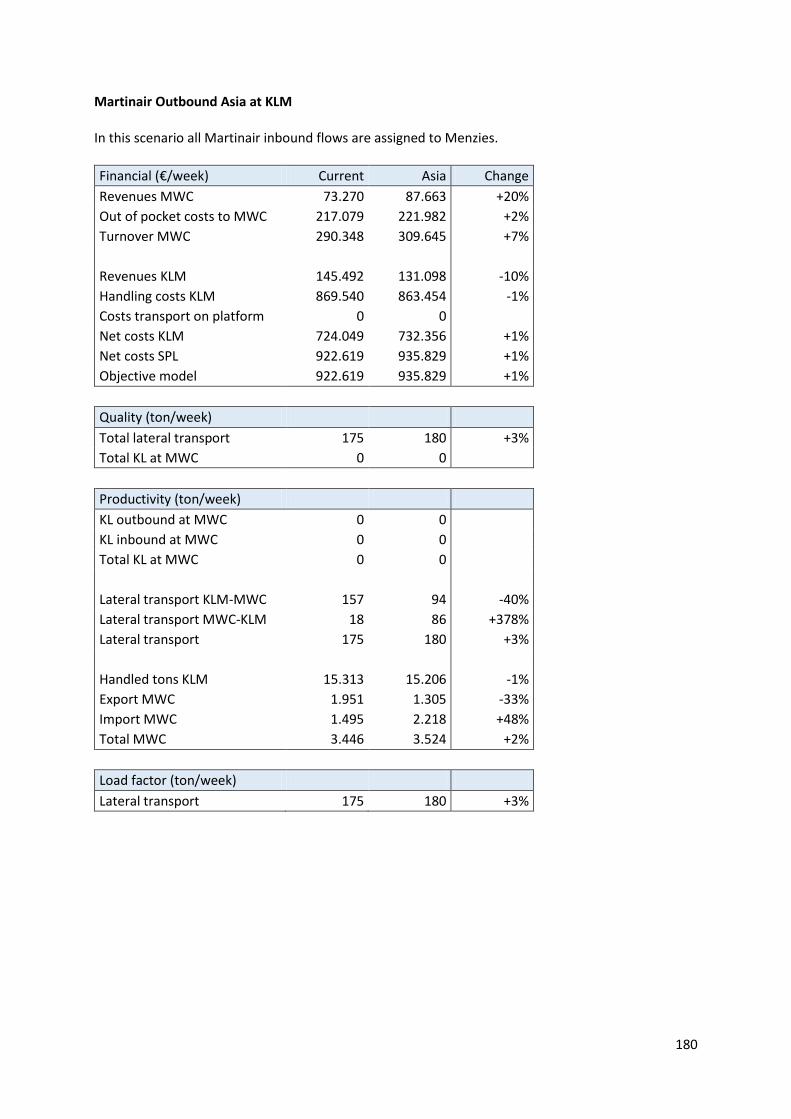
180
Martinair Outbound Asia at KLM
In this scenario all Martinair inbound flows are assigned to Menzies.
Financial (€/week) Current Asia Change
Revenues MWC 73.270 87.663 +20%
Out of pocket costs to MWC 217.079 221.982 +2%
Turnover MWC 290.348 309.645 +7%
Revenues KLM 145.492 131.098 -10%
Handling costs KLM 869.540 863.454 -1%
Costs transport on platform 0 0
Net costs KLM 724.049 732.356 +1%
Net costs SPL 922.619 935.829 +1%
Objective model 922.619 935.829 +1%
Quality (ton/week)
Total lateral transport 175 180 +3%
Total KL at MWC 0 0
Productivity (ton/week)
KL outbound at MWC 0 0
KL inbound at MWC 0 0
Total KL at MWC 0 0
Lateral transport KLM-MWC 157 94 -40%
Lateral transport MWC-KLM 18 86 +378%
Lateral transport 175 180 +3%
Handled tons KLM 15.313 15.206 -1%
Export MWC 1.951 1.305 -33%
Import MWC 1.495 2.218 +48%
Total MWC 3.446 3.524 +2%
Load factor (ton/week)
Lateral transport 175 180 +3%
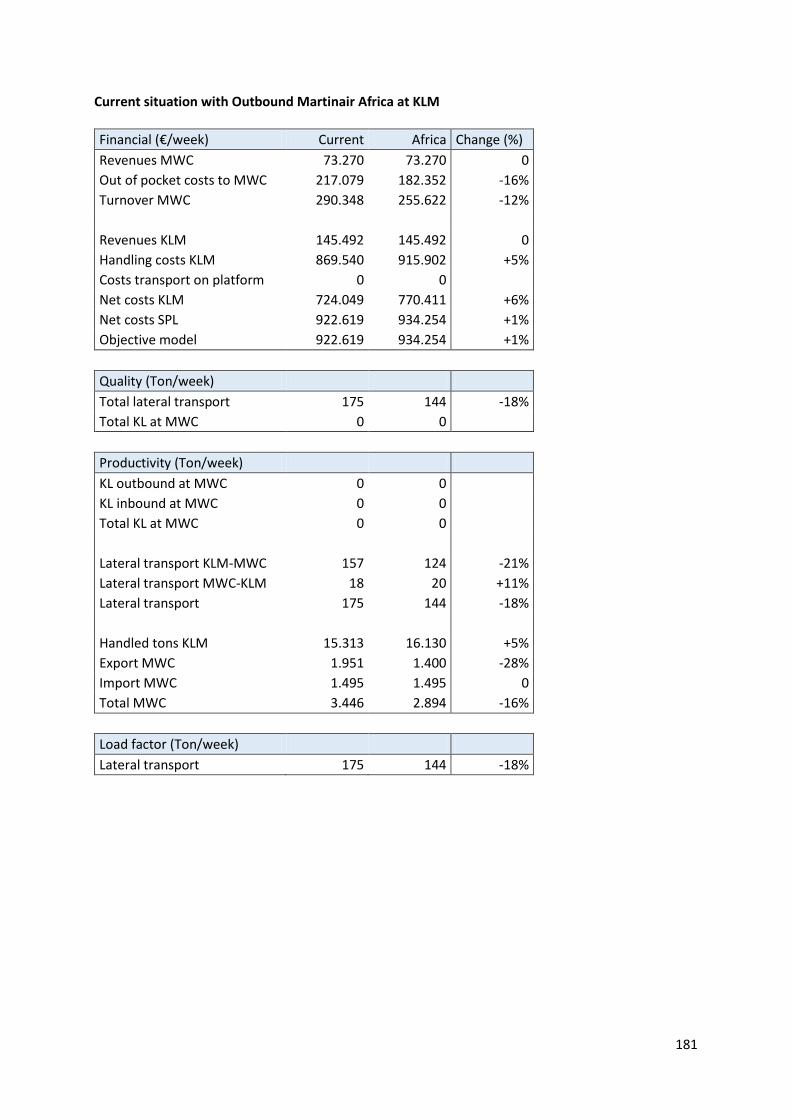
181
Current situation with Outbound Martinair Africa at KLM
Financial (€/week) Current Africa Change (%)
Revenues MWC 73.270 73.270 0
Out of pocket costs to MWC 217.079 182.352 -16%
Turnover MWC 290.348 255.622 -12%
Revenues KLM 145.492 145.492 0
Handling costs KLM 869.540 915.902 +5%
Costs transport on platform 0 0
Net costs KLM 724.049 770.411 +6%
Net costs SPL 922.619 934.254 +1%
Objective model 922.619 934.254 +1%
Quality (Ton/week)
Total lateral transport 175 144 -18%
Total KL at MWC 0 0
Productivity (Ton/week)
KL outbound at MWC 0 0
KL inbound at MWC 0 0
Total KL at MWC 0 0
Lateral transport KLM-MWC 157 124 -21%
Lateral transport MWC-KLM 18 20 +11%
Lateral transport 175 144 -18%
Handled tons KLM 15.313 16.130 +5%
Export MWC 1.951 1.400 -28%
Import MWC 1.495 1.495 0
Total MWC 3.446 2.894 -16%
Load factor (Ton/week)
Lateral transport 175 144 -18%

182
Current with Martinair Americas outbound at KLM
Financial (€/week) Current Americas Change (%)
Revenues MWC 73.270 73.270 0
Out of pocket costs to MWC 217.079 169.576 -22%
Turnover MWC 290.348 242.846 -16%
Revenues KLM 145.492 145.492 0
Handling costs KLM 869.540 939.538 +8%
Costs transport on platform 0 0
Net costs KLM 724.049 794.047 +10%
Net costs SPL 922.619 945.114 +2%
Objective model 922.619 945.114 +2%
Quality (Ton/week)
Total lateral transport 175 105 -40%
Total KL at MWC 0 0
Productivity (Ton/week)
KL outbound at MWC 0 0
KL inbound at MWC 0 0
Total KL at MWC 0 0
Lateral transport KLM-MWC 157 85 -46%
Lateral transport MWC-KLM 18 20 +11%
Lateral transport 175 105 -40%
Handled tons KLM 15.313 16.546 +8%
Export MWC 1.951 1.197 -39%
Import MWC 1.495 1.495 0
Total MWC 3.446 2.692 -22%
Load factor (Ton/week)
Lateral transport 175 105 -40%
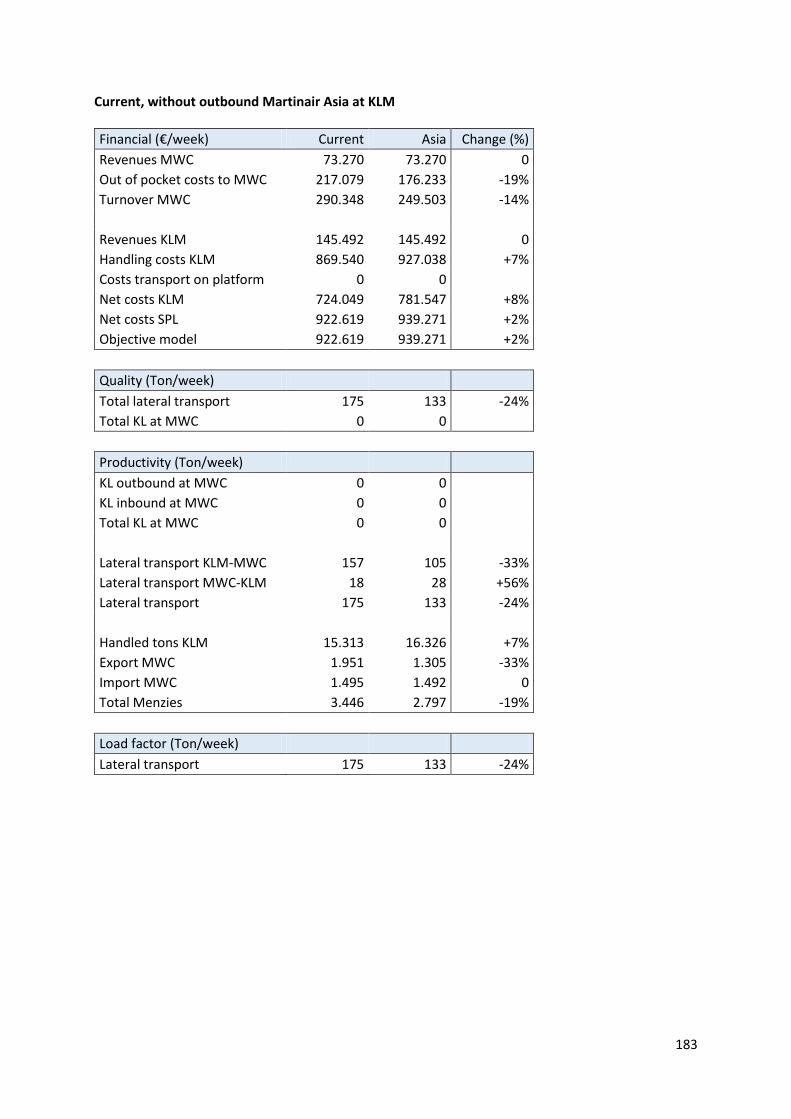
183
Current, without outbound Martinair Asia at KLM
Financial (€/week) Current Asia Change (%)
Revenues MWC 73.270 73.270 0
Out of pocket costs to MWC 217.079 176.233 -19%
Turnover MWC 290.348 249.503 -14%
Revenues KLM 145.492 145.492 0
Handling costs KLM 869.540 927.038 +7%
Costs transport on platform 0 0
Net costs KLM 724.049 781.547 +8%
Net costs SPL 922.619 939.271 +2%
Objective model 922.619 939.271 +2%
Quality (Ton/week)
Total lateral transport 175 133 -24%
Total KL at MWC 0 0
Productivity (Ton/week)
KL outbound at MWC 0 0
KL inbound at MWC 0 0
Total KL at MWC 0 0
Lateral transport KLM-MWC 157 105 -33%
Lateral transport MWC-KLM 18 28 +56%
Lateral transport 175 133 -24%
Handled tons KLM 15.313 16.326 +7%
Export MWC 1.951 1.305 -33%
Import MWC 1.495 1.492 0
Total Menzies 3.446 2.797 -19%
Load factor (Ton/week)
Lateral transport 175 133 -24%
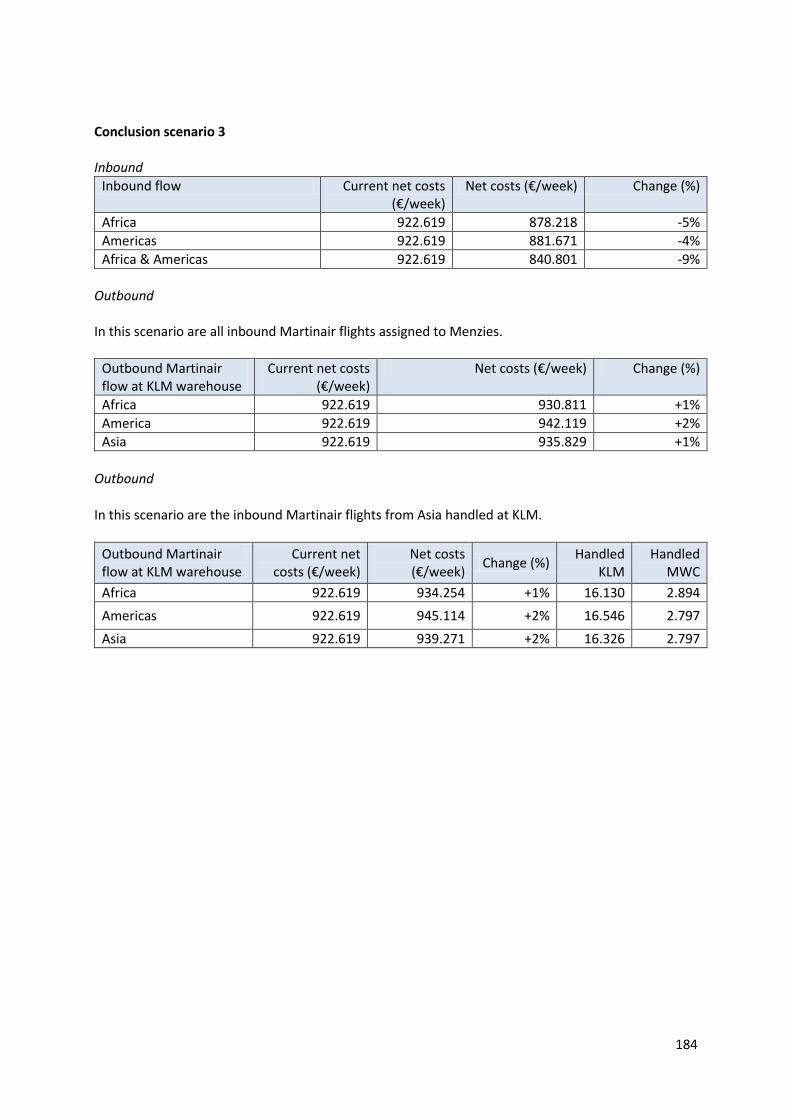
184
Conclusion scenario 3 Inbound
Inbound flow Current net costs (€/week)
Net costs (€/week) Change (%)
Africa 922.619 878.218 -5%
Americas 922.619 881.671 -4%
Africa & Americas 922.619 840.801 -9%
Outbound In this scenario are all inbound Martinair flights assigned to Menzies.
Outbound Martinair flow at KLM warehouse
Current net costs (€/week)
Net costs (€/week) Change (%)
Africa 922.619 930.811 +1%
America 922.619 942.119 +2%
Asia 922.619 935.829 +1%
Outbound
In this scenario are the inbound Martinair flights from Asia handled at KLM.
Outbound Martinair flow at KLM warehouse
Current net costs (€/week)
Net costs (€/week)
Change (%) Handled
KLM Handled
MWC
Africa 922.619 934.254 +1% 16.130 2.894
Americas 922.619 945.114 +2% 16.546 2.797
Asia 922.619 939.271 +2% 16.326 2.797
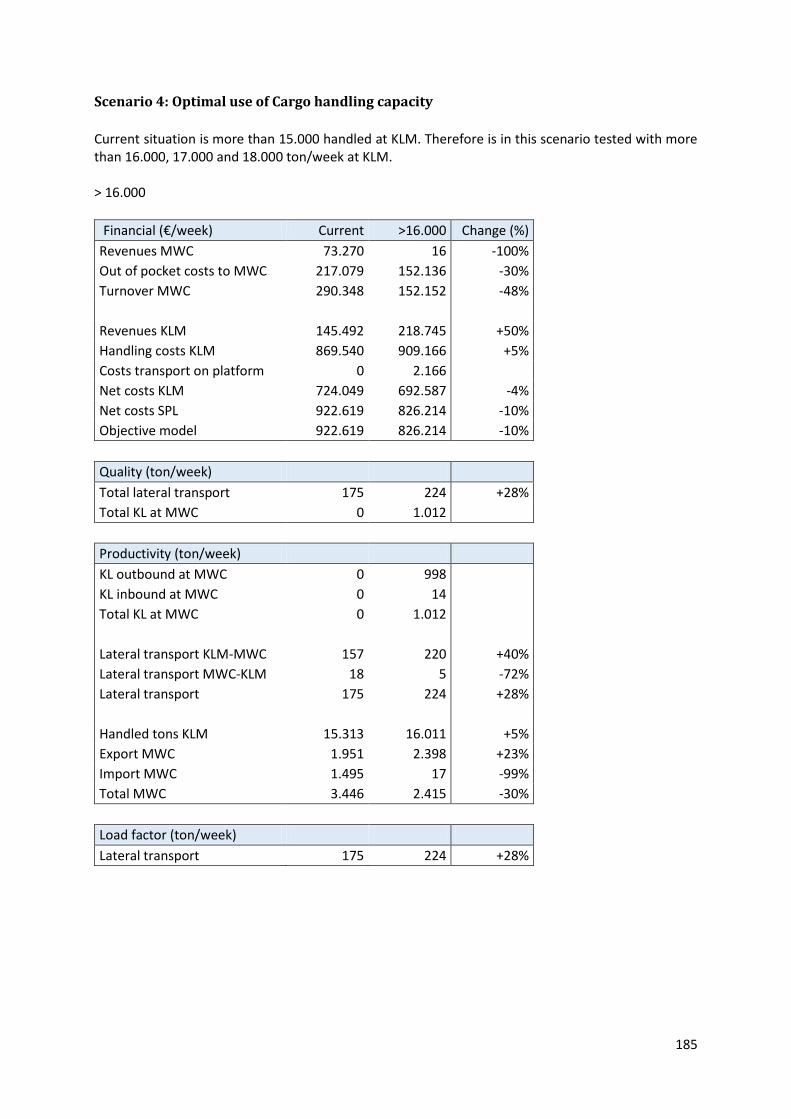
185
Scenario 4: Optimal use of Cargo handling capacity
Current situation is more than 15.000 handled at KLM. Therefore is in this scenario tested with more than 16.000, 17.000 and 18.000 ton/week at KLM. > 16.000
Financial (€/week) Current >16.000 Change (%)
Revenues MWC 73.270 16 -100%
Out of pocket costs to MWC 217.079 152.136 -30%
Turnover MWC 290.348 152.152 -48%
Revenues KLM 145.492 218.745 +50%
Handling costs KLM 869.540 909.166 +5%
Costs transport on platform 0 2.166
Net costs KLM 724.049 692.587 -4%
Net costs SPL 922.619 826.214 -10%
Objective model 922.619 826.214 -10%
Quality (ton/week)
Total lateral transport 175 224 +28%
Total KL at MWC 0 1.012
Productivity (ton/week)
KL outbound at MWC 0 998
KL inbound at MWC 0 14
Total KL at MWC 0 1.012
Lateral transport KLM-MWC 157 220 +40%
Lateral transport MWC-KLM 18 5 -72%
Lateral transport 175 224 +28%
Handled tons KLM 15.313 16.011 +5%
Export MWC 1.951 2.398 +23%
Import MWC 1.495 17 -99%
Total MWC 3.446 2.415 -30%
Load factor (ton/week)
Lateral transport 175 224 +28%
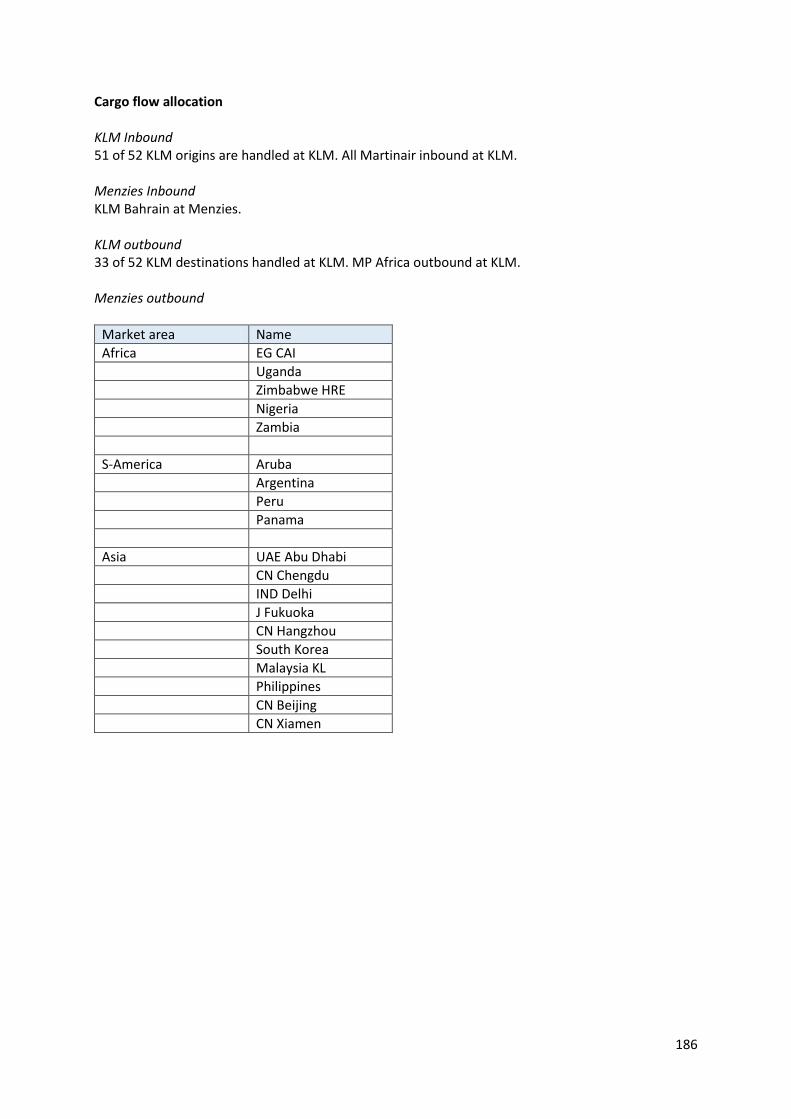
186
Cargo flow allocation KLM Inbound 51 of 52 KLM origins are handled at KLM. All Martinair inbound at KLM. Menzies Inbound KLM Bahrain at Menzies. KLM outbound 33 of 52 KLM destinations handled at KLM. MP Africa outbound at KLM. Menzies outbound
Market area Name
Africa EG CAI
Uganda
Zimbabwe HRE
Nigeria
Zambia
S-America Aruba
Argentina
Peru
Panama
Asia UAE Abu Dhabi
CN Chengdu
IND Delhi
J Fukuoka
CN Hangzhou
South Korea
Malaysia KL
Philippines
CN Beijing
CN Xiamen
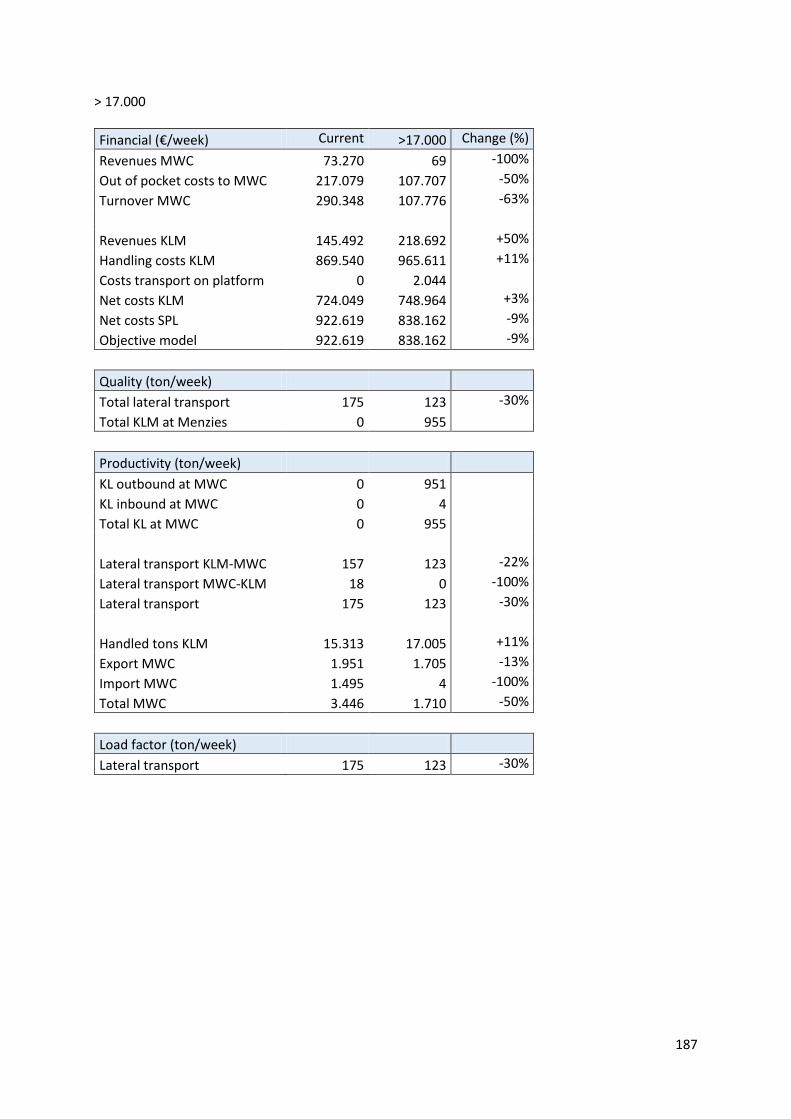
187
> 17.000
Financial (€/week) Current >17.000 Change (%)
Revenues MWC 73.270 69 -100%
Out of pocket costs to MWC 217.079 107.707 -50%
Turnover MWC 290.348 107.776 -63%
Revenues KLM 145.492 218.692 +50%
Handling costs KLM 869.540 965.611 +11%
Costs transport on platform 0 2.044
Net costs KLM 724.049 748.964 +3%
Net costs SPL 922.619 838.162 -9%
Objective model 922.619 838.162 -9%
Quality (ton/week)
Total lateral transport 175 123 -30%
Total KLM at Menzies 0 955
Productivity (ton/week)
KL outbound at MWC 0 951
KL inbound at MWC 0 4
Total KL at MWC 0 955
Lateral transport KLM-MWC 157 123 -22%
Lateral transport MWC-KLM 18 0 -100%
Lateral transport 175 123 -30%
Handled tons KLM 15.313 17.005 +11%
Export MWC 1.951 1.705 -13%
Import MWC 1.495 4 -100%
Total MWC 3.446 1.710 -50%
Load factor (ton/week)
Lateral transport 175 123 -30%
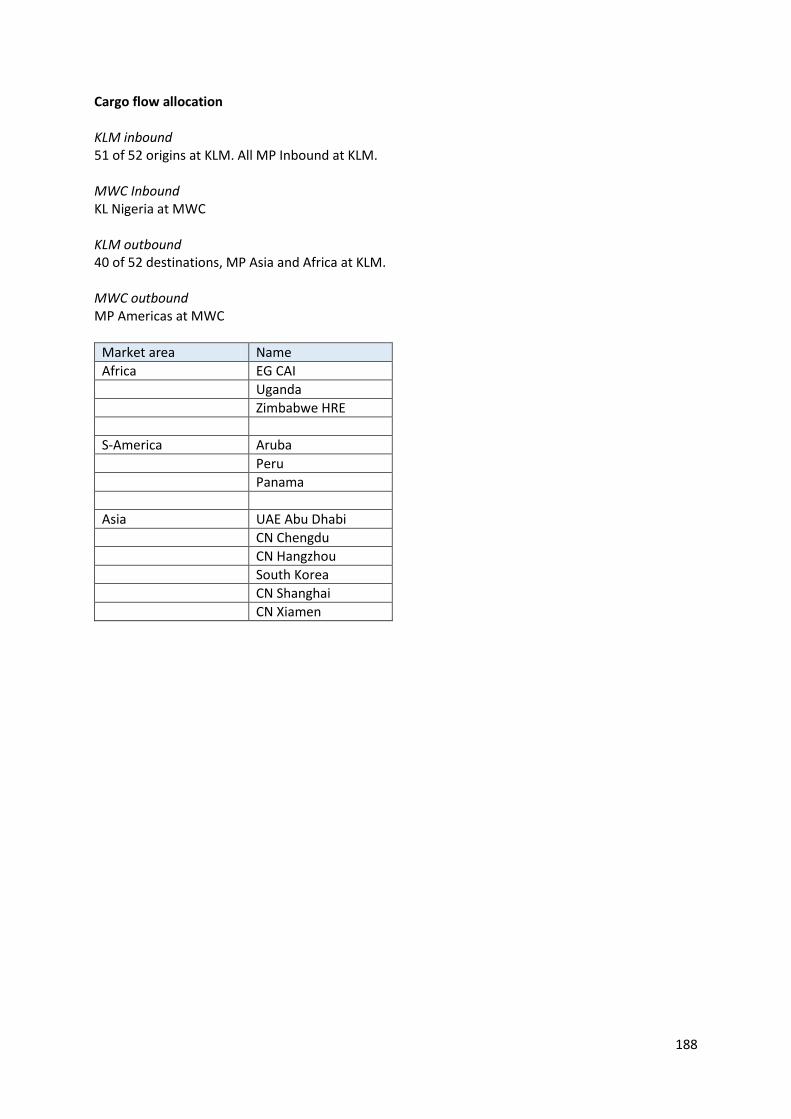
188
Cargo flow allocation KLM inbound 51 of 52 origins at KLM. All MP Inbound at KLM. MWC Inbound KL Nigeria at MWC KLM outbound 40 of 52 destinations, MP Asia and Africa at KLM. MWC outbound MP Americas at MWC
Market area Name
Africa EG CAI
Uganda
Zimbabwe HRE
S-America Aruba
Peru
Panama
Asia UAE Abu Dhabi
CN Chengdu
CN Hangzhou
South Korea
CN Shanghai
CN Xiamen
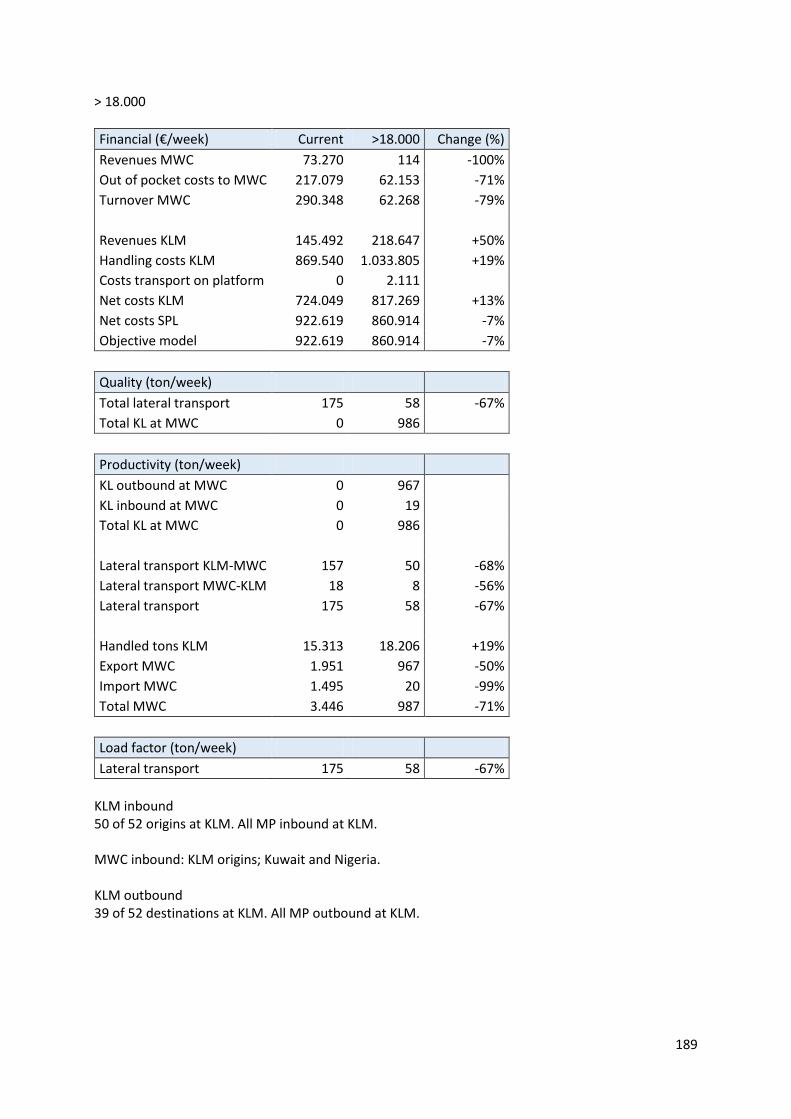
189
> 18.000
Financial (€/week) Current >18.000 Change (%)
Revenues MWC 73.270 114 -100%
Out of pocket costs to MWC 217.079 62.153 -71%
Turnover MWC 290.348 62.268 -79%
Revenues KLM 145.492 218.647 +50%
Handling costs KLM 869.540 1.033.805 +19%
Costs transport on platform 0 2.111
Net costs KLM 724.049 817.269 +13%
Net costs SPL 922.619 860.914 -7%
Objective model 922.619 860.914 -7%
Quality (ton/week)
Total lateral transport 175 58 -67%
Total KL at MWC 0 986
Productivity (ton/week)
KL outbound at MWC 0 967
KL inbound at MWC 0 19
Total KL at MWC 0 986
Lateral transport KLM-MWC 157 50 -68%
Lateral transport MWC-KLM 18 8 -56%
Lateral transport 175 58 -67%
Handled tons KLM 15.313 18.206 +19%
Export MWC 1.951 967 -50%
Import MWC 1.495 20 -99%
Total MWC 3.446 987 -71%
Load factor (ton/week)
Lateral transport 175 58 -67%
KLM inbound 50 of 52 origins at KLM. All MP inbound at KLM. MWC inbound: KLM origins; Kuwait and Nigeria. KLM outbound 39 of 52 destinations at KLM. All MP outbound at KLM.
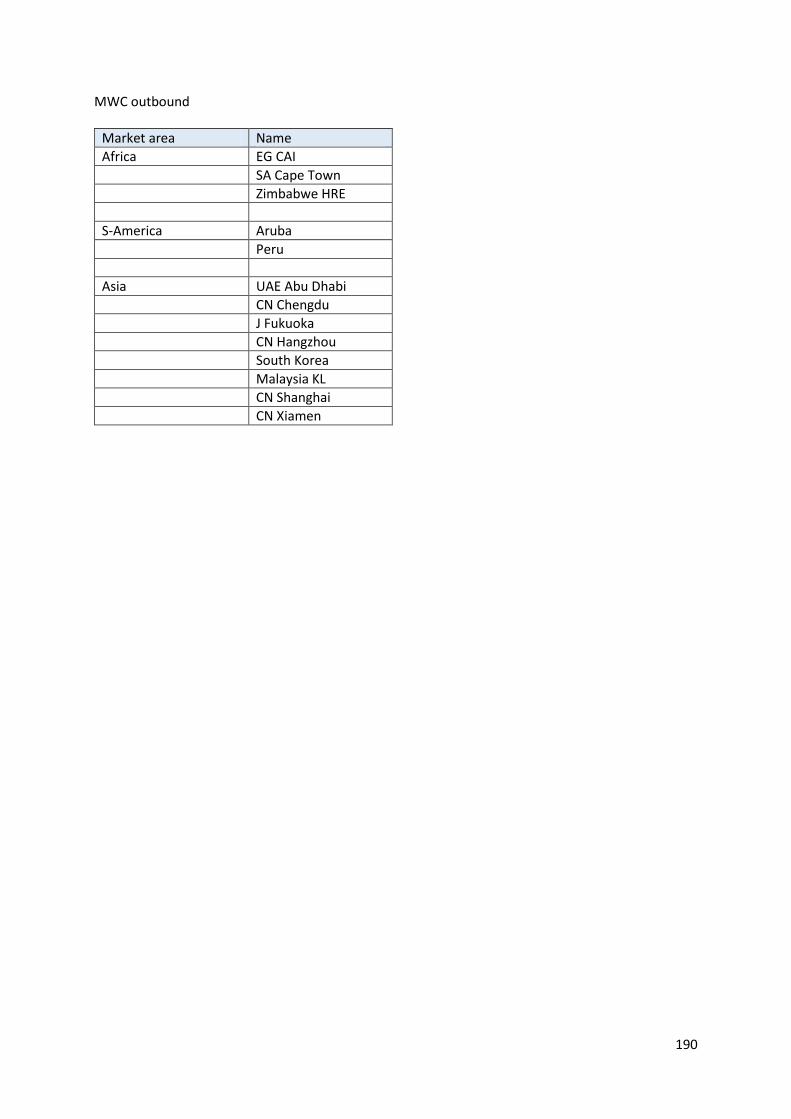
190
MWC outbound
Market area Name
Africa EG CAI
SA Cape Town
Zimbabwe HRE
S-America Aruba
Peru
Asia UAE Abu Dhabi
CN Chengdu
J Fukuoka
CN Hangzhou
South Korea
Malaysia KL
CN Shanghai
CN Xiamen
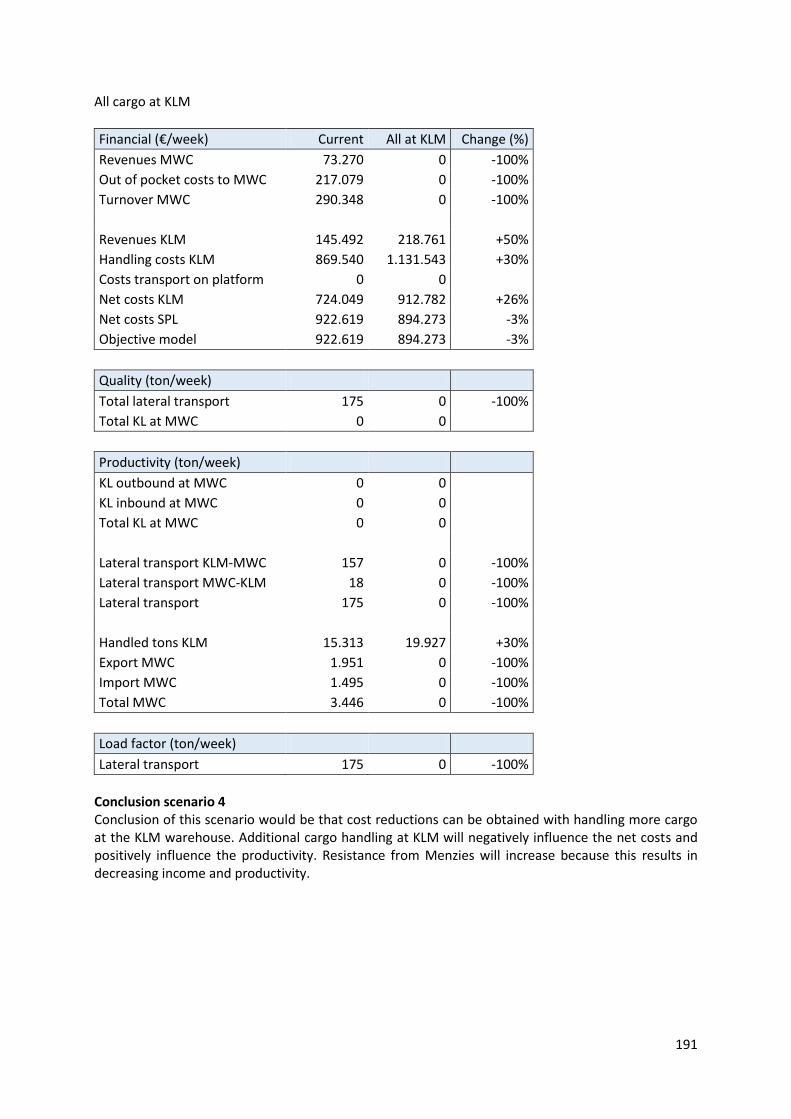
191
All cargo at KLM
Financial (€/week) Current All at KLM Change (%)
Revenues MWC 73.270 0 -100%
Out of pocket costs to MWC 217.079 0 -100%
Turnover MWC 290.348 0 -100%
Revenues KLM 145.492 218.761 +50%
Handling costs KLM 869.540 1.131.543 +30%
Costs transport on platform 0 0
Net costs KLM 724.049 912.782 +26%
Net costs SPL 922.619 894.273 -3%
Objective model 922.619 894.273 -3%
Quality (ton/week)
Total lateral transport 175 0 -100%
Total KL at MWC 0 0
Productivity (ton/week)
KL outbound at MWC 0 0
KL inbound at MWC 0 0
Total KL at MWC 0 0
Lateral transport KLM-MWC 157 0 -100%
Lateral transport MWC-KLM 18 0 -100%
Lateral transport 175 0 -100%
Handled tons KLM 15.313 19.927 +30%
Export MWC 1.951 0 -100%
Import MWC 1.495 0 -100%
Total MWC 3.446 0 -100%
Load factor (ton/week)
Lateral transport 175 0 -100%
Conclusion scenario 4 Conclusion of this scenario would be that cost reductions can be obtained with handling more cargo at the KLM warehouse. Additional cargo handling at KLM will negatively influence the net costs and positively influence the productivity. Resistance from Menzies will increase because this results in decreasing income and productivity.
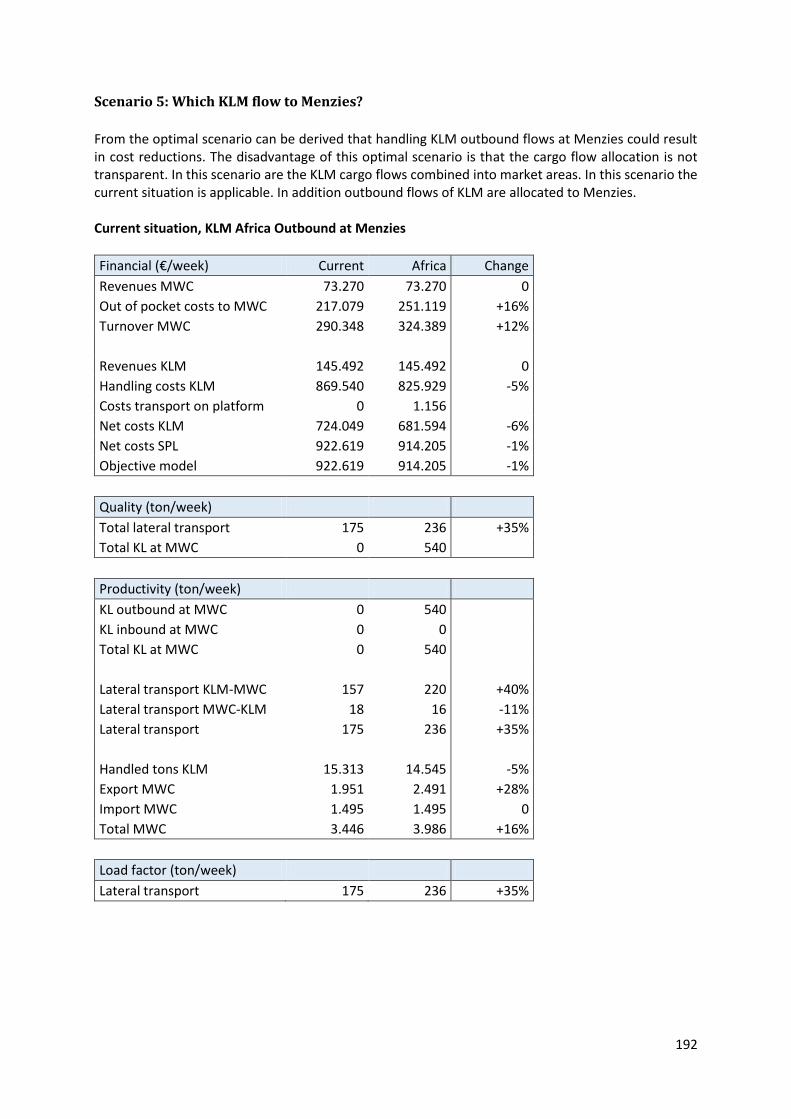
192
Scenario 5: Which KLM flow to Menzies?
From the optimal scenario can be derived that handling KLM outbound flows at Menzies could result in cost reductions. The disadvantage of this optimal scenario is that the cargo flow allocation is not transparent. In this scenario are the KLM cargo flows combined into market areas. In this scenario the current situation is applicable. In addition outbound flows of KLM are allocated to Menzies. Current situation, KLM Africa Outbound at Menzies
Financial (€/week) Current Africa Change
Revenues MWC 73.270 73.270 0
Out of pocket costs to MWC 217.079 251.119 +16%
Turnover MWC 290.348 324.389 +12%
Revenues KLM 145.492 145.492 0
Handling costs KLM 869.540 825.929 -5%
Costs transport on platform 0 1.156
Net costs KLM 724.049 681.594 -6%
Net costs SPL 922.619 914.205 -1%
Objective model 922.619 914.205 -1%
Quality (ton/week)
Total lateral transport 175 236 +35%
Total KL at MWC 0 540
Productivity (ton/week)
KL outbound at MWC 0 540
KL inbound at MWC 0 0
Total KL at MWC 0 540
Lateral transport KLM-MWC 157 220 +40%
Lateral transport MWC-KLM 18 16 -11%
Lateral transport 175 236 +35%
Handled tons KLM 15.313 14.545 -5%
Export MWC 1.951 2.491 +28%
Import MWC 1.495 1.495 0
Total MWC 3.446 3.986 +16%
Load factor (ton/week)
Lateral transport 175 236 +35%

193
Current situation, KL S-America Outbound at Menzies
Financial (€/week) Current S-America Change
Revenues MWC 73.270 73.270 0
Out of pocket costs to MWC 217.079 251.758 +16%
Turnover MWC 290.348 325.027 +12%
Revenues KLM 145.492 145.492 0
Handling costs KLM 869.540 823.599 -5%
Costs transport on platform 0 1.178
Net costs KLM 724.049 679.285 -6%
Net costs SPL 922.619 912.534 -1%
Objective model 922.619 912.534 -1%
Quality (ton/week)
Total lateral transport 175 273 +56%
Total KL at MWC 0 550
Productivity (ton/week)
KL outbound at MWC 0 550
KL inbound at MWC 0 0
Total KL at MWC 0 550
Lateral transport KLM-MWC 157 256 +63%
Lateral transport MWC-KLM 18 17 -6%
Lateral transport 175 273 +56%
Handled tons KLM 15.313 14.504 -5%
Export MWC 1.951 2.501 +28%
Import MWC 1.495 1.495 0
Total MWC 3.446 3.996 +16%
Load factor (ton/week)
Lateral transport 175 273 +56%
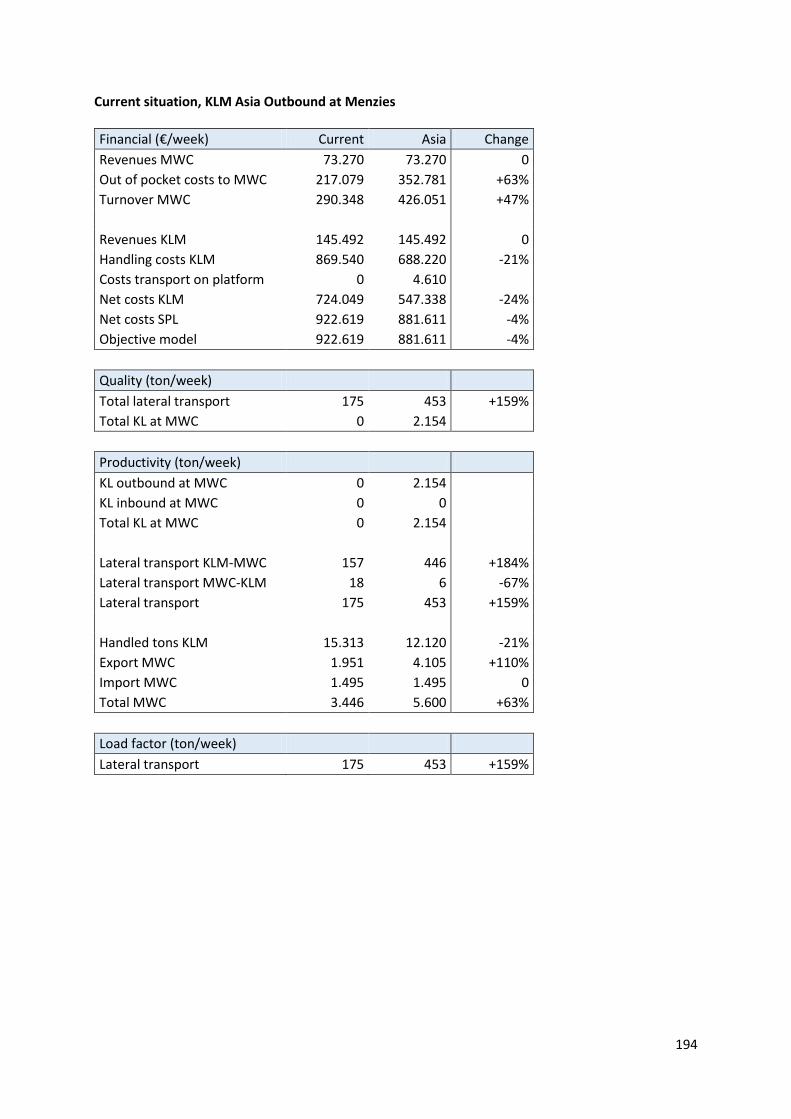
194
Current situation, KLM Asia Outbound at Menzies
Financial (€/week) Current Asia Change
Revenues MWC 73.270 73.270 0
Out of pocket costs to MWC 217.079 352.781 +63%
Turnover MWC 290.348 426.051 +47%
Revenues KLM 145.492 145.492 0
Handling costs KLM 869.540 688.220 -21%
Costs transport on platform 0 4.610
Net costs KLM 724.049 547.338 -24%
Net costs SPL 922.619 881.611 -4%
Objective model 922.619 881.611 -4%
Quality (ton/week)
Total lateral transport 175 453 +159%
Total KL at MWC 0 2.154
Productivity (ton/week)
KL outbound at MWC 0 2.154
KL inbound at MWC 0 0
Total KL at MWC 0 2.154
Lateral transport KLM-MWC 157 446 +184%
Lateral transport MWC-KLM 18 6 -67%
Lateral transport 175 453 +159%
Handled tons KLM 15.313 12.120 -21%
Export MWC 1.951 4.105 +110%
Import MWC 1.495 1.495 0
Total MWC 3.446 5.600 +63%
Load factor (ton/week)
Lateral transport 175 453 +159%
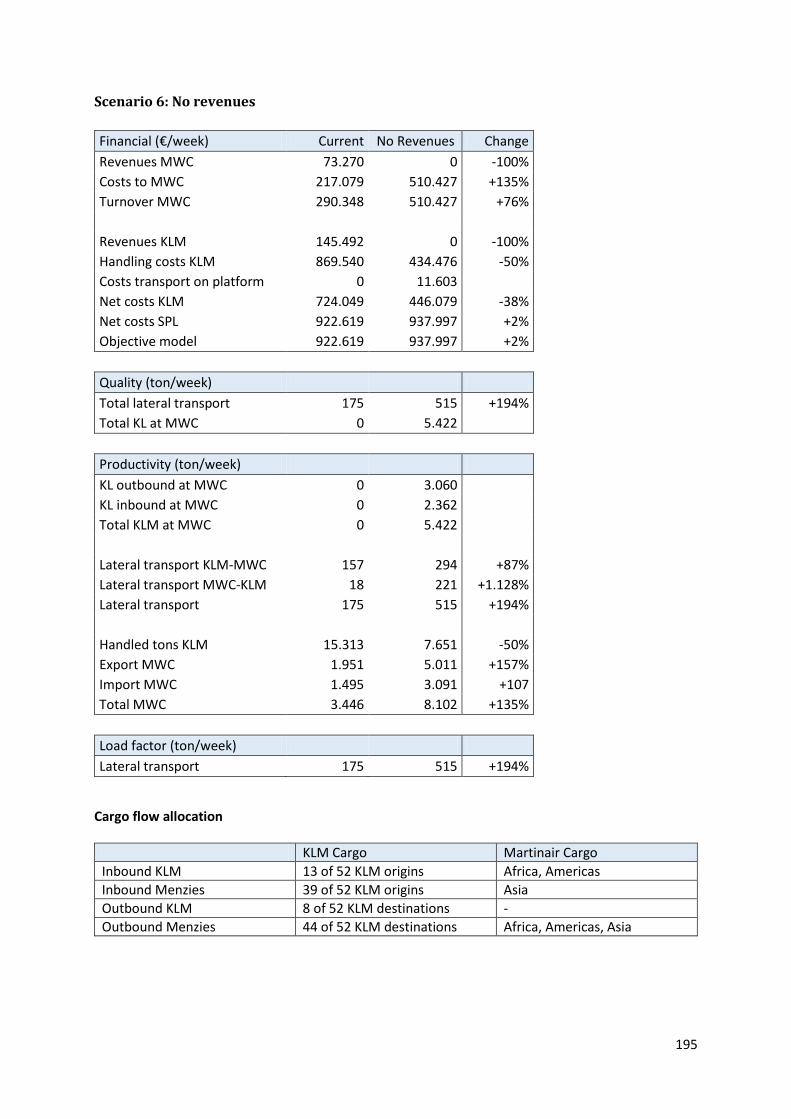
195
Scenario 6: No revenues
Financial (€/week) Current No Revenues Change
Revenues MWC 73.270 0 -100%
Costs to MWC 217.079 510.427 +135%
Turnover MWC 290.348 510.427 +76%
Revenues KLM 145.492 0 -100%
Handling costs KLM 869.540 434.476 -50%
Costs transport on platform 0 11.603
Net costs KLM 724.049 446.079 -38%
Net costs SPL 922.619 937.997 +2%
Objective model 922.619 937.997 +2%
Quality (ton/week)
Total lateral transport 175 515 +194%
Total KL at MWC 0 5.422
Productivity (ton/week)
KL outbound at MWC 0 3.060
KL inbound at MWC 0 2.362
Total KLM at MWC 0 5.422
Lateral transport KLM-MWC 157 294 +87%
Lateral transport MWC-KLM 18 221 +1.128%
Lateral transport 175 515 +194%
Handled tons KLM 15.313 7.651 -50%
Export MWC 1.951 5.011 +157%
Import MWC 1.495 3.091 +107
Total MWC 3.446 8.102 +135%
Load factor (ton/week)
Lateral transport 175 515 +194%
Cargo flow allocation
KLM Cargo Martinair Cargo
Inbound KLM 13 of 52 KLM origins Africa, Americas
Inbound Menzies 39 of 52 KLM origins Asia
Outbound KLM 8 of 52 KLM destinations -
Outbound Menzies 44 of 52 KLM destinations Africa, Americas, Asia
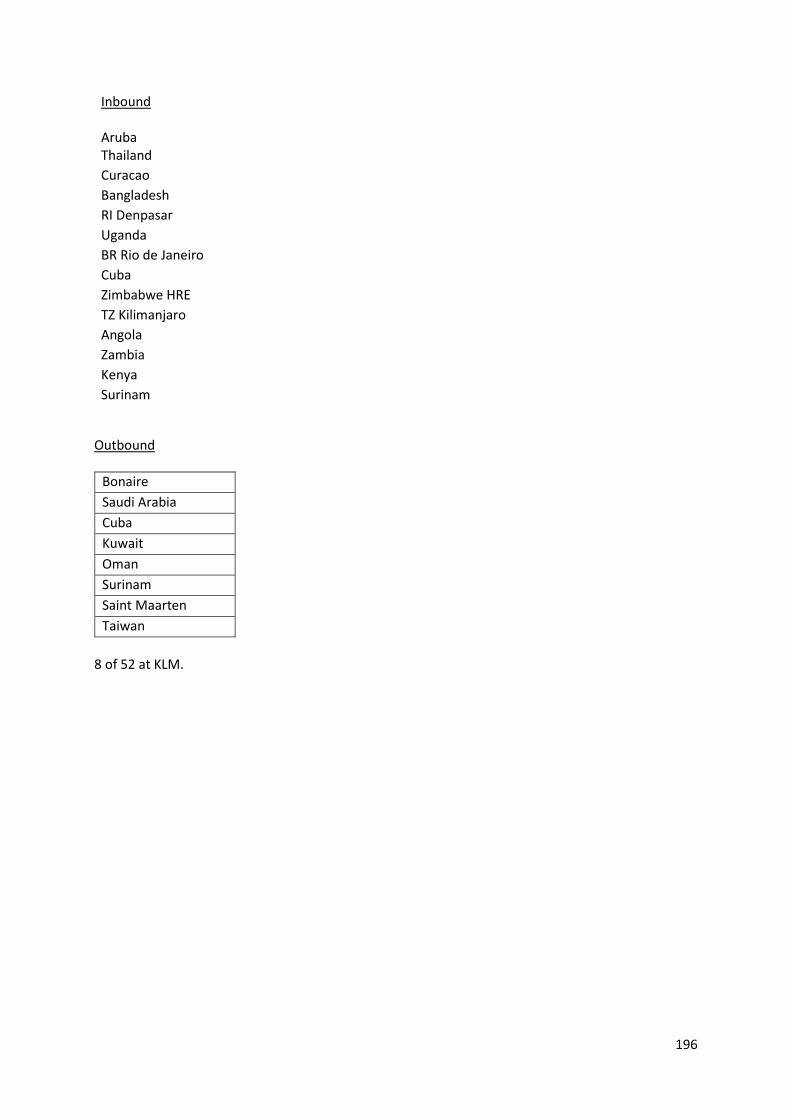
196
Inbound Aruba Thailand
Curacao
Bangladesh
RI Denpasar
Uganda
BR Rio de Janeiro
Cuba
Zimbabwe HRE
TZ Kilimanjaro
Angola
Zambia
Kenya
Surinam
Outbound
Bonaire
Saudi Arabia
Cuba
Kuwait
Oman
Surinam
Saint Maarten
Taiwan
8 of 52 at KLM.
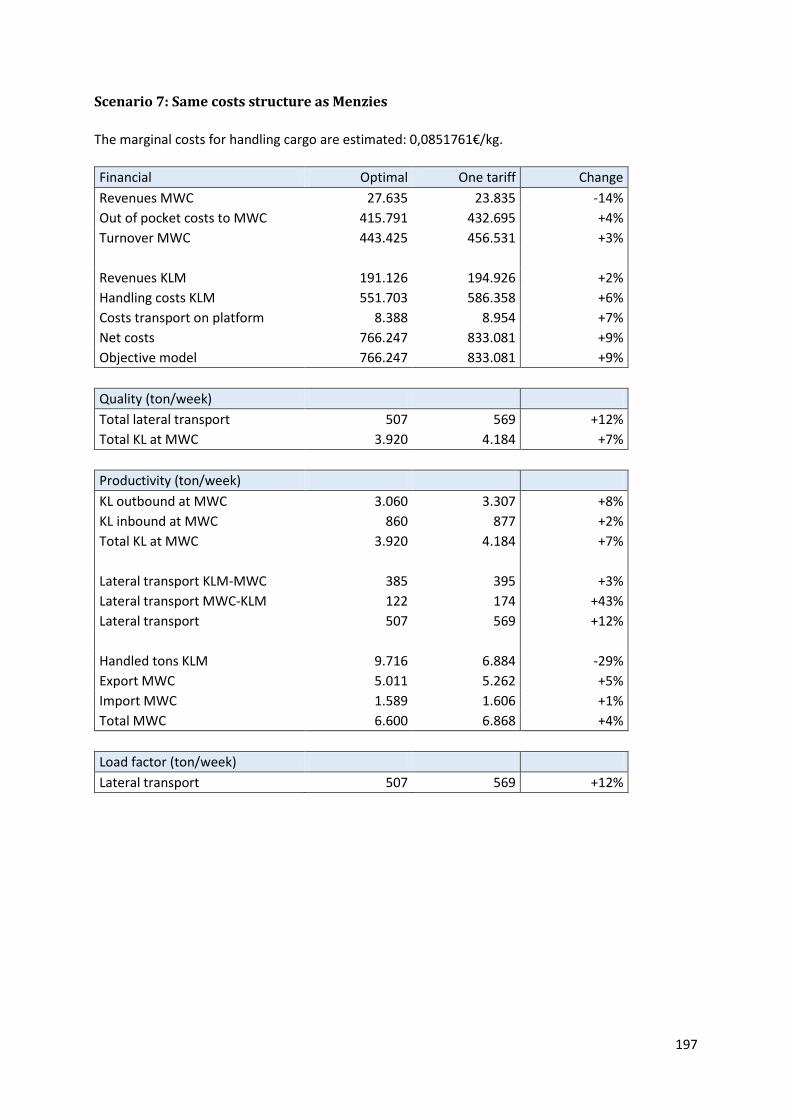
197
Scenario 7: Same costs structure as Menzies
The marginal costs for handling cargo are estimated: 0,0851761€/kg.
Financial Optimal One tariff Change
Revenues MWC 27.635 23.835 -14%
Out of pocket costs to MWC 415.791 432.695 +4%
Turnover MWC 443.425 456.531 +3%
Revenues KLM 191.126 194.926 +2%
Handling costs KLM 551.703 586.358 +6%
Costs transport on platform 8.388 8.954 +7%
Net costs 766.247 833.081 +9%
Objective model 766.247 833.081 +9%
Quality (ton/week)
Total lateral transport 507 569 +12%
Total KL at MWC 3.920 4.184 +7%
Productivity (ton/week)
KL outbound at MWC 3.060 3.307 +8%
KL inbound at MWC 860 877 +2%
Total KL at MWC 3.920 4.184 +7%
Lateral transport KLM-MWC 385 395 +3%
Lateral transport MWC-KLM 122 174 +43%
Lateral transport 507 569 +12%
Handled tons KLM 9.716 6.884 -29%
Export MWC 5.011 5.262 +5%
Import MWC 1.589 1.606 +1%
Total MWC 6.600 6.868 +4%
Load factor (ton/week)
Lateral transport 507 569 +12%
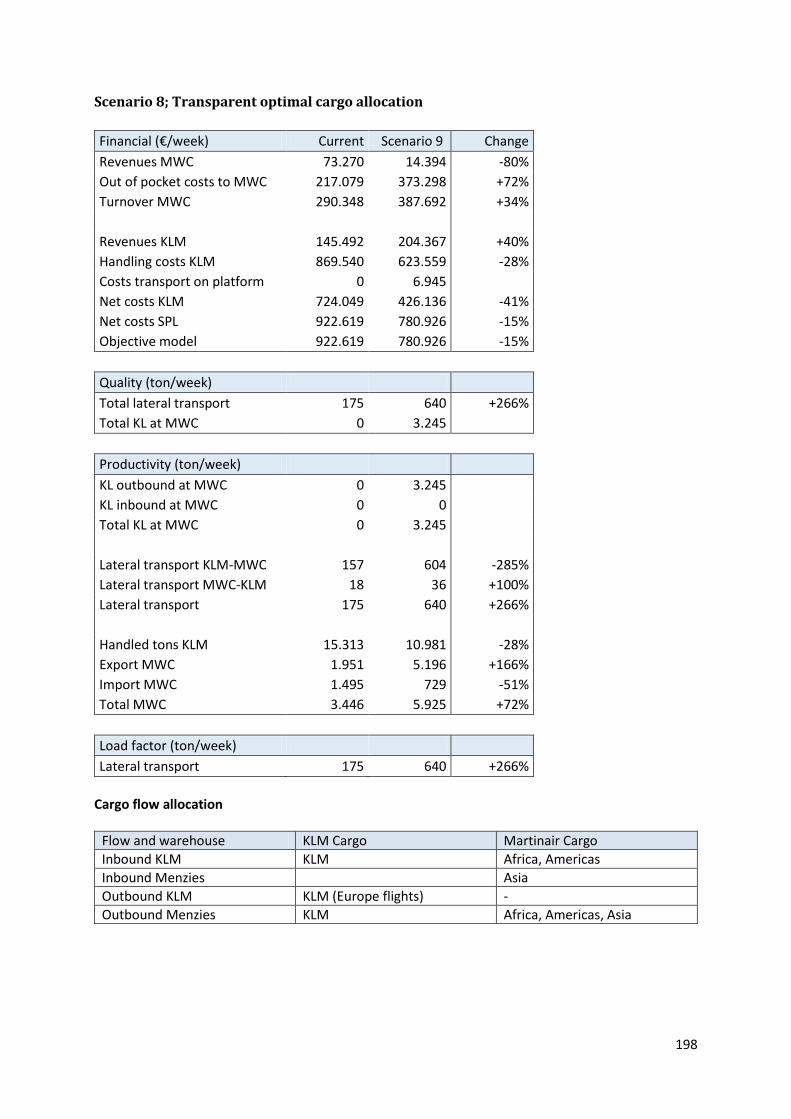
198
Scenario 8; Transparent optimal cargo allocation
Financial (€/week) Current Scenario 9 Change
Revenues MWC 73.270 14.394 -80%
Out of pocket costs to MWC 217.079 373.298 +72%
Turnover MWC 290.348 387.692 +34%
Revenues KLM 145.492 204.367 +40%
Handling costs KLM 869.540 623.559 -28%
Costs transport on platform 0 6.945
Net costs KLM 724.049 426.136 -41%
Net costs SPL 922.619 780.926 -15%
Objective model 922.619 780.926 -15%
Quality (ton/week)
Total lateral transport 175 640 +266%
Total KL at MWC 0 3.245
Productivity (ton/week)
KL outbound at MWC 0 3.245
KL inbound at MWC 0 0
Total KL at MWC 0 3.245
Lateral transport KLM-MWC 157 604 -285%
Lateral transport MWC-KLM 18 36 +100%
Lateral transport 175 640 +266%
Handled tons KLM 15.313 10.981 -28%
Export MWC 1.951 5.196 +166%
Import MWC 1.495 729 -51%
Total MWC 3.446 5.925 +72%
Load factor (ton/week)
Lateral transport 175 640 +266%
Cargo flow allocation
Flow and warehouse KLM Cargo Martinair Cargo
Inbound KLM KLM Africa, Americas
Inbound Menzies Asia
Outbound KLM KLM (Europe flights) -
Outbound Menzies KLM Africa, Americas, Asia