Embed Size (px)
Citation preview
Koninklijk Nederlands Instituut voor ZeeonderzoekRoyal Netherlands Institute for Sea Research
A multi-proxy approach to time-series fluxes and coretop sediments:
A possibility to deconvolve temperature and salinity in open ocean environments?
NIOZ group: Ulrike Fallet, Isla Castaneda, Sanne Vogels, Geert-Jan Brummer, Stefan Schouten
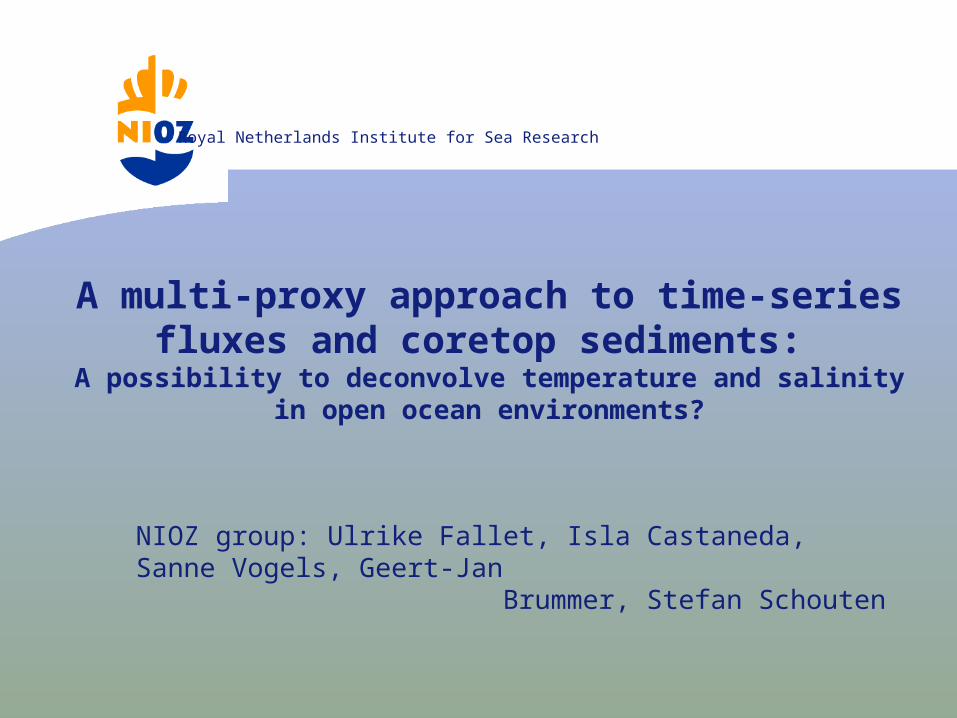
I. Research objectives
1. Establish temperature relationships in planktonic foraminifera with Mg/Ca and δ18O
2. Verify these with satellite remote sensing SST and in situ T-S from moored CTD’s
Is it possible to eliminate salinity in this equation?
Salinity gradient in the Mozambique Channel is ~0.4‰
Calculation of salinity depends on accuracy of
satellite remote sensing
Mg/Ca and δ18O measurements
Intraspecies variation
3. Determine foraminifera fluxes to the channel floor
4. Apply results to coretop foraminifera to calibrate proxies
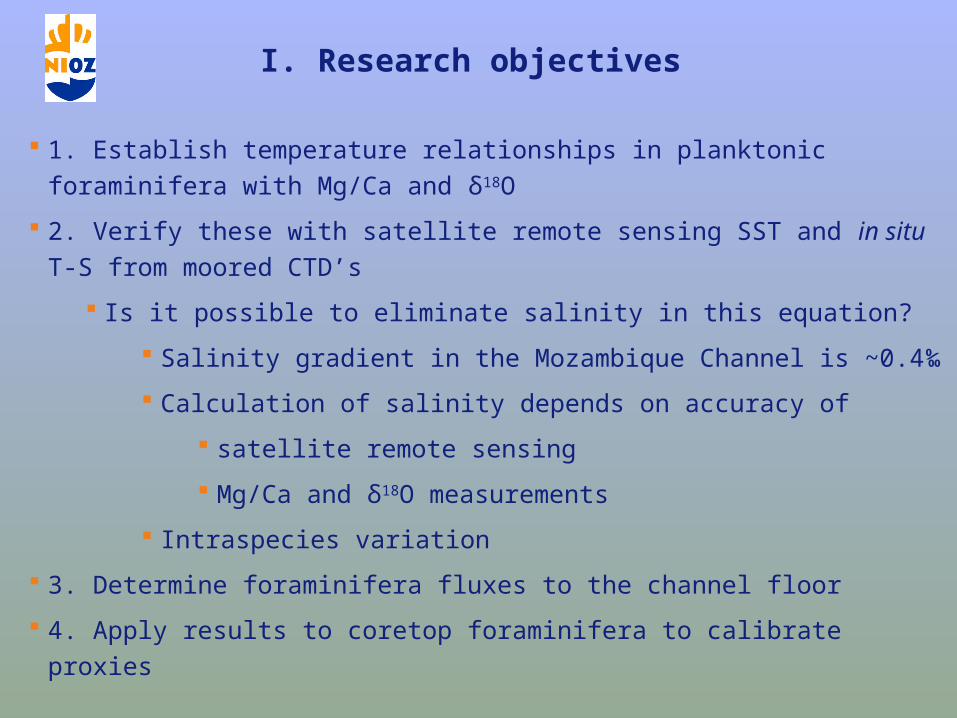
II. Research objectives
5. Compare Mg/ Ca and δ18O from planktonic foraminifera with
Coral proxies (Sr/Ca) off the coast of Madagascar
Organic matter proxies (Tex86, Uk37)
Downward particulate matter fluxes
Eddy transport through the channel (nutrient distribution by frontal upwelling, nutrient transport from coastal margins to the open channel, etc.)
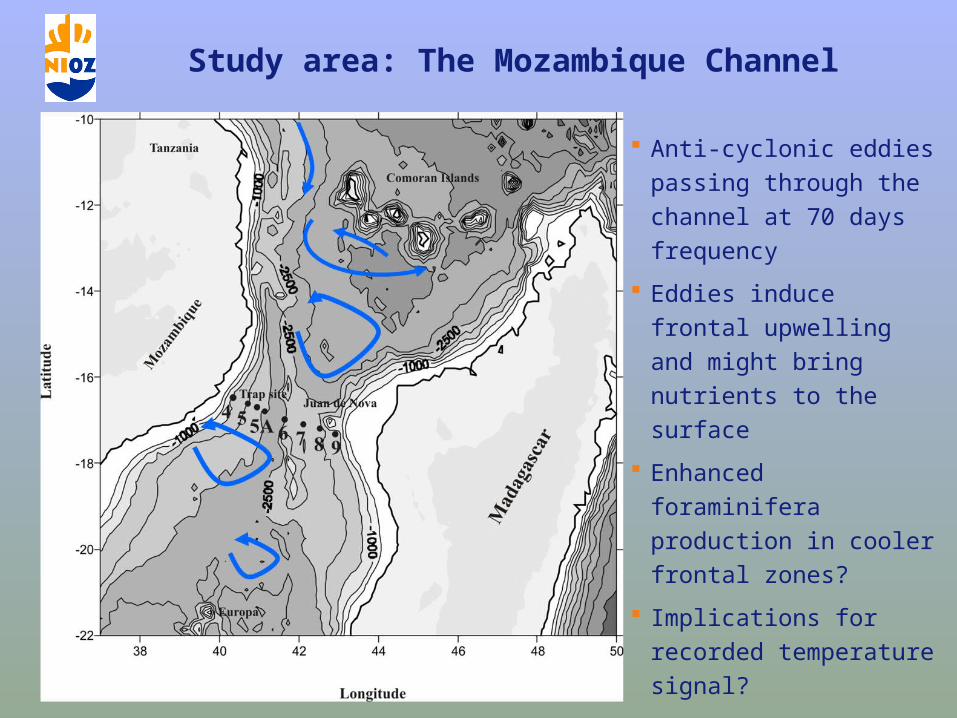
Study area: The Mozambique Channel
Anti-cyclonic eddies passing through the channel at 70 days frequency
Eddies induce frontal upwelling and might bring nutrients to the surface
Enhanced foraminifera production in cooler frontal zones?
Implications for recorded temperature signal?
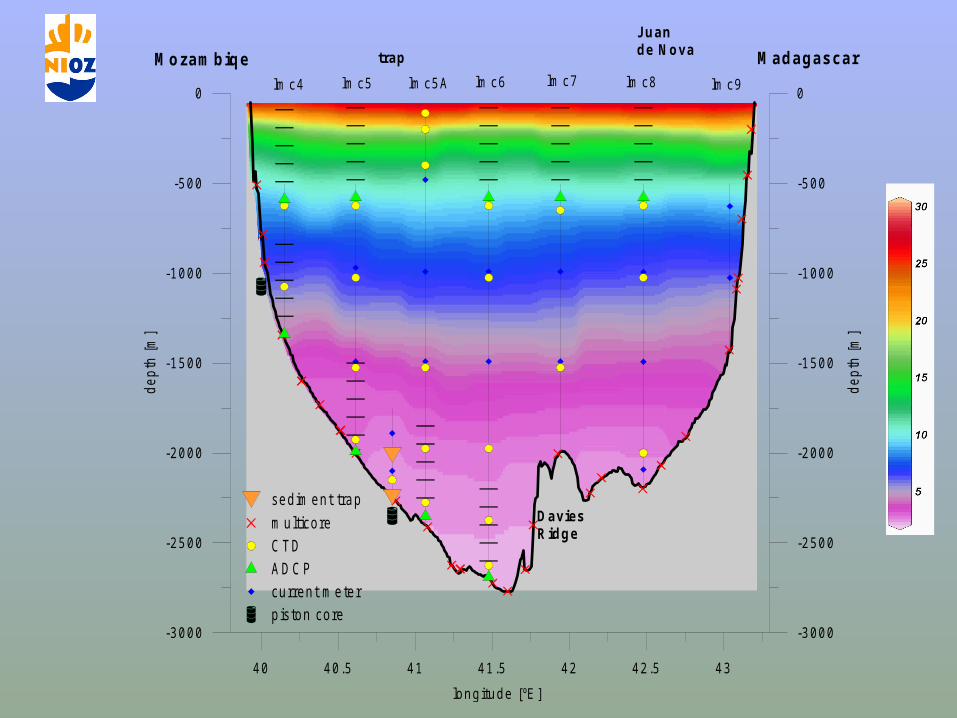
40 40.5 41 41.5 42 42.5 43
longitude [ºE ]
-3000
-2500
-2000
-1500
-1000
-500
0
dep
th [
m]
sedim ent trap
m ulticore
CTD
ADCP
current m eter
piston core-3000
-2500
-2000
-1500
-1000
-500
0
dep
th [
m]
MadagascarMozambiqe
Juan de Nova
DaviesRidge
lm c4 lm c5 lm c5A lm c6 lm c7 lm c8 lm c9
trap
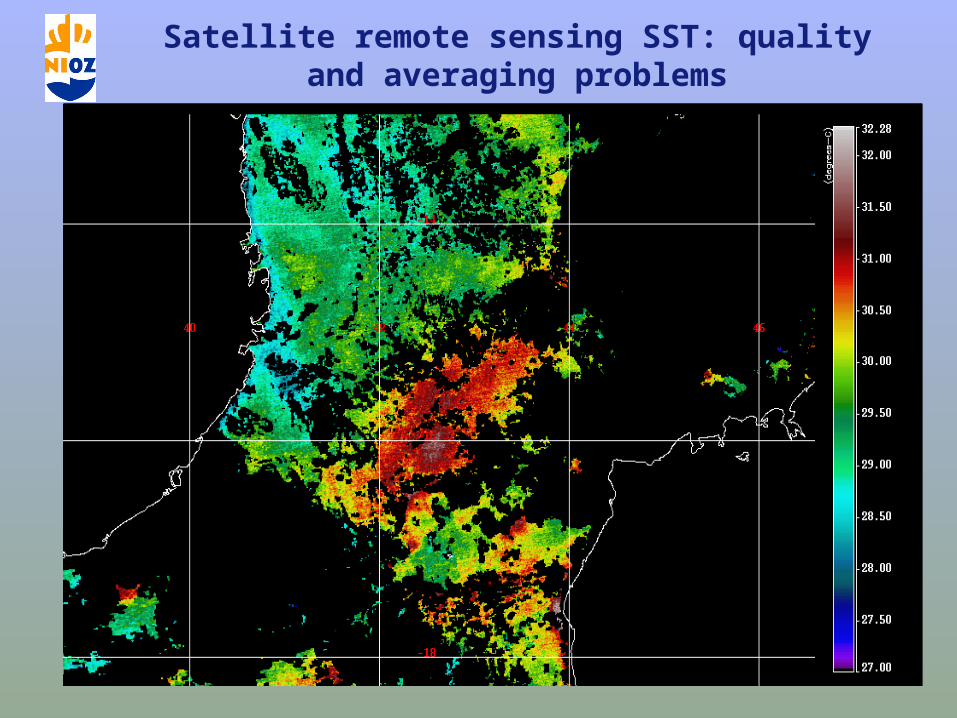
Satellite remote sensing SST: quality and averaging problems
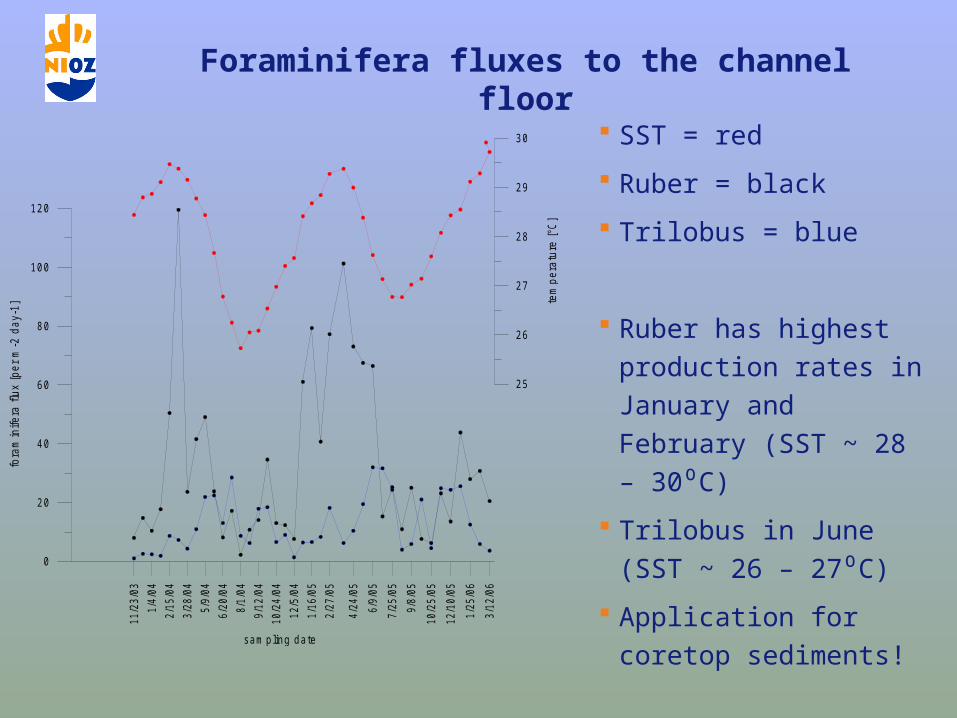
Foraminifera fluxes to the channel floor
SST = red
Ruber = black
Trilobus = blue
Ruber has highest production rates in January and February (SST ~ 28 – 30⁰C)
Trilobus in June (SST ~ 26 – 27⁰C)
Application for coretop sediments!11
/23/
03
1/4/
04
2/15
/04
3/28
/04
5/9/
04
6/20
/04
8/1/
04
9/12
/04
10/2
4/04
12/5
/04
1/16
/05
2/27
/05
4/24
/05
6/9/
05
7/25
/05
9/8/
05
10/2
5/05
12/1
0/05
1/25
/06
3/12
/06
sam pling date
0
20
40
60
80
100
120
fora
min
ifera
flu
x [p
er
m-2
da
y-1
]
25
26
27
28
29
30
tem
per
atu
re [°
C]
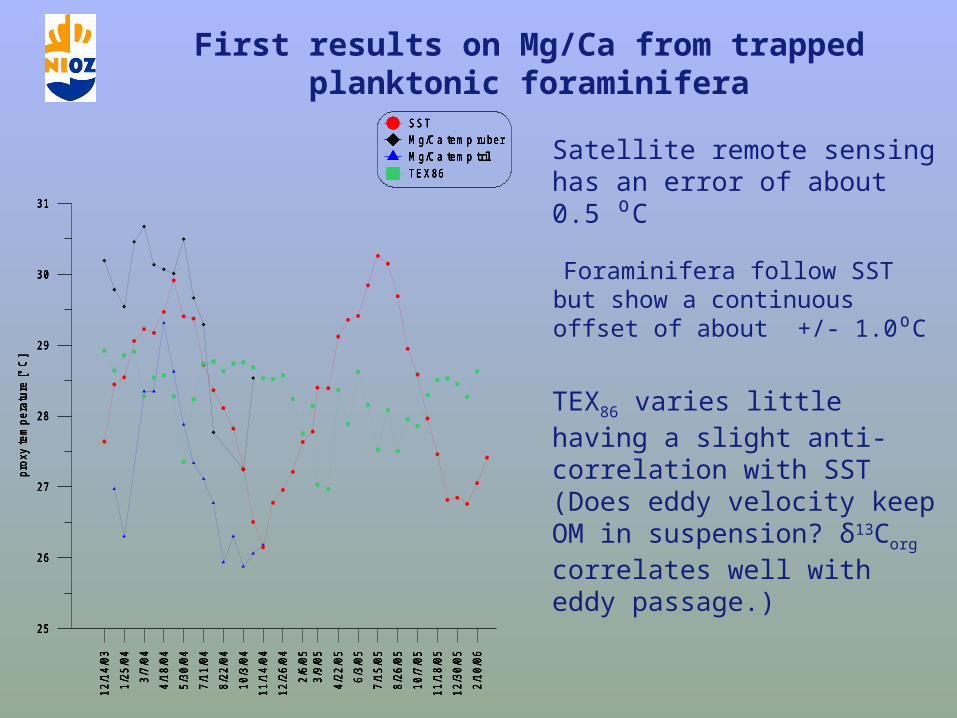
First results on Mg/Ca from trapped planktonic foraminifera
Foraminifera follow SST but show a continuous offset of about +/- 1.0⁰C
12/1
4/03
1/2
5/04
3/7/
04
4/1
8/04
5/3
0/04
7/1
1/04
8/2
2/04
10/
3/04
11/1
4/04
12/2
6/04
2/6/
053/
9/05
4/2
2/05
6/3/
05
7/1
5/05
8/2
6/05
10/
7/05
11/1
8/05
12/3
0/05
2/1
0/06
25
26
27
28
29
30
31
pro
xy te
mp
erat
ure
[° C
]
SST
M g/C a tem p ruber
M g/C a tem p tril
TEX 86
12/1
4/03
1/2
5/04
3/7/
04
4/1
8/04
5/3
0/04
7/1
1/04
8/2
2/04
10/
3/04
11/1
4/04
12/2
6/04
2/6/
053/
9/05
4/2
2/05
6/3/
05
7/1
5/05
8/2
6/05
10/
7/05
11/1
8/05
12/3
0/05
2/1
0/06
25
26
27
28
29
30
31
pro
xy te
mp
erat
ure
[° C
]
SST
M g/C a tem p ruber
M g/C a tem p tril
TEX 86
12/1
4/03
1/2
5/04
3/7/
04
4/1
8/04
5/3
0/04
7/1
1/04
8/2
2/04
10/
3/04
11/1
4/04
12/2
6/04
2/6/
053/
9/05
4/2
2/05
6/3/
05
7/1
5/05
8/2
6/05
10/
7/05
11/1
8/05
12/3
0/05
2/1
0/06
25
26
27
28
29
30
31
pro
xy te
mp
erat
ure
[° C
]
SST
M g/C a tem p ruber
M g/C a tem p tril
TEX 86
12/1
4/03
1/2
5/04
3/7/
04
4/1
8/04
5/3
0/04
7/1
1/04
8/2
2/04
10/
3/04
11/1
4/04
12/2
6/04
2/6/
053/
9/05
4/2
2/05
6/3/
05
7/1
5/05
8/2
6/05
10/
7/05
11/1
8/05
12/3
0/05
2/1
0/06
25
26
27
28
29
30
31
pro
xy te
mp
erat
ure
[° C
]
SST
M g/C a tem p ruber
M g/C a tem p tril
TEX 86
Satellite remote sensing has an error of about 0.5 ⁰C
TEX86 varies little having a slight anti-correlation with SST (Does eddy velocity keep OM in suspension? δ13Corg correlates well with eddy passage.)
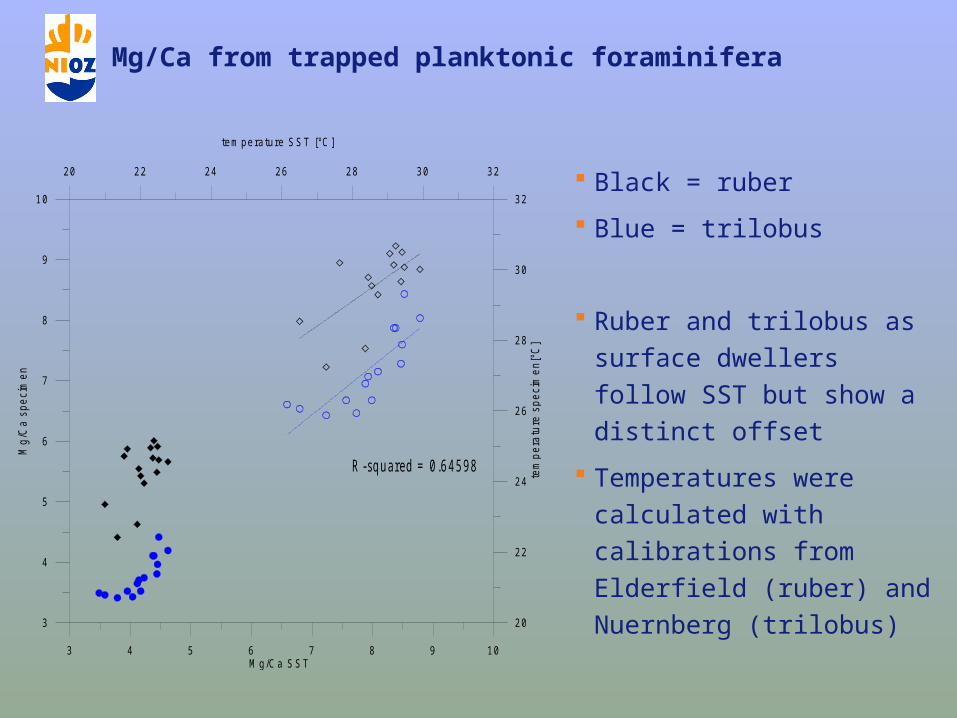
Mg/Ca from trapped planktonic foraminifera
Black = ruber
Blue = trilobus
Ruber and trilobus as surface dwellers follow SST but show a distinct offset
Temperatures were calculated with calibrations from Elderfield (ruber) and Nuernberg (trilobus) 3 4 5 6 7 8 9 10
M g/C a SST
3
4
5
6
7
8
9
10
Mg
/Ca
spe
cim
en
20 22 24 26 28 30 32
tem perature SST [°C ]
20
22
24
26
28
30
32
tem
pe
ratu
re s
pec
ime
n[°
C]
R -sq u a red = 0 .6 4 5 9 8
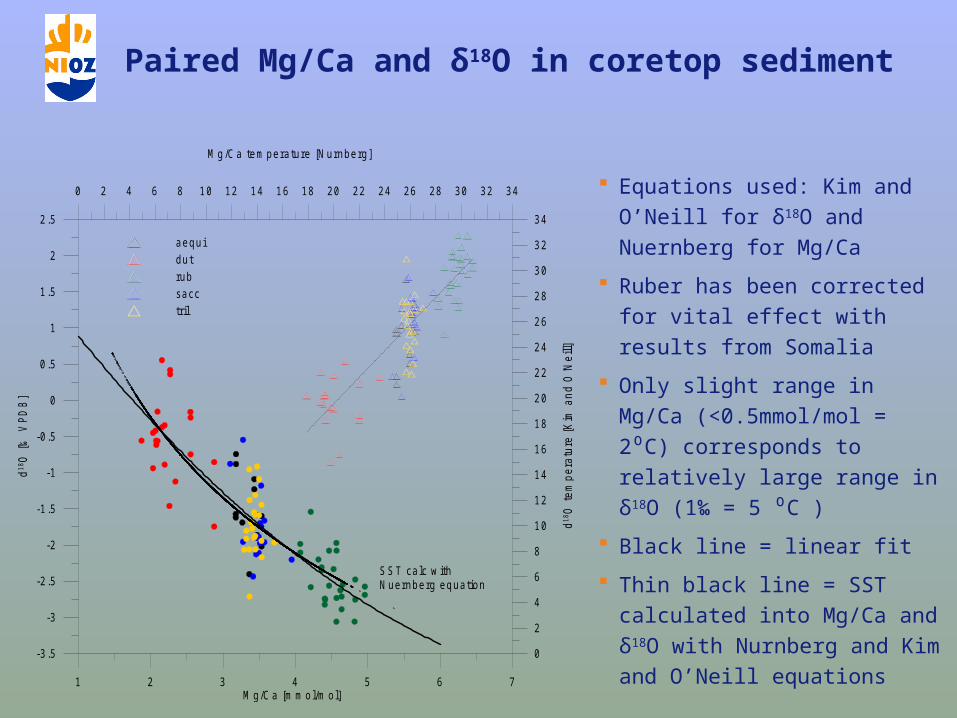
Paired Mg/Ca and δ18O in coretop sediment
Equations used: Kim and O’Neill for δ18O and Nuernberg for Mg/Ca
Ruber has been corrected for vital effect with results from Somalia
Only slight range in Mg/Ca (<0.5mmol/mol = 2⁰C) corresponds to relatively large range in δ18O (1‰ = 5 ⁰C )
Black line = linear fit
Thin black line = SST calculated into Mg/Ca and δ18O with Nurnberg and Kim and O’Neill equations 1 2 3 4 5 6 7
M g/C a [m m ol/m ol]
-3 .5
-3
-2 .5
-2
-1 .5
-1
-0 .5
0
0.5
1
1.5
2
2.5
d1
8 O [‰
VP
DB
]
0 2 4 6 8 10 12 14 16 18 20 22 24 26 28 30 32 34
M g/C a tem perature [N urnberg]
0
2
4
6
8
10
12
14
16
18
20
22
24
26
28
30
32
34
d18
O te
mp
erat
ure
[Kim
an
d O
'Nei
ll]
aequi
dut
rub
sacc
tril
SST ca lc w ith N uernberg equation
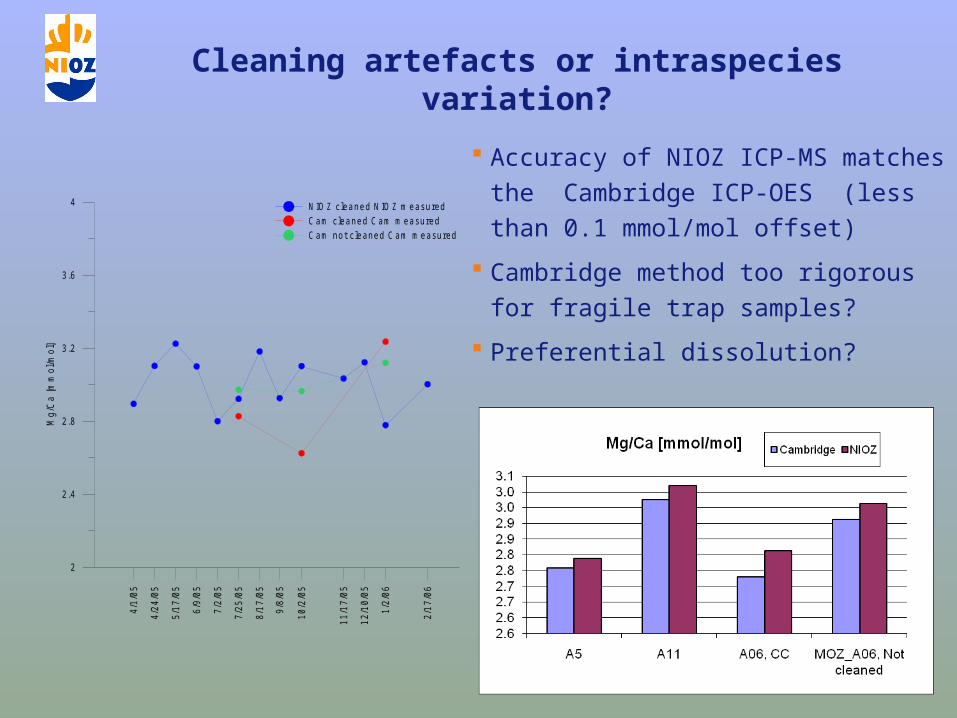
Cleaning artefacts or intraspecies variation?
4/1
/05
4/2
4/0
5
5/1
7/0
5
6/9
/05
7/2
/05
7/2
5/0
5
8/1
7/0
5
9/8
/05
10
/2/0
5
11/
17
/05
12/
10
/05
1/2
/06
2/1
7/0
6
2
2 .4
2.8
3.2
3.6
4
Mg
/Ca
[mm
ol/m
ol]
N IO Z cleaned N IO Z m easured
C am cleaned C am m easured
C am not c leaned C am m easured
Accuracy of NIOZ ICP-MS matches the Cambridge ICP-OES (less than 0.1 mmol/mol offset)
Cambridge method too rigorous for fragile trap samples?
Preferential dissolution?
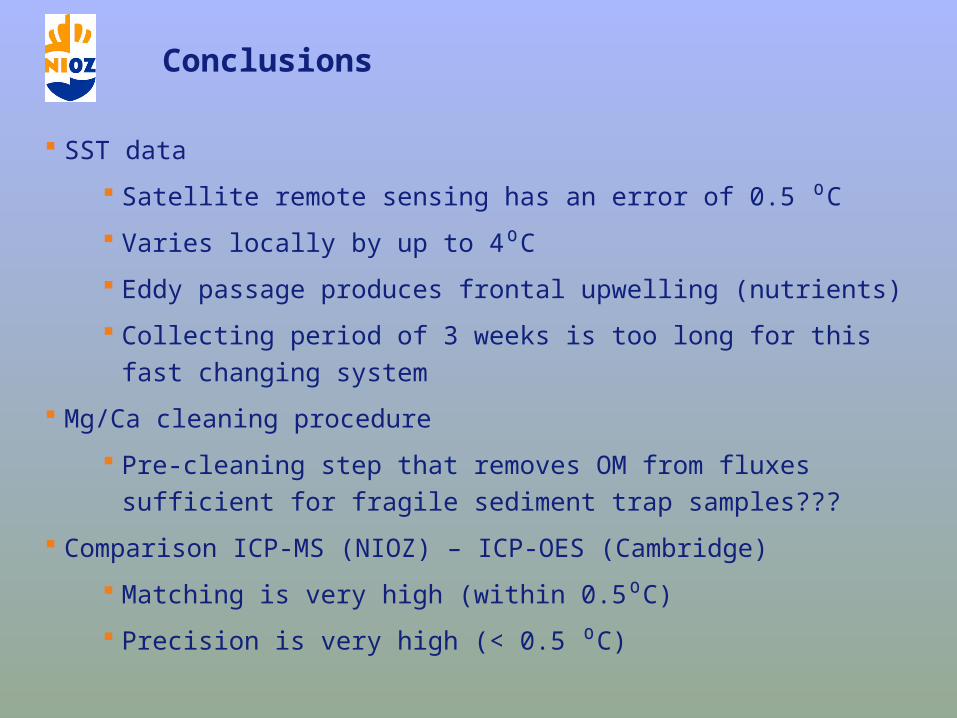
Conclusions
SST data
Satellite remote sensing has an error of 0.5 ⁰C
Varies locally by up to 4⁰C
Eddy passage produces frontal upwelling (nutrients)
Collecting period of 3 weeks is too long for this fast changing system
Mg/Ca cleaning procedure
Pre-cleaning step that removes OM from fluxes sufficient for fragile sediment trap samples???
Comparison ICP-MS (NIOZ) – ICP-OES (Cambridge)
Matching is very high (within 0.5⁰C)
Precision is very high (< 0.5 ⁰C)
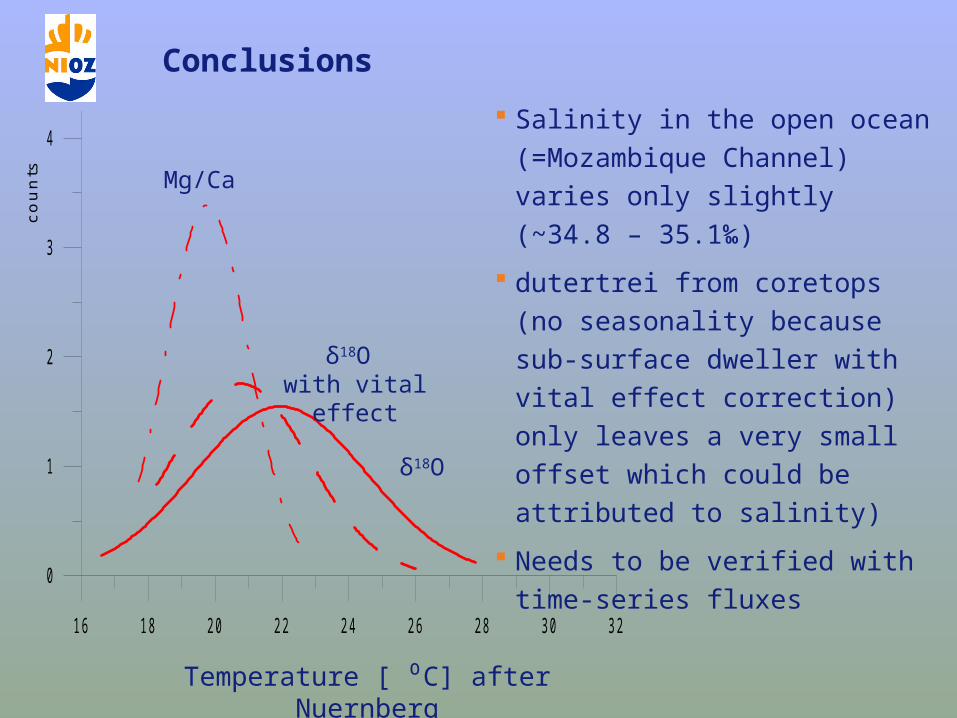
Conclusions
Salinity in the open ocean (=Mozambique Channel) varies only slightly (~34.8 – 35.1‰)
dutertrei from coretops (no seasonality because sub-surface dweller with vital effect correction) only leaves a very small offset which could be attributed to salinity)
Needs to be verified with time-series fluxes
16 18 20 22 24 26 28 30 32d18O tem pera ture [a fter K im and O 'N eill]
0
1
2
3
4
5
6
7
coun
ts Mg/Ca
δ18O
δ18O with vital effect
Temperature [ ⁰C] after Nuernberg
Outlook
Finish Mg/Ca measurements on time-series fluxes
Analyse time-series fluxes for δ18O
Paired Mg/Ca - δ18O can be used to check for salinity effect
Obtain satellite remote sensing temperatures that have been quality checked and calculate tri-weekly averages for trap location
Use SST and altimetry data to estimate frontal upwelling in eddies (temperature difference?)