Embed Size (px)
DESCRIPTION
staad
Citation preview

CHAPTER IV
MODELLING
4.1 Introduction
This chapter describes the procedures for modelling of guyed monorail steel
bridge through the frame analysis. Generally, the modelling processes are as follow:
1) Geometry
2) Material properties
3) Member specifications
4) Supports
5) Loadings
6) Analysis
7) Results

4.2 Geometry
There are two methods of creating the structure data to model the guyed
bridge in STAAD Pro 2003 software, which are:
1) Using the command file
2) Using the graphical model generation mode or graphical user interface (GUI)
as it is usually referred to.
The command file is a text file, which contains the data for the structure
being modelled. This file consists of simple English language of commands. This
commands file may be created directly using the editor built into the program, or
using Notepad or WordPad as in Microsoft Windows. This command file is also
automatically created behind the scenes when the structure is generated using the
Graphical User Interface. The graphical model generation mode and the command
file are seamlessly integrated. Therefore, the graphical model generation mode and
the command file can be access at the same time. In this study, the graphical user
interface (GUI) method is choosing to model the guyed bridge.
The first step in model the bridge structure is generating the model geometry.
There are one 3-D model are generate in this study. The structure type is to be
defined by choosing the space type structure. A space type structure is one where the
structure, the loading or both, causing the structure to deform in all 3 global axis (X,
Y and Z). SI units in meter as the length unit and kilo Newton as the force unit are
choose to start to generate the bridge model. However, the units can be changed later
if necessary, at any stage of the model creation. It can be shown in the Figure 4.1.
52

Figure 4.1: Create new structure.
Generally, the structure geometry consists of joint numbers, their coordinates,
and member numbers, the member connectivity information, plate element members
and others. The “Add Beam” option is selected earlier to facilitate adding beams to
create the structure. The directions of global axis (X, Y, Z) are presented in the icon
in the lower left hand corner of the drawing area, which shown in Figure 4.2.
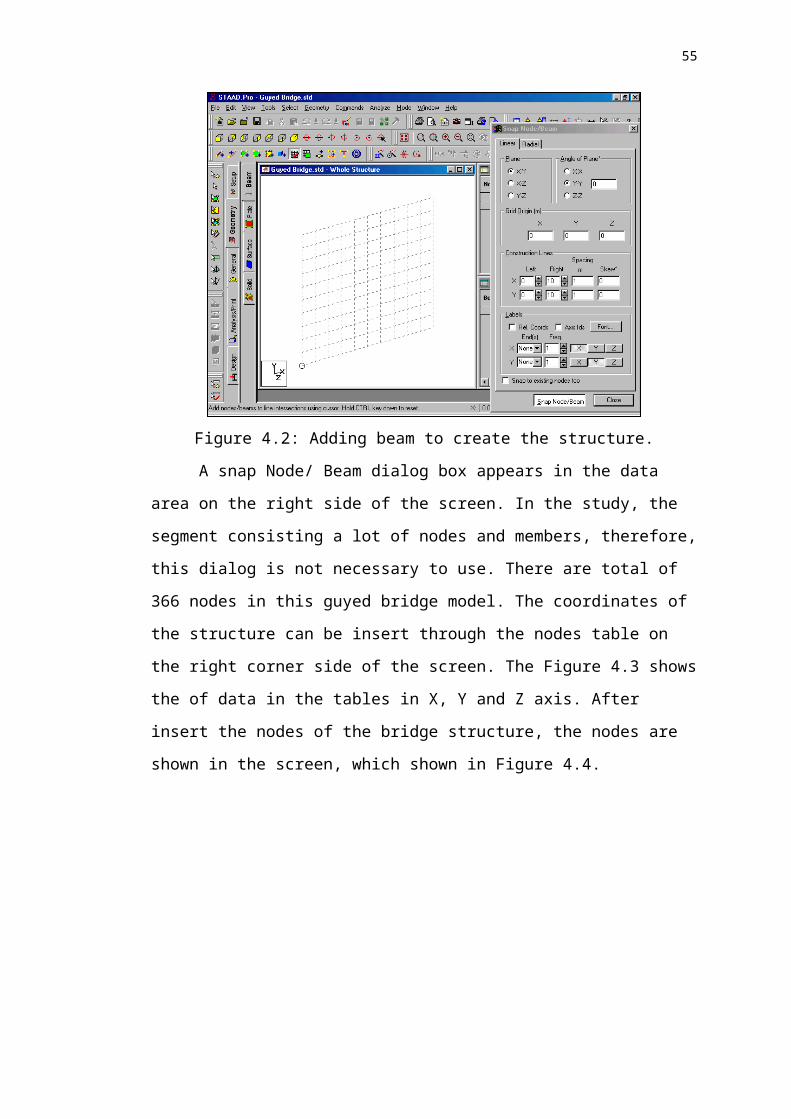
Figure 4.2: Adding beam to create the structure.
53

A snap Node/ Beam dialog box appears in the data area on the right side of
the screen. In the study, the segment consisting a lot of nodes and members,
therefore, this dialog is not necessary to use. There are total of 366 nodes in this
guyed bridge model. The coordinates of the structure can be insert through the nodes
table on the right corner side of the screen. The Figure 4.3 shows the of data in the
tables in X, Y and Z axis. After insert the nodes of the bridge structure, the nodes are
shown in the screen, which shown in Figure 4.4.
Figure 4.3: Coordinates can be insert through the nodes table.
Figure 4.4: Creating the nodes of the bridge structure.
54
Then, the beams are created by using the “Add Beam” button in the tools bar
to connect the nodes, which shown in Figure 4.5. In the study, there are 611 beams
are created to generate the guyed bridge model. The complete models of the guyed
monorail steel bridge are shown in Figure 4.6 in isometric view, Figure 4.7 in front
view, Figure 4.8 in side view and Figure 4.9 in plan view.
Figure 4.5: “Add Beam” button in the tools bar.
Figure 4.6: Isometric view of the guyed bridge model.
55
“Add Beam”

Figure 4.7: Front view of the guyed bridge model.
Figure 4.8: Side view of the guyed bridge model.
56

Figure 4.9: Plan view of the guyed bridge model.
4.3 Material properties
To assign cross section properties for the whole element in the guyed bridge
structure, click on the Property page icon located on the Structure Tools toolbar,
which shown in Figure 4.10. Alternative, one may go to the General/ Property page
from the left side of the screen as shown in the Figure 4.10.
57

Figure 4.10: “Member Property” icon in the tool bar.
In either case, the Properties dialog box comes up, which is shown in Figure
4.11. To apply the material properties to the member, select the members and the
selected members will be highlighted. It can be shown in Figure 4.12.
Figure 4.11: Material properties dialog box.
58
Member Page

Figure 4.12: The selected beams are highlighted.
In the dialog box that comes up, select the Rectangular tab. Notice that the
field called Material is presently on the checked mode. The material properties of
concrete for elasticity, Poisson’s ratio, density will be assigned along with the cross
section name. The material property values so assigned will be the program defaults.
Then, enter the cross section of the pylon and click the assign button as shown in the
Figure 4.13 below. The Figure 4.14 shows the material properties and cross section
that defined to the whole structure of the model.
Figure 4.13: Assign the material properties and cross section for the pylons.
59
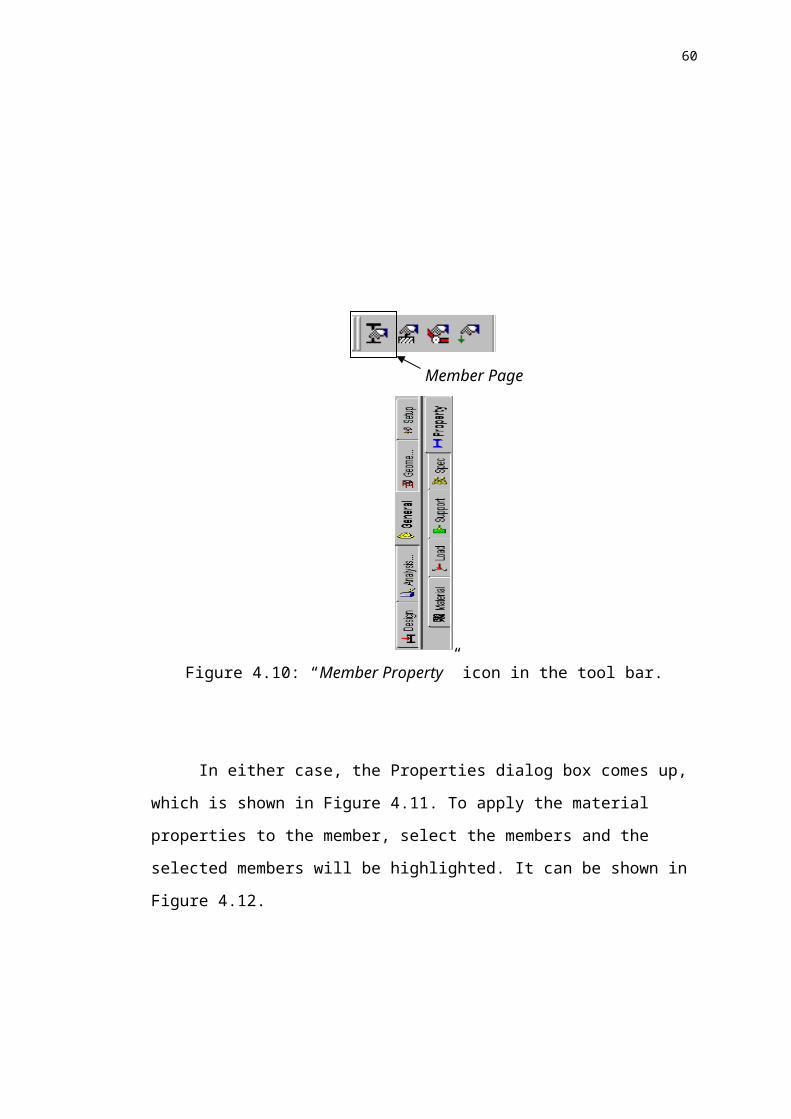
Figure 4.14: The material properties that assigned to the whole bridge structure.
4.4 Member specification
To assign the member specification for the selected element in the guyed
bridge structure, click on the Specification page icon located on the Structure Tools
toolbar. For example, the tendons of the bridge deck are selected and the Figure 4.15
shows the highlighted tendons element in the bridge structure. Alternative, one may
go to the General/ Specification page from the left side of the screen. These can be
shown in the Figure 4.16 below.
Figure 4.15: Highlighted tendons elements in the bridge model.
60

Figure 4.16: “Member Specification” icon in the toolbar.
In either case, the Specifications dialog box comes up. The cable specification
is defined through the Beam button in the dialog box. In the Beam Specs dialog box
that open, select the Cable tab. Then, enter a value of 1000 kN for the initial tension
force in the edit box to assign the tendon’s specification, as shown in Figure 4.16.
The same procedures are made to assign the member specification for the cables and
hanger.
Figure 4.17: Initial tension is assigned to the tendons.
61
Specification page

4.5 Supports
The suspension bridge structures are held rigid on the cable anchorages and
the foundations. To create the support, click on the Support Page icon located in the
top toolbar as shown in Figure 4.17 below. Alternatively, one may go to the General/
Support Page from the left side of the screen, as shown in Figure 4.17.
Figure 4.18: “Support” icon in the toolbar.
Select the nodes in the bottom of the pylons and nodes at the end of the cable
using the nodes cursor. Then, click on the Create button in the Supports dialog box.
In the Create Support dialog box that opens, select the Fixed tab and click on the
assign button as shown in Figure 4.18 below. This creates fixed type of support at the
foundation and anchorage, where all 6 degrees of freedom are restrained. The figure
4.19 shows the fixed support at the bridge model.
62
Support Page

Figure 4.19: Create the fixed support to the model.
Figure 4.20: Fixed support at the foundation and anchorage of the bridge model.
63
Fixed supports

4.6 Loadings
Three load cases are to be created for this structure. To create loads, click on
the Load Page icon located on the top toolbar. Alternatively, one may go to the
General/ Load page from the left side of the screen. In the Set Active Primary Load
Case dialog box that comes up, enter Dead Load as the title for load case 1, as shown
in Figure 4.20.
Figure 4.21: Create Load Case 1 for the structure.
The Loads dialog box will appear. To generate and assign the self-weight
load type, click on the self-weight button. In the self-weight load dialog box, specify
the direction of the dead load as y-direction, and enter the Factor as –1.0, as shown in
Figure 4.21. The negative number signifies that the self-weight load acts opposite to
the positive direction of the global axis along which it is applied. The self-weight
load is applicable to every member of the structure, and cannot be applied on a
selected list of members. The same procedures are made to apply the live load and
wind load to the structure.
Figure 4.22: Self-weight load is created to the bridge structure.
64

After creating the load case 1, 2, and 3, the load combination is assigned to
apply the load combination to the structure. There are three load combinations for
each case of ultimate limit state and serviceability limit state. First, click on the
Combine button in the loads dialog box and create the combine load, as shown in
Figure 4.22. In the Define Combination dialog box, enter 1.05 in the Factor edit box
and select the dead load cases from the left side list box and click on the > button.
The load cases along with the combination factor appear in the right side list box as
shown in the Figure 4.23. Then, select the live load with the value of factor 1.4. The
same procedures are made to assign the other load combination to the bridge model.
Figure 4.23: The new load combination is created.
Figure 4.24: The factor is applied to the load combination case.
65

4.7 Analysis
The analysis type that required proceeding is a linear static type in the study.
To specify the analysis command, first go to Analysis/ Print page from the left side
of the screen. Then, click on the Analysis sub-page from the second row of pages. In
the Analysis/ Print commands dialog box that appears, make sure that the Perform
Analysis tab is selected. Then, check the Statics Check print option. Finally, click on
the Add button followed by the Close button, as shown in Figure 4.24.
Figure 4.25: Assign Statics Check analysis for the bridge model.
66

4.8 Results
During the analysis process, STAAD Pro creates an output file. This file
provides important information on whether the analysis was performed properly.
Besides, the program also offer extensive result verification and visualisation
facilities. These facilities are accessed from the Post Processing Mode. The Post
Processing mode is used to verify the analysis and design results and generate
reports. In this study, the deflection profiles and the stress for the pylon structure are
obtained from the results of analysis. The results of the analysis will be discussed in
Chapter V.
67


