Embed Size (px)
Citation preview
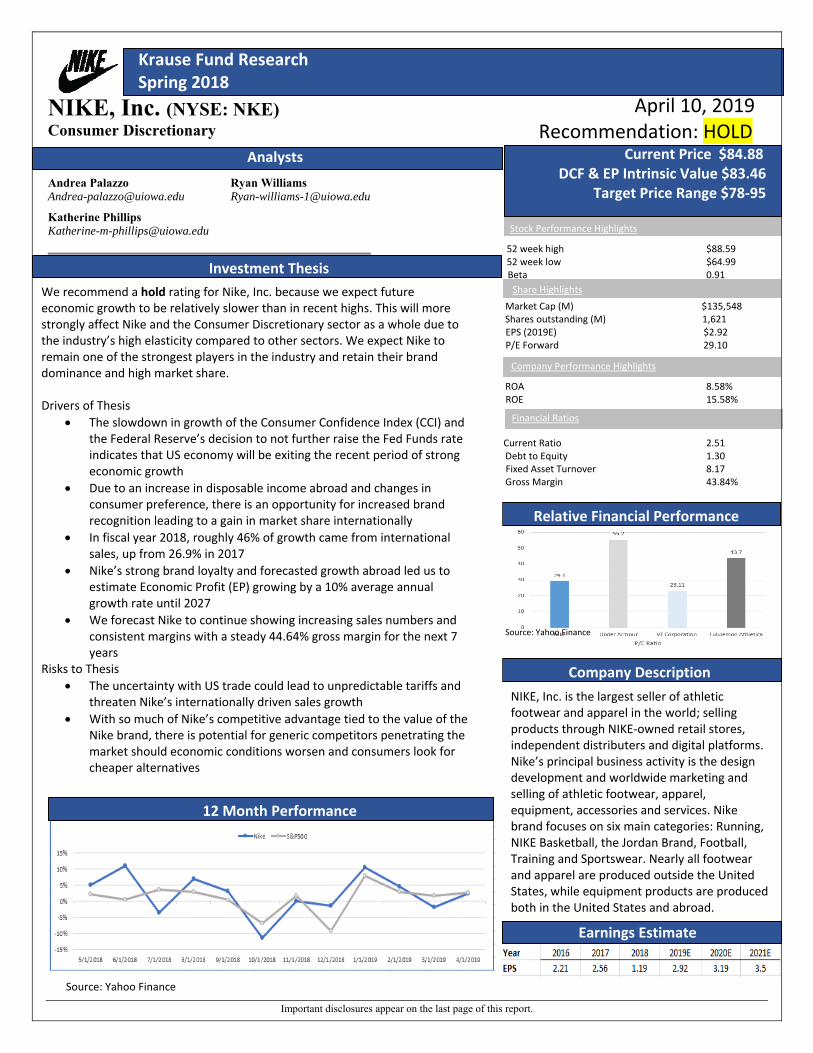
Important disclosures appear on the last page of this report.
Krause Fund Research Spring 2018
NIKE, Inc. (NYSE: NKE) Consumer Discretionary
Andrea Palazzo Ryan Williams [email protected] [email protected]
Katherine Phillips [email protected]
Investment Thesis
April 10, 2019 Recommendation: HOLD Current Price $84.88
DCF & EP Intrinsic Value $83.46 Target Price Range $78‐95
52 week high $88.59 52 week low $64.99 Beta 0.91
Market Cap (M) $135,548 Shares outstanding (M) 1,621 EPS (2019E) $2.92 P/E Forward 29.10
ROA 8.58% ROE 15.58%
Current Ratio 2.51 Debt to Equity 1.30 Fixed Asset Turnover 8.17 Gross Margin 43.84%
Financial Ratios
Analysts
Stock Performance Highlights
Share Highlights We recommend a hold rating for Nike, Inc. because we expect future economic growth to be relatively slower than in recent highs. This will more strongly affect Nike and the Consumer Discretionary sector as a whole due to the industry’s high elasticity compared to other sectors. We expect Nike to remain one of the strongest players in the industry and retain their brand dominance and high market share. Drivers of Thesis
The slowdown in growth of the Consumer Confidence Index (CCI) and the Federal Reserve’s decision to not further raise the Fed Funds rate indicates that US economy will be exiting the recent period of strong economic growth
Due to an increase in disposable income abroad and changes in consumer preference, there is an opportunity for increased brand recognition leading to a gain in market share internationally
In fiscal year 2018, roughly 46% of growth came from international sales, up from 26.9% in 2017
Nike’s strong brand loyalty and forecasted growth abroad led us to estimate Economic Profit (EP) growing by a 10% average annual growth rate until 2027
We forecast Nike to continue showing increasing sales numbers and consistent margins with a steady 44.64% gross margin for the next 7 years
Risks to Thesis
The uncertainty with US trade could lead to unpredictable tariffs and threaten Nike’s internationally driven sales growth
With so much of Nike’s competitive advantage tied to the value of the Nike brand, there is potential for generic competitors penetrating the market should economic conditions worsen and consumers look for cheaper alternatives
Company Performance Highlights
Financial Ratios
Company Description
NIKE, Inc. is the largest seller of athletic footwear and apparel in the world; selling products through NIKE‐owned retail stores, independent distributers and digital platforms. Nike’s principal business activity is the design development and worldwide marketing and selling of athletic footwear, apparel, equipment, accessories and services. Nike brand focuses on six main categories: Running, NIKE Basketball, the Jordan Brand, Football, Training and Sportswear. Nearly all footwear and apparel are produced outside the United States, while equipment products are produced both in the United States and abroad.
12 Month Performance
Earnings Estimate
Source: Yahoo Finance
Relative Financial Performance
Source: Yahoo Finance

1
Economic Outlook U.S. Real Gross Domestic Product (GDP) In the time since the U.S. economy began its recovery from the financial crisis of 2007, U.S. real Gross Domestic Product (GDP) has continued to grow at a consistent, albeit slow rate. Real GDP is one of the broadest economic indicators as it attempts to value all goods and services produced within the U.S. on an annual basis; consequently it is impacted by the successes or failures of every sector contributing to the U.S. economy. Since 2009, real GDP has grown at an average rate of 2.2% per year, including 2.9% growth in 2018. There are two primary reasons why we feel the real GDP growth numbers for 2019 will not exceed those from a year ago. First off is simple regression to the mean. Since 2009, a real GDP growth rate of 2.9% or higher has occurred only one other time; in 2015 real GDP grew by approximately 2.9%. In 2016 and 2017 real GDP grew by 1.6% and 2.1% respectively, for an average real GDP growth rate from 2015‐2017 of 2.2%.1 The second reason to expect a slight decline in GDP growth is the lagging effects of the 35‐day government shutdown. 2019 GDP is expected to be 0.02% lower (about $3 billion) as a result of the shutdown. First quarter results showed the impact to be considerably larger at 0.2% (annualized), though nearly all that spending will be distributed across the remainder of the year resulting in a 0.02% decrease in GDP.2 We predict GDP to continue growing at a steady rate of 2.2% per year moving forward.
Source: www.thebalance.com/us‐gdp‐by‐year1
Consumer Confidence Index (CCI) Strong Consumer Confidence numbers indicate that the short‐term outlook for Nike and the consumer discretionary sector includes strong growth. The Consumer Confidence Index (CCI) is a leading indicator for the US economy and is of import to the consumer discretionary sector as it reflects whether
consumers are optimistic about the direction the economy is headed, or pessimistic. Optimistic consumers tend to feel more secure in their occupations and investments and are thus more inclined to increase spending, while pessimistic consumers feel the need to safeguard their savings to hedge against financial uncertainty. Although the CCI fell from 131.4 in February 2019 to 124.1 in March, the number is still strong. This is only slightly worse than the 127.0 figure from a year ago in March 2018. Moving forward we expect the CCI to remain strong with only a slight decrease of 2.0 as the economy continues to fully recover from the month‐long government shutdown.3
Unemployment & Labor Force Participation Rate The combined impact of an extremely low unemployment rate with a labor force participation rate which has stayed steady since 2013 means that a larger percentage of the U.S. workforce is employed, which is a very good indicator for the consumer discretionary sector as a whole. Due to the non‐essential nature of sector, firms within it such as Nike see a larger boon from strong labor market numbers than other more inelastic sectors might. The unemployment rate is a measure of the percentage of unemployed people relative to the number of workers participating in the labor force. The labor force participation rate measures what portion of the eligible labor force is actively working or seeking work.4,5
Source: Bureau of Labor Statistics4 While the unemployment rate from December 2012 to December 2015 fell from 7.9% to 5.0%, the labor force participation rate similarly fell from 63.7% to 62.7% during that same time. So, despite a much lower unemployment rate, there were not nearly as many people returning to work as that number alone implies. From January 2016 through March 2019, that trend has reversed. Labor force participation is up 1% during that period, while the unemployment rate has continued to drop from 5.0% to 3.8%. We expect both the unemployment rate and the labor force participation rate to increase by about .2% by the end of the year. This is a good

2
sign as previously disgruntled workers continue reentering the workforce.4,5
Source: Bureau of Labor Statistics5
Corporate Costs of Capital The Federal Funds Rate is the rate at which banks borrow from other banks. The Federal Reserve has adjusted their short‐term goals for the Federal Funds Rate and are not expected to make any additional rate increases throughout the remainder of 2019. This is an important economic indicator as it influences the cost of borrowing for firms. We expect the Federal Funds rate to remain between 2.25% and 2.5% in the short‐term, and to be at 2.25% by the end of the year.6
Another key indicator of the corporate costs of capital is the 10‐year U.S. treasury rate. Since the beginning of 2019, 10‐year treasury yield curve rates have declined from 2.66% to 2.55% as of April 12, 2019. The U.S. treasury Yield Curve has inverted from the 1‐year through 7‐year treasuries, which often signifies economic trouble on the horizon. The inversion of the yield curve in combination with the Federal Reserve’s decision to halt their rate increases signifies that the corporate costs of capital moving forward should stay low. While a low cost of capital is typically good, if the reason rates are low is because the Federal Reserve has dropped rates in order to jolt a sputtering economy that is a bad sign which could be even worse for more elastic companies within the consumer discretionary sector.6,7
Source: U.S. Department of Treasury6
Consumer Price Index (CPI) The Consumer Price Index (CPI) is a cost of living driver which takes the weighted average of many goods and services in order to measure the change in costs over time. This is one of the most commonly used measurements for inflation. The change in the CPI can be used to predict other economic indicators as well; when inflation gets too high, the Federal Reserve tends to decrease the reserve requirements allowing banks to lend to other banks at a lower rate, encouraging investment. When inflation is very low (or potentially negative), the opposite action is taken. Since 2012, the CPI has increased at an average annual rate of 1.54%. The rate has been a slightly higher 2.03% looking back only to 2016. This is on the low side historically but is not yet a cause for concern. In the short‐run, a slowly increasing CPI is fine for the consumer discretionary sector so long as real wages continue to increase at their current pace. We expect the CPI to remain at 1.9% moving forward. While the slowly increasing CPI does not indicate that firms across all industries have been able to pass on increased input costs related to U.S. trade tariffs, this is not universally true for industry leaders whose brands are as dominant as Nike. Nike has been able to retain most of their profit margin.
Source: U.S. Inflation Calculator8
Global Sportswear Industry Analysis
Industry Description The global sportswear market is a growing division of the consumer discretionary sector and includes all active apparel, footwear, and accessory sales. In 2018, the global sportswear market generated approximately 174 billion dollars in revenue and is expected to grow to 220 billion by the year 2024. Industry sales are dependent on fluctuations in market dynamics and consumer preferences, with consumers currently demanding functional products that are versatile in style. The global sportswear industry is dominated by a few powerful companies, with Nike and Adidas accounting for 25% of the overall market.9 Companies that operate in selling

3
sportswear, sell their branded products predominantly to retail operations. ⅔ of revenue streams for Nike, Under Armour and VF Corp come from wholesaling operations, including sales to specialty stores, department stores, and national chains.1
Source: Satista 11
Apparel and Footwear The global sportswear market is dominated by apparel and footwear sales. In 2018, the apparel segment accounted for 78.65 billion of the industry’s total revenue and the footwear segment accounted for 36.9 billion of the industry total. Although the footwear sector only currently generates half the revenue totals of apparel, this sector demonstrates greater growth potential. Footwear sales are forecasted to outpace apparel growth in the next several years by 2% and is why industry leaders, like Nike, maintain market share.12
Industry Trends Growing Emphasis on Healthy Living Several social and demographic factors, including the development of a more health conscious public, have placed athletic wear as an integral part in consumers’ everyday lives. Since 2000, US gym membership has more than doubled to 61 million registered members.13 In correlation with the expanding active public, the athletic wear market inflates with a growing consumer market. Development in specialized athletic materials has also made sportswear more comfortable and desirable as an everyday outfit. Consumers are now not only wearing athletic wear in the gym, but enlarging its scope as an everyday wear. Athletic clothes are also becoming a status symbol as brands promote higher quality and style. Lululemon has been successful in developing a premium athletic brand image by rewarding consumers with status in their apparel. These brands are able to charge a premium for their specialized athleisure product offerings. Mass Customization of Product Offerings With the abundance of generic choices in the athletic wear market, consumers are beginning to demand a more personal product. Consumers expect the ability to choose a unique product that conforms to their individual lives. Major players
in the industry have begun efforts to adapt the efficient process of mass production to now allow room for consumer customization. Under Armour, Nike, and Adidas all have successfully launched online platforms that allow consumers to customize material and color of their product.14
Competitive Landscape The industry is predominantly controlled by the 3 largest market cap giants: Nike, Adidas, and Vf corp. Although Nike and Adidas currently dominate sales in the industry, new and developing players are growing at high rates. Lululemon is expected to lead the industry’s growth with an increase in sales of 13.1% and Colombia following with an 8.5% increase in sales. These surpass the industry giant Nike, who maintains a lower growth in sales of 7.7%, due to saturation in the US market.15 Nike remains the leader in the market, with the greatest sales and margins, but as Lululemon grows at more rapid rates they will see a greater threat for loss of market share.
Source: CFRA Industry Report 10 Porter 5 Forces Threat of Competition: High and Increasing The industry is highly fragmented, with an array of similar brands all competing for market share. Nike remains the industry leader, with high brand equity and consumer loyalty, but faces constant pressure from those attempting to penetrate Nike’s premium market and those attempting to steal market share with generic product offerings. Developing brands like Lululemon are maintaining strong growth, as they advertise similar high quality products that sell at premium prices, rivaling well established brands like Nike. Smaller competitors in the industry also continue to enter markets at lower price points, threatening Nike’s dominance in the industry. Threat of New Entrants: Moderate and Increasing It is relatively easy for new brands to enter the sportswear industry, but constructing the high levels of brand loyalty and economies of scale that Nike and VF Corp have developed is

4
relatively unattainable. Success in the industry also requires new entrants to quickly develop a highly technical skill set and invest in high levels of research and development to create the valued quality products that consumers are currently demanding.16
Threat of Substitutes: Moderate and Increasing Private label giants, like Amazon, have begun producing lower cost alternatives. Premium brands have managed to maintain consumer preference, as customers still prefer high quality products from reputable brands, but as Amazon develops higher quality products consumers will become indifferent. The industry is also continuously threatened by discounted counterfeit options that are heavily produced in developing countries. In this time of positive economic growth premium brands hold consumer preference, but any slowdown or complete downturn of the economy will push consumers to these lower cost alternatives.16 Bargaining Power of Suppliers: Low and Decreasing There is an abundance of manufacturing plants globally, especially in developing nations that produce all sporting apparel and footwear at low price points. The large number of suppliers in the market diminish collective supplier power in operative negotiations. It is relatively easy for the major players in the industry to switch suppliers, giving them leverage in pricing negotiations. Bargaining Power of Buyers: Moderate and Increasing With the high volume of competing brand options in the industry, between premium offerings and low‐cost alternatives, consumers have numerous brands they are able to purchase from. Consumers buying power increases as the number of similar alternatives within the industry increases, and there is a surplus of similar product offerings in the market currently. Nike and Lululemon are able to charge premiums for their products, with little worry of consumer price sensitive, given their well‐established brand perceptions and loyalty but smaller less established players are at the will of consumers deciding between an abundance of similar products.
Catalysts for Growth International Expansion The US sportswear market is becoming saturated with big name sportswear options, so industry players must expand to developing regions abroad in order to maintain steady growth levels. Specifically, there is growing potential in the Asian‐Pacific market, which is forecasted to generate 62.6 billion, at an 8.1% CAGR, by the year 2020. This is primarily due to rising disposable income of major countries in the region, like China, where per capita disposable income has more than tripled in the past 10 years. Increasing health concerns among consumers in the region has also expanded potential for sportswear development.17 China will become the largest
fashion market in the world in 2019, showing opportunity for market penetration and major growth potential for premium sportswear brands in the region. Industry leaders have already penetrated this market and are showing rapid growth in sales. Under Armour, a major competitor of Nike, has already predicted a revenue increase in their Asian retail by 22‐24% in the next year.10
Source: The Atlas18
Direct to Consumer As technology develops, direct consumer sales are becoming more prevalent and necessary for continued success in the discretionary sector. Today, ⅔ of consumers expect to be able to connect directly with the brands they shop with. Cutting out the middleman and connecting directly with customers has shown to increase margins and build stronger brand loyalty. Nike predicts its DTC sales to more than double to 16 billion by the year 2020. Under Armour also forecasted to increase DTC sales by 28‐30% in the next several years.18
Key Investment Considerations Positives During this time of high economic growth, the industry is seeing steady levels of high sales growth and increased returns to shareholders. There is also potential for further growth in the sportswear industry, with consumer lifestyles changing and a developing international market. Market leaders, like Nike and Adidas, have also built high brand equity in the market and ensure stable operations for investors. Negatives Due to the industry’s dependence on market fluctuations and consumer spending, it makes investment vulnerable to visible economic slowdown. Nike’s sales are volatile to fluctuations in consumer income, resulting in volatile returns to shareholders. The outcome of any investment in this sector is relatively unstable and reliant on market conditions.

5
Company Analysis Nike, Inc. Business Description Nike, Inc. designs, develops, markets and sells athletic footwear, apparel, equipment, accessories and services worldwide. They hold a diverse athletic platform in the market but hold a majority of share in the footwear industry.19
Nike is recognized as the top within their competitors because of their strategy to deliver must‐have products through the formation of a highly‐known brand name. We believe that Nike will continue to lead the footwear industry because the developments they have with loyal customer relationships from direct to consumer marketing channel and the worldwide presence of the brand.
Corporate Strategy Nike is recognizing that they are starting to grow at a slower pace than 5 or 6 years ago. In June 2017, Nike launched a new corporate plan called Consumer Direct Offense, to better serve customers directly and find a new strategy to match their growth now. The Consumer Direct Offense will grow consumer loyalty and repeat purchases, in turn expanding sales growth. This initiative is led by the Triple Double Strategy that emphasizes innovation, increase speed to market, and develops the direct relationship with consumers.21
A main way Nike is serving consumers directly is by creating a locally known business on a global scale. Nike compromised their geography structure to: North America; Europe, Middle East and Africa (EMEA); Greater China; Asia Pacific and Latin America (APLA) and Global Brand Divisions. Global Brand Divisions represents their overarching global brand platform Nike is changing old models by splitting into several operating segments based on geographic region and offers autonomy to these managing regions to control their own designs. Each segment recognized growth in their revenues and earnings in the prior annual report, excluding the global brand division, which heavily increased advertising costs.19 These
costs were necessary in the expansion of the direct to customer initiatives. In our model’s growth estimates, we projected North America continuing value to be 2%, Greater China to be 8%, APLA 5%, EMEA 4% and Global divisions to be 1%. We see Nike finding more growth in areas outside of the United States and will have a more areas of growth there because they are already prevalent and the top footwear brand in the US. In Q3 earnings reported on March 21, the Consumer Direct Offense strategy delivered wide growth across all geographies, but was led by continued expansion in China. Because of the positive result being shown from this new initiative, we see Nike continuing to serve customers in a changing retail environment with this plan. In years to come, they plan to invest more in opportunities to increase Nike’s digital transformation and continue the strong profitable growth in the upcoming fiscal years and later on.20
Products Lines Nike’s product line include footwear, apparel, equipment and the brands of Converse and Hurley. The Footwear sector dominates NIKE revenues with Sportswear, Running, and Jordan brands leading these sales for 2019.20 For fiscal year 2018, Footwear showed 22,268 in revenue growing 5.6% from 2017 revenue. Apparel coexists with footwear sales, often being sold as a collection, with sportswear and running categories driving sales in this category. For fiscal year 2018, the apparel sector reported 10,733 in revenue, growing 11.18% from 2017. The equipment and accessories operating segment bring in a small percentage of total revenues and show a decline in earnings. They reported 1396 in revenue, a 2% decline, for 2018.21
Converse is a wholly owned subsidiary driving sales from the sale of casual sneakers. Converse make up only 5% of total revenues for Nike. Reported on a currency‐neutral basis, revenues for Converse declined 11% for fiscal 2018.21 We believe the revenue decline Converse comes from a fashion shift in what people are wearing. The brand positioning of Converse is changing and is not the top casual shoe consumers are wearing. Hurley is another wholly owned subsidiary focusing on action sports and youth apparel.21
Footwear The largest product line for Nike is Footwear, making up 61% of total revenues for the company in 2018. Footwear revenues decreased 4% for FY 2018 in North America as lower revenues in all categories more than offset higher revenues in Sportswear.21 We believe Nike saw a decrease in revenue for Footwear during the most recent fiscal year because selling &
Source: Nike Annual Report 201821

6
administrative expenses grew from higher overhead expense as well as demand creation expenses increased. Higher sports marketing costs were only partially offset by lower retail brand costs. Although they saw a decrease for this product line, there was an overall increase shown for growth of Nike in FY 2018. This mostly from their high investment to support the Triple Double and Consumer Direct Offense strategies to fuel long‐term growth. Because footwear is the largest product line within the business, they emphasize new product and innovations to come. Nike is in the works to come out with a Self‐Lacing HyperAdapt sneaker in 2019. Nike sees that in the future self‐lacing shoes may become the norm for shoes. We expect the release of this new shoe to once again increase their position with competitors given the new lifestyle trends and increase in prices. This initiative will align with new corporate strategy, Consumer Direct Offense, and we for see them using the future feedback to the strategy to capitalize on consumer trends and wants. Apparel The apparel product line of Nike makes up approximately 30% of total revenues. We expect Nike’s lines of Sportswear, Training, and Running to continue to be the top‐selling apparel categorize for Nike. In FY 18, there was a 9% growth in revenue for apparel which mostly came from higher revenue from Sportswear and NIKE Basketball categories.21 The major growth we see within the apparel product line is leisurely items. There has been a recent fashion shift to leisure wear being an everyday outfit for women and men, predominantly in the United States. New major competitors like Lululemon Athletic Inc., sell items that are bought for casual and lifestyle purposes. Nike must continue to sell and find their niche within the leisure apparel area. It is important for Nike to find the preferences and needs of leisure, sportswear, and training for their consumers to be present in all markets. Equipment Nike sells a line of equipment including bags, balls, socks, eyewear, digital tracking devices, bats, gloves, protective gear, and other specialized equipment for sports activities. Equipment only makes up about 4% of the product sold by the company.21 Since this product area only counts for a small percentage of the total company, there is limited growth we see Nike making in the future here. The only area for growth we see is within digital tracking devices. Tracking devices are the newest thing on the market for individuals to follow their workouts and daily activity. Companies like Apple, Fitbit, Garmin and more lead the market for digital tracking devices. Right now, Nike has mobile applications like Nike+ and Nike Training which can be synced to most major tracking devices. We see Nike continuing to make new update to their digital training application with advancement in technology through footwear and apparel lines.
Converse and Hurley Converse sells casual sneakers, apparel and accessories under the Chuck Taylor, Converse, All Star, One Star, Star Chevron and Jack Purcell trademark. Hurley focuses on action sports and youth apparel. Converse generated an average of ‐1.5% decrease growth rates in sales from 2016 to 2018.21 In 2018 alone, there was a ‐7.5% decrease. We think that Converse and Hurley should put their focus new designs for their products to regain the market share of footwear and apparel of casual wear.
Source: Nike Annual Report 201821
Financial Summary and Recent Earnings Nike release 2019 Q3 earnings on March 21, 2019. Total revenue and earnings beat what analysts expected. EPS came in at $0.68 compared to the expected of $0.65. Revenue came in as $9.611 billion, coming in right under the expected of $9.612 billion.22 Earnings per share was driven by strong revenue growth and expansion of gross margins.22 North American sales were up 7% but this was below what was expected by investors, mostly being 10%. This gap between actual and expected caused the stock to drop around 4% after the earnings report came out. We think that since Nike already has brand loyalty and presence in North America, they are coming up on a steady state of growth within this segment. This is why we projected growth for Greater China to increase more in future year than for North America. Nike goals through FY23 include high single‐digit revenue growth, gross margin expansion of as much as 50 basis points, mid‐teens earnings per share growth; and low‐thirties percentage rate of return on invested capital.21 We expect Nike to be able to meet these goals with the promising earnings reported for Q3.

7
Source: Nike FY19 Financial Schedules and Key Financial Metrics20
Manufacturing and Distribution Virtually all of NIKE's products are manufactured outside of the US by independent contractors. The footwear line is manufactured in 124 factories in 13 countries with 94% of product manufactured in fiscal year 2018 produced in Asian countries. The apparel line is manufactured in 328 factories in 37 countries with 54% produced in Asian countries.21 This keeps production costs low and the large accumulation of supplier’s hedges risk against Trump Tariff implications. Protectionist trends are predicted to affect the industry as a whole, possibly leading to increased production costs, but will remain relatively insignificant in the long term earnings.21 Nike has a greater potential to pass increased prices along to their consumers, since they are the premier wholesaler to their competitors. Sojitz Corporation of America, a Japanese trading company, has a large control over import/export financing for NIKE. Current agreements expire May 31, 2019 and any disruption to a continued deal would result in a negative impact to sales from developing regions.21
The world‐wide trade tendency of countries moving towards a more isolationist trading agenda has both actualized and potential negative consequences for Nike who, according to the section Manufacturing on Nike’s 2018 10‐K, manufactures nearly 26% of all Nike apparel in China, including 47% of their footwear products.21 Additionally, while the United States “Tax Act” lowers future tax obligations for large companies in future years, those which have significant operations overseas were subject to a transition tax for the repatriation of undistributed foreign earnings.
Catalyst of Growth and Change Changes in Demand Creation On February 24, Nike came out with a new campaign that was a mix from the original “Just Do It” Slogan they are originally known for. The “Dream Crazier” campaign highlighted women’s athletic abilities are crazy but they also are
attainable. Serena Williams narrated the campaign highlighting the criticism women get for wanting equal opportunity in sports and facing adversity. It also highlights all the accomplishments women have had in sports describing them as “crazy” but showing pride in being crazy. These efforts that Nike is making to make a statement in the world in a new way they can find growth for their brand. Supporting rights that are heavily talked about and giving a stance can be controversial but also impactful. From 2017 to 2018 there was about a 7% increase in demand creation expenses. We project that in 2019, it will increase about 3%. We think that Nike will continue to make more campaigns like this in the future and have projected that in our models. We see this as an essential way for Nike to continue their brand loyalty and make an impact on their consumers.
SWOT Analysis Strengths Brand Loyalty Nike’s brand loyalty is their main way they attract consumers and is a strong lead for their sales. As the global leader in athletic footwear and apparel in the world, the brand and logo of Nike is instantly recognizable.21 The iconic “Swoosh” is known to be their most valuable asset and is registered as trademark in 170 jurisdictions worldwide.21 The logo is seen on professional sports leagues uniforms, collegiate athletes, and a number of other national sporting teams. In recent news, it was announced that Nike will be the official uniform and footwear supplier of the MLB, taking over the contract from the main competitor, Under Armour.23 We believe the success of the company is dependent on maintaining and advancing their brand loyalty and reputation among consumers. The continued marketing and design advancements must be adaptable to the changes in the media and digital advertising, in order to keep up the attractable brand. Global Market Recognition Nike products are sold in 170 countries and since 2005, more than 50% of their revenue has come from sales outside of the United States.24 The Nike Brand is separated into operating segments of: North America; Europe, Middle East & Africa; Greater China; Asia Pacific & Latin America. The global advantage and expansion that Nike has given them an edge over the other competitors within their industry. According to the Executive VP and CFO, Andy Campion, the footwear and apparel industries in international markets are larger in aggregate than in the U.S. These markets are fast change and when sports grow in other countries, so does Nike. In fiscal year 2018, North America has a ‐2% change growth, while the other three segments outside the U.S. had 9% or above change in growth, Greater China leading with 21%21. These statistics show that international growth has a large percentage of their yearly revenue and is a driving force for the company's growth.

8
We believe that there is more growth and potential for the international segments of Nike and should be a continued focus, as they are producing a high amount of revenue for the company.
Source: Nike Annual Report 201821
Weaknesses Limitations in Product Mix Nike’s main driver of revenue is the footwear product line, which saw a 5.25% change from 2017 to 2018.25 As this is making up over half of their revenue, Nike is becoming dependent on the sales of footwear in order to see success and survival of the company. In times of recession or unforeseen economic conditions, Nike can see a decline in sales because of their specific segment alignment. The high priced and luxury footwear product can be a weakness for the company during low consumer spending times. Nike is dependent on one area within their sector and we see there to be potential to diversify their product line and mix horizontally and vertically to include more apparel and accessory items. Independent Contractors and Labor Controversies Nike manufactures their products from independent contractors outside of the United States. A main disadvantage of independent international contractors subjects the firm to “headline” risks when things are uncontrolled. As these contractors do not comply with the laws and upholding of the company’s mission and vision, it could potentially be harmful for the business. Nike has license agreements that permit third parties from manufacturing their products, and have code of conduct rules on health and safety standards.21 In the past, Nike has been publicized for poor production and workplace conditions. This weakness directly deteriorate the brand image and sales of Nike. It could be a potential recommendation for Nike to change manufacturer supplying in years to come but is not a main investment that should be made now. Opportunities Technology Development Intertwining technology with fitness is the new development that many companies have been recently merging. Nike already relies heavily on specialists within biomechanics, chemistry, exercise physiology, engineering and more to research and develop the newest and greatest performance products.21 Nike already has applications and fitness tracking devices. With the top‐line research and development that Nike has, we believe that they can advance more with the opportunity of technology. The world is going towards digital‐
everything and becoming reliant on it more than ever. The market is willing to spend money on the cutting‐edge new technologies being developed. Some potential ideas could be clothing or footwear that monitors heart rate and tracks fitness progress. Product and Gender Expansion Majority of Nike products are focused towards athletic apparel. A recent trend within the last few years has been the rise of athleisure wear, meaning athletic apparel that can be worn in a non‐athletic setting. This trend of casual wear has been more acceptable in social and professional settings. According to some analysts, this is not a fad or a trend that is going to be leaving the market soon. It is “a lifestyle that is too comfortable for consumers for it to go away anytime soon”.26 A majority of athleisure clothing is worn by women, for example the popular trend of yoga pants. Nike has the opportunity to expand their sales and reach more women with the trend of athleisure and changing trends. In addition to the gender expansion, they potentially can develop clothing for smart‐casual business attire. Expanding their product line can give a competitive edge over opponents within the industry. Threats Top Competitor in the Industry The athletic footwear, apparel, and equipment industry is competitive on a worldwide basis. Nike is the largest seller and leader within the industry. They are seen as most competitive because of their quality products, consumer loyalty, and distributing and sourcing.21 As being the top leader within the industry, this creates a target on Nike’s back to be “the ones to beat.” With the high competition, comes companies trying to replicate the products that Nike has. There are hundreds of other companies creating athletic, athleisure, and comfortable clothing and footwear. Since Nike is at a high price margin per product, there are cheaper and similar products consumers can buy that nearly mimic the apparel and footwear. The argument for Nike is that their clothes are sold at a higher margin because of better quality products. In order to set Nike apart from the competitors, they must continue to expand their brand and focus on what the consumer is wanting.
Source: Statista27

9
Foreign Transactions Nike is heavily involved with other countries from manufacturing, revenue growth, and their major operating segments. A major threat that is involved with international prevalence is foreign transaction fees. Nike’s income before taxes decreased 11% in fiscal year 2018 and their gross margin decrease 8‐ basis points. These two factors were primarily due to foreign currency exchange rates negatively impacting their financials.21 The fluctuations in foreign currency have affected and potentially can continue to affect the operations and business of Nike.
Valuation Analysis
Revenue Decomposition Due to the saturation of the apparel and footwear markets in North America, we predict Nike’s sales growth will be driven by operations abroad in the Asia Pacific and Greater China markets. In FY18 North American sales declined by 2.4%, and recent Q3 earnings showed 3% less growth than analysts forecasted, coming in at 7% as opposed to 10%. We predict sales to initially recover due to Nike’s recent increased focus on marketing campaigns as well as an increase in consumer spending attributable to the recent positive economic conditions seen in the US. However, due to the saturation of Nike’s North American market, we forecast North America growth to remain at 2.9% until 2022, after which it will steadily decline to a steady rate of 2.0%. We forecast the greatest growth potential to come from the China and Asia Pacific regions. The 21.2% sales growth for Greater China in FY18 is not sustainable long term, but we predict that the growth rate in the region should remain a strong 15% until 2023. This is due in part to increases in consumer disposable income and changes in consumer trends in the Asian regions. In all geographic areas, we predict the growth rate to slowly decline as they approach a steady state in 2027 due to forecasted economic slowdowns in the next 5‐7 years.
Cost of Sales Nike’s cost of sales consists primarily of inventory costs and warehousing costs, and have historically averaged 55% of total sales. In FY 2018 Nike increased margins slightly to 56.16% of total sales, but due to implementation of more lean production models this percent should return to the historical average in 2019. We predict that Nike will keep operating at these historical margins until FY 2027. Since total cost of sales primarily consists of inventory costs, we forecast the total cost of sales to increase proportionally with sales growth
expectations. There is uncertainty surrounding U.S. trade tariffs and this brings us to believe that tying cost of sales to total revenue provides the most accurate projection possible.
CV Growth We forecast a CV growth rate of 4.0% based off our long‐term GDP growth estimate of 2.2%. We predict that in the long‐term sales growth for sports apparel and footwear will increase at a faster rate than GDP.
Selling and Administrative Expense Overall total selling and administrative expense will slightly decrease to 30.9% in 2027 CV due to decreasing depreciation and amortization expenses as well as an increase in demand creation expense. Demand creation expense consists of advertising and promotion costs, which include athlete endorsements and digital advertisements. We predict demand creation expense to initially increase as Nike develops brand equity in international markets. The demand creation expense will remain tied to revenue growth because as sales increase, Nike will continue steady sales promotion of the brand.
Capital Expenditures We forecast Nike to only invest in replacing deteriorated equipment and maintaining business operations. Since production for the majority of their inventory is outsourced, they do not require heavy investment in new equipment and machinery related to production. Nike outsources almost all manufacturing costs resulting in lower than industry average fixed asset replacement costs. We utilized inflation as a replacement rate for our capital expenditures forecast. Because they do not manufacture the majority of their inventory, the inflation rate serves as the cost of replacing equipment or facilities primarily related to operating overhead and administrative operations.
Weighted Average Cost of Capital (WACC) We used Nike’s WACC estimation to forecast the intrinsic stock value in the DCF and EP models. The WACC was used to discount the cash flows to present value. Cost of Debt Nike’s debt is classified as investment grade AA‐ by the S&P rating, resulting in relatively low cost of debt. Because there are no relevant bonds maturing in our forecasted horizon, we utilized FactSet’s estimated 3.36% pre‐tax cost of debt. The 2018 marginal tax rate decreased to 12.0% in light of recent tax cuts, further lowering total after‐tax cost of debt and the overall WACC estimate.

10
Cost of Equity To estimate cost of equity, we utilized the capital asset pricing model (CAPM). We used the 10 year treasury yield of 2.48% as our risk‐free rate and a raw beta of 0.91 from Bloomberg. The risk premium of 5.08% was sourced from Damodaran as a reliable source of future market premiums. These low estimates for cost of debt and cost of equity multiplied by their weights resulted in a relatively a low WACC of 6.89%.
Valuation Models Our DCF and EP models resulted in an intrinsic stock value of $83.46. For our DCF and EP models, we used an estimated CV growth rate of 4.00% and a 7‐year forecasted horizon. We believe Nike will grow operations until it reaches steady state growth by 2027. In our DCF analysis we grew NOPLAT until 2027 and subtracted out the change in invested capital to obtain our Free Cash Flow (FCF) valuation. Once we calculated our CV value, we discounted these cash flows to reach the value of operating assets. In our EP analysis we forecasted beginning Invested Capital (IC) and multiplied it by the difference between the forecasted ROIC and WACC to get the EP for each year along the forecasted horizon. We then discounted these values back, using the estimated WACC, and summed them together with beginning invested capital to reach the value of operating assets. In both models, we added back non‐operating assets and subtracted out non‐operating liabilities to arrive at our value of equity. Finally, we divided by shares outstanding and multiplied by a partial year adjustment to result at our final intrinsic stock value of $83.46. The DDM model for Nike calculated an intrinsic stock value of $103.74. We believe the DDM model artificially inflates the price due to its high EPS estimates for the CV year relative to their direct competitors. The high EPS CV year estimate is high as a result of our forecast that Nike will continue it’s trend of repurchasing shares of common stock. Because this is the tactic Nike has employed in recent years it was projected that the trend would continue, however it is unclear at what point they will inevitably stop their repurchasing. It is distinctly possible that they stop repurchasing shares before our CV year of 2027, in which case their EPS CV year would be lower than our current projection of $5.48 resulting in a lower projected future stock price. Despite guidance from management suggesting that future dividend payments will continue to increase steadily, having so much of the DDM model valuation reliant on their continued dedication to repurchasing shares makes using the DDM model an inferior option compared to the DCF and EP models. Due to its being less reliable, the DDM valuation was considered less in determining the target price. Using the relative valuation model, we calculated an implied relative value of $100.17 by multiplying the average forward
P/E ratio of 33.36 for comparable firms by Nike’s $2.92 EPS forecast for 2019. The comparable firms chosen were: Adidas, Columbia Sportswear Co., Lululemon Athletic Inc., VF Corporation, and Under Armour Inc. These five companies were chosen because they are all major competitors in athletic apparel or footwear, and each have similar market caps to Nike. Although we believe this model to be more accurate than the DDM model, the competitor average forward P/E ratio is considerably higher than Nike’s forward P/E projection due to the inclusions of Under Armour and Lululemon which skews the valuation high. Lululemon is valued as a growth firm rather than a value as their 55.20 forward P/E ratio indicates, and recent declines in brand popularity have severely damaged Under Armor in recent years.
Sensitivity Analysis We used a variety of data tables to compare two independent variables in our model and their impact on Nike’s stock price.
WACC to CV Growth We chose to analyze price sensitivity with the WACC because we use this rate as the discounting rate for the DCF and EP models, ultimately driving the estimated intrinsic price. A 0.10% increase in the WACC has a negative impact on our price of $3. Our CV growth is also important in our valuation because it is the rate we expect Nike to grow once in steady state and will ultimately impact future share price. A 0.25% increase in CV growth increases the price by $6.00. Because of the integral nature of these two rates in our models, slight changes in their value skew our price estimation.
Beta to Risk Premium Beta and risk premium estimates drive the cost of equity calculation, controlling our overall WACC estimation. Nike’s equity has a 94.8% weight, resulting in the cost of equity driving the largest part of the WACC. A 0.01 increase in beta decreases the share price roughly by $1.47 and a 0.01 decrease in beta resulted in a $1.51 price increase. A 0.1% increase in risk premium resulted in a $2.60 decrease in share price and a 0.1% decrease in risk premium resulted in a $2.75 increase in price. Both variables inversely alter the price estimation but

11
the price demonstrates more volatility to changes in beta than changes in the risk premium.
CV Demand Creation % of Revenue to CV Operating Overhead % of Revenue Demand creation and operating overhead expenses make up majority of Nike’s total selling and administrative expenses. Total selling and administrative expenses influences the EBITA used for the NOPLAT calculation, which ultimately flows into our DCF and EP models. A 0.1% increase in both demand creation and operating expenses decreases price by $0.90. These two variables result in the same impact on price and cause little variations in share prices.
CV ROIC to Cost of Equity Cost of equity, through the calculation of WACC, and CV ROIC are both used to calculate the continuing value in our valuation models. A 0.5% change in cost of equity barely fluctuates our price estimates, moving it only by a few cents. A 1% increase in CV ROIC results in an approximate 50 cent price increase. Both CV ROIC and the cost of equity show minimal impact on Nike’s estimated value.
Pre‐Tax Cost of Debt to Marginal Tax Rate Pre‐tax cost of debt and the marginal tax rate were both used to calculate the after‐tax cost of debt used in the WACC calculation. The 0.1% change in pre‐tax cost of debt only inversely impacts the price by a 0.01 change. The 0.5% change in the marginal tax rate also inversely impacts the price with a $0.78 change. Since the pre‐tax cost of debt is estimated to be low for Nike, we see more price sensitivity to changes in the marginal tax rate.

12
Important Disclaimer
This report was created by students enrolled in the Security Analysis (6F:112) class at the University of Iowa. The report was originally created to offer an internal investment recommendation for the University of Iowa Krause Fund and its advisory board. The report also provides potential employers and other interested parties an example of the students’ skills, knowledge and abilities. Members of the Krause Fund are not registered investment advisors, brokers or officially licensed financial professionals. The investment advice contained in this report does not represent an offer or solicitation to buy or sell any of the securities mentioned. Unless otherwise noted, facts and figures included in this report are from publicly available sources. This report is not a complete compilation of data, and its accuracy is not guaranteed. From time to time, the University of Iowa, its faculty, staff, students, or the Krause Fund may hold a financial interest in the companies mentioned in this report.

13
References 1Amadeo, K. (2019). US GDP by Year Compared to Recessions and Events. Retrieved from https://www.thebalance.com/us‐gdp‐by‐year‐3305543 2Congressional Budget Office. (2019). The Effects of Partial Shutdown Ending January 2019. Retrieved from https://www.cbo.gov/system/files?file=2019‐01/54937‐PartialShutdownEffects.pdf 3The Conference Board. (2019). Consumer Confidence Survey. Retrieved from https://www.conference‐board.org/data/consumerconfidence.cfm 4Bureau of Labor Statistics. (2019). Labor Force Statistics from the Current Population Survey. Retrieved from https://data.bls.gov/timeseries/lns14000000 5Bureau of Labor Statistics. (2019). Civilian labor force participation rate. Retrieved from https://www.bls.gov/charts/employment‐situation/civilian‐labor‐force‐participation‐rate.htm 6U.S. Department Of The Treasury. (2019). Daily Treasury Yield Curve Rates. Retrieved from https://www.treasury.gov/resource‐center/data‐chart‐center/interest‐rates/pages/TextView.aspx?data=yieldYear&year=2019 7Trading Economics. (2019). United States Fed Funds Rate. Retrieved from https://tradingeconomics.com/united‐states/interest‐rate 8U.S. Inflation Calculator. (2019). Consumer Price Index Data from 1913 to 2019. Retrieved from https://www.usinflationcalculator.com/inflation/consumer‐price‐index‐and‐annual‐percent‐changes‐from‐1913‐to‐2008/ 9Statista. (2018) Sportswear/Sporting Goods Companies Ranked by Worldwide Revenue in 2017. Retreived from https://www.statista.com/statistics/241885/sporting‐goods‐‐sportswear‐companies‐revenue‐worldwide/ 10Yanushevsky, Camilla, and Xiong Goon Jun, Xiong. (2019). CFRA Industry Surveys: Textiles, Apparel & Luxury Goods. Retrieved from NetAdvantage. 11Statista. (2019). Total Revenue of the GLobal Sports Apparel Market From 2012 to 2024. Retreived from https://www.statista.com/statistics/241885/sporting‐goods‐‐sportswear‐companies‐revenue‐worldwide/ 12Statista. (2019). Value of the Sports Apparel and Footwear Markets Worldwide. Retrieved from https://www.statista.com/statistics/915105/value‐of‐the‐sports‐apparel‐and‐footwear‐markets‐worldwide/ 13Statista. (2019). Total Number of Memberships at Fitness Centers in The US from 2000 to 2017. Retrieved from https://www.statista.com/statistics/236123/us‐fitness‐center‐‐health‐club‐memberships/ 14 Barker, J. (2018). Under Armour, Nike, Adidas race to 'personalize' products with new technology. Retrieved from https://www.baltimoresun.com/business/under‐armour‐blog/bs‐bz‐under‐armour‐customize‐20171206‐story.html
15 Statista. (2019). Sales Growth Forecast of the Leading Sportswear Companies Worldwide. Retreived from https://www.statista.com/statistics/900293/sales‐growth‐forecast‐of‐the‐leading‐sportswear‐companies‐worldwide/ 16 Capital Group. (2019). Athletic Wear is Leading the Pack in the Apparel Industry. Retrieved from https://www.capitalgroup.com/pcs/latest‐perspectives/athletic‐wear‐leading‐pack.html 17 Allied Market Research. (2019) Asia‐Pacific Sports Apparel Market is Estimated to Garner $62.6 Billion, by 2020. Retrieved from https://www.alliedmarketresearch.com/press‐release/asia‐pacific‐sports‐apparel‐market.html 18 Romero, L., & Romero, L. (2018, January 11). Projections of economic growth in emerging markets in 2018. Retrieved from https://www.theatlas.com/charts/By61lmBEG 19Nike, Inc. (2019), “Form 10Q 2019” Retrieved from www.investors.nike.com 20Nike, Inc (2019), “2019 Third Quarter Results” Retrieved from www.investors.nike.com 21 Nike, Inc (2018), “Form 10K 2018” Retrieved from www.investors.nike.com 22Thomas, L. (2019, March 21). Nike shares fall after North American sales growth disappoints. Retrieved from www.cnbc.com 23Brown, M. (2019). MLB Officially Partners With Nike And Fanatics; Nike To Be Official Uniform And Footwear Provider. Retrieved from http://www.forbe.com 24Media Corporate Net, “Nike Growth Story: It Started With A Handshake” Retrieved from www.media.corporate‐irl.net 25 Nike, Inc. (2019), “Fiscal 2019 Second Quarter Results”, Retrieved from www.investors.nike.com 26Petro, G. (2015). Lululemon, Nike And The Rise Of 'Athleisure'. Retrieved from https://www.forbes.com/sites/gregpetro/2015/09/16/lululemon‐nike‐and‐the‐rise‐of‐athleisure/#5ed07d4a37c8 27Statista. (2018). Global revenue of Nike and Adidas. Retrieved from www.statista.com

Nike, Inc.
Revenue Decomposition
Fiscal Year Ending May 31st 2016 2017 2018 2019E 2020E 2021E 2022E 2023E 2024E 2025E 2026E 2027CV
Revenue
Geographic Region
North America 14,764 15,216 14,855 15,286 15,729 16,185 16,574 16,971 17,379 17,796 18,223 18,587
Greater China 3,785 4,237 5,134 5,904 6,790 7,808 8,979 10,057 11,264 12,390 13,629 14,719
Europe, Middle East, & Africa 7,568 7,970 9,242 10,074 10,980 11,969 12,926 13,960 15,077 16,132 17,100 17,784
Asia Pacific & Latin America 4,317 4,737 5,166 5,683 6,251 6,876 7,564 8,093 8,659 9,179 9,730 10,216
Global Brand Divisons 73 73 88 90 92 93 95 97 99 101 103 104
Total Nike Brand 30,507 32,233 34,485 37,036 39,842 42,931 46,138 49,179 52,478 55,599 58,785 61,412
Converse 1,955 2,042 1,886 1,943 2,001 2,061 2,123 2,186 2,252 2,320 2,389 2,413
Corporate (86) 75 26 26 26 26 26 26 26 26 26 26
Total Revenues 32,376 34,350 36,397 39,005 41,868 45,018 48,287 51,391 54,756 57,944 61,201 63,851
Growth Rates
Geogrpahic Region
North America 7.5% 3.1% ‐2.4% 2.9% 2.9% 2.9% 2.4% 2.4% 2.4% 2.4% 2.4% 2.0%
Greater China 23.4% 11.9% 21.2% 15.0% 15.0% 15.0% 15.0% 12.0% 12.0% 10.0% 10.0% 8.0%
Europe, Middle East, & Africa 6.2% 5.3% 16.0% 9.0% 9.0% 9.0% 8.0% 8.0% 8.0% 7.0% 6.0% 4.0%
Asia Pacific ‐7.2% 9.7% 9.1% 10.0% 10.0% 10.0% 10.0% 7.0% 7.0% 6.0% 6.0% 5.0%
Global Brand Divisions ‐36.5% 0.0% 20.5% 2.0% 2.0% 2.0% 2.0% 2.0% 2.0% 2.0% 2.0% 1.0%
Total Nike Brand 6.3% 5.7% 7.0% 7.4% 7.6% 7.8% 7.5% 6.6% 6.7% 5.9% 5.7% 4.5%
Converse ‐1.4% 4.5% ‐7.6% 3.0% 3.0% 3.0% 3.0% 3.0% 3.0% 3.0% 3.0% 1.0%
Corporate 4.9% ‐187.2% ‐65.3% 0.0% 0.0% 0.0% 0.0% 0.0% 0.0% 0.0% 0.0% 0.0%
Total Revenues 5.8% 6.1% 6.0% 7.2% 7.3% 7.5% 7.3% 6.4% 6.5% 5.8% 5.6% 4.3%
% of Total Net Revenue
Geographic Region
North America 45.6% 44.3% 40.8% 39.2% 37.6% 36.0% 34.3% 33.0% 31.7% 30.7% 29.8% 29.1%
Greater China 11.7% 12.3% 14.1% 15.1% 16.2% 17.3% 18.6% 19.6% 20.6% 21.4% 22.3% 23.1%
Europe, Middle East, & Africa 23.4% 23.2% 25.4% 25.8% 26.2% 26.6% 26.8% 27.2% 27.5% 27.8% 27.9% 27.9%
Asia Pacfic 13.3% 13.8% 14.2% 14.6% 14.9% 15.3% 15.7% 15.7% 15.8% 15.8% 15.9% 16.0%
Global Brand Divisions 0.2% 0.2% 0.2% 0.2% 0.2% 0.2% 0.2% 0.2% 0.2% 0.2% 0.2% 0.2%
Total Nike Brand 94.2% 93.8% 94.7% 95.0% 95.2% 95.4% 95.6% 95.7% 95.8% 96.0% 96.1% 96.2%
Converse 6.0% 5.9% 5.2% 5.0% 4.8% 4.6% 4.4% 4.3% 4.1% 4.0% 3.9% 3.8%
Corporate ‐0.3% 0.2% 0.1% 0.1% 0.1% 0.1% 0.1% 0.1% 0.0% 0.0% 0.0% 0.0%
Total Revenues 100.0% 100.0% 100.0% 100.0% 100.0% 100.0% 100.0% 100.0% 100.0% 100.0% 100.0% 100.0%

Nike, Inc.
Income Statement
Fiscal Year Ending May 31st 2016 2017 2018 2019E 2020E 2021E 2022E 2023E 2024E 2025E 2026E 2027CV
Revenues 32,376 34,350 36,397 39,005 41,868 45,018 48,287 51,391 54,756 57,944 61,201 63,851
Cost of sales 17,405 19,038 20,441 21,593 23,178 24,922 26,731 28,450 30,313 32,078 33,880 35,348
Gross Profit 14,971 15,312 15,956 17,412 18,690 20,096 21,555 22,941 24,443 25,866 27,320 28,503
Expenses:
Demand creation expense 3,278 3,341 3,577 4,073 4,372 4,701 5,043 5,367 5,718 6,051 6,391 6,668
Operating overhead expense 6,529 6,506 7,160 7,364 7,904 8,499 9,116 9,702 10,337 10,939 11,554 12,054
Depreciation expense 649 706 747 906 915 926 939 952 967 983 999 1,017
Amortization expense 13 10 27 27 27 27 27 27 27 27 27 27
Total selling and administrative 10,469 10,563 11,511 12,370 13,219 14,153 15,124 16,048 17,049 18,000 18,971 19,766
Other Income (Expense):
Interest expense (income), net 19 59 54 263 269 292 317 379 375 408 514 485
Other (income) expense, net (140) (196) 66 66 66 66 66 66 66 66 66 66
Income before income taxes 4,623 4,886 4,325 5,371 5,807 6,301 6,814 7,338 7,835 8,341 8,929 9,289
Income tax expense 863 646 2,392 644 697 756 818 881 940 1,001 1,071 1,115
Income (loss) from Discontinued Operations
Net Income 3,760 4,240 1,933 4,726 5,110 5,545 5,996 6,458 6,894 7,340 7,857 8,174
Weighed Average Shares Outstanding 1,698 1,658 1,624 1,621 1,602 1,586 1,573 1,562 1,553 1,531 1,511 1,492
Basic EPS 2.21$ 2.56$ 1.19$ 2.92$ 3.19$ 3.50$ 3.81$ 4.13$ 4.44$ 4.79$ 5.20$ 5.48$
Dividends Declared Per Common Share 0.62$ 0.70$ 0.78$ 0.84$ 0.92$ 1.00$ 1.10$ 1.19$ 1.28$ 1.38$ 1.49$ 1.57$

Nike, Inc.
Balance Sheet
Fiscal Year Ending May 31st 2016 2017 2018 2019E 2020E 2021E 2022E 2023E 2024E 2025E 2026E 2027CV
Assets
Current Assets
Cash & equivalents 3,138 3,808 4,249 2,744 3,882 5,104 7,132 8,504 10,665 13,515 14,714 17,193
Short‐term investments 2,319 2,371 996 997 998 999 1,000 1,001 1,002 1,003 1,004 1,005
Accounts receivable, net 3,241 3,677 3,498 3,943 4,232 4,551 4,881 5,195 5,535 5,857 6,186 6,454
Prepaid expenses & other current assets 1,489 1,150 1,130 1,525 1,638 1,763 1,900 2,050 2,215 2,398 2,599 2,821
Inventories 4,838 5,055 5,261 5,603 6,021 6,479 6,982 7,534 8,142 8,811 9,550 10,367
Total Current Assets 15,025 16,061 15,134 14,811 16,771 18,896 21,894 24,284 27,559 31,584 34,053 37,840
Property, plant & equipment, net 3,520 3,989 4,454 4,499 4,552 4,613 4,681 4,754 4,831 4,913 4,998 5,086
Identifiable intangible assets, net 281 283 285 258 231 204 177 150 123 96 69 42
Goodwill 131 139 154 154 154 154 154 154 154 154 154 154
Deferred income taxes & other assets 2,439 2,787 2,509 2,319 2,440 2,624 2,827 3,050 3,295 3,565 3,863 4,193
Total Assets 21,396 23,259 22,536 22,041 24,148 26,491 29,733 32,391 35,962 40,312 43,137 47,315
Liabilities & Shareholder's Equity
Liabilities
Current Liabilities
Current portion of long‐term debt 44 6 6 ‐ ‐ ‐ 500 ‐ ‐ 1,000 ‐ ‐
Notes payable 1 325 336 186 199 215 231 250 270 292 316 343
Accounts payable 2,191 2,048 2,279 2,578 2,771 2,982 3,213 3,467 3,747 4,055 4,395 4,770
Accrued liabilities 3,037 3,011 3,269 3,663 3,936 4,236 4,564 4,925 5,323 5,760 6,244 6,777
Income taxes payable 85 84 150 101 121 130 140 151 163 176 191 207
Total Current Libailities 5,358 5,474 6,040 6,528 7,027 7,562 8,648 8,793 9,502 11,283 11,145 12,098
Long‐term debt 2,010 3,471 3,468 3,719 4,029 4,379 4,762 5,184 5,648 6,159 6,724 7,347
Deferred income taxes & other liabilities 1,770 1,907 3,216 1,175 1,410 1,516 1,632 1,760 1,901 2,056 2,228 2,417
Total Libailities 9,138 10,852 12,724 11,421 12,466 13,456 15,043 15,737 17,051 19,499 20,097 21,862
Shareholder's Equity
Common Stock 7,786 8,638 6,387 7,020 7,652 8,285 8,918 9,550 10,183 10,183 10,183 10,183
Accumulated other comprehensive income (loss) 318 (213) (92) (92) (92) (92) (92) (92) (92) (92) (92) (92)
Retained earnings 4,151 3,979 3,517 3,692 4,122 4,842 5,864 7,196 8,820 10,722 12,949 15,362
Total Shareholders Equity 12,255 12,404 9,812 10,620 11,682 13,035 14,690 16,654 18,911 20,813 23,040 25,453
Total Liabilities & Shareholder's Equity 21,393 23,256 22,536 22,041 24,148 26,491 29,733 32,391 35,962 40,312 43,137 47,315

Nike, Inc.
Cash Flow Statement
Fiscal Year Ending May 31st 2016 2017 2018
Cash Provided by Operations
Net income 3,760 4,240 1,833
Income charges (credits) not affecting cash:
Depreciation 649 706 747
Deferred income taxes (80) (273) 647
Stock‐based compensation (Note 11) 236 215 218
Amortization and other 13 10 27
Net foreign currency adjustments 98 (117) (99)
Net gain on divestitures
Changes in Working Capital
Account Receivables 60 (426) 187
Inventories (590) (231) (255)
Prepaid Expenses & Other Current & Non‐Current Assets (161) (120) 35
Accounts payable, accrued liabilities and income taxes payable (889) (364) 1,515
Net Cash Provided by Operations 3,096 3,640 4,955
Cash (Used) Provided by Investing Activities
Purchases of short‐term investments (5,367) (5,928) (4,783)
Maturities of short‐term investments 2,924 3,623 3,613
Sales of short‐term investments 2,386 2,423 2,496
Investments in reverse purchase agreements 150
Additions to property, plant and equipment (1,143) (1,105) (1,028)
Disposals of property, plant and equipment 10 13 3
Proceeds from divestitures
Increase in other assets, net of other liabilities
Settlement of net investment hedges
Other Investing Activity 6 (34) (25)
Net Cash Used by Investing Activities (1,034) (1,008) (4,835)
Cash (Used) Provided by Financing Activities
Net proceeds from long‐term debt issuance 981 (1,482)
Long‐term debt payments, including current portion (106) (44) (6)
Increase (decrease) in notes payable (67) 327 13
Payments on capital lease obligations (7) (17) (23)
Proceeds from exercise of stock options and other stock issuances 507 489 733
Excess tax benefits from share‐based payment arrangements 281 177
Repurchase of common stock (3,238) (3,223) (4,254)
Dividends — common and preferred (1,022) (1,133) (1,243)
Net Cash Used by Financing Activities (2,671) (1,942) (4,835)
Effect of exchange rate changes (105) (20) 45
Net (decrease) increase in cash and equivalents (714) 670 441
Cash and equivalents, beginning of year 3,852 3,138 3,808
Cash and equivalents, end of year 3,138 3,852 4,249

Nike, Inc. Cashflow Forecast
Fiscal Year Ending May 31st 2019E 2020E 2021E 2022E 2023E 2024E 2025E 2026E 2027CV
Cash Provided by OperationsNet Income 4,726 5,110 5,545 5,996 6,458 6,894 7,340 7,857 8,174 Depreciation Expense 906 915 926 939 952 967 983 999 1,017 Amortization Expense 27 27 27 27 27 27 27 27 27 Change in Deferred Taxes (1,852) 115 (79) (86) (95) (104) (115) (127) (140)
Changes in Working Capital(Change in Accounts Receivable) (445) (289) (318) (330) (314) (340) (322) (329) (268) (Change in Prepaid Expenses & Other Current Assets) (395) (114) (125) (137) (150) (165) (182) (201) (222) (Change in Inventories) (342) (418) (458) (503) (552) (608) (670) (739) (816) Change in Accounts Payable 299 192 211 231 254 280 308 340 376 Change in Accrued Liabilities 394 273 299 329 361 397 438 483 534 Change in Income Taxes Payable (49) 20 9 10 11 12 13 15 16
Net Cash Provided by Operating Activities 3,270 5,831 6,037 6,476 6,952 7,360 7,820 8,325 8,697
Cash (Used) Provided by Investing ActivitiesChange in Short‐Term Investments (1) (1) (1) (1) (1) (1) (1) (1) (1)
Capital Expenditure (951) (969) (987) (1,006) (1,025) (1,045) (1,064) (1,085) (1,105)
Change In Identifiable intangible assets, net ‐ ‐ ‐ ‐ ‐ ‐ ‐ ‐ ‐
Change in Goodwill ‐ ‐ ‐ ‐ ‐ ‐ ‐ ‐ ‐
Net Cash Used by Investing Activities (952) (970) (988) (1,007) (1,026) (1,046) (1,065) (1,086) (1,106)
Cash (Used) Provided by Financing ActivitiesChange in Current portion of long‐term debt (6) ‐ ‐ 500 (500) ‐ 1,000 (1,000) ‐
Changes in notes payable (150) 14 15 17 18 20 22 24 27
Change in Long‐Term Debt 251 310 350 384 422 464 511 564 623
Repurchase of Common Stock (3,175) (3,175) (3,175) (3,175) (3,175) (3,175) (3,175) (3,175) (3,175)
Change in Common Stock 633 633 633 633 633 633 ‐ ‐ ‐
Change in Accumulated other comprehensive income (loss) ‐ ‐ ‐ ‐ ‐ ‐ ‐ ‐ ‐
Payment of Dividends (1,376) (1,505) (1,650) (1,799) (1,951) (2,095) (2,263) (2,455) (2,586)
Net Cash Used by Financing Activities (3,824) (3,724) (3,827) (3,441) (4,553) (4,153) (3,904) (6,041) (5,111)
Change in cash (1,505) 1,138 1,222 2,028 1,372 2,161 2,850 1,198 2,480
Cash in beginning of the year 4,249 2,744 3,882 5,104 7,132 8,504 10,665 13,515 14,714
Cash at end of the year 2,744 3,882 5,104 7,132 8,504 10,665 13,515 14,714 17,193

Nike, Inc.
Common Size Income Statement (as percent of sales)
Fiscal Year Ending May 31st 2012 2013 2014 2015 2016 2017 2018 2019E 2020E 2021E 2022E 2023E 2024E 2025E 2026E 2027CV
Revenues 100% 100% 100% 100% 100% 100% 100% 100% 100% 100% 100% 100% 100% 100% 100% 100%Cost of sales 56.50% 56.41% 55.23% 54.03% 53.76% 55.42% 56.16% 55.36% 55.36% 55.36% 55.36% 55.36% 55.36% 55.36% 55.36% 55.36%Gross Profit 43.50% 43.59% 44.77% 45.97% 46.24% 44.58% 43.84% 44.64% 44.64% 44.64% 44.64% 44.64% 44.64% 44.64% 44.64% 44.64%Expenses:
Demand creation expense 11.17% 10.84% 10.90% 10.50% 10.12% 9.73% 9.83% 10.44% 10.44% 10.44% 10.44% 10.44% 10.44% 10.44% 10.44% 10.44%Operating overhead expense 17.41% 17.90% 18.36% 19.71% 20.17% 18.94% 19.67% 18.88% 18.88% 18.88% 18.88% 18.88% 18.88% 18.88% 18.88% 18.88%Depreciation expense 1.60% 1.73% 1.86% 1.98% 2.00% 2.06% 2.05% 2.32% 2.19% 2.06% 1.94% 1.85% 1.77% 1.70% 1.63% 1.59%Amortization expense 0.10% 0.26% 0.41% 0.14% 0.04% 0.03% 0.07% 0.07% 0.06% 0.06% 0.06% 0.05% 0.05% 0.05% 0.04% 0.04%Total selling and administrative 30.28% 30.74% 31.53% 32.33% 32.34% 30.75% 31.63% 31.71% 31.57% 31.44% 31.32% 31.23% 31.14% 31.06% 31.00% 30.96%Other Income (Expense)
Interest expense (income), net 0.02% ‐0.01% 0.12% 0.09% 0.06% 0.17% 0.15% 0.67% 0.64% 0.65% 0.66% 0.74% 0.68% 0.70% 0.84% 0.76%Other (income) expense, net 0.23% ‐0.06% 0.37% ‐0.19% ‐0.43% ‐0.57% 0.18% 0.17% 0.16% 0.15% 0.14% 0.13% 0.12% 0.11% 0.11% 0.10%Income before income taxes 12.97% 12.93% 12.75% 13.74% 14.28% 14.22% 11.88% 13.77% 13.87% 14.00% 14.11% 14.28% 14.31% 14.39% 14.59% 14.55%Income tax expense 3.24% 3.19% 3.06% 3.05% 2.67% 1.88% 6.57% 1.65% 1.66% 1.68% 1.69% 1.71% 1.72% 1.73% 1.75% 1.75%Income (loss) from Discontinued Operations 0.00% 0.08% 0.00% 0.00% 0.00% 0.00% 0.00% 0.00% 0.00% 0.00% 0.00% 0.00% 0.00% 0.00% 0.00% 0.00%
Net Income 9.53% 9.82% 9.69% 10.70% 11.61% 12.34% 5.31% 12.12% 12.20% 12.32% 12.42% 12.57% 12.59% 12.67% 12.84% 12.80%

Nike, Inc.
Common Size Balance Sheet (as percent of sales)
Fiscal Year Ending May 31st 2016 2017 2018 2019E 2020E 2021E 2022E 2023E 2024E 2025E 2026E 2027CV
Assets
Current Assets:
Cash & equivalents 13.45% 16.32% 18.21% 10.84% 13.96% 16.68% 22.03% 24.76% 29.30% 34.65% 35.14% 38.19%
Short‐term investments 9.94% 10.16% 4.27% 3.94% 3.59% 3.26% 3.09% 2.91% 2.75% 2.57% 2.40% 2.23%
Accounts receivable, net 13.89% 15.76% 14.99% 15.58% 15.22% 14.87% 15.08% 15.12% 15.21% 15.02% 14.78% 14.34%
Prepaid expenses & other current assets 6.38% 4.93% 4.84% 6.02% 5.89% 5.76% 5.87% 5.97% 6.09% 6.15% 6.21% 6.27%
Inventories 20.74% 21.67% 22.55% 22.13% 21.66% 21.17% 21.56% 21.93% 22.37% 22.59% 22.81% 23.03%
Total Current Assets 64.40% 68.84% 64.87% 58.51% 60.33% 61.75% 67.62% 70.70% 75.72% 80.98% 81.33% 84.06%
Property, plant & equipment, net 15.09% 17.10% 19.09% 17.77% 16.38% 15.08% 14.46% 13.84% 13.27% 12.59% 11.94% 11.30%
Identifiable intangible assets, net 1.20% 1.21% 1.22% 1.02% 0.83% 0.67% 0.55% 0.44% 0.34% 0.25% 0.16% 0.09%
Goodwill 0.56% 0.60% 0.66% 0.61% 0.55% 0.50% 0.48% 0.45% 0.42% 0.39% 0.37% 0.34%
Deferred income taxes & other assets 10.45% 11.95% 10.75% 9.16% 8.78% 8.58% 8.73% 8.88% 9.05% 9.14% 9.23% 9.31%
Total Assets 91.71% 99.69% 96.59% 87.07% 86.87% 86.57% 91.84% 94.30% 98.81% 103.35% 103.03% 105.10%
Liabilities & Shareholder's Equity
Liabilities
Current Liabilities:
Current portion of long‐term debt 0.19% 0.03% 0.03% 0.00% 0.00% 0.00% 1.54% 0.00% 0.00% 2.56% 0.00% 0.00%
Notes payable 0.00% 1.39% 1.44% 0.73% 0.72% 0.70% 0.71% 0.73% 0.74% 0.75% 0.76% 0.76%
Accounts payable 9.39% 8.78% 9.77% 10.19% 9.97% 9.74% 9.92% 10.09% 10.29% 10.40% 10.50% 10.60%
Accrued liabilities 13.02% 12.91% 14.01% 14.47% 14.16% 13.84% 14.10% 14.34% 14.62% 14.77% 14.91% 15.05%
Income taxes payable 0.36% 0.36% 0.64% 0.40% 0.43% 0.42% 0.43% 0.44% 0.45% 0.45% 0.46% 0.46%
Total Current Libailities 22.97% 23.46% 25.89% 25.79% 25.28% 24.71% 26.71% 25.60% 26.11% 28.93% 26.62% 26.87%
Long‐term debt 8.62% 14.88% 14.86% 14.69% 14.49% 14.31% 14.71% 15.09% 15.52% 15.79% 16.06% 16.32%
Deferred income taxes & other liabilities 7.59% 8.17% 13.78% 4.64% 5.07% 4.95% 5.04% 5.12% 5.22% 5.27% 5.32% 5.37%
Total Libailities 39.17% 46.51% 54.54% 45.12% 44.84% 43.97% 46.46% 45.81% 46.85% 49.99% 48.00% 48.56%
Shareholder's Equity
Common Stock 33.37% 37.02% 27.38% 27.73% 27.53% 27.07% 27.54% 27.80% 27.98% 26.11% 24.32% 22.62%
Accumulated other comprehensive income (loss) 1.36% ‐0.91% ‐0.39% ‐0.36% ‐0.33% ‐0.30% ‐0.28% ‐0.27% ‐0.25% ‐0.24% ‐0.22% ‐0.20%
Retained earnings 17.79% 17.05% 15.07% 14.59% 14.83% 15.82% 18.11% 20.95% 24.23% 27.49% 30.93% 34.12%
Total Shareholders Equity 52.53% 53.17% 42.06% 41.95% 42.02% 42.60% 45.37% 48.48% 51.96% 53.36% 55.03% 56.54%
Total Liabilities & Shareholder's Equity 91.69% 99.68% 96.59% 87.07% 86.87% 86.57% 91.84% 94.30% 98.81% 103.35% 103.03% 105.10%

Nike, Inc.
Value Driver Estimation
Fiscal Year Ending May 31st 2016 2017 2018 2019E 2020E 2021E 2022E 2023E 2024E 2025E 2026E 2027CV
NOPLAT
Sales 32,376 34,350 36,397 39,005 41,868 45,018 48,287 51,391 54,756 57,944 61,201 63,851
Cost of Goods Sold 17,405 19,038 20,441 21,593 23,178 24,922 26,731 28,450 30,313 32,078 33,880 35,348
SGA 10,469 10,563 11,511 12,370 13,219 14,153 15,124 16,048 17,049 18,000 18,971 19,766
Depreciation 649 706 747 906 915 926 939 952 967 983 999 1,017
Amortization 13 10 27 27 27 27 27 27 27 27 27 27
Add: Implied Interest on Operating Leases 192 229 229 234 237 240 243 246 250 254 259 263
EBITA 4,032 4,262 3,900 4,343 4,766 5,230 5,709 6,160 6,650 7,111 7,581 7,957
Adjusted Taxes:
Income Tax Expense 863 646 2,392 644 697 756 818 881 940 1,001 1,071 1,115
Tax Shield on Interest Expense (Income) 3 9 6 32 32 35 38 45 45 49 62 58
Tax Shield on Interest on Operating Leases 34 35 28 28 28 29 29 30 30 31 31 32
Tax Shield on other (income) expense, net (25) (30) 8 8 8 8 8 8 8 8 8 8
Less: Adjusted Taxes 876 660 2,434 712 765 828 893 964 1,023 1,088 1,172 1,212
Plus: Change in Deferred Taxes (80) (273) 647 (1,852) 115 (79) (86) (95) (104) (115) (127) (140)
NOPLAT 3,076 3,329 2,114 1,780 4,116 4,323 4,730 5,102 5,523 5,908 6,282 6,604
Invested Capital
Operating Current Assets: 11,187 11,600 11,709 13,021 13,985 15,044 16,177 17,348 18,630 19,963 21,395 22,834
Normal Cash 1,619 1,718 1,820 1,950 2,093 2,251 2,414 2,570 2,738 2,897 3,060 3,193
Accounts Receivables 3,241 3,677 3,498 3,943 4,232 4,551 4,881 5,195 5,535 5,857 6,186 6,454
Inventories 4,838 5,055 5,261 5,603 6,021 6,479 6,982 7,534 8,142 8,811 9,550 10,367
Prepaid Expenses & Other Current Assets 1,489 1,150 1,130 1,525 1,638 1,763 1,900 2,050 2,215 2,398 2,599 2,821
Operating Current Liabilities: 5,313 5,143 5,698 6,342 6,828 7,347 7,917 8,543 9,232 9,991 10,829 11,755
Accounts Payable 2,191 2,048 2,279 2,578 2,771 2,982 3,213 3,467 3,747 4,055 4,395 4,770
Income Taxes Payable 85 84 150 101 121 130 140 151 163 176 191 207
Accrued Liabilities 3,037 3,011 3,269 3,663 3,936 4,236 4,564 4,925 5,323 5,760 6,244 6,777
Net Operating Working Capital 5,874 6,457 6,011 6,679 7,157 7,696 8,260 8,805 9,398 9,972 10,566 11,079
Plus: Net PPE 3,520 3,989 4,454 4,499 4,552 4,613 4,681 4,754 4,831 4,913 4,998 5,086
Plus: Net Other Operating Assets 2,439 2,787 2,509 2,319 2,440 2,624 2,827 3,050 3,295 3,565 3,863 4,193
PV of Operating Leases 2,785 3,329 3,401 3,435 3,475 3,522 3,574 3,629 3,688 3,751 3,816 3,883
Intangible Assets 281 283 285 258 231 204 177 150 123 96 69 42
Less: Other Long‐Term Operating Liabilities ‐ ‐ ‐ ‐ ‐ ‐ ‐ ‐ ‐ ‐ ‐ ‐
Invested Capital (IC) 14,899 16,844 16,659 17,189 17,855 18,660 19,518 20,388 21,335 22,296 23,312 24,284
FCF
NOPLAT 3,076 3,329 2,114 1,780 4,116 4,323 4,730 5,102 5,523 5,908 6,282 6,604
Less: Change in Invested Capital 1,416 1,945 (185) 530 667 805 858 870 947 961 1,016 972
Free Cash Flow (FCF) 1,660 1,384 2,298 1,250 3,449 3,519 3,872 4,233 4,576 4,947 5,267 5,632
ROIC
NOPLAT 3,076 3,329 2,114 1,780 4,116 4,323 4,730 5,102 5,523 5,908 6,282 6,604
Beginning Invested Capital 13,483 14,899 16,844 16,659 17,189 17,855 18,660 19,518 20,388 21,335 22,296 23,312
Return on Invested Capital (ROIC) 22.8% 22.3% 12.5% 10.7% 23.9% 24.2% 25.3% 26.1% 27.1% 27.7% 28.2% 28.3%
EP
Beginning Invested Capital 13,483 14,899 16,844 16,659 17,189 17,855 18,660 19,518 20,388 21,335 22,296 23,312
ROIC 22.8% 22.3% 12.5% 10.7% 23.9% 24.2% 25.3% 26.1% 27.1% 27.7% 28.2% 28.3%
WACC 6.9% 6.9% 6.9% 6.9% 6.9% 6.9% 6.9% 6.9% 6.9% 6.9% 6.9% 6.9%
Economic Profit (EP) 2,147 2,302 952 631 2,930 3,092 3,443 3,756 4,117 4,437 4,745 4,997

Nike, Inc.
Weighted Average Cost of Capital (WACC) Estimation
Cost of Equity
Risk Free Rate 2.48%
Risk Premium 5.08%
Beta 0.91
Cost of Equity 7.10%
Cost of Debt
Pre‐Tax Cost of Debt 3.36%
Marginal Tax Rate 12%
After‐tax Cost of Debt 2.96%
Value of Equity
Share Price 84.21
Shares Outstanding 1,621
Value of Equity 136,515
Value of Debt
BV of Short‐term debt 342
BV of Long‐term debt 3,468
PV of Operating leases 3,401
Value of Debt 7,211
Weights
Equity 94.98%
Debt 5.02%
WACC Calculation
Cost of Equity 7.10%
Weight of Equity 94.98%
After‐tax Cost of Debt 2.96%
Weight of Debt 5.02%
WACC 6.89%

Nike, Inc.
Discounted Cash Flow (DCF) and Economic Profit (EP) Valuation Models
Key Inputs:
CV Growth 4.00%
CV ROIC 28.33%
WACC 6.89%
Cost of Equity 7.10%
DCF Model
Fiscal Year Ending May 31st 2019E 2020E 2021E 2022E 2023E 2024E 2025E 2026E 2027CV
NOPLAT 1,780 4,116 4,323 4,730 5,102 5,523 5,908 6,282 6,604
Less: Change in Invested Capital 530 667 805 858 870 947 961 1,016 972
Free Cash Flow 1,250 3,449 3,519 3,872 4,233 4,576 4,947 5,267 5,632
Continuing Value (CV) 195,929
PV of FCF 1,169 3,018 2,881 2,965 3,033 3,067 3,102 3,089 114,933
Value of Operating Asset 137,258
Add: Excess Cash 2,429
Add: Marketable Securites 996
Less: Debt (3,810)
Less: PV of Operating Leases (3,401)
Less: Underfunded Pension Liabilities (70)
Less: ESOP (4,356)
Value of Equity 129,046
Shares Outstanding 1,624
Price $79.46
Partrial Year Adjustment 1.05
Intrinsic Value of Stock 83.46$
Economic Profit
Fiscal Year Ending May 31st 2019E 2020E 2021E 2022E 2023E 2024E 2025E 2026E 2027CV
NOPLAT 1,780 4,116 4,323 4,730 5,102 5,523 5,908 6,282 6,604
Beginning Invested Capital 16,659 17,189 17,855 18,660 19,518 20,388 21,335 22,296 23,312
ROIC 10.7% 23.9% 24.2% 25.3% 26.1% 27.1% 27.7% 28.2% 28.3%
WACC 6.89% 6.89% 6.89% 6.89% 6.89% 6.89% 6.89% 6.89% 6.89%
EP 631 2,930 3,092 3,443 3,756 4,117 4,437 4,745 4,997
Continuing Value (CV) 172,617
PV of EP 590 2,565 2,532 2,637 2,691 2,760 2,782 2,783 101,258
PV (Economic Profit) 120,599
Beginning Invested Capital 16,659
Value of Operating Assets 137,258
Add: Excess Cash 2,429
Add: Marketable Securities 996
Less: Debt (3,810)
Less: PV of Operating Leases (3,401)
Less: Underfunded Pension Liabilities (70)
Less: ESOP (4,356)
Value of Equity 129,046
Shares Outstanding 1,624
Price $79.46
Partial Year Adjustment 1.05
Intrinsic Value of Stock $83.46

Nike, Inc.
Dividend Discount Model (DDM) or Fundamental P/E Valuation Model
Fiscal Year Ending May 31st 2019E 2020E 2021E 2022E 2023E 2024E 2025E 2026E 2027CV
EPS 2.92$ 3.19$ 3.50$ 3.81$ 4.13$ 4.44$ 4.79$ 5.20$ 5.48$
Key Assumptions
CV growth 4.00%
CV ROE 35.48%
Cost of Equity 7.10%
Future Cash Flows
P/E Multiple (CV Year) 29.11
EPS (CV Year) 5.48$
Future Stock Price 159.54$
Dividends Per Share 0.84$ 0.92$ 1.00$ 1.10$ 1.19$ 1.28$ 1.38$ 1.49$
Future Cash Flows 0.84$ 0.92$ 1.00$ 1.10$ 1.19$ 1.28$ 1.38$ 1.49$ 159.54$
Discount Rate 1.071 1.147 1.229 1.316 1.409 1.509 1.617 1.731 1.731
Discounted Cash Flows 0.78 0.80 0.82 0.83 0.84 0.84 0.85 0.86 92.14
Price 98.77
Partial Year Adjujstment 1.050
Intrinsic Value 103.74$

Nike, Inc.
Relative Valuation Models
EPS EPSTicker Company Price 2019E 2020E P/E 19 P/E 20
ADDYY Adidas $121.85 $5.43 $6.50 22.44 18.75
COLM Columbia Sportswear Co $104.18 $3.81 $4.87 27.34 21.39
LULU Luluemelon Athletic Inc $163.87 $3.75 $4.40 43.70 37.24
VFC VF Corporation $86.91 $3.76 $4.25 23.11 20.45
UA Under Armour Inc $19.32 $0.35 $0.52 55.20 37.15 Average 34.36 27.00
NKE Nike, Inc. $84.88 $ 2.92 $ 3.19 29.1 26.6
Implied Relative Value:
P/E (EPS19) $ 100.17
P/E (EPS20) 86.09$

Nike, Inc.
Key Management Ratios
Fiscal Year Ending May 31st 2016 2017 2018 2019E 2020E 2021E 2022E 2023E 2024E 2025E 2026E 2027CV
Liquidity Ratios
Current Ratio 2.80 2.93 2.51 2.27 2.39 2.50 2.53 2.76 2.90 2.80 3.06 3.13
Quick Ratio 0.60 0.67 0.58 0.60 0.60 0.60 0.56 0.59 0.58 0.52 0.56 0.53
Cash Ratio 0.59 0.70 0.70 0.42 0.55 0.67 0.82 0.97 1.12 1.20 1.32 1.42
Activity or Asset‐Management Ratios
Fixed Asset Turnover 9.20 8.61 8.17 8.67 9.20 9.76 10.32 10.81 11.33 11.80 12.25 12.55
Inventory Turnover 3.79 3.85 3.96 3.98 3.99 3.99 3.97 3.92 3.87 3.78 3.69 3.55
Financial Leverage Ratios
Debt Ratio 0.43 0.47 0.56 0.52 0.52 0.51 0.51 0.49 0.47 0.48 0.47 0.46
Debt to Equity Ratio 0.75 0.87 1.30 1.08 1.07 1.03 1.02 0.94 0.90 0.94 0.87 0.86
Equity Ratio 0.57 0.53 0.44 0.48 0.48 0.49 0.49 0.51 0.53 0.52 0.53 0.54
Profitability Ratios
Gross Margin 46.24% 44.58% 43.84% 44.64% 44.64% 44.64% 44.64% 44.64% 44.64% 44.64% 44.64% 44.64%
Profit Margin 11.61% 12.34% 5.31% 12.12% 12.20% 12.32% 12.42% 12.57% 12.59% 12.67% 12.84% 12.80%
Return on Asset 17.57% 18.23% 8.58% 21.44% 21.16% 20.93% 20.17% 19.94% 19.17% 18.21% 18.21% 17.28%
Return on Equity 30.68% 34.18% 19.70% 44.50% 43.74% 42.54% 40.82% 38.77% 36.46% 35.26% 34.10% 32.11%
Payout Policy Ratios
Dividend Payout Ratio 28.05% 27.34% 65.55% 28.73% 28.73% 28.73% 28.73% 28.73% 28.73% 28.73% 28.73% 28.73%
Definitions
Current Ratio = Total assets/total liabilities
Quick Ratio = Cash+ Accounts Receivable+ST investments / Total Current Liabilities
Cash Ratio = Cash / Total Current Liabilities
Fixed Asset Turnover = Total Revenue / PPE
Inventory Turnover = COGS / Average Inventory
Debt Ratio = Total Liabilities / Total Assets
Debt to Equity = Total Liabilities / Total Equity
Equity Ratio = Total Equity / Total Assets
Gross Margin = (Revenue‐Restaurant Operating Costs) / Revenue
Profit Margin = Net income / Total Revenue
Return on Assets = Net Income / Total Assets
Return on Equity = Net Income / Total Equity
Dividend Payout Ratio = Total Dividends Declared / EPS

Nike, Inc.
Operating Leases
Present Value of Operating Lease Obligations (2018) Present Value of Operating Lease Obligations (2017) Present Value of Operating Lease Obligations (2016)
Operating Operating Operating
Fiscal Years Ending May 31 Leases Fiscal Years Ending 43606 Leases Fiscal Years Ending 43606 Leases
2019 589 2018 537 2017 491
2020 523 2019 509 2018 453
2021 472 2020 438 2019 395
2022 412 2021 399 2020 347
2023 361 2022 350 2021 301
Thereafter 1608 Thereafter 1672 Thereafter 1244
Total Minimum Payments 3965 Total Minimum Payments 3905 Total Minimum Payments 3231
Less: Interest 564 Less: Interest 576 Less: Interest 446
PV of Minimum Payments 3401 PV of Minimum Payments 3329 PV of Minimum Payments 2785
Capitalization of Operating Leases Capitalization of Operating Leases Capitalization of Operating Leases
Pre‐Tax Cost of Debt 3.36% Pre‐Tax Cost of Debt 3.36% Pre‐Tax Cost of Debt 3.36%
Number Years Implied by Year 6 Payment 4.5 Number Years Implied by Year 6 Payment 4.8 Number Years Implied by Year 6 Payment 4.1
Lease PV Lease Lease PV Lease Lease PV Lease
Year Commitment Payment Year Commitment Payment Year Commitment Payment
1 589 569.9 1 537 519.5 1 491 475.0
2 523 489.5 2 509 476.4 2 453 424.0
3 472 427.4 3 438 396.7 3 395 357.7
4 412 361.0 4 399 349.6 4 347 304.0
5 361 306.0 5 350 296.7 5 301 255.2
6 & beyond 361 1246.7 6 & beyond 350 1289.6 6 & beyond 301 969.5
PV of Minimum Payments 3400.5 PV of Minimum Payments 3328.5 PV of Minimum Payments 2785.5

Nike, Inc.
Effects of ESOP Exercise and Share Repurchases on Common Stock Balance Sheet Account and Number of Shares Outstanding
Number of Options Outstanding (shares): 93
Average Time to Maturity (years): 6.00
Expected Annual Number of Options Exercised: 16
Current Average Strike Price: 40.73$
Cost of Equity: 9.00%
Current Stock Price: $84.88
2019E 2020E 2021E 2022E 2023E 2024E 2025E 2026E 2027CV
Increase in Shares Outstanding: 16 16 16 16 16 16
Average Strike Price: 40.73$ 40.73$ 40.73$ 40.73$ 40.73$ 40.73$
Increase in Common Stock Account: 633 633 633 633 633 633
Change in Treasury Stock 3,175 3,175 3,175 3,175 3,175 3,175 3,175 3,175 3,175
Expected Price of Repurchased Shares: 84.88$ 92.52$ 100.85$ 109.92$ 119.82$ 130.60$ 142.35$ 155.16$ 169.13$
Number of Shares Repurchased: 37 34 31 29 26 24 22 20 19
Shares Outstanding (beginning of the year) 1,643 1,621 1,602 1,586 1,573 1,562 1,553 1,531 1,511
Plus: Shares Issued Through ESOP 16 16 16 16 16 16 0 0 0
Less: Shares Repurchased in Treasury 37 34 31 29 26 24 22 20 19
Shares Outstanding (end of the year) 1,621 1,602 1,586 1,573 1,562 1,553 1,531 1,511 1,492

Nike, Inc.
Valuation of Options Granted
Ticker Symbol NKE
Current Stock Price $84.88
Risk Free Rate 2.48%
Current Dividend Yield 1.05%
Annualized St. Dev. of Stock Returns 28.69%
Average Average B‐S Value
Range of Number Exercise Remaining Option of Options
Outstanding Options of Shares Price Life (yrs) Price Granted
Range 1 93.20 40.73 6.00 46.74$ 4,356$
Total 93 40.73$ 6.00 51.59$ 4,356$

Nike, Inc.
Sensitivity Analysis
WACC
83.46$ 6.59% 6.69% 6.79% 6.89% 6.99% 7.09% 7.19%
3.25% 77.19 74.68 72.32 70.09 67.97 65.97 64.07
3.50% 81.95 79.11 76.44 73.93 71.56 69.33 67.22
3.75% 87.55 84.28 81.24 78.38 75.71 73.19 70.82
CV Growth 4.00% 94.23 90.42 86.89 83.61 80.54 77.68 75.00
4.25% 102.33 97.82 93.66 89.82 86.26 82.96 79.88
4.50% 112.38 106.91 101.91 97.34 93.13 89.25 85.66
4.75% 125.15 118.33 112.18 106.61 101.54 96.89 92.63
Beta
83.46$ 0.88 0.89 0.9 0.91 0.92 0.93 0.94
4.78% 97.62 95.77 93.98 92.26 90.60 88.99 87.43
4.88% 94.26 92.50 90.79 89.14 87.55 86.01 84.51
4.98% 91.12 89.43 87.79 86.21 84.68 83.21 81.77
Risk Premium 5.08% 88.17 86.54 84.97 83.46 81.99 80.57 79.20
5.18% 85.39 83.83 82.32 80.86 79.45 78.09 76.77
5.28% 82.77 81.27 79.82 78.42 77.06 75.74 74.47
5.38% 80.30 78.85 77.45 76.10 74.79 73.53 72.30
CV Demand Creation %
83.46$ 0.1014 0.1024 0.1034 0.1044 0.1054 0.1064 0.1074
18.58% 88.89 87.99 87.08 86.18 85.28 84.37 83.47
18.68% 87.99 87.08 86.18 85.28 84.37 83.47 82.57
CV Operating 18.78% 87.08 86.18 85.28 84.37 83.47 82.57 81.66
Overhead % 18.88% 86.18 85.28 84.37 83.47 82.57 81.66 80.76
18.98% 85.28 84.37 83.47 82.57 81.66 80.76 79.86
19.08% 84.37 83.47 82.57 81.66 80.76 79.86 78.96
19.18% 83.47 82.57 81.66 80.76 79.86 78.96 78.05
CV ROIC
83.46$ 0.2384 0.2484 0.2584 0.2684 0.2784 0.2884 0.2984
5.43% 80.09 80.66 81.20 81.69 82.15 82.57 82.97
5.93% 80.41 80.99 81.52 82.02 82.47 82.90 83.30
6.43% 80.73 81.31 81.84 82.34 82.80 83.23 83.63
Cost of Equity 6.93% 81.05 81.63 82.17 82.67 83.13 83.56 83.96
7.43% 81.36 81.95 82.49 82.99 83.46 83.89 84.29
7.93% 81.68 82.27 82.81 83.32 83.78 84.22 84.62
8.43% 82.00 82.59 83.14 83.64 84.11 84.54 84.95
Pre Tax Cost of Debt
83.46$ 0.0306 0.0316 0.0326 0.0336 0.0346 0.0356 0.0366
10.50% 85.83 85.82 85.81 85.80 85.79 85.78 85.77
11.00% 85.05 85.04 85.03 85.02 85.01 85.00 84.99
Marginal Tax 11.50% 84.27 84.26 84.25 84.24 84.23 84.22 84.21
Rate 12.00% 83.49 83.48 83.47 83.46 83.45 83.44 83.43
12.50% 82.71 82.70 82.69 82.67 82.66 82.65 82.64
13.00% 81.92 81.91 81.90 81.89 81.88 81.87 81.86
13.50% 81.14 81.13 81.12 81.11 81.10 81.09 81.08