Embed Size (px)
Citation preview
KUSKOKWIM RIVER SONAR PROGRESS REPORT, 1988
By
Karen E. Hyer David C. Mesiar
Daniel C. Huttunen
Regional Information Report' No.1IIIIIIIII
Alaska Department of Fish and Game Division of Commercial Fisheries
Chief Fisheries Scientist's Office Sonar and Technical Services
333 Raspberry Road Anchorage, Alaska 99518
March, 1990
'The Regional Information Report Series was established in 1987 to provide an information access system for all unpublished divisional reports. These reports frequently serve diverse ad hoc informational purposes or archive basic uninterpreted data. To accommodate timelyreporting of recently collected information, reports in this series undergo only limited internal review and may contain preliminary data; this information may be subsequently finalized and published in the formal 1iterature. Consequently, these reports should not be cited without prior approval of the author or the Division of Commercial Fisheries.

INTRODUCTION
METHODS . . .. . 112
1
Equipment .. Fish Detection ...
2
4
Fish Detection ...
TABLE OF CONTENTS
LIST OF FIGURES iv
ABSTRACT... v
Site Selection. .. Sonar Data Acquisition.
Dual-Beam Theory. 2
3 Fish Distribution. . . Sonar Estimates vs. Non-Acoustic Abundance Indices. 4
RESULTS . . . . . . . . . 5 Site Selection ... 5 Sonar Data Acquisition. 6
Fish Distribution. . . Sonar Estimates vs. Non-Acoustic Abundance Indices.
DISCUSSION . . . . . Site Selection.
667
77
Sonar Data Acquisition. 8 Equ i pment . . 8
Fish Detection ... 9 Fi sh Di stri but ion . . 10 Sonar Estimates vs. Non-Acoustic Abundance Indices. 10
LITERATURE CITED 12
iii
LIST OF FIGURES
Figure Page
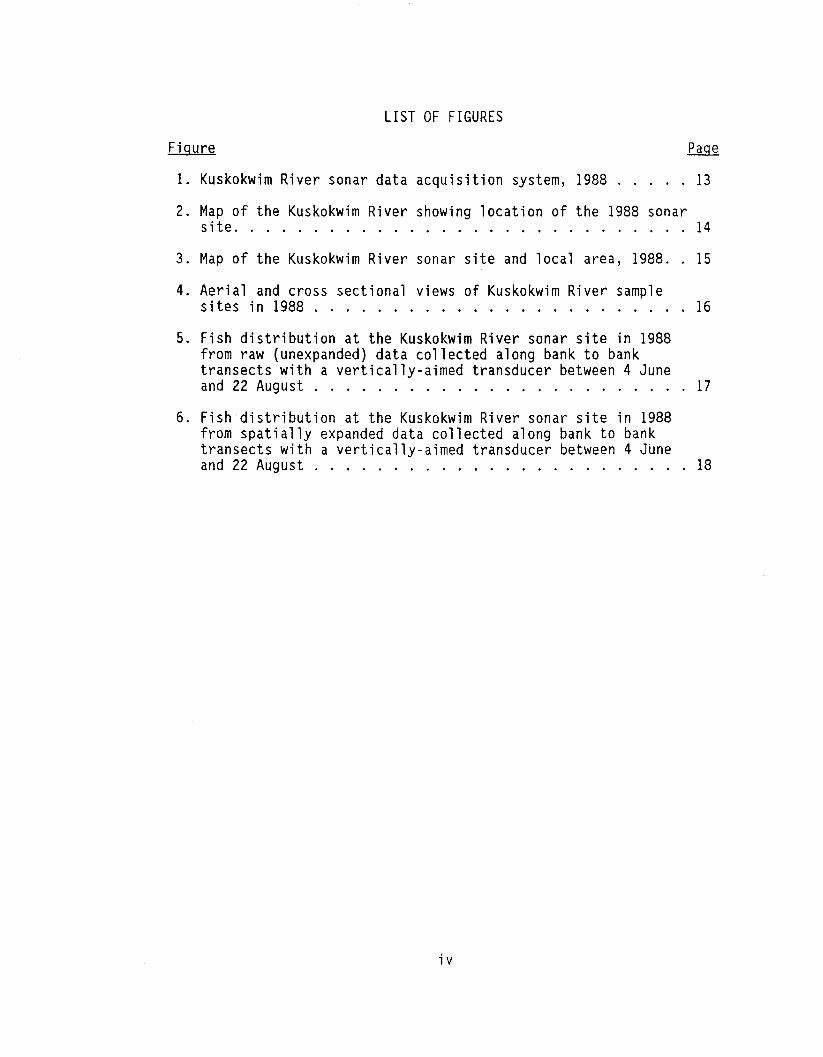
1. Kuskokwim River sonar data acquisition system, 1988 . . 13
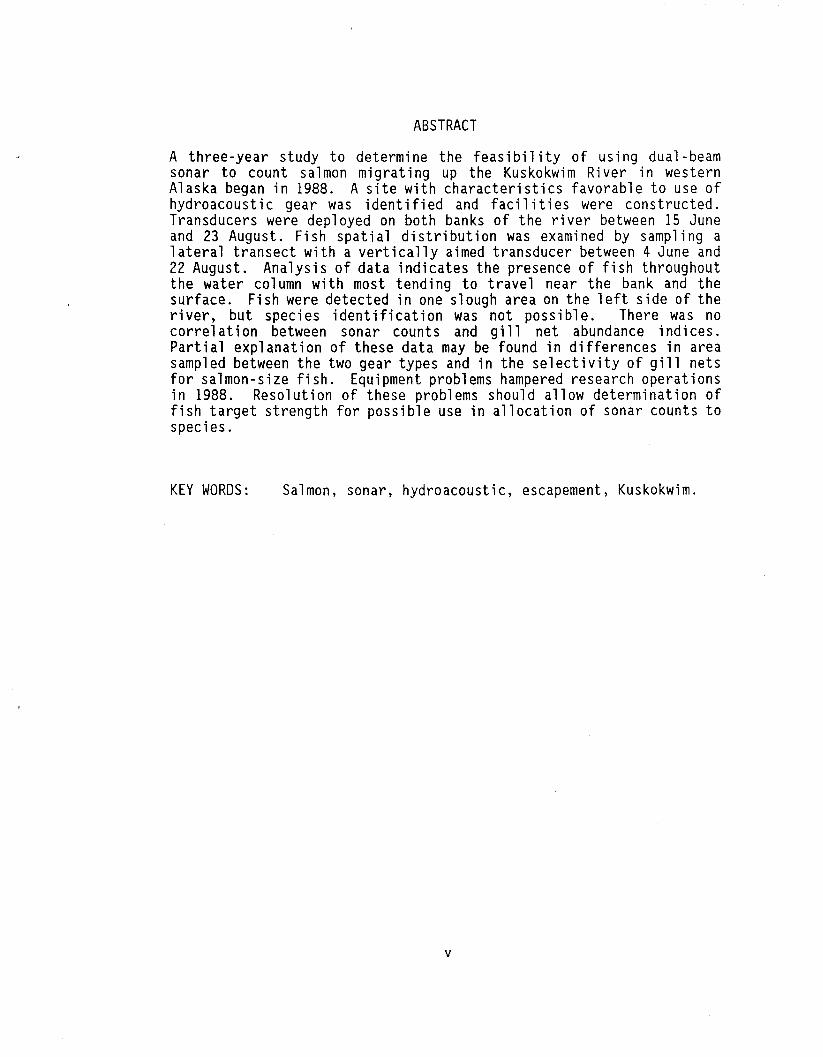
2. Map of the Kuskokwim River showing location of the 1988 sonar site. . . . . . . . . . . . . . . . . 14
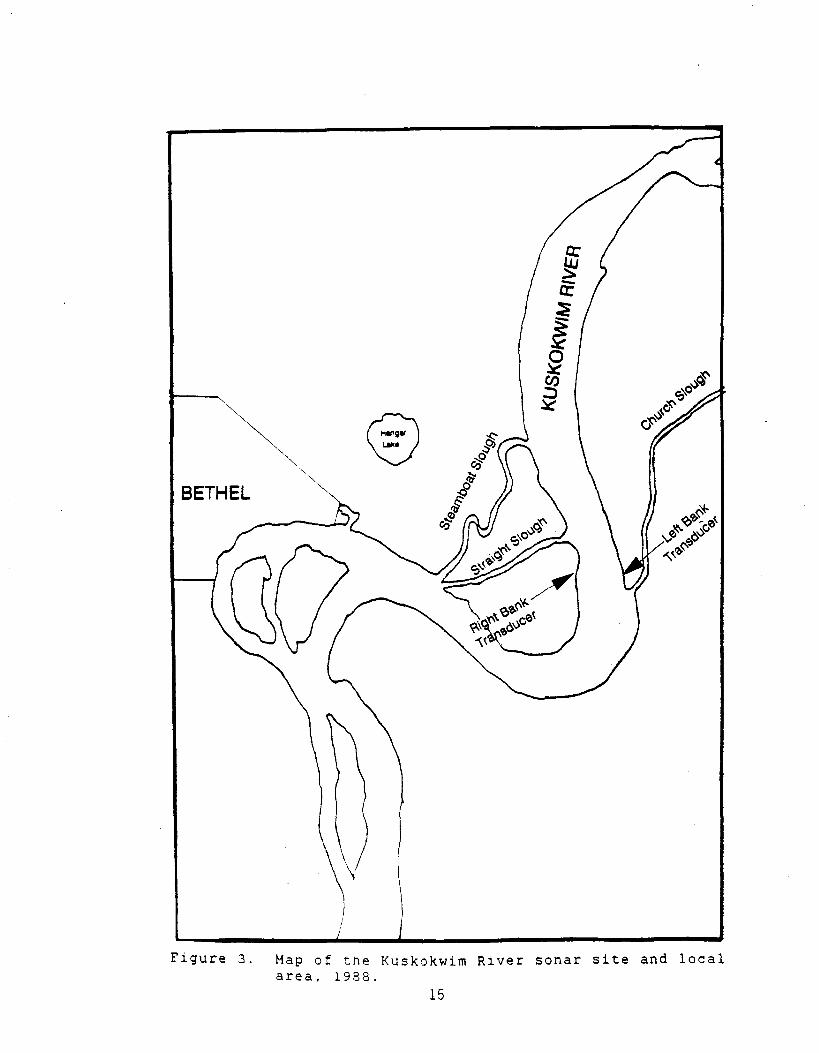
3. Map of the Kuskokwim River sonar site and local area, 1988. 15
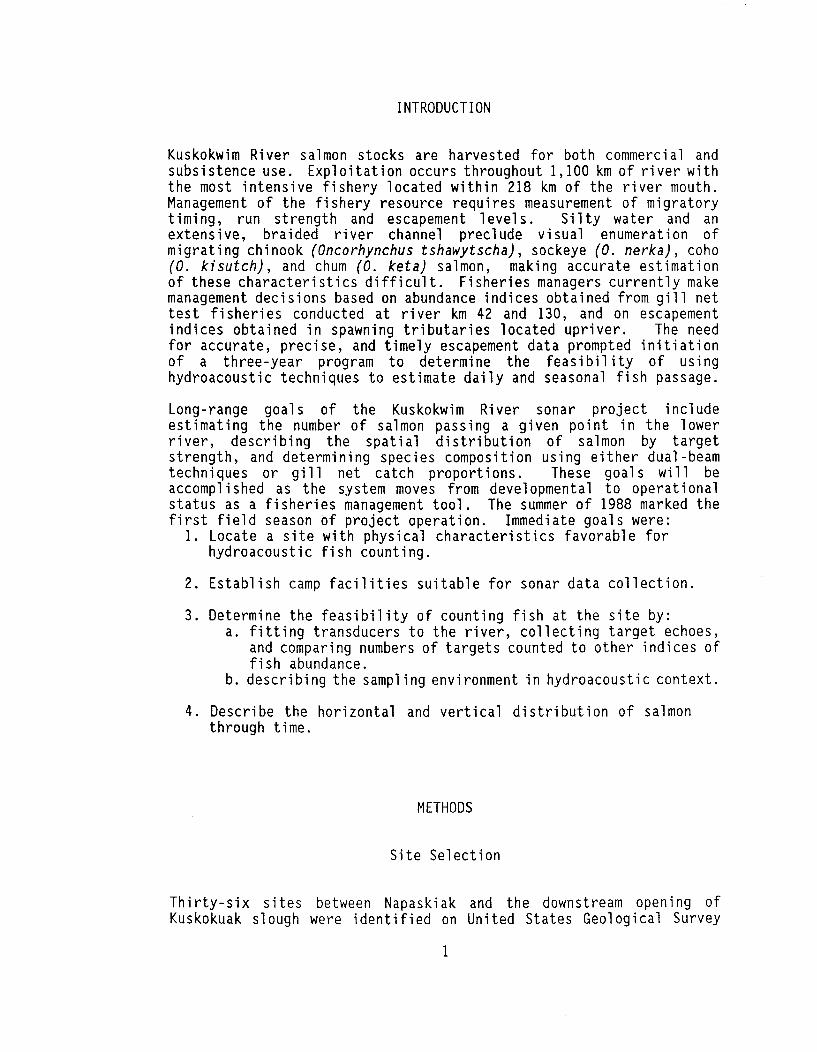
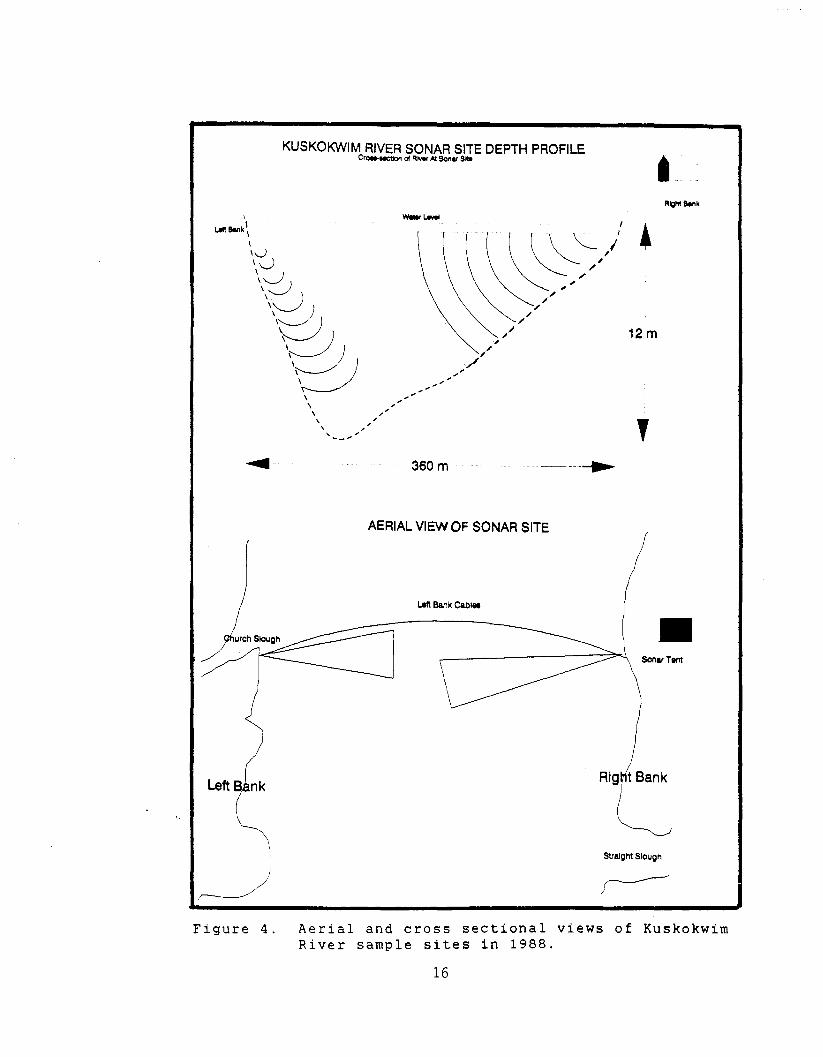
4. Aerial and cross sectional views of Kuskokwim River sample sites in 1988 . . . . . . . . . . . . . . . . . . . . . .. 16
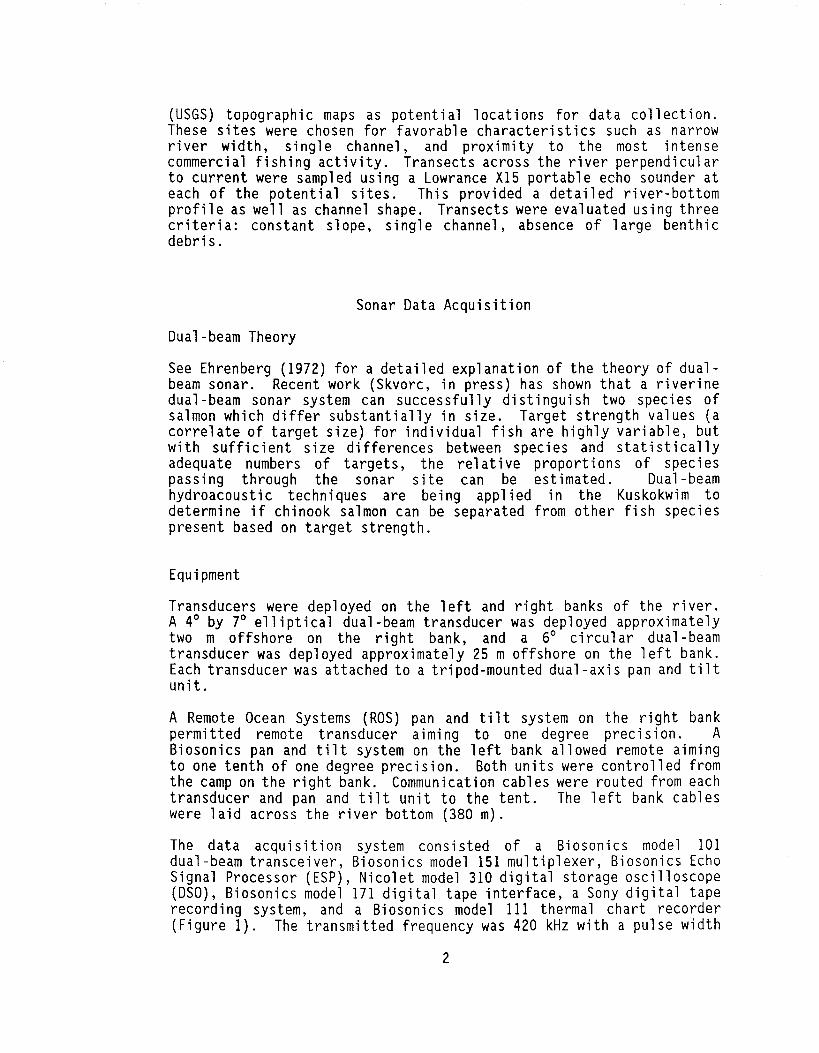
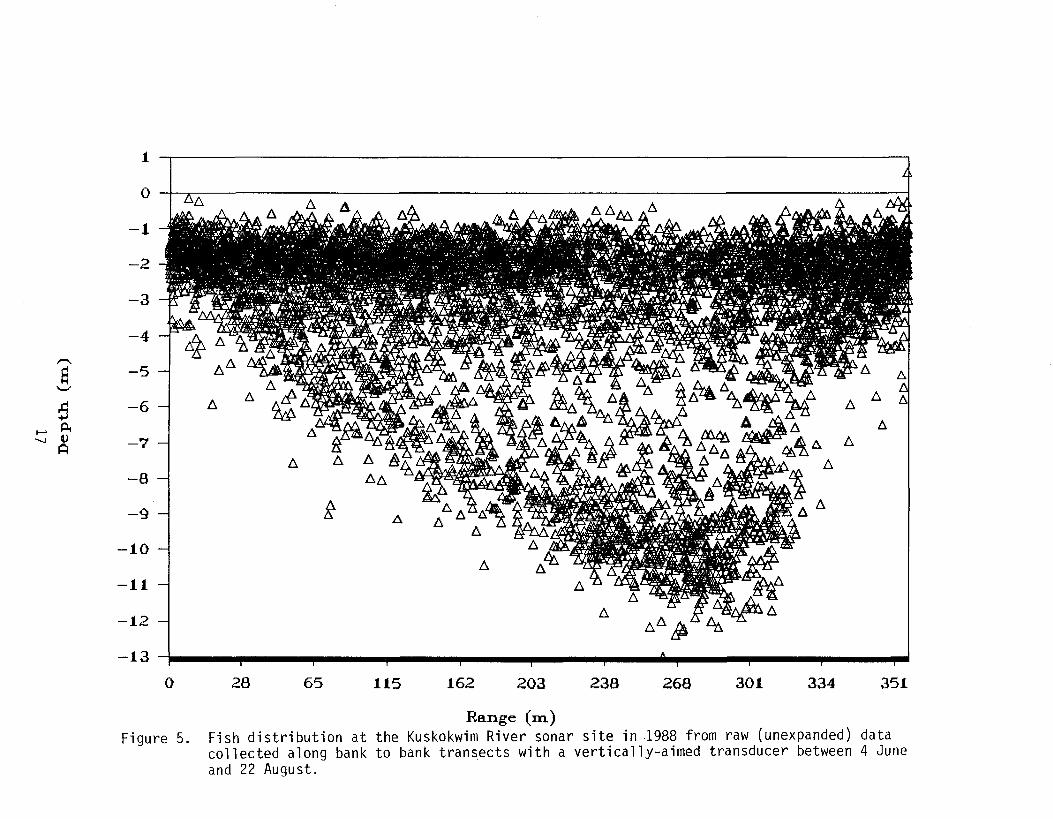
5. Fish distribution at the Kuskokwim River sonar site in 1988 from raw (unexpanded) data collected along bank to bank transects with a vertically-aimed transducer between 4 June and 22 August . . . . . . . . . . . . . . . . . . . . . . . . 17
6. Fish distribution at the Kuskokwim River sonar site in 1988 from spatially expanded data collected along bank to bank transects with a vertically-aimed transducer between 4 June and 22 August . . . . . . . . . . . . . . . . . . . . . . . . 18
iv
ABSTRACT
A three-year study to determine the feasibil ity of using dual-beam sonar to count salmon migrating up the Kuskokwim River in western Alaska began in 1988. A site with characteristics favorable to use of hydroacoustic gear was identified and facilities were constructed. Transducers were deployed on both banks of the river between 15 June and 23 August. Fish spatial distribution was examined by sampling a lateral transect with a vertically aimed transducer between 4 June and 22 August. Analysis of data indicates the presence of fish throughout the water column with most tending to travel near the bank and the surface. Fish were detected in one slough area on the left side of the river, but species identification was not possible. There was no correlation between sonar counts and gill net abundance indices. Partial explanation of these data may be found in differences in area sampled between the two gear types and in the selectivity of gill nets for salmon-size fish. Equipment problems hampered research operations in 1988. Resolution of these problems should allow determination of fish target strength for possible use in allocation of sonar counts to species.
KEY WORDS: Salmon, sonar, hydroacoustic, escapement, Kuskokwim.
v
INTRODUCTION
Kuskokwim River salmon stocks are harvested for both commercial and subsistence use. Exploitation occurs throughout 1,100 km of river with the most intensive fishery located within 218 km of the river mouth. Management of the fishery resource requires measurement of migratory timing, run strength and escapement levels. Silty water and an extensive, braided river channel preclude visual enumeration of migrating chinook (Oncorhynchus tshawytscha), sockeye (0. nerka) , coho (0. kisutch) , and chum (0. ketal salmon, making accurate estimation of these characteristics difficult. Fisheries managers currently make management decisions based on abundance indices obtained from gill net test fi sheri es conducted at ri ver km 42 and 130, and on escapement indices obtained in spawning tributaries located upriver. The need for accurate, precise, and timely escapement data prompted initiation of a three-year program to determine the feasibility of using hydroacoustic techniques to estimate daily and seasonal fish passage.
Long-range goals of the Kuskokwim River sonar project include estimating the number of salmon passing a given point in the lower river, describing the spatial distribution of salmon by targetstrength, and determining species composition using either dual-beam techniques or gill net catch proportions. These goals will be accomplished as the system moves from developmental to operational status as a fisheries management tool. The summer of 1988 marked the first field season of project operation. Immediate goals were:
1. Locate a site with physical characteristics favorable for hydroacoustic fish counting.
2. Establish camp facilities suitable for sonar data collection.
3. Determine the feasibility of counting fish at the site by: a. fitting transducers to the river, collecting target echoes,
and comparing numbers of targets counted to other indices of fish abundance.
b. describing the sampling environment in hydroacoustic context.
4. Describe the horizontal and vertical distribution of salmon through time.
METHODS
Site Selection
Thirty-six sites between Napaskiak and the downstream opening of Kuskokuak slough were ident ifi ed on United States Geo1ogi cal Survey
1
(USGS) topographic maps as potential locations for data collection. These sites were chosen for favorable characteristics such as narrow river width, single channel, and proximity to the most intense commercial fishing activity. Transects across the river perpendicular to current were sampled using a Lowrance X15 portable echo sounder at each of the potential sites. This provided a detailed river-bottom profile as well as channel shape. Transects were evaluated using three criteria: constant slope, single channel, absence of large benthic debris.
Sonar Data Acquisition
Dual-beam Theory
See Ehrenberg (1972) for a detailed explanation of the theory of dualbeam sonar. Recent work (Skvorc, in press) has shown that a riverine dual-beam sonar system can successfully distinguish two species of salmon which differ substantially in size. Target strength values (a correlate of target size) for individual fish are highly variable, but with sufficient size differences between species and statistically adequate numbers of targets, the relative proportions of species passing through the sonar site can be estimated. Dual-beam hydroacoustic techniques are being applied in the Kuskokwim to determine if chinook salmon can be separated from other fish species present based on target strength.
Equipment
Transducers were deployed on the left and right banks of the river. A 4° by 7° elliptical dual-beam transducer was deployed approximately two m offshore on the right bank, and a 6° circular dual-beam transducer was deployed approximately 25 m offshore on the left bank. Each transducer was attached to a tripod-mounted dual-axis pan and tilt uni t.
A Remote Ocean Systems (ROS) pan and tilt system on the right bank permitted remote transducer aiming to one degree precision. A Biosonics pan and tilt system on the left bank allowed remote aiming to one tenth of one degree precision. Both units were controlled from the camp on the right bank. Communication cables were routed from each transducer and pan and tilt unit to the tent. The 1eft bank cabl es were laid across the river bottom (380 m).
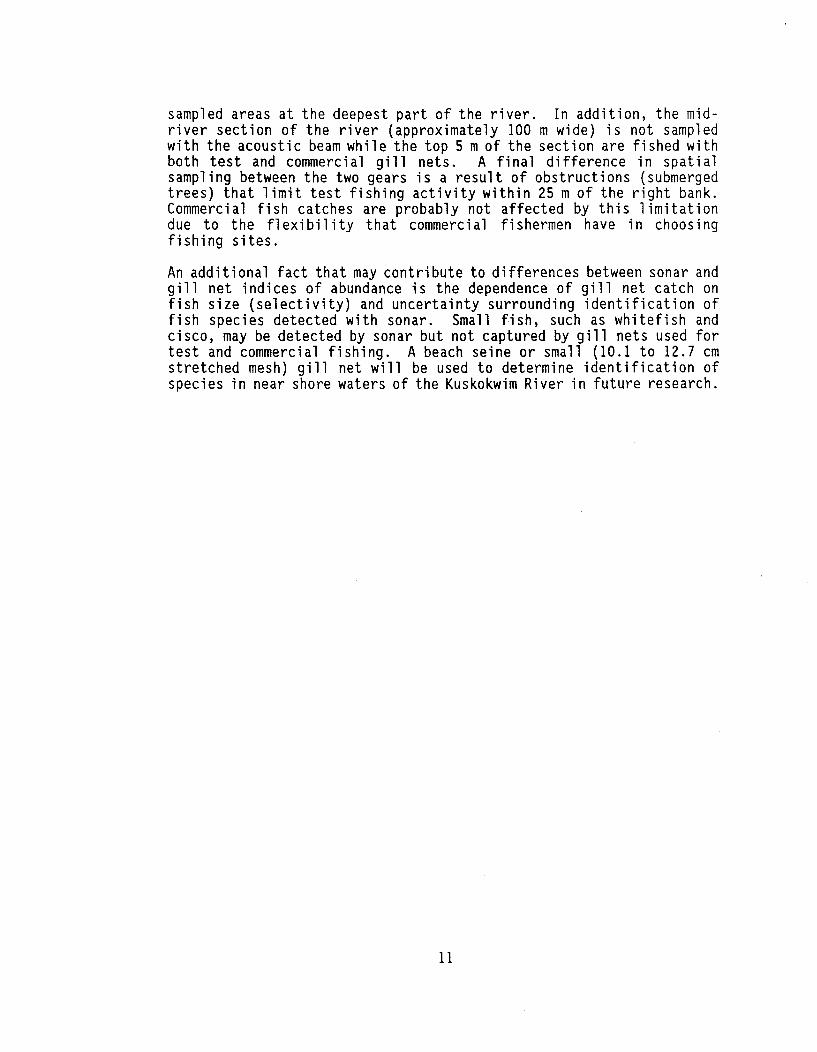
The data acquisition system consisted of a Biosonics model 101 dual-beam transceiver, Biosonics model 151 multiplexer, Biosonics Echo Signal Processor (ESP), Nicolet model 310 digital storage oscilloscope (DSO), Biosonics model 171 digital tape interface, a Sony digital tape recording system, and a Biosonics model III thermal chart recorder (Figure 1). The transmitted frequency was 420 kHz with a pulse width
2
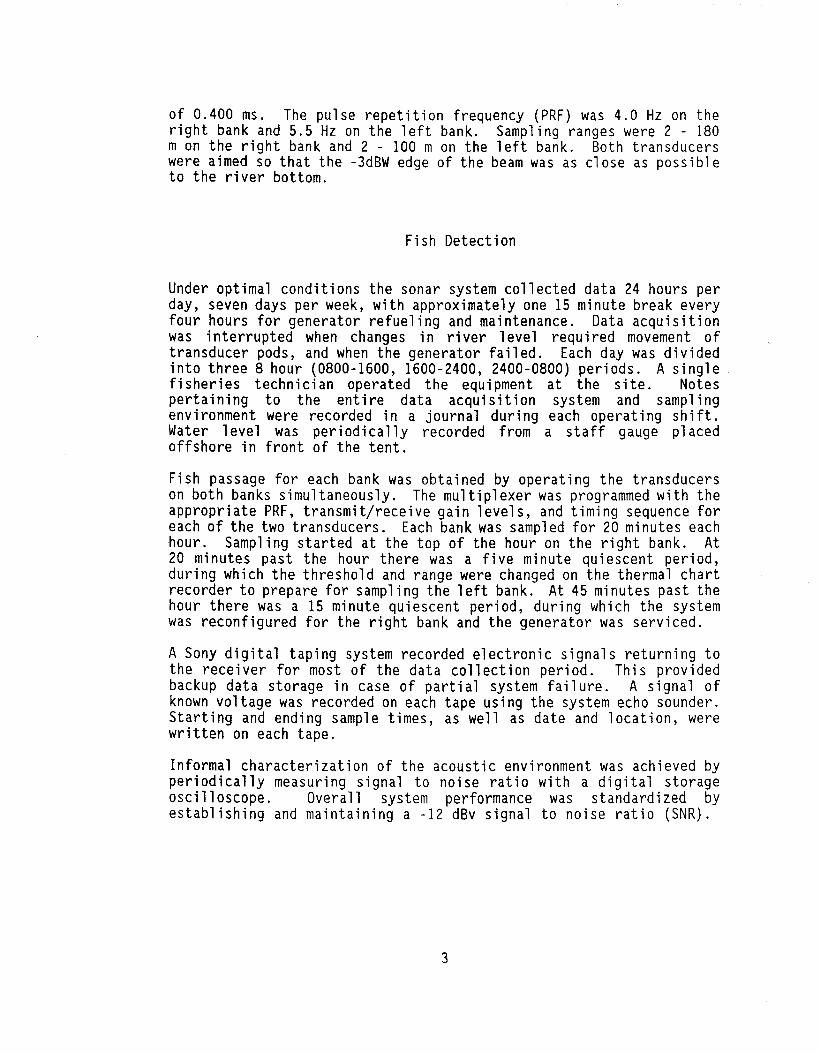
of 0.400 ms. The pulse repetition frequency (PRF) was 4.0 Hz on the right bank and 5.5 Hz on the left bank. Sampling ranges were 2 - 180 m on the right bank and 2 - 100 m on the left bank. Both transducers were aimed so that the -3dBW edge of the beam was as close as possible to the river bottom.
Fish Detection
Under optimal conditions the sonar system collected data 24 hours per day, seven days per week, with approximately one 15 minute break every four hours for generator refueling and maintenance. Data acquisition was interrupted when changes in river level required movement of transducer pods, and when the generator failed. Each day was divided into three 8 hour (0800-1600, 1600-2400, 2400-0800) periods. A single fisheries technician operated the equipment at the site. Notes pertaining to the entire data acquisition system and sampling environment were recorded in a journal during each operating shift. Water level was periodically recorded from a staff gauge placedoffshore in front of the tent.
Fish passage for each bank was obtained by operating the transducers on both banks simultaneously. The multiplexer was programmed with the appropriate PRF, transmit/receive gain levels, and timing sequence for each of the two transducers. Each bank was sampled for 20 minutes each hour. Sampling started at the top of the hour on the right bank. At 20 mi nutes past the hour there was a fi ve mi nute qu i escent peri od, during which the threshold and range were changed on the thermal chart recorder to prepare for sampling the left bank. At 45 minutes past the hour there was a 15 minute quiescent period, during which the system was reconfigured for the right bank and the generator was serviced.
A Sony digital taping system recorded electronic signals returning to the receiver for most of the data collection period. This provided backup data storage in case of partial system failure. A signal of known voltage was recorded on each tape using the system echo sounder. Starting and ending sample times, as well as date and location, were written on each tape.
Informal characterization of the acoustic environment was achieved by periodically measuring signal to noise ratio with a digital storage oscilloscope. Overall system performance was standardized byestablishing and maintaining a -12 dBv signal to noise ratio (SNR).
3
Fish Distribution
Information on fish spatial distribution was obtained by conducting bank-to-bank vertical-looking transects with a Lowrance XIS fathometer and 22° beam transducer. Transects were sampled 12 times daily; six samples each were collected at 1100 and at 1600 hours. Sample times rema i ned constant so that all tide stages were sampled over the duration of the study. Each transect provided a chart recording of the water column from surface to bottom.
A digitizing pad was used to scale each individual chart recording using the actual width and depth of the river. Then each fish trace was given location coordinates using this scale. The conical shape of the beam resulted in increased sampling area with depth; to account for this vertical bias, individual targets from each transect were expandedby C: r
C =
where: r is the maximum depth r i is the depth of the target
There are two nearby sloughs (Church and Straight) that bypass the sonar site. Fish using these sloughs for upstream migration would not be avail abl e to the sonar system. These sloughs were sampl ed for presence or absence of fish using the same portable fathometer used for the across-river transects.
Sonar Estimates vs. Non-Acoustic Abundance Indices
Commercial catch totals and catch per unit effort (CPUE) data from the test fishery are used by managers as indices of fish abundance in the main channel of the Kuskokwim River. These indices were compared to sonar counts to determine their correlation.
Adetailed description of the test fishery is found in Huttunen (1988). The project employs two drift gill nets: a 13.6 cm stretched mesh net 90 m long by 4.5 m deep, and a 20 cm stretched mesh net 90 m long by 5 mdeep. The nets are fished in each of three horizontal strata twice daily. The stratum nearest the left bank is station 1, the mid-river station is station 2, and the stratum nearest the right bank is station 3. The first drift of each tide began one hour after the high tide at Bethel. This ensured that all drifts were conducted after the tide induced flow reversal. The nets are deployed approximately one km upstream from the sonar site and retrieved directly in front of the sonar site. Each net samples each of the three stations once, and samples a randomly selected station a second time during each of the two daily sample intervals.
4
Daily indices of fish abundance obtained from the test fishery were compared to fish passage estimates derived from sonar data. The number of fish passing in front of the transducer during a given time period was estimated by counting target traces from chart recordi ngs made during twenty-minute sampling intervals. Fish counts were taken from chart recordings during the time period that the test fish gill nets sampled the river. These data were analyzed to determine the level of correlation to mean daily CPUE and to commercial catch in an upriverfishing district. The sonar data were first stratified by bank and examined for correlation with mean tidal CPUE indices for corresponding test fishery stations. Additionally, fish traces from fifteen 24-hour peri ods were counted from the chart recordi ngs. Counts were summed over each 24 hour period and analyzed to determine the level of correlation between those data and mean daily test fish CPUE for each of the 15 days.
Finally, the commercial catch within the upriver fishing district adjacent to the sonar site (District 335-12) was tested for correlation with sonar estimates from the day before the commercial opening. This assumed a 24 hour transit time from the sonar site into the district. The correlation analysis was performed to evaluate the predictive value of the sonar estimates to upriver commercial fishery catch.
RESULTS
Site Selection
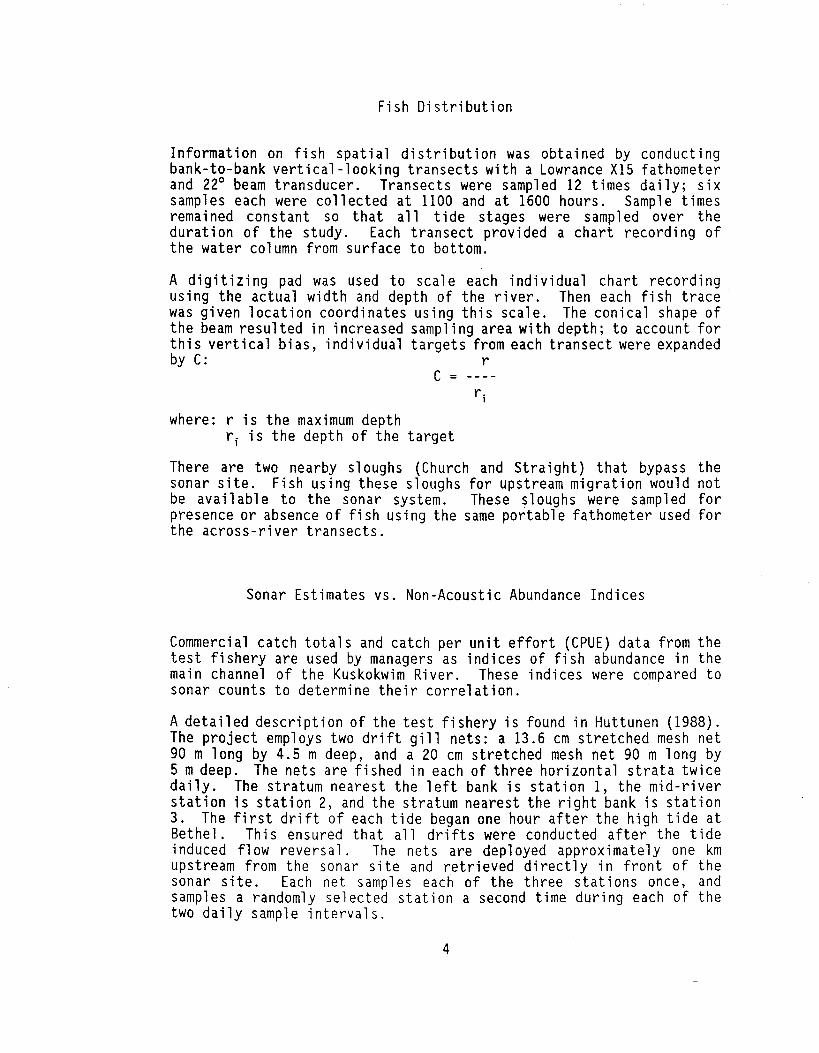
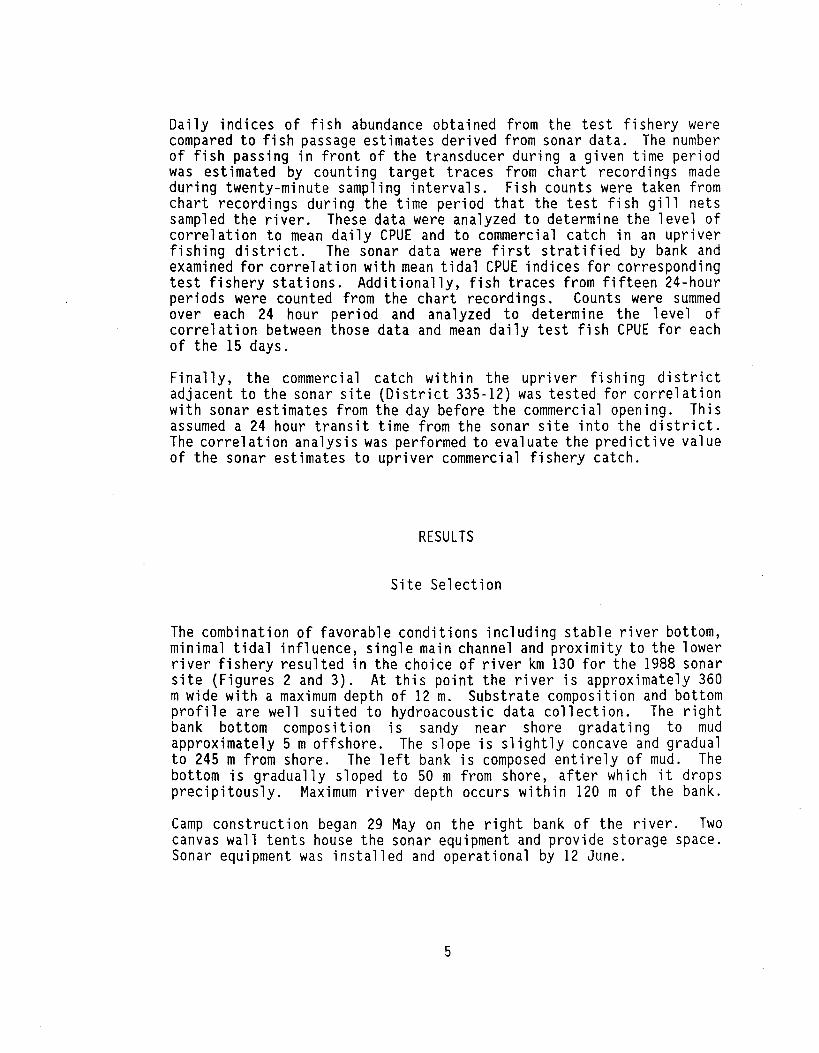
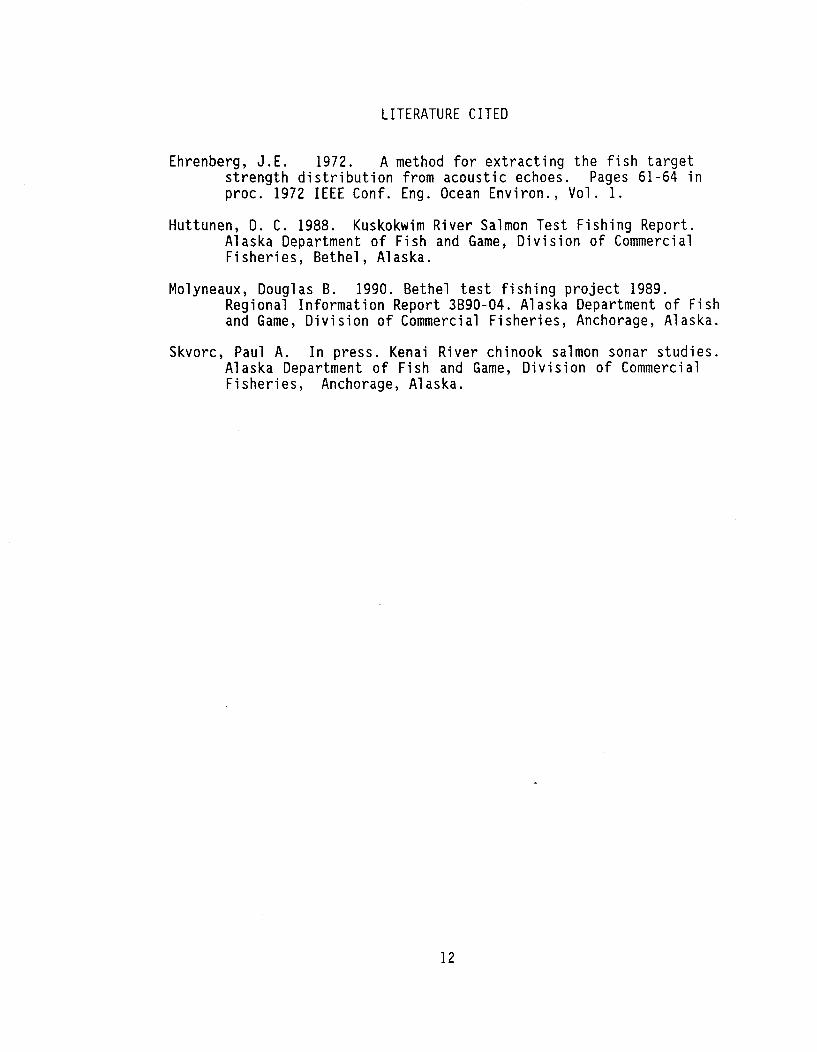
The combination of favorable conditions including stable river bottom, minimal tidal influence, single main channel and proximity to the lower river fishery resulted in the choice of river km 130 for the 1988 sonar site (Figures 2 and 3). At this point the river is approximately 360 mwide with a maximum depth of 12 m. Substrate composition and bottom profile are well suited to hydroacoustic data collection. The right bank bottom composition is sandy near shore gradating to mud approximately 5 moffshore. The slope is slightly concave and gradual to 245 m from shore. The left bank is composed entirely of mud. The bottom is gradually sloped to 50 m from shore, after which it drops precipitously. Maximum river depth occurs within 120 m of the bank.
Camp construction began 29 May on the right bank of the river. Two canvas wall tents house the sonar equipment and prOVide storage space. Sonar equipment was installed and operational by 12 June.
5
Sonar Data Acquisition
Periodic observations of the Kuskokwim River revealed an acousticallyquiet environment with a 12 dBv SNR at the maximum ranges. The right bank bottom profile at the site permitted aiming of the transducer to 180 m range. Unensonified areas under the beam (shadows) were small or non-existent (Figure 4). Equipment was deployed approximately 25 m from shore on the left bank in order to avoid the near-shore shelf. The muddy substrate made retrieval of equipment difficult. As on the ri ght bank, the bottom profil e allowed enson i fi cat i on of the water column with few "shadow" areas to a maximum range of 120 m.
Fish Detection
Acoustic data collection began on 15 June on the right bank. Fish were detected immediately. Data collection continued on the right bank until 14 July. Data were collected from the left bank from 14 July until 7 August. The right bank transducer was then reactivated for an additional three days. During 10 August through 23 August acoustic data were collected simultaneously from both banks for 20 minutes per bank per hour.
Forty-five days of right bank operation resulted in 720 hours of hydroacoust ic data recorded on chart paper and tape. A tota1 of 273,321 fish traces were counted from chart recordings. On the left bank, 23 days of operation yielded 232 hours of data from which 69,625 fish traces were counted. During fifteen days of simultaneous left and right bank data collection 240.5 hours of data were recorded. A total of 36,440 fish traces were counted during this time period, of which 20,042 were from left bank recordings and 16,398 were from right bank recordings. Tape recorded data were not analyzed for target strengthinformation due to a recording equipment malfunction that remained undetected throughout the data collection period.
Fish Distribution
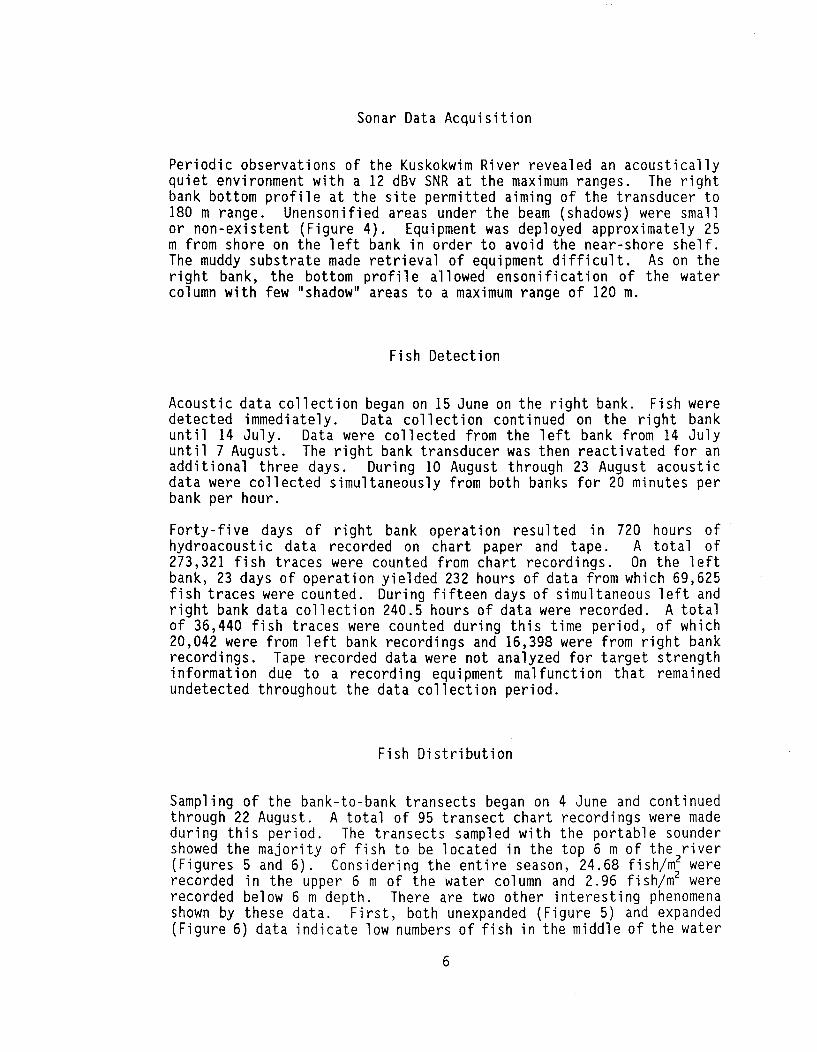
Sampling of the bank-to-bank transects began on 4 June and continued through 22 August. A total of 95 transect chart recordings were made during this period. The transects sampled with the portable sounder showed the majority of fish to be located in the top 6 m of the river (Figures 5 and 6). Considering the entire season, 24.68 fish/m2 were recorded in the upper 6 m of the water column and 2.96 fish/m2 were recorded below 6 m depth. There are two other interesting phenomena shown by these data. First, both unexpanded (Figure 5) and expanded (Figure 6) data indicate low numbers of fish in the middle of the water
6
column and centered around the deepest part of the channel where river velocity is greatest. Secondly, the data indicate fish passage along the bottom of the river in the middle of the channel.
Two acoustic samples totaling 3 hours and 45 minutes were collected at the downstream mouth of Church slough. Four acoustic samples totaling 7 hours were collected at the upstream end of Straight slough. The portable echo sounder recorded the presence of eight fish (species unknown) in Straight Slough; none were detected in Church Slough.
Sonar Estimates vs. Non-Acoustic Abundance Indices
When the acoustic data were stratified by bank and compared with gill net CPUE information collected during the same time period, no statistically significant (p < .05) relationships were detected. Similarly, we found no statistically significant (p < .05) relationships between 24-hour sonar counts and mean daily test gill net CPUE or between 24-hour sonar counts and subsequent commercial fishery catch in an adjacent district.
DISCUSSION
Site Se1ect ion
Evaluation of the data and results from the 1988 field season clearly establishes the feasibility of using hydroacoustic data for fisheries management information in the Kuskokwim River. The site was proven to be conducive to hydroacoustic sampling. The muddy river bottom had absorpt i ve rather than refl ect ive properties, all owi ng a very good signal-to-noise ratio even when the beam was aimed near the bottom. The river bottom at the site remained stable throughout the season.
Although the bottom profile at this site is the best available it is not ideal. The convex slope on the left bank makes achievement of an optimal aim for long-range ensonification with a single near-shore transducer di ffi cult. Thi s site may requi re two transducers for complete ensonification. One transducer would be located near shore while the second transducer would be located offshore at the end of the inshore transducer range. Similarly, the right bank profile and long range to the center of the channel may also require the use of two transducers. A wide-angle transducer could sample near-shore waters, and a narrow-angle transducer deployed at the same location would be used for long range detection. Such an arrangement woul d allow collection of a sufficient number of near shore target echoes for accurate estimation of target strength, while limiting the number of
7
echoes collected from each offshore target to avoid overloading the echo signal processor.
High wi nds and heavy ra in on four August days decreased SNR to an unacceptable level. Ensonification of surface strata for detection of fish, and particularly for echo signal processing, may be hampered byinclement weather conditions. Such conditions are not unusual during the month of August when coho salmon predominate.
The primary disadvantage of the site is the width of the river (360 m). In order to operate the left bank transducer from the tent on the right bank, cables were laid across the river bottom. Retrieval of the cable intact was impossible. It had become embedded in the bottom and the strain required to extract it caused the cable to part. It was determined post-seasonally that a different method of communication from the left bank must be developed. Laying cable across the river is hazardous for personnel and the probability of retrieving it intact is small. Expanding the project into a two-bank, two-camp operationwould be costly and difficult. Such an operation would require purchase of a second acoustic system and funding for additional support staff. Additionally, low ground on the left bank floods during the high tide in the early part of the season and remains wet throughout the operational longevity of the project. Transmission of data from a remote site (the far bank) to the camp installation via radio telecommunication techniques is currently under investigation as a solution to this problem.
Sonar Data Acquisition
Equipment
The summer of 1988 was the first field season for testing dual-beam sonar on the Kuskokwim River. The operation was plagued by equipmentproblems.
Three major product compat i bil ity problems were encountered wh i1e configuring the dual-beam system. The Compaq 386 microcomputer intended for use with the ESP board was incompatible due to the lack of an expans ion slot. A program error in the ESP software caused inaccurate data collection, and the ESP software would not operate in a Windows 386 environment. These problems precluded real time (inseason) estimation of fish target strength. Therefore the echoes were recorded on tape for analysis at a later date. During laboratory processing of the recorded data we discovered that the tapes lacked a synchronization pulse due to a faulty connection on the tape interface unit. Data retrieval was therefore not possible.
There were several other non-acoustic problems. Two difficulties were encountered with the ROS rotating system. First, the unshielded
8
rotator cable caused radio frequency (RF) interference and data loss when the rotator was activated. This problem is rectifiable throughpurchase of shielded cable. For the 1988 season, however, the expense of replacing the cable demanded that the pan and tilt units not be activated during data acquisition. Secondly, the digital readout on the ROS rotator control box di spl ayed only integer,s. A controll er which displays pan and tilt angle to the nearest tenth of a degree is required for the desired level of precision in aiming transducers. Installation of the appropriate LCD display module occurred in 1989.
Two problems compromised multiplexer operation. First, the unit was delivered from the manufacturer configured for single-beam instead of dual-beam operation. Data collection was delayed until the manufacturer del i vered schematics and an el ectroni cally experi enced staff member made necessary modifi cat ions for use as intended. The second problem was sporadic and mysterious loss of programmed sampling sequences from the mult i p1exer memory. We determi ned 1ate in the season that electromagnetic radiation generated by transmitting on the single side band radio caused memory to be changed randomly.
A crucial element of any acoustic data acquisition system in a remote location is the power source. Unfortunately, the generators supplying power to this project were high-maintenance and low-performance, and data collection suffered because of these deficiencies. Fluctuations in voltage suppl ied to the electronic components of the acoustic system, maintenance on motor and generator components, and small fuel capacity caused frequent interruptions in data collection. Furthermore, the generators produced so much noise while operating that neighboring fish camp inhabitants complained. These complaints prompted system shutdown for eight-hour periods on two occasions. A substantial noise-reducing structure was subsequently constructed. The structure and generator were soon thereafter destroyed in a fire started by the generator exhaust system. This sequence of events is a direct result of the State purchasing system, which views initial cost of an item as a11- important and ignores other factors such as quality, reliability, and safety. Honda EM3500 generators were purchased for the 1989 season as experience at other sites has proventheir value.
Fish Detection
The activities of the 1988 field season established the feasibility of hydroacoustic data collection at km 130 of the Kuskokwim River. Objectives of the coming field season will be to further investigate the feasibility of using dual-beam hydroacoustic techniques to separate chinook salmon from other species, to estimate the number of salmon passing river km 130, and to determine optimal transducer specifications and configuration for total river ensonification or accurate count expansion.
9
Fish Distribution
Two factors may bias fish distribution data collected with the portable echo sounder. Air bubbles and noise created by the boat and outboard motor may have scared fish near the surface. Additionally, boat wake turbulence sometimes caused the first one and one half meters of river depth to be uninterpretable on chart recordings. More careful positioning of the transducer during data collection so as to avoid boat and motor turbulence on chart recordings is easily accomplished. The effect of boat noise on fish swimming near the river surface, however, is not easily assessed. For the purposes of this study, however, the results obtained are sufficient in that they indicate fish distribution throughout the water column. Future sampling of the fish population with shore-based, laterally-aimed transducers can therefore not be limited to river bottom areas.
The apparent inverse relationship between fish abundance and water flow is consistent with observations made in other riverine locations. Distribution of fish near the river's surface across its entire width may also be related to river flow patterns; Kuskokwim River flow rates are generally low, particularly during daily high tides. Test gill net data indicate a direct relationship between fish abundance and high tide (Huttunen 1988; Molyneaux 1990). It is not yet clear, however, whether more fish are migrating upstream during daily high water events, or whether they are merely more susceptible to fishing gear at these times.
Chart recordings of fish passage in the sloughs on both sides of the river at the sonar site were difficult to interpret. The wide (22°)angle of the acoustic beam restricted sampling to 3.7 mand 8.5 mrange in Church and Straight sloughs; beyond these ranges surface and bottom reflection made identification of fish traces impossible. Although eight targets were detected in Church slough species composition remains unknown. The slow flow rate and relatively shallow water encountered in the sloughs decreases the probabil ity that they are being used by large numbers of salmon. Rather, it is more likely that resident non-salmon species utilize these areas. The absence of commercial and subsistence fishing effort in the sloughs is indicative of low salmon abundance.
Sonar Estimates vs. Non-Acoustic Abundance Indices
The lack of correlation between sonar counts and the abundance indices derived from gill nets (CPUE and commercial catch totals) may be explained by differences in the areas sampled by the two gear types. The acoustically sampled area consisted of the lower 10 mof the water column (at maximum range). The gill nets, on the other hand, sampled the top 5 m of the water column. Thus, there is only a 3 moverlap in
10
sampled areas at the deepest part of the river. In addition, the midriver section of the river (approximately 100 m wide) is not sampled with the acoustic beam while the top 5 mof the section are fished with both test and commercial gill nets. A final difference in spatialsampling between the two gears is a result of obstructions (submergedtrees) that limit test fishing activity within 25 mof the right bank. Commercial fish catches are probably not affected by this limitation due to the flexibility that commercial fishermen have in choosing fishing sites.
An additional fact that may contribute to differences between sonar and gill net indices of abundance is the dependence of gill net catch on fish size (selectivity) and uncertainty surrounding identification of fish species detected with sonar. Small fish, such as whitefish and cisco, may be detected by sonar but not captured by gill nets used for test and commercial fishing. A beach seine or small (10.1 to 12.7 cm stretched mesh) gill net will be used to determine identification of species in near shore waters of the Kuskokwim River in future research.
11
LITERATURE CITED
Ehrenberg, J.E. 1972. A method for extracting the fish target strength distribution from acoustic echoes. Pages 61-64 in proc. 1972 IEEE Conf. Eng. Ocean Environ., Vol. 1.
Huttunen, D. C. 1988. Kuskokwim River Salmon Test Fishing Report. Alaska Department of Fish and Game, Division of Commercial Fisheries, Bethel, Alaska.
Molyneaux, Douglas B. 1990. Bethel test fishing project 1989. Regional Information Report 3B90-04. Alaska Department of Fish and Game, Division of Commercial Fisheries, Anchorage, Alaska.
Skvorc, Paul A. In press. Kenai River chinook salmon sonar studies. Alaska Department of Fish and Game, Division of Commercial Fisheries, Anchorage, Alaska.
12
....... w
Sony 0igilaI
Biosooics 101 Nicolet 320 Digital
Tape Recording System
Biosonics 171
Dual-beam Transceiver Storage Oscilloscope
Biosonics 111
Digital Tape Interface
Biosooics 151 Multiplexer
A A Transducers
Thermal OJart
Recon:Ier
Figure 1. Kuskokwim River sonar data acquisition system, 1988.
/ /'
/ /'
/' /
/ \ ....
/ ~ 't
"\ "/ 1
/ /
/ /
/ ~~ ~--~~' r-' bJ~
~~it)
KUSKOKWlM AREA
Figure 2.
BETHEL
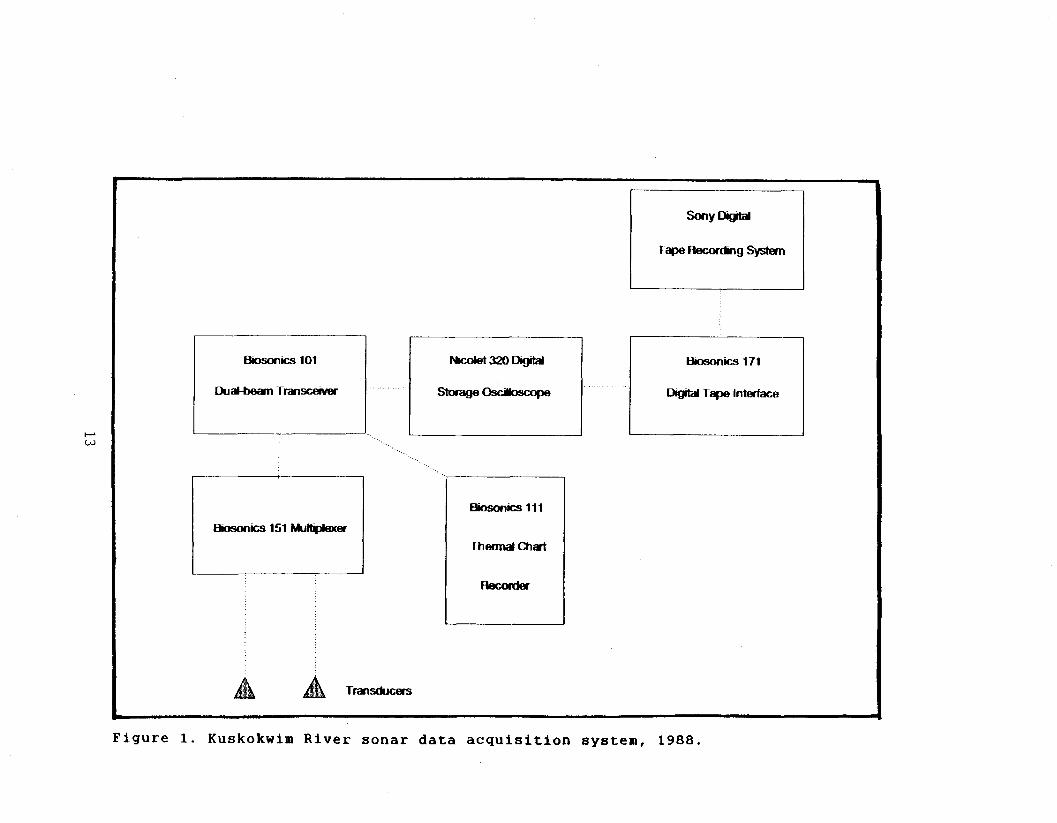
Figure 3. Hap of the Kuskokwim River sonar site and local area, 1988.
15
KUSKOKWIM RIVER SONAR SITE DEPTH PROFILE Cr of R..., ~ Sonar S.
Rlghlllenk
12 m
, 360m
AERIAL VIEW OF SONAR SITE
Sonar Tent•Rig t Bank
Left B nk
Straight Slough
Figure 4. Aerial and cross sectional views of Kuskokwim River sample sites in 1988.
16
1
0
-1
-2
-3
-4
""' -5S '-"
-6~ ....... PI -....J 0 -7
~
-8
-9
-10
-11
-12
-13 ,
6.
~ A
6.
0 28 65 115 162 203 238 268 301 334 351
Range (:m.) Figure 5. Fish distribution at the Kuskokwim River sonar site in 1988 from raw (unexpanded) data
collected along bank to bank transects with a vertically-aimed transducer between 4 June and 22 August.
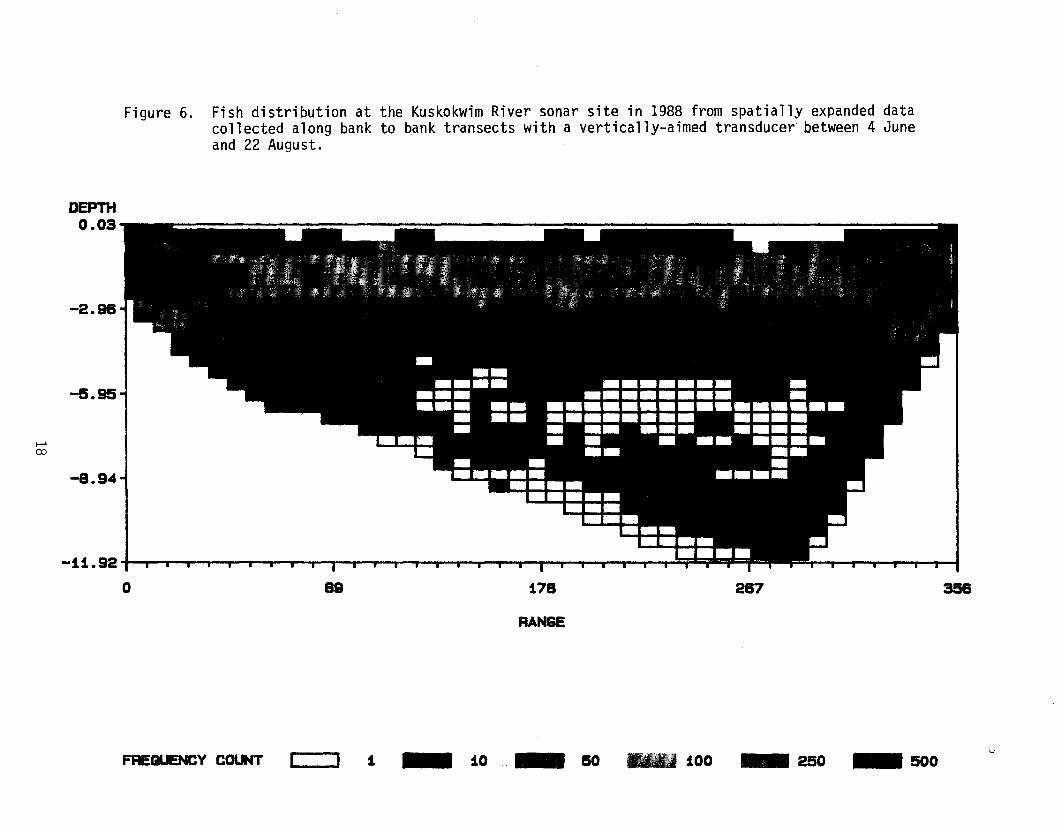
Figure 6. Fish distribution at the Kuskokwim River sonar site in 1988 from spatially expanded data collected along bank to bank transects with a vertically-aimed transducer between 4 June and 22 August.
DEPTH 0.03
-2.96
-5.95
I-' co
-8.94
~ , , , ,-{1.92 iii iii i i • Iii iii iii i I Iii iii iii i
o
AAN&E
89 t78 287 35B
uFAEGUENCY COUNT ~ I t _ to _ 50 _ tOO 250 _500