Embed Size (px)
Citation preview

po96-04NumberMN DEPT OF TRANSPORTATION
UI l11 H1 I 11I II I3 0314 00023 6926
CTSTE270.M651995
Moisture Sensitivity in AsphaltConcrete Mixtures
UNIVERSITY OF MINNESOTA
CENTER FOR
STUDIES* * * **E***
r r LL
L
L

FUNDING ACKNOWLEDGEMENT
This project was conducted with funding provided by the Center for Transportation Studies (CTS). The CTS supports the University ofMinnesota's research mission with a broad program covering many topics related to transportation. The program includes both
fundamental and applied research, with the goal of expanding the existing body of transportation knowledge.

Technical Report Documentation Page1. Report No. 2. 3. Recipient's Accession No.
MN/RC - 96/04
4. Title and Subtitle 5. Report Date
MOISTURE SENSITIVITY IN ASPHALT CONCRETE November 1995MIXTURES
6.
7. Author(s) 8. Performing Organization Report No.
Mary Stroup-Gardiner, David E. NewcombBenita Crow, William Kussman, *Dan Wegman
9. Performing Organization Name and Address 10. Project/Task/Work Unit No.
University of Minnesota *Mn/DOT Office of MaterialsCivil Engineering Department Research and Engineering500 Pillsbury Dr. S.E. Physical Research Section 11. Contract (C) or Grant (G) No.Minneapolis, Minnesota 55455 1400 Gervais Avenue
Maplewood, MN 5510972275 TOC#
12. Sponsoring Organization Name and Address 13. Type of Report and Period Covered
Minnesota Department of Transportation Final Report 1994-1995395 John Ireland BoulevardSt.Paul Minnesota, 55155 14. Sponsoring Agency CodeSt.Paul Minnesota, 55155
15. Supplementary Notes
16. Abstract (Limit: 200 words)
The research performed for this report was intended to recommend alternative mix design procedures andparameters for evaluation of asphalt mixture sensitivity, with more of an emphasis on volumetric relationships.Three Mn/DOT projects were selected to represent the following durability issues: 1) debonding of asphalt fromaggregate, 2) cohesion problems, and 3) mix design problems. Materials were obtained from these constructionprojects and evaluated in the laboratory. Gradations were varied from the project specifications so that mixtureswith more and less asphalt were evaluated along with the project mixture. Testing included the temperaturesusceptibility and moisture sensitivity of the mixtures, in addition to the net adsorption test on the aggregates.
The results suggested means for identifying moisture sensitivity mechanisms in mixtures during the mixturedesign phase, although these need to be confirmed through more extensive investigation. Aggregate mineralogy,gradation, and mixture proportioning can all play a role in improving the durability characteristics of asphaltmixtures. Recommendations are made for continued research and implementation of an improved approach toasphalt mixture design.
17. Document Analysis/Descriptors 18. Availability Statement
Moisture Sensitivity Tensile Strength Ratios No restrictions. Document available from:Asphalt Concrete Mixtures National Technical Information Services,
Springfield, Virginia 22161
19. Security Class (this report) 20. Security Class (this page) 21. No. of Pages 22. Price
Unclassified Unclassified 60

Moisture Sensitivity in Asphalt Concrete Mixtures
Final Report
Prepared by
Mary Stroup-GardinerDavid E. Newcomb
Benita CrowWilliam Kussman
University of MinnesotaCivil Engineering Department
500 Pillsbury Dr. S.E.Minneapolis, Minnesota 55455
(612) 626-1341
and
Dan Wegman
Minnesota Department of Transportation1400 Gervais Ave.
Maplewood, Minnesota 55109
November 1995
Published by
Minnesota Department of TransportationOffice of Research Administration200 Ford Building Mail Stop 330
117 University AvenueSt. Paul, Minnesota 55155
This report represents the results of research conducted by the authors and does not necessarily reflect the official views orpolicies of the Minnesota Department of Transportation. This report does not contain a standard or specified technique.

Table of Contents
Introduction .................
Research Program .............
Objectives .............
Scope ................
Selection of Projects ............
Materials ...................
Asphalt Cements .........
Aggregates .............
Mix Designs .................
Testing Program ..............
Temperature Susceptibility ...
Moisture Sensitivity .......
Net Adsorption ......
ASTM D4867 (Modified
Analysis ...................
Temperature Susceptibility ...
Moisture Sensitivity .......
Net Adsorption ......
Mixture Testing .....
Lottman)...................
00006000000000000**00*000. .* . . . . . ... . . .. • 0 a• •.. . . . . . . ..a. •
. .. . . . .. . . . . . . . . . . ... · • • • • • •
. . . . . . . . . . . . . . . . . . . . . .• . •...........................................................................
.........................
Lottman) ...........................................
.........................
.........................
.........................
.........................
Page
. 1
. 1
. 1
. 2
S3
. 4
. 4
. 5
S8
10
10
11
11
12
13
13
17
17
19
Initial Between-Laboratory Comparison of Compacted
Mixture Results ........................
Film Thickness, Air Voids, and VMA Considerations
Modified Lottman (ASTM D4867) Mixture Results .
Mixture Tensile Strength Requirements .........
Conclusions .........................................
Recommendations .....................................
Bibliography .........................................
Appendix A - Asphalt Mixture Durability Study 9PRS1016
19
20
22
24
27
29
31
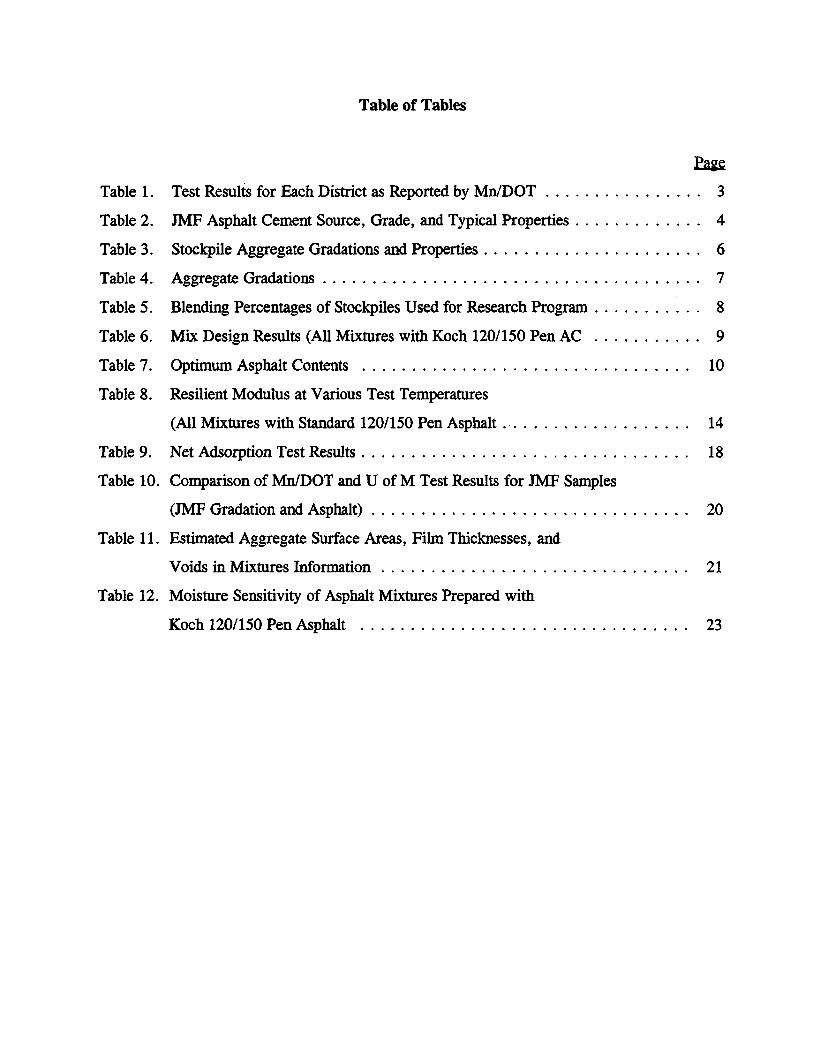
Table of Tables
Table 1. Test Results for Each District as Reported by Mn/DOT ................ 3
Table 2. JMF Asphalt Cement Source, Grade, and Typical Properties ............. 4
Table 3. Stockpile Aggregate Gradations and Properties ...................... 6
Table 4. Aggregate Gradations ...................................... 7
Table 5. Blending Percentages of Stockpiles Used for Research Program ........... 8
Table 6. Mix Design Results (All Mixtures with Koch 120/150 Pen AC ........... 9
Table 7. Optimum Asphalt Contents ......................... ....... 10
Table 8. Resilient Modulus at Various Test Temperatures
(All Mixtures with Standard 120/150 Pen Asphalt .................... 14
Table 9. Net Adsorption Test Results ................................. 18
Table 10. Comparison of Mn/DOT and U of M Test Results for JMF Samples
(JMF Gradation and Asphalt) ......... ....................... 20
Table 11. Estimated Aggregate Surface Areas, Film Thicknesses, and
Voids in Mixtures Information ............................... 21
Table 12. Moisture Sensitivity of Asphalt Mixtures Prepared with
Koch 120/150 Pen Asphalt ................................. 23

Table of Figures
Page
Figure 1. Aggregate Gradations .....................................
Figure 2. Comparison of Different Gradations for Each District ................
Figure 3. Comparison of Different Aggregate Sources (Districts)
for Each Gradation .......................................
Figure 4. Influence of Aggregate Gradation on net Adsorption Results ............
Figure 5. Influence of Film Thickness on Conditioned (Wet)
Tensile Strengths ........................................
Figure 6. Relationship Between Type of Mix, and Tensile Strengths and Ratios
[12.5 mm (2-in) minus Gradation] ............................
Figure 7. Relationship Between Type of Mix, and Tensile Strength and Ratios
[19 mm (3/4-in) minus Gradation) .............................
. 7
15
16
19
22
25
26


INTRODUCTION
Durability is one of the greatest problems confronting the performance of flexible
pavements. No amount of conservation in design can make up for a lack of resistance to
weathering. Although durability problems are normally associated with a lack of bonding between
asphalt and aggregate (stripping) other mixture related problems may result in moisture sensitivity.
Over the last 20 or so years, many states have mitigated moisture damage in asphalt
concrete with the addition of either liquid anti-strip additives or hydrated lime. While the use of
lime has proven to be the most consistently successful method for reducing moisture related
accelerated pavement distresses, this additive also requires plant modifications and additional
environmental and worker safety considerations. A more desirable approach would be to adjust
standard mix design parameters related to pavement durability such as the asphalt film thickness
and the in-place voids.
In order to determine whether an additive is required or if changes in the mix design would
be sufficient to mitigate moisture related problems, a laboratory testing program capable of
identifying the cause of moisture sensitivity needs to be established. While the moisture
sensitivity of mixtures has been evaluated extensively over the last 20 years, only limited work
has been done to specifically identify the reasons for moisture sensitivity. Before a routine
program for evaluating moisture sensitivity can be added to the mix design process, current tests
need to be evaluated to ensure that they identify the actual cause of the problem.
RESEARCH PROGRAM
Objectives
The main objective of this research was to recommend alternative mix design procedures and
parameters for moisture sensitive mixtures. It was anticipated that these recommendations would
be based on current mix design technology with an increased emphasis on volumetric relationships
(i.e., voids filled with asphalt, aggregate gradation, voids in mineral aggregate, total voids).
Scope
The research program was developed to investigate the influence of changes in film thickness and
voids in mineral aggregate (VMA) with changes in aggregate gradation on the moisture sensitivity
of hot mix asphalt concrete. Three projects were selected based on preliminary testing by
Mn/DOT. It was felt that each of these projects would represent one of three moisture sensitivity
mechanisms: 1) true stripping (debonding of asphalt from aggregate), 2) potential cohesion
problems, and 3) mix design problems. This study was designed to be a complimentary study to
the durability study conducted by the Minnesota Department of Transportation (Mn/DOT). The
final Mn/DOT report for this study is included as Appendix A.
Supplies of both aggregate and asphalt for each project were obtained during construction.
Mixtures were first prepared using the job mix formula (JMF) asphalts and aggregates in order
to compare the University of Minnesota (U of M) tensile strength results with the Mn/DOT
results. Next, the JMF aggregate gradation was used with a standard asphalt cement to determine
the influence of a change in asphalt cement source, and in one case a change in grade, on moisture
sensitivity. The influence of film thickness was evaluated by selecting a coarse gradation that
would produce a VMA similar to that of the typically fine aggregate gradation used in the JMF.
A second finer gradation was used to produce mixtures with thinner film thicknesses.
Testing included determining the temperature susceptibility of each of the mixtures as well
as the retained resilient modulus and tensile strengths after moisture conditioning. The net
adsorption test, developed during the Strategic Highway Research Program (SHRP) was also
evaluated as an additional method for identifying moisture sensitive mixtures.
Final recommendations were based on a summary of these results and those reported by
MnDOT in Appendix A.

SELECTION OF PROJECTS
A preliminary laboratory evaluation of a wide range of mixtures obtained from
construction projects throughout the state was conducted at the Mn/DOT laboratory. This work
included an evaluation of unconditioned tensile strengths, tensile strengths after a warm soak, and
tensile strengths after a freeze/thaw cycle, as well as a visual estimate of stripping (Appendix A).
Based on these results, three projects exhibiting a wide range of test results were selected for
further testing at the University of Minnesota laboratory.
The first project selected was from District 6 (Project No. 7904-06) because it exhibited
a moderate unconditioned tensile strength, but a high level of visual stripping was noted after
moisture conditioning (Table 1). The second project was selected from District 7 (Project No.
3204-60) because it had a high unconditioned tensile strength , a low retained strength ratio after
freeze/thaw conditioning, and little sign of visual stripping. The third project was selected from
District 8 (Project No. 6407-27) because it had a low unconditioned tensile strength, a high
retained strength ratio after freeze/thaw conditioning, and little visual stripping. These projects
should provide information on how changes in mix design parameters change moisture sensitivity
due to 1) the debonding of the asphalt from the aggregate (true stripping - District 6), 2) loss of
cohesive strength (District 7), and 3) low initial mixture strength (District 8).
Table 1. Test Results for Each District as Reported by Mn/DOT.
621 kPa
(92 psi)
883 kPa
(128 psi)
414 kPa
(60 psi)
359 kPa 455 kPa 414 kPa
(52) psi (66 psi) (60 psi)
56 51 100
30 to 40 < 3 5 to 10

MATERIALS
All original job mix formula (JMF) materials were characterized at the Mn/DOT
laboratory. In order to reduce the number of variables in the University of Minnesota's research
program, the asphalt source and grade were standardized.
Asphalt Cements
Table 1 shows typical values for the job mix formula asphalt cement source and grade used
in each of the projects. The Koch 120/150 pen asphalt cement from the Rosemont, Minnesota
refinery was selected as the standard asphalt used throughout the research program. The
properties for this asphalt are also shown in Table 2.
Table 2. JMF Asphalt Cement Source, Grade, and Typical Properties.
Properties District 61 District 71 District 81 Standard Asphalt
SP 7904-036 SP 3204-60 SP 6407-27
Source Ashland Ashland, Richards Koch
St. Paul Park
Grade 120/150 85/100 120/150 120/150
Viscosities:
600 (140 0F), Poise 400 1,131 752 877
1350 C (2750F), cSt 160 295 243 276
Penetration
250C (770 F), dmm 120 85 122 132
% Loss -0.16 -0.07 0.03 -0.18
1: Data Supplied by Mn/DOT
4

Aggregates
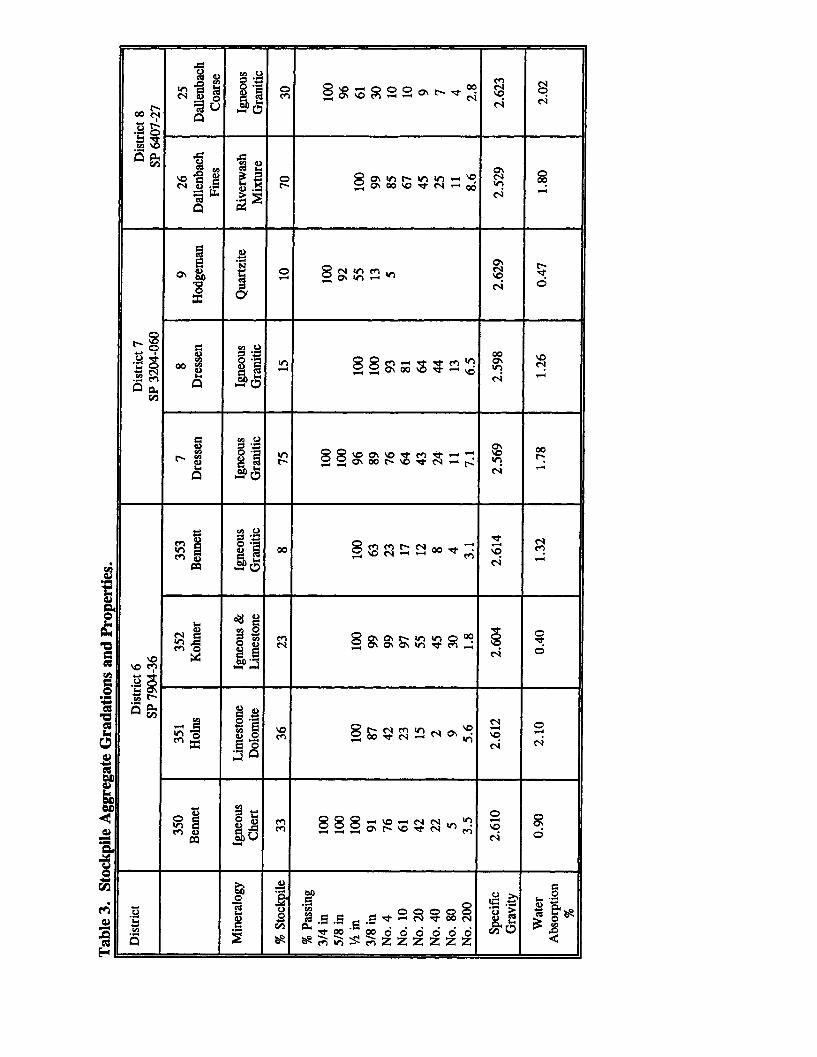
The aggregate gradations of the individual stockpiles used for each of the three projects
are shown in Table 2. This table also shows that the project in District 6 used 4 stockpiles while
the projects in Districts 7 and 8 used 3 and 2 stockpiles, respectively. A limited visual assessment
of the general mineralogy of each stockpile is also shown in Table 3.
The aggregates shown in Table 3 were used to prepare samples with the JMF gradation
and two additional gradations. The coarse gradation, actually the bottom of the 2340 Type 41
gradation band, was selected to fall below the maximum density line, have an increased film
thickness, but with VMA similar to those for the JMF. The fine gradation was selected as the top
of the Mn/DOT 2341 gradation band and was included as a means of evaluating a reducing film
thickness because of an increased aggregate surface area. All gradations are shown in Table 4.
Figure 1 shows that there was little difference in any of the three district JMF gradations.
The blending percentages for each stockpile for each of the fine, JMF, and coarse
gradations are shown in Table 5. The blending percentages for the JMF formula used in the
construction project and those used for the research samples differed somewhat due to differences
in the aggregate processing procedures and limited materials available for preparing research
samples.
S ;a g u
N 4
f ,
tn ---
0(4\4 -I I h s
g
S0 t a 1 -
Sn
000
a a-
te nn ..o c1 | 00 00
h W0PC -eno%-----------0---
*_ .__________________
en
S' II~
c ^r
- & cs ( .4 Co .)•m It 00 0°§~~~~~ z z z zw9 6 z &S^LA S? ?;? S2; &

Table 4. Aggregate Gradations.
Job Mix Formulas Laboratory Gradations
Properties District 6 District 7 District 8 Coarse FineSP 7904- SP 3204-60 SP 6407-27 Gradation Gradation
036
Cumulative % Passing18.75 mm (3/4 in) 100 100 100 10015.63 mm (5/8 in) 99 100 100 10012.5 mm (1 in) 100 93 98 95 1009.5 mm (3.8 in) 89 83 93 65 95
4.75 mm (No. 4) 65 70 69 52 832.07 mm (No. 10) 52 54 52 37 650.45 mm (No. 40) 23 21 24 10 350.075 mm (No. 200) 4 6 6 2 10
100
80
60
40
20
n
0.01 0.1 1 10
Sieve Size, mm
Figure 1. Aggregate Gradations.
100

Table 5. Blending Percentages of Stockpiles Used for Research Program.
District Gradation Stockpile & Stockpile & Stockpile & Stockpile &Percent Percent Percent Percent
District 6 Fine No. 350, 20% No. 351, 14% No. 352, 60% No. 353, 6%
JMF No. 350, 30% No. 351, 15% No. 352, 30% No. 353, 25%
Coarse No. 350, 2% No. 351, 30% No. 352, 15% No. 353, 53%
District 7 Fine No. 7, 18% No. 8, 73% No. 9, 9% Not Applicable
JMF No. 7, 18% No. 8, 54% No. 9, 28%
Coarse No. 7, 31% No. 8, 28% No. 9, 41%
District 8 Fine No. 26, 97% No. 25, 3% Not Applicable
JMF No. 26, 90% No. 25, 10%
Coarse. No. 26, 50% No. 25, 50%
MIX DESIGNS
The optimum asphalt cement contents were reported by Mn/DOT as 6.0, 5.5, and 5.0
percent for District 6 (SP 7904-036), District 7 (SP 3204-60), and District 8 (SP 6407-27),
respectively. These were held constant in order to assess the influence of changes in asphalt film
thickness due to changes in aggregate gradation on moisture sensitivity. While these values were
held constant, Marshall mix designs were completed for all gradations so that actual asphalt
contents could be compared to optimum asphalt contents. All mix design results are shown in
Table 6.
The Marshall stability of the JMF and fine aggregate gradations were similar (Table 6).
The coarse aggregate gradation had generally higher stability values than either the JMF or fine
gradations.
Changing from the JMF and job mix asphalt cement to the JMF and standard asphalt
cement resulted in a decrease in the optimum asphalt cement content for the District 6 mix, similar
cement content for District 7, and an increase in the optimum content for the District 8 mix (Table
7). While these changes may appear to be due to the change in asphalt source, they were more
likely due to differences in the specific stockpile percentages between the construction project and
research aggregate gradations (Tables 3 and 5).
8

Using the coarse gradation and the standard Koch asphalt resulted in a uniform reduction
in the optimum asphalt cement content of about 0.7 percent for both District 7 and 8 mixtures and
little change in the District 6 mixture. The design void level of 4 percent was not achieved for
the fine mixtures (Table 6). Therefore, the only observation that can be made for these mixtures
is that the fine gradation resulted in an increased optimum asphalt content. The corresponding
increase in VMA for the fine gradation reflects both the higher air voids as well as the reduction
in asphalt film thickness due to the increased aggregate surface area.
Table 6. Mix Design Results (All Mixtures with Koch 120/150 AC).
Asphalt JMF Coarse Gradation Fine GradationCementContent, Marshall VMA, Air Marshall VMA, Air Marshall VMA, Air
S Stability, % Voids, Stability, % Voids, Stability, % Voids,lb. % lb. % lb. %
District 6 (SP 7904-036)
4.0 NA NA NA 1,079 15.8 7.7 NA NA NA
4.5 1,043 14.6 6.0 1,170 15.4 7.3 NA 19.8 11.8
5.0 1,211 14.2 5.2 1,677 15.4 4.2 NA 17.6 10.1
5.5 1,451 13.3 1.9 1,700 15.9 4.0 NA 20.4 9.1
6.0 1,529 13.5 0.5 NA NA NA NA 18.0 6.2
District 7 (SP 3402-60)
4.0 NA NA NA 1,566 13.7 5.0 NA NA NA
4.5 1,310 13.4 6.2 1,249 13.7 3.8 1,201 16.9 9.1
5.0 1,397 14.2 5.4 1,536 12.2 1.2 1,283 16.9 7.7
5.5 1,175 13.5 3.0 1,621 12.0 1.5 1,265 16.7 6.1
6.0 1,472 13.2 1.3 NA NA NA 1,223 16.7 5.5
District 8 (6407-27)
4.0 NA NA NA 1,566 13.2 5.0 NA NA NA
4.5 1,111 18.1 6.9 1,249 13.1 3.8 961 21.8 11.0
5.0 930 18.2 5.5 1,536 11.7 1.2 1,104 24.0 11.6
5.5 943 19.0 5.2 1,621 11.5 1.5 980 21. 7.3
6.0 840 18.4 3.4 NA NA NA 987 19.7 5.1
9

Table 7. Optimum Asphalt Contents.
6.0 5.3 5.5 > 6.0
5.5 5.3 4.5 > 6.0
5.0 5.7 5.0 > 6.0
TESTING PROGRAM
Temperature Susceptibility
The temperature susceptibility of a mixture is evaluated by determining the change in
mixture stiffness with temperature. Measurements of resilient modulus determined according to
ASTM D4123 at various test temperatures are commonly used to develop this relationship.
Briefly, a conventional size sample was placed diametrically in a load frame capable of
applying a haversine load pulse for 0.1 seconds. This load was followed by rest periods of
varying durations (0.33, 0.5, and 1 Hz) and the corresponding horizontal deformations were
measured. The magnitude of the applied load was adjusted for each temperature and mixture type
so that the horizontal deformation was kept between 1.25 and 3.75 gm (50 and 150 p-in). A
minimum of 10 preconditioning cycles were used prior to data acquisition. Testing was conducted
at three test temperatures: 1, 25, and 40°C (34, 77, and 104°F).
ASTM D4123 specifies that both horizontal and vertical deformations be measured; these
measurements are intended to be used to calculate Poisson's ratio. However research has shown
that this type of total vertical displacement measurement is unreliable for this calculation.
Therefore all testing using this configuration assumed Poisson's ratio to be: 0.2 for temperatures
below 1°C (34°F), 0.3 for 100C (50°F), 0.35 for 250C (77°F), and 0.5 for 400C (1040F) (10).
10

Moisture Sensitivity
The most commonly accepted measure of the loss of mixture strength due to moisture and
freeze/thaw damage is defined by the ASTM D 4867, "Standard Test Method for Evaluating the
Effect of Moisture on Asphalt Concrete Paving Mixtures" (1). The research behind development
of this procedure has shown that there is a general correlation between laboratory results and
observed moisture damage of in-service pavements. Mixtures with retained strengths less than
about 70 percent tend to exhibit moisture related pavement distresses (2). This is the test method
recommended for inclusion in the SHRP Level 1 mix design procedures.
A second method to evaluate the loss of adhesion at the asphalt-aggregate interface was
recently developed by researchers at Auburn University for the SHRP A-003B contract. While
this method looks promising, the test method was not fully developed by the end of the SHRP
contract. The final procedure used to evaluate these mixtures was developed under a separate
Mn/DOT research project (3).
Net Adsorption
A 134-mL sample of a 0.6 g/L solution of asphalt cement dissolved in toluene was placed
in a large chromatography column and a peristaltic pump was used to continuously circulate the
solution. A set of three columns were run simultaneously. Four milliliters of solution were
removed from each column for an initial determination of asphalt cement concentration with a
spectrophotometer. The spectrophotometer measures the light absorbed by asphalt cement
molecules suspended in the toluene. A wave length of 410 nm was used since it has been found
to be the most sensitive wave length.
Fifty grams of graded aggregate were then added to each column and the solution was
circulated through the column for 6 hours. Another 4-mL was removed from each column and
the amount of adsorbed asphalt determined with a second spectrophotometer reading. Water
(1150 CjL) was added, and the solution and water recirculated for another 2 hours. The third and
final reading was obtained at this time. This measurement is used to indicate the amount of
11

asphalt cement that is returned to the solution due to the presence of water. The within-laboratory
standard deviation was reported by SHRP as 0.14 mg/g for either washed or unwashed minus 4.75
mm (No. 4) fraction gradations.
One change was made in the original SHRP procedure. This was to use 50 g of the full
aggregate gradation rather than limit the test to only the minus 4.75 mm (No. 4) fraction. This
change was made in order to assess the influence of the full gradation on moisture sensitivity (3).
The amount of asphalt adsorbed from the solution at any given time is calculated by:
V A -AB = -C (' M A
0
Where:
Bt = adsorption of asphalt cement by aggregate, mg/g
V = volume of solution in column just prior to obtaining reading,-mL
M = mass of aggregate in column, g
Ao = initial absorbance reading
At = absorbance reading at time, t
Co = initial concentration of asphalt in solution, g/ml
The amount of asphalt cement that is desorbed is the adsorption value after the water has been
added to the column minus the value obtained just prior to adding the water to the column.
ASTM D4867 (Modified Lottman)
A set of six samples was prepared for each gradation and project; all samples for a given project
were prepared with the same reduced numbers of blows to produce air void contents of 7 to 9
percent. Briefly, samples were separated into two sets. Air voids, resilient modulus and tensile
strengths were determined for the first set (i.e., unconditioned). The second set of samples were
partially saturated (55 - 80 percent), wrapped, frozen for a minimum of 15 hours, unwrapped and
12

thawed for 24 hours in a 40°C (140°F) water bath. The samples were then brought to the 250C
(770F) test temperature by storing in a water bath for 2 hours prior to testing. The data from this
set of samples were referred to as the conditioned results. Moisture sensitivity was expressed as
both the absolute values, before and after conditioning, for resilient modulus and tensile strength
as well as the ratios of conditioned to unconditioned values.
Resilient modulus was determined at the 0.1-second load duration with the measurements
taken over the full diameter of the sample (ASTM D4123), and test frequencies of 0.33, 0.5, 1.0
Hz. Tensile strengths were determined at a loading rate of 50 mm/min (2 in/min).
ANALYSIS
Temperature Susceptibility
Figure 2 shows that there was no consistent influence of a change of aggregate gradation on the
temperature susceptibility for a given district (Table 8). There was little difference between 1 and
250C (32 and 77'F) for either District 6 or 7 mixtures while District 8 showed that the coarse
gradation increased the mixture stiffness over the entire range of test temperatures. Differences
between the gradations were only seen at the warmer 40°C (104°F) temperature for Districts 6 and
7.
Figure 3 shows that all three individual projects had little difference in the temperature
susceptibility at or below 250C (770F) when the fine gradation was used. There was a significant
difference between all three projects at the warmer 400C (1040F) test temperature. The differences
in the temperature susceptibility became more project-specific as the coarseness of the gradation
increased. Since the air voids and VMA were within a narrow range for a given gradation, any
influence on the temperature susceptibility would most likely be due to differences in the
aggregate stockpiles. These differences would include percent and number of crushed faces,
mineralogy, and surface texture.
13

Table 8. Resilient Modulus at Various Test Temperatures.
(All Mixtures with Standard 120/150 Pen Asphalt)
NA:Samples too son to test.
14

District 6 (Project 7904-36)
Temperatur, C
District 7 (Project 3204-80)
1000
1000
Temperature, C
District 8 (Project 6407-27)
0 10 20 30
Temperature, C
-40 50
Figure 2. Comparison of Different Gradations for Each District.
15
Rellent Modulus, MPa
I'Fne ..JMF Grad. *CCoar"
0 10 20 30 40 5
1000
100
I

Comparison of Fine Gradations
1000
0 10 20 30
Temperature, C
1000
100
40 50
Comparison of JMF Gradations
Realent Modulus, MPa
Dit.t 0 (79046) BDttW 7(32040) DitL 8 (6407-27)
* * * * I * I * I * I * *
10 mpatue CTemperatmue CComparison of Coarse Gradations
1000
1000 10 20 30 40 50
Temperature, C
Figure 3. Comparison of Different Aggregate Sources (Districts) for Each Gradation.
16
4A fA JA A ci0u 50%
Moisture Sensitivity
Net Adsorption
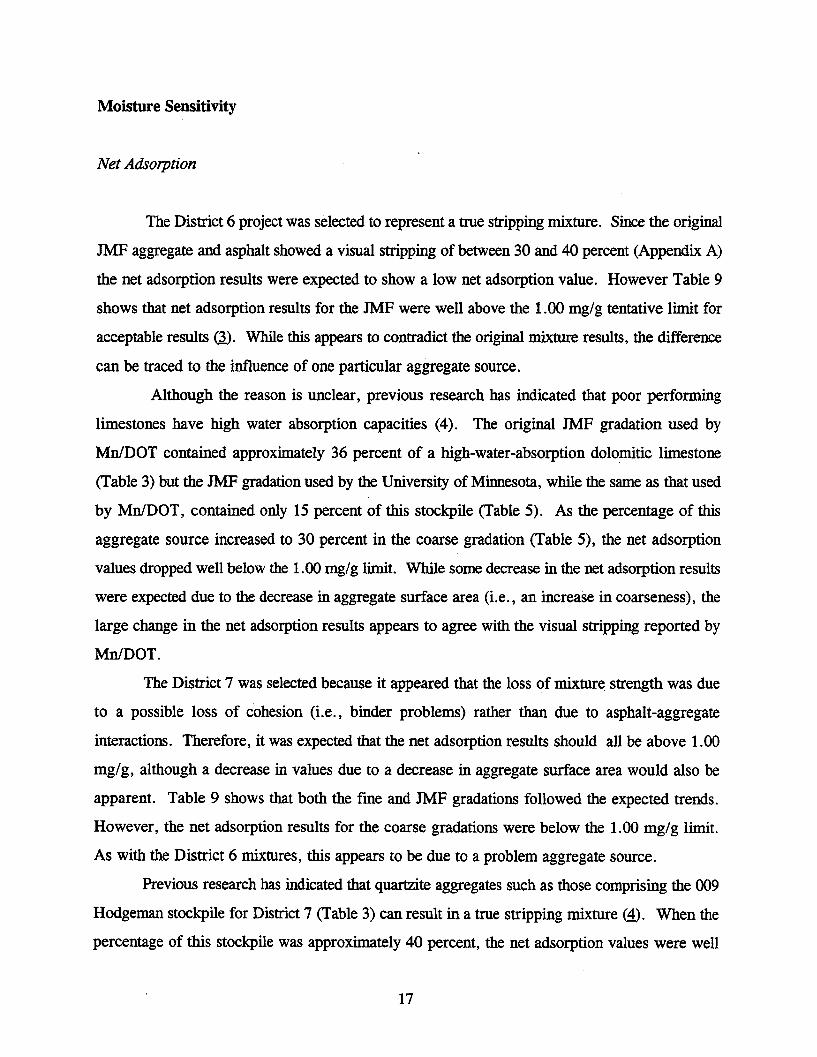
The District 6 project was selected to represent a true stripping mixture. Since the original
JMF aggregate and asphalt showed a visual stripping of between 30 and 40 percent (Appendix A)
the net adsorption results were expected to show a low net adsorption value. However Table 9
shows that net adsorption results for the JMF were well above the 1.00 mg/g tentative limit for
acceptable results (3). While this appears to contradict the original mixture results, the difference
can be traced to the influence of one particular aggregate source.
Although the reason is unclear, previous research has indicated that poor performing
limestones have high water absorption capacities (4). The original JMF gradation used by
Mn/DOT contained approximately 36 percent of a high-water-absorption dolomitic limestone
(Table 3) but the JMF gradation used by the University of Minnesota, while the same as that used
by Mn/DOT, contained only 15 percent of this stockpile (Table 5). As the percentage of this
aggregate source increased to 30 percent in the coarse gradation (Table 5), the net adsorption
values dropped well below the 1.00 mg/g limit. While some decrease in the net adsorption results
were expected due to the decrease in aggregate surface area (i.e., an increase in coarseness), the
large change in the net adsorption results appears to agree with the visual stripping reported by
Mn/DOT.
The District 7 was selected because it appeared that the loss of mixture strength was due
to a possible loss of cohesion (i.e., binder problems) rather than due to asphalt-aggregate
interactions. Therefore, it was expected that the net adsorption results should all be above 1.00
mg/g, although a decrease in values due to a decrease in aggregate surface area would also be
apparent. Table 9 shows that both the fine and JMF gradations followed the expected trends.
However, the net adsorption results for the coarse gradations were below the 1.00 mg/g limit.
As with the District 6 mixtures, this appears to be due to a problem aggregate source.
Previous research has indicated that quartzite aggregates such as those comprising the 009
Hodgeman stockpile for District 7 (Table 3) can result in a true stripping mixture (4). When the
percentage of this stockpile was approximately 40 percent, the net adsorption values were well
17

below the 1.00 mg/g limit. As long as the percentage was less than 30 percent (either the fine or
JMF gradation), the net adsorption results were acceptable. Since the percentage of this stockpile
in the original Mn/DOT mixture testing was only 10 percent, it was not surprising that only
limited visual stripping was reported.
District 8 was selected to represent a low initial mixture strength with little or no
indications of true stripping or loss of cohesion. Therefore, it was anticipated that the net
adsorption results should be acceptable for all aggregate gradations. Table 9 shows that this is
the case. Since there were no known problem aggregate types in this mixture, changes in the
proportions of aggregate sources had little influence on the results. The decrease in the net
adsorption results appears to be only the result of the decrease in aggregate surface area.
Table 9. Net Adsorption Test Results
Figure 4 summarizes the above discussion. The District 8 mixture shows the expected,
generally linear, decrease in net adsorption with a decrease in aggregate surface area. When a
critical percentage of a problem aggregate source was exceeded, then there was a significant drop
in the net adsorption results. The scope of this testing program was not sufficient to estimate
critical percentages of problem aggregates. However, both the net adsorption and Mn/DOT
mixture data suggest that percentages of these types of aggregate sources above 30 percent could
result in substantial moisture sensitivity problems.
18

Net Adsorption vs. Gradation
2
.5
1-
0.5 -
n
Net Adsorption, mg AC/g Agg.
Fine JMF
Air Voids, %
Coarse
Figure 4. Influence of Aggregate Gradation on Net Adsorption Results.
Mixture Testing
Initial Between-Laboratory Comparison of Compacted Mixture Results: To insure that
both the Mn/DOT and U of M laboratories were providing a similar assessment of the selected
projects, the JMF mixtures were prepared at both laboratories. A reduced compactive effort was
used in order to increase the air voids to a level similar to that of typical in-service pavements;
both laboratories used the same reduced number of blows to compact these samples. The
numbers of blows, air voids and tensile strengths after freeze/thaw conditioning obtained by both
laboratories are shown in Table 10.
While the air voids were similar between laboratories, significantly different tensile
strengths were obtained both before and after freeze/thaw conditioning. However, the before and
after conditioning trends are the same, e.g., the order of the initial tensile strength does not
19
-- Dist 6 (7904-36) e Dist 7 (3204-60) * Dist 8 (6407.27)
i 6 II%

change between the two laboratories, and the largest difference for before and after was seen for
the District 7 mix. This could be due to differences in procedures for saturating, freezing, and
thawing the samples. It also could be due to the differences in preparing the aggregate gradations;
these differences were noted in the mix design section.
These results emphasize the need for an assessment of testing variability. Precision
statements are needed in order to identify the differences between real material variability and
testing variability.
Table 10. Comparison of Mn/DOT and U of M Test Results for JMF Samples.(JMF Gradation and Asphalt)
Project Number Mn/DOT U of Mof
Blows' Air Tensile Strength Tensile Air Tensile Strength TensileVoids Unconditioned Strength After Voids Unconditioned Strength
% kPa (psi) Freeze/Thaw % kPa (psi) AfterkPa (psi) Freeze/Thaw
kPa (psi)
District 6 22 7.6 634 (92) 359 (52) 8.6 524 (76) 428 (62)7904-36
District 7 12 8.3 883 (128) 455 (66) 7.6 704 (102) 235 (34)324-60
District 8 13 8.6 421 (61) 421 (61) 6.8 317 (46) 331 (48)6407-27
1: Marshall compaction, bevel head, rotating base.
Film Thickness, Air Voids, and VMA Considerations: Table 11 shows that the air voids for
the fine gradation ranged between 8.2 and 11.2 percent. This was due to the actual asphalt content being
below the optimum for this gradation (Table 7). While the actual asphalt cement content was higher than
the optimum for the coarse gradation, the air voids for these samples were within the desired range of
6 to 8 percent for a reduced compactive effort (Table 8). The differences in the air voids were also
reflected in the VMA. In general, as the air voids increased, so did the VMA.
The asphalt cement content was held constant so that the effect of film thickness could be
evaluated. Table 11 shows that the film thickness was dependent upon the aggregate gradation and
decreased with the increasing fineness of the aggregate gradation. An estimate of the film thickness for
20

each gradation for each project was obtained using an equation presented by Aljassar and Haas (56).
Because of the limited material available for both aggregate tests and mixture preparation, an insufficient
quantity of material below this fraction was available for a hydrometer analysis. Therefore, the surface
area in this case was calculated for the 0.075 mm (No. 200) and above fractions. The results, shown in
Table 11, were as expected: the finer the gradation, the greater the surface area. The asphalt film
thickness was estimated for each mixture based on effective volume of asphalt cement (i.e., total volume
minus absorbed volume), surface area of the aggregate, and weight of aggregate in the sample (6.pg.,
151). As the coarseness of the gradation increased, so did the film thickness.
Table 11. Estimated Aggregate Surface Areas, Film Thicknesses, andVoids in Mixtures Information.
1: The asphalt contents were 6.0, 5.5, and 5.0 for Districts 6, 7, and 8, respectively.No changes were made for different gradations.
21

Modified Lottman (ASTM D4867) Mixture Results: Table 12 shows the average test
results for a set of three samples for each gradation for each district. The air voids for the fine
aggregate gradation tended to be higher than either the JMF or coarse gradations. As discussed
previously, the difference in air voids was most likely due to the less than optimum asphalt content
in the fine aggregate gradations.
Concentrating on the tensile strength results, the original (dry) tensile strengths for a given
district were fairly consistent. Dry tensile strengths ranged from:
* 545 to 593 kPa (79 to 86 psi) for District 6
* 379 to 407 kPa (55 to 59 psi) for District 7
* 351 to 485 kPa (51 to 63 psi) for District 8
While the moisture conditioned (wet) results appear to be somewhat dependent upon the
air voids with higher air voids generally associated with lower strengths, there was also an
apparent dependence on the film thickness. As the film thickness increased, the wet tensile
strengths also increased (Figure 5), except for District 6.
Wet Tensile Strength, kPa500
400
300 -----
200 ---------- __--------2Air Voids > 8%
100
|*'District 6 *eDistrict 7 *-District 8
00 5 10 15 20
Asphalt Cement Film Thickness, microns
Figure 5. Influence of Film Thickness on Conditioned (Wet) Tensile Strengths.
22

Table 12. Moisture Sensitivity of Asphalt Mixtures Preparedwith Koch 120/150 Pen Asphalt.
8.5
20.3
4.2 6.3 8.5 5.8 7.2 11.1 6.55 -I I .I.- i.. .1
17.1 14.8 20.3 18.6 17.3 20.4 22.1- ,iIH I Ii H IIIi
7.6
18.0
irauon, % 5 65 433 53 4 3 6o 7 8I 36
lus, Dry 1,151 1,483 2,110 1248 1,020 1,166 1,393 1,497 1,675MPa (ksi) (167) (215) (306) (181) (148) (169) (202) (217) (243)
ulus, Wet 697 945 1,104 620 1,055 1,166 593 993 1,400MPa (ksi) (101) (137) (160) (90) (53) (169) (86) (144) (203)
us Ratio, % 61 64 52 61 104 100 50 67 84
tgth, Dry 593 524 552 379 386 407 351 315 435kPa (psi) (86) (76) (80) (55) (56) (59) (51) (46) (63)
gh, Wet 366 421 324 207 331 414 193 331 359Pa (psi) (53) (61) (47) (30) (48) (60) (28) (48) (52)
h Ratio, % 62 80 59 62 86 102 55 104 82I 1 1 1 - 11 L 104,
NA:Data not available
While the net adsorption results for the coarse District 6 mixtures suggested an increase
in percentage of high absorption limestone should increase the mixture moisture sensitivity, the
mixture results suggest that an increased film thickness from around 9 /m for the JMF to about
16 um for the coarse gradation offset the potential problems from the increased percentage of the
high absorptive limestone stockpile. Even when the film thickness was decreased below 9 mn and
the air voids increased, as was seen for the fine aggregate gradation, but the percentage of the
high absorption limestone was minimized, the wet tensile strengths were similar to those for the
coarse gradation. This suggests that there is a trade-off of low film thickness and/or high air
voids with good aggregates and an increased film thickness with moderate air voids and a potential
problem aggregate source.
23
-. & - o A&A, ol - A.^ P• ,,•Pf -01,^ p/HI' npy V'r

Similar results were noted for the District 7 mixtures, except that for these mixtures there
was a significant reduction in wet strengths with a reduction in film thickness and higher air voids
(fine gradation). Using the coarse aggregate gradation for this mixture significantly improved the
wet strengths. Again, this suggests that mix design changes which would increase the film
thickness and/or decrease the air voids may offset problems with marginal aggregate sources.
Even though the District 8 aggregate sources were considered to be good sources from an
asphalt-aggregate interaction view point, the wet strengths of this mixture were significantly
reduced by decreasing the film thickness and/or increasing the air voids. This suggests that
without a sufficient film thickness and proper density control, even good materials could have
marginal performance.
Mixture Tensile Strength Requirements: In order to suggest absolute tensile strength
values and percent retained strength limits, expressed as the tensile strength ratio (TSR) for
identifying potentially moisture sensitive mixtures, the work completed at the Mn/DOT laboratory
and included as Appendix A was analyzed. Figures 6 and 7 show both of these values for projects
separated first by maximum size aggregate and then by type of gradation for each maximum size.
For the 12.5 mm (1/2 in) minus gradation (Figure 6) the type 2331 tensile strengths ranged from
365 to 448 kPa (53 to 65 psi), and 324 to 551 kPa (47 to 80 psi) for the type 2341. No specific
trends were evident in this figure. However, for the 19 mm (3/4 in) minus gradation, it appears
that the inclusion of recycled asphalt pavement (RAP) in the mixture increased the tensile strength
of the Type 2342 and 2332 mixtures (Figure 7). All of the RAP mixtures also had tensile strength
ratios above 70 percent and tensile strengths of at least 414 kPa (60 psi).
While there was insufficient data for any given type of mixture, a general estimate of
acceptable tensile strength limits was obtained by combining all variables for each of the type
2331 and 2341 mixtures. The mean and standard deviation for any type 2331 or 2332 mixture
for either top size aggregate, were 512 kPa (74.3 psi) and 98 kPa (14.2 psi), respectively. Using
one standard deviation as an acceptable lower limit below the mean, then any type 2331 or 2332
mixture should have a minimum dry tensile strength value of 414 kPa (60 psi). The mean and
standard deviation for any of the type 2341 or 2342 mixtures were 678 kPa (98.4 psi) and 114 kPa
(16.6 psi), respectively. Based on the above approach, the lowest acceptable dry tensile strength
24

for any type 2341 or 2342 mixture would be 552 kPa (80 psi).
An examination of Figures 6 and 7 show that in most cases, Minnesota mixtures can
exhibit TSR values over 70 percent. However, three out of a total of 15 projects had values
between 50 and 70 percent retained. This range of TSRs may indicate mixtures in need of
remedial action such as a reduction in aggregate surface area (i.e., a coarser aggregate gradation),
a thicker film thickness, and/or lower air voids. TSRs in this range may also indicate a true
stripping problem; the mineralogy and percent of mix of each aggregate stockpile should be
evaluated in an effort to identify any potentially marginal aggregate sources.
1/2" minus
Dry Tensile Strength, kPa Tensile Strength Ratio, %
0 .-- - -------- -^- - --------- - ^
0
* =.
0
---.---------- ._---- ---- ----- --.--- ------- t
*
- ---- --- I-----------------
3508-19 0301-41 2513A
Type 2341
Figure 6. Relationship Between Type of Mix, and Tensile Strengths and Ratios(12.5 mm (1/2 in) minus Gradation)
25
1000
800
600
400
200
0
100
90
80
70
60
50
40
30
20
10
036
47
6407-27 6802-23
Type 2331
7404-06
Type 2342
7904-
Type 23

3/4" minus
Dry Tensile Strength, kPa Tensile Strength Ratio, %0
U
Sa Tensile Strength a TSR
6802-23 0705-14 6407-27
Type 2331
0110-283116-109
Type 2332
3003-19 8605-36
Type 2342
Figure 7. Relationship Between Type of Mix, and Tensile Strengths and Ratios(19 mm (3/4 in) minus Gradation)
26
1000
800
600
400
200
100
90
80
70
60
50
40
30
20
10
0A
05624

CONCLUSIONS
The following conclusions can be drawn from this study:
1. Pavement distresses in Minnesota which have been attributed to moisture can actually
represent one of three mechanisms: 1) true stripping (debonding of the asphalt from the
aggregate), 2) loss of cohesion in the binder, or 3) low initial mixture strength. Suggested
approaches to identify these mechanisms are as follows:
True stripping can be identified by a combination of low retained strengths of the
compacted mixture after moisture conditioning and an obvious percentage of bare
aggregate after a boiling water test (greater than about 30 percent).
Loss of cohesion in the binder can be identified as a substantial loss in retained
strength (TSR of about 60 percent or less) with little or no visual stripping.
Low mixture strength can be identified by values of unconditioned tensile strength
values of less than about 483 kPa (70 psi).
These definitions were based on a limited number of laboratory tests and should be
confirmed through comparisons with field performance and further laboratory testing.
2. The properties of a true stripping mixture can be marginally improved by either an
increased film thickness, lower voids, or using a decreased percentage of a marginal
aggregate source.
3. Mixtures with a low initial strength may be improved somewhat by using a coarser
aggregate gradation. While it is also possible to increase the initial mixture strength with
a stiffer grade of asphalt, care needs to be taken so that other problems such as thermal
cracking are not generated as a result of improving the strength by using a stiffer binder.
27
4. Aggregate characteristics that appear to promote moisture damage problems includes high
absorptive (> 2 percent water absorption capacity) dolomitic limestone and quartzite.
5. The finer aggregate gradation appeared to minimize any differences in temperature
susceptibility due to changes in aggregate source or properties at or below 250C (770 F).
28
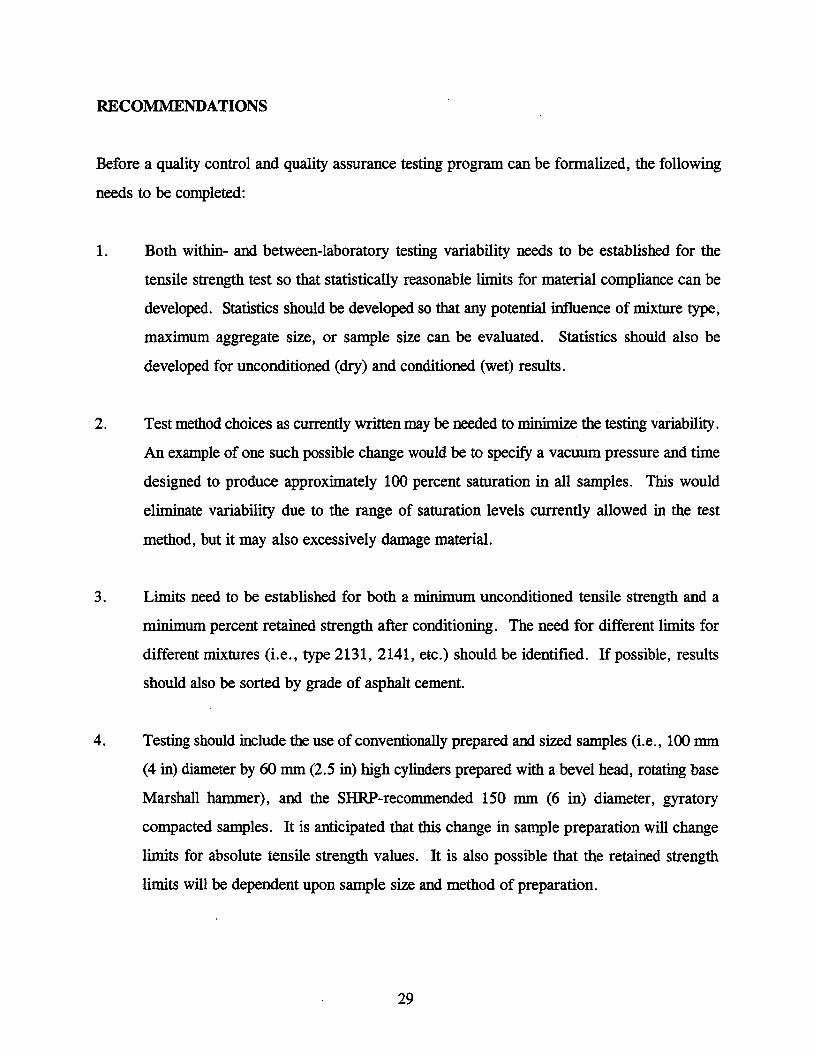
RECOMMENDATIONS
Before a quality control and quality assurance testing program can be formalized, the following
needs to be completed:
1. Both within- and between-laboratory testing variability needs to be established for the
tensile strength test so that statistically reasonable limits for material compliance can be
developed. Statistics should be developed so that any potential influence of mixture type,
maximum aggregate size, or sample size can be evaluated. Statistics should also be
developed for unconditioned (dry) and conditioned (wet) results.
2. Test method choices as currently written may be needed to minimize the testing variability.
An example of one such possible change would be to specify a vacuum pressure and time
designed to produce approximately 100 percent saturation in all samples. This would
eliminate variability due to the range of saturation levels currently allowed in the test
method, but it may also excessively damage material.
3. Limits need to be established for both a minimum unconditioned tensile strength and a
minimum percent retained strength after conditioning. The need for different limits for
different mixtures (i.e., type 2131, 2141, etc.) should be identified. If possible, results
should also be sorted by grade of asphalt cement.
4. Testing should include the use of conventionally prepared and sized samples (i.e., 100 mm
(4 in) diameter by 60 mm (2.5 in) high cylinders prepared with a bevel head, rotating base
Marshall hammer), and the SHRP-recommended 150 mm (6 in) diameter, gyratory
compacted samples. It is anticipated that this change in sample preparation will change
limits for absolute tensile strength values. It is also possible that the retained strength
limits will be dependent upon sample size and method of preparation.
29

5. Once a precision statement has been developed for moisture sensitivity testing, this test
(ASTM D4867) should be included in mix design testing. If true stripping is suspected
as a potential problem, the boiling water test should also be conducted as a subjective way
to confirm this as a source of potential problems.
6. Previous work has attempted to develop a precision statement for the boiling water test but
it was indicated that the results were too subjective. This test should be used only as an
indicator and not in any form as a quality control or acceptance test.
7. Because the inclusion of RAP in the mixture appears to improve both the tensile strength
of the mixtures as well as the retained strengths, a separate study should be designed to
investigate RAP mixtures more thoroughly. Topics of investigation should include control
of RAP variables such as binder content and aggregate gradation, optimum percentage
added to the mixture, and influence of mixture type on results.
8. Links between laboratory-determined values and field performance should be established.
9. Further research testing (i.e., the net adsorption) should be continued as a means of
identifying aggregate mineralogy with a tendency for producing moisture sensitive
mixtures.
30

BIBLIOGRAPHY
1. Association for Testing and Materials Annual Book of Standards, Road and Paving
Materials: Pavement Management Techniques. Vol. 04.03, 1994.
2. Tunnicliff, D.G., Root, R.E., "Use of Anti-Stripping Additives in Asphaltic Concrete
Mixtures," NCHRP Report 274, Transportation Research Board, 1984.
3. Stroup-Gardiner, M., Newcomb, D., "Physio-Chemical Evaluation of Asphalt-Aggregate
Interactions," Minnesota Department of Transportation Report Mn/RC-94/12, June 1994.
4. Curtis, C.W., Ensley, K., Epps, J., "Fundamental Properties of Asphalt-Aggregate
Interactions Including Adhesion and Absorption," Strategic Highway Research Program,
Report SHRP-A-341, December, 1993.
5. Aljassar. A., Haas, R., "Towards Automating Size-Gradient Analysis," Transportation
Research Board Preprint No. 940680, Annual Meeting in Washington, D.C., 1994
6. Roberts, R.L., Kandhal, P.S., Brown, E.R., Lee, D., Kennedy, T.W., Hot Mix Asphalt
Materials. Mixture. Design and Construction. NAPA Education Foundation, Lanham,
Maryland, 1991.
31


APPENDIX A
ASPHALT MIXTURE DURABILITY STUDY 9PRS 1016Prepared by Dan Wegman, P.E. for Mn/DOT
June, 1995


ASPHALT MIXTURE DURABILITY STUDY 9PRS 1016DAN WEGMAN P.E.
Abstract: The use of hot mix asphalt pavements represents a major investment in highways by
the people of Minnesota each year. The performance of these pavements is a function of the
design and construction of each project. Minnesota's Quality Management Program has been a
key factor in significant improvements in the performance of asphalt pavements in Minnesota,
especially in the elimination of rutting. However, a few projects still experience problems
associated with long term durability such as premature cracking, stripping and in some cases
ravelling of the pavement. Moisture sensitivity, density and absorptive aggregates were suspected
as primary factors contributing to these conditions. In order to qualify these suspicions a study
was initiated to look at asphalt mixes statewide on a mix design and production basis. This study
emphasizes moisture sensitivity (stripping), absorption and voids in the mineral aggregate
(VMA). In addition, in-place pavement voids were determined and will be tracked over time to
provide correlations to actual pavement performance.
Premature failure or poor performance of asphalt pavements may be attributed to many
factors relating to mixture design, production and placement. Factors in each of these areas or
combinations thereof may significantly contribute to long term pavement performance. Factors
specific to each area may create detrimental conditions which can adversely impact another area
thus magnifying the chance for premature failure. For instance, a dry mixture with inadequate
VMA is more difficult to compact thus increasing the potential for high in-place voids. With
this in mind, this study was initiated with a major objective of determining how quality mixture
production can be obtained for all extremes of materials used to produce asphalt mixtures
throughout the state. The main areas of concentration being moisture sensitivity, absorption and
VMA.
Dick Root of Chicago Testing Laboratory, Inc. was hired as a consultant to provide his
expertise, establish a sampling/ testing plan and assure valid laboratory testing.
A-1

SAMPLING AND TESTING PLAN
A copy of the sampling and testing plan is provided at the end of this appendix. Sample sites
were set up so each outstate District would have 2 or 3 (1993) projects included in the study.
Criteria for project selection was to include projects supplied from marginal performing
aggregate sources if possible. However, the construction program was small, so projects for the
most part were selected on a basis of what was being constructed at the time the study was
initiated. The study includes virgin and recycle mixes used for level, binder and wearing
courses. Course designations are distinguished by two numbers (mix type) followed by three
letters (first letter denotes max. agg. size; A= 1/2 minus, B=3/4 minus and last two letters
denote course; WE= Wear, BI= Binder, LV= Level. Three mix types were used in the study:
Type 31 is a low volume, low crush mixture; Type 41 is a medium volume and crush mixture
and Type 47 is a high volume and crush mixture. Type 32, 42 and 48 are the same classification
but have recycled asphalt pavement (RAP) material in them. Aggregate samples were taken
from the aggregate feed belts wherever possible otherwise samples were taken from the
contractors stockpiles. Asphalt samples were taken from the contractors storage tank and Hot
Mix Asphalt (HMA) samples were taken from behind the paver. All samples were transported
to the Mn/DOT central laboratory for testing.
LABORATORY AND FIELD TESTING
It was decided to perform all laboratory testing within the Mn/DOT central laboratory so inter-
laboratory testing discrepancies would not be introduced. Testing performed included the
Modified Lottman (ASTM D4867), aggregate specific gravities (AASHTO T84, T85) and
asphalt absorption (determined by the rice method). VMA values were also calculated for all
mixtures.
Volumetric field testing was conducted on each project in accordance with Mn/DOT's
quality assurance specification. contractor quality control tests include voids and gradations run
on a one per thousand ton basis with minimum asphalt content assured at start up and maintained
A-2
during production by plant settings. State quality assurance tests are run at an approximate rate
of one per four contractor tests. Contractors tests are used for acceptance provided they are
verified by State test results.
Results from the laboratory test are shown in Table 1. Both the contractor and Mn/DOT
test results are shown in Figures A-1 through A-18.
STUDY OBJECTIVES
One objective of this study is to evaluate Mn/DOT's Quality Assurance Specification in terms
of its ability to assure good mixture durability in relation to moisture sensitivity, asphalt
absorption and VMA. These parameters have been identified as crucial to mix durability in the
Superpave System developed by SHRP. Another objective is to determine the need for measuring
these parameters during mixture production in addition to the determinations made in the
standard mix design process. The primary objective is to evaluate existing conditions to
determine future needs for the transition to the Superpave System.
MOISTURE SENSITIVITY
In the past, Mn/DOT used a cold water abrasion test to screen mixes for potential moisture
sensitivity. In 1985 this test was discontinued on trial mixes due to its insensitivity to mixture
performance. Mn/DOT currently does not have a specification related to moisture damage and
identification of moisture sensitive mixtures is not part of the existing mix design procedure. For
this study the modified Lottman test method (ASTM D4867) was chosen to measure the loss of
mixture strength due to cohesive and/or adhesive problems.
Many states using this test method in their specifications require a minimum tensile
strength ratio (TSR - a measure of the retained tensile strength after conditioning) of 70 percent.
In this study, of the 18 mixtures tested, 13 exceeded this requirement after wet conditioning and
10 mixtures exceeded the requirement after freeze/thaw conditioning. Mixtures failing 70
A-3

percent TSR were predominantly located in the southern part of the state (Districts 6, 7 and 8)
where marginal quality aggregates (in terms of absorption, durability and soundness) are
frequently encountered.
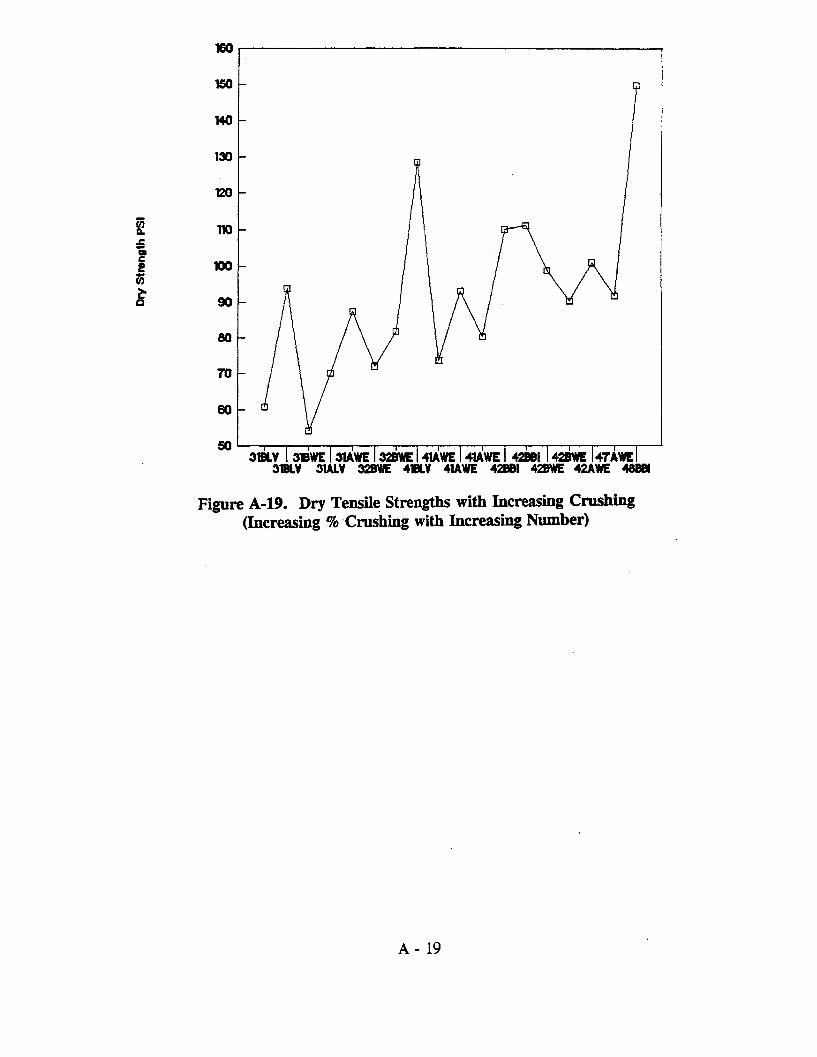
Dry strengths exhibited a very wide range from 54 to 149 psi with the values showing
a correlation to the amount of crushing in the mixtures (Figure A-19).
ASPHALT ABSORPTION
Asphalt absorption was suspected as a contributor to mix durability problems and thus was
included as a research parameter. Work done by Kandhal and Khatri showed that asphalt
absorption is time dependent (Fig. A-20) and can be a factor which leads to premature failure
of asphalt paving mixtures.
Mn/DOT's standard procedure for laboratory mixed material is to cure (age) the mixture
in the oven at 143*C (290*F) for 45 minutes. Kandhal's recommendation is to age the mixture
for 4 hours in order to more accurately account for asphalt absorption. For this study cure times
of 3/4, 2, and 4 hours were performed to determine asphalt absorption over time and assess its
significance to mix durability. Results were somewhat surprising in that asphalt absorption over
time did not appear to be as big a factor as anticipated. In comparing the difference in asphalt
absorption between the 3/4 and 4 hour cure times most mixtures were under 0.2 percent with
the largest difference being 0.35 percent absorption. A greater concern is that absorptions based
on 4 hour aging ranged from 0.28 to 1.94 percent. This wide range questions whether VMA
is being adequately accounted for on a project and program basis in Minnesota.
VOIDS IN THE MINERAL AGGREGATE (VMA)
Many factors can have an effect on the VMA content of a mix. Aggregate gradation, shape and
surface texture are all important properties. In addition, the properties of the fine aggregate
generally have a greater effect on the VMA content of a mix than do the properties of the coarse
A-4

aggregate. Virtually all asphalt mixtures placed in Minnesota are on the fine side of the
maximum density line when plotted on the .45 power chart (Figures A-21 and A-22). Mn/DOT
also assures adequate VMA by specifying a minimum asphalt content for all mixtures. This
approach is based on the assumption that the specific gravity of aggregates are relatively uniform
throughout the state and that broad band gradation requirements coupled with minimum asphalt
contents will provide adequate VMA (Figure A-23).
For economical purposes contractors typically design mixtures as close to the maximum
density line as possible with minimum asphalt content and gradations in compliance. During
production a "VMA collapse" is often encountered forcing the contractor to make adjustments
to his gradations to raise voids. VMA cannot easily be checked after these adjustments because
aggregate specific gravities are not usually determined in the mix design process. In submitting
his mix designs, the contractor is given the option of determining his aggregate specific gravities
(AASHTO T84 and T85) or using an assumed 1 percent asphalt absorption to calculate the bulk
specific gravity of the aggregate. In virtually all cases the contractor elects to use the 1 percent
absorption option. Mixtures with aggregates having an excess of 1 percent absorption and
designed at or near minimum asphalt levels can have inadequate VMA in conjunction with
insufficient asphalt film thickness on the aggregate thus creating potential durability problems.
Mixtures with aggregates having less than 1 percent adsorption and designed at or near minimum
asphalt levels may require gradation adjustments upon start up to maintain the required 3-5
percent mixture air voids. The degree of aggregate absorption divergence from the assumed 1
percent and the changes in aggregate shape upon going through the plant are both potential
factors in the mixture having inadequate VMA.
Asphalt absorption over time can also present a challenge when trying to duplicate
mixture design properties in the field. The most obvious case being when an asphalt mixture is
insufficiently aged in the mix design to account for a substantial portion of the absorption that
ultimately takes place in the field. This situation creates the potential for poor mixture durability
due to inadequate effective asphalt in the mix.
For the projects in this study, the mix design data shows in most cases the VMA
calculated using the 1 percent absorption assumption is higher than the VMA calculated using
aggregate specific gravities determined via AASHTO T84 and T85. In many cases the VMA
A-5

calculated via T84 and T85 does not meet Asphalt Institute or Mn/DOT criteria. It is also
interesting to note that the lowest VMA calculated by T84 and T85 corresponds to a very low
TSR even though the asphalt absorptions for this mixture are very low (see SP 4705-34).
The design process is not complete until the mixture is produced through the mixing
facility and the design parameters are verified in the field. In light of the "VMA collapse"
typically encountered with plant produced material this study went ahead and tracked VMA
along with voids on a production basis. Voids were calculated on mix samples taken behind the
paver as required on all Mn/DOT quality assurance projects. VMA was recalculated from the
T84 & T85 aggregate specific gravity values whenever a change in the mixture took place. The
charts with this plotted data also show a line denoting minimum VMA values based on the
Asphalt Institute and Mn/DOT criteria. In most cases VMA criteria is not maintained throughout
the project and in some cases never met at all.
CONCLUSIONS
1. Moisture sensitivity, absorption and inadequate VMA can all be factors in poor pavement
durability. It appears that moisture sensitivity on a regional level and inadequate VMA
on a statewide level are the most prominent factors in Minnesota.
2. Factors not included in this study may also play a prominent role in circumstances of
poor pavement durability. Pavement density (in place voids) and Fines to Asphalt (F/A)
ratio are two factors that warrant particular attention.
3. The freeze/thaw (iced) conditioning performed in the modified Lottman testing does not
appear to be necessary in detecting moisture sensitive mixtures based on this data.
However, this observation is contradicted in research performed by others. (See
reference 4.)
4. The subjective visual stripping observations conducted by Mn/DOT's Senior Central Lab
A-6
Technician did not correlate well with measured TSR values.
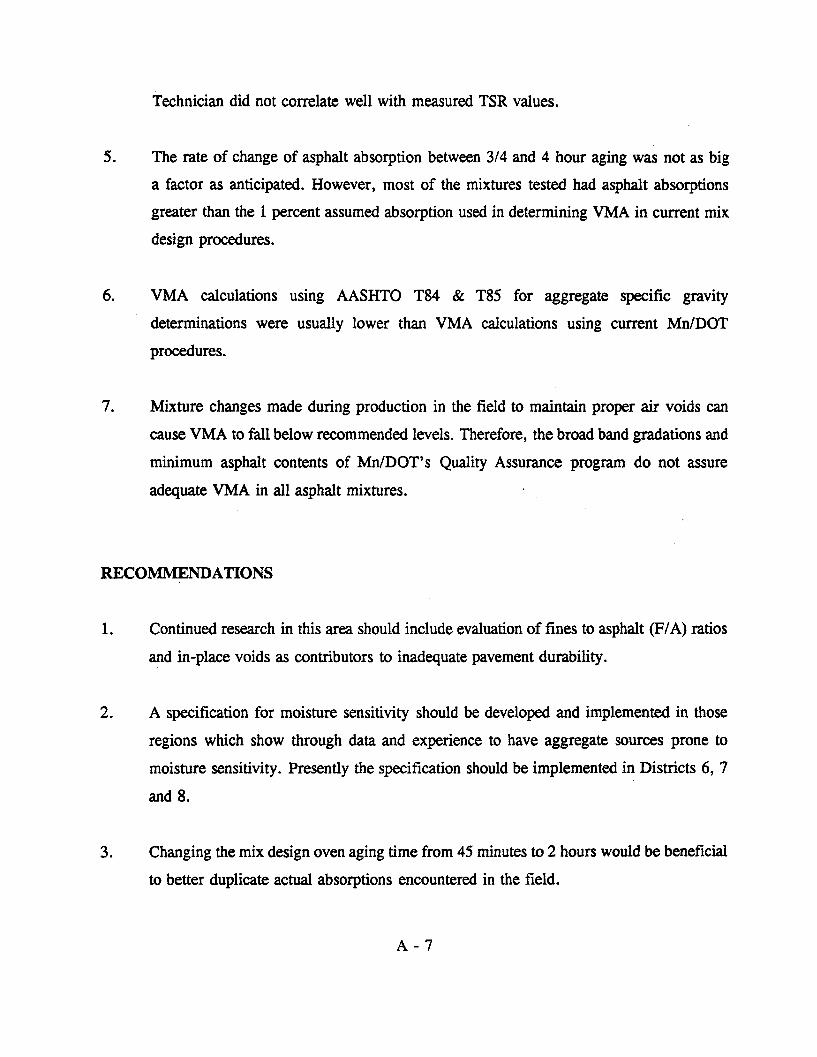
5. The rate of change of asphalt absorption between 3/4 and 4 hour aging was not as big
a factor as anticipated. However, most of the mixtures tested had asphalt absorptions
greater than the 1 percent assumed absorption used in determining VMA in current mix
design procedures.
6. VMA calculations using AASHTO T84 & T85 for aggregate specific gravity
determinations were usually lower than VMA calculations using current Mn/DOT
procedures.
7. Mixture changes made during production in the field to maintain proper air voids can
cause VMA to fall below recommended levels. Therefore, the broad band gradations and
minimum asphalt contents of Mn/DOT's Quality Assurance program do not assure
adequate VMA in all asphalt mixtures.
RECOMMENDATIONS
1. Continued research in this area should include evaluation of fines to asphalt (F/A) ratios
and in-place voids as contributors to inadequate pavement durability.
2. A specification for moisture sensitivity should be developed and implemented in those
regions which show through data and experience to have aggregate sources prone to
moisture sensitivity. Presently the specification should be implemented in Districts 6, 7
and 8.
3. Changing the mix design oven aging time from 45 minutes to 2 hours would be beneficial
to better duplicate actual absorptions encountered in the field.
A-7

4. A better means of assuring adequate VMA in both mix design and during production is
essential. This should be developed and implemented as soon as possible.
5. All mix durability factors identified in this study are addressed in the Level One
Superpave System being promoted by the FHWA. Implementation of the Level One
Superpave System once the equipment and expertise is obtained is recommended.
REFERENCES
1. "Evaluation of Asphalt Absorption by Mineral Aggregates," Prithvi S. Kandhal and
Maqbool A. Khatri, National Center for Asphalt Technology, Auburn, Alabama 1991.
2. "Hot-Mix Asphalt Paving Handbook," AASHTO/NAPA, James A. Scherocman
(Consultant), July, 1991.
3. "The Effects of Testing and Production Procedures on Mix Design Results," National
Asphalt Pavement Association, Richard E. Root (Consultant), IS 112, 1991
4. "Changes in Asphalt Concrete Durability Resulting from Exposure to Multiple Cycles
of Freezing and Thawing," ASTM, Gilmore, Darland, Girdler, Wilson and Scherocman;
1985.
A-8

o
"e
0=3
-"
S00 a 0 % A; C -< o W t ?
Ai
A-9
-8 A 8 * g g " , , , R , , A
--, 0, 0 Q o Q 4 0 ---, --, ? - c € c -- -.
v 00 o o o -o . , o , o o N - 0 O
" 00 ,,s-, m ; ,,,,p, -;I.
i I C ! i i i el:^ ^
f,.:• -, 4.
0 Q O 000 O C--0^C- O OCO-0
v v
.. -@09c S i .3 O -
. ~00 , ,C 4 C 0 0 0 0 0 %4% P-0
X 0( 0 C- I0
-J
1> I-0O O 0
-C CC3 nu, riu~o asoo )
OICO()~ IQ~ ~ - N j - i N i C-
Ucrrb \

0 VMA
+ Test Void o Moving Avg Vold State VMA
Figure A-1. District 1, Project 0110-28, 32B Wear.
- _
i 3" I 5 1 7 I 1 I i I2 4 6 8 10 12 14 16
o VMA+ Tet Vold Moving Avg Void State VMA
Figure A-2. District 1, Project 3116-109, 32B Wear.
A-10
IT
15
141312111098
6
54
321
16
15
14
1
12
1
10
9
8
7
6
5
4
39»
vop
ao
As

4I
1 I2
3 14
s IDl
102 I103
104 I 10s105
o VMA+ Test Void o Moving Avg Void a State VMA
Figure A-4. District 2, Project 6802-23, 31B Wear.
A- 11
If
15
14
1312
11
10
98
67
54
321
Ilop .
ID
15
14
13
12
11
10
9
8
7
5
4
-I-- I I
-- a~
1 1 l s r Is li n 1 is l 1719 212 4 6 8 10 12 14 18 18 20
o VMA
+ Test Void Moving Avg Void A State VMA
Figure A-3. District 2, Project 3508-19, 41A Wear.
-.
-L
-~Z ,~-7-~
I
ILM
%P -

No Data Available
Figure A-5. District 2, Project 6802-2.3, 31A Leveling.
1 I 9 1 1 1 503 I 507 I 203 207 2113 7 11 501 505 201 205 209
0 VMA
+ Test Void Movig AvgVoid a State VMAFigure A-6. District 3, Project 3003-19, 42B Wear.
A-12
i I I ' I'
AA
D
1514
13121
10
98
654321n
I
%V I I I I I I I

15
14
13
12
n11
9
8
7
6
5
4
3
2
1
1 3 5 1 7 1 I I2 4 8 10 12
13 I14
15
0 VMA
+ 'st' o Moving Avg Void A State VMA
Figure A-8. District 3, Project 8605-36, 42B, Binder.
A-13
A
1 3 I 5 I I 9 I 11 I I 1 I 101 103 12 4 6 8 10 12 14 16 102 104
0 VMA
+ Test Vod Moving Avg Void State VMA
Figure A-7. District 3, Project 3003-19, 42B, Binder.16
15
14
13
12
11
10
9
8
7
6
5
4
3
2
~L
hh
I I I

If
s15
14
13
12
11
a 10lo79T
6
5
4
3I
2 4 8
0 VMA
+ Test Vod o Movig Avg Void a State VMA
Figure A-9. District 4, Project 0301-41, 41A Wear.17IT
is- I141312
T-11 -
S10-
E g9-
T -
A
1 I 3 l s I n l "I s . Wl"'B2 4 6 8 10 12 14 1 16
0 VMA
+ Test Void Movig Avg Vold a State VMA
Figure A-10. District 4, Project 5625A, 42B Wear.
A-14
A
A
LA
SF

14
13
12
.T
8
7
6
5
4
3
2
1112
10
a 9
=, 8
6
5
4
3
2
i l 3 , 1 9 l 32 4 6 8 0 12
0 VMA
+ Tst Vold Moving Avg Vold A State VMA
Figure A-11. District 6, Project 2513A, 41A Wear.
505 S0 509 516 511 520 522 524 528 528 530 532506 508 515 517 519 521 523 525 527 529 531
0 VMA
+ TestVold o MovigAvgVold a State VMA
Figure A-12. District 6, Project 7404-06, 42A Wear.
A-15
4
1
r
i
ir
!
~--"~
Ah0~4~~ b~ A
· I
-
-
h
- -
17
15
14
13
12
1110
9
8785
4
32
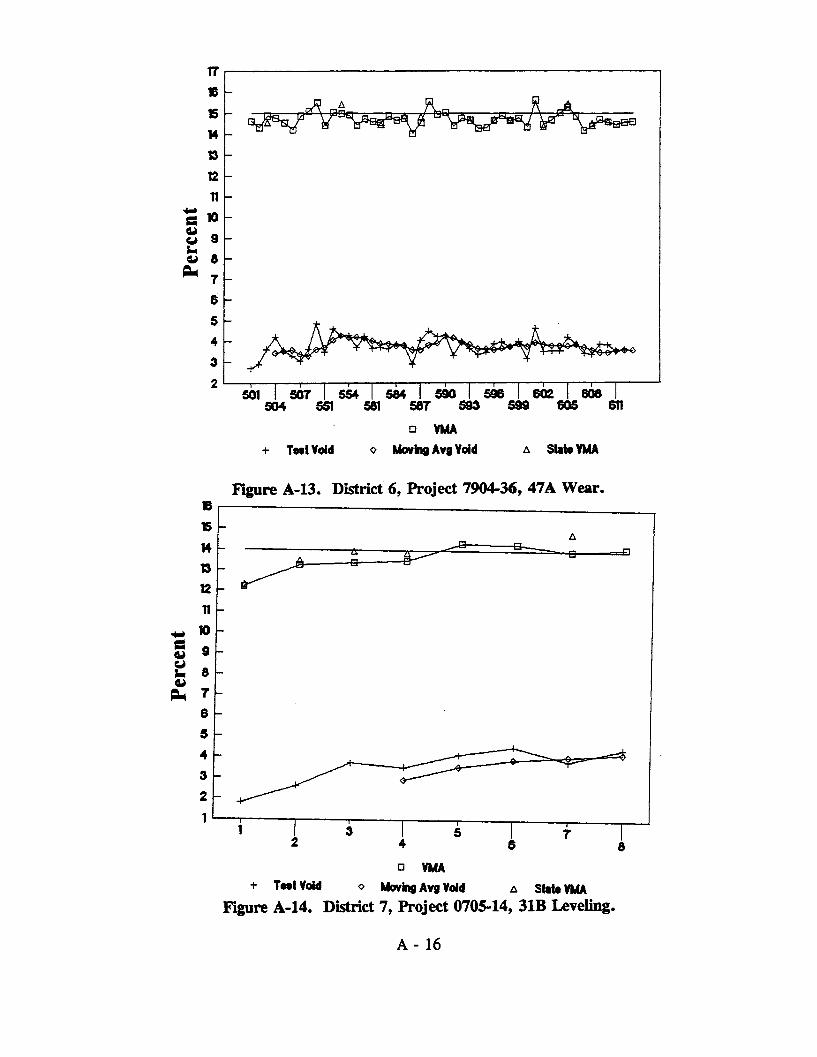
S Moving Avg Void SState VMA
Figure A-13. District 6, Project 7904-36, 47A Wear.
0 VMA+ Test Vold o Movhg Avg Void A State VMA
Figure A-14. District 7, Project 0705-14, 31B Leveling.
A- 16
501 507 54 l 4 i 4 590 598 8 602 1 608 i1504 561 581 587 593 599 605 611
0 VMA
+ Test Void
10
15
14
13
12
1110
9
8
7
8
6
4
3
2
1
QUarsI A"Y^SS"^ RZ 0" ^qB s
-
dm

17
is15
141312
11
10987
5432
1
i I 3 I 5 7 I 9 I2 4 8 10
o VMA
+ Test Void o Movng Avg Void A State VMA
Figure A-16. District 8, Project 4705-34, 48B, Binder.
A- 17
0~
1 7 1 106 1 I i I 4 1130 1i4 103 109 115 121 127 133
o VMA
+ Test Void Moving Avg Void A State VMA
Figure A-15. District 7, Project 3204-60, 41B, Leveling.
- -C
15
14
13
12
11
10
9
8
7
6
5
4
3
2

14
13
12
11
10
4
3
I. 7
I-_"&~~/"_cy4-P~p
L
I~
P~?-~=S~i 1 -r101 I rT I 13
104 11
o VMA
+ -est Void Movig Avg Void a State VMA
Figure A-17. District 8, Project 6407-27, 31B, Leveling.1B
|aL -
1 7 13 19 25 31 13434 10 16 22 28 34 40
a VMA
+ Tet Vold Moving Avg Vold State VMA
Figure A-18. District 8, Project 6407-27, 31A, Wear.
A-18
II -
SX10 -
g 9-
L 6-4)
( A -
fi
le
14 -
13 -
12 -
S
s2
150
140
130
120
2100
= 90
80
70
60
so31BLV I 3aWE I 31AWEI 32BWE I 41AWE I 41AWE I 42BI1 142W 147TAWEI
31BLV 31ALV 32BWE 41BLV 41AWE 42BBI 428WE 42AWE 488B
Figure A-19. Dry Tensile Strengths with Increasing Crushing(Increasing % Crushing with Increasing Number)
A- 19
I
I
7 1 1 · · r 7 1 I I

elB6eJ66BV 'M % 'uo!odJosqv
Cu 0
SioSc u
-c
- o- "
CL
E0
0 ) £
U-
III.. Q.0 S e
Cu
o - i(c
£»<~
"!5aQ. i
1^
0>
A -20

aaNISSlVd 1N303 oG
1111 11111 llll lllllil «
pp
** * *. * * 8 I I I i.O , d... . *....^ff ̂ i? ... s
-a
0* c
-w
a
-4:
uj rC- U 8
- I- 0 5
=- a
tz
A-21
z12ag
I-<Ow
ul
CS
us
03
. -
8 8 8 8 8 8 8ONISS2d iM30H3d
5112~
~fic~
RO
0
rilllllllltZlllfllll1~1111111111111

DRISSlld &M3 UAS sa S 2
IZt . 04 all
CIO to
IESIN
so
cca 4"
re ·qI oil IN 4
NU I
iI(11
st S S g gwVM 91IMM L"CM64I wqLO)qA
Q
0
83 0
coSCu
ra
0o
2
06
C!0
OwIE izum
A - 22
LI
Jill#Aora I-JUL

>1%
ACTUAL
AGGREGATE =1%
ABSORPTION
<1%
VMA BELOW MINIMUMVOIDS AT DESIGN
VMA I AGG. VOLUME
VMA AT MINIMUMVOIDS AT DESIGN
VMA I AGG. VOLUME
VMA ABOVE MINIMUM
VMA ABOVE MINIMUMVOIDS AT DESIGN
Best
SAGG. VOLUME
NO
VMA FAR BELOW MINIMUMVOIDS BELOW DESIGN
Worst
VMA AGO. VOLUME
VMA BELOW MINIMUMVOIDS BELOW DESIGN
VMA I AGG. VOLUME
VMA IN QUESTIONVOIDS BELOW DESIGN
VMA AGG. VOLUME
YES
"VMA COLLAPSE"(AGGREGATE SHAPE/SIZE CHANGES THROUGH PLANT)
AIR FREE ABSVOID
KI VMA | AGGREGATE I
A -23
Ir
-
I