Embed Size (px)
Citation preview

HIGH REYNOLDS NUMB.. (U) AIR FORCE INST OF TECH
D-R5NLRSSFID URIGHT-PATTERSON AFB OH SCHOOL OF ENGI.. 6 P HOE
u NC A S F E DEC 84 RFIT/GRE/R /94D-i9 F/G 2 /4 L
mhEmohhohEohhhEmhmhhhohEEmhhEmEmmhhhhhEEEEEIEhhhohEEEmhshEmEEEEEEEEEEEEEmEEEEmhhhmhEEI

1 -8L.215
Lw
11lI1 11-___ 1.8
MICROCOPY RESOLUTION TEST CHART
NATIONAL BUREAU OF STANDARDS-I63 A
I..
..................................................................................................................... ."° °." . ". . . . . °--.'.- I°.
REPR600CFD AT GOVERNMENT EXMt#E"
ThLEC FSRAEROGNS NCMRSOBLDSA IG ENLS UBRI
TW-IE0INL ACD
THSI
GayProBS
(3 ~ ~ ~ WDIMENStFIONA SAETAMR2
AIRtUNIVERSTYF
AIRFOCEINSITTEOF ECNOOG
Wrigt-Ptteron ir orc Basmie hi
85 03 13 096-- - - -- - -~~~ . - ....... , . - vmqw _________________________________
AFIrP/tAE/AA/84D-1 9
INFLUENCE OF SURFACE ROUJGHNESS ON COMPRESSORBLADES AT HIGH REYNOLDS NUMBER IN A
TWO-DIMENSIONAL CASCADE
THESIS
Gary P. Moe, B.S.Captain, UJSAF
AFIT/GAE/AA/84D-i 9 C
D Approved for public release; distribution unlimited

a- -W. 4 -
AFIT/GAE/AA/84D-1 9
- - INFLJENCE OF SURFACE ROUGHNESS ON COMPRESSOR
BLADES AT H-IGH REYNOLDS NUMBER IN A
TWO-DIMENSIONAL CASCADE
THESIS
Presented to the Faculty of the School of Engineering
of the Air Force Instituite of Technology
Air University
In Partial Fulfillment of the-
Requirements for the Degree of
Master of Science in Aeronautical Engineering
Gary P. Moe, B.S.
Captain, USAF
December 1984
Approved for public release; distribution unlimited
,. °°.- °.
U. . .. . . . . . . . . . . . . . . . .
* . . •- . .
* -l .- - -.- .--..-----.-.--.- - -
Acknowledgments
I appreciate t s opportunity to express my thanks to the many
people whose contributions were invaluable in completing this project.
-I thank D1r. Milton Franke and Capt. Wesley Cox, my committee members,
for their insight and suggestions regarding this work.
I am especially grateful for guidance given me by my principal
thesis advisor, Dr. William C. Elrod. My thanks also go to Lt.
Frederick Tanis Jr. who, though no longer a student at AFIT, gave of his
time to help me become acquainted with the Cascade Test Facility.
This work could not have been accomplished without the excellent
support of the men of the fabrication shop and the laboratory
technicians; especially John Brohas, who in five days completed a job
that would normally take three times as long, and Harley Linville, who
was always willing to help the students.
Finally, I give my heartfelt thanks to my wife, Phyllis, for her
encouragement throughout my schooling and her many hours spent typing
this report.
Accessicfl For.~A .
OTIC .. .
INSPECTED - -
a L tv Codes
va .d/or"
• .- _ ctal
_C la,
• "7-
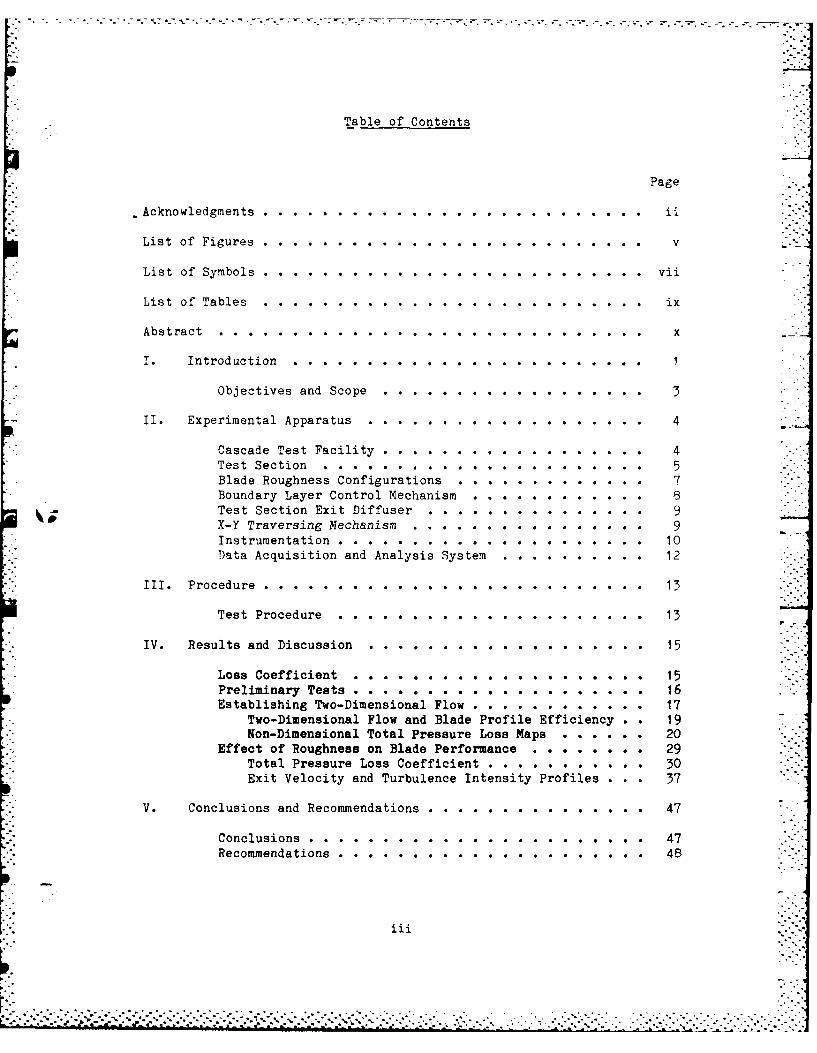
Table of Contents
Page
Acknowledgmnents. .. ................... .. .. ..
List of Figures. .. ......................... v
List of Symbols. .. ........................ vii
List of Tables. ........................... ix
Abstract .. ............................. x
I. Introduction................... . . ... . .. .. .. .. .. ....
Objectives and Scope .. .................. 3
II. Experimental Apparatus .. ................... 4
Cascade Test Facility . .. .. .. .. .. .. .. .. .. 4Test Section.........................5Blade Roughness Configurations................7Boundary Layer Control Mechanism .. ............ 8Test Section Exit Diffuser .. ............... 9X-Y Traversing Mechanism .. ................ 9Instrumentation .. ..................... 10Data Acquisition and Analysis System .. .......... 12
I II. Procedure . .. .. .. .. .. .. .. .. .. .. .. .. .. 13
Test Procedure . . . . . .. .. .. .. .. .. .. . .13
IV. Results and Discussion. ................... 15
Loss Coefficient . . . . . . . . . . . .. .. .. .. 15Preliminary Tests . . . . . . . . . . . . . . . ... . 16Establishing Two-Dimensional Flow . * . . . . 17
Two-Dimensional Flow and Blade Profile*Efficiency . 19Non-Dimensional Total Pressure Loss Maps . . . . 20
Effect of Roughness on Blade Performance . . . . . . . . 29Total Pressure Loss Coefficient . . . . . . .. .. .. 30Exit Velocity and Turbulence Intensity Profiles . . . 37
V. Conclusions and Recommendations . .. .. .. .. .. .. . .47
Conclusions. .. .................. . . . 47
Recommendations .. ..................... 48

Appendix A: Roughness Definitions. ................. 49
Appendix B: Development of Adiabatic Efficiency of the Cascade .. 50
Appendix C: Non-Dimensional Total Pressure Loss Data
Ifor NACA 65-A506 Airfoils .............. 57
Appendix P: Velocity and Turbulence Intensity Profiles.... . . . ....
Bibliography ...........................
Vita . . . . . . . . . . . . . . . . . . . . . . . . . . . . . . .
iv

- 3
List of Figures
Page
Figure
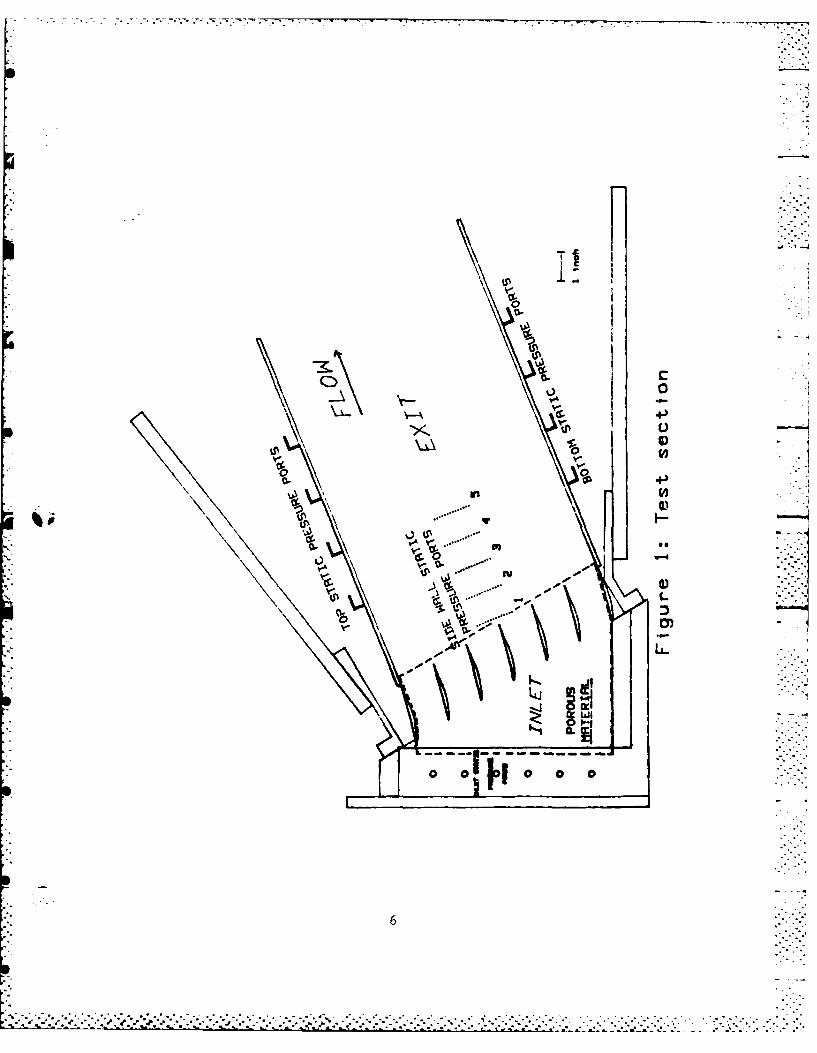
1. Test Section ............ ......................... 6
2. Test Blade Profiles .......... ..................... 8
3. Hot Film Probe Calibration Curves .............. 11
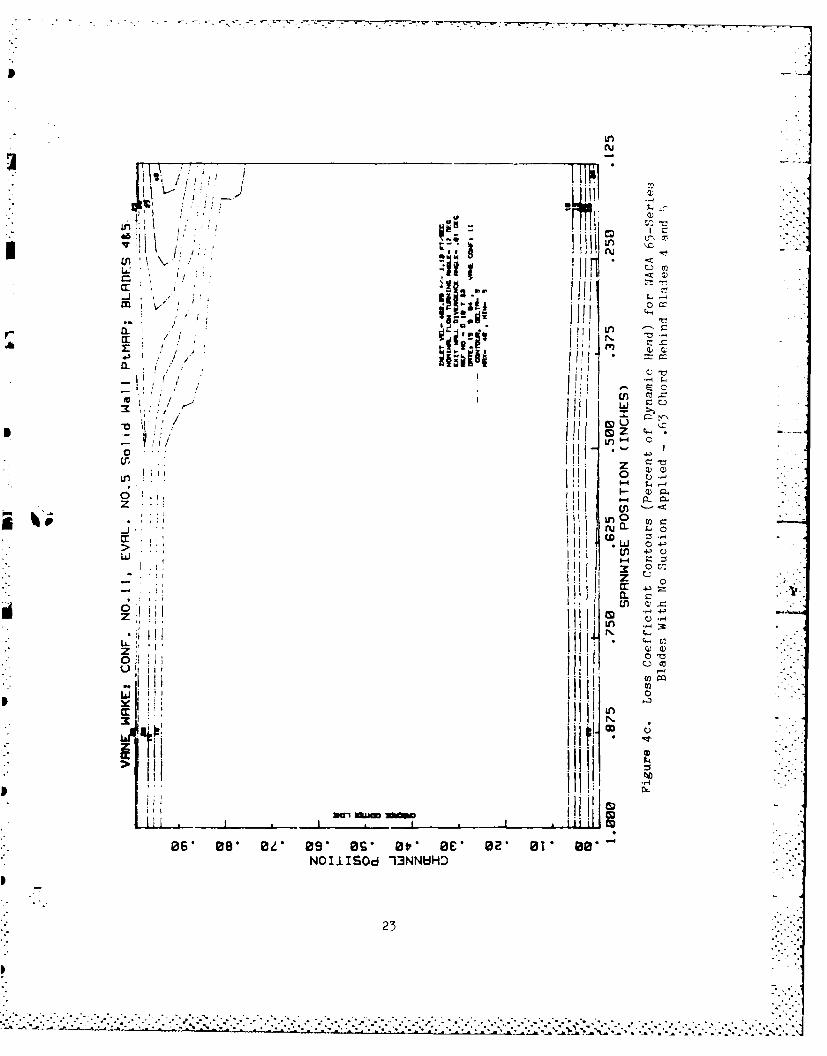
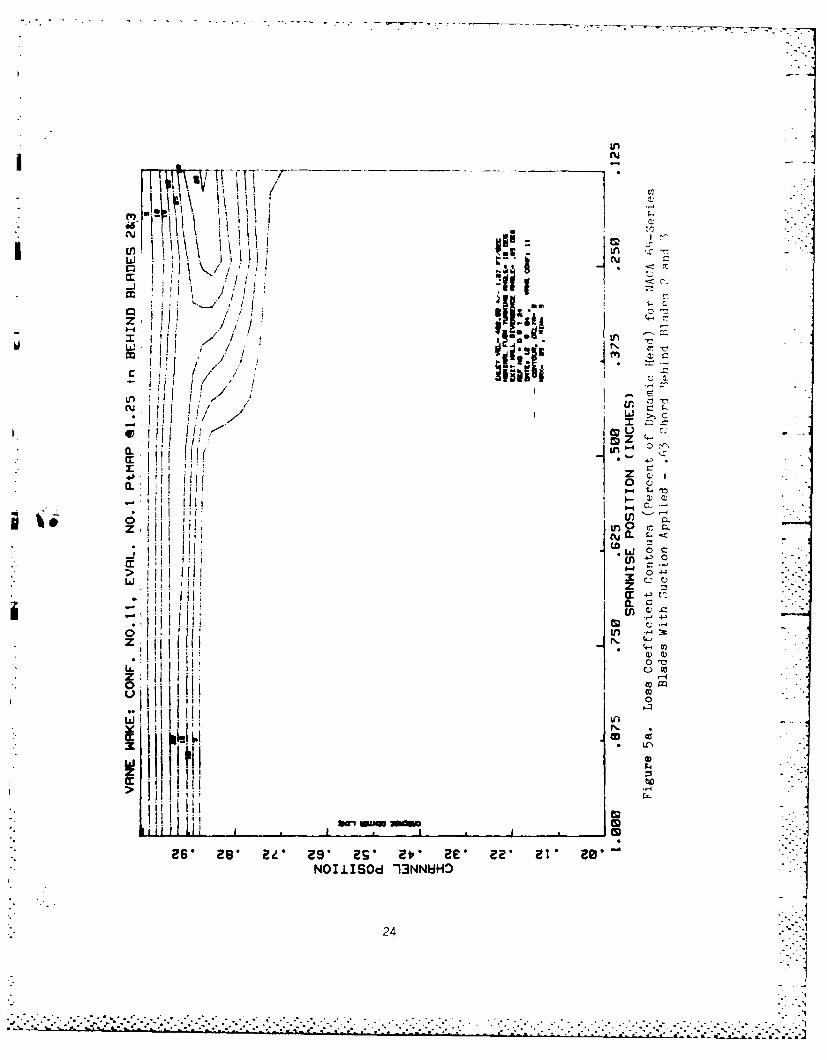
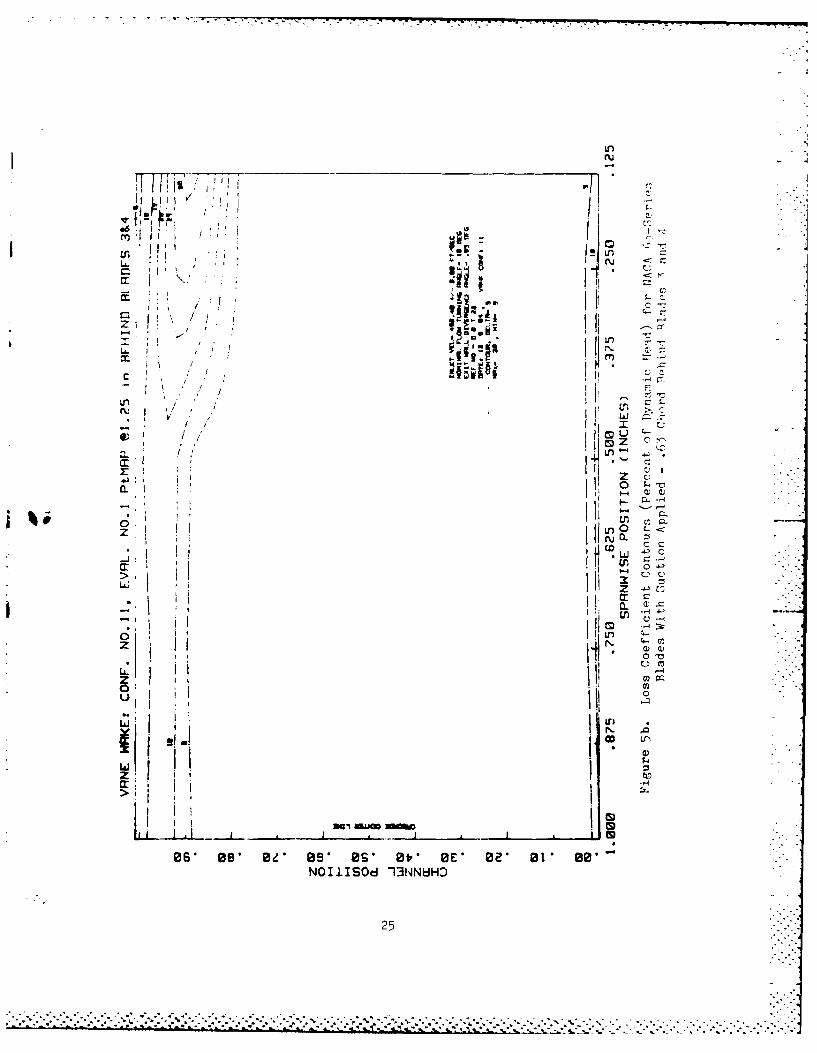
4. Loss Coefficient Contours (Percent of Dynamic Head) forNACA 65-Series Blades With No Suction Applied - .63 ChordBehind Blades ........ ......................... 2. .
5. Loss Coefficient Contours (Percent of Dynamic Head) forNACA 65-Series Blades With Suction Applied - .63 ChordBehind Blades ....................... . 24
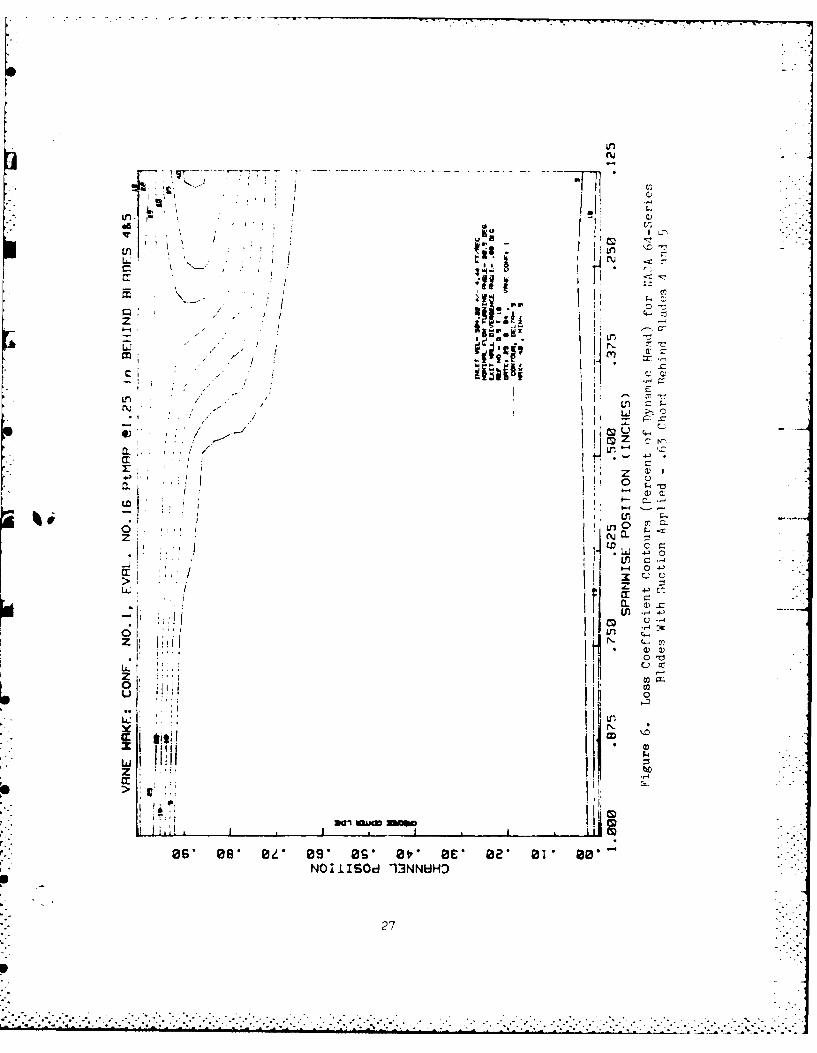
6. Loss Coefficient Contours (Percent of Dynamic Head) forNACA 64-Series Blades With Suction Applied - .63 ChordBehind Blades 4 and 5 .......... .................... 27
7. Logarithmic Plot of Performance Loss With Relative SandRoughness for NACA 64-Series Blades ... ............. ... 31
B 8. Linear Plot of Performance Loss With Relative Sand Roughnessfor NACA 64-Series Blades ....................... 32
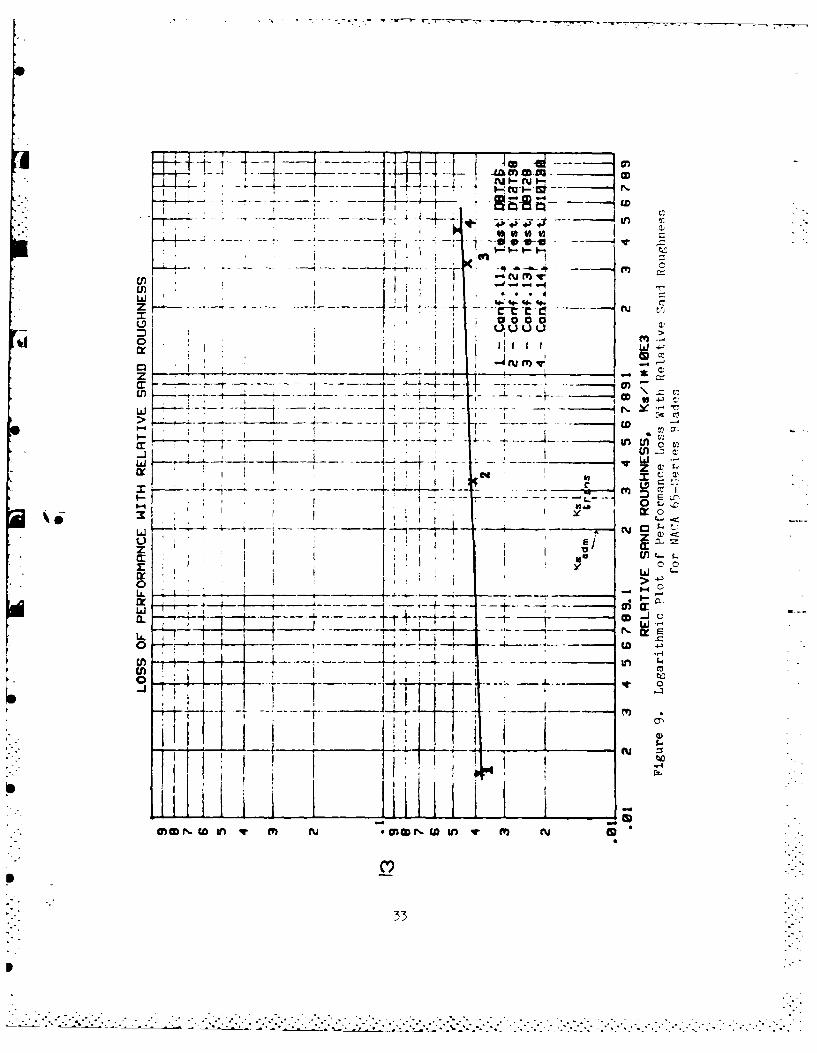
9. Logarithmic Plot of Performance Loss With Relative SandRoughness for NACA 65-Series Blades ... ............. ... 33
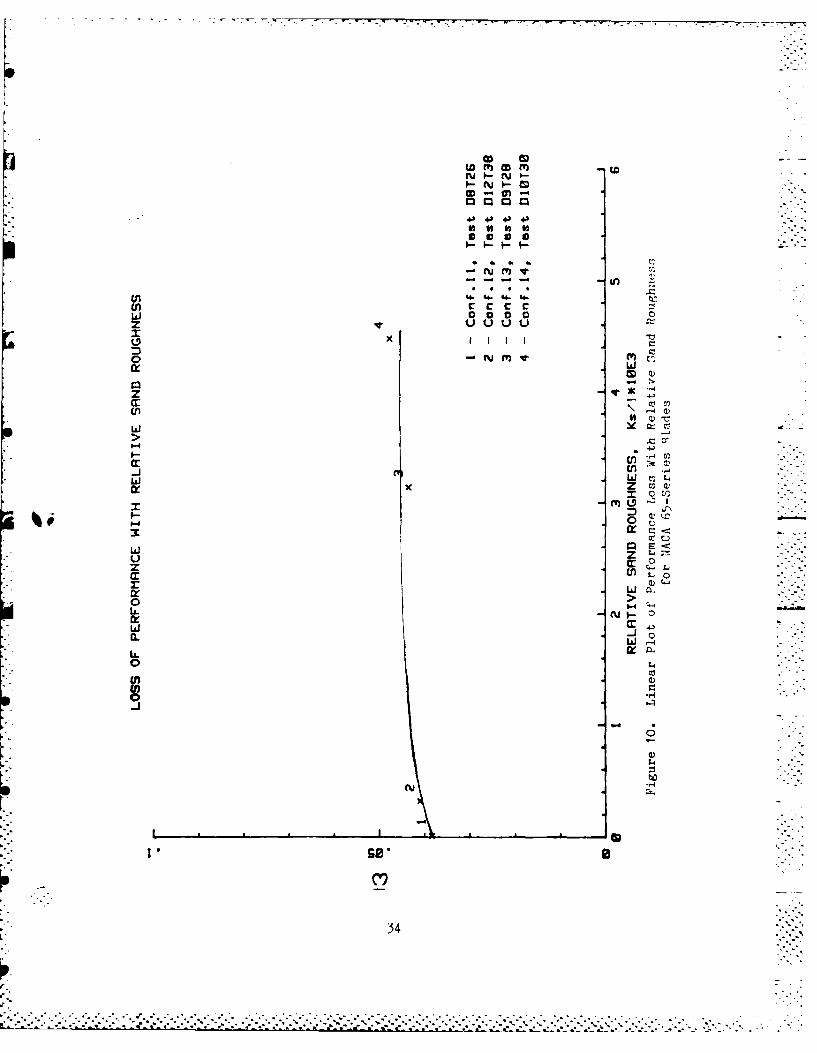
10. Linear Plot of Performance Loss With Relative Sand Roughnessfor NACA 65-Series Blades ...... .................. . . 34
11. Velocity and Turbulence Intensity ProfileConf No. I Traverse No. 2: Ks/l-O.088x10 3 . . . . . . . . . . 38
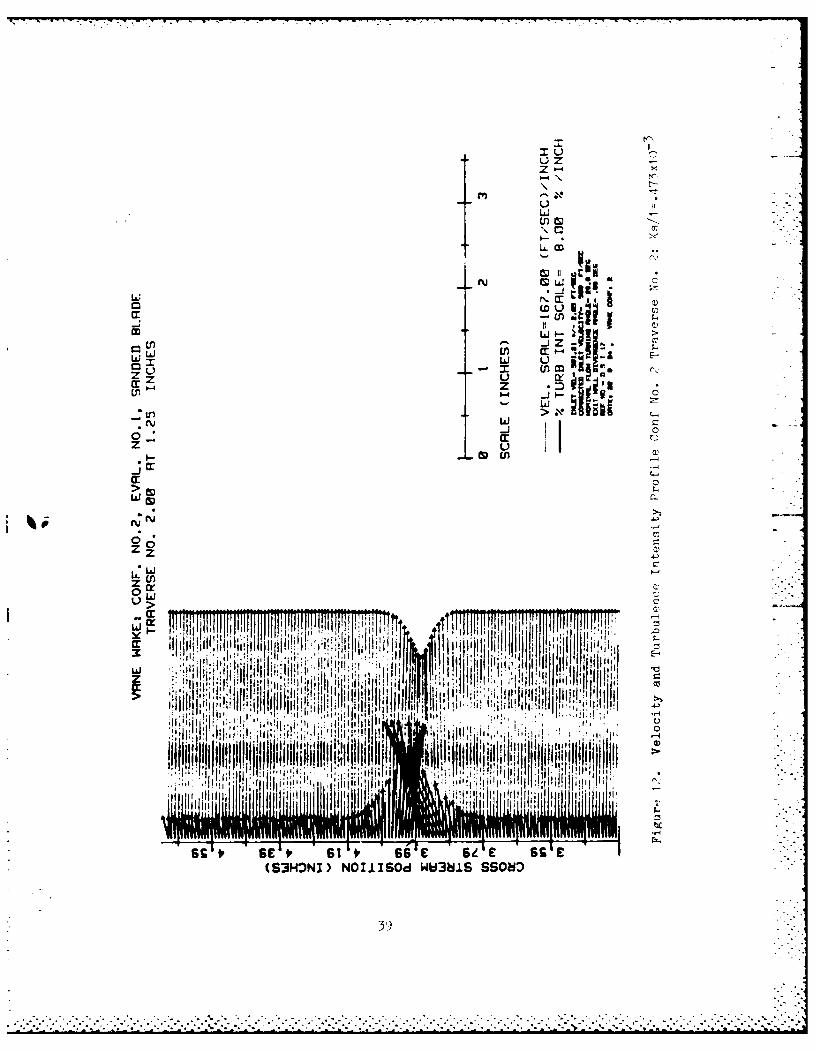
12. Velocity and Turbulence Intensity ProfileConf No. 2 Traverse No. 2: Ks/l=0.473x10 -3 . . . . . . . . . . 39
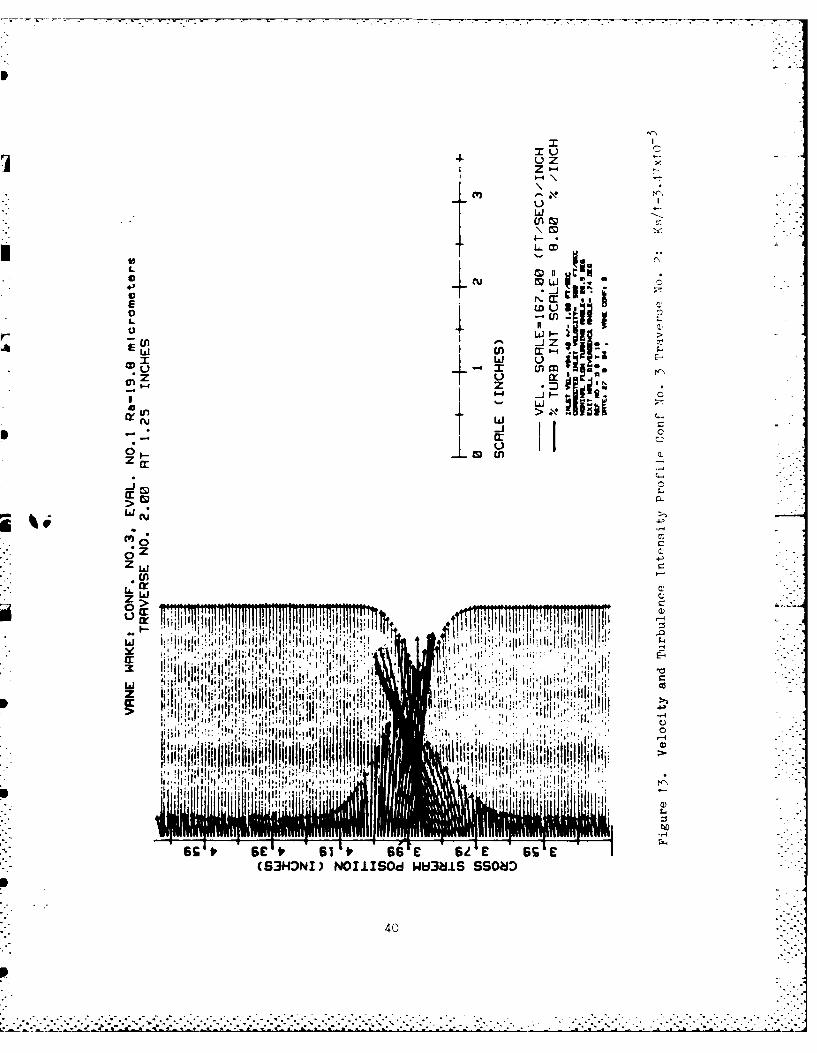
13. Velocity and Turbulence Intensity Profile
Conf No. 3 Traverse No. 2: Ks/l=3.47x10-3 . ......... 40
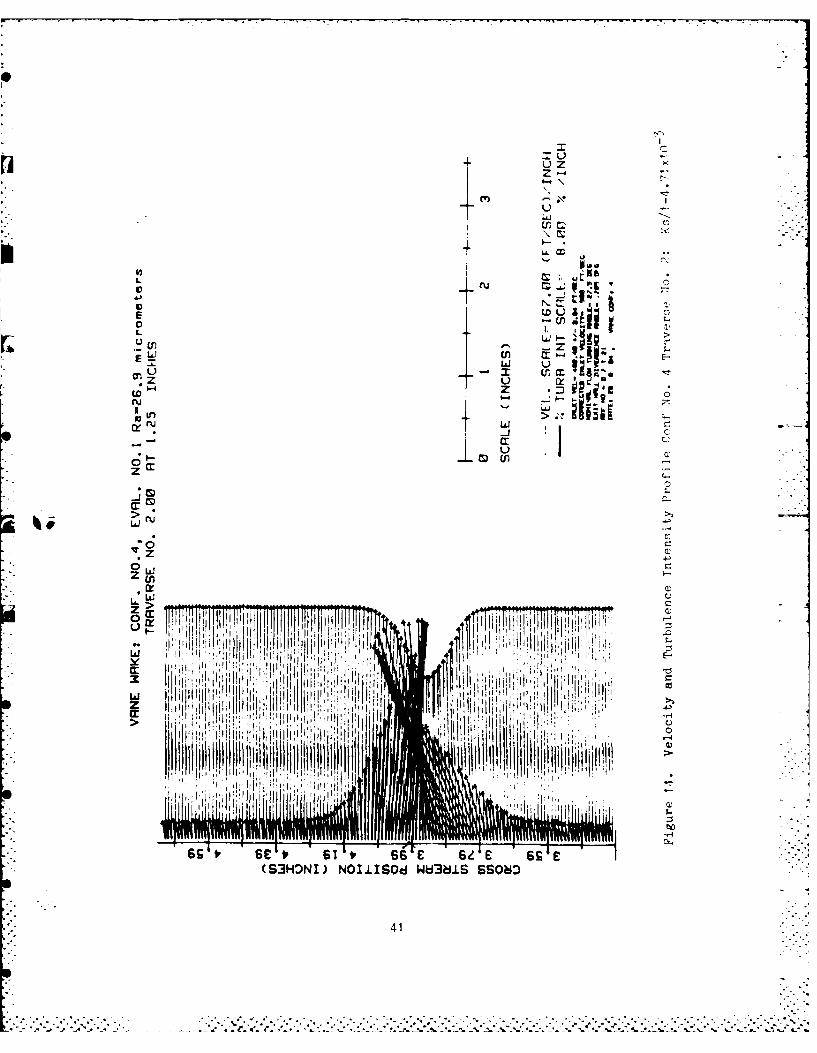
14. Velocity and Turbulence Intensity ProfileConf No. 4 Traverse No. 2: Ks/l=4.71x10- 3 . . . . . . . . . . 41
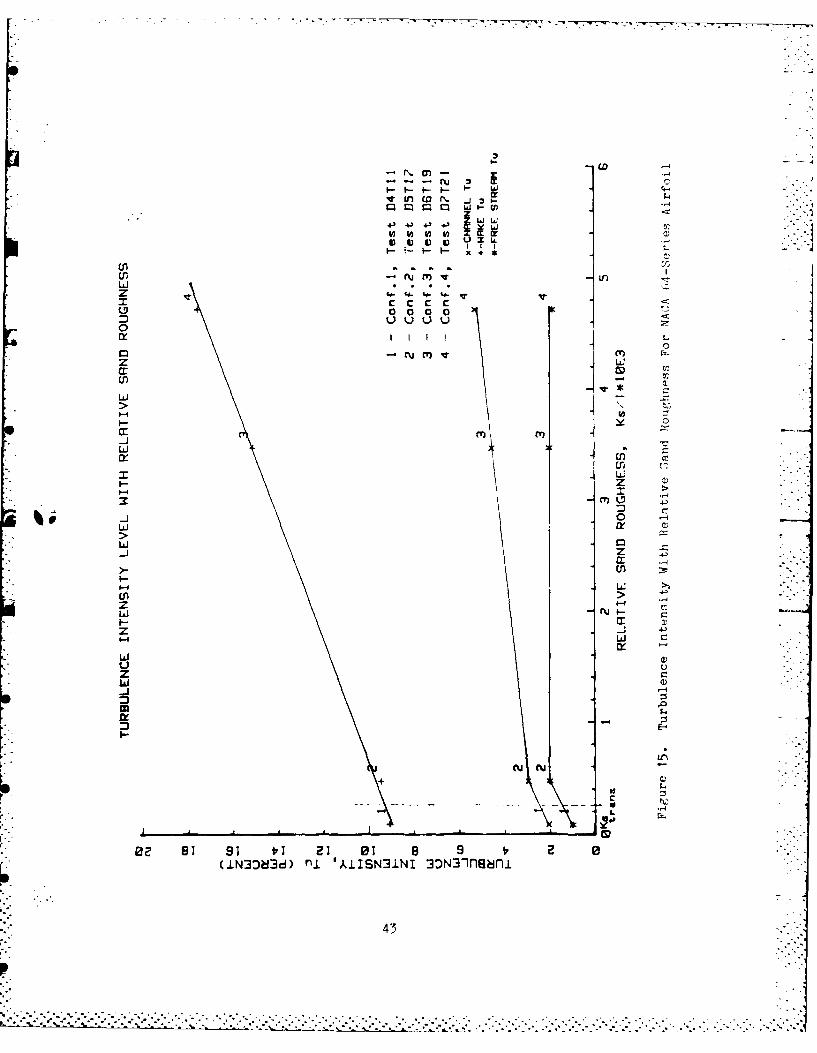
15. Turbulence Intensity With Relative Sand RoughnessFor NACA 64-Series Airfoil .................. 43
._-
VU.'

16. Turbulence Intensity With Relative Sand RoughnessFor NACA 65-Series Airfoil .. .................. 44
217. Arithmetic Average Ruuglhns~ . . . . .. .. .. .. .. .. .. 49
18. Temperature-Entropy Plot Of Compression Process....... "
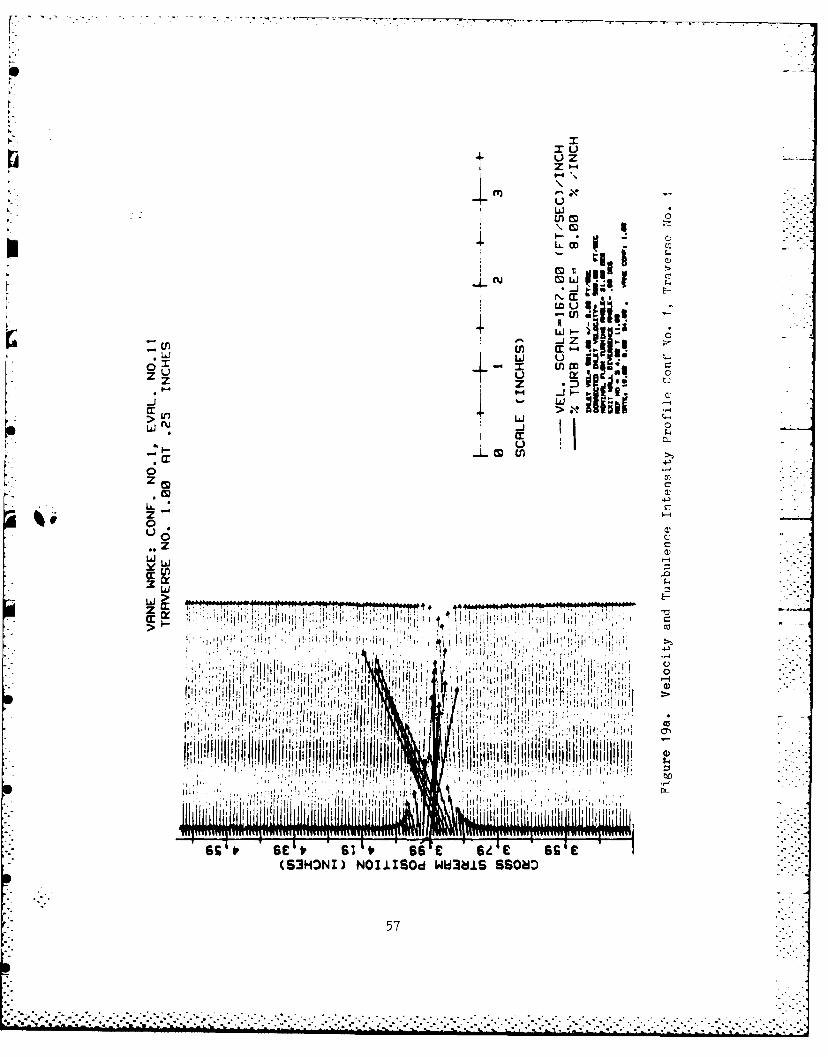
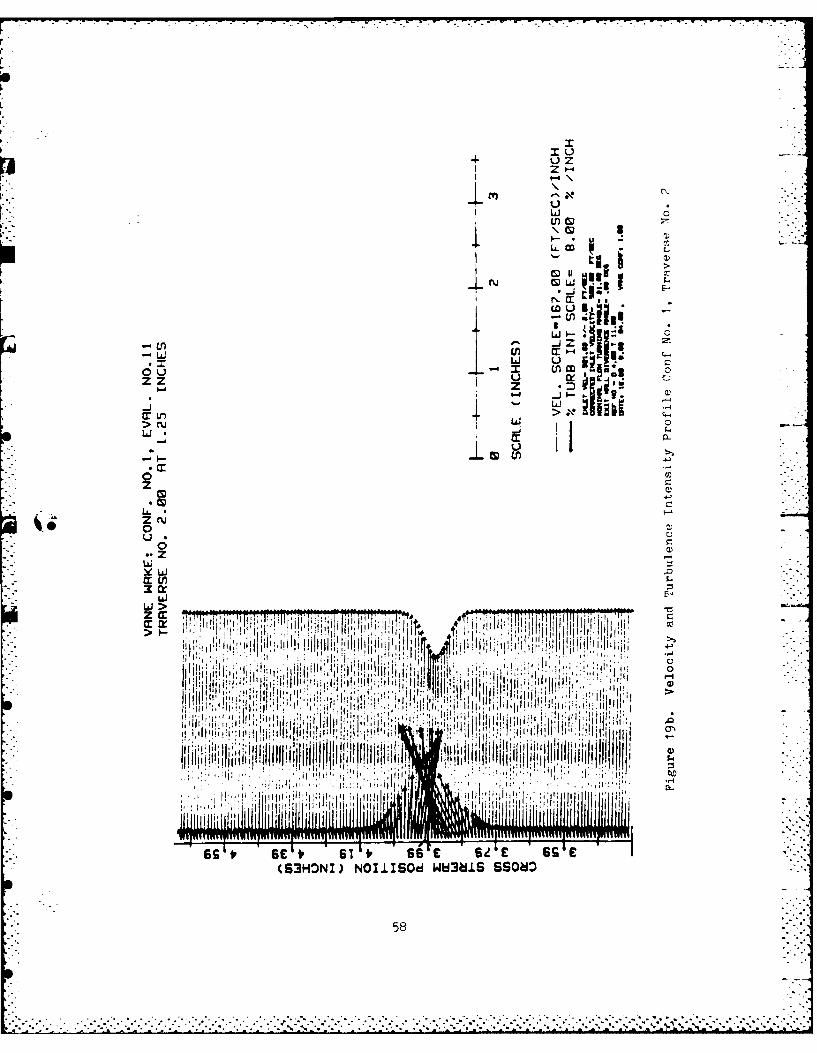
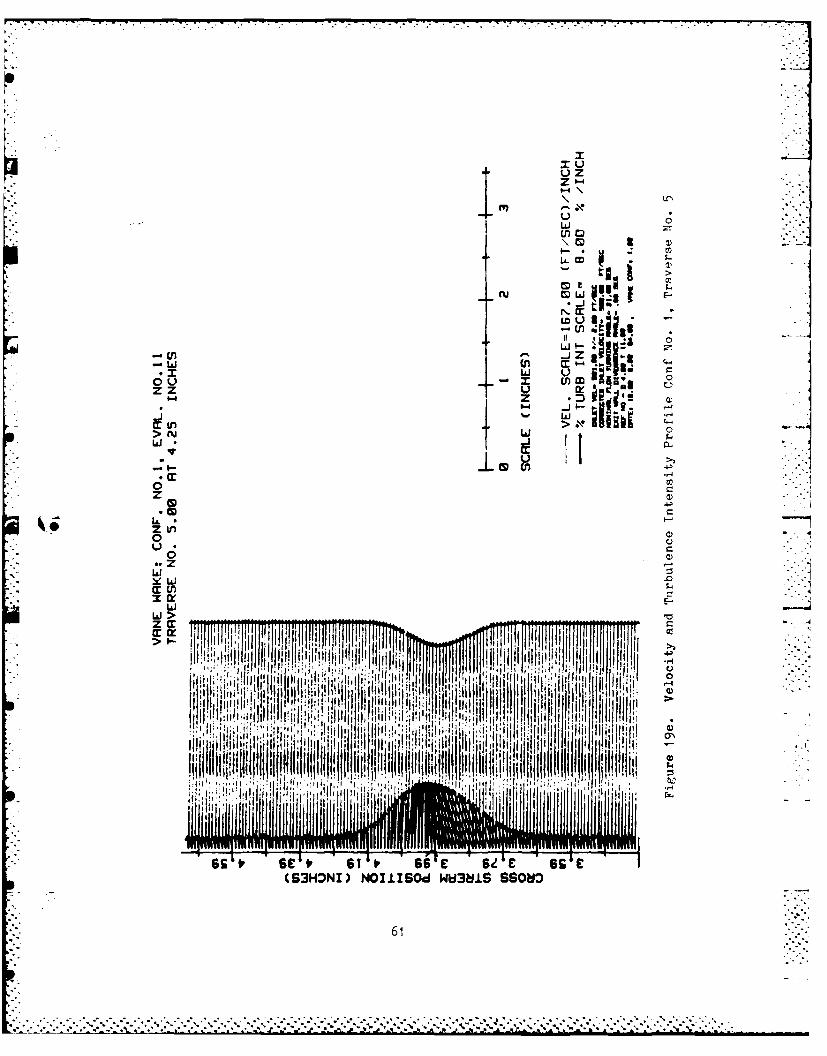
19. Velocity and Turbulence Intensity ProfileConf No. 1. ............ ............... 57
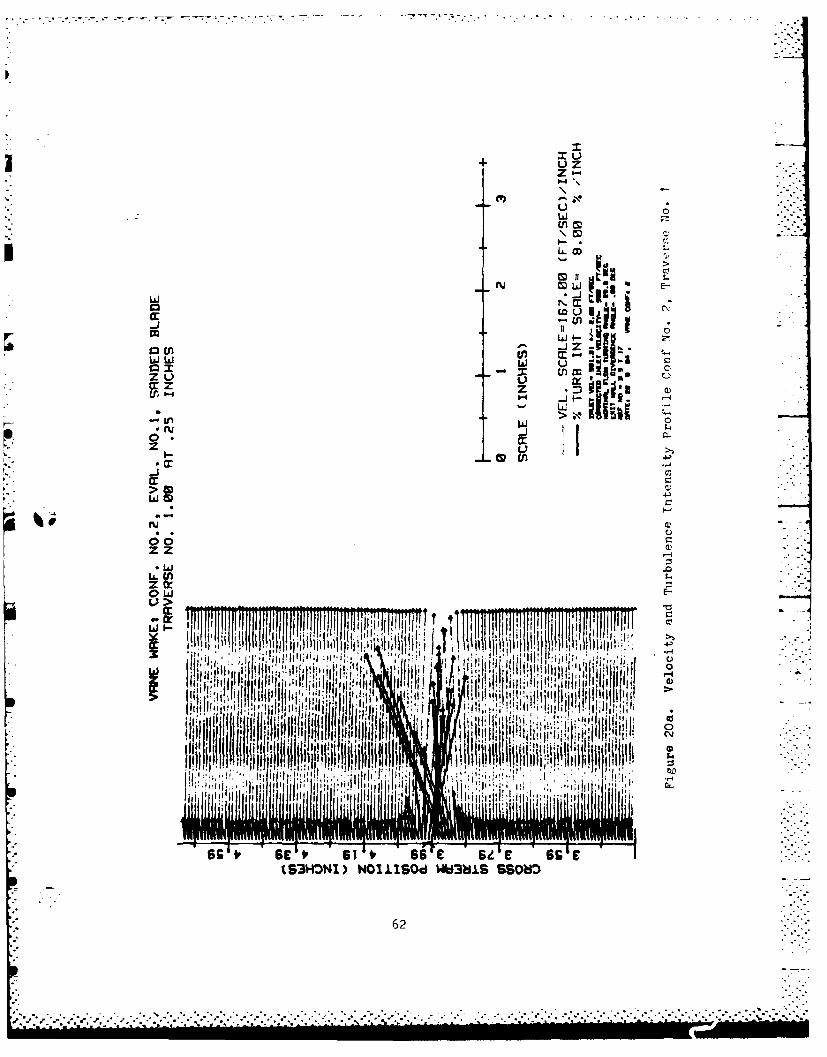
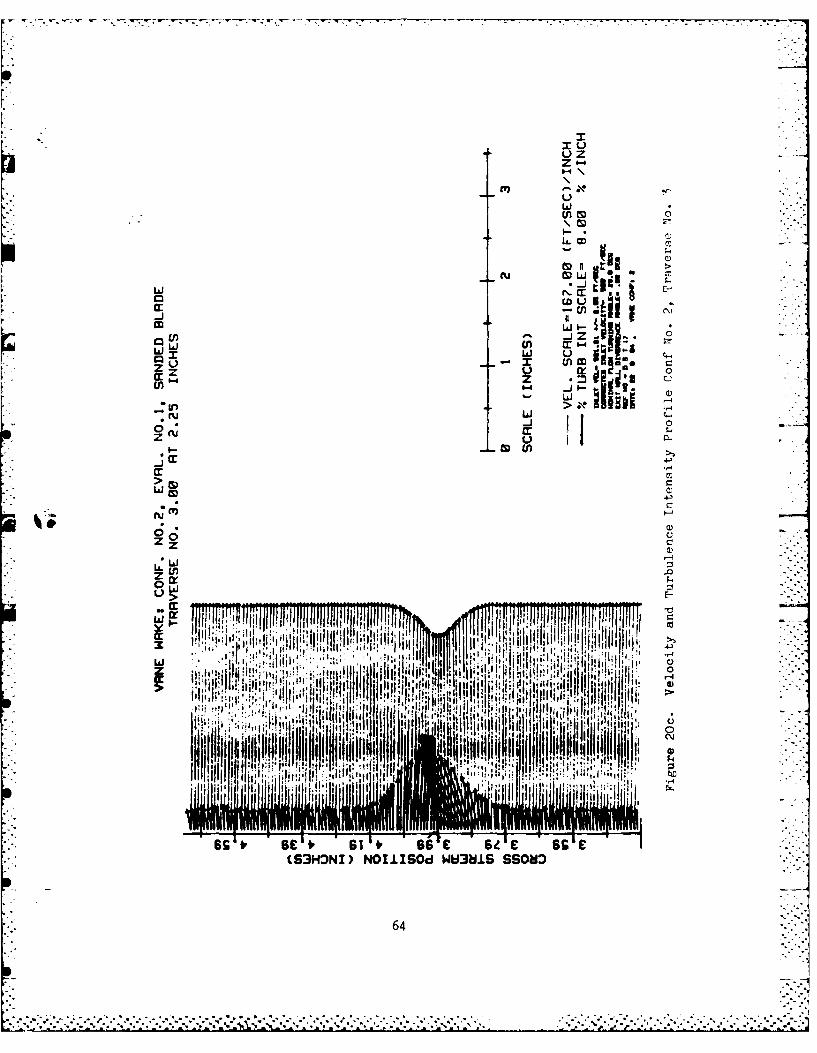
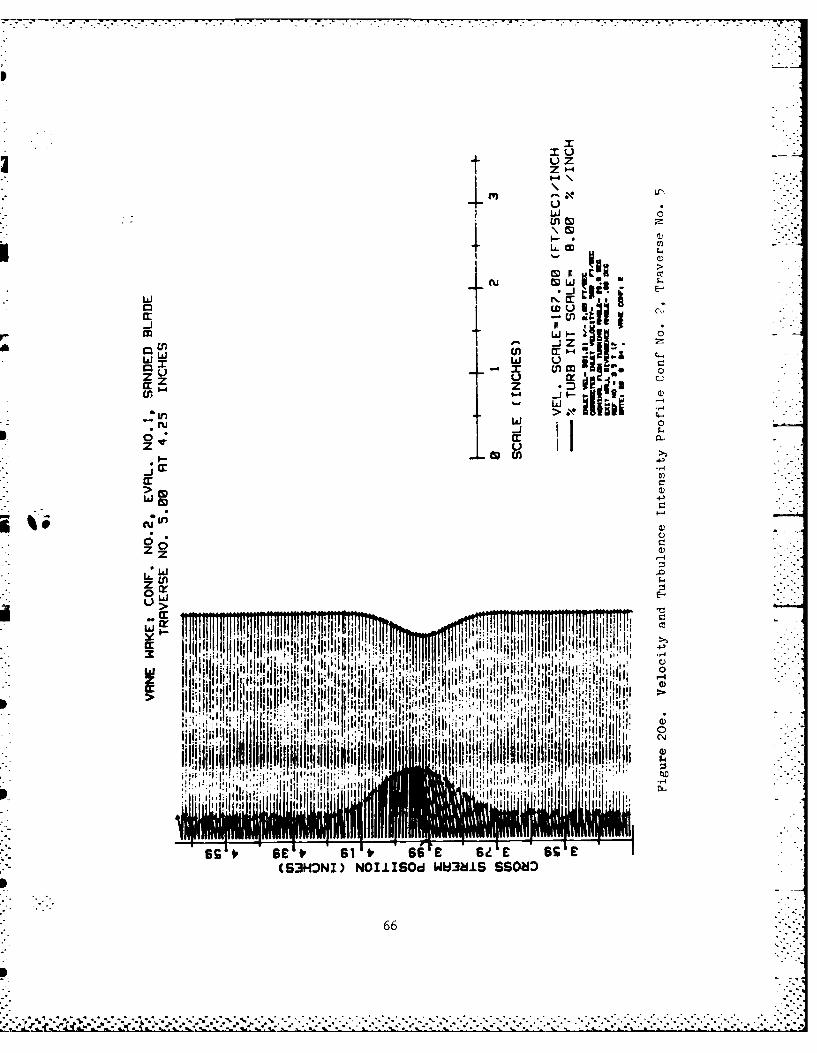
20. Velocity and Turbulence Intensity ProfileCon! No. 2 .. .......................... 62
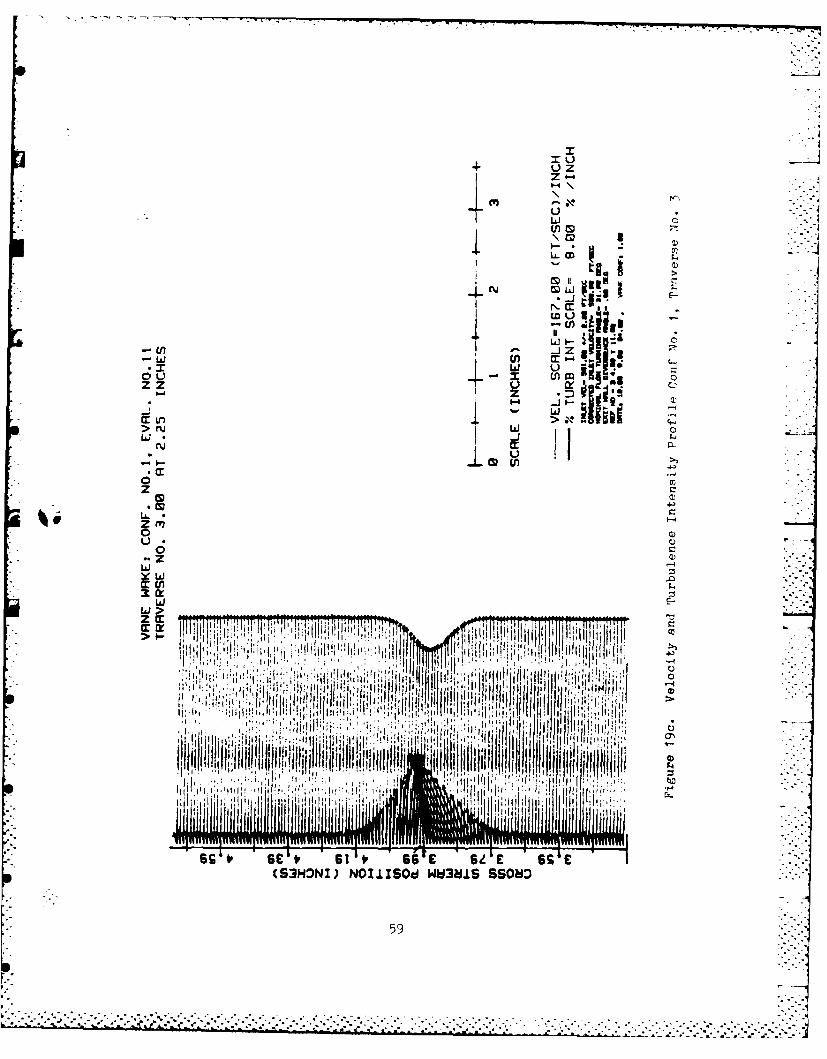
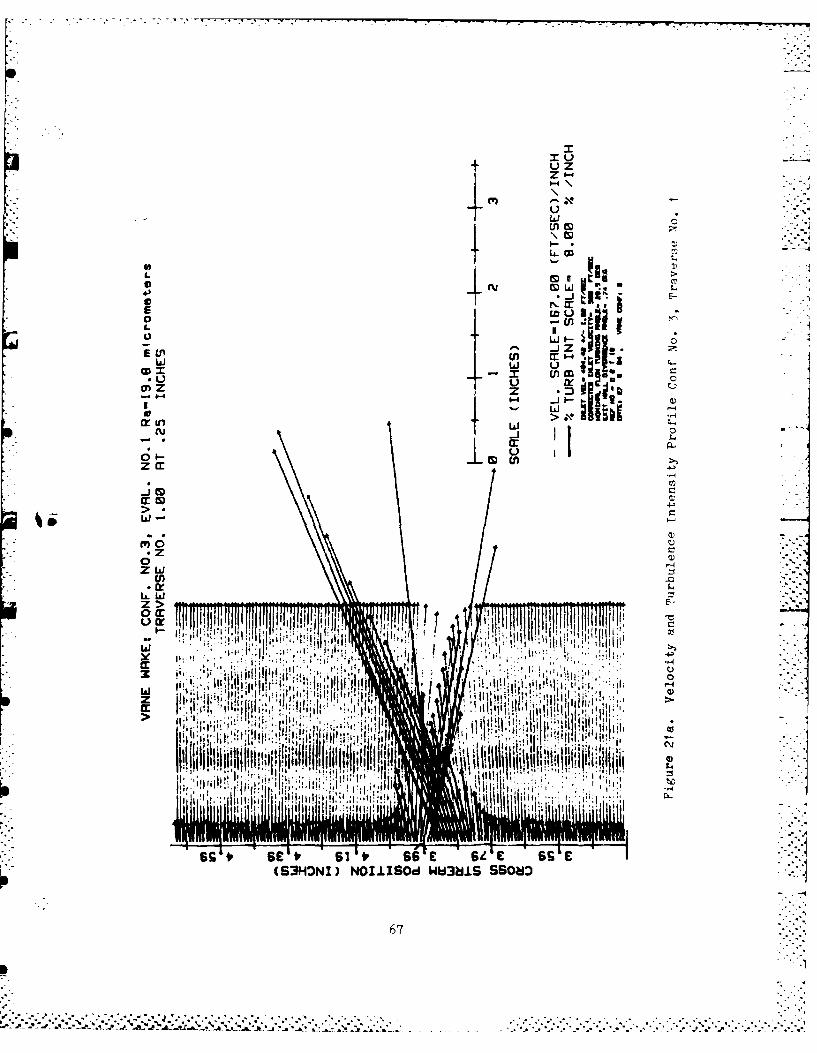
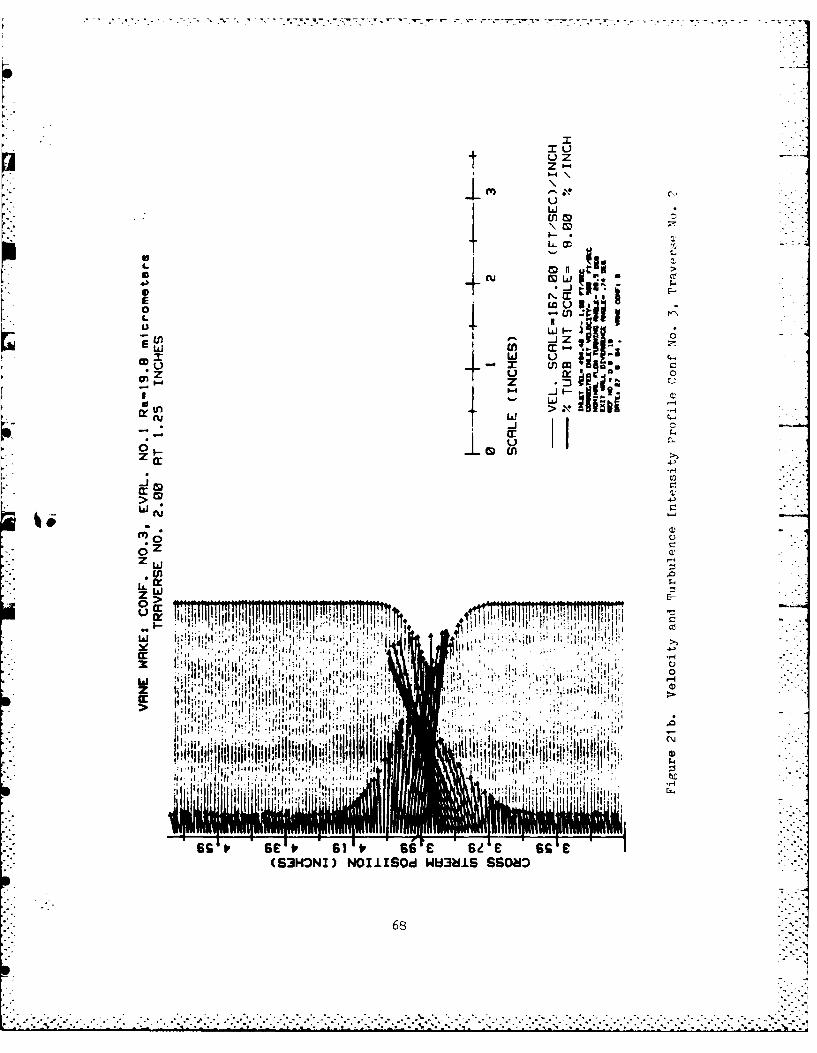
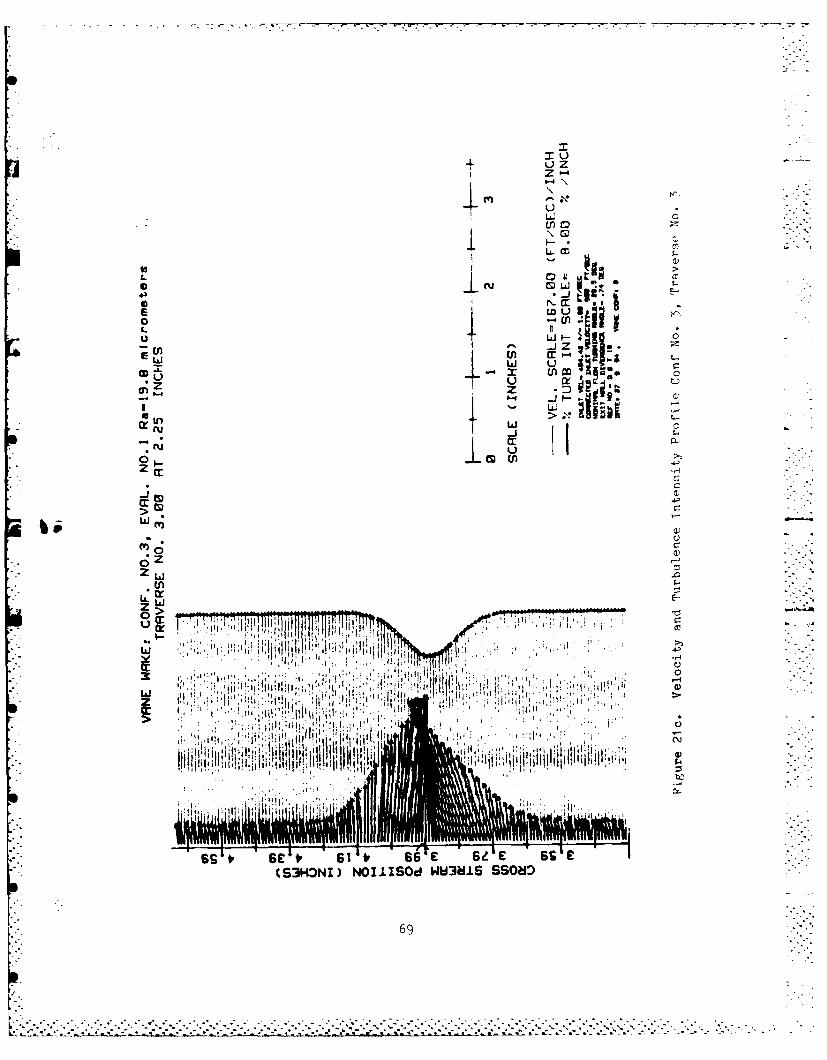
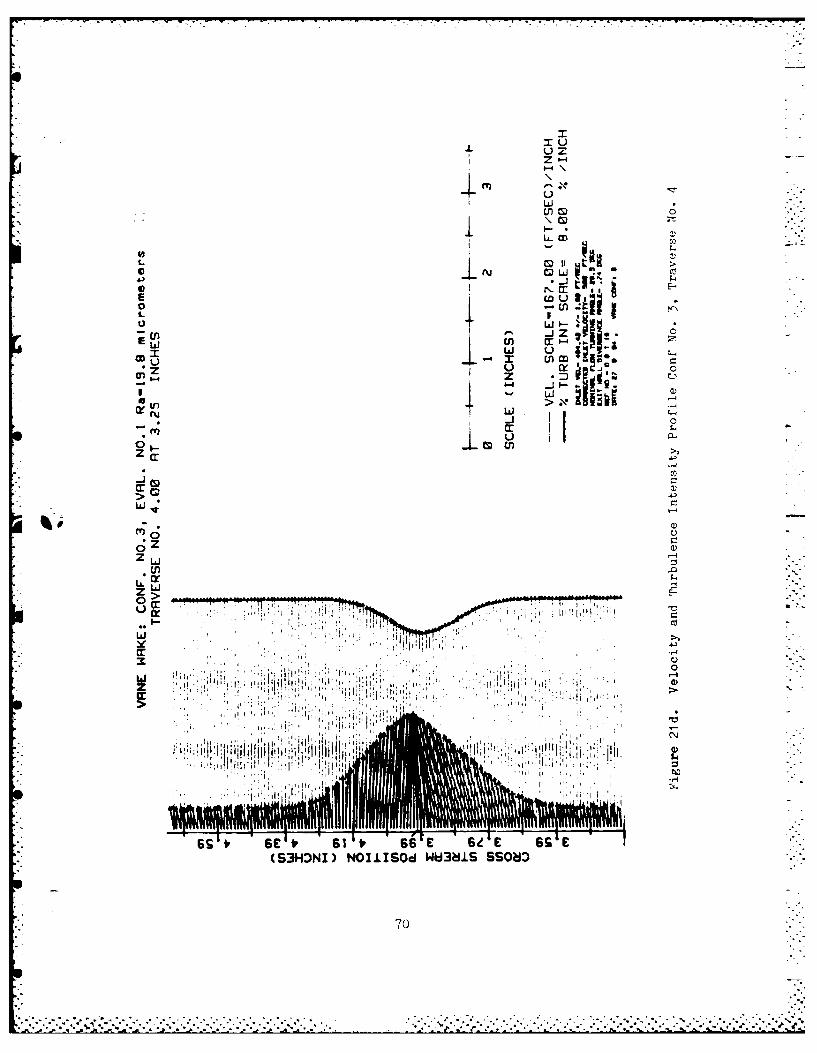
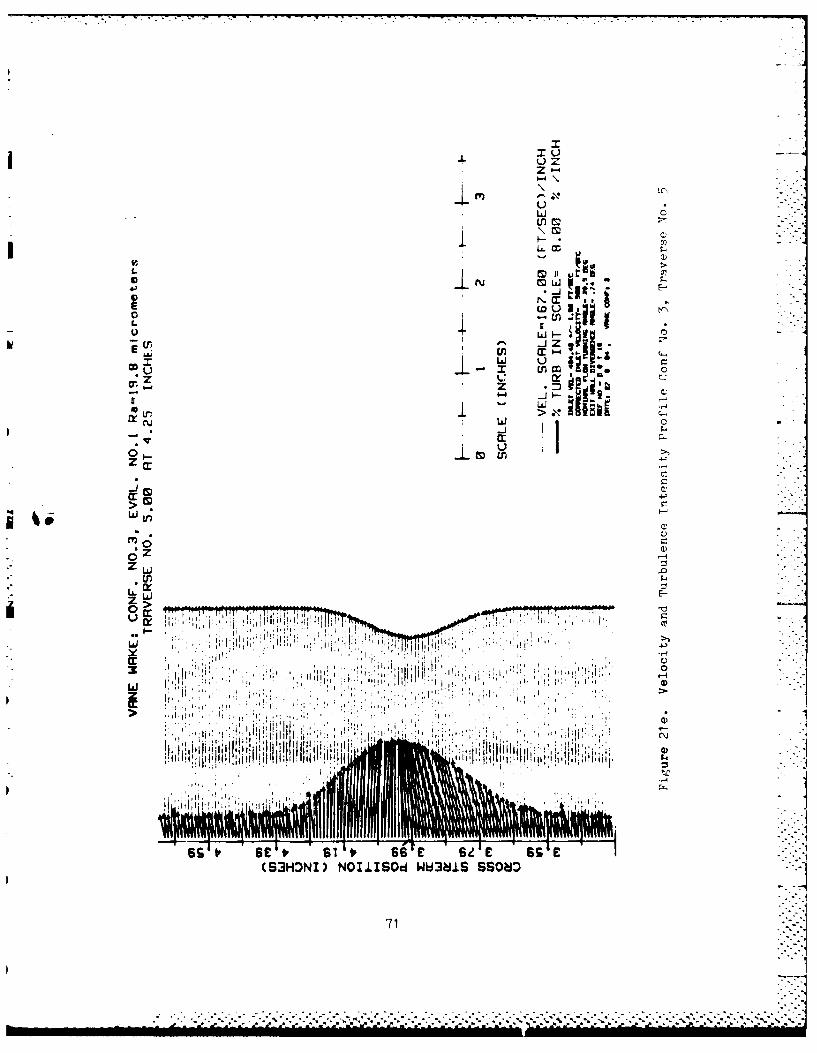
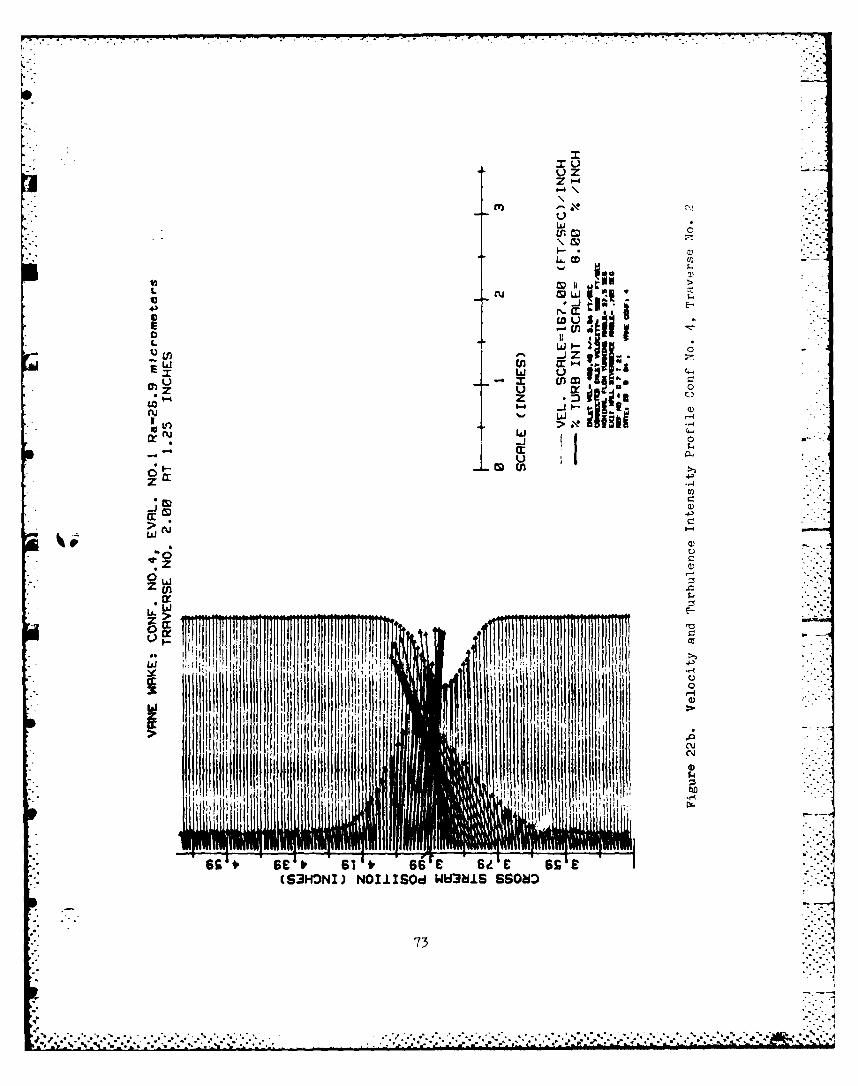
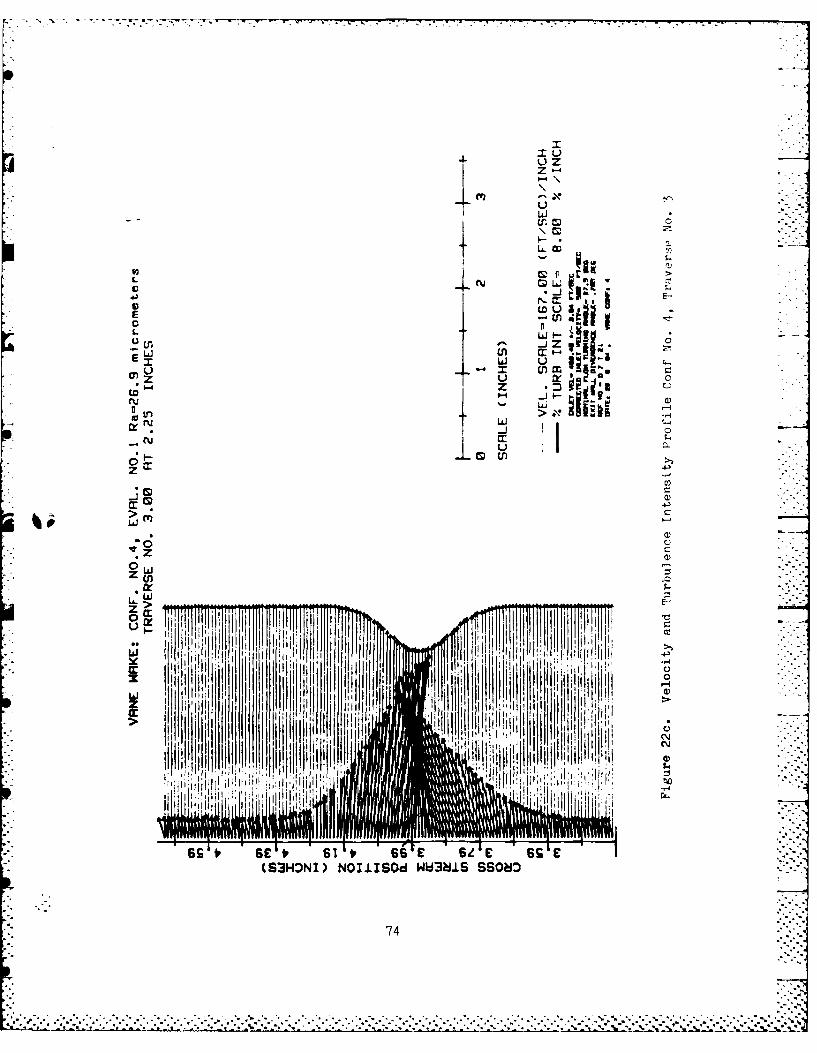
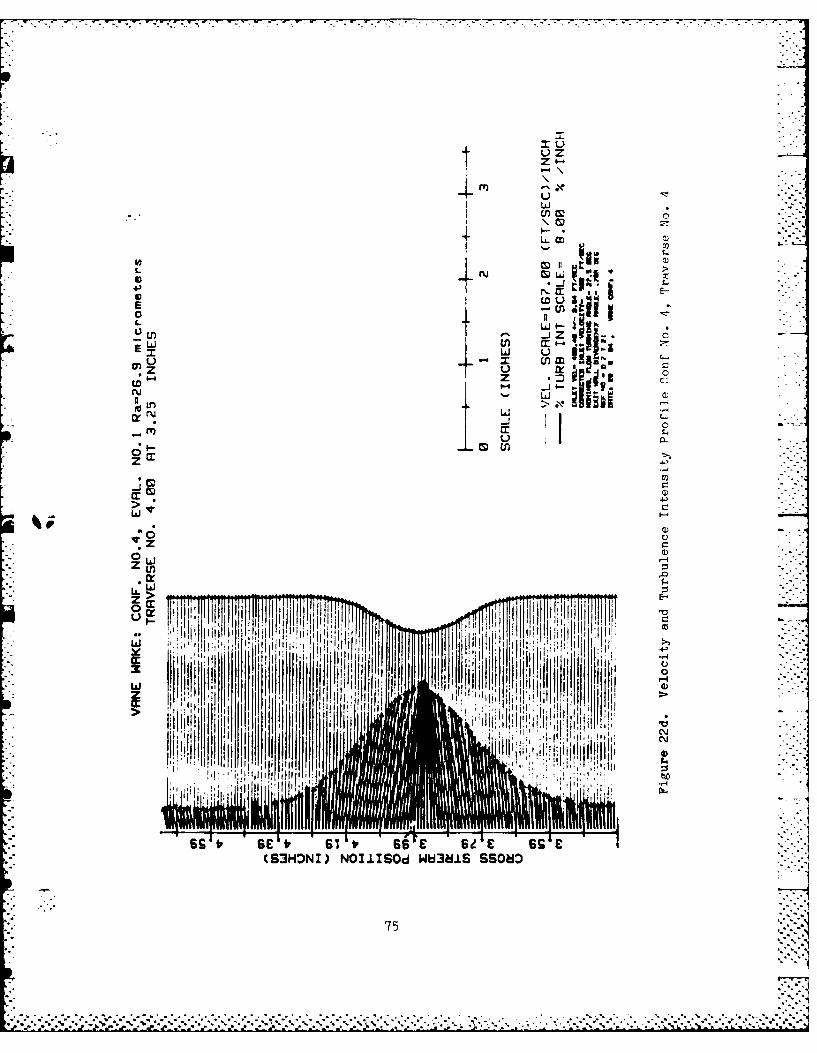
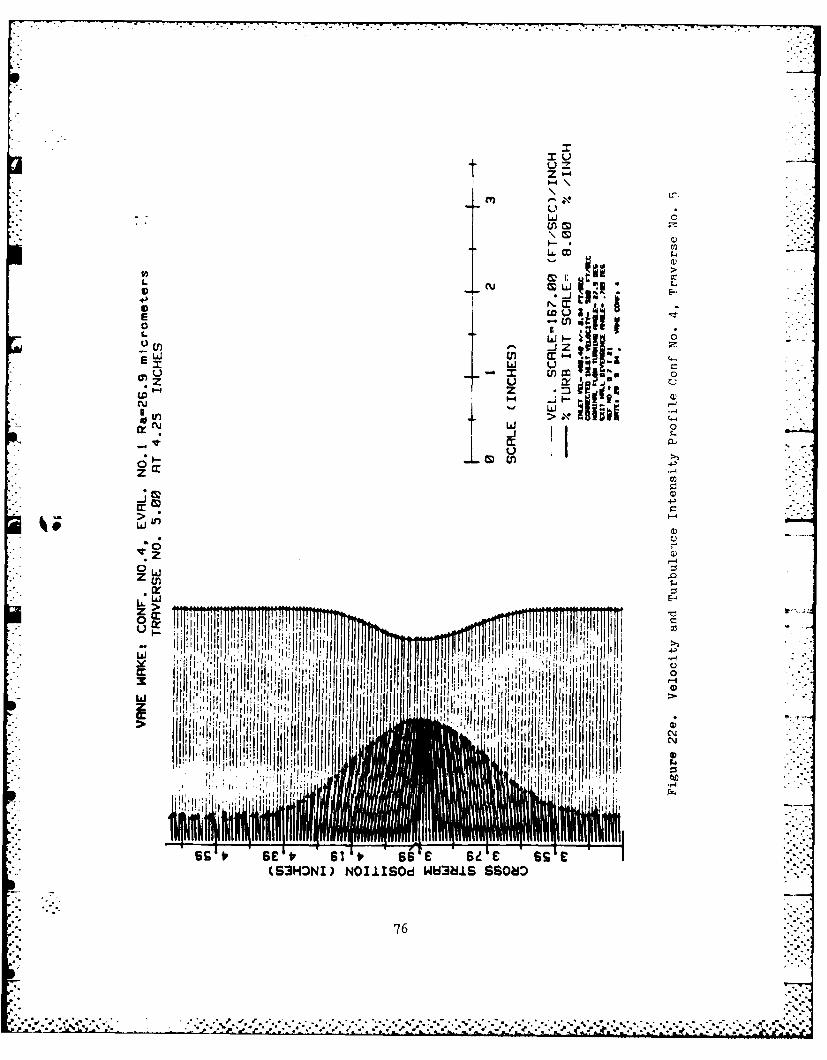
21. Velocity and Turbulence Intensity Profiler Conf No. 3 .. .......................... 67
s22. Velocity and Turbulence Intensity Profile
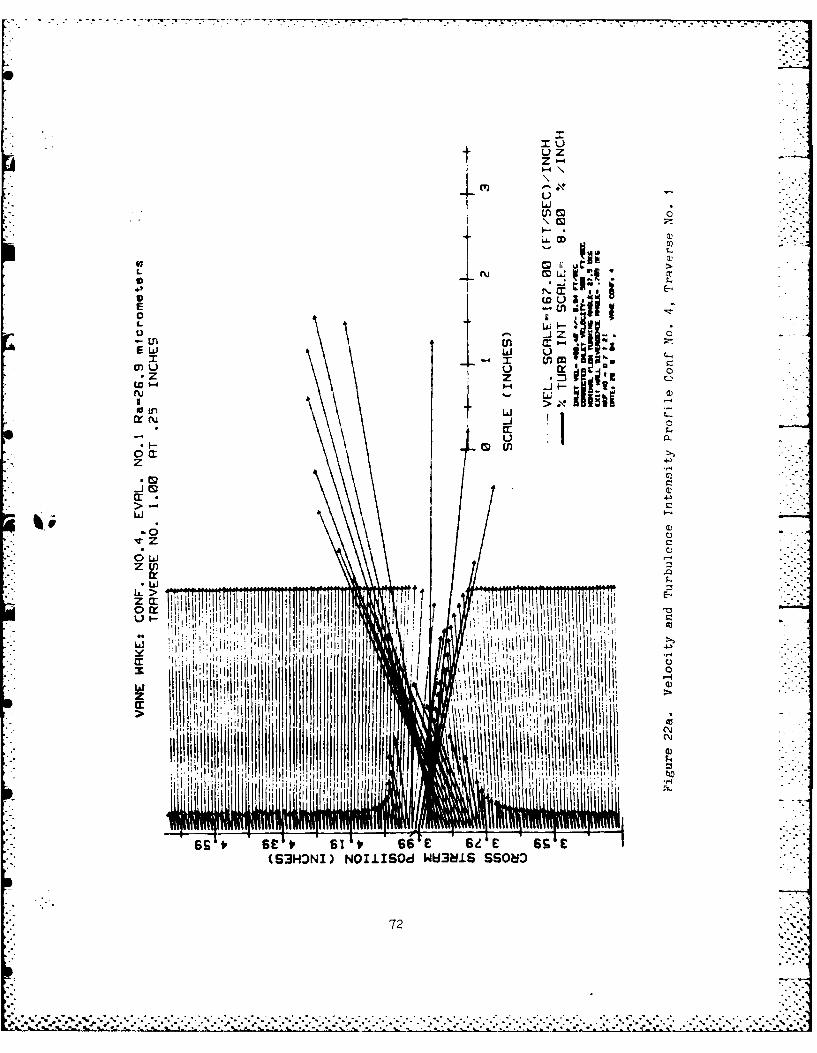
Conf No. 4 .. .......................... 72
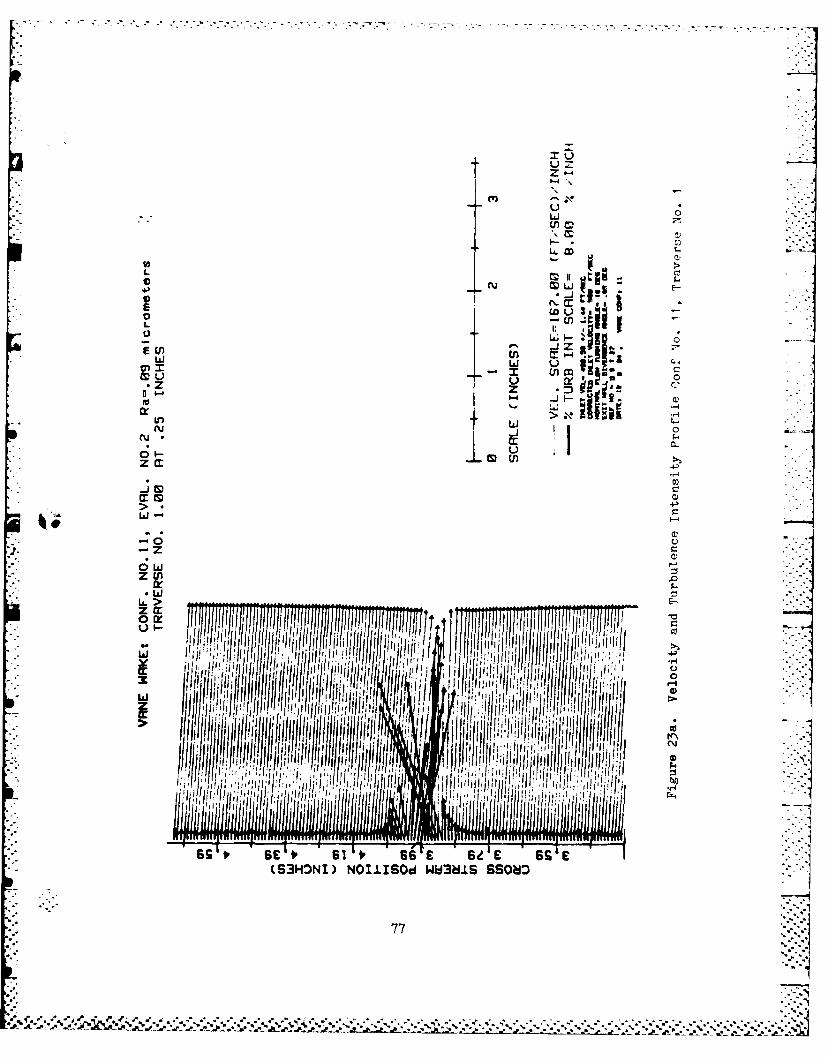
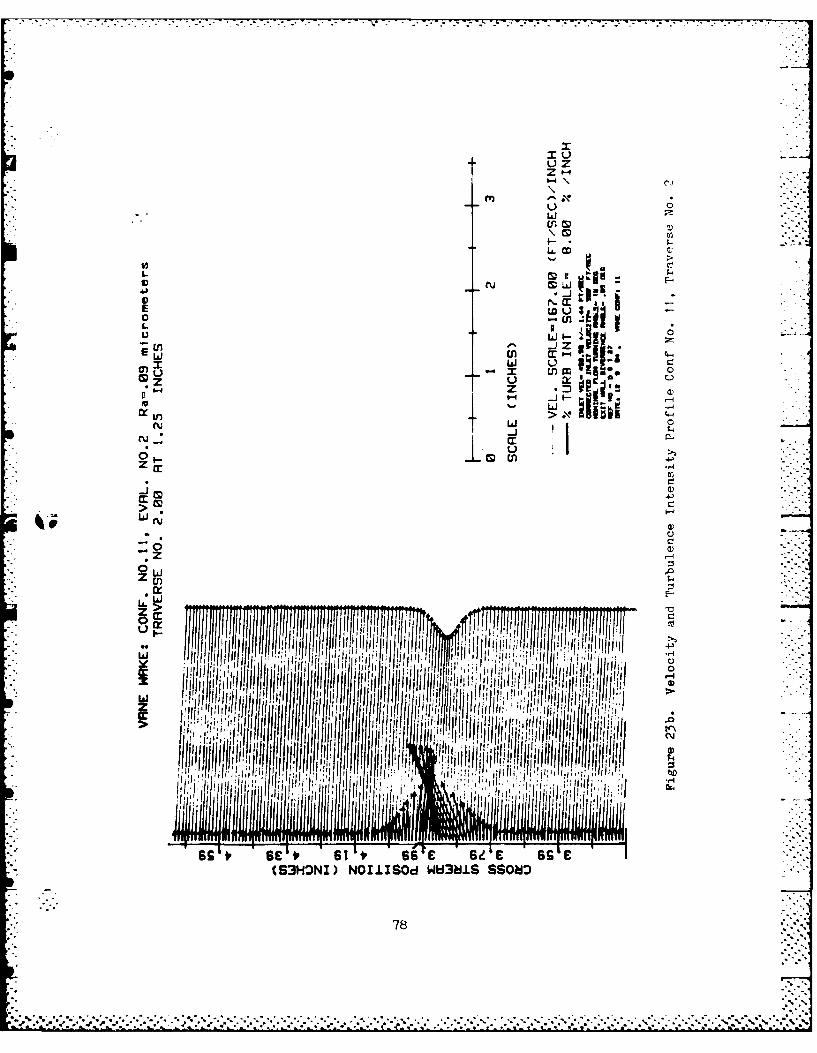
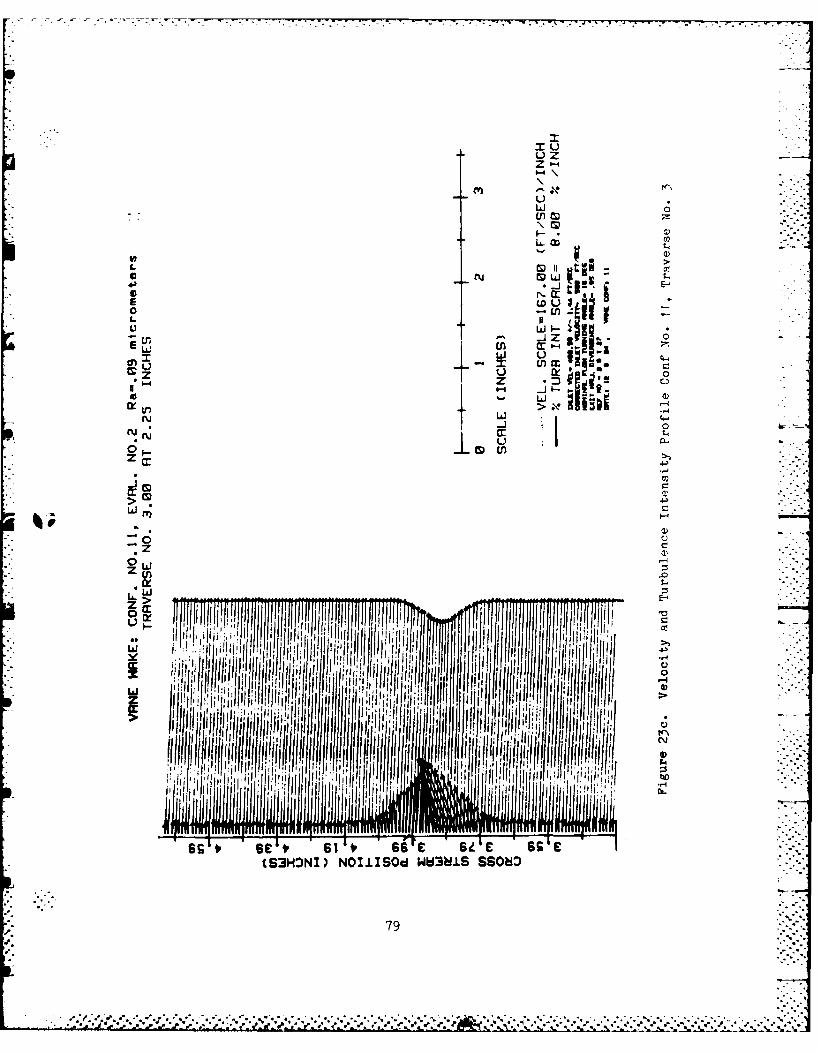
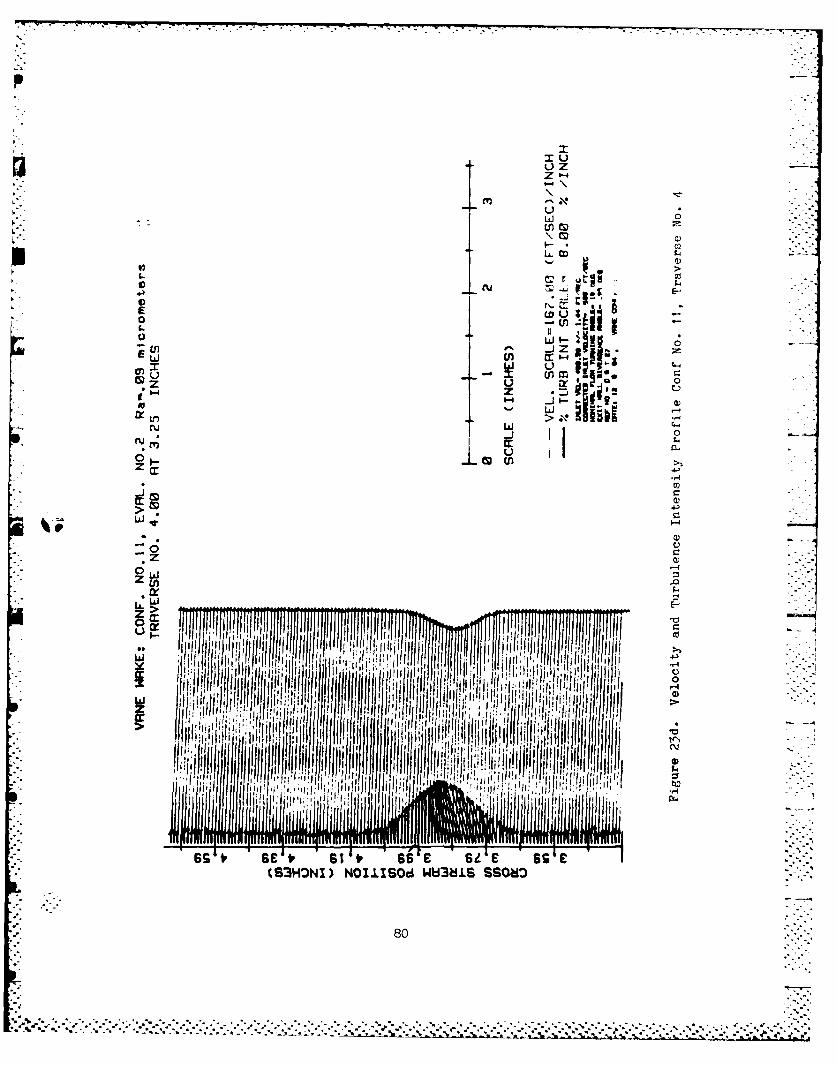
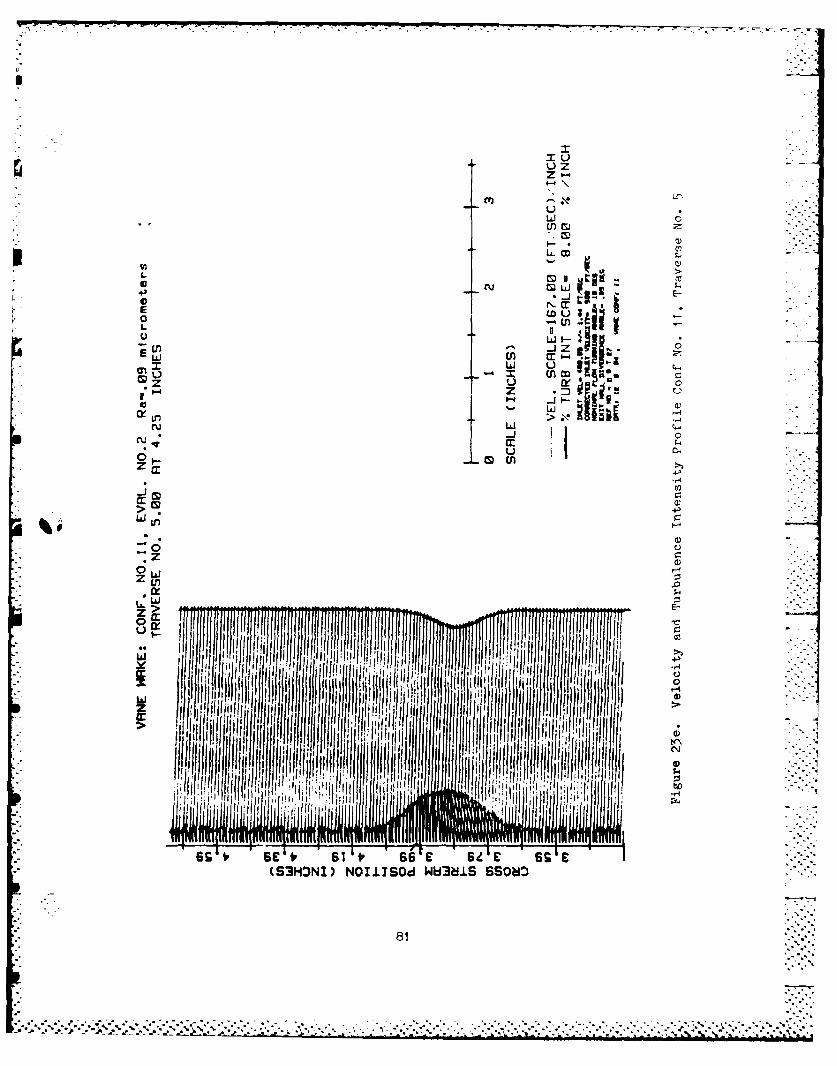
23. Velocity and Turbulence Intensity ProfileConf No. 11. ............ .............. 77
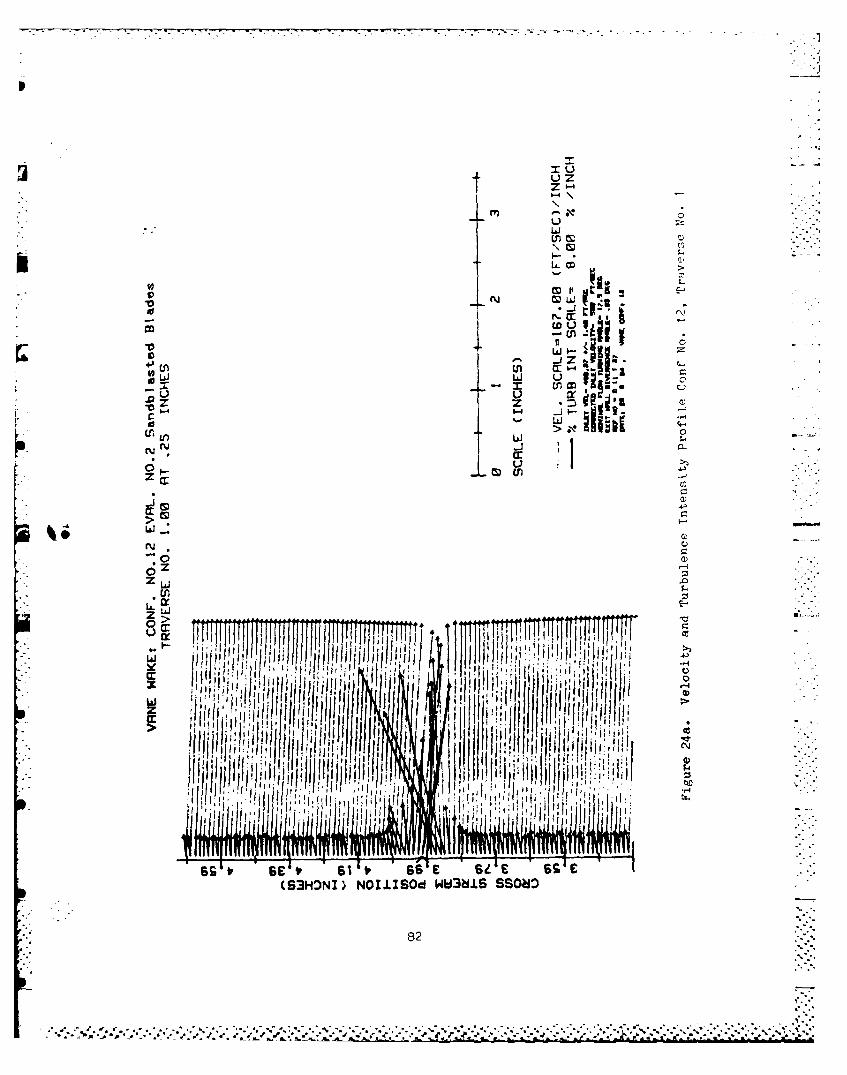
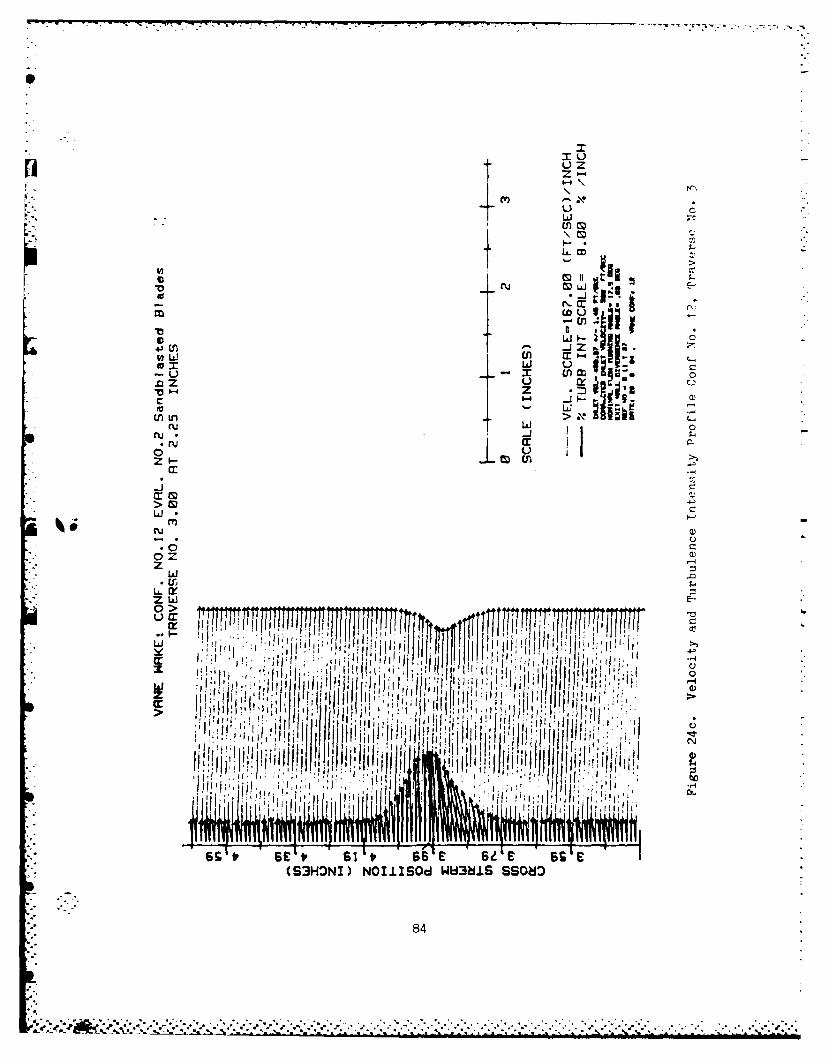
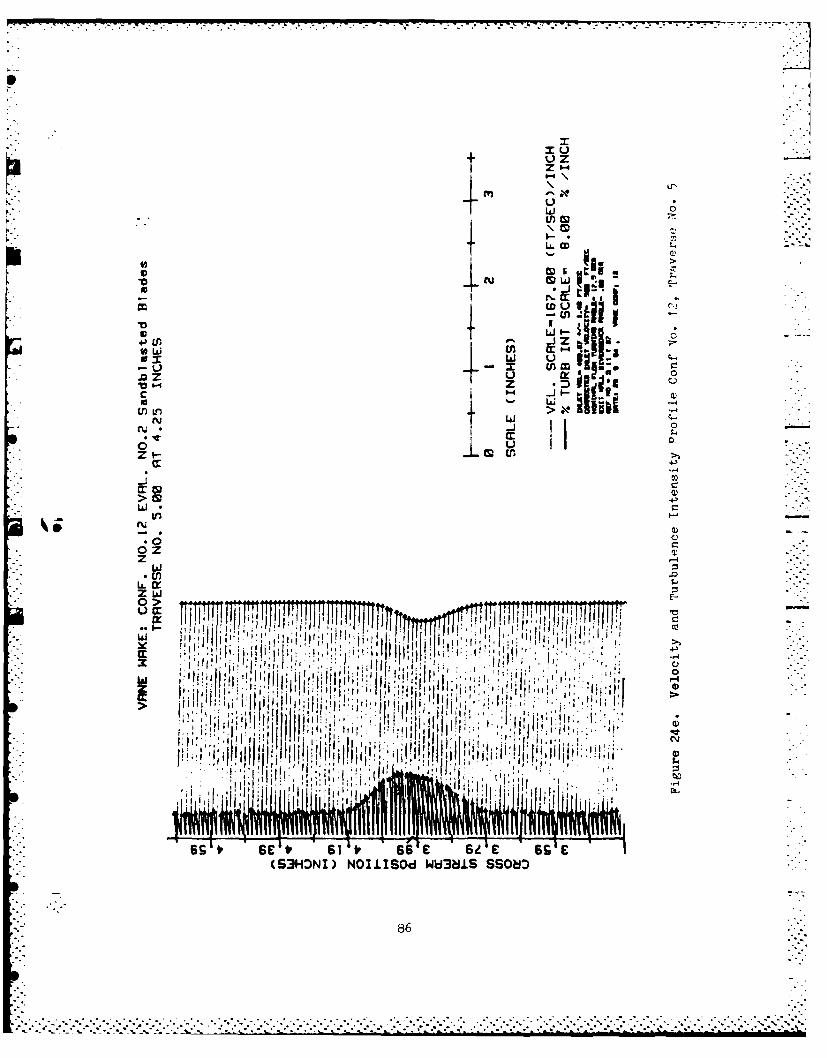
24. Velocity and Turbulence Intensity ProfileCon! No. 12. .......................... 82
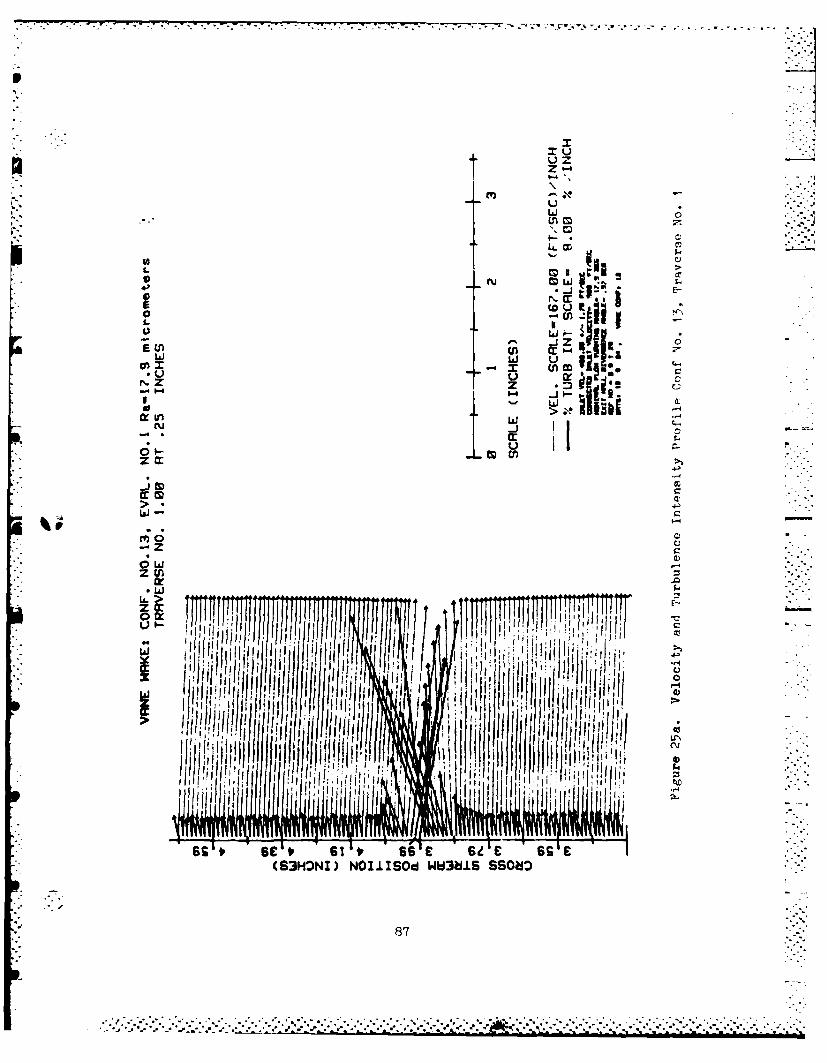
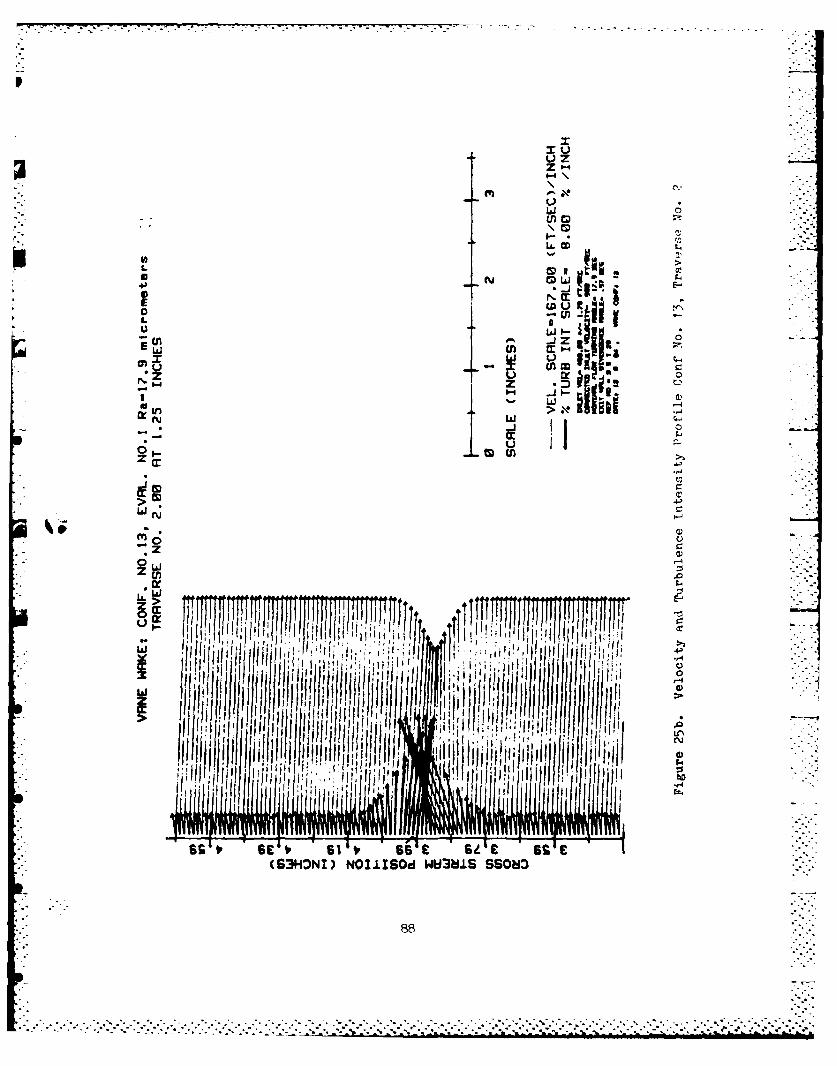
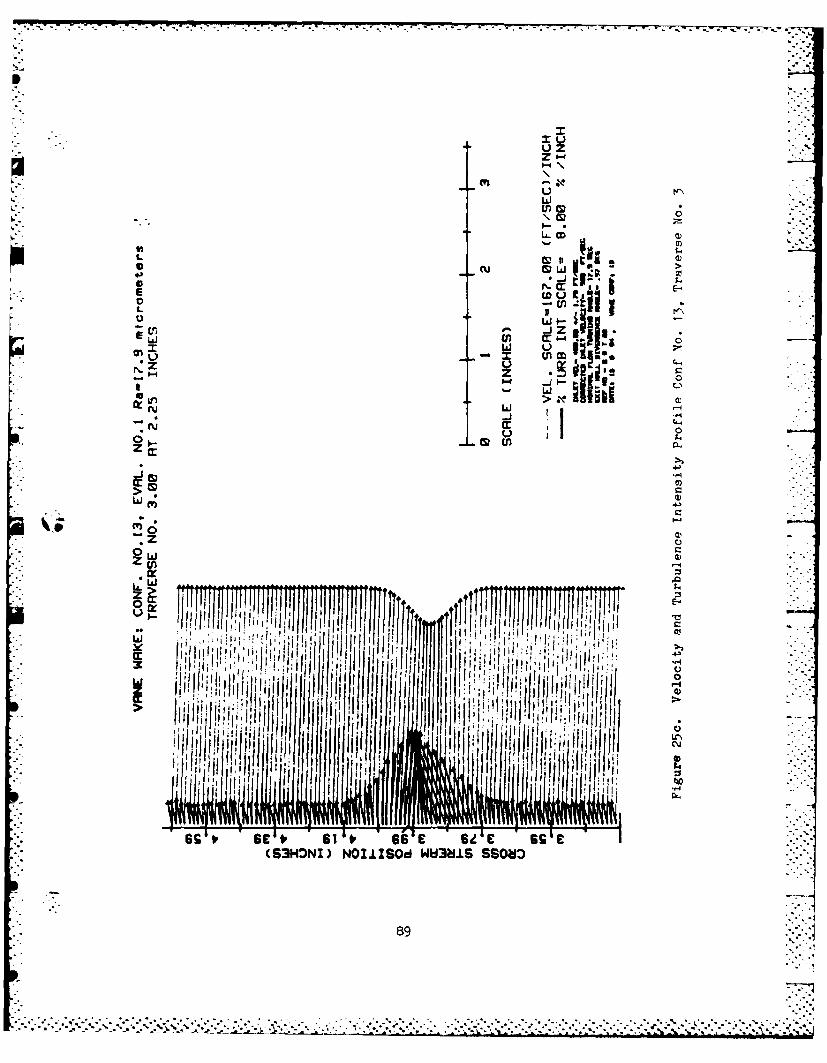
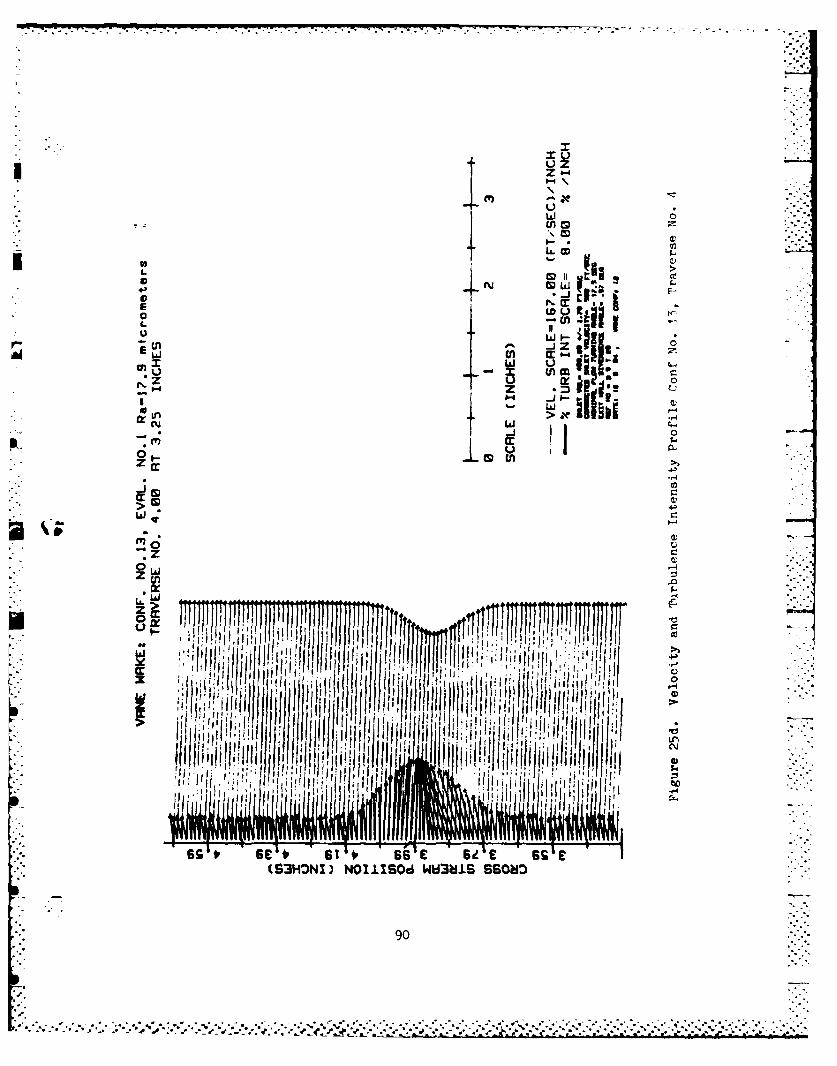
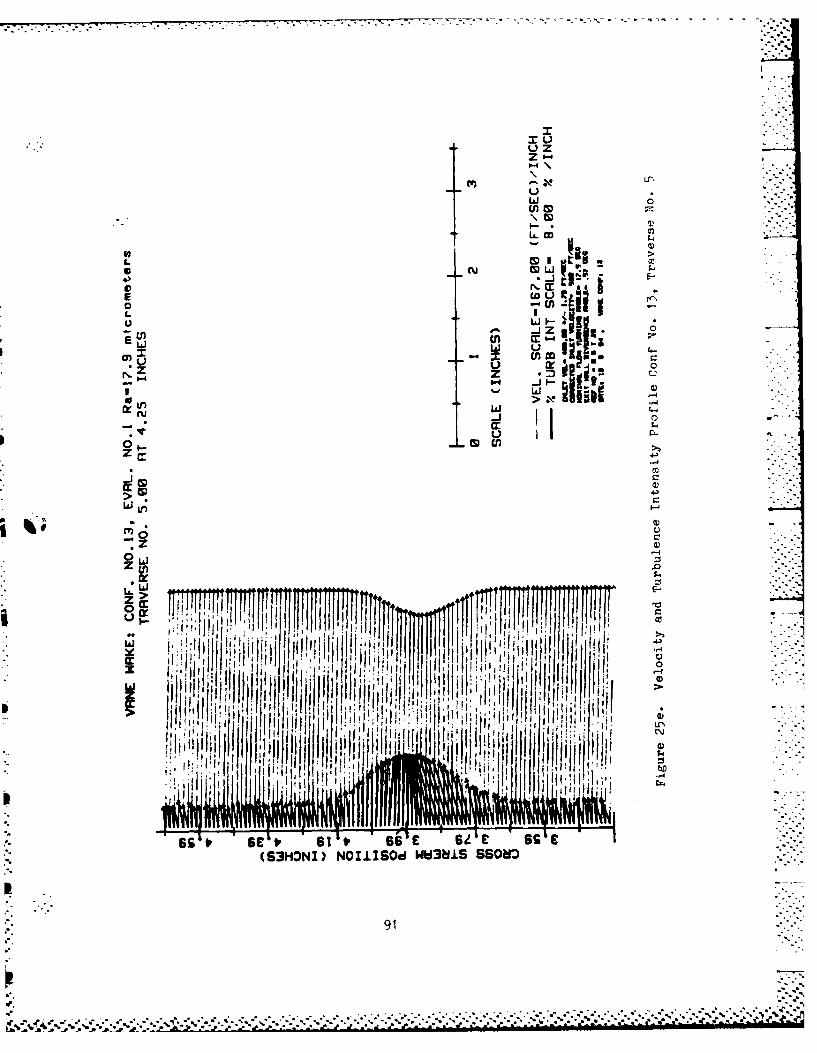
25. Velocity and Turbulence Intensity ProfileCon!f No. 13. .......................... 87
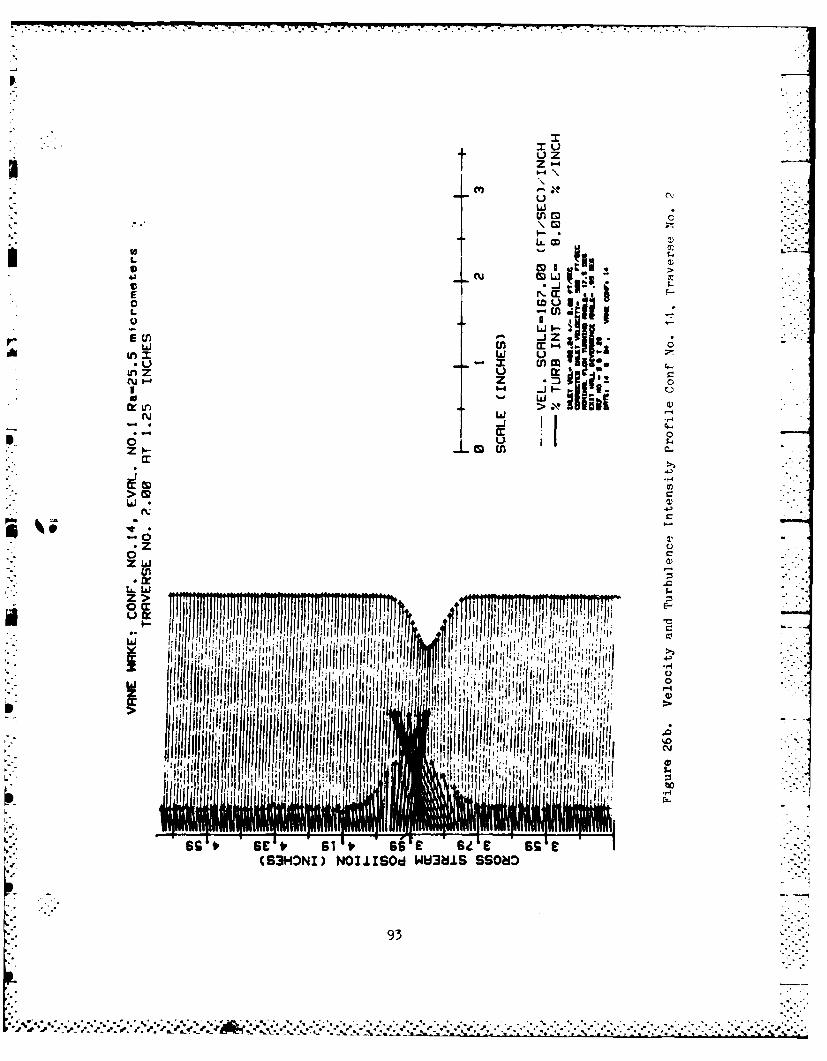
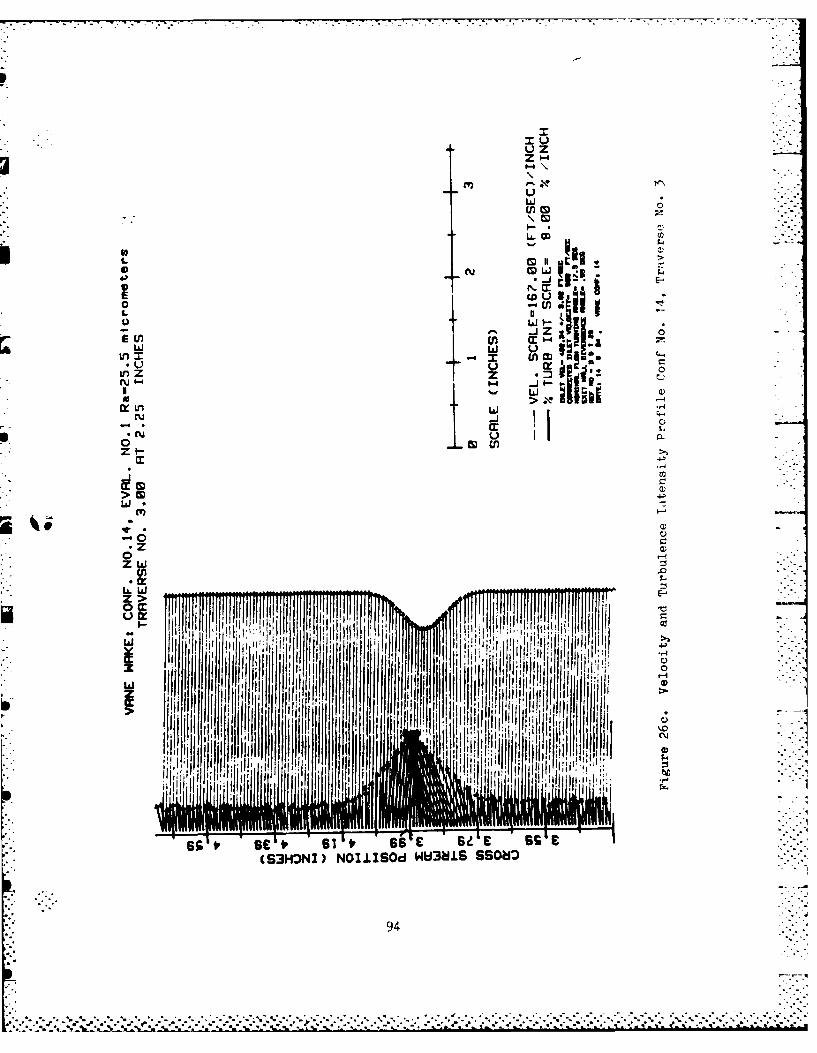
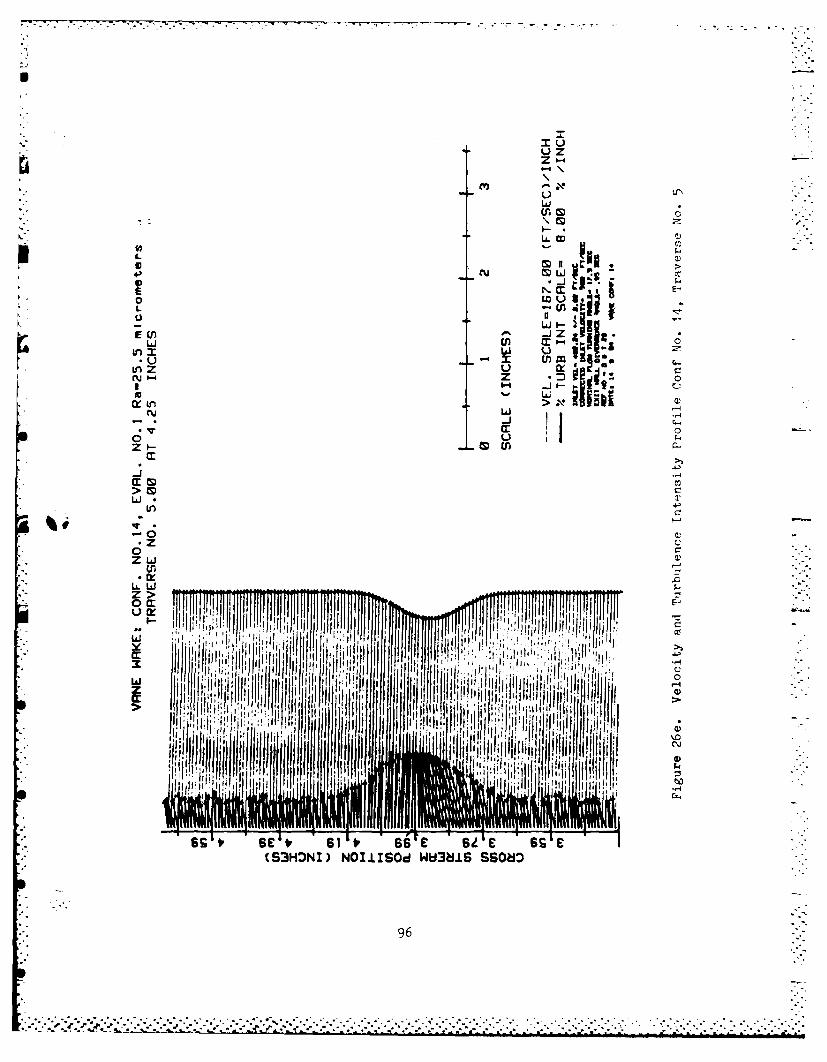
26. Velocity and Turbulence Intensity ProfileConf No. 14. .......................... 92
iv
* -. .. .. . . . ..- ' _ . . ..--
• - - - - - . . . r .
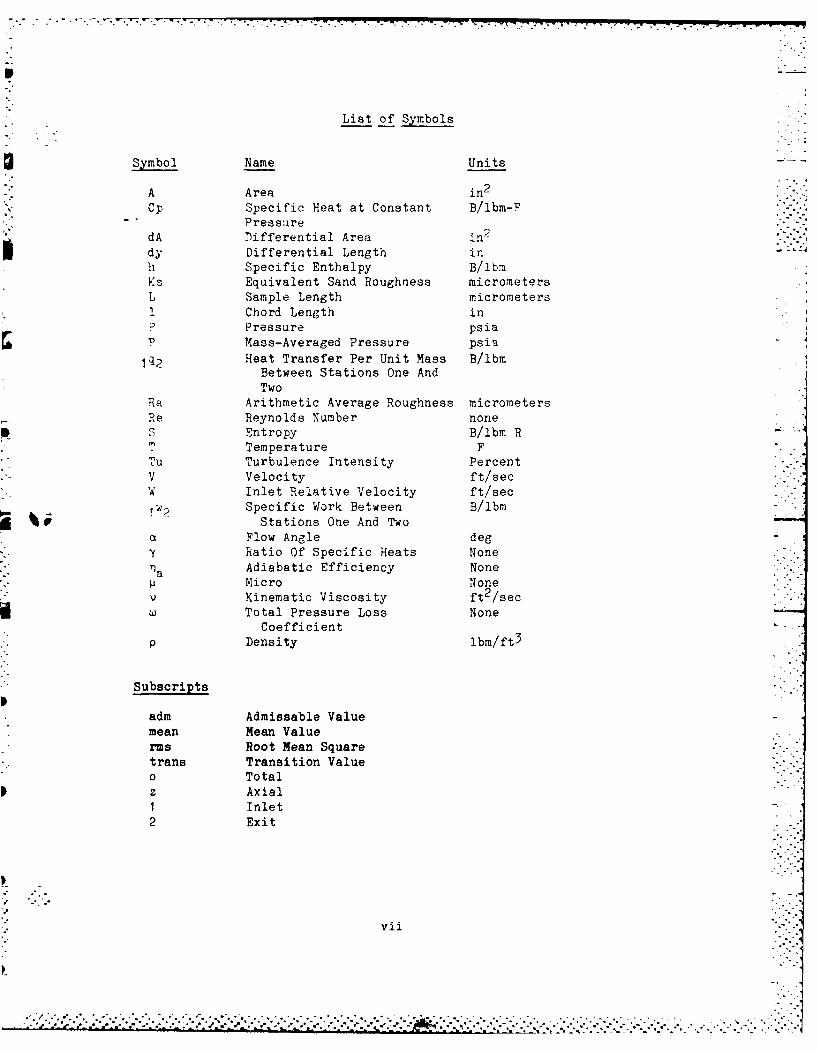
List of Symbols
Symbol Name Units
A Area in2
Cp Specific Heat at Constant B/lbm-F" - Pressure
dA Differential Area in2
dy Differential Length in - -1 Specific Enthalpy B/ibm
Ks Equivalent Sand Roughness micrometersL Sample Length micrometers
I Chord Length inP Pressure psia
P Mass-Averaged Pressure psia -
02 Heat Transfer Per Unit Mass B/ibmBetween Stations One AndTwo
Ra Arithmetic Average Roughness micrometersRe Reynolds Number none3 Entropy B/ibm R
T Temperature FTu Turbulence Intensity PercentV Velocity ft/secW Inlet Relative Velocity ft/seclw2 Specific Work Between B/ibmi%p
Stations One And Twoa Flow Angle deg
Ratio Of Specific Heats None
na Adiabatic Efficiency NoneMicro None
v Kinematic Viscosity ft2/secTotal Pressure Loss None
CoefficientDensity ibm/ft3
Subscripts
adm Admissable Valuemean Mean Valuerms Root Mean Squaretrans Transition Valueo Total
z Axial1 Inlet2 Exit
vii

Superscripts
Isentropic Value
Acronymsi
AFIT Air Force Institute of TechnologyAV DR Axial Velocity Density RatioCTF Cascade Test FacilityHP Hewlett PackardNACA National Advisory Coimmittee on AeronauticsTSI Thermo Systems International
viii
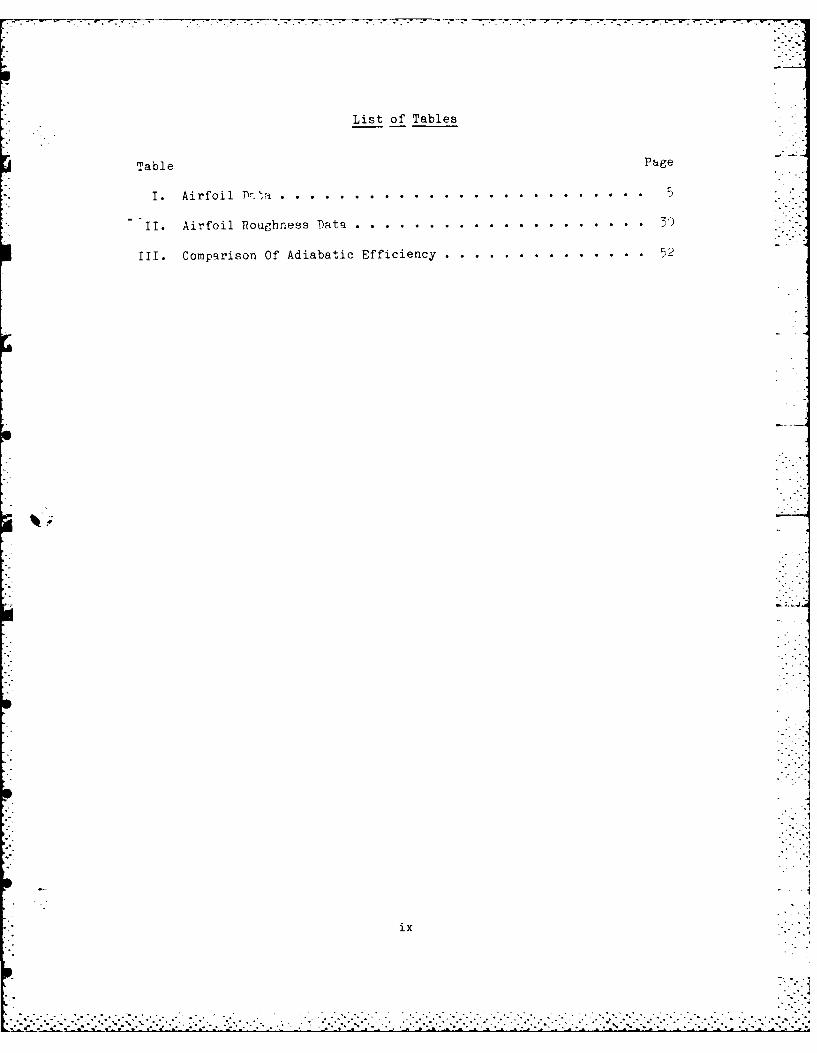
List of Tables
Table Pg
I. Airfoil D ............... . . . .. .. .. .. .............
II. Airfoil Roughness D~ata. ................. .. .. .
III. Comparison Of Adiabatic Efficiency. .............. 2
ix

Abstract
A cascade test facility has been established which incorporates
sidewall boundary layer control, permitting two-dimensional flow
investigation over the center span (about 2/3 the width of the blade) )f
an airfoil in cascade, and an investigation has been conducted to
deternine the influence of roughness on the airfoil. Two representativte
compressor profiles, the NACA 64-A905 and 65-A506, with two inch chords
and aspect ratios of one were tested at airflow inlet velocities
comparable to those in axial flow compressors. An Axial Velocity
Density Ratio of unity was the criterion used to determine when two-
dimensional flow was achieved.
Test results indicate that initial small increases of roughness
have a much greater effect on blade total pressure loss than do
subsequent larger roughness values. A small increase in roughness-
produces a substantial increase in free stream turbulence with
practically no effect on the wake. Further increase in roughness
produces a substantial effect on the wake but little effect on the free
stream turbulence. Surface roughness is shown to have a much greater
influence on blade wake turbulence intensity for the higher camber
airfoils tested than for lower camber airfoils.
x
--..... *.d. .. . .
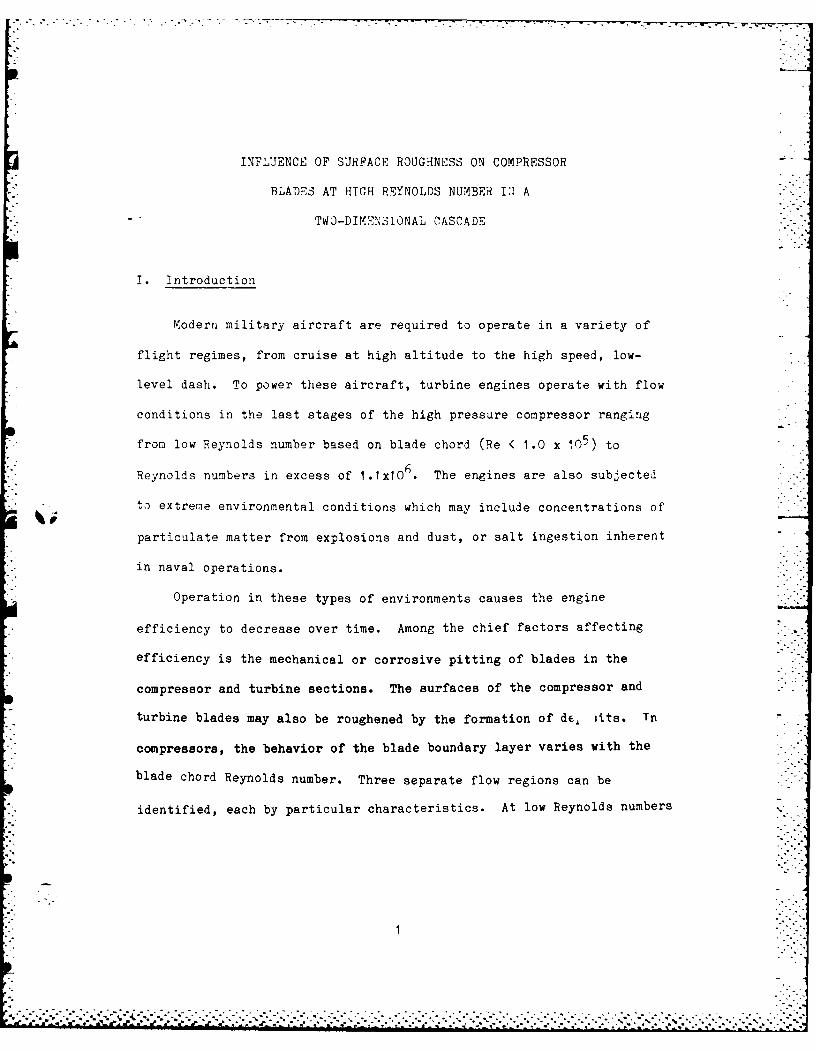
INFLUENCE OF SURFACE ROUGHNESS ON COMPRESSOR
BLADES AT HIGH REYNOLDS NUMBER IN A
TWO-DIMENSIONAL CASCADE
I. Introduction
Modern military aircraft are required to operate in a variety of
flight regimes, from cruise at high altitude to the high speed, low-
level dash. To power these aircraft, turbine engines operate with flow
conditions in the last stages of the high pressure compressor ranging
from low Reynolds number based on blade chord (Re < 1.0 x .O5 ) to
Reynolds numbers in excess of 1.1x10 6 The engines are also subjected
to extreme environmental conditions which may include concentrations of
particulate matter from explosions and dust, or salt ingestion inherent
in naval operations.
Operation in these types of environments causes the engine
efficiency to decrease over time. Among the chief factors affecting
efficiency is the mechanical or corrosive pitting of blades in the
compressor and turbine sections. The surfaces of the compressor and
turbine blades may also be roughened by the formation of de, its. Tn
compressors, the behavior of the blade boundary layer varies with the
blade chord Reynolds number. Three separate flow regions can be
identified, each by particular characteristics. At low Reynolds numbers

(Re < 1.0 x 10⁵) the boundary layer is laminar and is much more prone to
separation in an adverse pressure gradient than the turbulent boundary
layer. Large losses accompany the laminar separation (Ref. 3).
Schaffler, in his study of surface roughness effects on axial flow
compressors, described the boundary layer in the intermediate range of
Reynolds numbers (based on blade chord) as being turbulent over much of
the blade and the surface as hydrodynamically smooth (Ref. 11). That
is, the boundary layer over the blade begins as laminar, but in a short
distance transitions to turbulent with the peaks of the roughness
totally submerged in the laminar sublayer of the turbulent boundary ""
layer. The blade losses are proportional to Reynolds number raised to an
appropriate power which depends on camber and incidence (Ref 15:150).
At high Reynolds numbers the boundary layer is turbulent and the peaks
of the roughness may be high enough to protrude through the laminar
sublayer making the blade surface hydrodynamically rough. Blade losses
in this range do not depend on chord Reynolds number but are a function
of the roughness itself (Ref 11:9). Fottner and Schaffler report that
"increasing pressure ratios and flow velocities in modern gas turbine
compressors increase the Reynolds Number over chord length ratio at the
back end of the compression system to an extent that even with the best
presently available manufacturing methods, noticeable losses of
potentially achievable efficiency gains must be accepted." (Ref. 5:171)
This investigation was primarily concerned with the high Reynolds
number flow regime (Re > 4 x 10⁵). The work was conducted in a two-
dimensional cascade test facility used for testing compressor and
turbine airfoils. Research began in 1981 with several investigators
2
studying roughness effects in cascade flow (Ref. 6,14,17). The results
of those previous experiments were overshadowed by the solid endwall/
blade boundary layer interaction to the extent that two-dimensional
flow was not established.
Objective and Scope
The objectives of this investigation were twofold.
1. Establish a facility that would permit two-dimensional flow
investigations of a cascade of compressor blades.2. Determine the effect of surface roughness on blade losses
using a non-dimensional total pressure loss coefficient to characterize
the effect.
To accomplish these objectives a sidewall boundary layer control
system was built and installed on the cascade test section to reduce
secondary flow and airfoil/sidewall boundary layer interaction to the
degree that two-dimensional flow is attained. Total pressure surveys
were made in the exit plane to evaluate the effectiveness of the
boundary layer control. Once two-dimensional flow was established, exit
wake surveys were run on smooth and roughened blades to determine flow
losses due to roughness through the test section. A non-dimensional
total pressure loss parameter was used as a measure of the losses.
Average Blade Roughness, Ra, and Equivalent Sand Roughness, Ks, were
used in this investigation to characterize the blade surfaces. The
roughness parameters are defined in Appendix A.
• L-[
".3 .
iI. Experimental Apparatus
The investigation of effects of blade roughness on compressor blade
cascade performance was conducted in the Cascade Test Facility (CTF) at
-the Air Force Institute of Technology Aeronautics Laboratory. The
system, which is described in detail by Allison (Ref. 1), is a cascade
wind tunnel with a computerized data acquisition system. A brief
description follows along with modifications made specifically for this
research.
Cascade Test Facility
The cascade test facility is built around a two-inch by eight-inch
test section containing seven airfoils. The flow unit Reynolds number
based on blade chord and inlet velocity is in excess of two million per
foot. A suction system has been added to control the boundary layer
within the test section by drawing off the sidewall boundary layer prior
to, and throughout, the blade row.
To run the CTF, source air is supplied by a blower rated at 3000
cfm with a discharge head of 26 ounces. Cool air is drawn in from the
outside and mixed with warmer recirculated air to stabilize operating
temperatures. Particles which may damage a hot film sensor are trapped
by a series of fiber and electrostatic filters ahead of the blower and
in the stilling chamber.
After passing through the blower the airflow is straightened and
conditioned by several screens and a honeycomb lattice located in the -
stilling chamber. This system provides air to the test section with
turbulence intensities of generally less than one percent.
4
j,,'." .- ...... ,.. , -' -'-'%', .. . .. ..,-.. .. .o .. -....-...-, . .. . . .o.. -... °... . . -.. '. - ... . . -.

Test Section
The two dimensional cascade test section used in the present
investigation is shown in Figure 1. Two different sets of airfoils were
studied. The first was a cascade containing seven NACA 64-A905 airfoils
(including the two that form the end walls) with a two-inch chord and
aspect ratio of 1.0. A second test section had seven NACA 65-A506
airfoils installed also with a two-inch chord and aspect ratio of 1.0.
The profile of the NACA 64-A905 blade is similar to that of a compressor
exit guide vane while the NACA 65-A506 profile approximates that of a
blade in the latter stages of a high pressure compressor. The
parameters describing the two test sections are listed in Table I.
TABLE I
Airfoil Data
Airfoil NACA 64-A905 NACA 65-A506
Chord 2 in 2 in
Aspect Ratio 1.0 1.0Row Inlet Angle 31 deg 31 degAngle of Attack 25 deg 13 degStagger Angle 6 deg 18 degTurning Angle 33 deg 18 deg
A blade spacing of 1.333 inches was used in each test section. With
these dimensions the solidity, defined as
solidity = chord/spacing (I)
was 1.5.
5.. ., ." .
1110,AA
V -.
U) -0 0

Blade Roughness Configurations
The two different airfoil shapes tesed for roughness effects are
shown in Figure 2. Tanis (Ref. 14) determined that suction side
roughness on the first quarter chord had the greatest influence on the
efficiency of the cascade since the roughness magnitude relative to the
local boundary layer was greatest near the leading edge. For this
reason several sets of airfoils were roughened on the suction side by
either sand blasting or applying various sizes of grit to the first
quarter chord.
The blades were cast from Fiber-Resin FR-44 casting resin using the
5595 cure, then aged at an elevated temperature to increase the
resistance to bending in the airflow. Some of the blades were then
sandblasted to the desired roughness. The others were coated with a
thin film of ceramic acrylic sealer and carborundum grit was blown on.
A final coating of acrylic sealer was then applied to these blades.
Much care had to be taken not to alter the shape of the leading edge.
After the blades were modifier', a Rank Taylor Hobson Surtonic 3
profilometer with recorder and parameter units attached was used to
measure roughness values of Ra (Ref. 15). The roughened surface, though
very uniform, was measured at several locations and the average of these
measurements was recorded as characterizing the roughness.
7

NRCR 64-R905 NRCR 65-R506
Figure 2: Test Blade Profiles
Boundary Layer Control Mechanism
Several investigators have used a combination of an upstream
suction slot and sidewalls which were porous across the blade row to
effect boundary layer control (Ref. 2, 4). For this investigation a
continuous porous sidewall which extended from at least one-half chord
up stream to just past the trailing edges of the blades was added to the
cascade test section (see Figure 1). With this system the boundary
layer can be continuously drawn off from the sidewalls before reaching
the blades and also throughout the blade passage.
One sixteenth-inch thick metallic walls of Pall corporation PSS
316L Porous Stainless Steel were used. This particular material is
normally used in filtering applications and is capable of trapping
particles 11 micrometers in size. Because of the dense construction,
the porous stainless steel provided adequate flow resistance to give
uniform suction flow in the blade passages.
p8
__.
. . . . ... o....... . . . ........ .. •.o. ... •..................

-.. 7 .7 N
Panels of perforated plexiglass backing supported the porous
sidewalls. The rest of the boundary layer control mechanism consisted
of two aluminum manifolds, one on each side of the test section, and an
industrial vacuum cleaner with a measured flow rate capacity of about 60
cfm tnrough the sidewall suction system. This is about 4.3 lbm/min mas3
flow at 110 F.
Test Section Exit Diffuser
A 13-inch channel with adjustable endwalls was incorporated into
the test section to enable simulation of either nozzle, diffuser, or
neutral exit conditions. Static pressure taps in the endwalls and
sidewalls were used to determine when the exit channel was set in the
?roper configuration. Since an ambient exit pressure was desired, the
endwalls were adjusted until all pressure readings were essentially
j %, atmospheric. Additional static pressure taps were located in the test
section inlet throat to aid in positioning the endwalls for uniform flow
conditions and for measuring inlet velocity.
X-Y Traversing Mechanism
A computer controlled traversing mechanism which is described in
Ref. 14 was used to position the hot film anemometer sensor in the exit
flow. The traverser would locate the probe at any downstream (X) or
crosstream (Y) point with an accuracy of 0.002-inch in the X direction
and 0.001-inch in the Y direction. Locating the probe in the spanwise
(Z) direction was accomplished manually by using a thumb screw and dial
indicator. For this investigation a normal run would include five
traverses in the Y direction at 1-inch intervals along the X direction.
9
. .
• . --
.. * ~ *- -* * .-* * *. -. * *. ~ - *-......... . . .

The data window began at 0.25-inch behind the blade and contained 133
data points in each traverse. These points were spaced 0.01-inch apart
and began 0.6-inch below the center blade. In this way good resolution
was achieved across the 1.333-inch blade spacing. All data were taken
on the blade centerline except that taken to determine quality of flow
in the test section.
Instrumentation
The AFIT Cascade Test Facility is instrumented with a variety of
devices. Fifteen 30-inch U-tube manometers, four Statham Laboratories
P6TC-2D-350 pressure transducers, a hot film X-wire anemometer sensor,
and two "T-type" thermocouples are all used to monitor the system. _
Manometers were used for balancing the test section and setting the
suction flow. Tank total, throat and exit static, and ambient pressure
j% were measured by pressure transducers. The tank total temperature and
ambient temperature were measured by the thermocouples. The hot film
anemometer system was composed of a TSI model 1241-10 X-wire sensor
operated by two TSI model 1050 constant temperature anemometers. The
system measured both the mean and fluctuating velocity components in the
X and Y directions. From this information the turbulence intensity and
exit flow velocity was obtained.
The hot film sensor was calibrated using a scheme designed to
account for the effect of elevated temperatures. This scheme permitted
representing all calibration data for a particular sensor in the
temperature range of interest with a single curve as shown in figure 3.
A detailed description is given by Tanis (Ref. 14). Sensor error of
less than one percent was obtained with the calibration. However, when
10
. .. ". .
. . . . .. . . . . . . . . . . . . . . . . .

- ~~~~~ ~C 4- Li - -- - -~ .-- rr
*?
InS
i cS L :; ! , 0l~ 1 LXL.JWn
- .1'IS
4k <
CD
Za* -1iw ) *O isn
the sensor was used in the test apparatus the measured velocity was
approximately five to seven percent greater than theoretically possible.
The factors causing the increase are thought to be differences in flow
humidity and probe support temperature between the calibration station
and the test apparatus. To correct the velocity, continuity between two
centerline planes located upstream and downstream of the blade row was
used. The planes spanned the streamlines defining the channel between
the two center blades of the cascade. The flow was two-dimensional
through the cascade and, therefore, assumed uniform along the midapan of
the blade. Inlet and exit mass flow rates were calculated from measured
data. A comparison of the two was made and a correction factor, if
required, applied to the exit velocity to maintain continuity through
the cascade. Using this method, accuracies on the order of 99 percent
were achieved.
Data Acquisition and Analysis System
The heart of the CTF is the data acquisition system controlled by
an HP 9845B computer (Ref. 1). By using the appropriate software an
investigator can specify the number and location of data points to be
taken. The system positions the hot film probe at the desired positions
and records the pertinent data (all pressures, temperatures, and
anemometer readings). This data is then stored as voltages on magnetic
disks. Subsequently, a data reduction program is used to convert the
m data into a useful form of pressures, temperatures and velocities, and
again store the information on magnetic disks. The data in this form is
then used to evaluate the various performance parameters.
12
I II. Procedure
The general thrust of this investigation was to determine the
effects of surface roughness on compressor blade performance in a two-
dimensional cascade. To accomplish this, boundary layer control was
incorporated in order to establish two-dimensional flow in the tect
section. This flow control was determined to be necessary as a result
of a series of baseline test runs made in effort to reproduce data
already taken from the NACA 64-A905 airfoils (Ref. 17).
Testing Procedure
I~n setting the test conditions, the sequence of actions was as
follows: when the airflow through the test section reached the
operating condition (115 degrees F < Tol < 120 degrees F), endwalls were
adjusted until wall static pressure was ambient and uniform parallel to
the cascade exit flow direction. A check was also made for uniform
pressure across the inlet throat. The establishment of uniform pressure
across the throat along with a stabilized temperature insured that
uniform flow conditions existed upstream of the blade cascade. Once the
test section was balanced, the measured turning angle was determined
with the use of a protractor. A total pressure survey was subsequently
made vertically across the exit channel of one blade at the 0.63 chord
point downstream from the trailing edge. The survey consisted of 13
total pressure readings made with a pitot tube oriented parallel to the
mean flow. The arithmetic average of the exit total pressure was used
to calculate the outlet velocity, which was subsequently employed in
p D
13
determining the flow conditions. The hot film sensor was then installed
and adjusted for the particular measured turning angle. A test,
containing 665 data points, was then run.
After completing the series of test runs on smooth blades witholt
suction, boundary layer control was then used. Abbreviated runs were
made at several suction rates to determine when two-dimensional flow was
achieved. When two-dimensional flow was established, the blades were
tested for the effects of surface roughness. Five traverses at one-inch
intervals in the axial direction were made with 133 data positions in
each traverse. The data were stored on magnetic disk then later reduced
and analysed.
7-
14
14 ""
.'-'.-'.".-'..'.'.','~~~~~. . . '..''''-... . .... .. .... ,. '...' . ....,.-.,.-.,- ,......... . . .. .. .-.- '"
IV. Results and Discussion
The objectives of this study were to modify the cascade test
section to give two-dimensional flow and to determine the effects of
-surface roughness on the efficiency, expressed as the total pressure
loss coefficient, j, of an airfoil in cascade. Two different test
sections were used; each had porous sidewalls for boundary layer control
and one had a set of solid sidewalls for comparing results without
suction to those with the suction applied.
Loss Coefficient
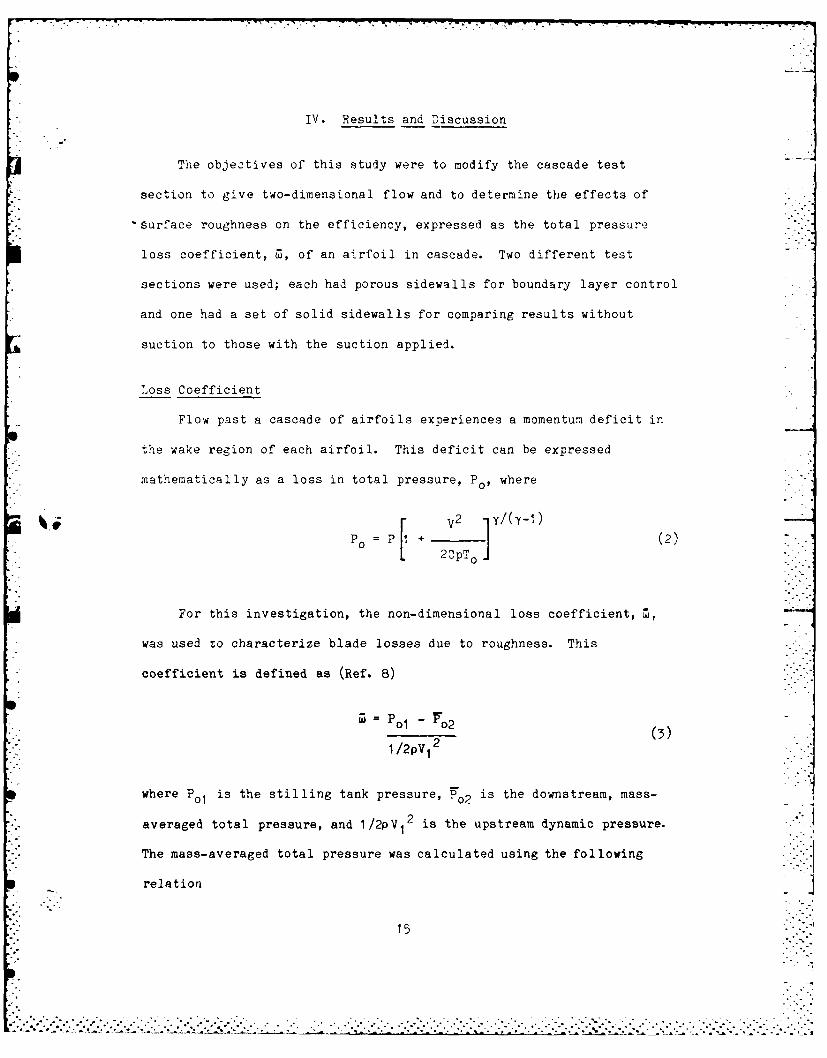
Flow past a cascade of airfoils experiences a momentum deficit in
the wake region of each airfoil. This deficit can be expressed
mathematically as a loss in total pressure, Pop where
Po= + (2)
For this investigation, the non-dimensional loss coefficient, M,
was used to characterize blade losses due to roughness. This
coefficient is defined as (Ref. 8)
P - To2 )
1/2PV12
where P is the stilling tank pressure, Po2 is the downstream, mass-
averaged total pressure, and 1/2PV 1 2 is the upstream dynamic pressure.
The mass-averaged total pressure was calculated using the following
relation
15
' *. j. ... .."•*> j•
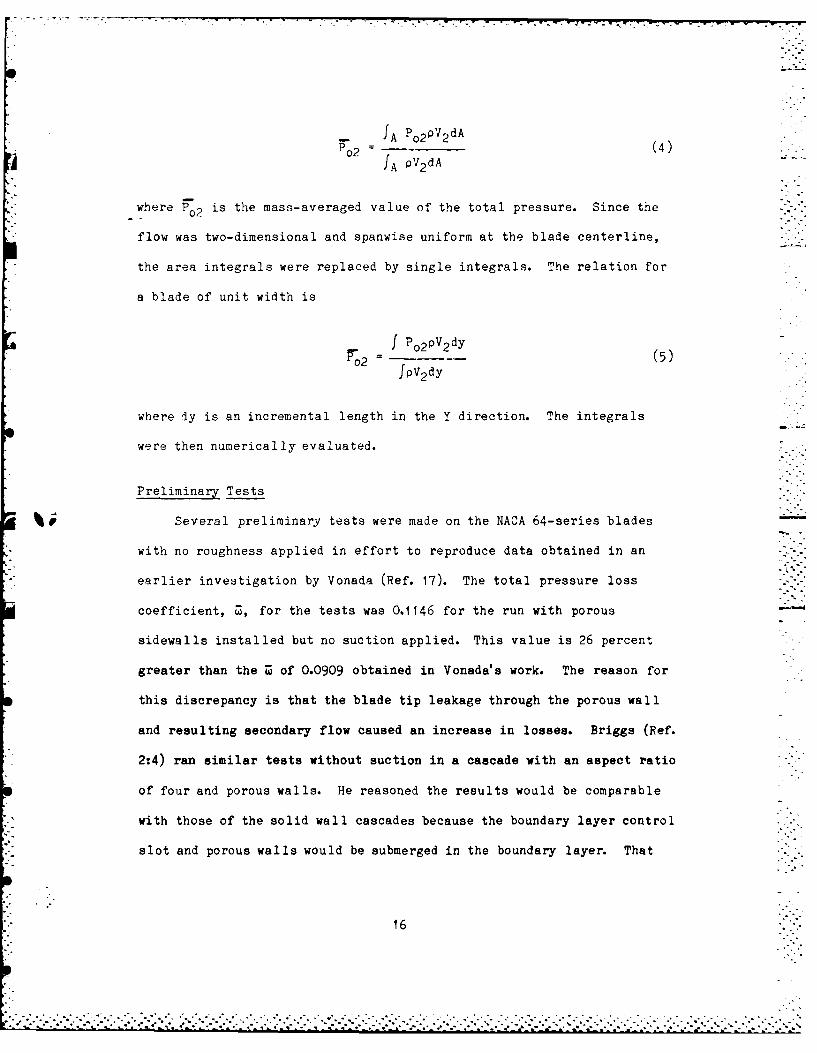
- A Po2PV 2 dAPo2= (4)
JA PV2dA
where Po2 is the mass-averaged value of the total pressure. Since the
flow was two-dimensional and spanwise uniform at the blade centerline,
the area integrals were replaced by single integrals. The relation for
a blade of unit width is
f Po2 P V2 dy
o2 -(5)Jpv 2dy
where dy is an incremental length in the Y direction. The integrals
were then numerically evaluated.
Preliminary Tests
Several preliminary tests were made on the NACA 64-series blades
with no roughness applied in effort to reproduce data obtained in an
earlier investigation by Vonada (Ref. 17). The total pressure loss
coefficient, 7, for the tests was 0.1146 for the run with porous
sidewalls installed but no suction applied. This value is 26 percent
greater than the M of 0.0909 obtained in Vonada's work. The reason for
this discrepancy is that the blade tip leakage through the porous wall
and resulting secondary flow caused an increase in losses. Briggs (Ref.
2:4) ran similar tests without suction in a cascade with an aspect ratio
of four and porous walls. He reasoned the results would be comparable
with those of the solid wall cascades because the boundary layer control
slot and porous walls would be submerged in the boundary layer. That
16
.. . . ° . ...... ° .... ,. . .................... . . •.... .
does not hold true for cascades with an aspect ratio of one because of
the greater influence the wall/blade boundary layer interaction has on
the centerline flow conditions.
-Establishing Two-Dimensional Flow
A series of tests were run on smooth NACA 65-series blades in order
to establish the required suction for two-dimensional flow and determine
the effects of suction on the flow. In order to be useful for
engineering purposes, cascade data taken from several sources using the
same flow conditions must be comparable. It is not uncommon for the
data to differ from those of similar cascade tunnels which ran tests
under nearly identical geometric settings. Physical characteristics of
the different wind tunnels, such as aspect ratio and turbulence
intensity, account for these differences in data (Ref. 2:2).
To give a common reference point at which cascade data is obtained, -
several criteria have been established. Erwin and Emery (Ref. 4)
reported that the experimental pressure rise from existing cascades was
usually substantially smaller than the value which theoretically
corresponded to the measured turning angle. They also found
disagreement between values of lift coefficients obtained from
integrated experimental pressure distribution plots and those derived
from the measured turning angle. As a result of such discrepancies,
criteria for two-dimensional flow were given. A partial list follows:
1) Equal pressures, velocities, and directions exist at
different spanwise positions.
17
2) The static pressure rise across the cascade equals the
value associated with the measured turning angle and
wake.
3) No region of low-energy flow other than the blade wakes
exist and the wakes are constant in the spanwise
direction.
An additional condition which must be met is an Axial Velocity
Density Ratio (AVDR) of unity (Ref. 2, 13). Axial Velocity Density
Ratio is defined as
P2 Vz2AVDR = (6)
P1 VZ1
where
lvZI = Vlcosa ! and Vz2 = V2 coscz2
According to Briggs (Ref. 2) irrotational, momentum, and continuity
conditions may be used to determine the deviation of the flow from two-
dimensional. He also suggested that due to complexity and time
constraints, satisfying continuity, that is, an AVDR of unity, on the
tunnel centerline would be sufficient to establish two-dimensionality in
a compressible flow.
A value of AVDR greater than unity is indicated when the flow is
not two-dimensional. It is believed that interaction of the sidewall
and test blade boundary layers causes premature separation at the wall-
blade junction producing a large low energy region. This large wake
causes a restricting of the flow and increases the exit velocity. With
18
sidewall suction applied the boundary layer is drawn off and the passaC
convergence is reduced. When AVDR =1, two-dimensionality exists.
Scholz (Ref. 13) gave a somewhat broader definition applicable to
compressor units, where 0.3<AVlR<1.2 defined a "quasi-tw-dimensional"
flow.
For this study, the amount of air removed by the suction system was
a fairly constant 2.4 percent of the total inlet air. The range of
values for other comparable tunnel cascade systems varies from 1.2
percent (Ref. 10) to 9 percent (Ref. 2). The AVDR measurements varied
from 1.01 to 1.013 with suction applied. With no suction the values
were generally about five percent larger. Although the magnitude of the
change is not large, the flow improvements through boundary layer
control were substantial.
Two-Dlimensional Flow and Blade Profile Efficiency. An additional
check of the flow two-dimensionality was made in this study by comparing,
the blade adiabatic efficiency obtained from cascade test results
against blade profile losses. According to Vincent (Ref. 16) blade
profile losses are about ten percent. Thus, if the flow in a cascade is
actually two-dimensional, losses due to blade tip leakage or wall-blade
interaction should be minimal, giving a blade profile efficiency on the
order of 90 percent.
The blade adiabatic efficiency is defined as
h2 -i
na h 2 h
19

where h1 is the upstream static enthalpy, h2 is the actual downstream
static enthalpy, and h., is the downstream static enthalpy resulting
fron isentropic compression for the same pressure rise. For this study,
the results indicated an increase in adiabatic efficiency from 0.727
without boundary layer control to 0.894 with boundary layer control
applied. A detailed explanation is given in Appendix B.
Non-Dimensional Total Pressure Loss Maps. Exit plane surveys, from
which the local total pressures were calculated were made at a distance
of 0.63 chord downstream of the blades to evaluate the losses through
the blade passage. Figures 4 and 5 present lines of constant value of
j in percent for the NACA 65-series airfoils for three channels between
blades. Figure 4 is for the test section with solid sidewalls and no
suction applied and Figure 5 is for the same blade configuration but
with boundary layer control in use. The effect of boundary layer
control may be seen by a comparison of these two figures.
In each figure the horizontal axis represents the half-channel
spanwise position in inches from the test section wall. The physical
limit of the measuring probe was 0.125 inches from the wall. The
vertical axis depicts the channel position between two blades in percent
of channel height. Zero percent represents the pressure surface and 100
percent the suction surface.
A comparison of Figures 4 and 5 shows that for the flow with
boundary layer suction the overall magnitude of losses is significantly
smaller than for the section without suction. Two of the criteria
mentioned by Erwin and Emery for two-dimensional flow were that no
region of low energy flow other than the blade wake existed, and that
20

7-77 'MVw/
I'i Q) V.-
i/I, ccm
nil Hail/
IH Lf E C.,
L.1M
I0 u
Z1) Lii CI 1 u 2
'Ij
o iio~4j
4- 0In C) 4
NOL:d ~NH
z2
0 D r
* ~ ~~~~~~ Q .*'**)-- - ..
. . . . . . . . . . . . . . . . . . . .. . a . .
. . . . . . . .. . . . . . . . . . . .. . . . . . . . . . . . . . . . . . . . . . .. . . . .

LA'A
.-
0 , 1U 1 -
U7
C~L
U) r- = . . .
0 EO
D a):1 0
- II,* ~I aiii -
~;*;; m
26 28 H!9 9 ip 2' Z' 2 0NOISd 3NH
* 22
WIW
n
a AV
UC.
Lnc08. *z~i~~ i-
I .. -
I,0 cc,-
C) .. 4
.4.)
LiW W
LJ 0
4
06' 09* OZ 09* OG 00' OC2 02' 01 0
NOI.LISOd 13NNUHD
23
T' -. '
HI 6n
- I..-
M. 0ZI~~~i 0H~/1~-I~~~~r a. .N~-
I/I, ~ ~LiH~t 1(1
iL > -
/ ~ CC
7 z
NOIIS' 13NNWH
H24
-V. - - -. . . . .
U,
C;
IL.
Lii0-1,
II I/ 4-zi ' ~ ~-I EL~,iI I
2/ J
06 1' 08 0 9 O* 0 E 0'0 0
NOIIIS~~d -11HU:
25i

In
CI Ii -,
rz
zz
-4E
Lr) Ir.j
z
0 Lf
CL
InL 0 4-'u~n. a.
-j 0c
- I,
U) -4 H
z~
0 HI
06 as, oil 09, 0 00,* 020 01, 00NOIIISOd 13NNWHD
26
U,
Ln-J
I V
I rrL
N4
0 anLL. I
= Z.
0~
o to
zmm06,~~~~ ~ ~ ~ ~ as V 0,aa, e e l 0
NOIII 13NWH
o 27
the wake be constant in the spanwise direction. One can see by
inspection ofthe solid wall plots (Figure 4) that this is not the case. -,
There are larger areas of loss and substantial differences in the losses
from blade to blade (Figures 4a, b, c). For the blade row with suction
(Figure 5), however, the areas with significant loss are small.
Moreover, the uniformity of the flow from one blade channel to another
is illustrated by the similarity of Figures 5a, b, and c.
Figure 6 shows the loss coefficient at the 0.63 chord exit plane
behind the NACA 64-series airfoils. This plot shows a larger area of
the channel with significant losses and larger loss magnitude. This is
due to the greater diffusion which results from a higher turning angle.
The higher flow turning angle gives rise to a steeper pressure gradient
leading to a thicker blade boundary layer at the trailing edge.
It should be noted that, whether or not boundary layer control is
used, there is a large region about the blade midspan (about two-thirds
blade width) where the flow is very uniform. However, with suction
applied, the large areas of undisturbed flow in both the 64-series and
65-series test sections had losses on the order of 1.5 to 3.0 percent,
while flow losses approached 7.5 percent in the section with solid
sidewalls, as indicated by the data in Appendix C. It is concluded
that, in accordance with the criteria given in References 2 and 4, and
from the results of this study, the test section with boundary layer
control applied is adequate for two-dimensional compressor blade cascade
studies.
28
* -.- '
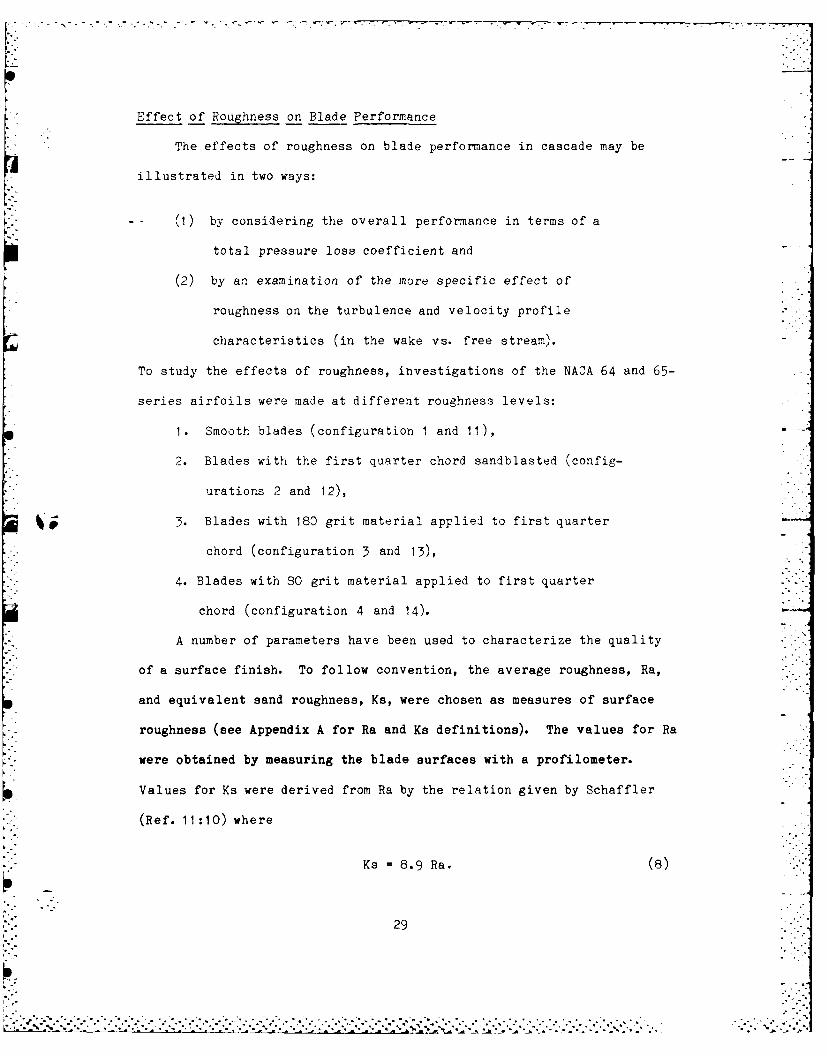
Effect of Roughness on Blade Performance
The effects of roughness on blade performance in cascade may be
illustrated in two ways:
(i) by considering the overall performance in terms of a
total pressure loss coefficient and
(2) by an examination of the more specific effect of
roughness on the turbulence and velocity profile
characteristics (in the wake vs. free stream).
To study the effects of roughness, investigations of the NACA 64 and 65-
series airfoils were made at different roughness levels:
1. Smooth blades (configuration 1 and 11),
2. Blades with the first quarter chord sandblasted (config-
urations 2 and 12),
3. Blades with 180 grit material applied to first quarter
chord (configuration 3 and 13),
4. Blades with 80 grit material applied to first quarter
chord (configuration 4 and 14).
A number of parameters have been used to characterize the quality
of a surface finish. To follow convention, the average roughness, Ra,
and equivalent sand roughness, Ks, were chosen as measures of surface
roughness (see Appendix A for Ra and Ks definitions). The values for Ra
were obtained by measuring the blade surfaces with a profilometer.
Values for Ks were derived from Ra by the relation given by Schaffler
(Ref. 11:10) where
Ks =8.9 Ra. (8)
29
!-........................... . . ....
=" - ' '-"'" ..... 'J'-', ' ' ' ',> " "-.° M"l'fl'L. t"i V& La " . La V." " ., -. -.- '. ' ,." " '""
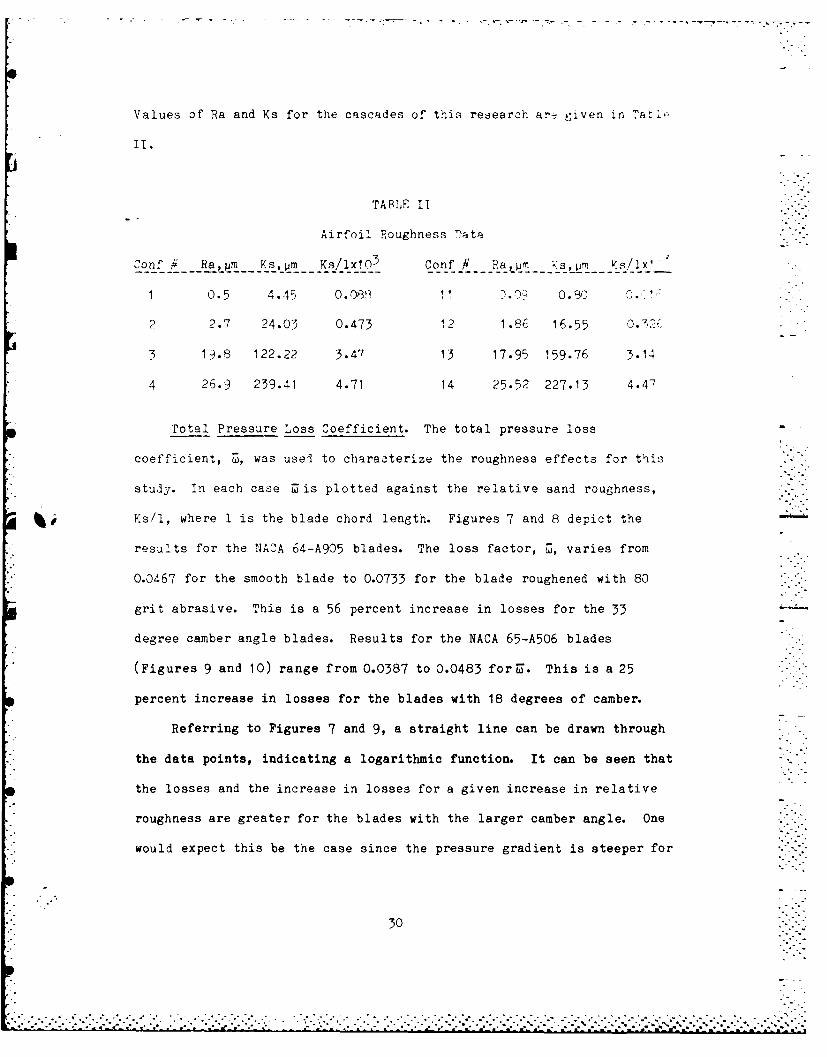
Values of Ra and Ks for the cascades of this research ar given in aA'
IT
TABLE II
Airfoil Roughness Data
Conf' i Ra,pm Ks,'jm Xs,/lx103 of1 a~r sjrl~/x
---- ---- II f- ---- '-'- - S
1 0.5 4.45 0.0199 1 D } • 09 0.90 •
2 2.7 24.03 0.473 12 1.86 16.55 0. 32,'
3 19.8 122.22 3.47 13 17.95 159.76 3.14
4 26.9 239.41 4.71 14 25.52 227.13 4.47
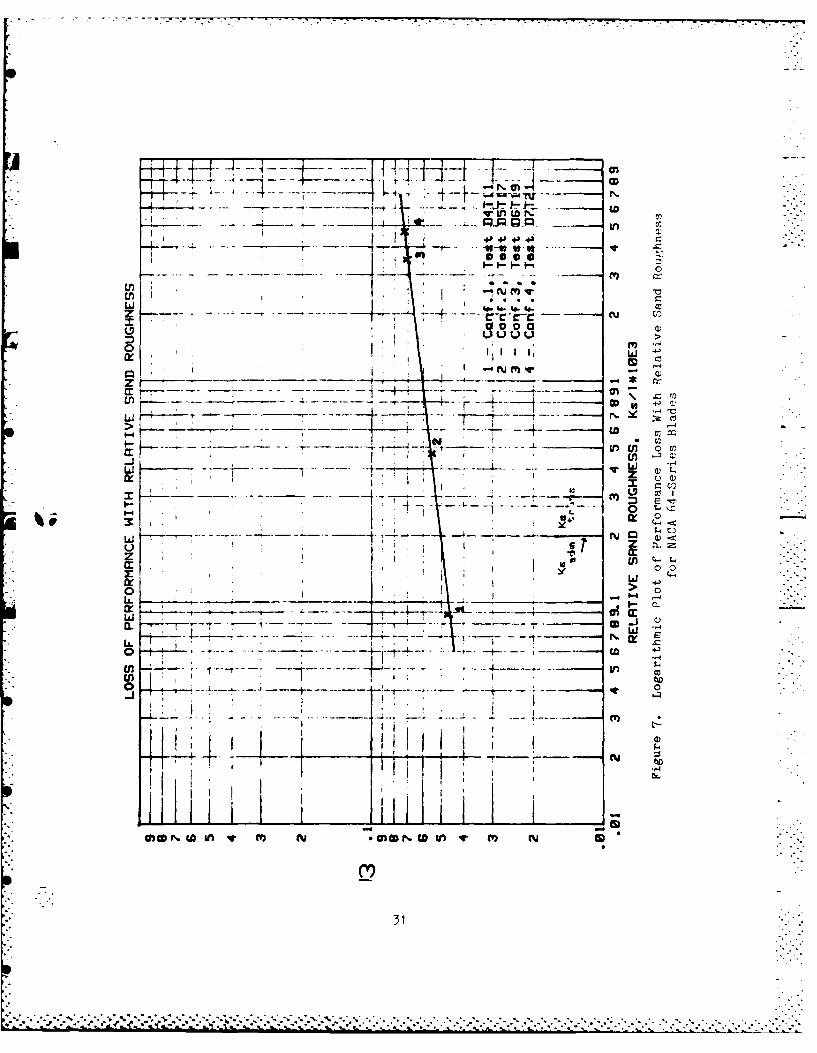
Total Pressure Loss Coefficient. The total pressure loss
coefficient, Z, was usei to characterize the roughness effects for this
study. In each case Zis plotted against the relative sand roughness, -:
Ks/l, where 1 is the blade chord length. Figures 7 and 8 depict the
results for the NACA 64-A905 blades. The loss factor, 7, varies from
0.0467 for the smooth blade to 0.0733 for the blade roughened with 80
grit abrasive. This is a 56 percent increase in losses for the 33
degree camber angle blades. Results for the NACA 65-A506 blades
(Figures 9 and 10) range from 0.0387 to 0.0483 for7. This is a 25
percent increase in losses for the blades with 18 degrees of camber.
Referring to Figures 7 and 9, a straight line can be drawn through
the data points, indicating a logarithmic function. It can be seen that
the losses and the increase in losses for a given increase in relative
roughness are greater for the blades with the larger camber angle. One
would expect this be the case since the pressure gradient is steeper for
30
~zI i7CD
V, -n w N
Li w 4 ..
uuuu
LlO
7- r- m
-o L~
0 0
I >
Li .
o co
IL,
0 DN(aL ? ucnC -w IV mY N -
31
vi inw
U)n
U) c c cwj 0 00 0z u uu U
w w
U)aLw z C, a
,.m 00
LI a:
z U) ~cr () C-
Ix aIs. -1
L a:
00
32
icwu
~CI IV
.t Ln U;~-
0 ti t tv .cr
I: I. ii 'CutW.~' -
ly . _ _ - -s.z aI ,' -Lo
-t- M-------- E-~-- ----- -- j--t
-7-L-7lz 0)a
LL i
I La
*~ i - _ _ _
to In I Ic N w i
0 *I~33
ru~N
U) c c cWL 0 000 0z L) UuvuU
CA -41a
141Z) -4
U M C -4
UZ 17 ll
z $.I~
00 "
LL. 0
IAJ0L. ik: r
00
Q)
CC.
34
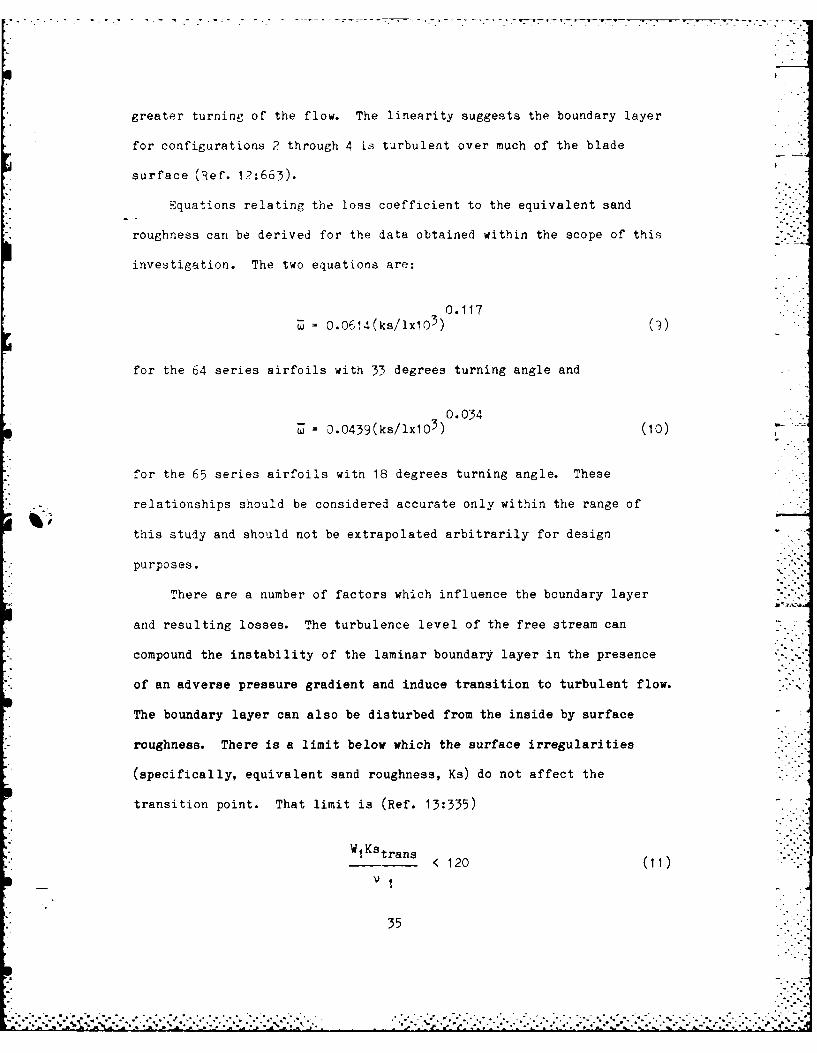
greater turning of the flow. The linearity suggests the boundary layer
for configurations 2 through 4 is turbulent over much of the blade
surface (Ref. 12:663).
Equations relating the loss coefficient to the equivalent sand
roughness can be derived for the data obtained within the scope of this
investigation. The two equations are:
0.117= 0.0614(ks/lx10 3 ) (9)
for the 64 series airfoils with 33 degrees turning angle and
0.0o34-W- 0.0439(ks/lx10 3 ) (10)
for the 65 series airfoils with 18 degrees turning angle. These
relationships should be considered accurate only within the range of
this study and should not be extrapolated arbitrarily for design
purposes.
There are a number of factors which influence the boundary layer
and resulting losses. The turbulence level of the free stream can
compound the instability of the laminar boundary layer in the presence
of an adverse pressure gradient and induce transition to turbulent flow.
The boundary layer can also be disturbed from the inside by surface
roughness. There is a limit below which the surface irregularities
(specifically, equivalent sand roughness, Ks) do not affect the
transition point. That limit is (Ref. 13:335)
W1 KstrmI trans'
< 120 (Ii)
35
." --" .-, Z-.• %.. . . . .... .

where W4 is upstream relative velocity and v is the upstream kinematic
viscosity.
Besides causing laminar-turbulent transition, surface roughnecs can
also directly increase the frictional losses. In the turbulent bounar..
layer friction losses may become substantial once the size of the
roughness reaches a particular value relative to the local boundary
layer thickness. This value, known as admissible sand roughness, KSad-.,
can be approximated by (Ref. 5:174)
KSadmW Id- < 90. (12)
VI
The values for kStrans/l and kSadml for the flow conditions in this
investigation are 0.277 x 10- 3 and 0.200 x 10- 3 respectively and are
located between data points one and two. One can see that both Kstrans
and Ksadm are functions of the ratio between velocity and kinematic
viscosity alone, that is, the Reynolds number per unit length (Ref.
11:10). That means above the limit of KStrans the losses are dependent
only upon the size of the roughness elements. Schaffler (Ref. 11:6)
called the flow in this region "turbulent attached flow with
hydrodynamically rough surfaces."
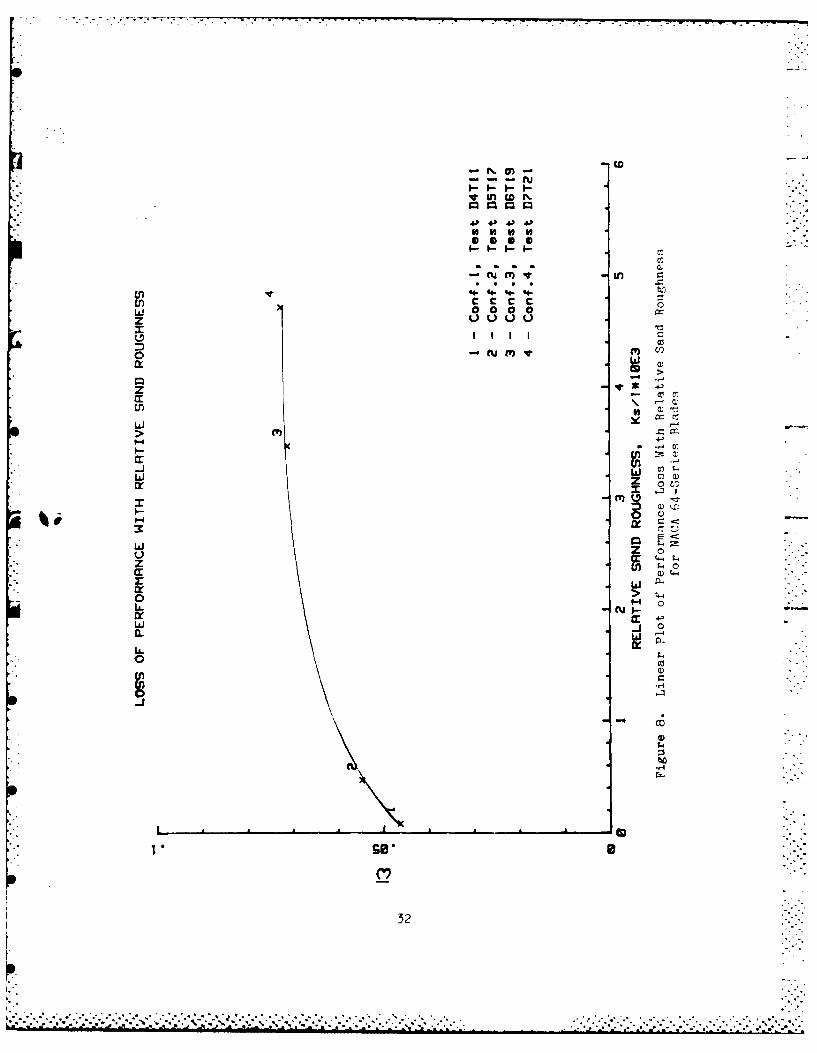
Figures 8 and 10 illustrate that even surface roughness of small
magnitude has a definite effect on blade losses. Minor deteriorations
of the surface quality cause the total pressure losses to increase in
greater measure than in the range of larger roughness. For example, the
relative roughness, Ks/l, of the 33 degree camber blades, configurations
I and 2, (Figure 8), increases from 0.088 x 10- 3 to 0.479 x 10- 3 . The
36
--. ..
*- - - - - - - - - - -- - - - -.- "
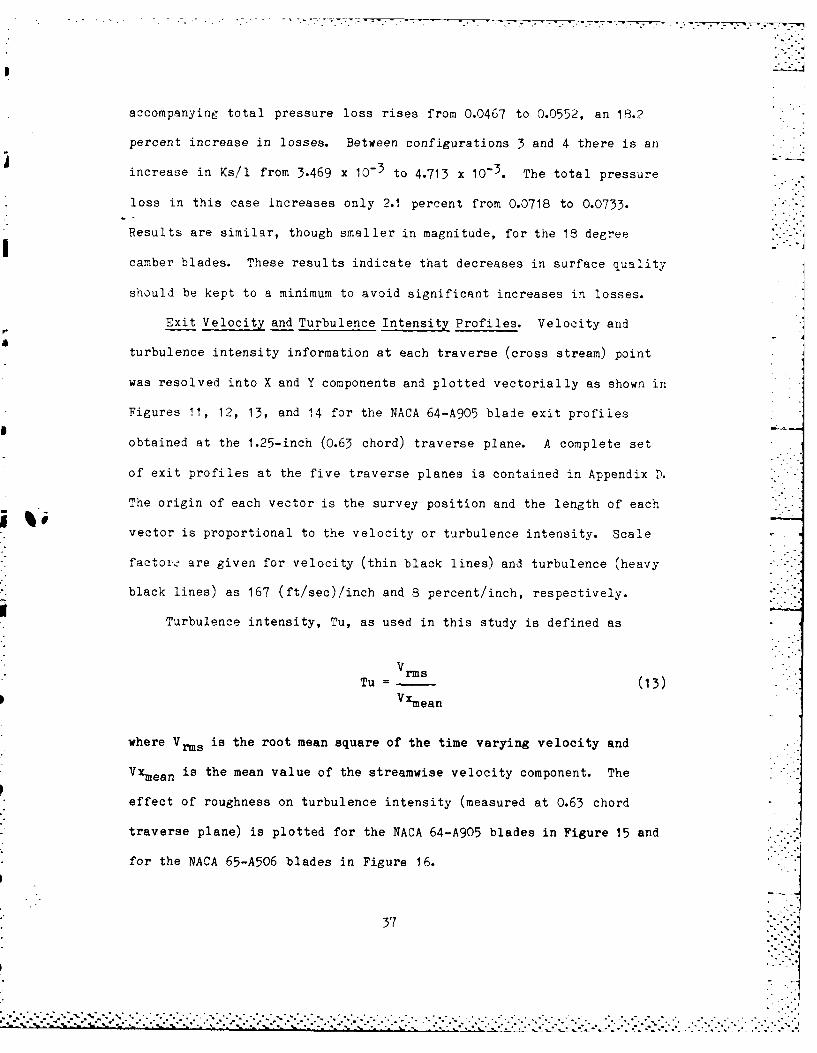
accompanying total pressure loss rises from 0.0467 to 0.0552, an 18.2
percent increase in losses. Between configurations 3 and 4 there is an
increase in Ks/l from 3.469 x I0- to 4.713 x 10- 3 . The total pressure
loss in this case increases only 2.1 percent from 0.0718 to 0.0733.
Results are similar, though smaller in magnitude, for the 18 degree
camber blades. These results indicate that decreases in surface quality
should be kept to a minimum to avoid significant increases in losses.
Exit Velocity and Turbulence IntensitX Profiles. Velocity and ]turbulence intensity information at each traverse (cross stream) point
was resolved into X and Y components and plotted vectorially as shown in
Figures 11, 12, 13, and 14 for the NACA 64-A905 blade exit profilesIZ
obtained at the 1.25-inch (0.63 chord) traverse plane. A complete set
of exit profiles at the five traverse planes is contained in Appendix D.
The origin of each vector is the survey position and the length of each
vector is proportional to the velocity or turbulence intensity. Scale
factor- are given for velocity (thin black lines) and turbulence (heavy
black lines) as 167 (ft/sec)!inch and 8 percent/inch, respectively.
Turbulence intensity, Tu, as used in this study is defined as
Tu rm (13)
Vxmean
where Vrm is the root mean square of the time varying velocity and
Vxmean is the mean value of the streamwise velocity component. The
effect of roughness on turbulence intensity (measured at 0.63 chord
traverse plane) is plotted for the NACA 64-A905 blades in Figure 15 and
for the NACA 65-A506 blades in Figure 16.
37
. . .° .. . . . .. . . . . , .- -.. ; . . ... %....%J - . > . .% ...........-..-. ... ... .. ** . . . . . . . . .• r _' _ ', " '.'..,' ' - ' .' .-.
o . --. . . . . ." - .- '- .-" '.- " i.! , . '-. * ".,. .'.- '"-'-'"

I) m
0 LLJ
4. .1
(fl z X
jJ -j'
0~~
zzL)s
-a:
- I-
0 0
fi
j~r31;.r
0CSH.I NO1Sd U6S S6
03
uz
6-
Ur) M
a:a(D L) a
U U al4
V) z
LAI0
a::
0
z
L::
crr
11111 i al : 11 11Ii~ 1111 ''' iJillII If'' I ~~~i; I i f.~it~
11 1 !IPC
MSHONI) NOIJ.ISOd WW3b.LS SSOMO
39)
. . . .. . ..... .
L) Z
Z
L C)
oIS)
0
0L Mz u
I II
(U 941
it r pim.0 0 CA:
z a-4
_jE 1~6E 6~ ~
0 40
Z -4
IL
u I
7 z
cr ILLo -u~u
t a:
c~r
-Ir I
>uIL
if l it
cr ;I. it
It.
Ilo)
41.
The effect of roughness on the velocity profiles is illustrated for
configurations 1 through 4 in Figures 11 through 14, respectively.
There is an overall deepening and broadening of the velocity decrement
in the blade wake as the relative roughness increases. A slight -
decrease in wake width is evident between configurations 1 and 2
(Figures 11 and 12). At larger roughness levels, however, the wake
again increases (Figures 12, 13, and 14).
It can be seen from Figures 11 through 16 that with increasing-
roughness there is an increase of Tu in both magnitude and affected wake
area. There is an increase in the free stream turbulence intensity for
configuration 2 in comparison to configuration 1 (Figures 11 and 12).
The level of free stream turbulence then remains fairly constant, even
though the relative roughness is further increased (Figures 12, 13, and-
14).
Figures 15 and 16 illustrate the variation of Tu with relative
roughness in another way. The two figures depict mass-averaged Tu
values for the blade wake and entire blade channel (1.333 inches)
plotted against relative roughness. Values of free stream Tu are also
shown. For both cascade test sections, the mass-averaged turbulence
intensity ("Channel Tu") increases significantly for small increases in
roughness (data points 1 and 2). Between points 2 and 4 values for
blade channel and free stream Tu vary fairly linearly, but with a
smaller incline, with increasing relative roughness. It is believed
(R~ef. 20) that the initial sharp increase in Tu is caused by the
K transition of the boundary layer over the blade from laminar to
turbulent. As a result, turbulent fluctuations propagate across the
42
CD -
- -- nLjw ~ I in1oN 1
cm w U),
4.) 41 +) y
Li *
z LLIccc
Li 7 -
Li -
LI sm-i z
Lii
LiJ
z b F4
Li n4Icu
4j
zl 9-J2 0
434

ru mWewcrr LO
LLJ . . . .
z 4- 4- -
c c ccE.! 0 00
00
I I l , I 2wl
I- >.4
zzI-a:
wEU>zm
Lii 5
-JL
LI
CU ruNri
*02 89; 91 f*1 21 al 9 9 tF 0
(iN33N3d) ".l 'A.LISN31NI 30N3inednifl
b 44
blade passage at approximately the speed of sound causing the Tu in the
mainstream to be higher than when much of the boundary layer was
laminar. Once the free stream becomes turbulent because of the
excitation of the boundary layer, further increases of roughness would
make the boundary layer thicker but would not increase the free stream
Tu.
By comparing the wake Tu of the 64-series blades (Figure 15) with
that of the 65-series blades (Figure 16), it can be seen that surface
roughness has a much greater effect on the wake Tu of the NACA 64-A905
airfoils. The wake Tu data for the 65-series blades increases in a
manner similar to the channel and free stream Tu for that blade. There
is a significant initial increase in Tu then almost no further increase
of wake Tu even though there is a ten-fold increase in roughness. The
wake Tu data for the 64-series blades continues to increase steadily
with increasing roughness over the entire range. It appears that there
is a relationship between the influence of roughness on the blade wake
Tu and the camber of the airfoil. A possible explanation is that the
flow over the more highly cambered blade is separated, whereas the flow
over the lower cambered blade is not separated for any of the roughness
configurations tested. As the degree of roughness is increased on the
blade with the higher camber the boundary layer, which is already
separated at some point on the blade, thickens and becomes more
susceptible to earlier separation. This causes a shift in the
separation point towards the blade leading edge. As the point of
separation moves forward the wake continues to grow with an accompanying
increase in wake Tu (Ref. 20).
45
..........- "...---..-.... .

A comparison of the plots of turbulence intensity, Tu, vs. relative
sand roughness (Figures 15 and 16) and total pressure loss coefficient,
w, vs. relative roughness (Figures 8 and 10) suggests in the range of
this investigation three effects of roughness are encountered:
(1) A small increase in roughness produces a doubling of
free stream turbulence with practically no effect on
the wake. This effect might not be noticed at all
if the free stream turbulence were higher, as in an
actual turbomachine.
(2) Further increase in surface roughness produces a
substantial effect on the wake but little effect on the
free stream turbulence. Both of these affect Z since it
is determined from mass-averaged values over the entire
blade channel.
(3) Surface roughness has a much greater influence on blade
wake Tu over the entire range of roughness tested for
the higher camber airfoils than for the lower camber
airfoils.
46
r 21

r V. Conclusions and Recommendations
Conclusions
This study was concerned with developing a facility to provide two-
- dimensional flow for investigations of compressor blade cascades and
exploring the effects of roughness on different airfoils in cascade.
Two blade profiles, the NACA 64-A905 and NACA 65-A506 were used.
Existing criteria of Erwin and Emery (Ref. 4) and Briggs (Ref. 2) were
used to determine when two-dimensional flow was achieved. As a result
of this study, the following conclusions are drawn.
1. Through the use of sidewall boundary layer control, a
facility has been established that permits two-
dimensional flow investigation over the center span
(about 2/3 the width of the blade) of an airfoil in
cascade.-
2. The initial small increases of roughness have a much
greater effect on blade total pressure loss than do
subsequent larger roughness values.
3. A small increase in roughness produces a substantial
increase in free stream turbulence (and M) with
practically no effect on the wake. This effect might not
be noticed at all if the free stream turbulence were
higher, as in an actual turbomachine.
4. Further increase in roughness produces a substantial
effect on the wake but little effect on the free stream
turbulence.
47
5. Surface roughness appears to have a much greater
influence on blade wake Tu for the higher camber airfoils
tested than for lower camber airfoils.
- Recommendations
The findings of this investigation suggest that compressor blade
roughness should be kept as small as practicable. It is recommended
that additional study on blade performance be accomplished as follows:
1. Investigate the influence of free stream turbulence on
the blade wakes of roughened airfoils in cascade by
varying the turbulence intensity in the test section
upstream of the cascade,
2. Determine the existence of a relationship between the
camber angle and blade wake Tu by making a series of
tests on airfoils of increasing camber angles and,
3. Conduct a more detailed study of the pressure
distribution and boundary layer over the blade over a
range of roughness values.
48
S.. .-.-.-*,.
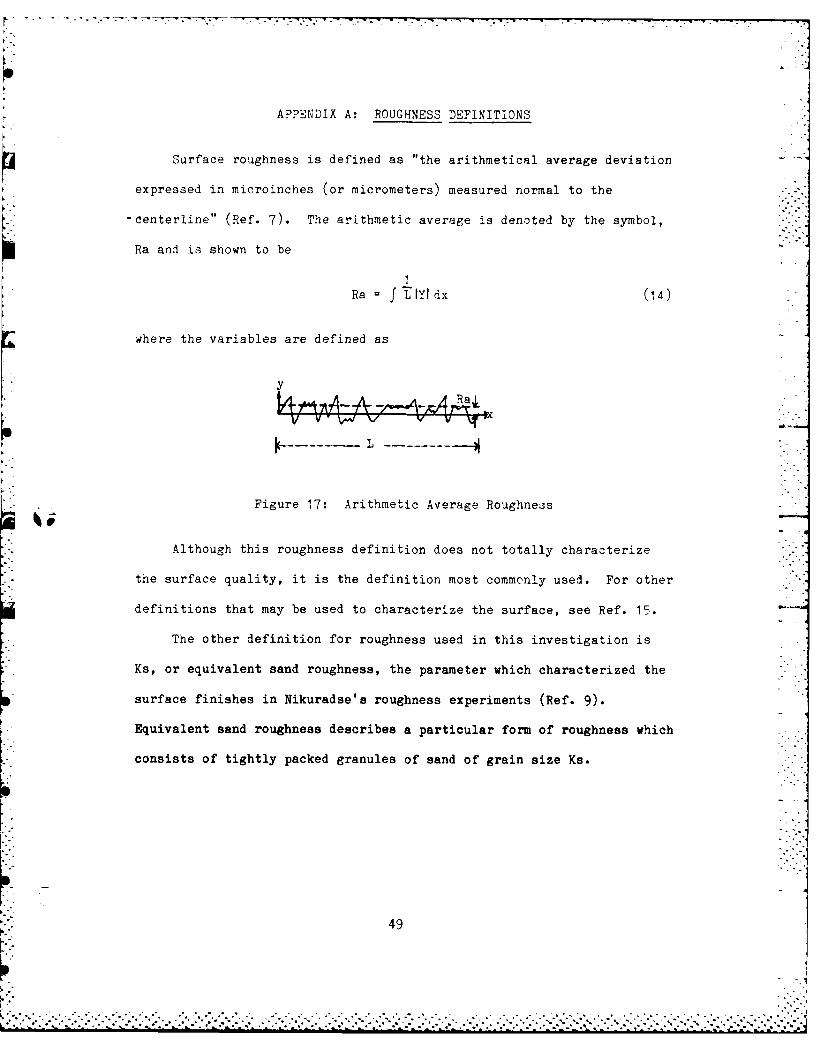
APPENDIX A: ROUGHNESS DEFINITIONS
Surface roughness is defined as "the arithmetical average deviation
expressed in microinches (or micrometers) measured normal to the
-centerline" (Ref. 7). The arithmetic average is denoted by the symbol,
Ra and is shown to be
Ra f L[IYdx (14)
where the variables are defined as
y
ZA" - I
Figure 17: Arithmetic Average Roughness
Although this roughness definition does not totally characterize
the surface quality, it is the definition most commonly used. For other
definitions that may be used to characterize the surface, see Ref. 15.
The other definition for roughness used in this investigation is
Ks, or equivalent sand roughness, the parameter which characterized the
surface finishes in Nikuradse's roughness experiments (Ref. 9).
Equivalent sand roughness describes a particular form of roughness which
consists of tightly packed granules of sand of grain size Ks.
49
o.. ...-.. . .

APPENDIX B
Development of Adiabatic Efficiency of the Cascade
Adiabatic efficiency for a compression process is defined in terms
- of static enthalpies as §:h2 h l
na (15)Ih2 - hl,
In the above equation h1 is upstream enthalpy, h2 is the downstream
enthalpy, and h2 is the downstream enthalpy resulting from isentropic
compression. The compression process may be seen in Figure 13.
Pi
Po2
o2To,, To2 , To 2 o2
t ~P2 "'
T T2 2P
T2 -
2
1
S
Figure 18: Temperature-Entropy Plot of Compression Process
50 .-'J
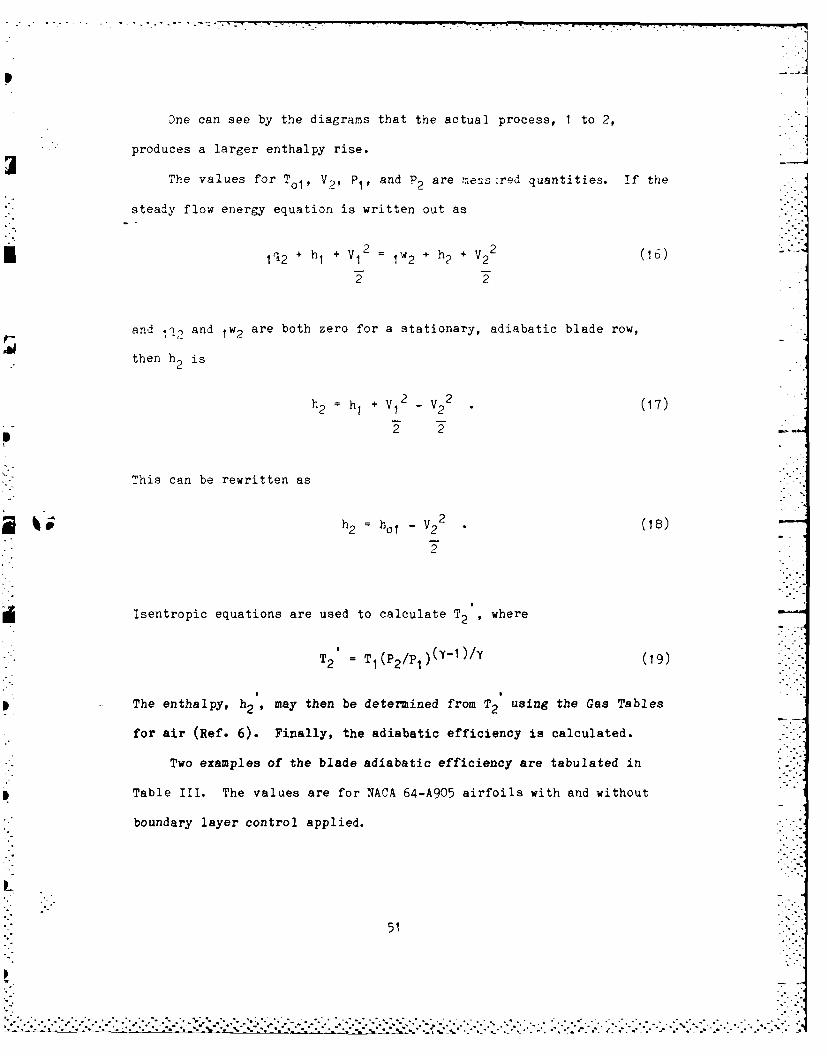
One can see by the diagrams that the actual process, I to 2,
produces a larger enthalpy rise.
The values for Tol, V2 , P1 , and P2 are ,neis red quantities. If the
steady flow energy equation is written out as
jq2 + h, + V12 = w2 + h2 + V2
2 (16)
and 12 and Iw2 are both zero for a stationary, adiabatic blade row,
then h is 2 2
h2 + V72 V2
2 (17)
This can be rewritten as
h2 -- ho1 -V 22 . (18)
2
Isentropic equations are used to calculate T2 , where
2= T 1 (P2/P1 )(Y-1)/Y (19)
The enthalpy, h2 , may then be determined from T2 using the Gas Tables
for air (Ref. 6). Finally, the adiabatic efficiency is calculated.
Two examples of the blade adiabatic efficiency are tabulated in
Table III. The values are for NACA 64-A905 airfoils with and without
boundary layer control applied.
51

TABLE III
Comparison of Adiabatic Efficiency
Parameter With B. L Control Without B. L. Control (Ref. 17)
T1, 97.73 96.21
To1, OF 118.7 116.3
h 1, B/lbm 133.24 132.95
ho1 , B/ibm 138.29 137.73
V 2, f/sec 420.65 414.7
P1, psia 13.84 14.12
P2' psia 14.33 14.49
Y 1.4 1.4
e Calculated Values
h2 B/ibm 134.75 134.31
T2 OF 103.01 100.33
h2 B/ibm 134.58 133.94
0.892 0.727
Sa
One can readily see the dramatic increase in blade efficiency when
boundary control is used.
52
* . * . .. ..... ; -

APPENDIX C: Non-dimensional Total Pressure Loss Data
For NACA 65-A506 Airfoils
53

TOTAL PRESSURE MAP AT 1.25 INCHES BEHIND BLADES 4 AND 5 *''SOLID WALLS INSTALLED
iNominal Flow Turninq Angle- 17 Del., Exit Wall Divergence Angle- .61 DegInlet Reynolds Numner Per Foot= 2.66 Million
SPANW'ISE P SITION ON INCHESCHANNEL"-"
PDSITICN 1.00 0.75 0.50 0.25 0.125
.992 .2771 .2812 2893 .2426 .26C2
.972 .2467 .2508 .271 .3251 .3593
.952 .1555 .1641 1993 .3775 .4271
.932 .0901 .0938 .1152 3967 .4572
.911 .0667 .0674 .0708 .3854 .4584
.891 .0676 .0642 .0583 3001 .4379
.871 .0656 .0648 .0619 .2688 .3687
.851 .0673 .0649 .063 .1769 .2878
.83 .0662 .0639 .0601 .1094 .22G8
.81 .0665 .0639 .0634 .0695 .1356
.79 .0681 .0655 .0619 0585 .1451
.77 .0678 .0643 C621 .0553 .1383749 .0671 .067 .0663 .0606 .0885
.729 0662 0653 .0646 0524 .1005
.709 .0666 .0636 0653 .0569 .0872
.689 067 .0648 0674 .0597 .0882
.668 .0657 .0666 0678 0579 .0897
.648 .067 .0673 .071 .0577 .0829
.628 .0669 .0652 0"08 0547 .0896
.608 .0648 0644 .0737 .0612 .0819
.587 .0663 .0662 .0709 .063. .0891
.567 .0673 .0667 .0711 .0624 .0773.547 .068 .0634 .069 .0669 .0873.527 .0653 0653 .0672 .0663 .0852.506 .06i4 .0655 .0688 .0669 .0877.486 .0643 .067 065 .0779.466 .066 .0653 .0675 .0653 .0769.446 .0666 .0666 .0695 .0657 .0865.425 .0661 .06568 .0713 .0652 .0852.405 .066 .0666 .0717 .0693 .0825.385 .0667 .0668 .0708 .0711 .0a73.365 .0652 .0693 .0755 .07 .079.344 .0655 .0676 .0723 .07 .0766.324 .069 .0685 .0711 .071 .0765.304 .0672 .0687 .0728 .0698 .0868
.284 .0667 .069 .0715 .0664 .0777
.263 .0656 .0688 .0704 .0694 .0928
.243 .0678 .0702 .0705 .0662 .0823
.223 .0663 .0706 .071 .0683 .0805
.203 .0675 .0708 .0726 .0648 .0788
.182 .0669 .0692 .0747 .0705 .0824
.162 .0672 .073 .0736 .0721 .0831
.142 .0647 .072 .0727 .072 .0784
.122 .0657 .0698 .0729 .0736 .0782
.101 .0645 .0704 .0732 .0741 .u7t3
.081 .0715 .0746 .0798 .077 .0749
.061 .1268 .1194 .1317 .0929 .0063
.041 .2248 .2189 .2349 .1561 .1509
.02 .285 .29 .3038 .2544 .27060 .2411 .2532 .2727 .3563 .3912
54
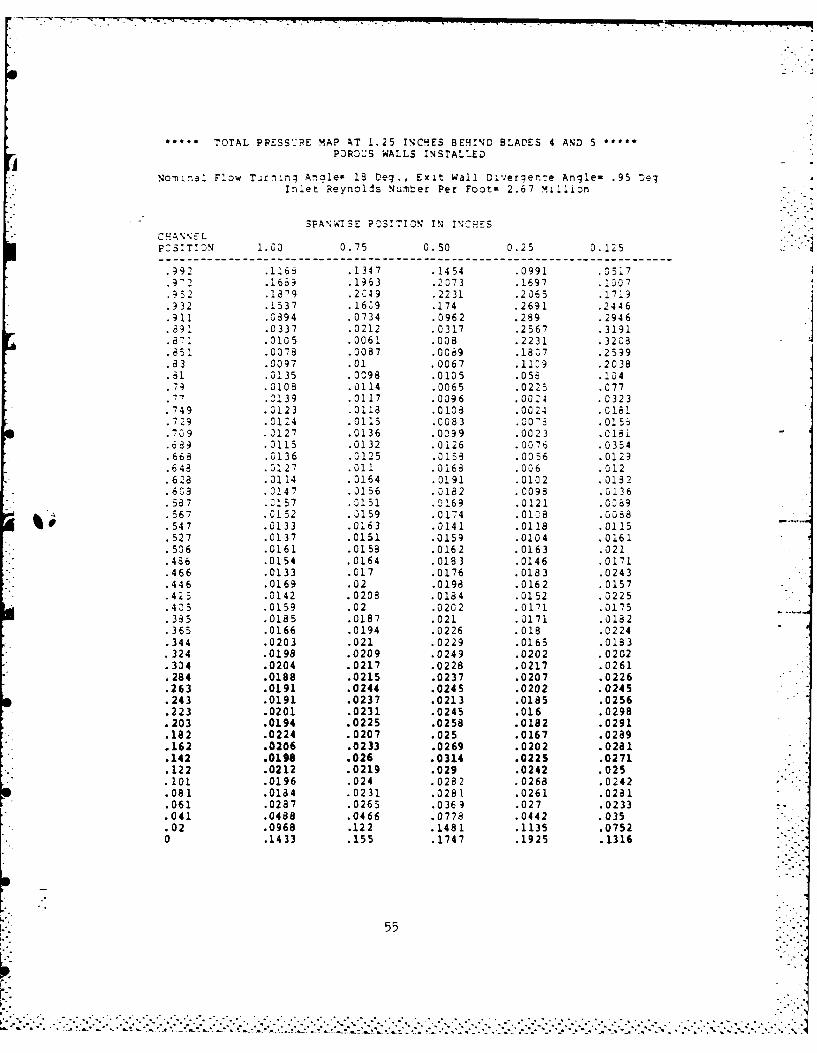
TOTAL PPESSPRE MAP AT 1.25 INCHES BEqIND BLADES 4 AND 5 *
PDROUS WALLS INSrALLED
Nominal Flow Tjrning Angle= 18 Deg., Exit Wall Div:ergenze Angle- .95 DegInlet Reynolds Numter Per Foot- 2.67 Million
SPAWI SE PITION IN INCHESCH;AXELP2Si DN 1.00 0.75 0.50 0.25 0.125
.992 .1166 .1347 .1454 .0991 .0517
.9 2 .1669 .1963 .2073 .1697 .1007
.952 .1879 .2049 .2231 .2065 .1719
.932 .1537 .16 9 .174 .2691 .2446
.911 .0894 .0734 .0962 .289 .2946.891 .0337 .0212 .0317 .2567 .3191.8-1 .0105 .0061 .008 .2231 .3208.851 .0078 .0087 .0069 .1807 .2599.83 .0097 .01 .0067 .11C9 .2038.i1 .0135 .0098 .0105 .056 .104.79 .0108 .0114 .0065 .0225 .077., .0139 .0117 .0096 .00:4 .0323
.749 .0123 .0118 .0108 .0024 0181
.7Z9 0124 .0115 .0083 00- 0156
.709 0127 .0136 .0099 .0023 .018i
.689 .0115 .0132 .0126 .0076 .0354
.668 .0136 .0125 .0153 .0056 .0129.643 .0127 .011 .0163 .006 .012
628 0114 .0164 .0191 .0102 0182608 0147 .0156 .0182 0098 .0136587 2157 .0151 .0169 .0121 0: 9
b 567 .0152 .0159 .0174 01Ca .0088I 547 .0133 .0163 .0141 .0118 0115
527 .0137 .0151 .0159 .0104 .0161506 .0161 .0158 .0162 .0163 .021
.486 .0154 .0164 .0183 .0146 .0171
.466 .0133 .017 .0176 0183 .0243
.446 .0169 .02 .0198 .0162 0157
.425 .0142 .0208 .0184 .0152 .0225
.405 .0159 .02 .0202 .01,71 .0175
.335 .0185 .0187 .021 .0171 .0182
.365 .0166 .0194 .0226 .018 .0224344 .0203 .021 .0229 .0165 .0183324 .0198 .0209 .0249 .0202 .0202
.304 .0204 .0217 .0228 .0217 .0261
.284 .0188 .0215 .0237 .0207 .0226
.263 .0191 .0244 .0245 .0202 .0245.243 .0191 .0237 .0213 .0185 .0256.223 .0201 .0231 .0245 .016 .0298.203 .0194 .0225 .0258 .0182 .0291.182 .0224 .0207 .025 .0167 .0289.162 .0206 .0233 .0269 .0202 .0281.142 .0198 .026 .0314 .0225 .0271.122 .0212 .0219 .029 .0242 .025.101 .0196 .024 .0282 .0268 .0242.081 .0184 .0231 .0281 .0261 .0281.061 .0287 .0265 .036 9 .027 .0233 ..041 .0488 .0466 .0778 .0442 .035.02 .0968 .122 .1481 .1135 .07520 .1433 .155 .1747 .1925 .1316
55
. ... .. .... . aa~S'.'. .. . C .. . .
APPENDIX D: Velocity and Turbulence Intensity Profiles
56
U ZI 4 \
ru uj
I -.
W~W U) ~ -l* a.
Lai-
u*r I In j
0
z&
IA > Il .
'ID
601 601P ra 664 e SG I(S3HONI) NOZJ.ISOd WW3616 SS060
57
NL Z
U)
LLLCoil9
CD I
J1 -'f i iuI, Ln .,
_fi u
- z-. -j I.- M f
LJL
> Hfi 0
O00
0
Li > --- --.- *0
ittll it
*ii'iIi
6c, 1, 61 6 c GE(S3HONI) NOIIISOd WW361S SSONO
58
I
U)C
a;
U
U) I
o 0)
> Ci
Z 0
La -zz
L)
w~ I'
a: 66'II
oI .11 l 11 W.H L4n
ssf 6C~ 6 WE 6PE 6C
MSHONI) NOI11SOci WW3b.LS SSObO
59

uz
Z
INA
LJIiii
u1 XA Ujj .3 '
M- Lii
-Im U,a:
z
0U.C
.. >
II E-'
Zf i i'iw r rn r Ifj Ia i
:i r : i ll i~ II'~ 4 ' I ~I1 f f
601 6C 1 61 't 6 6zE c sr.MSHODX NO1LISOd WW3611S SS060
60
j.u z
IS))
r'
LAJ
MZZ
>u En
zz
>4 L.I
U.CLiCL
0.
Lii> _ _ _ _ _ _ _ _ _Y ul
m'
2 E lr66 ~ G
p 6.
uzIZ
LL. CD
,- m
ImI
flr M u-' t
92 UnUIx xf im t~
Z .)X L
-Er, =.
C; rC
(r
00 w
-4J
'i'' i '
sr sell 61 6i GE W~E SMS3ONI) NOI lISOd WWj3H1S SSOH3
62

LL
U D
Ln LWU)Li Ln a~
xz -g3in
U.
0- a: CLe -
z
>4-
LAJ)
fu.
c * .1. araII
10- 0: w'lI I I. :
S7i,- i
10 0is- -I
s.061~ ill, s z I 6;MHOD NOI.ISOd WI:3MIS SSOUO
63
X L)
LL)
I rA w mw %
an Ln
cr ~z m
> v2J
ccc>C
WtV
z z
LACL _ _ __ _ __ _ _ m_ _ _ _ __ _ c
I j
jiiiIli ''' 1111 ca'~'
Ii 4
11 a
... s ~ se * %*.. ***** silo........E6G
* ~ ~ (3H N N411~ *..** *..'...... q*.. .. t ** * .**
5 U ,.t, ,... N .~ ' 64

I IL) Z
T v.
.-zn m~.
i. U,± 11
_jI M
S&mE 1 6 ~
z u c I a*'. . -cc 0-4 z:..(n- -
+ 'u
LIIC'
LU 0
'L CD oi
LI LOU t.
rU m
-.
Li Ul u
> IV:-- j
z L)
w U)cc~ .
ccC
0 I)* C.
U))
if !I~
PCSIH I I ) -IliS~ h~3.SSOIH
66
+ IL)
U NO
L In
*- -
U -- - E
0) H uu ,
z
cn L
> 41
z >
__ __till- .-
T L
LL CD
cu u
UN
1-4
irN LAj- Ij
a:,cuZ
m -4
C; z
Lauj(n:'I';
I' I '''''
C)H~I >OlSdWUW S~
---....-...-....-....-.................... !11 -
u z
U)
w [L
jn _j z
CDO U ax
zz
r ru -
CrC
C; z
be Li Z
LZ
I' .1. ~
lii 6 c
CSHNINOISdWibSS~1
- . C69
Z0-4
L INJ
o LJ
L Ia
LLJ rg-4cr
OD T L) U) -
oI.LI> V*
* 0'J
cZL
*Ln *
z >
UJ S ol,.
z
(S3H3NI) NOIIISOd WW36.LS SSObO
70
I~ Uz1-4\
VUuC
I .1. (1
4J --C
u jj
E Ln (- -,
C D L LJJ C,
oz I-,zwz
ty Lrl >
II Iii
6z * E* ST*6'E6r_SHN)NjI~dW3± S~
71:
> . . .*.~--.~.*-*.*.*...*.**...*~
4.CL) I!
CDC
L cu
*7 1
I 0
o Un
z z
UJI
m U)*1z
Z 4-
z U)
*LJ
oI I r
II, :1~
(S3HNI) OIJIS~dW~3.LS S-4
I72
%% .*--.. . .. *,-.. . *v..(D
X L)u z
U2- CDC
t. u
IN
L Li
LiL
'-. a:
0 L
cc~
CY
0..
661* 6F 6 61$1 6FE e c r.(S3ONJ '-4Sd WNS SN
Li 73
IL)Z
CAC
LL CD
W',- t1
0 Iiu~3
Ln n -*
M 0
z
ILi I
zi I;
C; 0 U)
IJc,cr 4.
cr m>CL~0)
L'-4Z in
L) I ., ':r
HI . hIIIi~dI.IiLo
Is, 0E O r'e 61 r
(S13HOD NOIIISOd WW361S SSONO
74
-A-
LL
v tz
kr tLn
-j 4
a:aLi U-
zi U U
zzii ii
L )Li >X il
IIJ
m a:C 1~BE Se ~C;H~I a:iI~ u~~± C5O
z7
XIL)
La
00
L j -
z IT i
uj 0.
L4
0 .0
p ' li
I, .
u-4
z > X 6 ~0S~OI NQ.Im ~3.SS
i76
Ln 0
CD)
LIP
IL If
N Lo *--
0 ~r
x 0n
zaz
o>wzu L
.LLIIu uh j -,i~ i lSII III I1!J4illU
4-7
Z-j
LW
E -i
o cnn9
o lh- I;
U -
0 I .-
ru >0 mZcr
C4
Vt
* 0i
ra. S a o 60e 62 r
MHONDNO11S~d W361SSS*b
78.
I
U)
(UJ
1.
L. NJ
r4-
z 52a:,
1-4
00zC
L:w E
z >0
a:n~'nffdi ri~jijI(1~1~1? l l 1111
p1111 1''( LIiIi ~ i
j!j I iI' liii' iII
(S3H3NI) NOIIISOd WW361LS SSONO
79
u zZ~-
(D 0)
0 (U
,- u~J min.
1- z- g..~
Im (n
z a:
c0)
0~zS..
.4.
800
*..4
A.~~~~~ ~~~~~~~~ 11H... . * . . ... S *- - . -. S *S..
- S S - .~* - - S -~ .. *- 5. .- ~ -~. ~ . ~ .. ?
ZI-
LLC
Liin
LL) t . -
E
0 DL -n
3- U
rkru,>
__m c0
L: E-
z >E4Y 6.SH~I Na:T~dW3±6S
u 81
* 0*Jill - .
~ - - 0*~0~ . .< .. * ~ ~ ill 43 - -
4~ Uz
L ~ CD
wu
U*cc1 I--*
z S
~LsJ LnJ
z Li.
7m cc
LIJ
cZo
IS , 6*f '' ' i'
CS3HONI) NOIIISOd WONI.S SSONO
82

XIL)
Z"-
Lio
40±
wl) U1~
U)U0 AL Cr
o0zL ir noZ
Li.J
N C
z 1
Li
-ILL
_
.
IL1 d l1 'II It" !111,1 t1it 1 fill
jI~'I4
LI I'
6EG sei 6 6e rsie SG ECS3HONI) NOI.LISOd WW361S SS060
83
X L
L)
0L m
IL
X- u
4Jlf ILI
N LL 0y~
>~ m-AJ
0 zz.0
Vj0
zw
zr III-~
z I
CS3HOD NOI.LISOd WW3NIS SSONO
* 84

-Ri5i 855 INFLUENCE OF SURFACE ROUGHNESS ON COMPRESSOR BLADES RT 2/2HIGH REYNOLDS NUMB..(U) AIR FORCE INST OF TECHURIGHT-PATTERSON AFA OH SCHOOL OF 2MGI. G P MOE
UNCLASSIFIED DEC 84 AFIT/GAE/AA/84D-i9 F/G 28/4 M
mom.ommom
1.25 .- i 1,
~MICROCOPY RESOLUTION TEST CHART
.NATONAL BUREAU OF TANDAR - 319 A
13-
P..
P ._
' o . ...... : _......,. : .. ... . .. . .. .. .. ... -.. , ........--.- .,..1.8.:.I''N,':-'"'':: "".' ,:: .". :: ' ,:-- -,., ,-,-,-: :,:.x .2 5 1:.' . 4 111:.' ..-, 6.: . ,:_,'. 2 .-.. :.:.:.:..'.'-'-''.:.:.''

U zZI-
V LI 16
FA LLI0- - I
> N
LOL Ian
0 u ~=
> mm
0 zaLf)
0 >UZi 11 11
71! r, I M 11 -------- I :1,4-,
ai -- -, 1 !
Lhi
,0
IIs Isl
(S3H:DNI) NOI.LISOd WU3blS SSOIMO
85-
t Z"-
2rm-4 t-.
1*JLL. CD
* {.NfuM0L
_jU i-w u*M
4~LUJ
z0 0 7
pi 141 ioI
>n -
Z
LaJ
ZiLaM
> Ii IT
SEt r p 66 I 1 E SGECS3HONI) NOI1ISOd WU36.LS SSONO
IL)
Z-
uz
L IM
4, J W.. u
LL,Ir~ In L
LAl
z Jil
u
it~ 1 I
sr o, s , It I o6E 6 r
MSHONI) NOIIISOd WWd3N±S SSONO
87
0 z-4
tY~CV
LLA. O tI, Y~Ia
*cIu
zj
rZ
z >i
01 ssC53101) NOilS~ WU~±itsO
La8
x
uzZI-
LE m
COD
EO U
VILE
w.I U) c
z cz
0 0)
Z 0n
IM0,
a:,
> k0
sr. e t, 61 ap We We s. r
(63HND N111Sd WWNIt S b
89~itWEilW-l
L)Z
Lii 0
LL. CD
0~ it
0 H .
-j zu 5 ( es
0
0 u CL
Li.
cc ~ il~i*-
cc ~ tl~J
0 MCC
I.. . . . ..-
- .. .. ... * .. h .*.'. .
IZ
LdCU)
CD 0
0 U
L~
I,
-4 :3 0r
64-
m 02
.4,3>CLL)
U.10
all'
''I ~Oi TIIl~~1'
(113HNDNOI11SOd WU3b.LS SSOK)
91

I~ Uz
Li
LL. N D
L -Cl). 1 UU-
LaI_- a
xIJ - Eu LI .-tz .J I
L
I: wz > ------------ -----
MC
Ia)
N-4
6L si W -
MHOND Nj11~ WWbS S
iii III 92
t Z'-
twtUc
Li~IMw u I
A mI a:J
In z u ICU w- z
I 0
C; S.
-o -
o CK
LII ________ ______!;d- 4.'itq~hq 'It0
p. SE* 6 1 GSE 6 E 6MSHOD NOIIISOd WW3b1S SSObO
93
IZ
I.. OD
Is
L. J J.-
Z LI 'r
-> 0 si
Z~aa:
LLW
00
Laii
~6.1. 6 6 E 6 re 6ECS30N1 NOI.LISOd W163b.lS SSObiD
94

u z
(A m
tY t
U) cLd UJI0
x x M
U tin Z iz .=)
.-z 0 U):
00
Z LI -4
IL L~ LI --0 -------z >
0
-4J
MHON NOI40-WbS S
~w. C95
Z"-
0
LC C
-. LL. CD
u~ZE-
ZI. xi LA0
LWd In0
'h w> ~ ~ I
ii I 0In~
0r~
Z ~ i 6 ~ ~0SHN)NII~ ~~. S~
z 96
LL-::~..-- .- **....* .....
Bibliography
1. Allison, Dennis M. Design and Evaluation of a Cascade TestFacility, Unpublished MS Thesis, Wright-Patterson AFB, Ohio: AirForce Institute of Technology, June 1982.
--2. Briggs, William R. Effect of Mach Number on the Flow and
Application of Compressibility Effects in A Two-DimensionalSubsonic-Transonic Compressor Cascade Having Varied Porous-Wall Suction at the Blade Tips, Technical Note No. 2649, NationalAdvisory Committee on Aeronautics.
3. Bullock, R. 0. Analysis of Reynolds number and Scale Effects on
Performance of Turbo machinery, ASME Series A Journal ofEngineering for Power, 86:247, July 1964.
4. Erwin, John R., Emery, James C. "Effect of Tunnel Configurationand Testing Technique on Cascade Performance," Report No. 1016
National Advisory Committee on Aeronautics, 263-277, 1951.
5. Fottner, L., Schaffler, A. AGARD 175, Neuilly sur Seine, France;
AGARD 1976.
6. Genovese, David T. Roughness Effects on Compressor Outlet Guide
Vanes at High Reynolds Number and High Angle of Attack, UnpublishedMS Thesis. Wright-Patterson AFB, Ohio: Air Force Institute of
Technology, December 1982.
7. Keenan, Joseph H., Kay, Joseph. Gas Tables, New York; John Wiley &Sons, Inc., 1948.
8. Koch, C. C., Smith, L. H. Jr. "Loss Sources and Magnitudes in
Axial Flow Compressors," Journal of Engineering for Power, 411-424,July 1976.
9. Lieblein, Seymor, Roudebush, William H. Low Speed WakeCharacteristics of Two-Dimensional Cascade and Isolated AirfoilSections, Technical Note 3771, National Advisory Cn~mittee onAeronautics, October 1956.
10. Nikuradse, J. Turbulente Reibunqsschichten an der Platte, Munchenand Berlin; ZWB, 1942.
11. Peacock, R. E. Boundary Layer Suction to Eliminate CornerSeparation in Cascades of Aerofoils, A.R.C. R.&M. No. 3663,University Engineering Department, Cambridge, October 1965, (AD90037).
97
...........S . . . ~ S .S.S"
12. Schaffler, A. "Experimental and Analytical Investigation of theEffects of Reynolds Number and Blade Surface Roughness onMultistage Axial Flow Compressors," ASME Journal of Engineering forPower, 102:5-13 January 1980.
13. Schlichting, Hermann. Boundary Layer Theory, Seventh Edition, NewYork; McGraw-Hill, 1979.
14. Scholz, Norbert. Aerodynamics of Cascades, AG220, Neuilly surSeine, France; AGARD, 1977.
15. Tanis, Frederick J. Roughness Effect on Compressor BladePerformance in Cascade at High Reynolds Number, Unpublished MS
Thesis. Wright-Patterson AFB, Ohio: Air Force Institute ofTechnology, November 1983.
16. Taylor, Hobson. Surtronic 3 Operating Instructions. Leichester,
England: Rank Taylor Hobson, (undated).
17. Vincent, Edward T. The Theory and Design of Gas Turbines and Jet
Engines, New York; McGraw-hill, 1950.
18. Vonada, John A. and Elrod, William C., Allison, Dennis M. WakeMixing Investigation of Crenelated Trailing Edge Blades in Cascade,Proceedings, AIAA Ninth Annual Mini-Symposium on Aerospace Scienceand Technology. Wright-Patterson AFB, Ohio: Air Force Institute
of Technology, 22 March 1983.
19. Wassell, A. B., "Reynolds Number Effects in Axial Compressors,"
ASME Journal of Engineering for Power, 149-156, April 1968.
20. - ------, The Pall Porous Metal Filter Guide, Pall Corporation, 1982.
21. Wennerstrom, A. J. Personal interview, AFWAL, Wright-Patterson -
AFB, Ohio, 1 Nov 1984.
98
-7.
VITA
Captain Gary P. Moe was born on 9 March 1955 in North Hollywood,
California. In 1972 he attended the University of California, Berkeley
-from which he received the degree of Bachelor of Science in Mechanical
Engineering in June 1976. Upon graduation, he received a commission in
the USAF through the ROTC program. He was employed as a research
assistant for the Electrical Engineering Department, Texas Tech
University, Lubbock, Texas until called to active duty in May 1977. He
completed pilot training and received his wings in May 1978. Captain
'4oe then served as a KC-135 copilot and aircraft commander in the 97th
Air Refueling Squadron, Blytheville AFB, Arkansas, until entering the
School of Engineering, Air Force Institute of Technology, in June 1983.
He is a member of Tau Beta Pi.
Permanent address:
4325 Sonoma Mtn. Road
Santa Rosa, CA 95404
99
_Z

UNC LASS IFIEDSECURITY CLASSIFICATION OF THIS PAGE
REPORT DOCUMENTATION PAGEM.REPORT SECURITY CLASSIFiCA( ION 1b. RESTRICTIVE MARKINGS
TUNC LASST FIED ________________________
2s. SECURITY CLASSIFICATION AUTHORITY 3. DIST RIBUT ION/AVAI LASILITY OF REPORT
2b. ECLSSI ICAIO~OOWGRAONG CHEULEApproved for public release;2b. ECLSSI ICAIONOOWGRAONG CHEULEdistribution unlimited.
4. PERFORMING ORGANIZATION REPORT NUMBER(S) 5. MONITORING ORGANIZATION REPORT NUMBER(S)
AFIT/GAE/AA/B4D-196a. NAME OF PERFORMING ORGANIZATION b. OFFICE SYMBOL 7a. NAME OF MONITORING ORGANIZATION
School of Engineering r (I pliaEN
6 c. ADDRESS ICit). State and ZIP Code) 7b. ADDRESS (City, State and ZIP Code)
Air Force Institute of TechnologyWright-Patterson AF'B, OH- 45433
Ba. NAME OF FUINDING/SPONSORING jBb. OFFICE SYMBOL 9. PROCUREMENT INSTRUMENT IDENTIFICATION NUMBERORGANIZATION (i applicable)
Sc. ADDRESS CIty. State and ZIP Code) 10. SOURCE OF FUNDING NOS.
PROGRAM PROJECT TASK WORK UNITELEMENT NO. NO. NO. NO.
11. TITLE (include Security Classi~fication)
* See Box 19 _____________________
12. PERSONAL AUTHOR(S)
*Moe, Gary Patrick, B.S., Capt, UA0 3a. TYPE OF REPORT 13b. TIME COVERED 14. DATE OF REPORT (Yr.. Mo.. Day 5.PAGE COUNT
MS Thesis FOTO1934 December1216. SUPPLEMENTARY NOTATION
1.COSATI CODES 18. SUBJECT TERMS (Continue on reverse if necessary and identify by block number)
Compressor Blades, Roughness Effects, Boundary Layer.
19. ABSTRACT (Continue on reverse if necessary and identify by block number,
Thesis Title: INFUENCE OF SURFACE ROUGHNESS ON COMPRESSOR BLADESAT HIGH REYNOLDS NUMBER IN A TWO-DIMENSIONAL CASCADE
Advisor: Dr. William C. Elrod bill.*
Aj, Fcrce "tI~I i,,tv6I''9 (AICI
20. OISTRIBUTION/AVAILASILITY OF ABSTRACT 21. ABSTRACT SECURITY CLASSIFICATION
)NCLASSIFIEO/UNLIMITED 2k SAME AS APT. C DTIC USERS 0 UNCLASSIFIED
22s. NAME OF RESPONSIBLE INDIVIDUAL 22b TELEPHONE NUMBER 22c OFFICE SYMBOL
00 FORM 1473, 83 APR EDITION OF I JAN 73 IS OBSOLETE. UNCLASSIFIEDSECURITY CLASSIFICATION OF THIS PAGE
*:**.*.*....** ... .. i.*..*.,-.. *. .. , . . . . . . . . . . . . . . .
* UNCLASSIFIEDSECURITY CLASSIFICATION OF THIS PAGE
A cascade test facility has been established which incorporatessidewall boundary layer control, perr'tting two-dimensional flowinvestigation over the center span (aLut 2/3 the width of the tlade) ofan airfoil in cascade, and an investigation has been conducted todetermine the influence of roughness on the airfoil. Two representativecompressor profiles, the NACA 64-A905 and 65-A506, with two inch chordsand aspect ratios of one were tested at airflow inlet velocitiescomparable to those in axial flow compressors. An Axial VelocityDensity Ratio of unity was the criterion used to determine when two-dimensional flow was achieved.
Test results indicate that initial small increases of roughnesshave a much greater effect on blade total pressure loss than dosubsequent larger roughness values. A small increase in roughnessproduces a substantial increase in free stream turbulence withpractically no effect on the wake. Further increase in roughnessproduces a substantial effect on the wake but little effect on the freestream turbulence. Surface roughness is shown to have a much greaterinfluence on blade wake turbulence intensity for the higher camberairfoils tested than for lower camber airfoils.....
.1
UNC LASS IFIEDSECURITY CLASSIFICATION OF THIS PAGE
~~................. .... .. * .. ... . .. . .. ....... . ...... .... ....*. . ...... .-. ... . .. ,.-... . ...... ..
FILME D
4-85
DTIC-........


![greatbarringtonpolice.com · 2021. 1. 12. · Initiated - PATROL CHECK [GRE] MONUMENT VALLEY RD Radio [ GRE Phone [GRE] Phone [GRE] Phone CHOU] - AMB TRANSPORT LEWIS AVE - MOTOR VEHICLE](https://img.pdfslide.net/doc/110x75/60a850ebeab7de55b5543264/g-2021-1-12-initiated-patrol-check-gre-monument-valley-rd-radio-gre-phone.jpg)