Embed Size (px)
Citation preview

8/6/2019 la joya isd - 9th grade center - 1996 Texas School Survey of Drug and Alcohol Use
http://slidepdf.com/reader/full/la-joya-isd-9th-grade-center-1996-texas-school-survey-of-drug-and-alcohol 1/353

8/6/2019 la joya isd - 9th grade center - 1996 Texas School Survey of Drug and Alcohol Use
http://slidepdf.com/reader/full/la-joya-isd-9th-grade-center-1996-texas-school-survey-of-drug-and-alcohol 2/353
LA JOYA ISD - 9TH GRADE CENTERSPRING 1996
TABLE B1: PREVALENCE AND RECENCY OF USE OF SELECTED SUBSTANCES--> ALL STUDENTS
EVER PAST SCHOOL NOT PAST NEVERUSED MONTH YEAR YEAR USED
____________________________________________________________________________TOBACCO 44.5% 15.2% 12.1% 17.2% 55.5%
ALCOHOL 63.8% 30.3% 17.2% 16.2% 36.2%
ADJ-INHALANTS 14.7% 3.9% 3.1% 7.7% 85.3%
ANY ILLICIT DRUG 19.8% 7.7% 5.9% 6.2% 80.2%
MARIJUANA 15.4% 5.1% 4.4% 5.9% 84.6%
MARIJUANA ONLY 5.8% 1.5% 2.0% 2.3% 94.2%
COCAINE OR CRACK 5.4% 1.8% 1.0% 2.6% 94.6%
COCAINE 5.4% 1.6% 1.3% 2.6% 94.6%
CRACK 1.8% 0.5% * % 1.0% 98.2%
HALLUCINOGENS 1.6% 0.5% * % 0.8% 98.4%
UPPERS 3.7% 1.6% 1.0% 1.0% 96.3%
DOWNERS 3.4% 1.3% 1.1% 1.1% 96.6%
STEROIDS 1.0% * % * % 0.8% 99.0%
ECSTASY 0.8% * % * % 0.5% 99.2%
ROACH 10.4% 3.1% 3.1% 4.2% 89.6%____________________________________________________________________________
TABLE B2: PREVALENCE AND RECENCY OF USE OF SELECTED SUBSTANCES
8/6/2019 la joya isd - 9th grade center - 1996 Texas School Survey of Drug and Alcohol Use
http://slidepdf.com/reader/full/la-joya-isd-9th-grade-center-1996-texas-school-survey-of-drug-and-alcohol 3/353
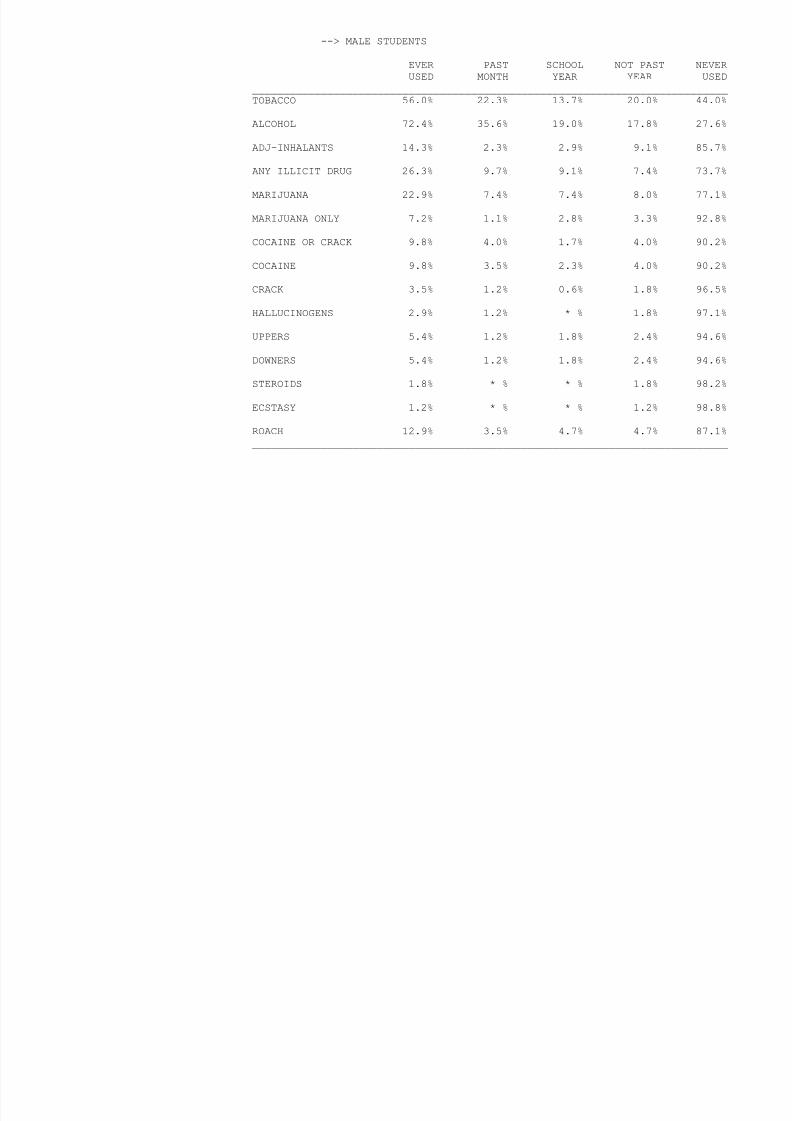
--> MALE STUDENTS
EVER PAST SCHOOL NOT PAST NEVERUSED MONTH YEAR YEAR USED
____________________________________________________________________________TOBACCO 56.0% 22.3% 13.7% 20.0% 44.0%
ALCOHOL 72.4% 35.6% 19.0% 17.8% 27.6%
ADJ-INHALANTS 14.3% 2.3% 2.9% 9.1% 85.7%
ANY ILLICIT DRUG 26.3% 9.7% 9.1% 7.4% 73.7%
MARIJUANA 22.9% 7.4% 7.4% 8.0% 77.1%
MARIJUANA ONLY 7.2% 1.1% 2.8% 3.3% 92.8%
COCAINE OR CRACK 9.8% 4.0% 1.7% 4.0% 90.2%
COCAINE 9.8% 3.5% 2.3% 4.0% 90.2%
CRACK 3.5% 1.2% 0.6% 1.8% 96.5%
HALLUCINOGENS 2.9% 1.2% * % 1.8% 97.1%
UPPERS 5.4% 1.2% 1.8% 2.4% 94.6%
DOWNERS 5.4% 1.2% 1.8% 2.4% 94.6%
STEROIDS 1.8% * % * % 1.8% 98.2%
ECSTASY 1.2% * % * % 1.2% 98.8%
ROACH 12.9% 3.5% 4.7% 4.7% 87.1%____________________________________________________________________________

8/6/2019 la joya isd - 9th grade center - 1996 Texas School Survey of Drug and Alcohol Use
http://slidepdf.com/reader/full/la-joya-isd-9th-grade-center-1996-texas-school-survey-of-drug-and-alcohol 4/353
LA JOYA ISD - 9TH GRADE CENTERSPRING 1996
TABLE B3: PREVALENCE AND RECENCY OF USE OF SELECTED SUBSTANCES--> FEMALE STUDENTS
EVER PAST SCHOOL NOT PAST NEVERUSED MONTH YEAR YEAR USED
____________________________________________________________________________TOBACCO 35.2% 9.4% 10.8% 15.0% 64.8%
ALCOHOL 56.5% 26.2% 15.9% 14.5% 43.5%
ADJ-INHALANTS 15.1% 5.2% 3.3% 6.6% 84.9%
ANY ILLICIT DRUG 14.6% 6.1% 3.3% 5.2% 85.4%
MARIJUANA 9.4% 3.3% 1.9% 4.2% 90.6%
MARIJUANA ONLY 4.6% 1.8% 1.4% 1.4% 95.4%
COCAINE OR CRACK 1.9% * % * % 1.4% 98.1%
COCAINE 1.9% * % * % 1.4% 98.1%
CRACK * % * % * % * % 99.5%
HALLUCINOGENS * % * % * % * % 99.5%
UPPERS 2.4% 1.9% * % * % 97.6%
DOWNERS 1.9% 1.4% * % * % 98.1%
STEROIDS * % * % * % * % 99.5%
ECSTASY * % * % * % * % 99.5%
ROACH 8.5% 2.8% 1.9% 3.8% 91.5%____________________________________________________________________________
TABLE B4: PREVALENCE AND RECENCY OF USE OF SELECTED SUBSTANCES
8/6/2019 la joya isd - 9th grade center - 1996 Texas School Survey of Drug and Alcohol Use
http://slidepdf.com/reader/full/la-joya-isd-9th-grade-center-1996-texas-school-survey-of-drug-and-alcohol 5/353
--> WHITE STUDENTS
EVER PAST SCHOOL NOT PAST NEVERUSED MONTH YEAR YEAR USED
____________________________________________________________________________TOBACCO * % * % * % * % * %
ALCOHOL * % * % * % * % * %
ADJ-INHALANTS * % * % * % * % * %
ANY ILLICIT DRUG * % * % * % * % * %
MARIJUANA * % * % * % * % * %
MARIJUANA ONLY * % * % * % * % * %
COCAINE OR CRACK * % * % * % * % * %
COCAINE * % * % * % * % * %
CRACK * % * % * % * % * %
HALLUCINOGENS * % * % * % * % * %
UPPERS * % * % * % * % * %
DOWNERS * % * % * % * % * %
STEROIDS * % * % * % * % * %
ECSTASY * % * % * % * % * %
ROACH * % * % * % * % * %____________________________________________________________________________
8/6/2019 la joya isd - 9th grade center - 1996 Texas School Survey of Drug and Alcohol Use
http://slidepdf.com/reader/full/la-joya-isd-9th-grade-center-1996-texas-school-survey-of-drug-and-alcohol 6/353
LA JOYA ISD - 9TH GRADE CENTERSPRING 1996
TABLE B5: PREVALENCE AND RECENCY OF USE OF SELECTED SUBSTANCES--> AFRICAN/AMERICAN STUDENTS
EVER PAST SCHOOL NOT PAST NEVERUSED MONTH YEAR YEAR USED
____________________________________________________________________________TOBACCO * % * % * % * % * %
ALCOHOL * % * % * % * % * %
ADJ-INHALANTS * % * % * % * % * %
ANY ILLICIT DRUG * % * % * % * % * %
MARIJUANA * % * % * % * % * %
MARIJUANA ONLY * % * % * % * % * %
COCAINE OR CRACK * % * % * % * % * %
COCAINE * % * % * % * % * %
CRACK * % * % * % * % * %
HALLUCINOGENS * % * % * % * % * %
UPPERS * % * % * % * % * %
DOWNERS * % * % * % * % * %
STEROIDS * % * % * % * % * %
ECSTASY * % * % * % * % * %
ROACH * % * % * % * % * %____________________________________________________________________________
TABLE B6: PREVALENCE AND RECENCY OF USE OF SELECTED SUBSTANCES
8/6/2019 la joya isd - 9th grade center - 1996 Texas School Survey of Drug and Alcohol Use
http://slidepdf.com/reader/full/la-joya-isd-9th-grade-center-1996-texas-school-survey-of-drug-and-alcohol 7/353
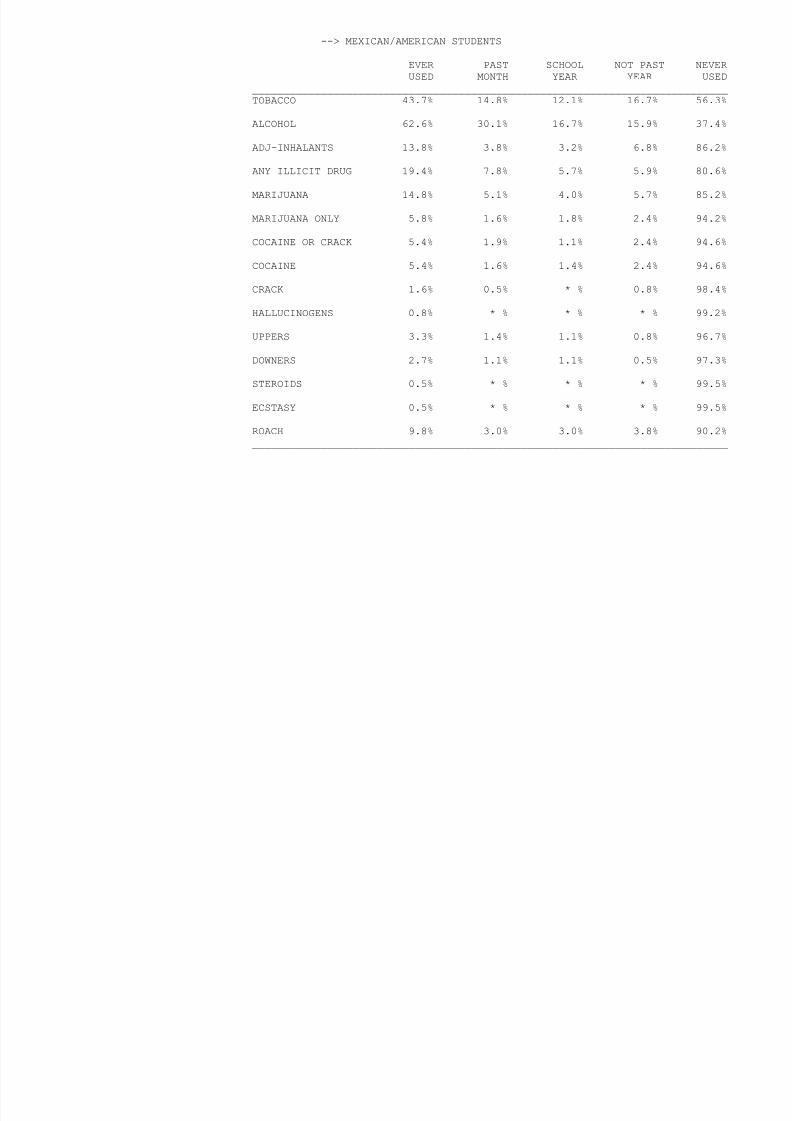
--> MEXICAN/AMERICAN STUDENTS
EVER PAST SCHOOL NOT PAST NEVERUSED MONTH YEAR YEAR USED
____________________________________________________________________________TOBACCO 43.7% 14.8% 12.1% 16.7% 56.3%
ALCOHOL 62.6% 30.1% 16.7% 15.9% 37.4%
ADJ-INHALANTS 13.8% 3.8% 3.2% 6.8% 86.2%
ANY ILLICIT DRUG 19.4% 7.8% 5.7% 5.9% 80.6%
MARIJUANA 14.8% 5.1% 4.0% 5.7% 85.2%
MARIJUANA ONLY 5.8% 1.6% 1.8% 2.4% 94.2%
COCAINE OR CRACK 5.4% 1.9% 1.1% 2.4% 94.6%
COCAINE 5.4% 1.6% 1.4% 2.4% 94.6%
CRACK 1.6% 0.5% * % 0.8% 98.4%
HALLUCINOGENS 0.8% * % * % * % 99.2%
UPPERS 3.3% 1.4% 1.1% 0.8% 96.7%
DOWNERS 2.7% 1.1% 1.1% 0.5% 97.3%
STEROIDS 0.5% * % * % * % 99.5%
ECSTASY 0.5% * % * % * % 99.5%
ROACH 9.8% 3.0% 3.0% 3.8% 90.2%____________________________________________________________________________

8/6/2019 la joya isd - 9th grade center - 1996 Texas School Survey of Drug and Alcohol Use
http://slidepdf.com/reader/full/la-joya-isd-9th-grade-center-1996-texas-school-survey-of-drug-and-alcohol 8/353
LA JOYA ISD - 9TH GRADE CENTERSPRING 1996
TABLE B7: PREVALENCE AND RECENCY OF USE OF SELECTED SUBSTANCES--> STUDENTS REPORTING A AND B GRADES
EVER PAST SCHOOL NOT PAST NEVERUSED MONTH YEAR YEAR USED
____________________________________________________________________________TOBACCO 43.4% 14.5% 10.6% 18.3% 56.6%
ALCOHOL 63.8% 28.8% 17.6% 17.3% 36.2%
ADJ-INHALANTS 12.6% 3.9% 2.3% 6.5% 87.4%
ANY ILLICIT DRUG 18.0% 6.1% 5.5% 6.4% 82.0%
MARIJUANA 13.2% 3.5% 3.9% 5.8% 86.8%
MARIJUANA ONLY 5.0% 1.3% 1.6% 2.2% 95.0%
COCAINE OR CRACK 5.1% 1.3% 1.3% 2.6% 94.9%
COCAINE 5.1% 1.0% 1.6% 2.6% 94.9%
CRACK 1.6% * % * % 1.3% 98.4%
HALLUCINOGENS 1.9% 0.6% * % 1.0% 98.1%
UPPERS 3.3% 1.3% 0.7% 1.3% 96.7%
DOWNERS 3.3% 1.0% 1.0% 1.3% 96.7%
STEROIDS 1.3% * % * % 1.0% 98.7%
ECSTASY 1.0% * % * % 0.6% 99.0%
ROACH 9.1% 2.6% 2.6% 3.9% 90.9%____________________________________________________________________________
TABLE B8: PREVALENCE AND RECENCY OF USE OF SELECTED SUBSTANCES

8/6/2019 la joya isd - 9th grade center - 1996 Texas School Survey of Drug and Alcohol Use
http://slidepdf.com/reader/full/la-joya-isd-9th-grade-center-1996-texas-school-survey-of-drug-and-alcohol 9/353
--> STUDENTS REPORTING C, D, AND F GRADES
EVER PAST SCHOOL NOT PAST NEVERUSED MONTH YEAR YEAR USED
____________________________________________________________________________TOBACCO 50.0% 21.0% 16.1% 12.9% 50.0%
ALCOHOL 62.9% 33.9% 14.5% 14.5% 37.1%
ADJ-INHALANTS 24.2% 3.2% 6.5% 14.5% 75.8%
ANY ILLICIT DRUG 32.3% 17.7% 9.7% 4.8% 67.7%
MARIJUANA 29.0% 14.5% 8.1% 6.5% 71.0%
MARIJUANA ONLY 10.8% 3.1% 4.6% 3.1% 89.2%
COCAINE OR CRACK 8.2% 4.9% * % 3.3% 91.8%
COCAINE 8.2% 4.9% * % 3.3% 91.8%
CRACK 3.3% 1.6% 1.6% * % 96.7%
HALLUCINOGENS * % * % * % * % 100%
UPPERS 6.7% 3.3% 3.3% * % 93.3%
DOWNERS 5.1% 3.4% 1.7% * % 94.9%
STEROIDS * % * % * % * % 100%
ECSTASY * % * % * % * % 100%
ROACH 18.0% 6.6% 6.6% 4.9% 82.0%____________________________________________________________________________

8/6/2019 la joya isd - 9th grade center - 1996 Texas School Survey of Drug and Alcohol Use
http://slidepdf.com/reader/full/la-joya-isd-9th-grade-center-1996-texas-school-survey-of-drug-and-alcohol 10/353

8/6/2019 la joya isd - 9th grade center - 1996 Texas School Survey of Drug and Alcohol Use
http://slidepdf.com/reader/full/la-joya-isd-9th-grade-center-1996-texas-school-survey-of-drug-and-alcohol 11/353
--> STUDENTS NOT LIVING WITH TWO PARENTS
EVER PAST SCHOOL NOT PAST NEVERUSED MONTH YEAR YEAR USED
____________________________________________________________________________TOBACCO 62.0% 23.9% 15.5% 22.5% 38.0%
ALCOHOL 74.6% 42.3% 18.3% 14.1% 25.4%
ADJ-INHALANTS 16.9% 5.6% 2.8% 8.5% 83.1%
ANY ILLICIT DRUG 26.8% 14.1% 4.2% 8.5% 73.2%
MARIJUANA 19.7% 8.5% 4.2% 7.0% 80.3%
MARIJUANA ONLY 8.0% 4.0% * % 4.0% 92.0%
COCAINE OR CRACK 2.8% 2.8% * % * % 97.2%
COCAINE 2.8% 2.8% * % * % 97.2%
CRACK 2.9% 1.4% 1.4% * % 97.1%
HALLUCINOGENS * % * % * % * % 100%
UPPERS 5.7% 2.9% 1.4% 1.4% 94.3%
DOWNERS 2.9% 2.9% * % * % 97.1%
STEROIDS 4.2% * % 1.4% 2.8% 95.8%
ECSTASY 1.4% 1.4% * % * % 98.6%
ROACH 15.9% 4.3% 4.3% 7.2% 84.1%____________________________________________________________________________

8/6/2019 la joya isd - 9th grade center - 1996 Texas School Survey of Drug and Alcohol Use
http://slidepdf.com/reader/full/la-joya-isd-9th-grade-center-1996-texas-school-survey-of-drug-and-alcohol 12/353
LA JOYA ISD - 9TH GRADE CENTERSPRING 1996
TABLE B11: PREVALENCE AND RECENCY OF USE OF SELECTED SUBSTANCES--> STUDENTS WHO WOULD SEEK HELP FROM ADULTS FOR SUBSTANCE ABUSE
PROBLEMS
EVER PAST SCHOOL NOT PAST NEVERUSED MONTH YEAR YEAR USED
____________________________________________________________________________TOBACCO 41.7% 12.8% 13.4% 15.5% 58.3%
ALCOHOL 60.6% 30.9% 14.9% 14.9% 39.4%
ADJ-INHALANTS 12.3% 2.1% 2.7% 7.5% 87.7%
ANY ILLICIT DRUG 17.6% 6.9% 5.9% 4.8% 82.4%
MARIJUANA 13.8% 4.8% 4.3% 4.8% 86.2%
MARIJUANA ONLY 7.4% 2.1% 2.6% 2.6% 92.6%
COCAINE OR CRACK 2.1% 1.6% * % 0.5% 97.9%
COCAINE 2.1% 1.6% * % 0.5% 97.9%
CRACK 1.1% 0.5% * % 0.5% 98.9%
HALLUCINOGENS 1.1% 0.5% 0.5% * % 98.9%
UPPERS 2.7% 1.6% 0.5% 0.5% 97.3%
DOWNERS 2.2% 1.6% 0.5% * % 97.8%
STEROIDS 0.5% * % * % 0.5% 99.5%
ECSTASY 0.5% * % * % 0.5% 99.5%
ROACH 5.9% 1.1% 1.1% 3.8% 94.1%____________________________________________________________________________
8/6/2019 la joya isd - 9th grade center - 1996 Texas School Survey of Drug and Alcohol Use
http://slidepdf.com/reader/full/la-joya-isd-9th-grade-center-1996-texas-school-survey-of-drug-and-alcohol 13/353
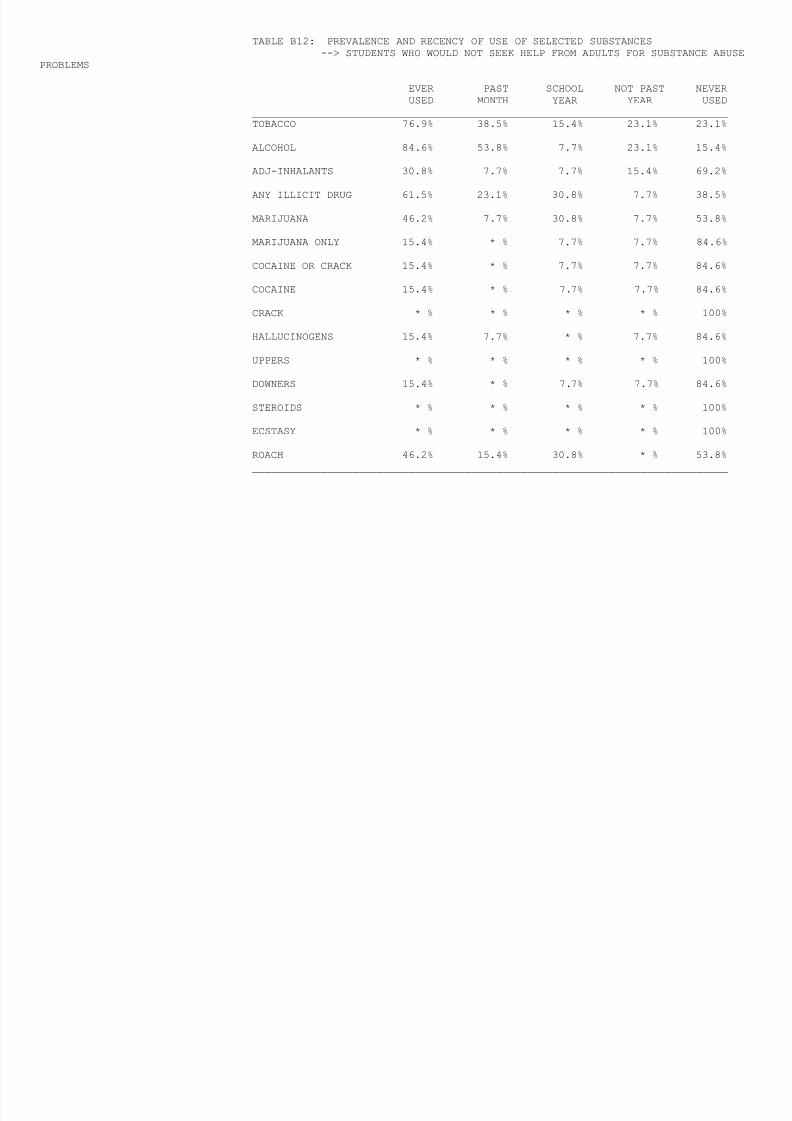
TABLE B12: PREVALENCE AND RECENCY OF USE OF SELECTED SUBSTANCES--> STUDENTS WHO WOULD NOT SEEK HELP FROM ADULTS FOR SUBSTANCE ABUSE
PROBLEMS
EVER PAST SCHOOL NOT PAST NEVERUSED MONTH YEAR YEAR USED
____________________________________________________________________________TOBACCO 76.9% 38.5% 15.4% 23.1% 23.1%
ALCOHOL 84.6% 53.8% 7.7% 23.1% 15.4%
ADJ-INHALANTS 30.8% 7.7% 7.7% 15.4% 69.2%
ANY ILLICIT DRUG 61.5% 23.1% 30.8% 7.7% 38.5%
MARIJUANA 46.2% 7.7% 30.8% 7.7% 53.8%
MARIJUANA ONLY 15.4% * % 7.7% 7.7% 84.6%
COCAINE OR CRACK 15.4% * % 7.7% 7.7% 84.6%
COCAINE 15.4% * % 7.7% 7.7% 84.6%
CRACK * % * % * % * % 100%
HALLUCINOGENS 15.4% 7.7% * % 7.7% 84.6%
UPPERS * % * % * % * % 100%
DOWNERS 15.4% * % 7.7% 7.7% 84.6%
STEROIDS * % * % * % * % 100%
ECSTASY * % * % * % * % 100%
ROACH 46.2% 15.4% 30.8% * % 53.8%____________________________________________________________________________
8/6/2019 la joya isd - 9th grade center - 1996 Texas School Survey of Drug and Alcohol Use
http://slidepdf.com/reader/full/la-joya-isd-9th-grade-center-1996-texas-school-survey-of-drug-and-alcohol 14/353
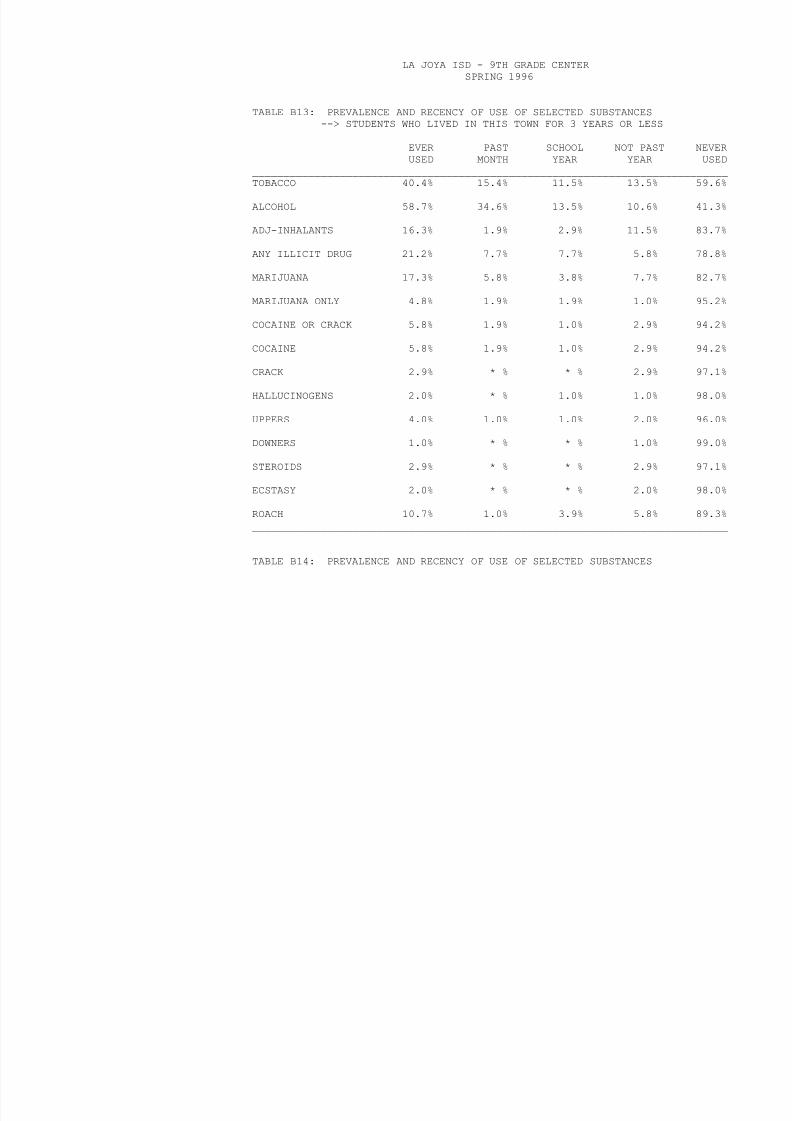
LA JOYA ISD - 9TH GRADE CENTERSPRING 1996
TABLE B13: PREVALENCE AND RECENCY OF USE OF SELECTED SUBSTANCES--> STUDENTS WHO LIVED IN THIS TOWN FOR 3 YEARS OR LESS
EVER PAST SCHOOL NOT PAST NEVERUSED MONTH YEAR YEAR USED
____________________________________________________________________________TOBACCO 40.4% 15.4% 11.5% 13.5% 59.6%
ALCOHOL 58.7% 34.6% 13.5% 10.6% 41.3%
ADJ-INHALANTS 16.3% 1.9% 2.9% 11.5% 83.7%
ANY ILLICIT DRUG 21.2% 7.7% 7.7% 5.8% 78.8%
MARIJUANA 17.3% 5.8% 3.8% 7.7% 82.7%
MARIJUANA ONLY 4.8% 1.9% 1.9% 1.0% 95.2%
COCAINE OR CRACK 5.8% 1.9% 1.0% 2.9% 94.2%
COCAINE 5.8% 1.9% 1.0% 2.9% 94.2%
CRACK 2.9% * % * % 2.9% 97.1%
HALLUCINOGENS 2.0% * % 1.0% 1.0% 98.0%
UPPERS 4.0% 1.0% 1.0% 2.0% 96.0%
DOWNERS 1.0% * % * % 1.0% 99.0%
STEROIDS 2.9% * % * % 2.9% 97.1%
ECSTASY 2.0% * % * % 2.0% 98.0%
ROACH 10.7% 1.0% 3.9% 5.8% 89.3%____________________________________________________________________________
TABLE B14: PREVALENCE AND RECENCY OF USE OF SELECTED SUBSTANCES
8/6/2019 la joya isd - 9th grade center - 1996 Texas School Survey of Drug and Alcohol Use
http://slidepdf.com/reader/full/la-joya-isd-9th-grade-center-1996-texas-school-survey-of-drug-and-alcohol 15/353
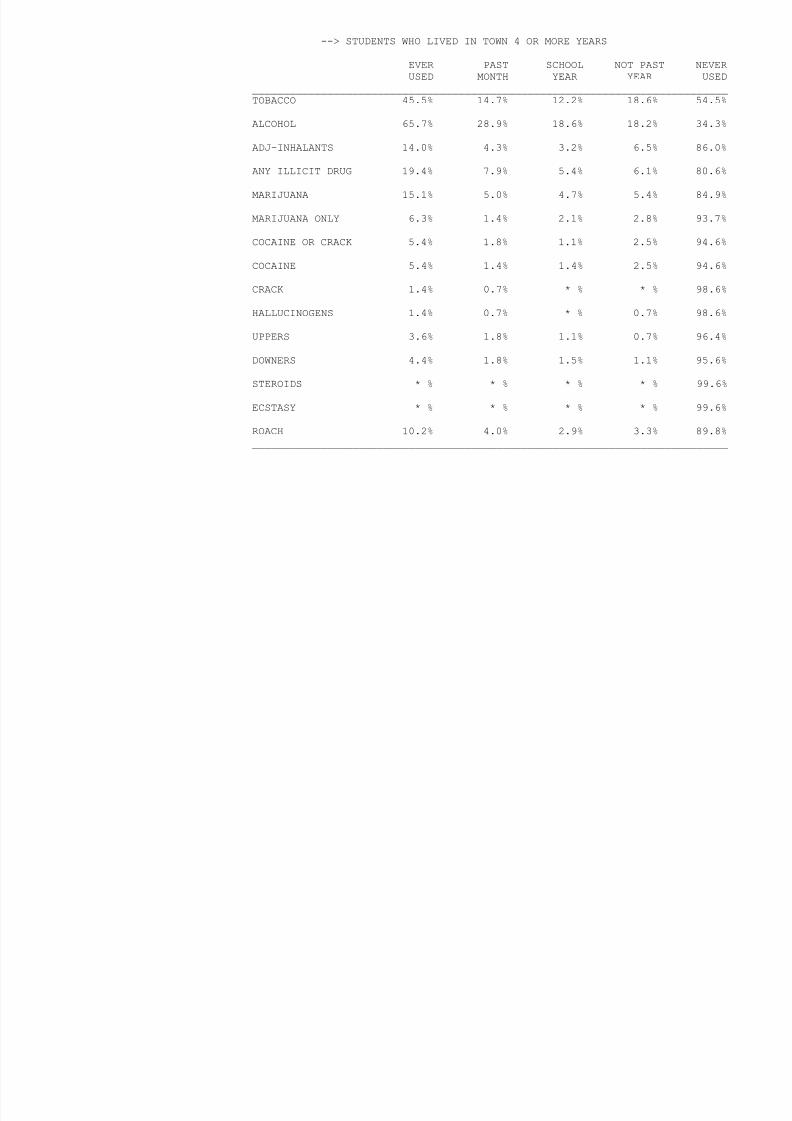
--> STUDENTS WHO LIVED IN TOWN 4 OR MORE YEARS
EVER PAST SCHOOL NOT PAST NEVERUSED MONTH YEAR YEAR USED
____________________________________________________________________________TOBACCO 45.5% 14.7% 12.2% 18.6% 54.5%
ALCOHOL 65.7% 28.9% 18.6% 18.2% 34.3%
ADJ-INHALANTS 14.0% 4.3% 3.2% 6.5% 86.0%
ANY ILLICIT DRUG 19.4% 7.9% 5.4% 6.1% 80.6%
MARIJUANA 15.1% 5.0% 4.7% 5.4% 84.9%
MARIJUANA ONLY 6.3% 1.4% 2.1% 2.8% 93.7%
COCAINE OR CRACK 5.4% 1.8% 1.1% 2.5% 94.6%
COCAINE 5.4% 1.4% 1.4% 2.5% 94.6%
CRACK 1.4% 0.7% * % * % 98.6%
HALLUCINOGENS 1.4% 0.7% * % 0.7% 98.6%
UPPERS 3.6% 1.8% 1.1% 0.7% 96.4%
DOWNERS 4.4% 1.8% 1.5% 1.1% 95.6%
STEROIDS * % * % * % * % 99.6%
ECSTASY * % * % * % * % 99.6%
ROACH 10.2% 4.0% 2.9% 3.3% 89.8%____________________________________________________________________________
8/6/2019 la joya isd - 9th grade center - 1996 Texas School Survey of Drug and Alcohol Use
http://slidepdf.com/reader/full/la-joya-isd-9th-grade-center-1996-texas-school-survey-of-drug-and-alcohol 16/353
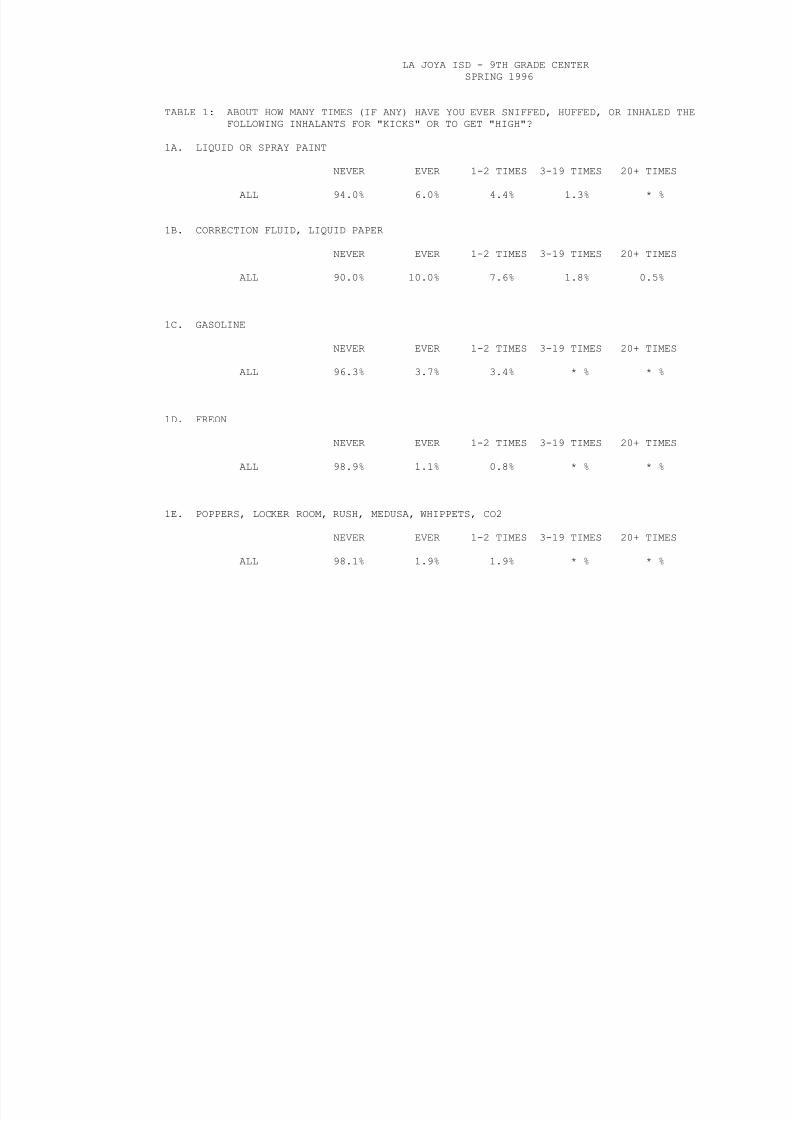
LA JOYA ISD - 9TH GRADE CENTERSPRING 1996
TABLE 1: ABOUT HOW MANY TIMES (IF ANY) HAVE YOU EVER SNIFFED, HUFFED, OR INHALED THEFOLLOWING INHALANTS FOR "KICKS" OR TO GET "HIGH"?
1A. LIQUID OR SPRAY PAINT
NEVER EVER 1-2 TIMES 3-19 TIMES 20+ TIMES
ALL 94.0% 6.0% 4.4% 1.3% * %
1B. CORRECTION FLUID, LIQUID PAPER
NEVER EVER 1-2 TIMES 3-19 TIMES 20+ TIMES
ALL 90.0% 10.0% 7.6% 1.8% 0.5%
1C. GASOLINE
NEVER EVER 1-2 TIMES 3-19 TIMES 20+ TIMES
ALL 96.3% 3.7% 3.4% * % * %
1D. FREON
NEVER EVER 1-2 TIMES 3-19 TIMES 20+ TIMES
ALL 98.9% 1.1% 0.8% * % * %
1E. POPPERS, LOCKER ROOM, RUSH, MEDUSA, WHIPPETS, CO2
NEVER EVER 1-2 TIMES 3-19 TIMES 20+ TIMES
ALL 98.1% 1.9% 1.9% * % * %

8/6/2019 la joya isd - 9th grade center - 1996 Texas School Survey of Drug and Alcohol Use
http://slidepdf.com/reader/full/la-joya-isd-9th-grade-center-1996-texas-school-survey-of-drug-and-alcohol 17/353
1F. SHOE SHINE, TEXAS SHINE
NEVER EVER 1-2 TIMES 3-19 TIMES 20+ TIMES
ALL 98.4% 1.6% 1.3% * % * %
1G. GLUE
NEVER EVER 1-2 TIMES 3-19 TIMES 20+ TIMES
ALL 95.2% 4.8% 4.0% 0.5% * %
1H. PAINT OR LACQUER THINNER, TOLUENE, OTHER SOLVENTS
NEVER EVER 1-2 TIMES 3-19 TIMES 20+ TIMES
ALL 96.3% 3.7% 2.4% 1.1% * %
8/6/2019 la joya isd - 9th grade center - 1996 Texas School Survey of Drug and Alcohol Use
http://slidepdf.com/reader/full/la-joya-isd-9th-grade-center-1996-texas-school-survey-of-drug-and-alcohol 18/353
LA JOYA ISD - 9TH GRADE CENTERSPRING 1996
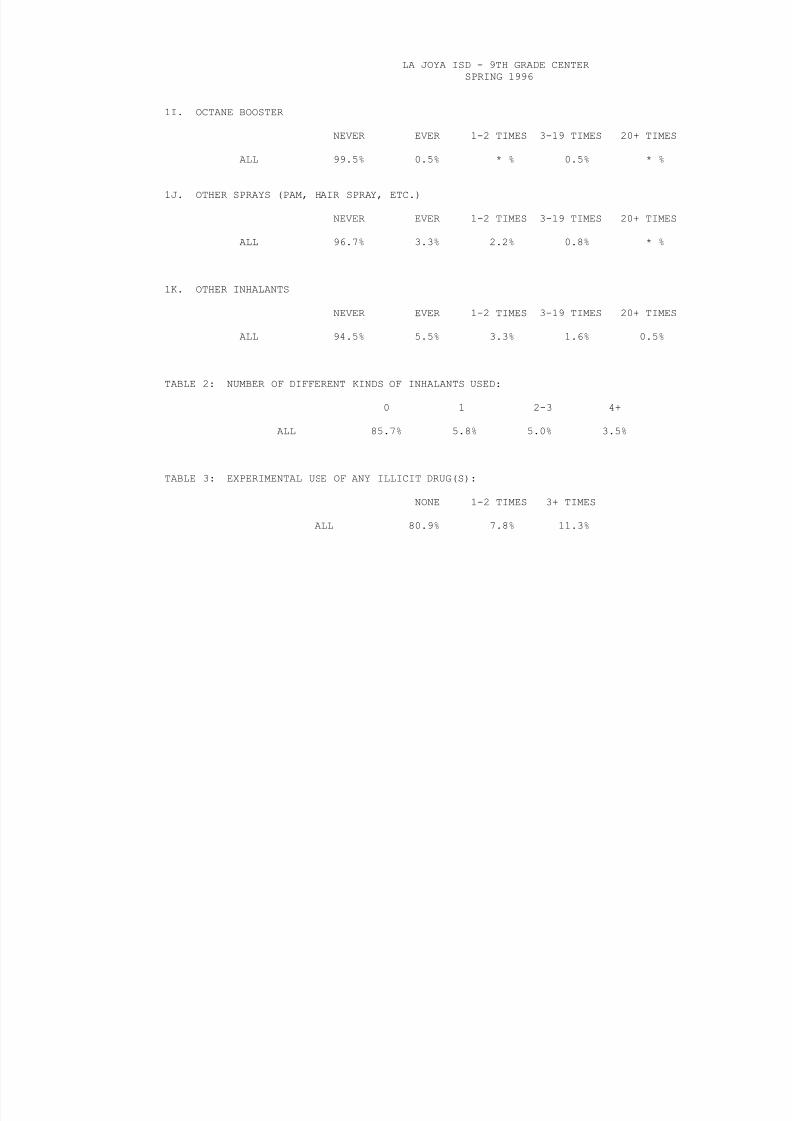
1I. OCTANE BOOSTER
NEVER EVER 1-2 TIMES 3-19 TIMES 20+ TIMES
ALL 99.5% 0.5% * % 0.5% * %
1J. OTHER SPRAYS (PAM, HAIR SPRAY, ETC.)
NEVER EVER 1-2 TIMES 3-19 TIMES 20+ TIMES
ALL 96.7% 3.3% 2.2% 0.8% * %
1K. OTHER INHALANTS
NEVER EVER 1-2 TIMES 3-19 TIMES 20+ TIMES
ALL 94.5% 5.5% 3.3% 1.6% 0.5%
TABLE 2: NUMBER OF DIFFERENT KINDS OF INHALANTS USED:
0 1 2-3 4+
ALL 85.7% 5.8% 5.0% 3.5%
TABLE 3: EXPERIMENTAL USE OF ANY ILLICIT DRUG(S):
NONE 1-2 TIMES 3+ TIMES
ALL 80.9% 7.8% 11.3%

8/6/2019 la joya isd - 9th grade center - 1996 Texas School Survey of Drug and Alcohol Use
http://slidepdf.com/reader/full/la-joya-isd-9th-grade-center-1996-texas-school-survey-of-drug-and-alcohol 19/353
TABLE 4: AVERAGE NUMBER OF TIMES ILLICIT SUBSTANCES WERE USED:
PAST MONTH LIFE TIME
ALL 0.5 2.1
TABLE 5: IN THE PAST 30 DAYS, HAVE YOU SMOKED CIGARETTES?
NO YES
ALL 85.3% 14.7%
TABLE 6: ABOUT HOW MANY OF YOUR CLOSE FRIENDS USE...
6A. ALCOHOL (BEER, WINE COOLERS, WINE, HARD LIQUOR)?
NEVERHEARD OF NONE A FEW SOME MOST ALL
ALL 3.0% 22.4% 32.1% 19.1% 13.9% 9.4%

8/6/2019 la joya isd - 9th grade center - 1996 Texas School Survey of Drug and Alcohol Use
http://slidepdf.com/reader/full/la-joya-isd-9th-grade-center-1996-texas-school-survey-of-drug-and-alcohol 20/353
LA JOYA ISD - 9TH GRADE CENTERSPRING 1996
6B. INHALANTS (SPRAY, GLUE, GASOLINE, ETC.)?
NEVERHEARD OF NONE A FEW SOME MOST ALL
ALL 9.9% 70.0% 12.5% 4.4% 2.3% 0.9%
6C. MARIJUANA?
NEVERHEARD OF NONE A FEW SOME MOST ALL
ALL 5.8% 54.8% 20.1% 8.7% 7.3% 3.2%
TABLE 7: HOW MANY OF YOUR FRIENDS...
7A. FEEL CLOSE TO THEIR PARENTS?
NONE A FEW SOME MOST ALL
ALL 10.1% 25.5% 23.2% 29.4% 11.9%
7B. SOMETIMES CARRY WEAPONS?
NONE A FEW SOME MOST ALL
ALL 64.6% 18.8% 10.4% 3.4% 2.9%
7C. CARE ABOUT MAKING GOOD GRADES?
NONE A FEW SOME MOST ALL
8/6/2019 la joya isd - 9th grade center - 1996 Texas School Survey of Drug and Alcohol Use
http://slidepdf.com/reader/full/la-joya-isd-9th-grade-center-1996-texas-school-survey-of-drug-and-alcohol 21/353
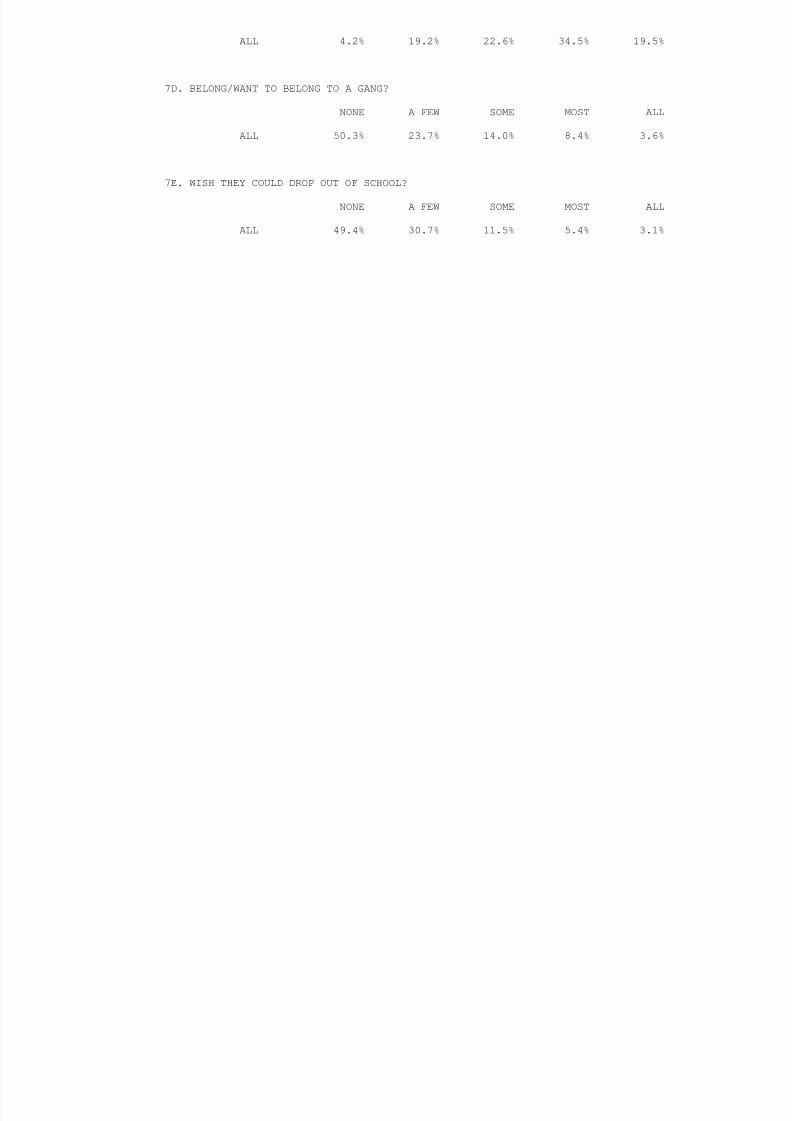
ALL 4.2% 19.2% 22.6% 34.5% 19.5%
7D. BELONG/WANT TO BELONG TO A GANG?
NONE A FEW SOME MOST ALL
ALL 50.3% 23.7% 14.0% 8.4% 3.6%
7E. WISH THEY COULD DROP OUT OF SCHOOL?
NONE A FEW SOME MOST ALL
ALL 49.4% 30.7% 11.5% 5.4% 3.1%
8/6/2019 la joya isd - 9th grade center - 1996 Texas School Survey of Drug and Alcohol Use
http://slidepdf.com/reader/full/la-joya-isd-9th-grade-center-1996-texas-school-survey-of-drug-and-alcohol 22/353
LA JOYA ISD - 9TH GRADE CENTERSPRING 1996
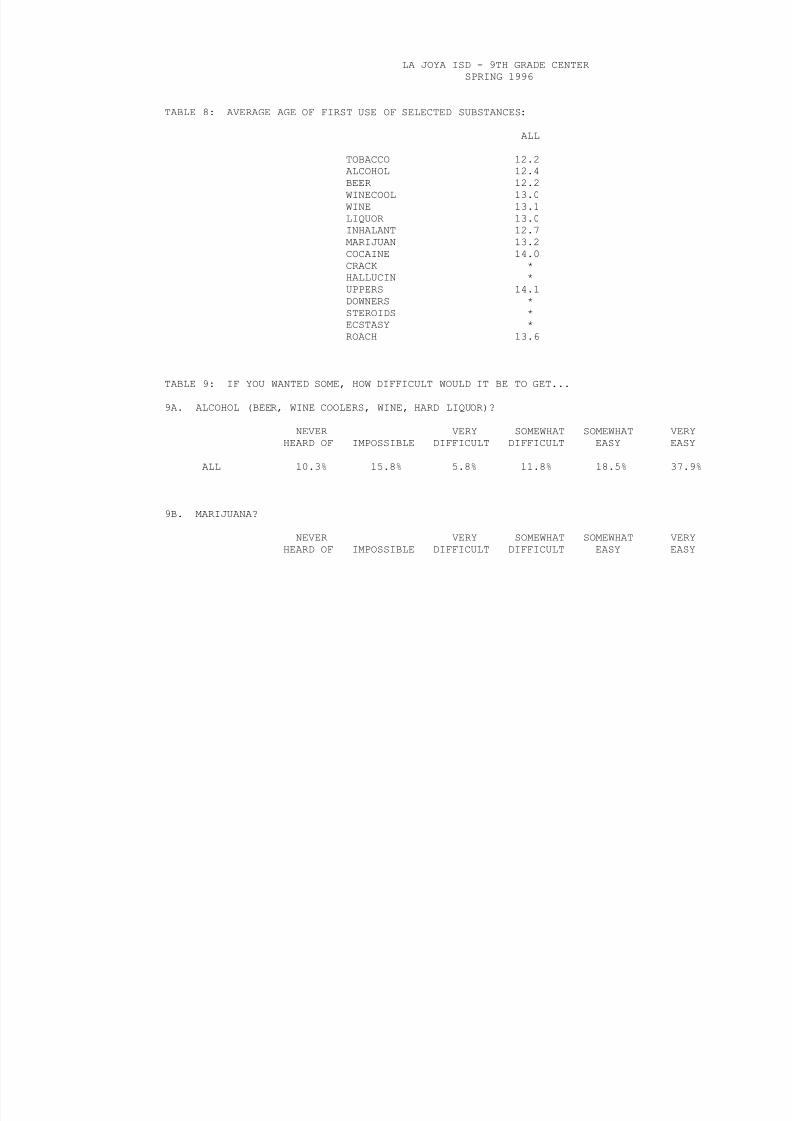
TABLE 8: AVERAGE AGE OF FIRST USE OF SELECTED SUBSTANCES:
ALL
TOBACCO 12.2ALCOHOL 12.4BEER 12.2WINECOOL 13.0WINE 13.1LIQUOR 13.0INHALANT 12.7MARIJUAN 13.2COCAINE 14.0CRACK *
HALLUCIN *UPPERS 14.1DOWNERS *STEROIDS *ECSTASY *ROACH 13.6
TABLE 9: IF YOU WANTED SOME, HOW DIFFICULT WOULD IT BE TO GET...
9A. ALCOHOL (BEER, WINE COOLERS, WINE, HARD LIQUOR)?
NEVER VERY SOMEWHAT SOMEWHAT VERYHEARD OF IMPOSSIBLE DIFFICULT DIFFICULT EASY EASY
ALL 10.3% 15.8% 5.8% 11.8% 18.5% 37.9%
9B. MARIJUANA?
NEVER VERY SOMEWHAT SOMEWHAT VERYHEARD OF IMPOSSIBLE DIFFICULT DIFFICULT EASY EASY

8/6/2019 la joya isd - 9th grade center - 1996 Texas School Survey of Drug and Alcohol Use
http://slidepdf.com/reader/full/la-joya-isd-9th-grade-center-1996-texas-school-survey-of-drug-and-alcohol 23/353
ALL 19.4% 36.9% 9.1% 9.1% 6.8% 18.8%
9C. COCAINE?
NEVER VERY SOMEWHAT SOMEWHAT VERYHEARD OF IMPOSSIBLE DIFFICULT DIFFICULT EASY EASY
ALL 21.2% 40.8% 10.3% 7.7% 7.7% 12.2%
9D. CRACK?
NEVER VERY SOMEWHAT SOMEWHAT VERYHEARD OF IMPOSSIBLE DIFFICULT DIFFICULT EASY EASY
ALL 23.7% 43.8% 10.1% 8.1% 4.9% 9.4%
9E. HALLUCINOGENS?
NEVER VERY SOMEWHAT SOMEWHAT VERYHEARD OF IMPOSSIBLE DIFFICULT DIFFICULT EASY EASY
ALL 35.7% 39.5% 8.7% 6.4% 3.2% 6.4%

8/6/2019 la joya isd - 9th grade center - 1996 Texas School Survey of Drug and Alcohol Use
http://slidepdf.com/reader/full/la-joya-isd-9th-grade-center-1996-texas-school-survey-of-drug-and-alcohol 24/353
LA JOYA ISD - 9TH GRADE CENTERSPRING 1996
TABLE 10: SINCE SCHOOL BEGAN IN THE FALL, ON HOW MANY DAYS HAVE YOU GOTTEN INTO TROUBLEWITH YOUR TEACHERS BECAUSE OF YOUR DRINKING?
NONE 1 DAY 2-3 DAYS 4+ DAYS
ALL 99.6% * % * % * %
TABLE 11: SINCE SCHOOL BEGAN IN THE FALL, ON HOW MANY DAYS HAVE YOU GOTTEN INTO TROUBLEWITH YOUR TEACHERS BECAUSE OF YOUR DRUG USE?
NONE 1 DAY 2-3 DAYS 4+ DAYS
ALL 98.9% * % 0.8% * %
TABLE 12: 30-DAY PREVALENCE OF USE OF SELECTED SUBSTANCES:
12A. BY ABSENCES DUE TO ILLNESS OR OTHER REASONS
NONE 1 DAY 2-3 DAYS 4+ DAYS
ALCOHOL 20.8% 28.0% 29.8% 34.6%INHALANTS 8.3% 4.0% * % 3.2%
MARIJUANA 10.4% 2.0% 3.5% 6.3%
12B. BY CONDUCT PROBLEMSNONE 1 DAY 2-3 DAYS 4+ DAYS
ALCOHOL 20.4% 52.9% 31.3% 53.7%INHALANTS 1.6% 8.8% 13.3% 4.9%MARIJUANA 3.1% 2.9% 6.7% 19.5%
TABLE 13: SINCE SCHOOL BEGAN IN THE FALL, ON HOW MANY DAYS (IF ANY) HAVE YOU ATTENDED
8/6/2019 la joya isd - 9th grade center - 1996 Texas School Survey of Drug and Alcohol Use
http://slidepdf.com/reader/full/la-joya-isd-9th-grade-center-1996-texas-school-survey-of-drug-and-alcohol 25/353
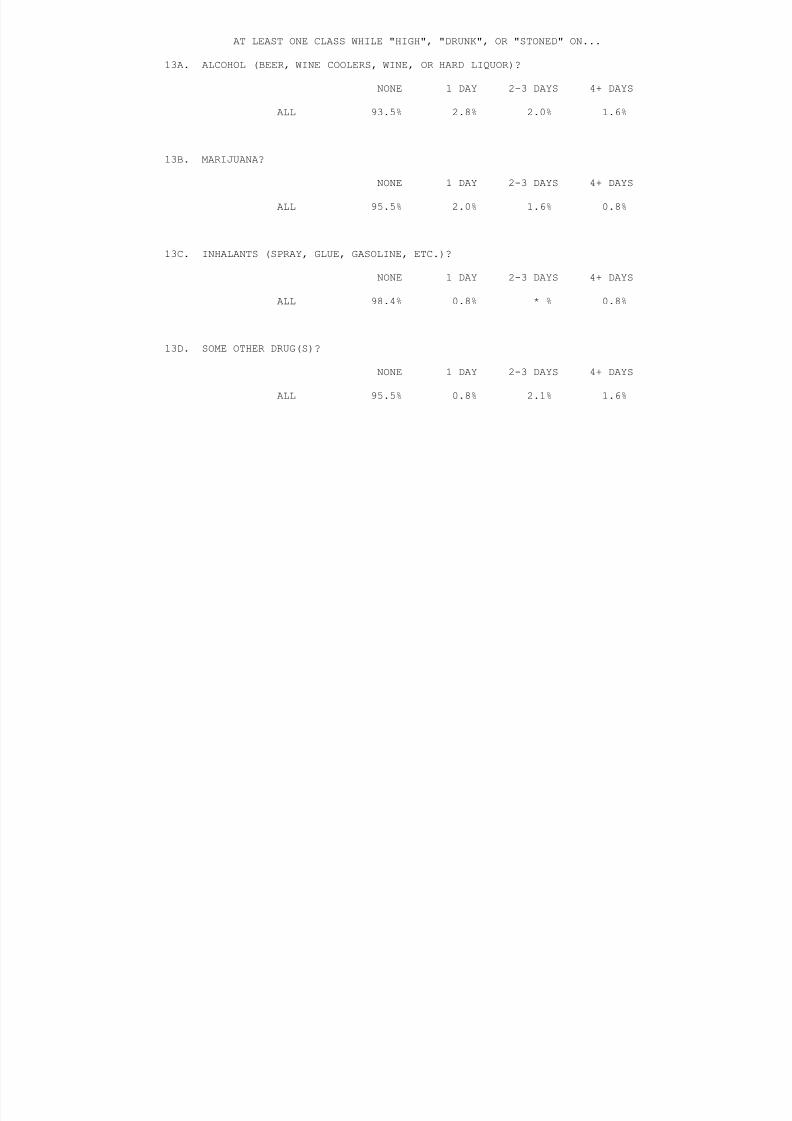
AT LEAST ONE CLASS WHILE "HIGH", "DRUNK", OR "STONED" ON...
13A. ALCOHOL (BEER, WINE COOLERS, WINE, OR HARD LIQUOR)?
NONE 1 DAY 2-3 DAYS 4+ DAYS
ALL 93.5% 2.8% 2.0% 1.6%
13B. MARIJUANA?
NONE 1 DAY 2-3 DAYS 4+ DAYS
ALL 95.5% 2.0% 1.6% 0.8%
13C. INHALANTS (SPRAY, GLUE, GASOLINE, ETC.)?
NONE 1 DAY 2-3 DAYS 4+ DAYS
ALL 98.4% 0.8% * % 0.8%
13D. SOME OTHER DRUG(S)?
NONE 1 DAY 2-3 DAYS 4+ DAYS
ALL 95.5% 0.8% 2.1% 1.6%

8/6/2019 la joya isd - 9th grade center - 1996 Texas School Survey of Drug and Alcohol Use
http://slidepdf.com/reader/full/la-joya-isd-9th-grade-center-1996-texas-school-survey-of-drug-and-alcohol 26/353
LA JOYA ISD - 9TH GRADE CENTERSPRING 1996
TABLE 14: AGE OF FIRST USE OF MARIJUANA BY FAMILY SITUATION:
14A. TWO-PARENT FAMILY
NEVER 9 OR UNDER 10-11 12-13 14-15 16-17 18 OR OVER
ALL 86.2% * % 1.8% 0.7% 1.4% 3.2% 2.1%
14B. OTHER FAMILY SITUATION
NEVER 9 OR UNDER 10-11 12-13 14-15 16-17 18 OR OVER
ALL 79.7% * % * % * % 3.1% 6.3% 9.4%
TABLE 15: DURING THE PAST 12 MONTHS, HOW MANY TIMES HAVE YOU...
15A. GOTTEN INTO DIFFICULTIES OF ANY KIND WITH YOUR FRIENDS BECAUSE OF YOUR DRINKING?
NONE 1 TIME 2-3 TIMES 4+ TIMES
ALL 95.8% 2.9% 0.8% * %
15B. GOTTEN INTO DIFFICULTIES OF ANY KIND WITH YOUR FRIENDS BECAUSE OF YOUR DRUG USE?
NONE 1 TIME 2-3 TIMES 4+ TIMES
ALL 97.9% * % 0.9% 0.9%
15C. BEEN CRITICIZED BY SOMEONE YOU WERE DATING BECAUSE OF DRINKING?
NONE 1 TIME 2-3 TIMES 4+ TIMES

8/6/2019 la joya isd - 9th grade center - 1996 Texas School Survey of Drug and Alcohol Use
http://slidepdf.com/reader/full/la-joya-isd-9th-grade-center-1996-texas-school-survey-of-drug-and-alcohol 27/353
ALL 95.3% 3.0% 1.7% * %
15D. BEEN CRITICIZED BY SOMEONE YOU WERE DATING BECAUSE OF DRUG USE?
NONE 1 TIME 2-3 TIMES 4+ TIMES
ALL 97.4% 1.7% 0.9% * %
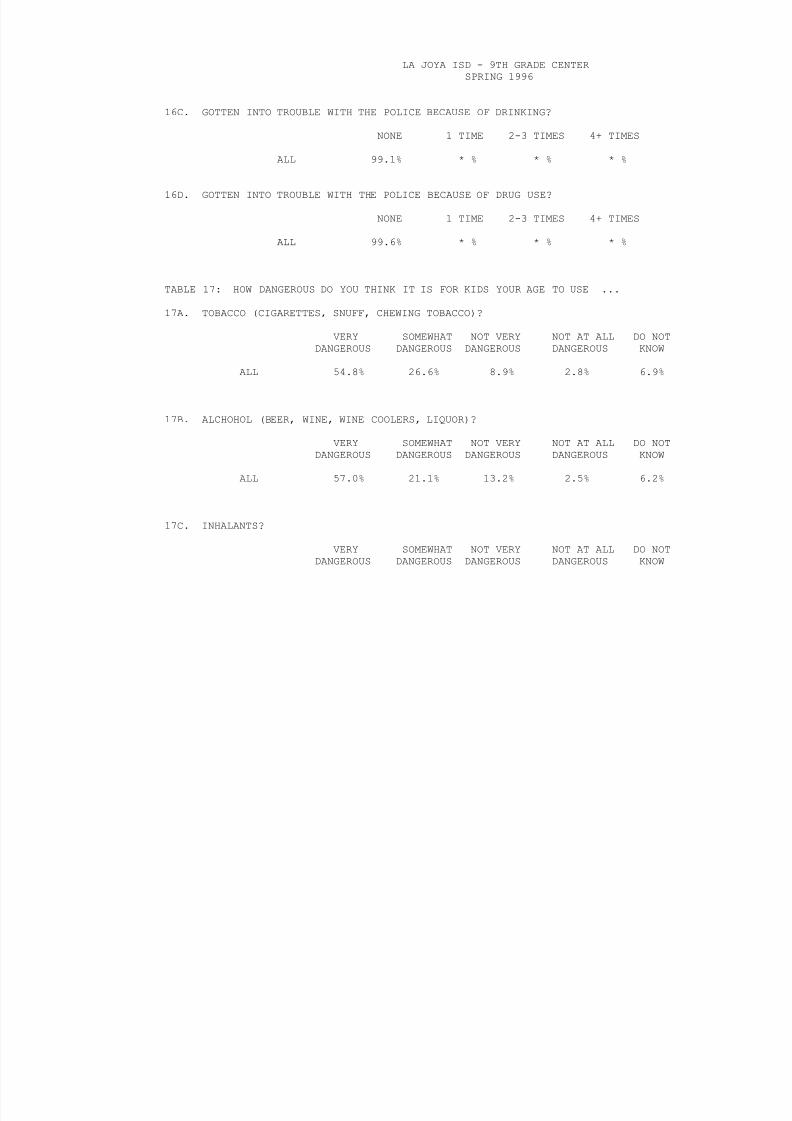
TABLE 16: DURING THE PAST 12 MONTHS, HOW MANY TIMES HAVE YOU...
16A. DRIVEN A CAR WHEN YOU'VE HAD A GOOD BIT TO DRINK?
NONE 1 TIME 2-3 TIMES 4+ TIMES
ALL 96.1% 2.2% 1.7% * %
16B. DRIVEN A CAR WHEN YOU FELT HIGH FROM DRUGS?
NONE 1 TIME 2-3 TIMES 4+ TIMES
ALL 98.3% 0.9% 0.9% * %
8/6/2019 la joya isd - 9th grade center - 1996 Texas School Survey of Drug and Alcohol Use
http://slidepdf.com/reader/full/la-joya-isd-9th-grade-center-1996-texas-school-survey-of-drug-and-alcohol 28/353
8/6/2019 la joya isd - 9th grade center - 1996 Texas School Survey of Drug and Alcohol Use
http://slidepdf.com/reader/full/la-joya-isd-9th-grade-center-1996-texas-school-survey-of-drug-and-alcohol 29/353
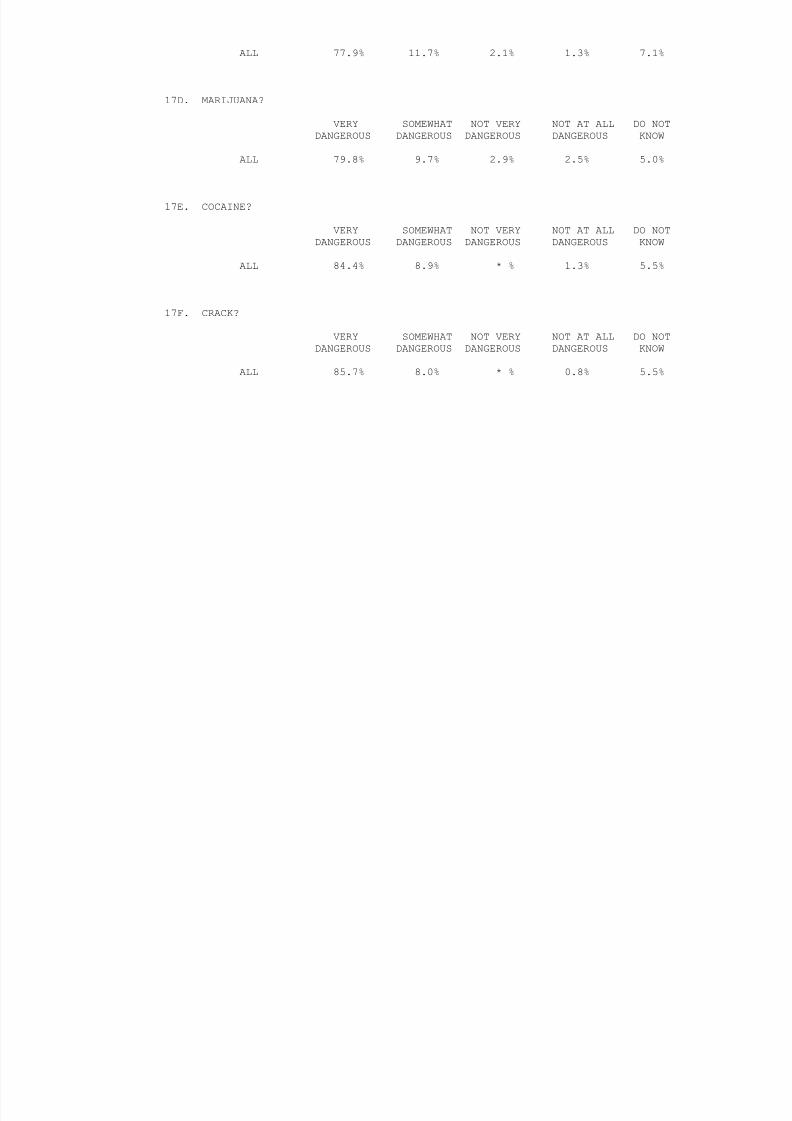
ALL 77.9% 11.7% 2.1% 1.3% 7.1%
17D. MARIJUANA?
VERY SOMEWHAT NOT VERY NOT AT ALL DO NOTDANGEROUS DANGEROUS DANGEROUS DANGEROUS KNOW
ALL 79.8% 9.7% 2.9% 2.5% 5.0%
17E. COCAINE?
VERY SOMEWHAT NOT VERY NOT AT ALL DO NOTDANGEROUS DANGEROUS DANGEROUS DANGEROUS KNOW
ALL 84.4% 8.9% * % 1.3% 5.5%
17F. CRACK?
VERY SOMEWHAT NOT VERY NOT AT ALL DO NOTDANGEROUS DANGEROUS DANGEROUS DANGEROUS KNOW
ALL 85.7% 8.0% * % 0.8% 5.5%

8/6/2019 la joya isd - 9th grade center - 1996 Texas School Survey of Drug and Alcohol Use
http://slidepdf.com/reader/full/la-joya-isd-9th-grade-center-1996-texas-school-survey-of-drug-and-alcohol 30/353
LA JOYA ISD - 9TH GRADE CENTERSPRING 1996
17G. ECSTASY?
VERY SOMEWHAT NOT VERY NOT AT ALL DO NOTDANGEROUS DANGEROUS DANGEROUS DANGEROUS KNOW
ALL 73.0% 10.8% 0.8% 1.2% 14.1%
17H. STEROIDS?
VERY SOMEWHAT NOT VERY NOT AT ALL DO NOTDANGEROUS DANGEROUS DANGEROUS DANGEROUS KNOW
ALL 76.9% 12.4% 1.7% 1.2% 7.9%
TABLE 18: ALCOHOL OR OTHER DRUGS ARE SOMETIMES USED AT TEENAGE PARTIES. THINKING OFTHE PARTIES YOU ATTENDED THIS SCHOOL YEAR, HOW OFTEN WERE THE FOLLOWING USED?
18A. ALCOHOLHALF MOST OF DON'T DIDN'T
NEVER SELDOM THE TIME THE TIME ALWAYS KNOW ATTEND
ALL 42.4% 13.4% 13.0% 10.5% 10.5% 2.1% 8.0%
18B. MARIJUANA AND/OR OTHER DRUGSHALF MOST OF DON'T DIDN'T
NEVER SELDOM THE TIME THE TIME ALWAYS KNOW ATTEND
ALL 66.4% 7.2% 6.8% 4.3% 4.3% 2.6% 8.5%
TABLE 19: IF YOU HAD A DRUG OR ALCOHOL PROBLEM AND NEEDED HELP, WHO WOULD YOU GO TO?
19A. A COUNSELOR OR PROGRAM IN SCHOOL

8/6/2019 la joya isd - 9th grade center - 1996 Texas School Survey of Drug and Alcohol Use
http://slidepdf.com/reader/full/la-joya-isd-9th-grade-center-1996-texas-school-survey-of-drug-and-alcohol 31/353
NO YES
ALL 48.6% 51.4%
19B. ANOTHER ADULT IN SCHOOL (SUCH AS A NURSE OR TEACHER)
NO YES
ALL 55.0% 45.0%
19C. A COUNSELOR OR PROGRAM OUTSIDE OF SCHOOL
NO YES
ALL 53.1% 46.9%
8/6/2019 la joya isd - 9th grade center - 1996 Texas School Survey of Drug and Alcohol Use
http://slidepdf.com/reader/full/la-joya-isd-9th-grade-center-1996-texas-school-survey-of-drug-and-alcohol 32/353
LA JOYA ISD - 9TH GRADE CENTERSPRING 1996
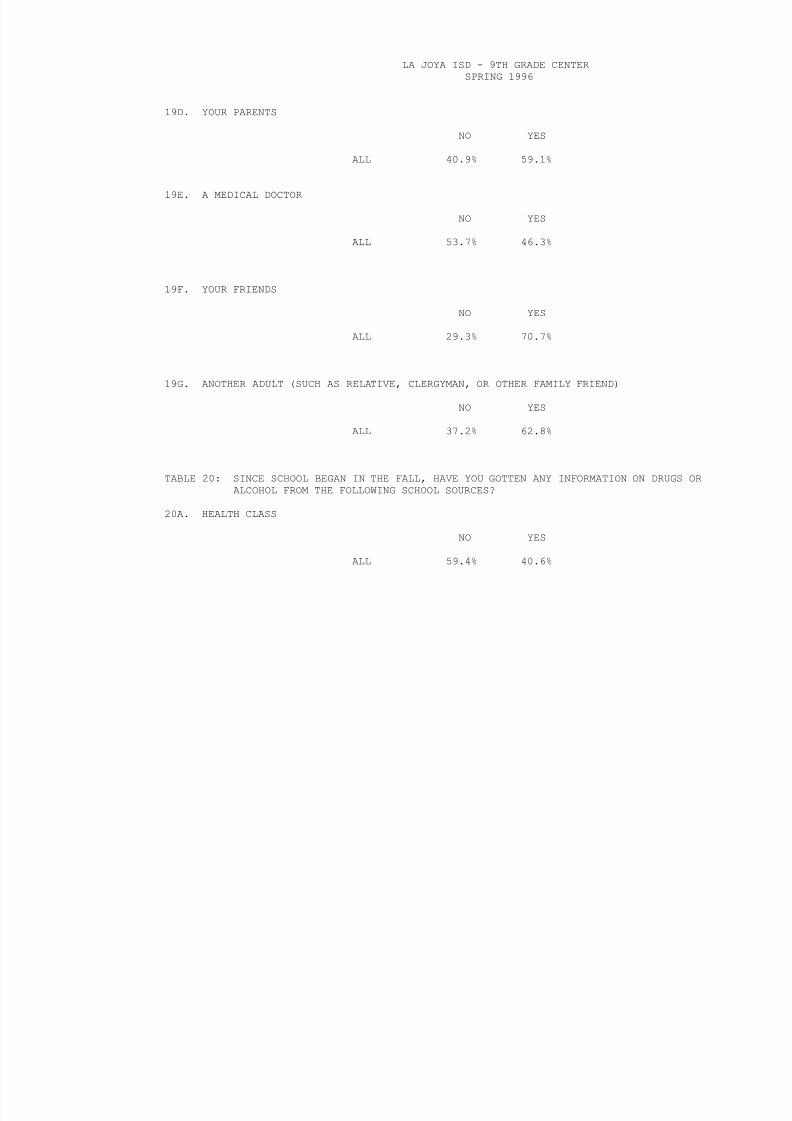
19D. YOUR PARENTS
NO YES
ALL 40.9% 59.1%
19E. A MEDICAL DOCTOR
NO YES
ALL 53.7% 46.3%
19F. YOUR FRIENDS
NO YES
ALL 29.3% 70.7%
19G. ANOTHER ADULT (SUCH AS RELATIVE, CLERGYMAN, OR OTHER FAMILY FRIEND)
NO YES
ALL 37.2% 62.8%
TABLE 20: SINCE SCHOOL BEGAN IN THE FALL, HAVE YOU GOTTEN ANY INFORMATION ON DRUGS ORALCOHOL FROM THE FOLLOWING SCHOOL SOURCES?
20A. HEALTH CLASS
NO YES
ALL 59.4% 40.6%
8/6/2019 la joya isd - 9th grade center - 1996 Texas School Survey of Drug and Alcohol Use
http://slidepdf.com/reader/full/la-joya-isd-9th-grade-center-1996-texas-school-survey-of-drug-and-alcohol 33/353
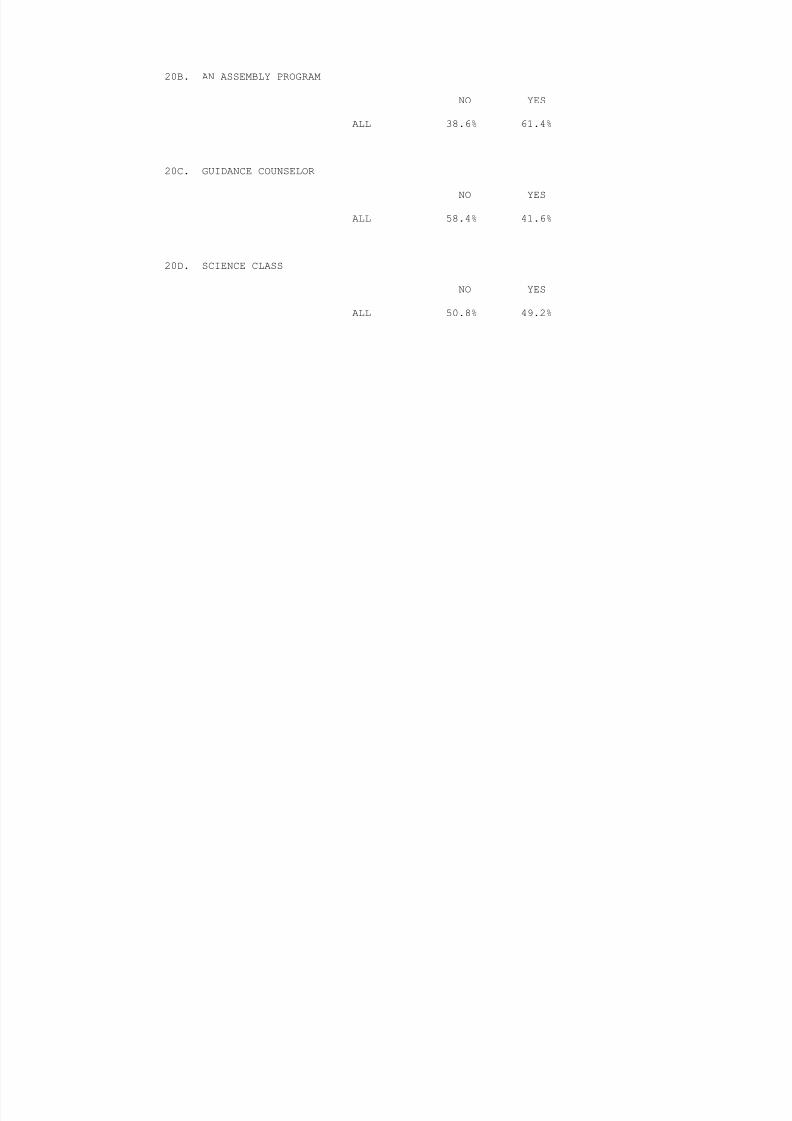
20B. AN ASSEMBLY PROGRAM
NO YES
ALL 38.6% 61.4%
20C. GUIDANCE COUNSELOR
NO YES
ALL 58.4% 41.6%
20D. SCIENCE CLASS
NO YES
ALL 50.8% 49.2%
8/6/2019 la joya isd - 9th grade center - 1996 Texas School Survey of Drug and Alcohol Use
http://slidepdf.com/reader/full/la-joya-isd-9th-grade-center-1996-texas-school-survey-of-drug-and-alcohol 34/353
LA JOYA ISD - 9TH GRADE CENTERSPRING 1996
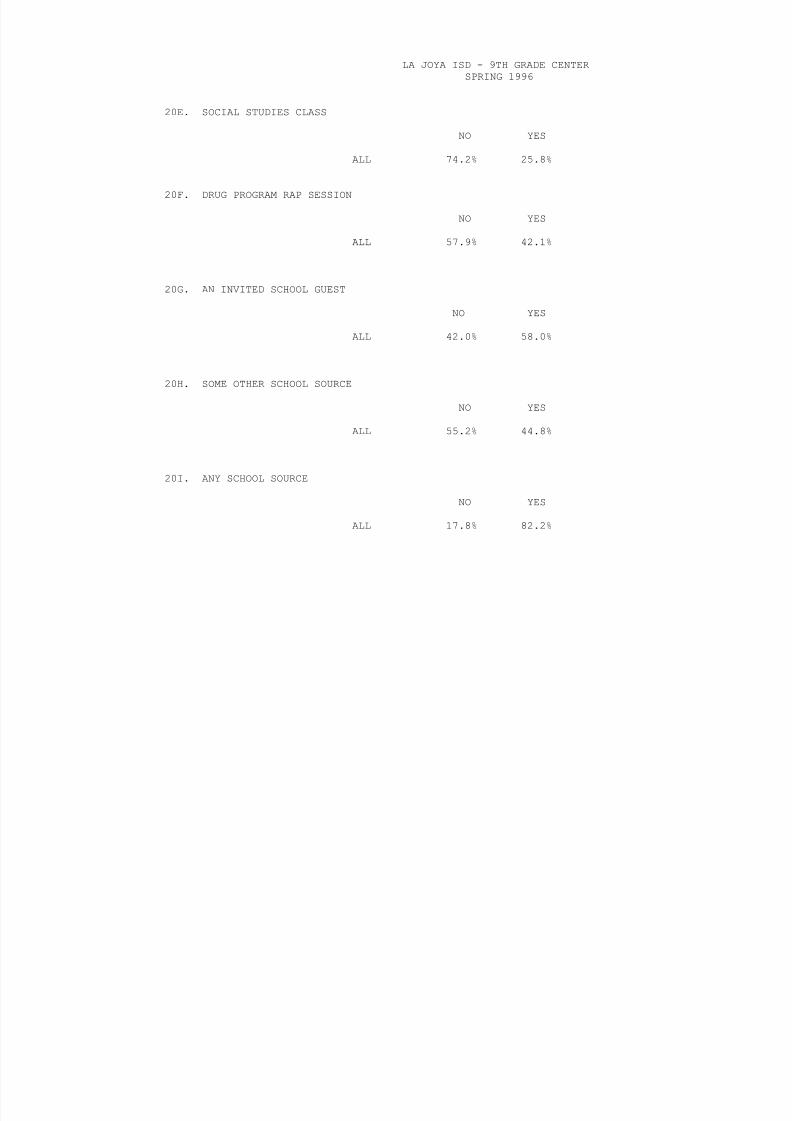
20E. SOCIAL STUDIES CLASS
NO YES
ALL 74.2% 25.8%
20F. DRUG PROGRAM RAP SESSION
NO YES
ALL 57.9% 42.1%
20G. AN INVITED SCHOOL GUEST
NO YES
ALL 42.0% 58.0%
20H. SOME OTHER SCHOOL SOURCE
NO YES
ALL 55.2% 44.8%
20I. ANY SCHOOL SOURCE
NO YES
ALL 17.8% 82.2%

8/6/2019 la joya isd - 9th grade center - 1996 Texas School Survey of Drug and Alcohol Use
http://slidepdf.com/reader/full/la-joya-isd-9th-grade-center-1996-texas-school-survey-of-drug-and-alcohol 35/353
TABLE 21: SINCE SCHOOL BEGAN IN THE FALL, HAVE YOU SOUGHT HELP, OTHER THAN FROM FAMILY ORFRIENDS, FOR PROBLEMS IN ANY WAY CONNECTED WITH YOUR USE OF ALCOHOL, MARIJUANA,OR OTHER DRUGS?
NO YES
ALL 88.9% 11.1%
TABLE 22: HOW DO YOUR PARENTS FEEL ABOUT KIDS YOUR AGE...
22A. DRINKING BEER?
STRONGLY MILDLY MILDLY STRONGLY DON'TDISAPPROVE DISAPPROVE NEITHER APPROVE APPROVE KNOW
ALL 72.0% 14.0% 4.2% 0.9% 0.9% 7.9%
22B. USING MARIJUANA?
STRONGLY MILDLY MILDLY STRONGLY DON'TDISAPPROVE DISAPPROVE NEITHER APPROVE APPROVE KNOW
ALL 86.7% 3.8% 1.4% * % * % 7.1%

8/6/2019 la joya isd - 9th grade center - 1996 Texas School Survey of Drug and Alcohol Use
http://slidepdf.com/reader/full/la-joya-isd-9th-grade-center-1996-texas-school-survey-of-drug-and-alcohol 36/353
LA JOYA ISD - 9TH GRADE CENTERSPRING 1996
TABLE A1: HOW OFTEN DO YOU NORMALLY USE...
A1A. BEER?
NEVER EVER WEEKLY MONTHLY YEARLY RARELY
ALL 58.0% 42.0% 6.0% 18.8% 8.6% 8.6%
A1B. WINE COOLERS?
NEVER EVER WEEKLY MONTHLY YEARLY RARELY
ALL 62.3% 37.7% 4.3% 16.1% 10.0% 7.3%
A1C. WINE?
NEVER EVER WEEKLY MONTHLY YEARLY RARELY
ALL 65.7% 34.3% 3.7% 11.1% 10.5% 9.0%
A1D. LIQUOR?
NEVER EVER WEEKLY MONTHLY YEARLY RARELY
ALL 71.6% 28.4% 3.3% 11.2% 9.1% 4.8%
TABLE A2: WHEN YOU DRINK THE FOLLOWING ALCOHOLIC BEVERAGES, HOW MANY DRINKS DO YOUUSUALLY HAVE AT ONE TIME, ON AVERAGE?

8/6/2019 la joya isd - 9th grade center - 1996 Texas School Survey of Drug and Alcohol Use
http://slidepdf.com/reader/full/la-joya-isd-9th-grade-center-1996-texas-school-survey-of-drug-and-alcohol 37/353
A2A. BEER
NEVER EVER 5 OR MORE 1 TO 4 LESS THAN 1
ALL 48.8% 51.2% 14.6% 25.6% 11.0%
A2B. WINE COOLERS
NEVER EVER 5 OR MORE 1 TO 4 LESS THAN 1
ALL 52.0% 48.0% 13.2% 25.7% 9.2%
A2C. WINE
NEVER EVER 5 OR MORE 1 TO 4 LESS THAN 1
ALL 55.9% 44.1% 9.7% 22.1% 12.4%
A2D. LIQUOR
NEVER EVER 5 OR MORE 1 TO 4 LESS THAN 1
ALL 63.6% 36.4% 9.2% 19.4% 7.8%
8/6/2019 la joya isd - 9th grade center - 1996 Texas School Survey of Drug and Alcohol Use
http://slidepdf.com/reader/full/la-joya-isd-9th-grade-center-1996-texas-school-survey-of-drug-and-alcohol 38/353
LA JOYA ISD - 9TH GRADE CENTERSPRING 1996
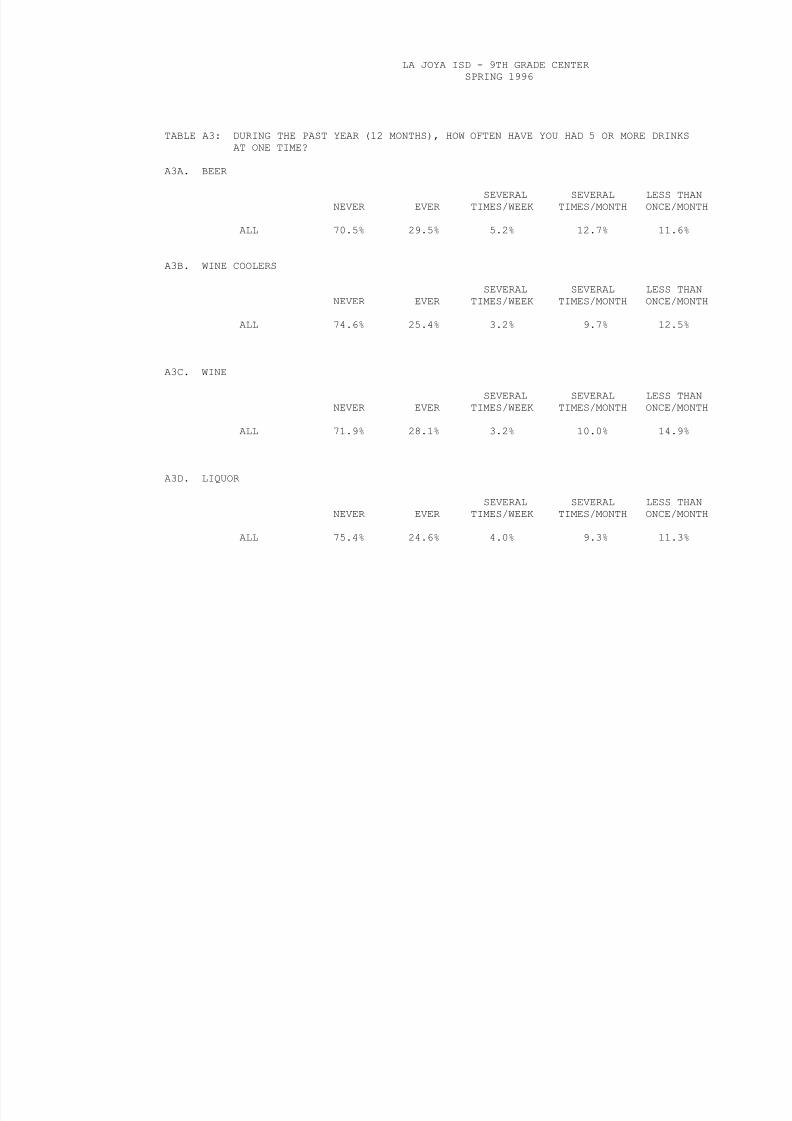
TABLE A3: DURING THE PAST YEAR (12 MONTHS), HOW OFTEN HAVE YOU HAD 5 OR MORE DRINKSAT ONE TIME?
A3A. BEER
SEVERAL SEVERAL LESS THANNEVER EVER TIMES/WEEK TIMES/MONTH ONCE/MONTH
ALL 70.5% 29.5% 5.2% 12.7% 11.6%
A3B. WINE COOLERS
SEVERAL SEVERAL LESS THANNEVER EVER TIMES/WEEK TIMES/MONTH ONCE/MONTH
ALL 74.6% 25.4% 3.2% 9.7% 12.5%
A3C. WINE
SEVERAL SEVERAL LESS THANNEVER EVER TIMES/WEEK TIMES/MONTH ONCE/MONTH
ALL 71.9% 28.1% 3.2% 10.0% 14.9%
A3D. LIQUOR
SEVERAL SEVERAL LESS THANNEVER EVER TIMES/WEEK TIMES/MONTH ONCE/MONTH
ALL 75.4% 24.6% 4.0% 9.3% 11.3%

8/6/2019 la joya isd - 9th grade center - 1996 Texas School Survey of Drug and Alcohol Use
http://slidepdf.com/reader/full/la-joya-isd-9th-grade-center-1996-texas-school-survey-of-drug-and-alcohol 39/353

8/6/2019 la joya isd - 9th grade center - 1996 Texas School Survey of Drug and Alcohol Use
http://slidepdf.com/reader/full/la-joya-isd-9th-grade-center-1996-texas-school-survey-of-drug-and-alcohol 40/353
LA JOYA ISD - 9TH GRADE CENTERSPRING 1996
GENDER
Q1 Frequency Percent----------------------------Male 180 45.3Female 217 54.7
Frequency Missing = 1
GRADE
Q2 Frequency Percent--------------------------9th 398 100.0
LIVE WITH BOTH PARENTS
Q3 Frequency Percent-------------------------Yes 320 81.0No 75 19.0
Frequency Missing = 3
AGE
Q4 Frequency Percent-----------------------------------13 1 0.314 121 30.415 230 57.816 45 11.3
17 1 0.3
8/6/2019 la joya isd - 9th grade center - 1996 Texas School Survey of Drug and Alcohol Use
http://slidepdf.com/reader/full/la-joya-isd-9th-grade-center-1996-texas-school-survey-of-drug-and-alcohol 41/353
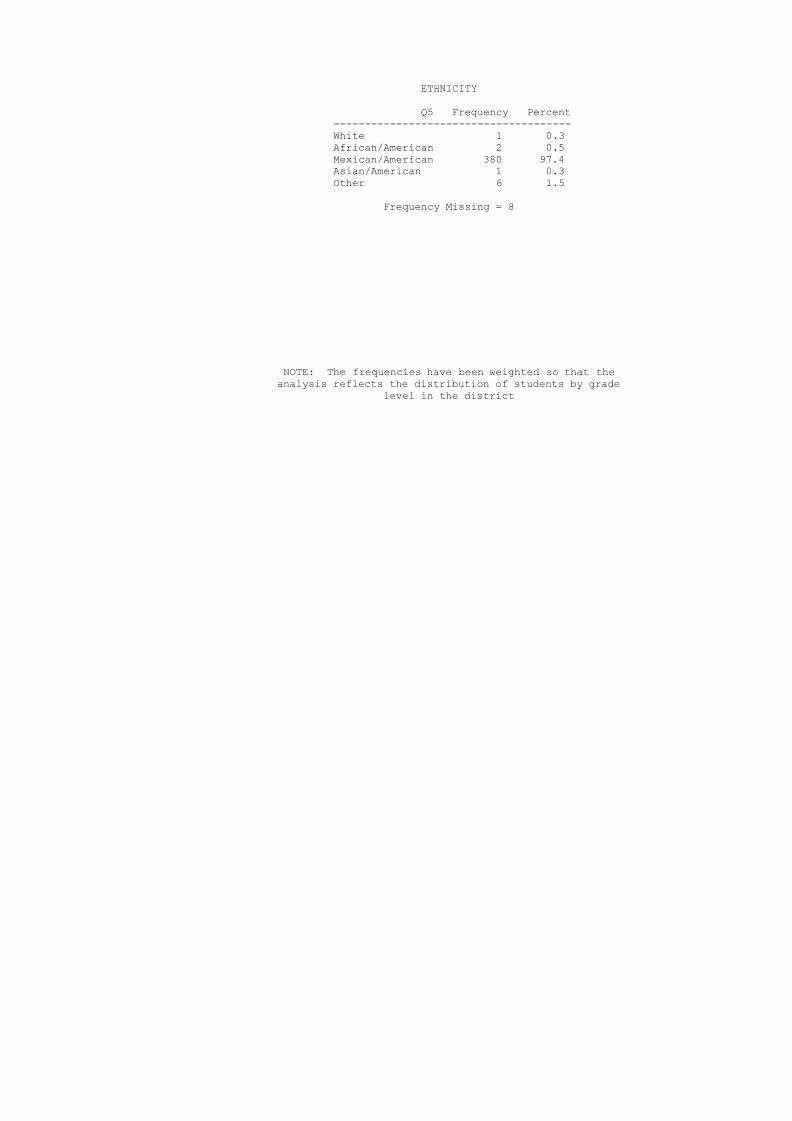
ETHNICITY
Q5 Frequency Percent--------------------------------------White 1 0.3
African/American 2 0.5Mexican/American 380 97.4Asian/American 1 0.3Other 6 1.5
Frequency Missing = 8
NOTE: The frequencies have been weighted so that theanalysis reflects the distribution of students by grade
level in the district

8/6/2019 la joya isd - 9th grade center - 1996 Texas School Survey of Drug and Alcohol Use
http://slidepdf.com/reader/full/la-joya-isd-9th-grade-center-1996-texas-school-survey-of-drug-and-alcohol 42/353
LA JOYA ISD - 9TH GRADE CENTERSPRING 1996
ON AVERAGE WHAT GRADES DO YOU GET
Q6 Frequency Percent--------------------------------Mostly A's 85 22.3Mostly B's 232 60.7
Mostly C's 60 15.7Mostly D's 3 0.8Mostly F's 2 0.5
Frequency Missing = 16
LENGTH OF TIME IN THIS DISTRICT
Q7 Frequency Percent-------------------------------<1 year 44 11.32-3 years 61 15.6>4 years 286 73.1
Frequency Missing = 7
DO YOU HAVE A JOB
Q8 Frequency Percent-------------------------Yes 31 7.8No 364 92.2
Frequency Missing = 3
DO YOU GET AN ALLOWANCE

8/6/2019 la joya isd - 9th grade center - 1996 Texas School Survey of Drug and Alcohol Use
http://slidepdf.com/reader/full/la-joya-isd-9th-grade-center-1996-texas-school-survey-of-drug-and-alcohol 43/353
Q9 Frequency Percent-------------------------Yes 201 51.9No 186 48.1
Frequency Missing = 11
EITHER PARENT COLLEGE GRADUATE
Q10 Frequency Percent----------------------------------Yes 59 15.0No 265 67.3I Don't Know 70 17.8
Frequency Missing = 4
NOTE: The frequencies have been weighted so that theanalysis reflects the distribution of students by grade
level in the district

8/6/2019 la joya isd - 9th grade center - 1996 Texas School Survey of Drug and Alcohol Use
http://slidepdf.com/reader/full/la-joya-isd-9th-grade-center-1996-texas-school-survey-of-drug-and-alcohol 44/353
LA JOYA ISD - 9TH GRADE CENTERSPRING 1996
QUALIFY FOR FREE/REDUCED PRICE LUNCH
Q11 Frequency Percent----------------------------------Yes 289 74.7No 29 7.5
I Don't Know 69 17.8
Frequency Missing = 11
PARTICIPATE IN ATHLETICS
Q12A Frequency Percent--------------------------
Yes 148 41.1No 212 58.9
Frequency Missing = 38
PARTICIPATE IN BAND/ORCHESTRA
Q12B Frequency Percent--------------------------
Yes 48 13.8No 301 86.2
Frequency Missing = 49
PARTICIPATE IN CHOIR
Q12C Frequency Percent--------------------------
Yes 40 11.7
8/6/2019 la joya isd - 9th grade center - 1996 Texas School Survey of Drug and Alcohol Use
http://slidepdf.com/reader/full/la-joya-isd-9th-grade-center-1996-texas-school-survey-of-drug-and-alcohol 45/353
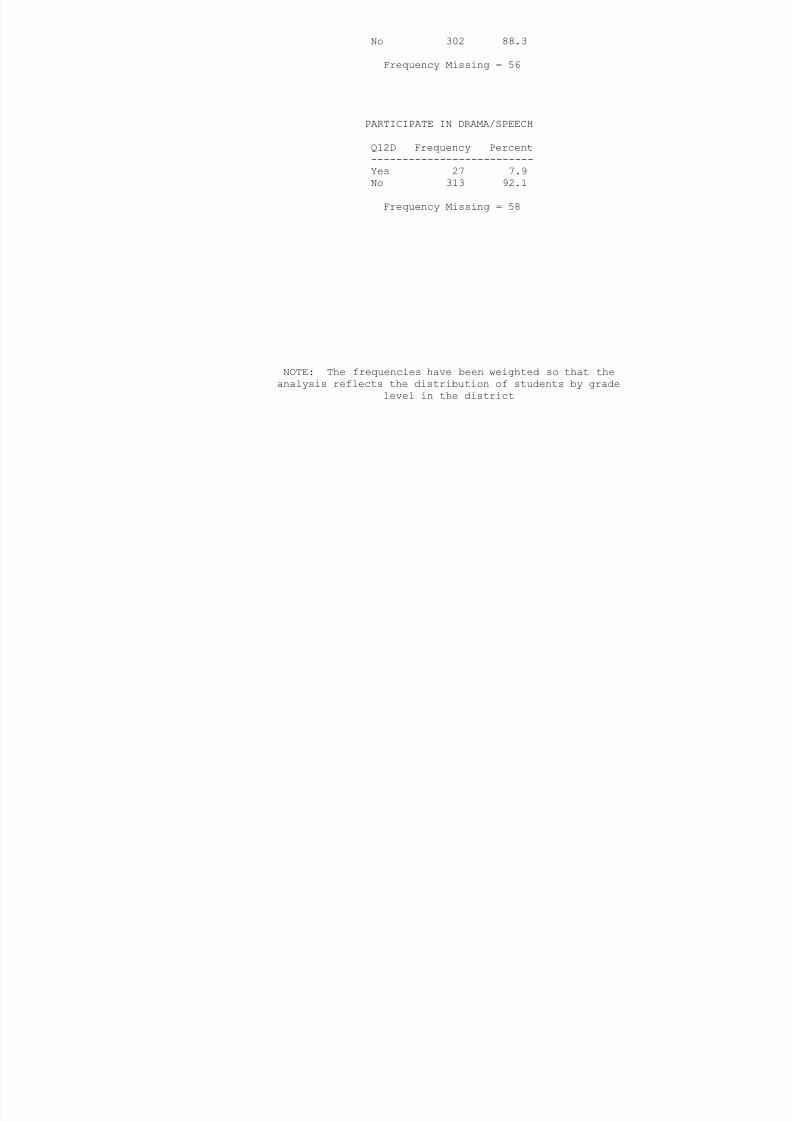
No 302 88.3
Frequency Missing = 56
PARTICIPATE IN DRAMA/SPEECH
Q12D Frequency Percent--------------------------Yes 27 7.9No 313 92.1
Frequency Missing = 58
NOTE: The frequencies have been weighted so that theanalysis reflects the distribution of students by grade
level in the district
8/6/2019 la joya isd - 9th grade center - 1996 Texas School Survey of Drug and Alcohol Use
http://slidepdf.com/reader/full/la-joya-isd-9th-grade-center-1996-texas-school-survey-of-drug-and-alcohol 46/353
LA JOYA ISD - 9TH GRADE CENTERSPRING 1996
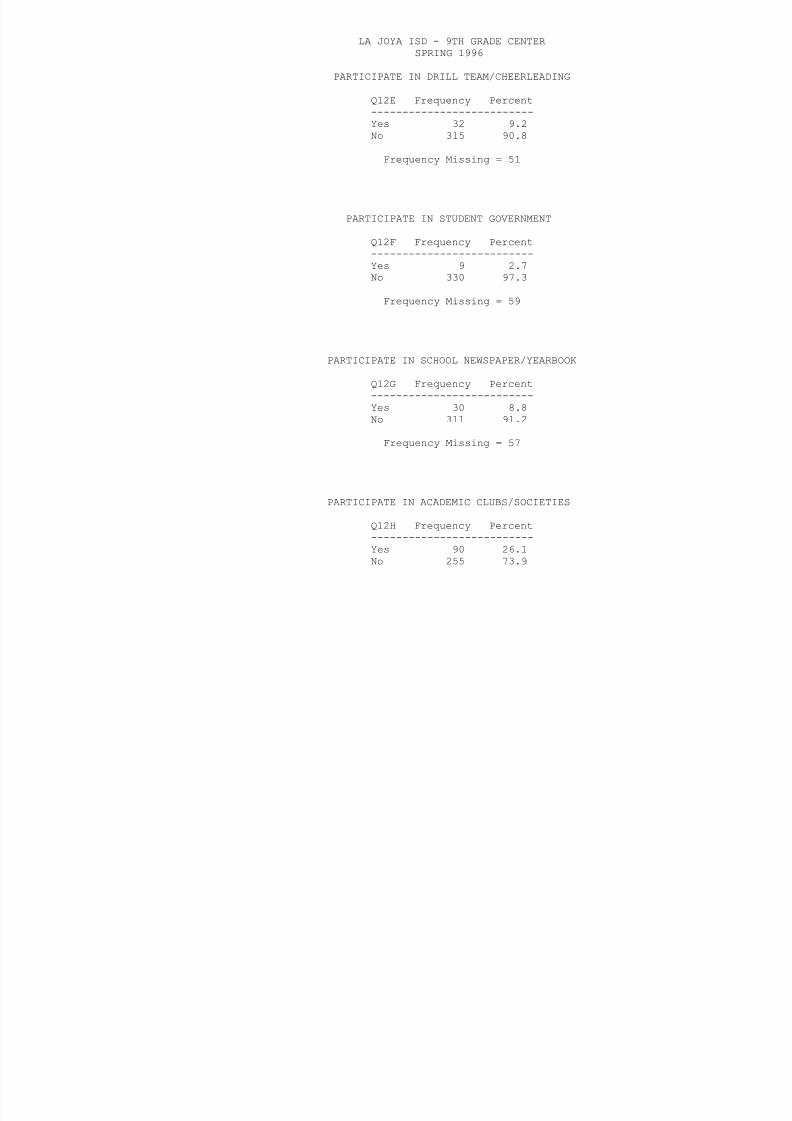
PARTICIPATE IN DRILL TEAM/CHEERLEADING
Q12E Frequency Percent--------------------------Yes 32 9.2No 315 90.8
Frequency Missing = 51
PARTICIPATE IN STUDENT GOVERNMENT
Q12F Frequency Percent--------------------------Yes 9 2.7No 330 97.3
Frequency Missing = 59
PARTICIPATE IN SCHOOL NEWSPAPER/YEARBOOK
Q12G Frequency Percent--------------------------Yes 30 8.8
No 311 91.2
Frequency Missing = 57
PARTICIPATE IN ACADEMIC CLUBS/SOCIETIES
Q12H Frequency Percent--------------------------Yes 90 26.1
No 255 73.9
8/6/2019 la joya isd - 9th grade center - 1996 Texas School Survey of Drug and Alcohol Use
http://slidepdf.com/reader/full/la-joya-isd-9th-grade-center-1996-texas-school-survey-of-drug-and-alcohol 47/353
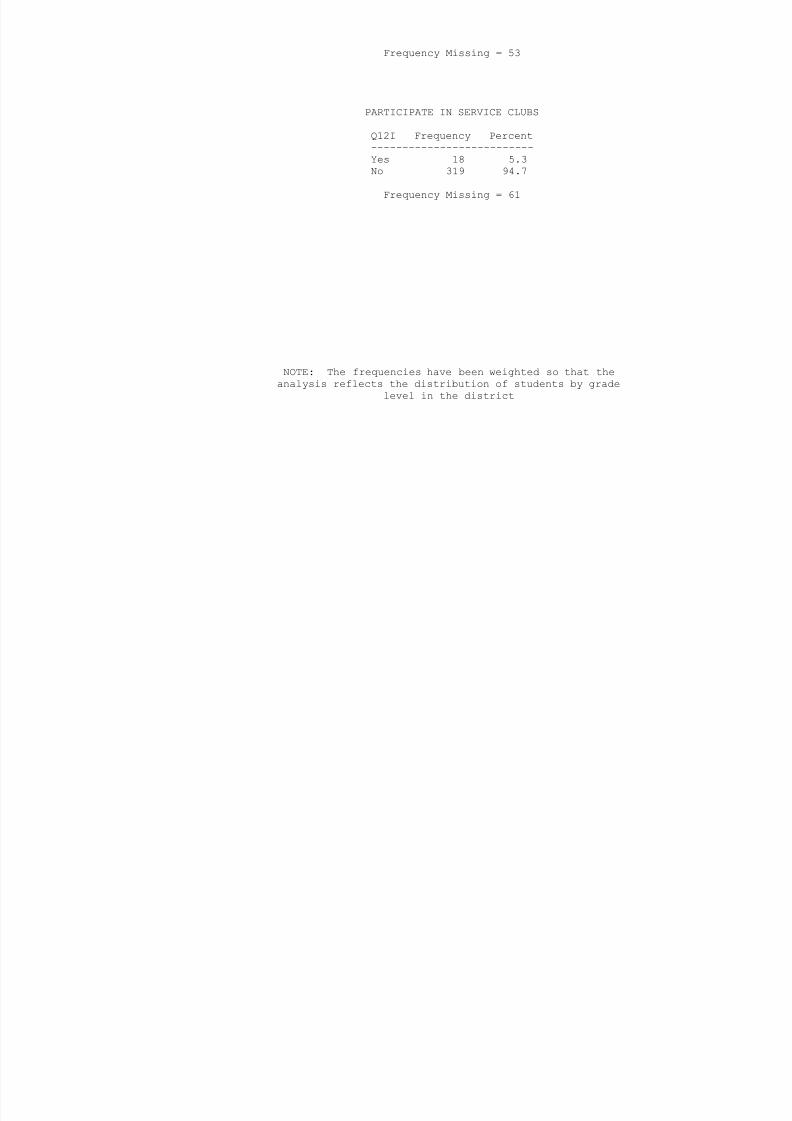
Frequency Missing = 53
PARTICIPATE IN SERVICE CLUBS
Q12I Frequency Percent
--------------------------Yes 18 5.3No 319 94.7
Frequency Missing = 61
NOTE: The frequencies have been weighted so that theanalysis reflects the distribution of students by grade
level in the district

8/6/2019 la joya isd - 9th grade center - 1996 Texas School Survey of Drug and Alcohol Use
http://slidepdf.com/reader/full/la-joya-isd-9th-grade-center-1996-texas-school-survey-of-drug-and-alcohol 48/353
LA JOYA ISD - 9TH GRADE CENTERSPRING 1996
PARTICIPATE IN VOE/DE/WORK-STUDY
Q12J Frequency Percent--------------------------Yes 14 4.2No 318 95.8
Frequency Missing = 66
PARTICIPATE IN OTHER CLUBS
Q12K Frequency Percent--------------------------Yes 119 33.6No 235 66.4
Frequency Missing = 44
DO YOU FEEL SAFE IN YOUR HOME
Q13A Frequency Percent-------------------------------------Very Safe 287 73.6
Somewhat Safe 73 18.7Not Very Safe 12 3.1Not Safe At All 4 1.0Don't Know 14 3.6
Frequency Missing = 8
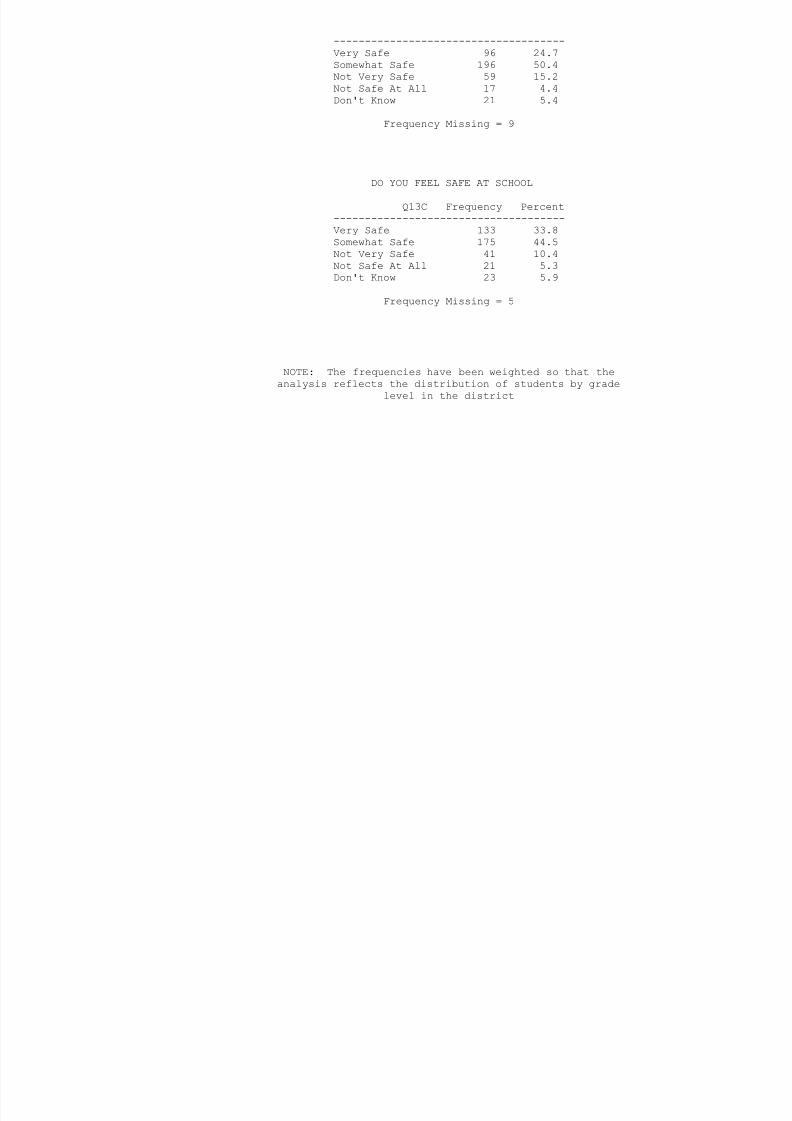
DO YOU FEEL SAFE IN YOUR NEIGHBORHOOD
Q13B Frequency Percent
8/6/2019 la joya isd - 9th grade center - 1996 Texas School Survey of Drug and Alcohol Use
http://slidepdf.com/reader/full/la-joya-isd-9th-grade-center-1996-texas-school-survey-of-drug-and-alcohol 49/353
-------------------------------------Very Safe 96 24.7Somewhat Safe 196 50.4Not Very Safe 59 15.2Not Safe At All 17 4.4Don't Know 21 5.4
Frequency Missing = 9
DO YOU FEEL SAFE AT SCHOOL
Q13C Frequency Percent-------------------------------------Very Safe 133 33.8Somewhat Safe 175 44.5Not Very Safe 41 10.4Not Safe At All 21 5.3Don't Know 23 5.9
Frequency Missing = 5
NOTE: The frequencies have been weighted so that theanalysis reflects the distribution of students by grade
level in the district

8/6/2019 la joya isd - 9th grade center - 1996 Texas School Survey of Drug and Alcohol Use
http://slidepdf.com/reader/full/la-joya-isd-9th-grade-center-1996-texas-school-survey-of-drug-and-alcohol 50/353
LA JOYA ISD - 9TH GRADE CENTERSPRING 1996
FRIENDS FEELING CLOSE TO THEIR PARENTS
Q14A Frequency Percent---------------------------None 39 10.1A Few 99 25.5
Some 90 23.2Most 114 29.4All 46 11.9
Frequency Missing = 10
HOW MANY FRIENDS CARRY WEAPONS
Q14B Frequency Percent---------------------------None 248 64.6A Few 72 18.8Some 40 10.4Most 13 3.4All 11 2.9
Frequency Missing = 14
HOW MANY FRIENDS CARE ABOUT GOOD GRADES
Q14C Frequency Percent---------------------------None 16 4.2A Few 73 19.2Some 86 22.6Most 131 34.5All 74 19.5
Frequency Missing = 18
8/6/2019 la joya isd - 9th grade center - 1996 Texas School Survey of Drug and Alcohol Use
http://slidepdf.com/reader/full/la-joya-isd-9th-grade-center-1996-texas-school-survey-of-drug-and-alcohol 51/353
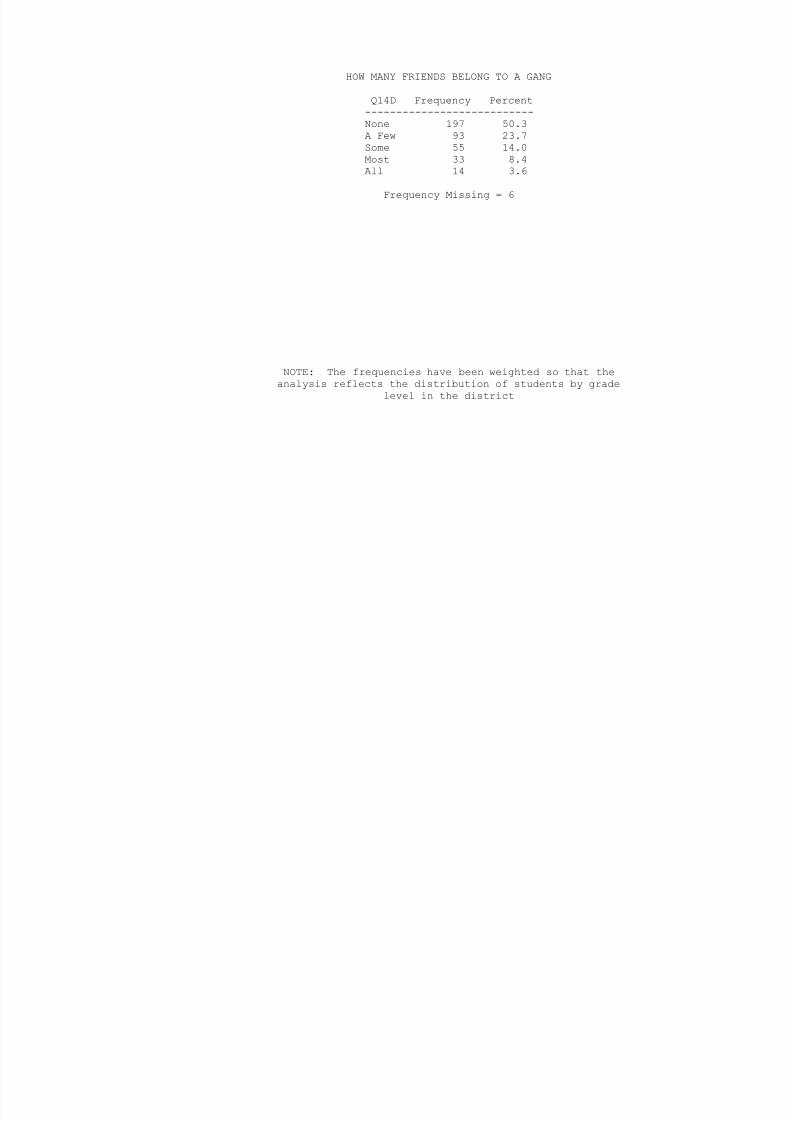
HOW MANY FRIENDS BELONG TO A GANG
Q14D Frequency Percent---------------------------None 197 50.3A Few 93 23.7
Some 55 14.0Most 33 8.4All 14 3.6
Frequency Missing = 6
NOTE: The frequencies have been weighted so that theanalysis reflects the distribution of students by grade
level in the district
8/6/2019 la joya isd - 9th grade center - 1996 Texas School Survey of Drug and Alcohol Use
http://slidepdf.com/reader/full/la-joya-isd-9th-grade-center-1996-texas-school-survey-of-drug-and-alcohol 52/353
LA JOYA ISD - 9TH GRADE CENTERSPRING 1996
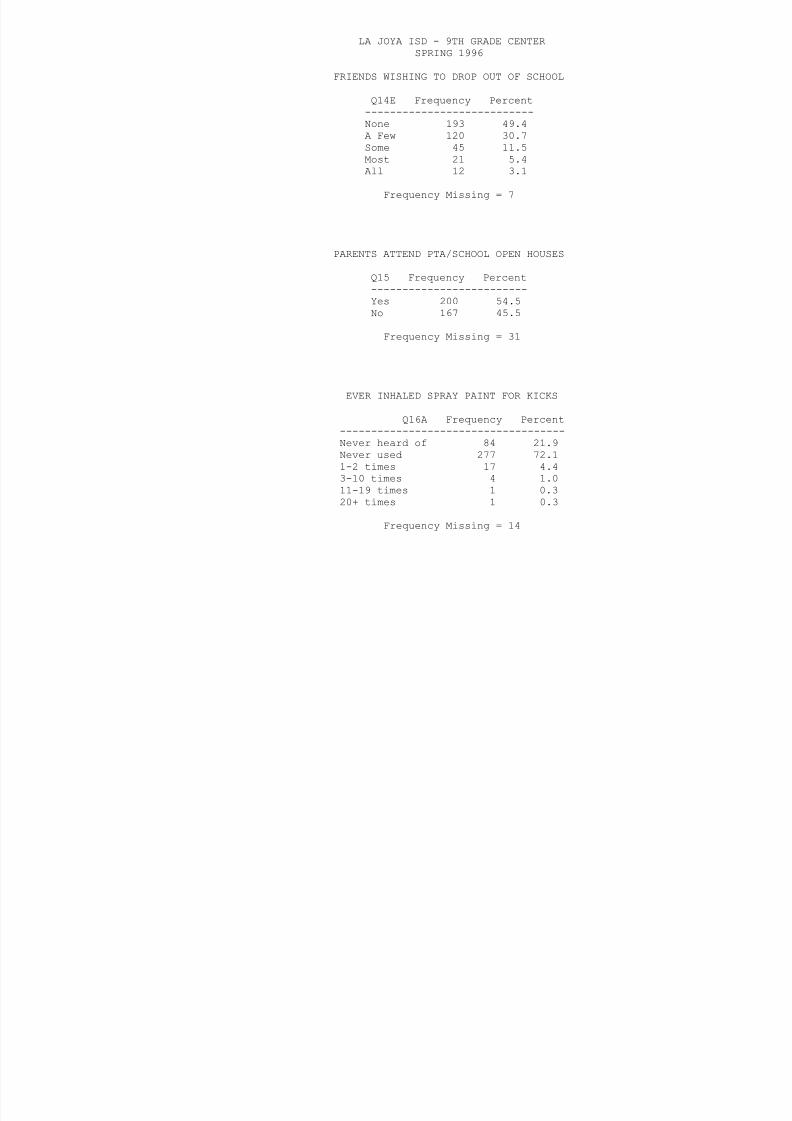
FRIENDS WISHING TO DROP OUT OF SCHOOL
Q14E Frequency Percent---------------------------None 193 49.4A Few 120 30.7
Some 45 11.5Most 21 5.4All 12 3.1
Frequency Missing = 7
PARENTS ATTEND PTA/SCHOOL OPEN HOUSES
Q15 Frequency Percent-------------------------Yes 200 54.5No 167 45.5
Frequency Missing = 31
EVER INHALED SPRAY PAINT FOR KICKS
Q16A Frequency Percent------------------------------------Never heard of 84 21.9Never used 277 72.11-2 times 17 4.43-10 times 4 1.011-19 times 1 0.320+ times 1 0.3
Frequency Missing = 14

8/6/2019 la joya isd - 9th grade center - 1996 Texas School Survey of Drug and Alcohol Use
http://slidepdf.com/reader/full/la-joya-isd-9th-grade-center-1996-texas-school-survey-of-drug-and-alcohol 53/353
EVER INHALED LIQUID PAPER FOR KICKS
Q16B Frequency Percent------------------------------------Never heard of 68 17.8Never used 275 72.21-2 times 29 7.63-10 times 7 1.8
20+ times 2 0.5
Frequency Missing = 17
NOTE: The frequencies have been weighted so that theanalysis reflects the distribution of students by grade
level in the district
LA JOYA ISD 9TH GRADE CENTER

8/6/2019 la joya isd - 9th grade center - 1996 Texas School Survey of Drug and Alcohol Use
http://slidepdf.com/reader/full/la-joya-isd-9th-grade-center-1996-texas-school-survey-of-drug-and-alcohol 54/353
LA JOYA ISD - 9TH GRADE CENTERSPRING 1996
EVER INHALED GASOLINE FOR KICKS
Q16C Frequency Percent------------------------------------Never heard of 59 15.5Never used 307 80.8
1-2 times 13 3.43-10 times 1 0.3
Frequency Missing = 18
EVER INHALED FREON FOR KICKS
Q16D Frequency Percent------------------------------------Never heard of 154 41.2Never used 216 57.81-2 times 3 0.83-10 times 1 0.3
Frequency Missing = 24
EVER INHALED POPPERS, ETC. FOR KICKS
Q16E Frequency Percent------------------------------------Never heard of 206 54.5Never used 165 43.71-2 times 7 1.9
Frequency Missing = 20
EVER INHALED SHOE SHINE FOR KICKS

8/6/2019 la joya isd - 9th grade center - 1996 Texas School Survey of Drug and Alcohol Use
http://slidepdf.com/reader/full/la-joya-isd-9th-grade-center-1996-texas-school-survey-of-drug-and-alcohol 55/353
Q16F Frequency Percent------------------------------------Never heard of 121 31.9Never used 252 66.51-2 times 5 1.33-10 times 1 0.3
Frequency Missing = 19
NOTE: The frequencies have been weighted so that theanalysis reflects the distribution of students by grade
level in the district
LA JOYA ISD 9TH GRADE CENTER
8/6/2019 la joya isd - 9th grade center - 1996 Texas School Survey of Drug and Alcohol Use
http://slidepdf.com/reader/full/la-joya-isd-9th-grade-center-1996-texas-school-survey-of-drug-and-alcohol 56/353
LA JOYA ISD - 9TH GRADE CENTERSPRING 1996
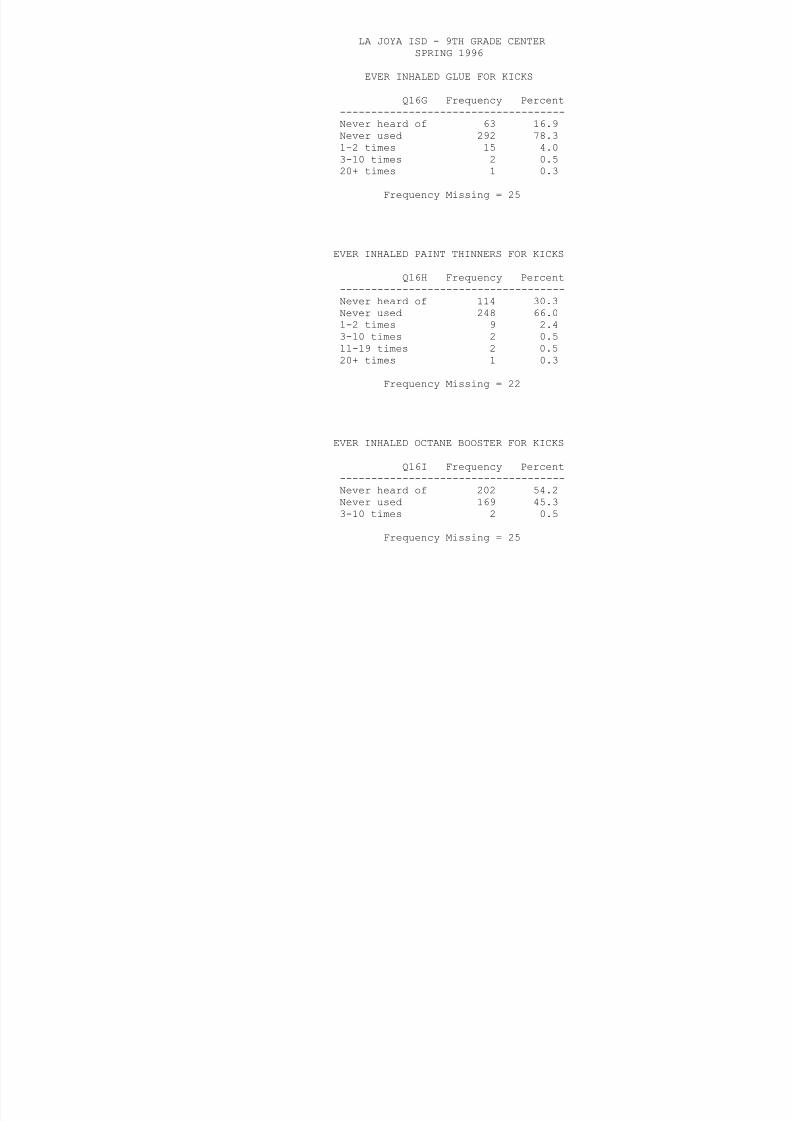
EVER INHALED GLUE FOR KICKS
Q16G Frequency Percent------------------------------------Never heard of 63 16.9Never used 292 78.3
1-2 times 15 4.03-10 times 2 0.520+ times 1 0.3
Frequency Missing = 25
EVER INHALED PAINT THINNERS FOR KICKS
Q16H Frequency Percent------------------------------------Never heard of 114 30.3Never used 248 66.01-2 times 9 2.43-10 times 2 0.511-19 times 2 0.520+ times 1 0.3
Frequency Missing = 22
EVER INHALED OCTANE BOOSTER FOR KICKS
Q16I Frequency Percent------------------------------------Never heard of 202 54.2Never used 169 45.33-10 times 2 0.5
Frequency Missing = 25

8/6/2019 la joya isd - 9th grade center - 1996 Texas School Survey of Drug and Alcohol Use
http://slidepdf.com/reader/full/la-joya-isd-9th-grade-center-1996-texas-school-survey-of-drug-and-alcohol 57/353
EVER INHALED OTHER SPRAYS FOR KICKS
Q16J Frequency Percent------------------------------------Never heard of 65 17.9Never used 286 78.81-2 times 8 2.2
3-10 times 3 0.820+ times 1 0.3
Frequency Missing = 35
NOTE: The frequencies have been weighted so that theanalysis reflects the distribution of students by grade
level in the district
LA JOYA ISD - 9TH GRADE CENTER

8/6/2019 la joya isd - 9th grade center - 1996 Texas School Survey of Drug and Alcohol Use
http://slidepdf.com/reader/full/la-joya-isd-9th-grade-center-1996-texas-school-survey-of-drug-and-alcohol 58/353
LA JOYA ISD 9TH GRADE CENTERSPRING 1996
EVER INHALED OTHER INHALANTS FOR KICKS
Q16K Frequency Percent------------------------------------Never heard of 99 27.1Never used 246 67.4
1-2 times 12 3.33-10 times 5 1.411-19 times 1 0.320+ times 2 0.5
Frequency Missing = 33
CIGARETTE USE DURING LIFETIME
Q17A Frequency Percent------------------------------------Never heard of 13 3.4Never used 210 54.31-2 times 96 24.83-10 times 29 7.511-19 times 9 2.320+ times 30 7.8
Frequency Missing = 11
SMOKELESS TOBACCO USE DURING LIFETIME
Q17B Frequency Percent------------------------------------Never heard of 41 10.6Never used 323 83.51-2 times 15 3.93-10 times 6 1.611-19 times 1 0.3
20+ times 1 0.3
8/6/2019 la joya isd - 9th grade center - 1996 Texas School Survey of Drug and Alcohol Use
http://slidepdf.com/reader/full/la-joya-isd-9th-grade-center-1996-texas-school-survey-of-drug-and-alcohol 59/353
Frequency Missing = 11
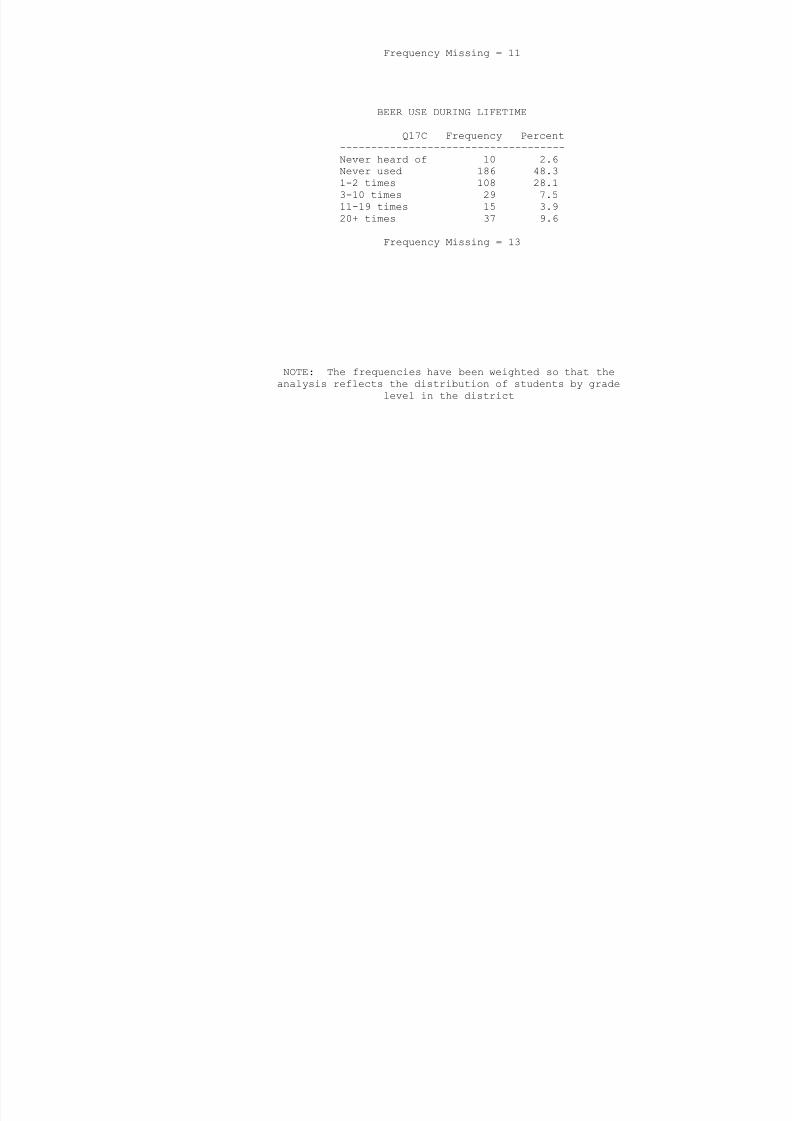
BEER USE DURING LIFETIME
Q17C Frequency Percent
------------------------------------Never heard of 10 2.6Never used 186 48.31-2 times 108 28.13-10 times 29 7.511-19 times 15 3.920+ times 37 9.6
Frequency Missing = 13
NOTE: The frequencies have been weighted so that theanalysis reflects the distribution of students by grade
level in the district
LA JOYA ISD - 9TH GRADE CENTER

8/6/2019 la joya isd - 9th grade center - 1996 Texas School Survey of Drug and Alcohol Use
http://slidepdf.com/reader/full/la-joya-isd-9th-grade-center-1996-texas-school-survey-of-drug-and-alcohol 60/353
LA JOYA ISD 9TH GRADE CENTERSPRING 1996
WINE COOLER USE DURING LIFETIME
Q17D Frequency Percent------------------------------------Never heard of 18 4.7Never used 186 48.3
1-2 times 103 26.83-10 times 39 10.111-19 times 7 1.820+ times 32 8.3
Frequency Missing = 13
WINE USE DURING LIFETIME
Q17E Frequency Percent------------------------------------Never heard of 17 4.4Never used 204 53.31-2 times 102 26.63-10 times 32 8.411-19 times 8 2.120+ times 20 5.2
Frequency Missing = 15
LIQUOR USE DURING LIFETIME
Q17F Frequency Percent------------------------------------Never heard of 18 4.8Never used 236 63.11-2 times 68 18.23-10 times 20 5.311-19 times 9 2.4
20+ times 23 6.1

8/6/2019 la joya isd - 9th grade center - 1996 Texas School Survey of Drug and Alcohol Use
http://slidepdf.com/reader/full/la-joya-isd-9th-grade-center-1996-texas-school-survey-of-drug-and-alcohol 61/353
Frequency Missing = 24
INHALANT USE DURING LIFETIME
Q17G Frequency Percent
------------------------------------Never heard of 36 9.4Never used 319 82.91-2 times 18 4.73-10 times 9 2.320+ times 3 0.8
Frequency Missing = 13
NOTE: The frequencies have been weighted so that theanalysis reflects the distribution of students by grade
level in the district

8/6/2019 la joya isd - 9th grade center - 1996 Texas School Survey of Drug and Alcohol Use
http://slidepdf.com/reader/full/la-joya-isd-9th-grade-center-1996-texas-school-survey-of-drug-and-alcohol 62/353
8/6/2019 la joya isd - 9th grade center - 1996 Texas School Survey of Drug and Alcohol Use
http://slidepdf.com/reader/full/la-joya-isd-9th-grade-center-1996-texas-school-survey-of-drug-and-alcohol 63/353
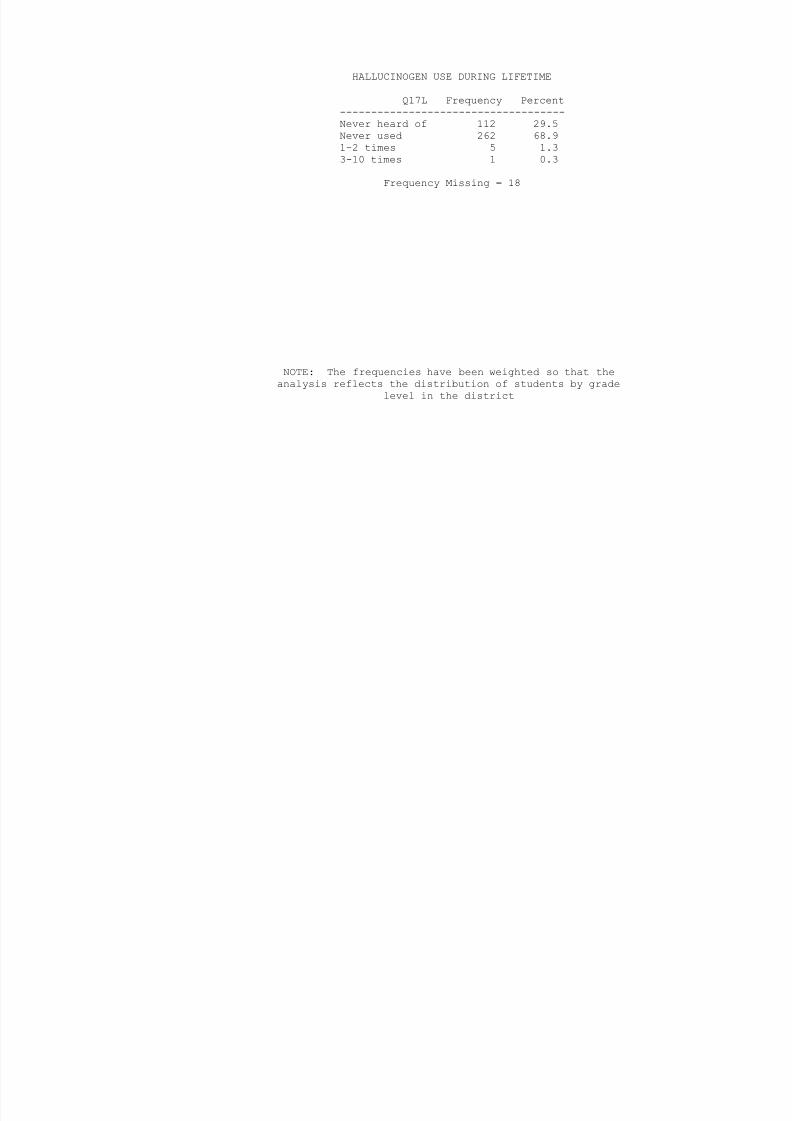
HALLUCINOGEN USE DURING LIFETIME
Q17L Frequency Percent------------------------------------Never heard of 112 29.5Never used 262 68.9
1-2 times 5 1.33-10 times 1 0.3
Frequency Missing = 18
NOTE: The frequencies have been weighted so that theanalysis reflects the distribution of students by grade
level in the district
LA JOYA ISD - 9TH GRADE CENTER

8/6/2019 la joya isd - 9th grade center - 1996 Texas School Survey of Drug and Alcohol Use
http://slidepdf.com/reader/full/la-joya-isd-9th-grade-center-1996-texas-school-survey-of-drug-and-alcohol 64/353
SPRING 1996
UPPER USE DURING LIFETIME
Q17M Frequency Percent------------------------------------Never heard of 122 32.7Never used 238 63.8
1-2 times 10 2.711-19 times 3 0.8
Frequency Missing = 25
DOWNER USE DURING LIFETIME
Q17N Frequency Percent------------------------------------
Never heard of 119 31.9Never used 241 64.61-2 times 9 2.43-10 times 1 0.311-19 times 1 0.320+ times 2 0.5
Frequency Missing = 25
STEROID USE DURING LIFETIME
Q17O Frequency Percent------------------------------------Never heard of 61 16.2Never used 311 82.71-2 times 2 0.53-10 times 1 0.311-19 times 1 0.3
Frequency Missing = 22
8/6/2019 la joya isd - 9th grade center - 1996 Texas School Survey of Drug and Alcohol Use
http://slidepdf.com/reader/full/la-joya-isd-9th-grade-center-1996-texas-school-survey-of-drug-and-alcohol 65/353
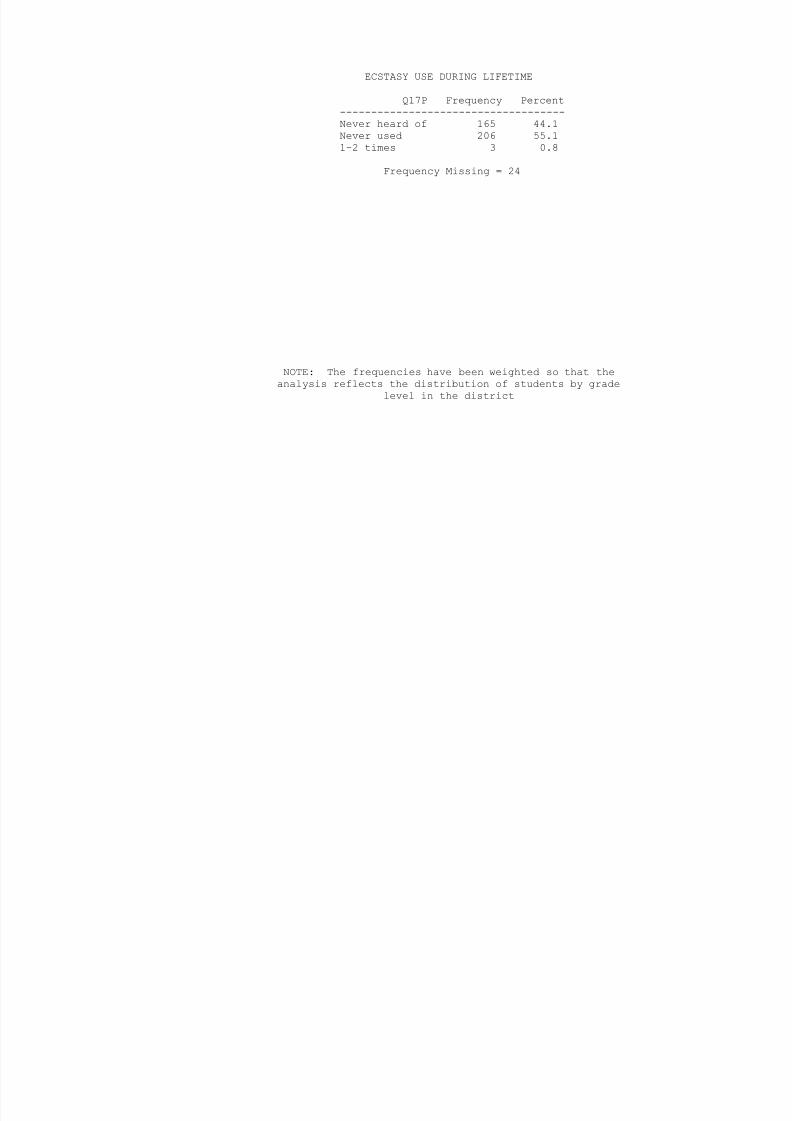
ECSTASY USE DURING LIFETIME
Q17P Frequency Percent------------------------------------Never heard of 165 44.1Never used 206 55.1
1-2 times 3 0.8
Frequency Missing = 24
NOTE: The frequencies have been weighted so that theanalysis reflects the distribution of students by grade
level in the district
LA JOYA ISD - 9TH GRADE CENTER

8/6/2019 la joya isd - 9th grade center - 1996 Texas School Survey of Drug and Alcohol Use
http://slidepdf.com/reader/full/la-joya-isd-9th-grade-center-1996-texas-school-survey-of-drug-and-alcohol 66/353
SPRING 1996
ROACH USE DURING LIFETIME
Q17Q Frequency Percent------------------------------------Never heard of 66 17.6Never used 270 72.0
1-2 times 27 7.23-10 times 6 1.611-19 times 5 1.320+ times 1 0.3
Frequency Missing = 23
CIGARETTE USE IN PAST SCHOOL YEAR
Q18A Frequency Percent------------------------------------Never heard of 18 4.7Never used 268 70.51-2 times 52 13.73-10 times 19 5.011-19 times 7 1.820+ times 16 4.2
Frequency Missing = 18
SMOKELESS TOBACCO USE IN PAST SCHOOL YR
Q18B Frequency Percent------------------------------------Never heard of 30 8.0Never used 328 87.91-2 times 5 1.33-10 times 3 0.811-19 times 3 0.8
20+ times 4 1.1

8/6/2019 la joya isd - 9th grade center - 1996 Texas School Survey of Drug and Alcohol Use
http://slidepdf.com/reader/full/la-joya-isd-9th-grade-center-1996-texas-school-survey-of-drug-and-alcohol 67/353
Frequency Missing = 25
BEER USE IN PAST SCHOOL YEAR
Q18C Frequency Percent
------------------------------------Never heard of 14 3.8Never used 233 63.11-2 times 70 19.03-10 times 26 7.011-19 times 11 3.020+ times 15 4.1
Frequency Missing = 29
NOTE: The frequencies have been weighted so that theanalysis reflects the distribution of students by grade
level in the district
LA JOYA ISD - 9TH GRADE CENTER1996

8/6/2019 la joya isd - 9th grade center - 1996 Texas School Survey of Drug and Alcohol Use
http://slidepdf.com/reader/full/la-joya-isd-9th-grade-center-1996-texas-school-survey-of-drug-and-alcohol 68/353
SPRING 1996
WINE COOLER USE IN PAST SCHOOL YEAR
Q18D Frequency Percent------------------------------------Never heard of 23 6.2Never used 238 64.3
1-2 times 68 18.43-10 times 19 5.111-19 times 13 3.520+ times 9 2.4
Frequency Missing = 28
WINE USE IN PAST SCHOOL YEAR
Q18E Frequency Percent------------------------------------Never heard of 19 5.1Never used 241 65.31-2 times 70 19.03-10 times 21 5.711-19 times 8 2.220+ times 10 2.7
Frequency Missing = 29
LIQUOR USE IN PAST SCHOOL YEAR
Q18F Frequency Percent------------------------------------Never heard of 19 5.2Never used 258 70.91-2 times 54 14.83-10 times 17 4.711-19 times 7 1.9
20+ times 9 2.5
F Mi i 34

8/6/2019 la joya isd - 9th grade center - 1996 Texas School Survey of Drug and Alcohol Use
http://slidepdf.com/reader/full/la-joya-isd-9th-grade-center-1996-texas-school-survey-of-drug-and-alcohol 69/353
Frequency Missing = 34
INHALANT USE IN PAST SCHOOL YEAR
Q18G Frequency Percent
------------------------------------Never heard of 37 10.0Never used 317 85.91-2 times 12 3.33-10 times 1 0.320+ times 2 0.5
Frequency Missing = 29
NOTE: The frequencies have been weighted so that theanalysis reflects the distribution of students by grade
level in the district

8/6/2019 la joya isd - 9th grade center - 1996 Texas School Survey of Drug and Alcohol Use
http://slidepdf.com/reader/full/la-joya-isd-9th-grade-center-1996-texas-school-survey-of-drug-and-alcohol 70/353

8/6/2019 la joya isd - 9th grade center - 1996 Texas School Survey of Drug and Alcohol Use
http://slidepdf.com/reader/full/la-joya-isd-9th-grade-center-1996-texas-school-survey-of-drug-and-alcohol 71/353
HALLUCINOGEN USE IN PAST SCHOOL YEAR
Q18L Frequency Percent------------------------------------Never heard of 99 27.3Never used 261 71.9
1-2 times 3 0.8
Frequency Missing = 35
NOTE: The frequencies have been weighted so that theanalysis reflects the distribution of students by grade
level in the district
LA JOYA ISD - 9TH GRADE CENTERSPRING 1996

8/6/2019 la joya isd - 9th grade center - 1996 Texas School Survey of Drug and Alcohol Use
http://slidepdf.com/reader/full/la-joya-isd-9th-grade-center-1996-texas-school-survey-of-drug-and-alcohol 72/353
SPRING 1996
UPPER USE IN PAST SCHOOL YEAR
Q18M Frequency Percent------------------------------------Never heard of 103 29.3Never used 239 68.1
1-2 times 7 2.03-10 times 2 0.6
Frequency Missing = 47
DOWNER USE IN PAST SCHOOL YEAR
Q18N Frequency Percent------------------------------------
Never heard of 95 27.5Never used 242 69.91-2 times 5 1.43-10 times 2 0.611-19 times 2 0.6
Frequency Missing = 52
STEROID USE IN PAST SCHOOL YEAR
Q18O Frequency Percent------------------------------------Never heard of 59 16.9Never used 290 82.91-2 times 1 0.3
Frequency Missing = 48
ECSTASY USE IN PAST SCHOOL YEAR

8/6/2019 la joya isd - 9th grade center - 1996 Texas School Survey of Drug and Alcohol Use
http://slidepdf.com/reader/full/la-joya-isd-9th-grade-center-1996-texas-school-survey-of-drug-and-alcohol 73/353
Q18P Frequency Percent------------------------------------Never heard of 129 37.0Never used 219 62.81-2 times 1 0.3
Frequency Missing = 49
NOTE: The frequencies have been weighted so that theanalysis reflects the distribution of students by grade
level in the district
LA JOYA ISD - 9TH GRADE CENTERSPRING 1996

8/6/2019 la joya isd - 9th grade center - 1996 Texas School Survey of Drug and Alcohol Use
http://slidepdf.com/reader/full/la-joya-isd-9th-grade-center-1996-texas-school-survey-of-drug-and-alcohol 74/353
SPRING 1996
ROACH USE IN PAST SCHOOL YEAR
Q18Q Frequency Percent------------------------------------Never heard of 61 16.9Never used 278 77.0
1-2 times 17 4.73-10 times 3 0.811-19 times 1 0.320+ times 1 0.3
Frequency Missing = 37
CIGARETTE USE IN PAST 30 DAYS
Q19A Frequency Percent------------------------------------Never heard of 57 15.4Never used 256 69.21-2 times 32 8.63-10 times 14 3.811-19 times 4 1.120+ times 7 1.9
Frequency Missing = 28
SMOKELESS TOBACCO USE IN PAST 30 DAYS
Q19B Frequency Percent------------------------------------Never heard of 79 21.8Never used 273 75.41-2 times 4 1.13-10 times 5 1.411-19 times 1 0.3
Frequency Missing = 36
8/6/2019 la joya isd - 9th grade center - 1996 Texas School Survey of Drug and Alcohol Use
http://slidepdf.com/reader/full/la-joya-isd-9th-grade-center-1996-texas-school-survey-of-drug-and-alcohol 75/353
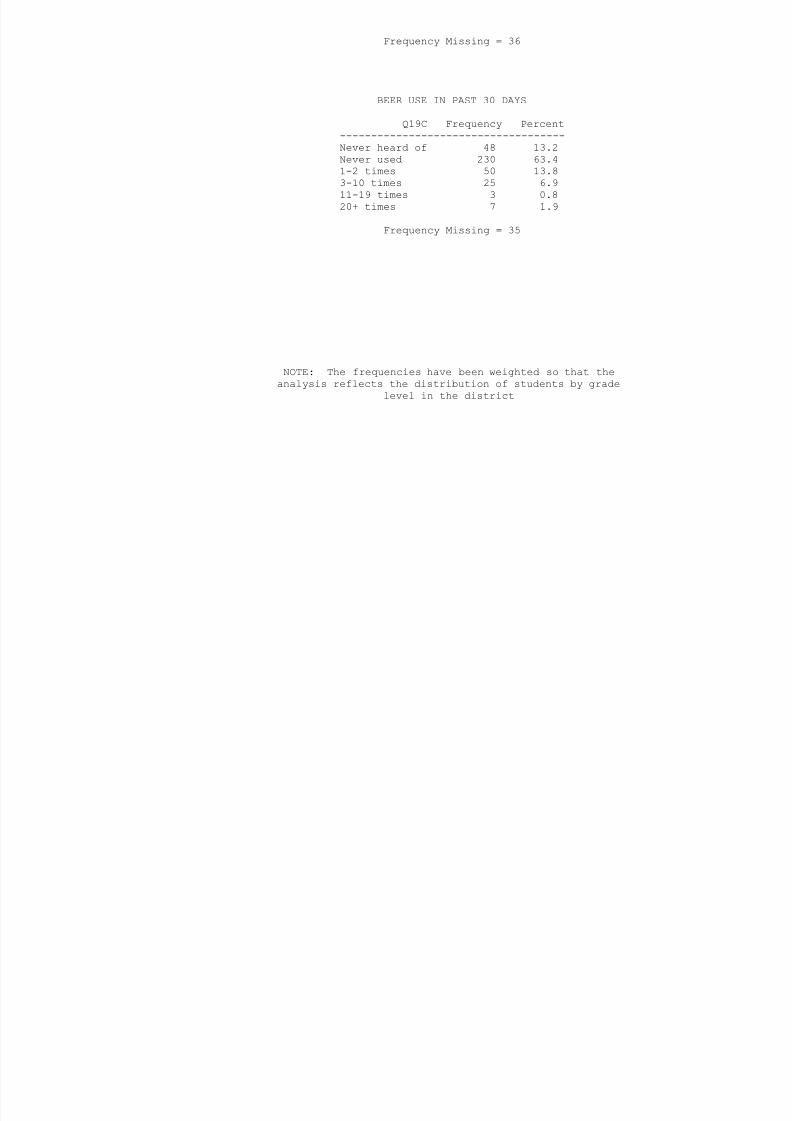
BEER USE IN PAST 30 DAYS
Q19C Frequency Percent------------------------------------
Never heard of 48 13.2Never used 230 63.41-2 times 50 13.83-10 times 25 6.911-19 times 3 0.820+ times 7 1.9
Frequency Missing = 35
NOTE: The frequencies have been weighted so that theanalysis reflects the distribution of students by grade
level in the district
8/6/2019 la joya isd - 9th grade center - 1996 Texas School Survey of Drug and Alcohol Use
http://slidepdf.com/reader/full/la-joya-isd-9th-grade-center-1996-texas-school-survey-of-drug-and-alcohol 76/353
Frequency Missing = 42
8/6/2019 la joya isd - 9th grade center - 1996 Texas School Survey of Drug and Alcohol Use
http://slidepdf.com/reader/full/la-joya-isd-9th-grade-center-1996-texas-school-survey-of-drug-and-alcohol 77/353
q y g
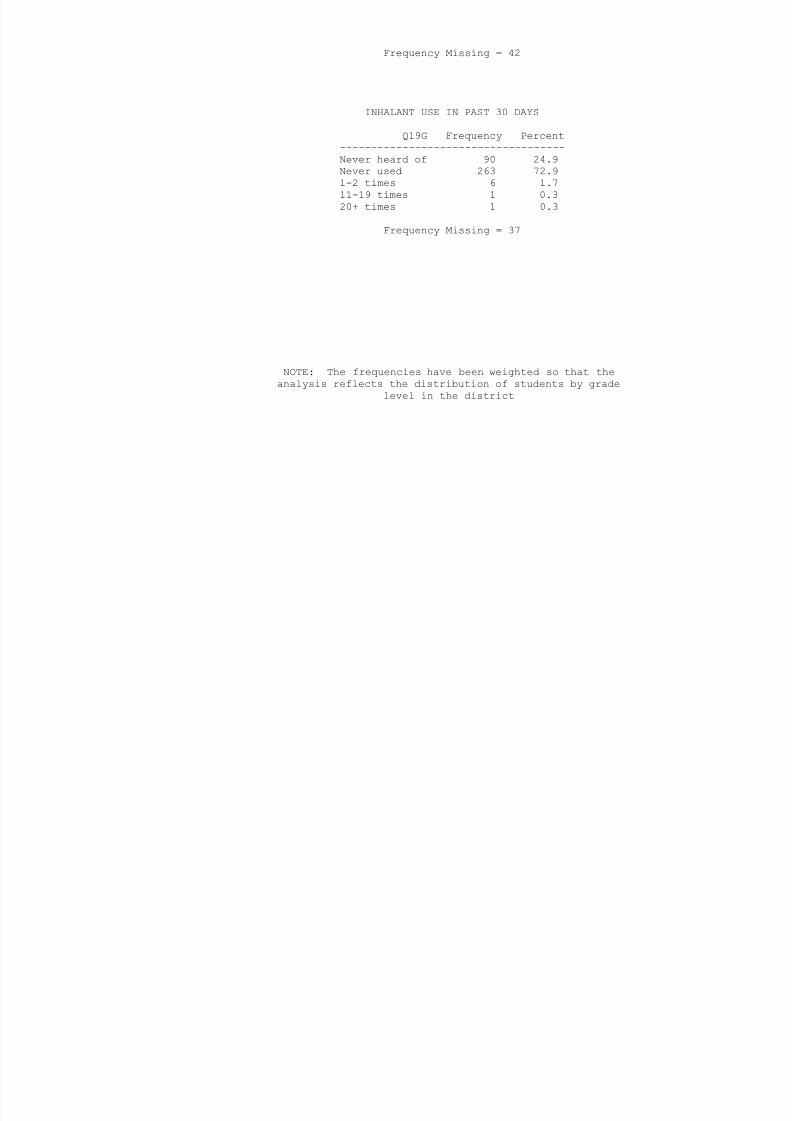
INHALANT USE IN PAST 30 DAYS
Q19G Frequency Percent
------------------------------------Never heard of 90 24.9Never used 263 72.91-2 times 6 1.711-19 times 1 0.320+ times 1 0.3
Frequency Missing = 37
NOTE: The frequencies have been weighted so that theanalysis reflects the distribution of students by grade
level in the district
LA JOYA ISD - 9TH GRADE CENTERSPRING 1996

8/6/2019 la joya isd - 9th grade center - 1996 Texas School Survey of Drug and Alcohol Use
http://slidepdf.com/reader/full/la-joya-isd-9th-grade-center-1996-texas-school-survey-of-drug-and-alcohol 78/353
MARIJUANA USE IN PAST 30 DAYS
Q19H Frequency Percent------------------------------------Never heard of 70 20.1Never used 259 74.2
1-2 times 10 2.93-10 times 4 1.111-19 times 4 1.120+ times 2 0.6
Frequency Missing = 49
COCAINE USE IN PAST 30 DAYS
Q19I Frequency Percent------------------------------------Never heard of 84 23.5Never used 268 74.91-2 times 4 1.13-10 times 2 0.6
Frequency Missing = 40
CRACK USE IN PAST 30 DAYS
Q19J Frequency Percent------------------------------------Never heard of 89 25.5Never used 258 73.91-2 times 2 0.6
Frequency Missing = 49
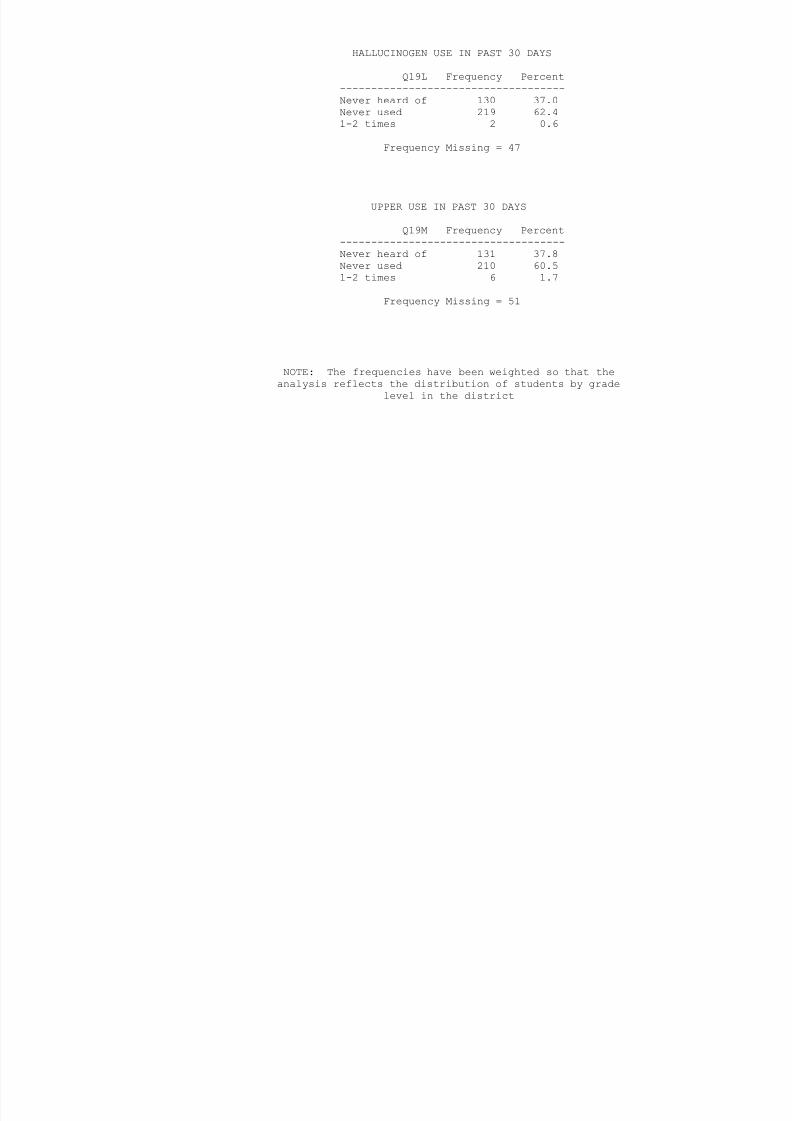
HALLUCINOGEN USE IN PAST 30 DAYS
8/6/2019 la joya isd - 9th grade center - 1996 Texas School Survey of Drug and Alcohol Use
http://slidepdf.com/reader/full/la-joya-isd-9th-grade-center-1996-texas-school-survey-of-drug-and-alcohol 79/353
Q19L Frequency Percent------------------------------------Never heard of 130 37.0Never used 219 62.41-2 times 2 0.6
Frequency Missing = 47
UPPER USE IN PAST 30 DAYS
Q19M Frequency Percent------------------------------------Never heard of 131 37.8Never used 210 60.51-2 times 6 1.7
Frequency Missing = 51
NOTE: The frequencies have been weighted so that theanalysis reflects the distribution of students by grade
level in the district

8/6/2019 la joya isd - 9th grade center - 1996 Texas School Survey of Drug and Alcohol Use
http://slidepdf.com/reader/full/la-joya-isd-9th-grade-center-1996-texas-school-survey-of-drug-and-alcohol 80/353
8/6/2019 la joya isd - 9th grade center - 1996 Texas School Survey of Drug and Alcohol Use
http://slidepdf.com/reader/full/la-joya-isd-9th-grade-center-1996-texas-school-survey-of-drug-and-alcohol 81/353
LA JOYA ISD - 9TH GRADE CENTERSPRING 1996
8/6/2019 la joya isd - 9th grade center - 1996 Texas School Survey of Drug and Alcohol Use
http://slidepdf.com/reader/full/la-joya-isd-9th-grade-center-1996-texas-school-survey-of-drug-and-alcohol 82/353
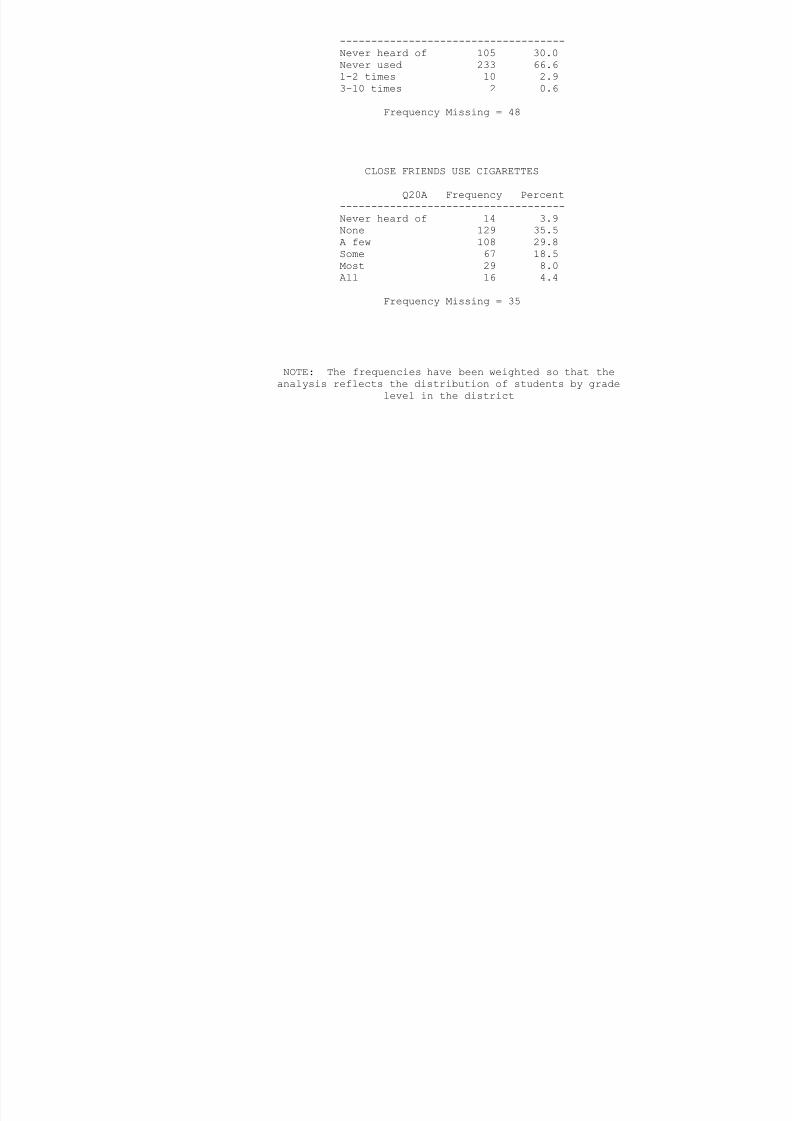
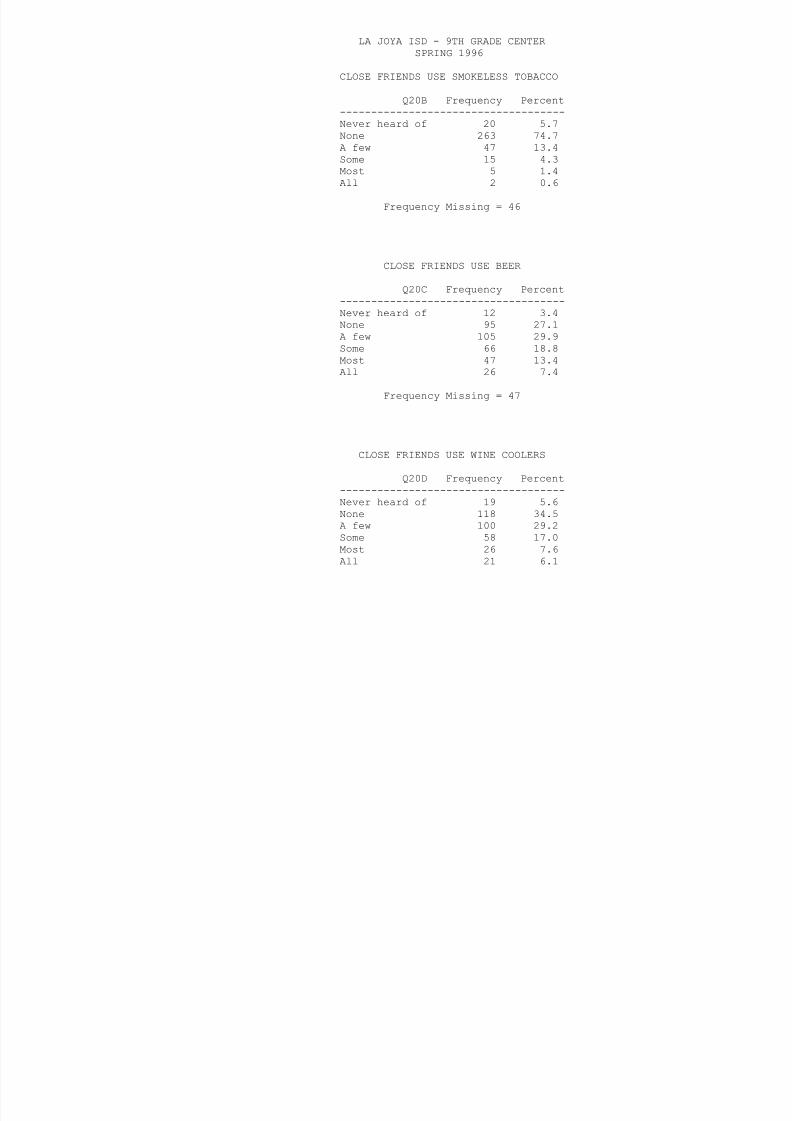
CLOSE FRIENDS USE SMOKELESS TOBACCO
Q20B Frequency Percent------------------------------------Never heard of 20 5.7None 263 74.7
A few 47 13.4Some 15 4.3Most 5 1.4All 2 0.6
Frequency Missing = 46
CLOSE FRIENDS USE BEER
Q20C Frequency Percent------------------------------------Never heard of 12 3.4None 95 27.1A few 105 29.9Some 66 18.8Most 47 13.4All 26 7.4
Frequency Missing = 47
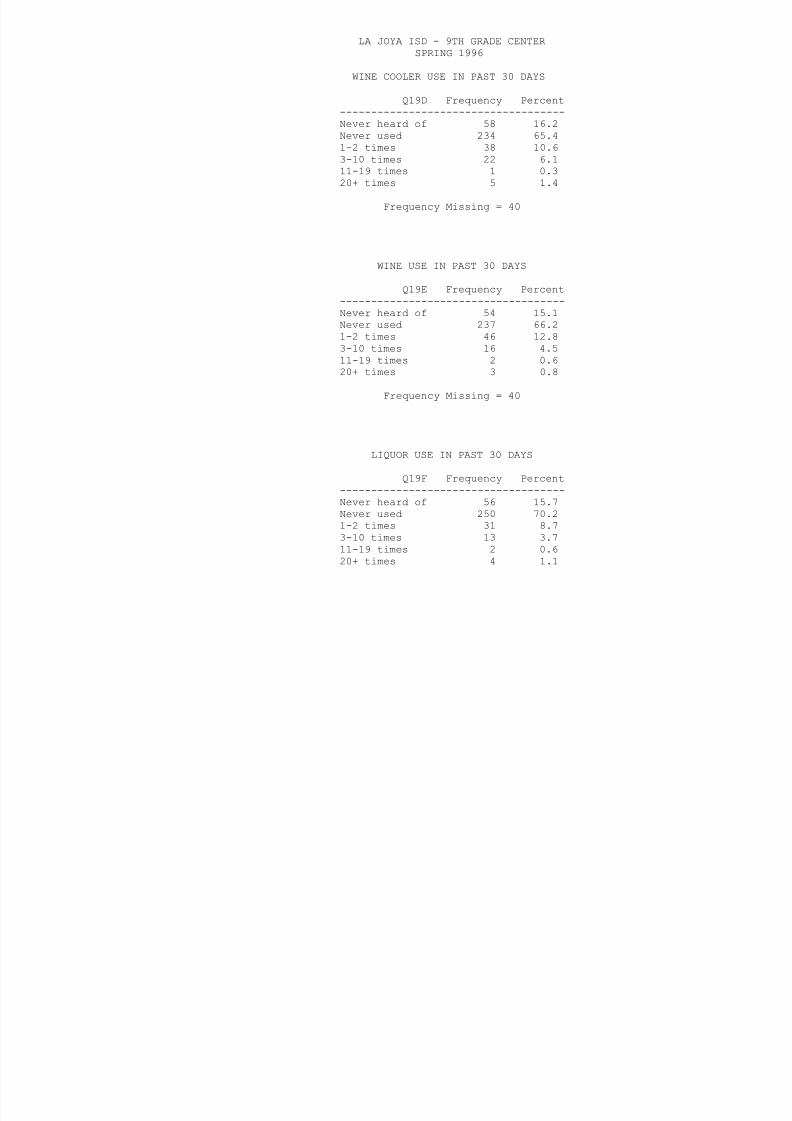
CLOSE FRIENDS USE WINE COOLERS
Q20D Frequency Percent------------------------------------Never heard of 19 5.6None 118 34.5A few 100 29.2Some 58 17.0Most 26 7.6
All 21 6.1
Frequency Missing = 56

8/6/2019 la joya isd - 9th grade center - 1996 Texas School Survey of Drug and Alcohol Use
http://slidepdf.com/reader/full/la-joya-isd-9th-grade-center-1996-texas-school-survey-of-drug-and-alcohol 83/353
CLOSE FRIENDS USE WINE
Q20E Frequency Percent
------------------------------------Never heard of 12 3.6None 138 40.8A few 103 30.5Some 44 13.0Most 25 7.4All 16 4.7
Frequency Missing = 60
NOTE: The frequencies have been weighted so that theanalysis reflects the distribution of students by grade
level in the district
LA JOYA ISD - 9TH GRADE CENTERSPRING 1996
8/6/2019 la joya isd - 9th grade center - 1996 Texas School Survey of Drug and Alcohol Use
http://slidepdf.com/reader/full/la-joya-isd-9th-grade-center-1996-texas-school-survey-of-drug-and-alcohol 84/353
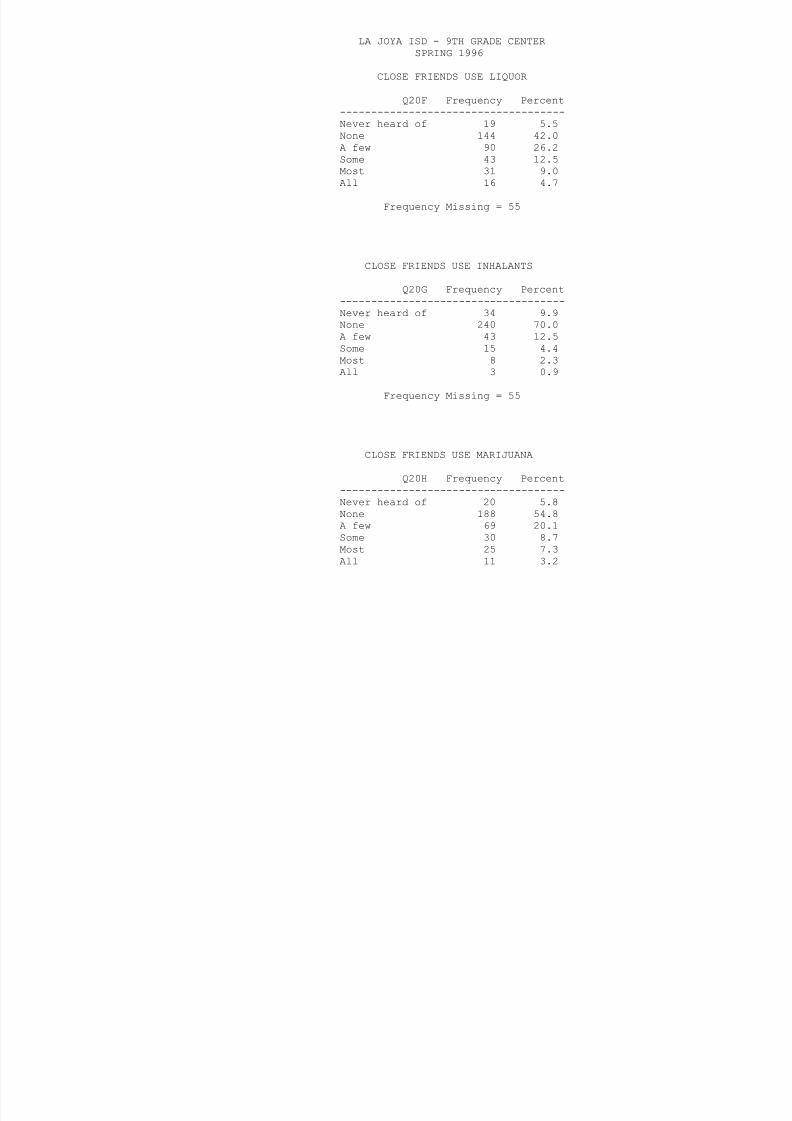
CLOSE FRIENDS USE LIQUOR
Q20F Frequency Percent------------------------------------Never heard of 19 5.5None 144 42.0
A few 90 26.2Some 43 12.5Most 31 9.0All 16 4.7
Frequency Missing = 55
CLOSE FRIENDS USE INHALANTS
Q20G Frequency Percent------------------------------------Never heard of 34 9.9None 240 70.0A few 43 12.5Some 15 4.4Most 8 2.3All 3 0.9
Frequency Missing = 55
CLOSE FRIENDS USE MARIJUANA
Q20H Frequency Percent------------------------------------Never heard of 20 5.8None 188 54.8A few 69 20.1Some 30 8.7Most 25 7.3
All 11 3.2
Frequency Missing = 55

8/6/2019 la joya isd - 9th grade center - 1996 Texas School Survey of Drug and Alcohol Use
http://slidepdf.com/reader/full/la-joya-isd-9th-grade-center-1996-texas-school-survey-of-drug-and-alcohol 85/353
CLOSE FRIENDS USE COCAINE
Q20I Frequency Percent
------------------------------------Never heard of 22 6.5None 227 67.2A few 51 15.1Some 24 7.1Most 11 3.3All 3 0.9
Frequency Missing = 60
NOTE: The frequencies have been weighted so that theanalysis reflects the distribution of students by grade
level in the district
LA JOYA ISD - 9TH GRADE CENTERSPRING 1996

8/6/2019 la joya isd - 9th grade center - 1996 Texas School Survey of Drug and Alcohol Use
http://slidepdf.com/reader/full/la-joya-isd-9th-grade-center-1996-texas-school-survey-of-drug-and-alcohol 86/353
CLOSE FRIENDS USE CRACK
Q20J Frequency Percent------------------------------------Never heard of 26 8.0None 238 72.8
A few 44 13.5Some 10 3.1Most 8 2.4All 1 0.3
Frequency Missing = 71
CLOSE FRIENDS USE HALLUCINOGENS
Q20L Frequency Percent------------------------------------Never heard of 71 21.4None 235 70.8A few 18 5.4Some 4 1.2Most 3 0.9All 1 0.3
Frequency Missing = 66
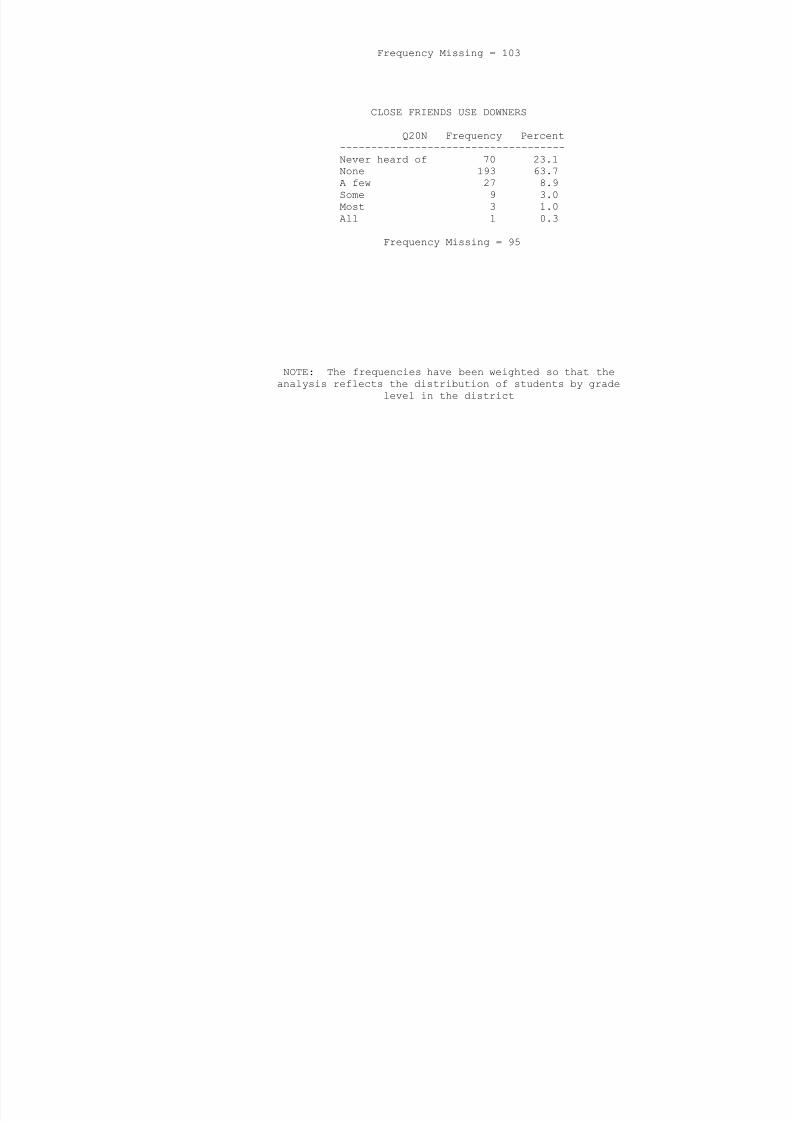
CLOSE FRIENDS USE UPPERS
Q20M Frequency Percent------------------------------------Never heard of 65 22.0None 194 65.8A few 21 7.1Some 9 3.1Most 4 1.4
All 2 0.7
8/6/2019 la joya isd - 9th grade center - 1996 Texas School Survey of Drug and Alcohol Use
http://slidepdf.com/reader/full/la-joya-isd-9th-grade-center-1996-texas-school-survey-of-drug-and-alcohol 87/353

8/6/2019 la joya isd - 9th grade center - 1996 Texas School Survey of Drug and Alcohol Use
http://slidepdf.com/reader/full/la-joya-isd-9th-grade-center-1996-texas-school-survey-of-drug-and-alcohol 88/353

8/6/2019 la joya isd - 9th grade center - 1996 Texas School Survey of Drug and Alcohol Use
http://slidepdf.com/reader/full/la-joya-isd-9th-grade-center-1996-texas-school-survey-of-drug-and-alcohol 89/353
AGE WHEN FIRST USED CIGARETTES
Q21A Frequency Percent-----------------------------------Never used it 210 58.0
<9 years old 22 6.110 years old 14 3.911 years old 14 3.912 years old 17 4.713 years old 43 11.914 years old 30 8.315 years old 10 2.816 years old 2 0.6
Frequency Missing = 36
NOTE: The frequencies have been weighted so that theanalysis reflects the distribution of students by grade
level in the district
LA JOYA ISD - 9TH GRADE CENTERSPRING 1996

8/6/2019 la joya isd - 9th grade center - 1996 Texas School Survey of Drug and Alcohol Use
http://slidepdf.com/reader/full/la-joya-isd-9th-grade-center-1996-texas-school-survey-of-drug-and-alcohol 90/353
AGE WHEN FIRST USED SMOKELESS TOBACCO
Q21B Frequency Percent-----------------------------------10 years old 3 9.111 years old 3 9.1
12 years old 3 9.113 years old 10 30.314 years old 7 21.215 years old 5 15.216 years old 1 3.0>18 years old 1 3.0
Frequency Missing = 365
AGE WHEN FIRST USED BEER
Q21C Frequency Percent-----------------------------------Never used it 181 50.4<9 years old 22 6.110 years old 16 4.511 years old 26 7.212 years old 23 6.413 years old 40 11.114 years old 36 10.015 years old 10 2.8
16 years old 5 1.4
Frequency Missing = 39
AGE WHEN FIRST USED WINE COOLERS
Q21D Frequency Percent-----------------------------------Never used it 194 54.6
<9 years old 5 1.410 years old 8 2.311 years old 17 4.8

8/6/2019 la joya isd - 9th grade center - 1996 Texas School Survey of Drug and Alcohol Use
http://slidepdf.com/reader/full/la-joya-isd-9th-grade-center-1996-texas-school-survey-of-drug-and-alcohol 91/353
11 years old 17 4.812 years old 13 3.713 years old 57 16.114 years old 39 11.015 years old 16 4.516 years old 6 1.7
Frequency Missing = 43
NOTE: The frequencies have been weighted so that theanalysis reflects the distribution of students by grade
level in the district
LA JOYA ISD - 9TH GRADE CENTERSPRING 1996
8/6/2019 la joya isd - 9th grade center - 1996 Texas School Survey of Drug and Alcohol Use
http://slidepdf.com/reader/full/la-joya-isd-9th-grade-center-1996-texas-school-survey-of-drug-and-alcohol 92/353
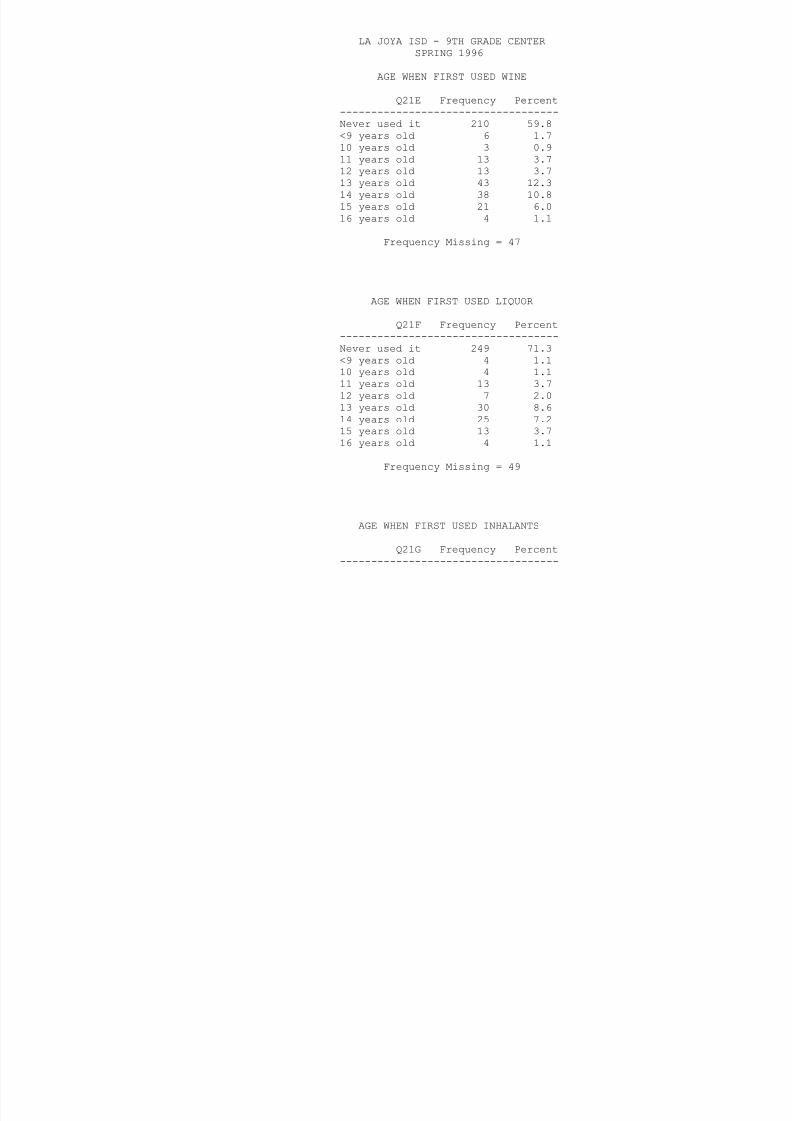
AGE WHEN FIRST USED WINE
Q21E Frequency Percent-----------------------------------Never used it 210 59.8<9 years old 6 1.710 years old 3 0.911 years old 13 3.712 years old 13 3.713 years old 43 12.314 years old 38 10.815 years old 21 6.016 years old 4 1.1
Frequency Missing = 47
AGE WHEN FIRST USED LIQUOR
Q21F Frequency Percent-----------------------------------Never used it 249 71.3<9 years old 4 1.110 years old 4 1.111 years old 13 3.712 years old 7 2.013 years old 30 8.614 years old 25 7.2
15 years old 13 3.716 years old 4 1.1
Frequency Missing = 49
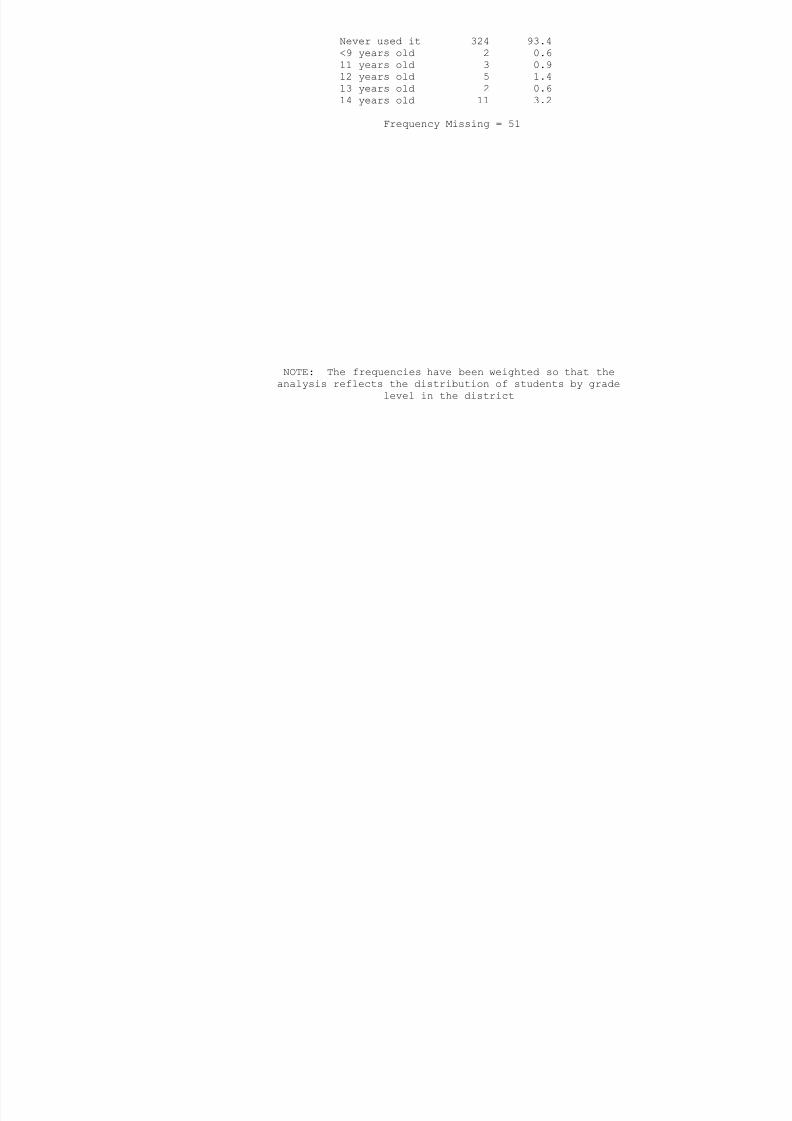
AGE WHEN FIRST USED INHALANTS
Q21G Frequency Percent-----------------------------------
Never used it 324 93.4<9 years old 2 0.611 years old 3 0.9
8/6/2019 la joya isd - 9th grade center - 1996 Texas School Survey of Drug and Alcohol Use
http://slidepdf.com/reader/full/la-joya-isd-9th-grade-center-1996-texas-school-survey-of-drug-and-alcohol 93/353
y12 years old 5 1.413 years old 2 0.614 years old 11 3.2
Frequency Missing = 51
NOTE: The frequencies have been weighted so that theanalysis reflects the distribution of students by grade
level in the district
8/6/2019 la joya isd - 9th grade center - 1996 Texas School Survey of Drug and Alcohol Use
http://slidepdf.com/reader/full/la-joya-isd-9th-grade-center-1996-texas-school-survey-of-drug-and-alcohol 94/353
16 years old 1 0.3
Frequency Missing = 51
8/6/2019 la joya isd - 9th grade center - 1996 Texas School Survey of Drug and Alcohol Use
http://slidepdf.com/reader/full/la-joya-isd-9th-grade-center-1996-texas-school-survey-of-drug-and-alcohol 95/353
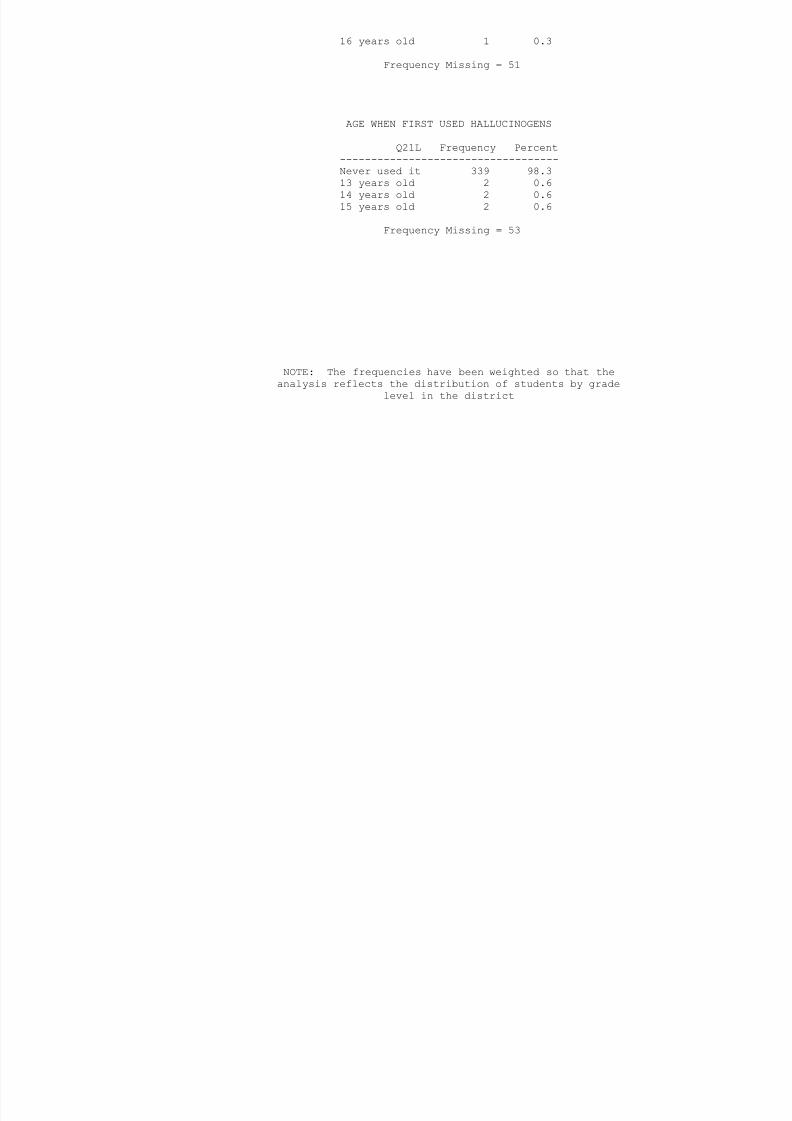
AGE WHEN FIRST USED HALLUCINOGENS
Q21L Frequency Percent-----------------------------------Never used it 339 98.313 years old 2 0.614 years old 2 0.615 years old 2 0.6
Frequency Missing = 53
NOTE: The frequencies have been weighted so that theanalysis reflects the distribution of students by grade
level in the district
LA JOYA ISD - 9TH GRADE CENTERSPRING 1996

8/6/2019 la joya isd - 9th grade center - 1996 Texas School Survey of Drug and Alcohol Use
http://slidepdf.com/reader/full/la-joya-isd-9th-grade-center-1996-texas-school-survey-of-drug-and-alcohol 96/353
AGE WHEN FIRST USED UPPERS
Q21M Frequency Percent-----------------------------------Never used it 331 97.113 years old 2 0.614 years old 5 1.515 years old 3 0.9
Frequency Missing = 57
AGE WHEN FIRST USED DOWNERS
Q21N Frequency Percent-----------------------------------
Never used it 330 97.312 years old 1 0.313 years old 2 0.614 years old 3 0.915 years old 3 0.9
Frequency Missing = 59
AGE WHEN FIRST USED STEROIDS
Q21O Frequency Percent-----------------------------------Never used it 339 99.1<9 years old 1 0.310 years old 1 0.314 years old 1 0.3
Frequency Missing = 56
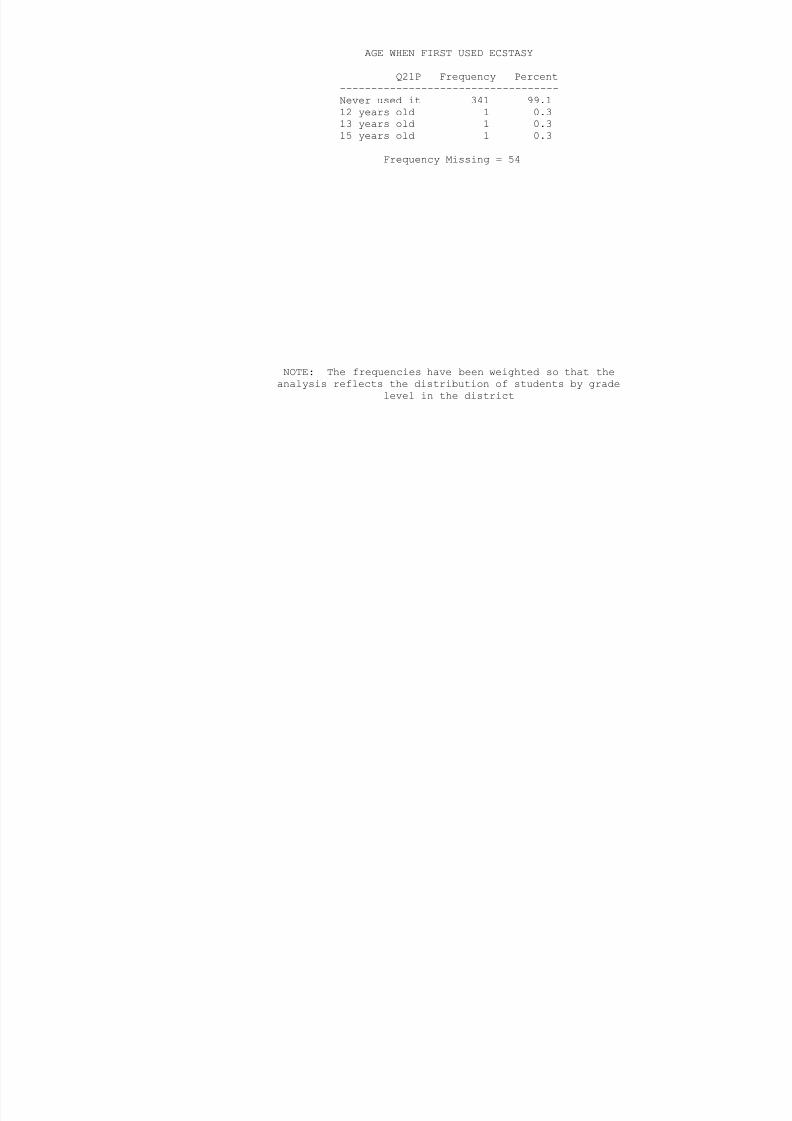
AGE WHEN FIRST USED ECSTASY
8/6/2019 la joya isd - 9th grade center - 1996 Texas School Survey of Drug and Alcohol Use
http://slidepdf.com/reader/full/la-joya-isd-9th-grade-center-1996-texas-school-survey-of-drug-and-alcohol 97/353
Q21P Frequency Percent-----------------------------------Never used it 341 99.112 years old 1 0.313 years old 1 0.315 years old 1 0.3
Frequency Missing = 54
NOTE: The frequencies have been weighted so that theanalysis reflects the distribution of students by grade
level in the district
LA JOYA ISD - 9TH GRADE CENTERSPRING 1996

8/6/2019 la joya isd - 9th grade center - 1996 Texas School Survey of Drug and Alcohol Use
http://slidepdf.com/reader/full/la-joya-isd-9th-grade-center-1996-texas-school-survey-of-drug-and-alcohol 98/353
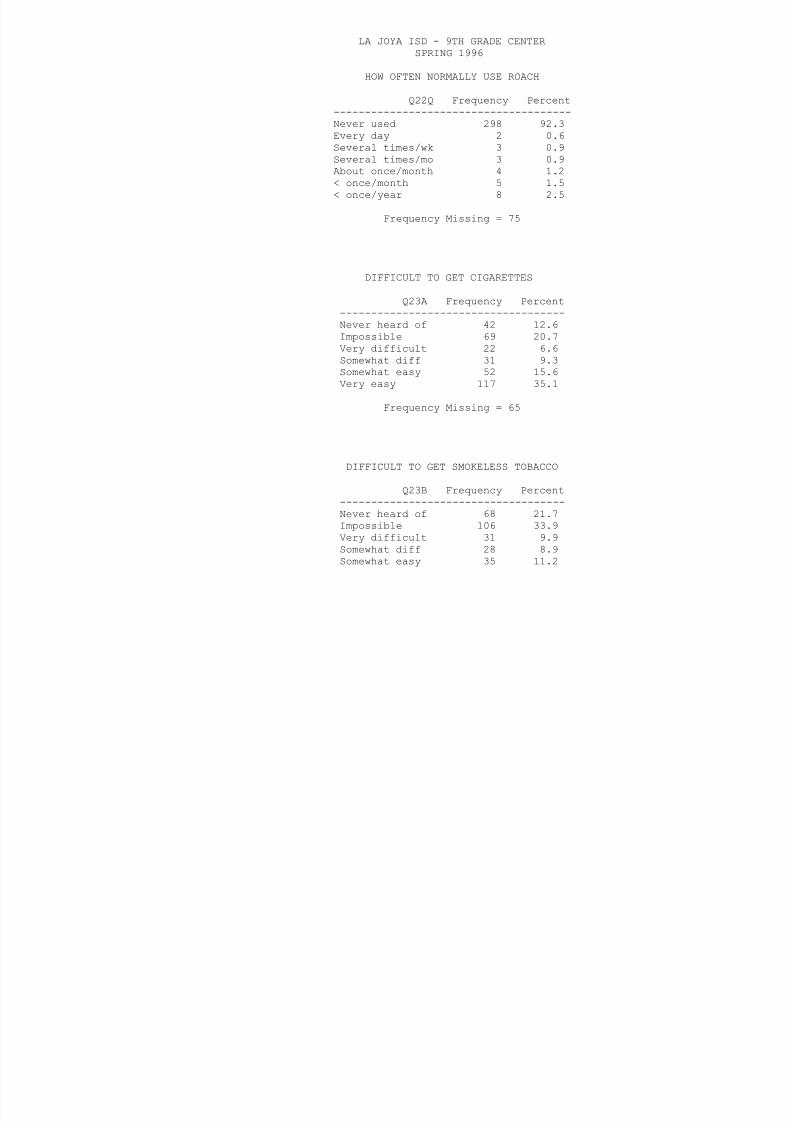
AGE WHEN FIRST USED ROACH
Q21Q Frequency Percent-----------------------------------Never used it 312 90.412 years old 7 2.013 years old 5 1.414 years old 15 4.315 years old 5 1.416 years old 1 0.3
Frequency Missing = 53
HOW OFTEN NORMALLY USE CIGARETTES
Q22A Frequency Percent--------------------------------------Never used 223 66.0Every day 4 1.2Several times/wk 11 3.3Several times/mo 20 5.9About once/month 29 8.6< once/month 27 8.0< once/year 24 7.1
Frequency Missing = 60
HOW OFTEN NORMALLY USE SMOKELESS TOBACCO
Q22B Frequency Percent--------------------------------------Never used 310 95.1Every day 1 0.3Several times/wk 1 0.3Several times/mo 5 1.5About once/month 4 1.2
< once/month 3 0.9< once/year 2 0.6
i i 72
8/6/2019 la joya isd - 9th grade center - 1996 Texas School Survey of Drug and Alcohol Use
http://slidepdf.com/reader/full/la-joya-isd-9th-grade-center-1996-texas-school-survey-of-drug-and-alcohol 99/353
Frequency Missing = 72
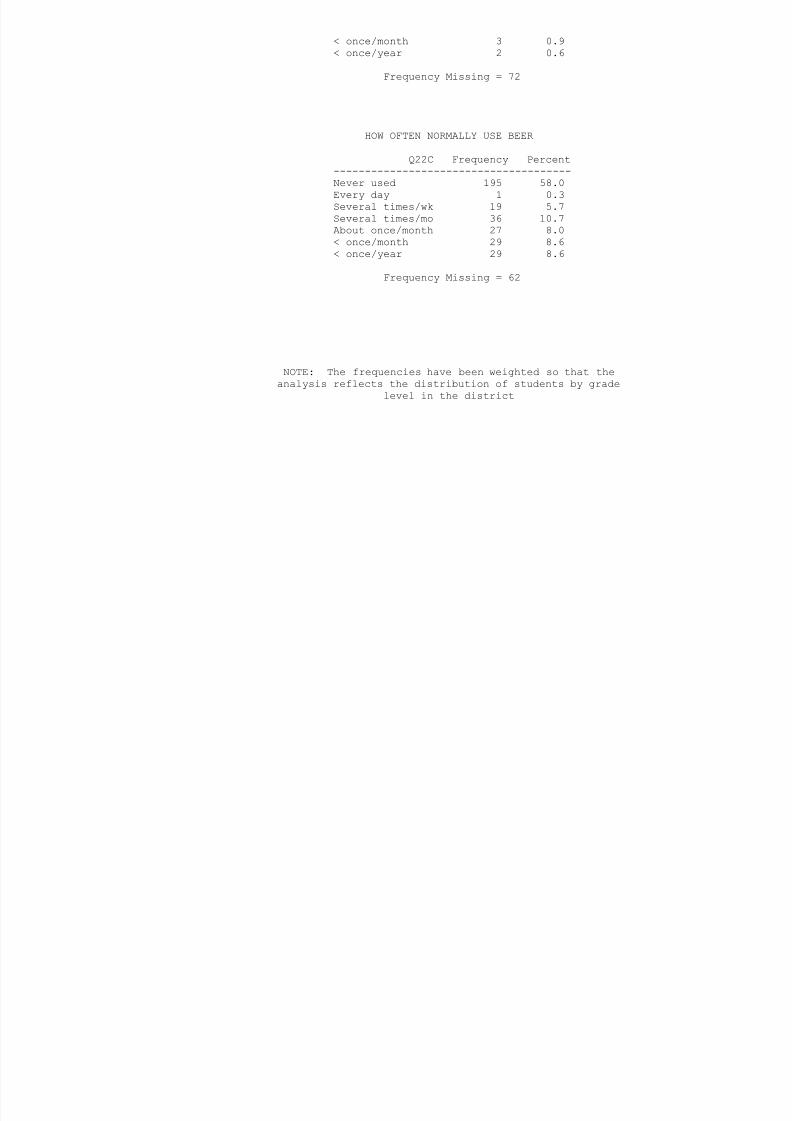
HOW OFTEN NORMALLY USE BEER
Q22C Frequency Percent--------------------------------------Never used 195 58.0Every day 1 0.3Several times/wk 19 5.7Several times/mo 36 10.7About once/month 27 8.0< once/month 29 8.6< once/year 29 8.6
Frequency Missing = 62
NOTE: The frequencies have been weighted so that theanalysis reflects the distribution of students by grade
level in the district
LA JOYA ISD - 9TH GRADE CENTERSPRING 1996
HOW OFTEN NORMALLY USE WINE COOLERS

8/6/2019 la joya isd - 9th grade center - 1996 Texas School Survey of Drug and Alcohol Use
http://slidepdf.com/reader/full/la-joya-isd-9th-grade-center-1996-texas-school-survey-of-drug-and-alcohol 100/353
HOW OFTEN NORMALLY USE WINE COOLERS
Q22D Frequency Percent--------------------------------------Never used 205 62.3Every day 2 0.6Several times/wk 12 3.6Several times/mo 31 9.4About once/month 22 6.7< once/month 33 10.0< once/year 24 7.3
Frequency Missing = 69
HOW OFTEN NORMALLY USE WINE
Q22E Frequency Percent--------------------------------------Never used 213 65.7Every day 1 0.3Several times/wk 11 3.4Several times/mo 19 5.9About once/month 17 5.2< once/month 34 10.5< once/year 29 9.0
Frequency Missing = 74
HOW OFTEN NORMALLY USE LIQUOR
Q22F Frequency Percent--------------------------------------Never used 237 71.6Several times/wk 11 3.3Several times/mo 20 6.0About once/month 17 5.1
< once/month 30 9.1< once/year 16 4.8
Freq enc Missing 67

8/6/2019 la joya isd - 9th grade center - 1996 Texas School Survey of Drug and Alcohol Use
http://slidepdf.com/reader/full/la-joya-isd-9th-grade-center-1996-texas-school-survey-of-drug-and-alcohol 101/353
Frequency Missing = 67
HOW OFTEN NORMALLY USE INHALANTS
Q22G Frequency Percent--------------------------------------Never used 313 94.8Several times/wk 1 0.3Several times/mo 2 0.6About once/month 3 0.9< once/month 9 2.7< once/year 2 0.6
Frequency Missing = 68
NOTE: The frequencies have been weighted so that theanalysis reflects the distribution of students by grade
level in the district

8/6/2019 la joya isd - 9th grade center - 1996 Texas School Survey of Drug and Alcohol Use
http://slidepdf.com/reader/full/la-joya-isd-9th-grade-center-1996-texas-school-survey-of-drug-and-alcohol 102/353
Frequency Missing = 78

8/6/2019 la joya isd - 9th grade center - 1996 Texas School Survey of Drug and Alcohol Use
http://slidepdf.com/reader/full/la-joya-isd-9th-grade-center-1996-texas-school-survey-of-drug-and-alcohol 103/353
HOW OFTEN NORMALLY USE HALLUCINOGENS
Q22L Frequency Percent--------------------------------------Never used 319 98.8About once/month 1 0.3< once/month 1 0.3< once/year 2 0.6
Frequency Missing = 75
NOTE: The frequencies have been weighted so that theanalysis reflects the distribution of students by grade
level in the district
LA JOYA ISD - 9TH GRADE CENTERSPRING 1996
HOW OFTEN NORMALLY USE UPPERS

8/6/2019 la joya isd - 9th grade center - 1996 Texas School Survey of Drug and Alcohol Use
http://slidepdf.com/reader/full/la-joya-isd-9th-grade-center-1996-texas-school-survey-of-drug-and-alcohol 104/353
HOW OFTEN NORMALLY USE UPPERS
Q22M Frequency Percent--------------------------------------Never used 304 97.4Several times/wk 1 0.3About once/month 1 0.3< once/month 4 1.3< once/year 2 0.6
Frequency Missing = 86
HOW OFTEN NORMALLY USE DOWNERS
Q22N Frequency Percent
--------------------------------------Never used 305 97.8Several times/mo 1 0.3About once/month 1 0.3< once/month 3 1.0< once/year 2 0.6
Frequency Missing = 86
HOW OFTEN NORMALLY USE STEROIDS
Q22O Frequency Percent--------------------------------------Never used 317 99.1Several times/mo 1 0.3< once/year 2 0.6
Frequency Missing = 78
HOW OFTEN NORMALLY USE ECSTASY
Q22P Frequency Percent

8/6/2019 la joya isd - 9th grade center - 1996 Texas School Survey of Drug and Alcohol Use
http://slidepdf.com/reader/full/la-joya-isd-9th-grade-center-1996-texas-school-survey-of-drug-and-alcohol 105/353
Q22P Frequency Percent--------------------------------------Never used 312 99.4Several times/mo 1 0.3< once/month 1 0.3
Frequency Missing = 84
NOTE: The frequencies have been weighted so that theanalysis reflects the distribution of students by grade
level in the district
8/6/2019 la joya isd - 9th grade center - 1996 Texas School Survey of Drug and Alcohol Use
http://slidepdf.com/reader/full/la-joya-isd-9th-grade-center-1996-texas-school-survey-of-drug-and-alcohol 106/353
Very easy 45 14.4
Frequency Missing = 85

8/6/2019 la joya isd - 9th grade center - 1996 Texas School Survey of Drug and Alcohol Use
http://slidepdf.com/reader/full/la-joya-isd-9th-grade-center-1996-texas-school-survey-of-drug-and-alcohol 107/353
DIFFICULT TO GET BEER
Q23C Frequency Percent
------------------------------------Never heard of 34 10.7Impossible 56 17.6Very difficult 22 6.9Somewhat diff 42 13.2Somewhat easy 58 18.2Very easy 106 33.3
Frequency Missing = 80
NOTE: The frequencies have been weighted so that theanalysis reflects the distribution of students by grade
level in the district
LA JOYA ISD - 9TH GRADE CENTERSPRING 1996
DIFFICULT TO GET WINE COOLERS

8/6/2019 la joya isd - 9th grade center - 1996 Texas School Survey of Drug and Alcohol Use
http://slidepdf.com/reader/full/la-joya-isd-9th-grade-center-1996-texas-school-survey-of-drug-and-alcohol 108/353
Q23D Frequency Percent------------------------------------Never heard of 45 14.1Impossible 65 20.3Very difficult 22 6.9
Somewhat diff 34 10.6Somewhat easy 56 17.5Very easy 98 30.6
Frequency Missing = 78
DIFFICULT TO GET WINE
Q23E Frequency Percent------------------------------------Never heard of 47 15.0Impossible 76 24.2Very difficult 23 7.3Somewhat diff 36 11.5Somewhat easy 47 15.0Very easy 85 27.1
Frequency Missing = 84
DIFFICULT TO GET LIQUOR
Q23F Frequency Percent------------------------------------Never heard of 51 16.3Impossible 80 25.6Very difficult 29 9.3Somewhat diff 28 8.9Somewhat easy 41 13.1Very easy 84 26.8
Frequency Missing = 85

8/6/2019 la joya isd - 9th grade center - 1996 Texas School Survey of Drug and Alcohol Use
http://slidepdf.com/reader/full/la-joya-isd-9th-grade-center-1996-texas-school-survey-of-drug-and-alcohol 109/353
DIFFICULT TO GET INHALANTS
Q23G Frequency Percent------------------------------------
Never heard of 79 24.9Impossible 98 30.9Very difficult 13 4.1Somewhat diff 15 4.7Somewhat easy 24 7.6Very easy 88 27.8
Frequency Missing = 81
NOTE: The frequencies have been weighted so that theanalysis reflects the distribution of students by grade
level in the district
LA JOYA ISD - 9TH GRADE CENTERSPRING 1996
DIFFICULT TO GET MARIJUANA

8/6/2019 la joya isd - 9th grade center - 1996 Texas School Survey of Drug and Alcohol Use
http://slidepdf.com/reader/full/la-joya-isd-9th-grade-center-1996-texas-school-survey-of-drug-and-alcohol 110/353
Q23H Frequency Percent------------------------------------Never heard of 60 19.4Impossible 114 36.9Very difficult 28 9.1
Somewhat diff 28 9.1Somewhat easy 21 6.8Very easy 58 18.8
Frequency Missing = 89
DIFFICULT TO GET COCAINE
Q23I Frequency Percent------------------------------------Never heard of 66 21.2Impossible 127 40.8Very difficult 32 10.3Somewhat diff 24 7.7Somewhat easy 24 7.7Very easy 38 12.2
Frequency Missing = 87
DIFFICULT TO GET CRACK
Q23J Frequency Percent------------------------------------Never heard of 73 23.7Impossible 135 43.8Very difficult 31 10.1Somewhat diff 25 8.1Somewhat easy 15 4.9Very easy 29 9.4
Frequency Missing = 90

8/6/2019 la joya isd - 9th grade center - 1996 Texas School Survey of Drug and Alcohol Use
http://slidepdf.com/reader/full/la-joya-isd-9th-grade-center-1996-texas-school-survey-of-drug-and-alcohol 111/353
DIFFICULT TO GET HALLUCINOGENS
Q23L Frequency Percent------------------------------------
Never heard of 111 35.7Impossible 123 39.5Very difficult 27 8.7Somewhat diff 20 6.4Somewhat easy 10 3.2Very easy 20 6.4
Frequency Missing = 87
NOTE: The frequencies have been weighted so that theanalysis reflects the distribution of students by grade
level in the district
LA JOYA ISD - 9TH GRADE CENTERSPRING 1996
DIFFICULT TO GET UPPERS

8/6/2019 la joya isd - 9th grade center - 1996 Texas School Survey of Drug and Alcohol Use
http://slidepdf.com/reader/full/la-joya-isd-9th-grade-center-1996-texas-school-survey-of-drug-and-alcohol 112/353
Q23M Frequency Percent------------------------------------Never heard of 115 37.7Impossible 108 35.4Very difficult 22 7.2
Somewhat diff 18 5.9Somewhat easy 15 4.9Very easy 27 8.9
Frequency Missing = 93
DIFFICULT TO GET DOWNERS
Q23N Frequency Percent------------------------------------Never heard of 118 38.4Impossible 107 34.9Very difficult 23 7.5Somewhat diff 17 5.5Somewhat easy 15 4.9Very easy 27 8.8
Frequency Missing = 91
DIFFICULT TO GET STEROIDS
Q23O Frequency Percent------------------------------------Never heard of 91 29.7Impossible 129 42.2Very difficult 32 10.5Somewhat diff 19 6.2Somewhat easy 7 2.3Very easy 28 9.2
Frequency Missing = 92

8/6/2019 la joya isd - 9th grade center - 1996 Texas School Survey of Drug and Alcohol Use
http://slidepdf.com/reader/full/la-joya-isd-9th-grade-center-1996-texas-school-survey-of-drug-and-alcohol 113/353
DIFFICULT TO GET ECSTASY
Q23P Frequency Percent------------------------------------
Never heard of 139 44.8Impossible 105 33.9Very difficult 26 8.4Somewhat diff 12 3.9Somewhat easy 7 2.3Very easy 21 6.8
Frequency Missing = 88
NOTE: The frequencies have been weighted so that theanalysis reflects the distribution of students by grade
level in the district
LA JOYA ISD - 9TH GRADE CENTERSPRING 1996
DIFFICULT TO GET ROACH
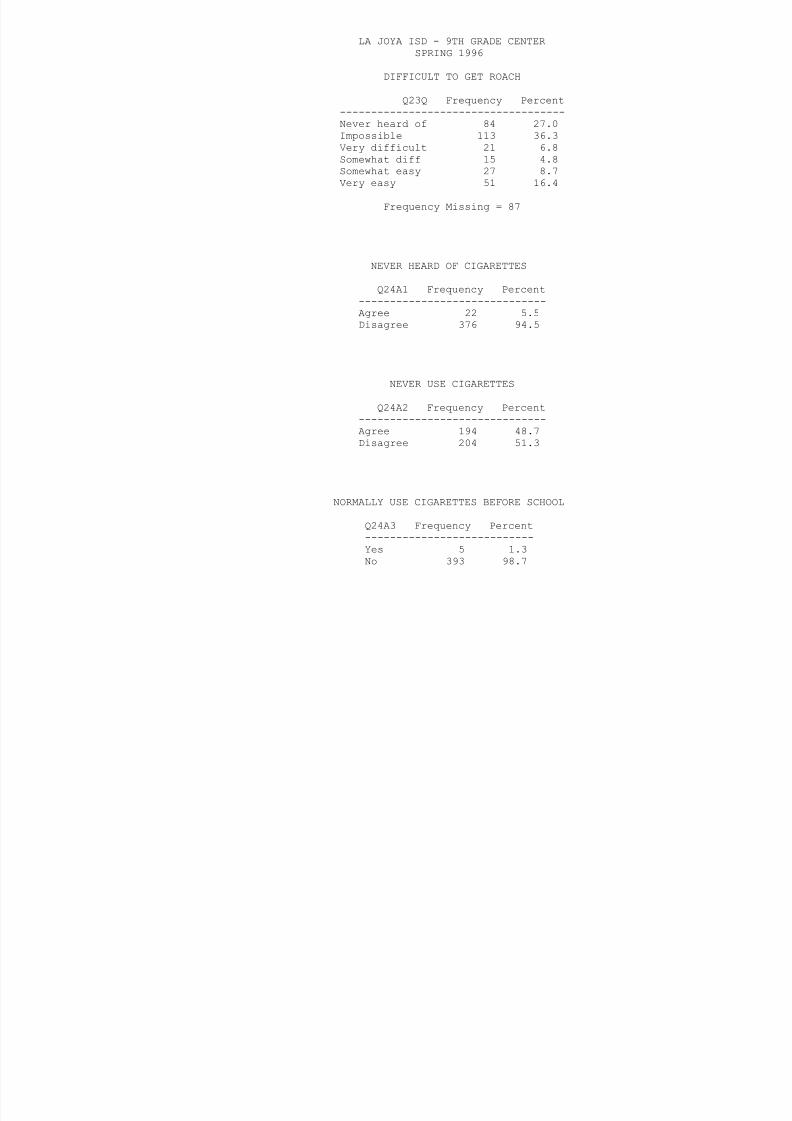
8/6/2019 la joya isd - 9th grade center - 1996 Texas School Survey of Drug and Alcohol Use
http://slidepdf.com/reader/full/la-joya-isd-9th-grade-center-1996-texas-school-survey-of-drug-and-alcohol 114/353
Q23Q Frequency Percent------------------------------------Never heard of 84 27.0Impossible 113 36.3Very difficult 21 6.8
Somewhat diff 15 4.8Somewhat easy 27 8.7Very easy 51 16.4
Frequency Missing = 87
NEVER HEARD OF CIGARETTES
Q24A1 Frequency Percent------------------------------Agree 22 5.5Disagree 376 94.5
NEVER USE CIGARETTES
Q24A2 Frequency Percent------------------------------
Agree 194 48.7Disagree 204 51.3
NORMALLY USE CIGARETTES BEFORE SCHOOL
Q24A3 Frequency Percent---------------------------Yes 5 1.3No 393 98.7
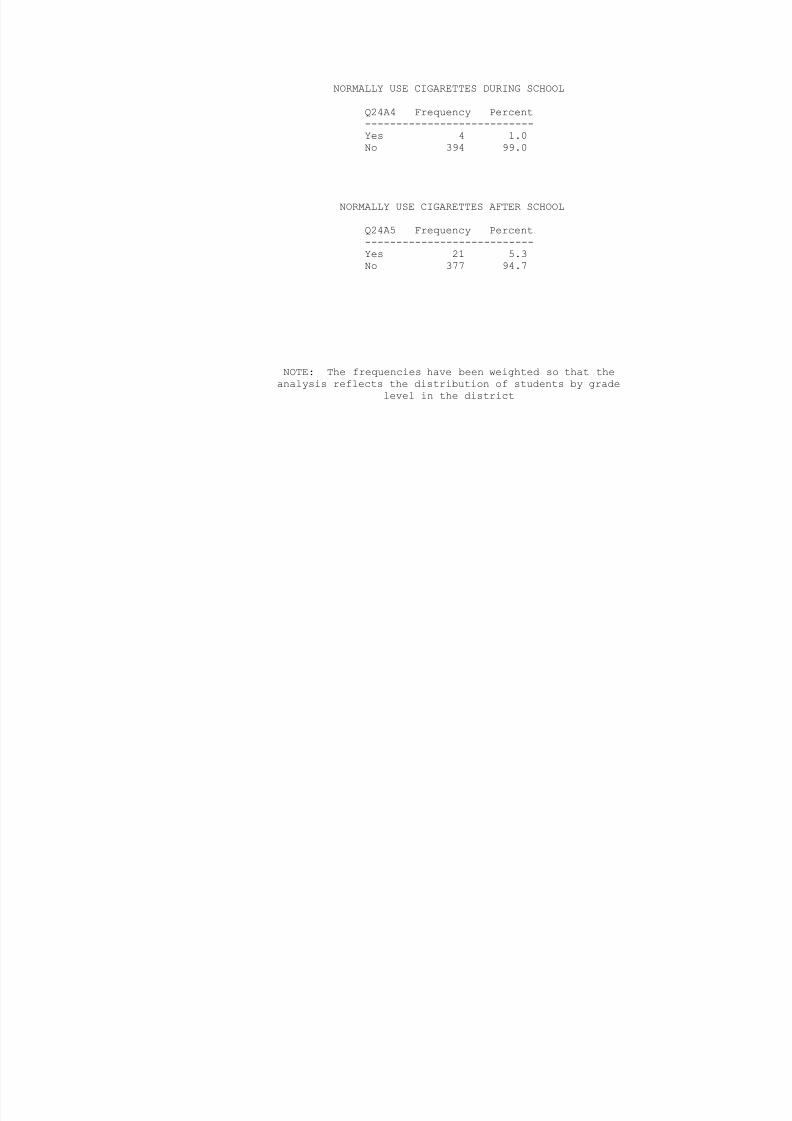
8/6/2019 la joya isd - 9th grade center - 1996 Texas School Survey of Drug and Alcohol Use
http://slidepdf.com/reader/full/la-joya-isd-9th-grade-center-1996-texas-school-survey-of-drug-and-alcohol 115/353
LA JOYA ISD - 9TH GRADE CENTERSPRING 1996
NORMALLY USE CIGARETTES ON WEEKENDS
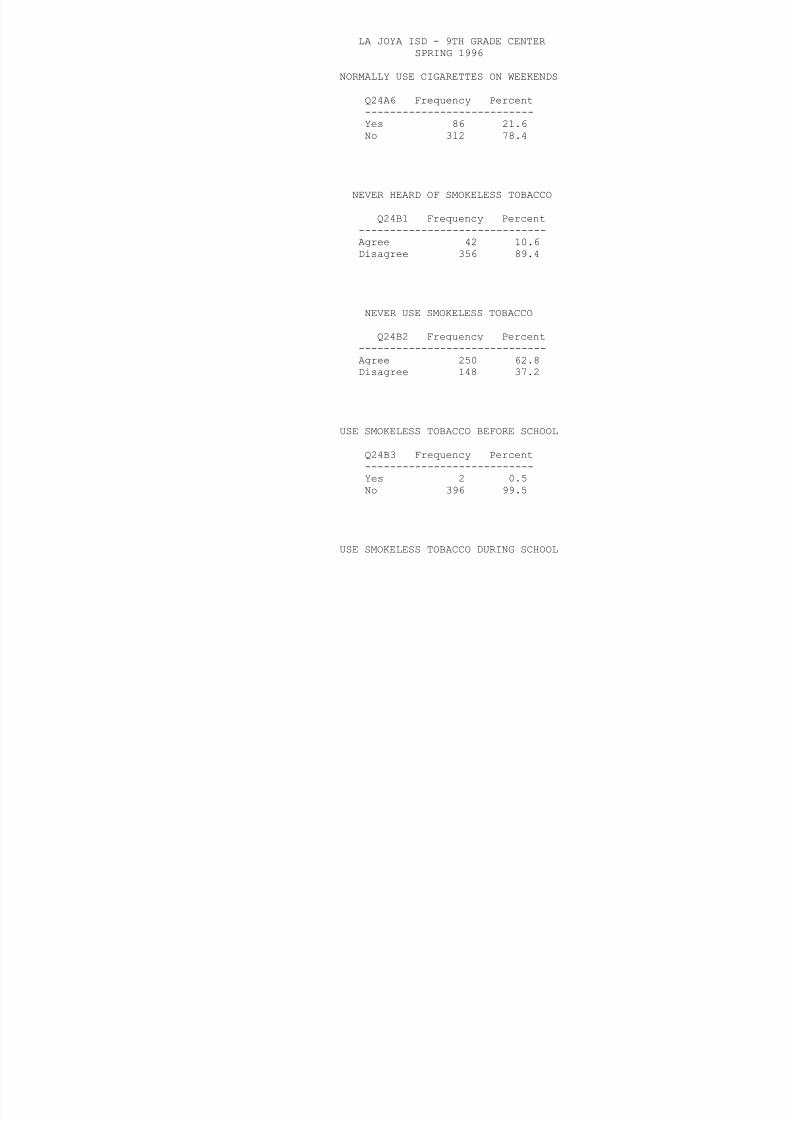
8/6/2019 la joya isd - 9th grade center - 1996 Texas School Survey of Drug and Alcohol Use
http://slidepdf.com/reader/full/la-joya-isd-9th-grade-center-1996-texas-school-survey-of-drug-and-alcohol 116/353
Q24A6 Frequency Percent---------------------------Yes 86 21.6No 312 78.4
NEVER HEARD OF SMOKELESS TOBACCO
Q24B1 Frequency Percent------------------------------Agree 42 10.6Disagree 356 89.4
NEVER USE SMOKELESS TOBACCO
Q24B2 Frequency Percent------------------------------Agree 250 62.8Disagree 148 37.2
USE SMOKELESS TOBACCO BEFORE SCHOOL
Q24B3 Frequency Percent---------------------------Yes 2 0.5No 396 99.5
USE SMOKELESS TOBACCO DURING SCHOOL
Q24B4 Frequency Percent---------------------------Yes 2 0.5No 396 99.5

8/6/2019 la joya isd - 9th grade center - 1996 Texas School Survey of Drug and Alcohol Use
http://slidepdf.com/reader/full/la-joya-isd-9th-grade-center-1996-texas-school-survey-of-drug-and-alcohol 117/353
USE SMOKELESS TOBACCO AFTER SCHOOL
Q24B5 Frequency Percent---------------------------Yes 2 0.5No 396 99.5
NOTE: The frequencies have been weighted so that theanalysis reflects the distribution of students by grade
level in the district
LA JOYA ISD - 9TH GRADE CENTERSPRING 1996
USE SMOKELESS TOBACCO ON WEEKENDS
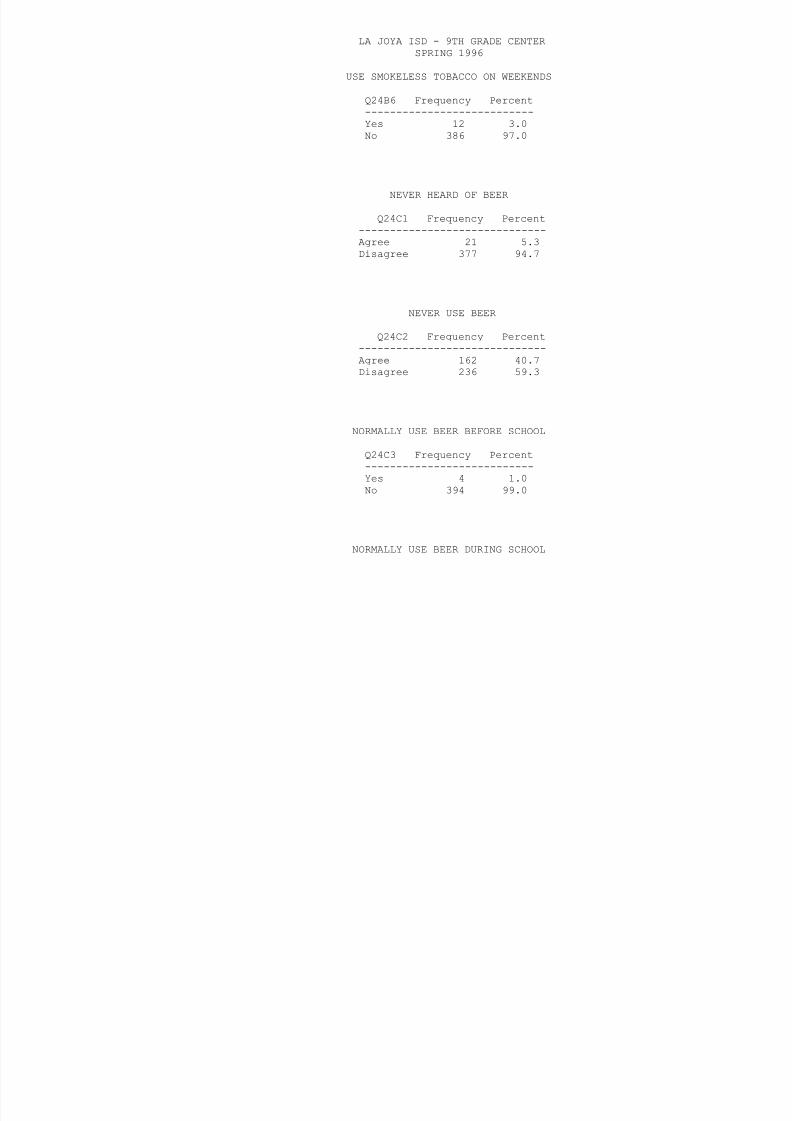
8/6/2019 la joya isd - 9th grade center - 1996 Texas School Survey of Drug and Alcohol Use
http://slidepdf.com/reader/full/la-joya-isd-9th-grade-center-1996-texas-school-survey-of-drug-and-alcohol 118/353
Q24B6 Frequency Percent---------------------------Yes 12 3.0No 386 97.0
NEVER HEARD OF BEER
Q24C1 Frequency Percent------------------------------Agree 21 5.3Disagree 377 94.7
NEVER USE BEER
Q24C2 Frequency Percent------------------------------Agree 162 40.7Disagree 236 59.3
NORMALLY USE BEER BEFORE SCHOOL
Q24C3 Frequency Percent---------------------------Yes 4 1.0No 394 99.0
NORMALLY USE BEER DURING SCHOOL

8/6/2019 la joya isd - 9th grade center - 1996 Texas School Survey of Drug and Alcohol Use
http://slidepdf.com/reader/full/la-joya-isd-9th-grade-center-1996-texas-school-survey-of-drug-and-alcohol 119/353
LA JOYA ISD - 9TH GRADE CENTERSPRING 1996
NORMALLY USE BEER ON WEEKENDS

8/6/2019 la joya isd - 9th grade center - 1996 Texas School Survey of Drug and Alcohol Use
http://slidepdf.com/reader/full/la-joya-isd-9th-grade-center-1996-texas-school-survey-of-drug-and-alcohol 120/353
Q24C6 Frequency Percent---------------------------Yes 115 28.9No 283 71.1
NEVER HEARD OF WINE COOLERS
Q24D1 Frequency Percent------------------------------Agree 23 5.8Disagree 375 94.2
NEVER USE WINE COOLERS
Q24D2 Frequency Percent------------------------------Agree 174 43.7Disagree 224 56.3
NORMALLY USE WINE COOLERS BEFORE SCHOOL
Q24D3 Frequency Percent---------------------------Yes 2 0.5No 396 99.5
NORMALLY USE WINE COOLERS DURING SCHOOL
Q24D4 Frequency Percent---------------------------Yes 3 0.8No 395 99.2
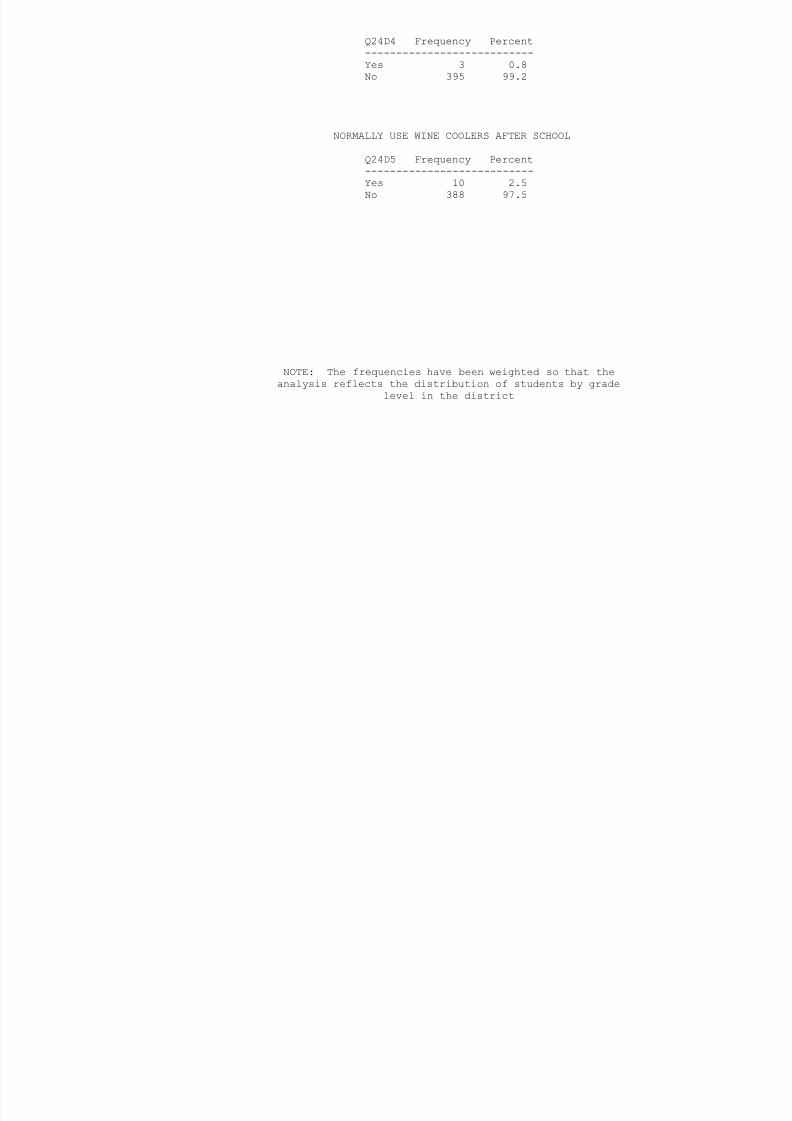
8/6/2019 la joya isd - 9th grade center - 1996 Texas School Survey of Drug and Alcohol Use
http://slidepdf.com/reader/full/la-joya-isd-9th-grade-center-1996-texas-school-survey-of-drug-and-alcohol 121/353
NORMALLY USE WINE COOLERS AFTER SCHOOL
Q24D5 Frequency Percent---------------------------Yes 10 2.5No 388 97.5
NOTE: The frequencies have been weighted so that theanalysis reflects the distribution of students by grade
level in the district
LA JOYA ISD - 9TH GRADE CENTERSPRING 1996
NORMALLY USE WINE COOLERS ON WEEKENDS

8/6/2019 la joya isd - 9th grade center - 1996 Texas School Survey of Drug and Alcohol Use
http://slidepdf.com/reader/full/la-joya-isd-9th-grade-center-1996-texas-school-survey-of-drug-and-alcohol 122/353
Q24D6 Frequency Percent---------------------------Yes 103 25.9No 295 74.1
NEVER HEARD OF WINE
Q24E1 Frequency Percent------------------------------Agree 23 5.8Disagree 375 94.2
NEVER USE WINE
Q24E2 Frequency Percent------------------------------Agree 185 46.5Disagree 213 53.5
NORMALLY USE WINE BEFORE SCHOOL
Q24E3 Frequency Percent---------------------------Yes 2 0.5No 396 99.5
NORMALLY USE WINE DURING SCHOOL
Q24E4 Frequency Percent---------------------------Yes 2 0.5No 396 99.5

8/6/2019 la joya isd - 9th grade center - 1996 Texas School Survey of Drug and Alcohol Use
http://slidepdf.com/reader/full/la-joya-isd-9th-grade-center-1996-texas-school-survey-of-drug-and-alcohol 123/353
NORMALLY USE WINE AFTER SCHOOL
Q24E5 Frequency Percent---------------------------Yes 6 1.5No 392 98.5
NOTE: The frequencies have been weighted so that theanalysis reflects the distribution of students by grade
level in the district
LA JOYA ISD - 9TH GRADE CENTERSPRING 1996
NORMALLY USE WINE ON WEEKENDS
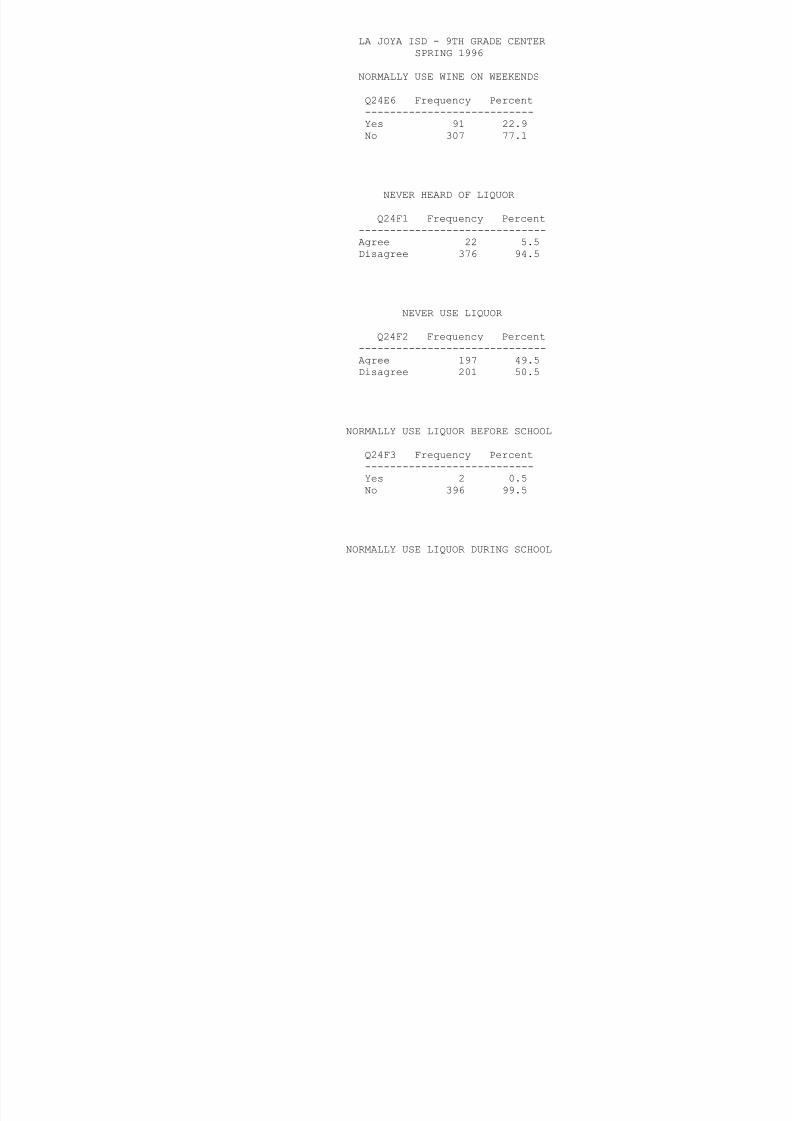
8/6/2019 la joya isd - 9th grade center - 1996 Texas School Survey of Drug and Alcohol Use
http://slidepdf.com/reader/full/la-joya-isd-9th-grade-center-1996-texas-school-survey-of-drug-and-alcohol 124/353
Q24E6 Frequency Percent---------------------------Yes 91 22.9No 307 77.1
NEVER HEARD OF LIQUOR
Q24F1 Frequency Percent------------------------------Agree 22 5.5Disagree 376 94.5
NEVER USE LIQUOR
Q24F2 Frequency Percent------------------------------Agree 197 49.5Disagree 201 50.5
NORMALLY USE LIQUOR BEFORE SCHOOL
Q24F3 Frequency Percent---------------------------Yes 2 0.5No 396 99.5
NORMALLY USE LIQUOR DURING SCHOOL

8/6/2019 la joya isd - 9th grade center - 1996 Texas School Survey of Drug and Alcohol Use
http://slidepdf.com/reader/full/la-joya-isd-9th-grade-center-1996-texas-school-survey-of-drug-and-alcohol 125/353
LA JOYA ISD - 9TH GRADE CENTERSPRING 1996
NORMALLY USE LIQUOR ON WEEKENDS
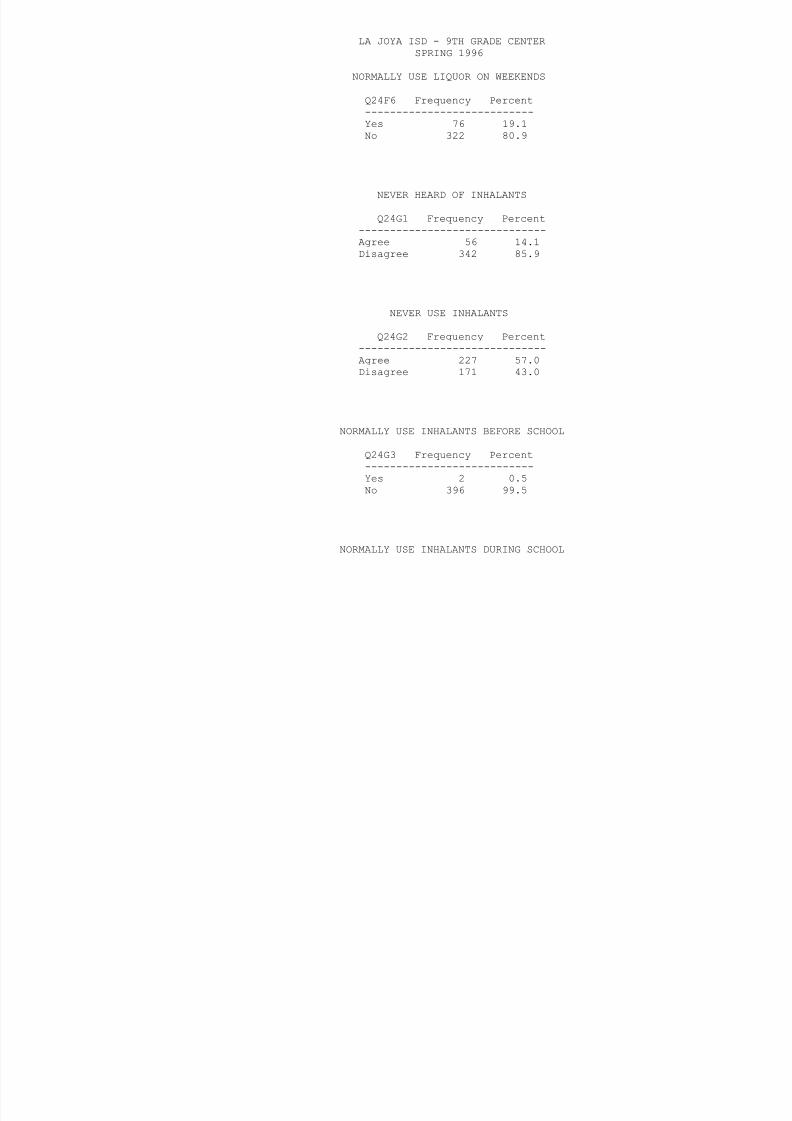
8/6/2019 la joya isd - 9th grade center - 1996 Texas School Survey of Drug and Alcohol Use
http://slidepdf.com/reader/full/la-joya-isd-9th-grade-center-1996-texas-school-survey-of-drug-and-alcohol 126/353
Q24F6 Frequency Percent---------------------------Yes 76 19.1No 322 80.9
NEVER HEARD OF INHALANTS
Q24G1 Frequency Percent------------------------------Agree 56 14.1Disagree 342 85.9
NEVER USE INHALANTS
Q24G2 Frequency Percent------------------------------Agree 227 57.0Disagree 171 43.0
NORMALLY USE INHALANTS BEFORE SCHOOL
Q24G3 Frequency Percent---------------------------Yes 2 0.5No 396 99.5
NORMALLY USE INHALANTS DURING SCHOOL
Q24G4 Frequency Percent---------------------------Yes 6 1.5No 392 98.5

8/6/2019 la joya isd - 9th grade center - 1996 Texas School Survey of Drug and Alcohol Use
http://slidepdf.com/reader/full/la-joya-isd-9th-grade-center-1996-texas-school-survey-of-drug-and-alcohol 127/353
NORMALLY USE INHALANTS AFTER SCHOOL
Q24G5 Frequency Percent---------------------------Yes 10 2.5No 388 97.5
NOTE: The frequencies have been weighted so that theanalysis reflects the distribution of students by grade
level in the district
LA JOYA ISD - 9TH GRADE CENTERSPRING 1996
NORMALLY USE INHALANTS ON WEEKENDS
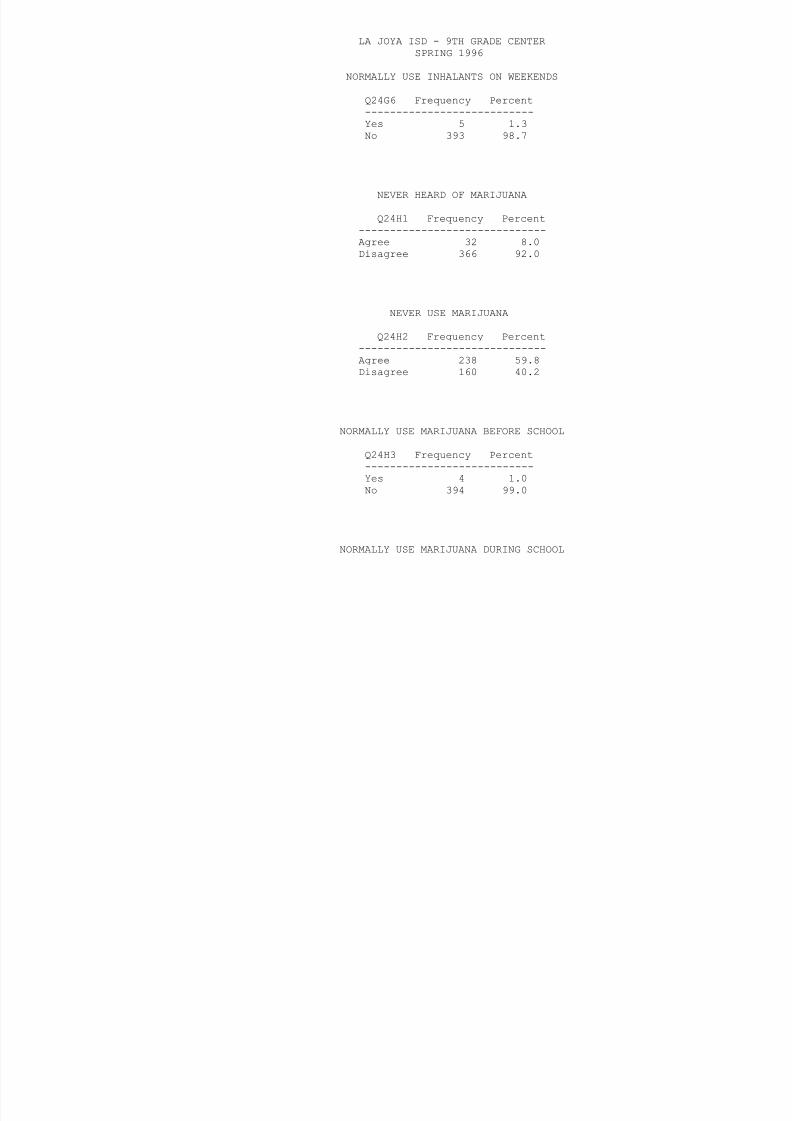
8/6/2019 la joya isd - 9th grade center - 1996 Texas School Survey of Drug and Alcohol Use
http://slidepdf.com/reader/full/la-joya-isd-9th-grade-center-1996-texas-school-survey-of-drug-and-alcohol 128/353
Q24G6 Frequency Percent---------------------------Yes 5 1.3No 393 98.7
NEVER HEARD OF MARIJUANA
Q24H1 Frequency Percent------------------------------Agree 32 8.0Disagree 366 92.0
NEVER USE MARIJUANA
Q24H2 Frequency Percent------------------------------Agree 238 59.8Disagree 160 40.2
NORMALLY USE MARIJUANA BEFORE SCHOOL
Q24H3 Frequency Percent---------------------------Yes 4 1.0No 394 99.0
NORMALLY USE MARIJUANA DURING SCHOOL

8/6/2019 la joya isd - 9th grade center - 1996 Texas School Survey of Drug and Alcohol Use
http://slidepdf.com/reader/full/la-joya-isd-9th-grade-center-1996-texas-school-survey-of-drug-and-alcohol 129/353
LA JOYA ISD - 9TH GRADE CENTERSPRING 1996
NORMALLY USE MARIJUANA ON WEEKENDS
Q24H6 F P t
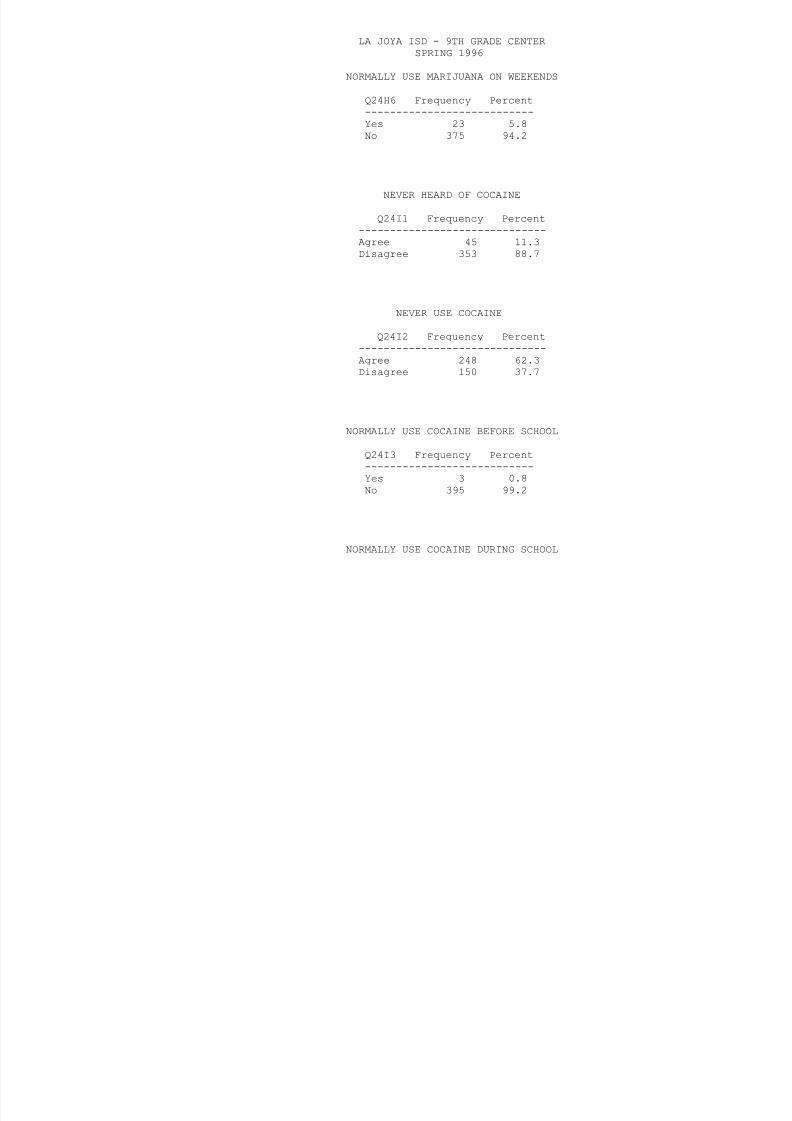
8/6/2019 la joya isd - 9th grade center - 1996 Texas School Survey of Drug and Alcohol Use
http://slidepdf.com/reader/full/la-joya-isd-9th-grade-center-1996-texas-school-survey-of-drug-and-alcohol 130/353
Q24H6 Frequency Percent---------------------------Yes 23 5.8No 375 94.2
NEVER HEARD OF COCAINE
Q24I1 Frequency Percent------------------------------Agree 45 11.3Disagree 353 88.7
NEVER USE COCAINE
Q24I2 Frequency Percent------------------------------Agree 248 62.3Disagree 150 37.7
NORMALLY USE COCAINE BEFORE SCHOOL
Q24I3 Frequency Percent---------------------------Yes 3 0.8No 395 99.2
NORMALLY USE COCAINE DURING SCHOOL
Q24I4 Frequency Percent---------------------------Yes 3 0.8No 395 99.2

8/6/2019 la joya isd - 9th grade center - 1996 Texas School Survey of Drug and Alcohol Use
http://slidepdf.com/reader/full/la-joya-isd-9th-grade-center-1996-texas-school-survey-of-drug-and-alcohol 131/353
NORMALLY USE COCAINE AFTER SCHOOL
Q24I5 Frequency Percent---------------------------Yes 1 0.3No 397 99.7
NOTE: The frequencies have been weighted so that theanalysis reflects the distribution of students by grade
level in the district
LA JOYA ISD - 9TH GRADE CENTERSPRING 1996
NORMALLY USE COCAINE ON WEEKENDS
Q24I6 Frequency Percent

8/6/2019 la joya isd - 9th grade center - 1996 Texas School Survey of Drug and Alcohol Use
http://slidepdf.com/reader/full/la-joya-isd-9th-grade-center-1996-texas-school-survey-of-drug-and-alcohol 132/353
Q24I6 Frequency Percent---------------------------Yes 2 0.5No 396 99.5
NEVER HEARD OF CRACK
Q24J1 Frequency Percent------------------------------Agree 56 14.1Disagree 342 85.9
NEVER USE CRACK
Q24J2 Frequency Percent------------------------------Agree 240 60.3Disagree 158 39.7
NORMALLY USE CRACK BEFORE SCHOOL
Q24J3 Frequency Percent---------------------------Yes 1 0.3No 397 99.7
NORMALLY USE CRACK DURING SCHOOL
Q24J4 Frequency Percent---------------------------Yes 1 0.3No 397 99.7

8/6/2019 la joya isd - 9th grade center - 1996 Texas School Survey of Drug and Alcohol Use
http://slidepdf.com/reader/full/la-joya-isd-9th-grade-center-1996-texas-school-survey-of-drug-and-alcohol 133/353
NORMALLY USE CRACK AFTER SCHOOL
Q24J5 Frequency Percent---------------------------No 398 100.0
NOTE: The frequencies have been weighted so that theanalysis reflects the distribution of students by grade
level in the district
LA JOYA ISD - 9TH GRADE CENTERSPRING 1996
NORMALLY USE CRACK ON WEEKENDS
Q24J6 Frequency Percent
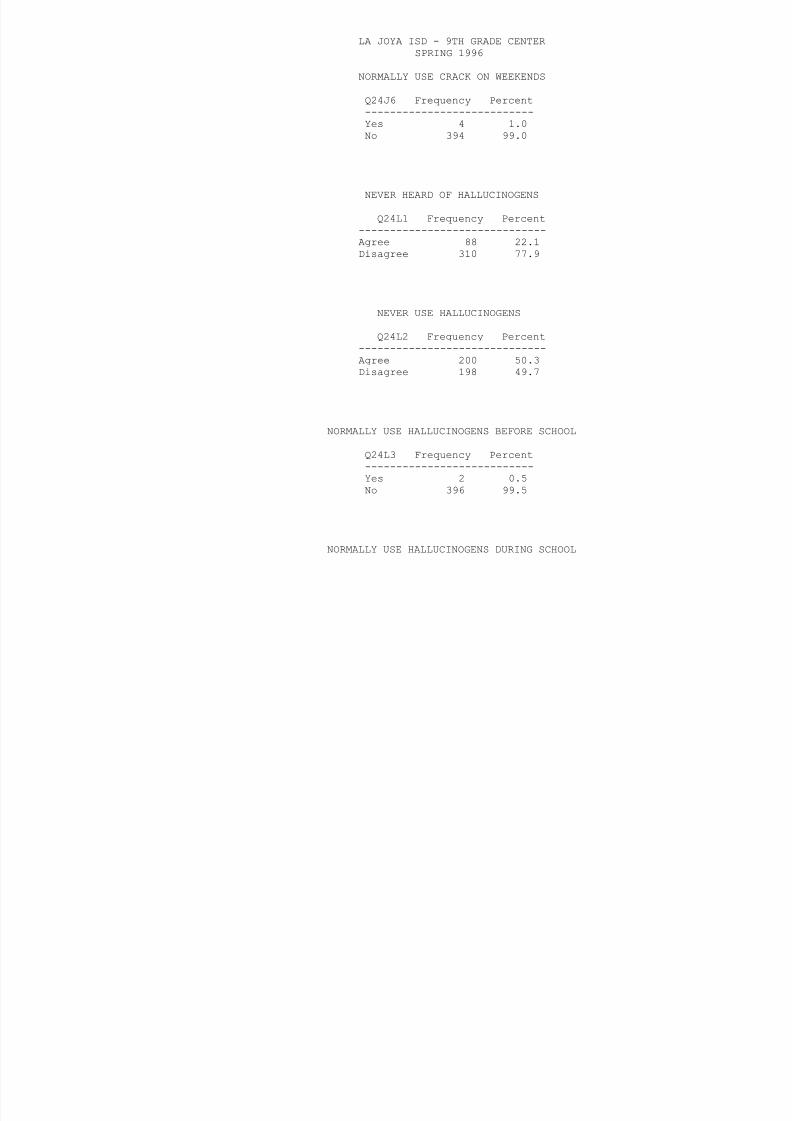
8/6/2019 la joya isd - 9th grade center - 1996 Texas School Survey of Drug and Alcohol Use
http://slidepdf.com/reader/full/la-joya-isd-9th-grade-center-1996-texas-school-survey-of-drug-and-alcohol 134/353
Q24J6 Frequency Percent---------------------------Yes 4 1.0No 394 99.0
NEVER HEARD OF HALLUCINOGENS
Q24L1 Frequency Percent------------------------------Agree 88 22.1Disagree 310 77.9
NEVER USE HALLUCINOGENS
Q24L2 Frequency Percent------------------------------Agree 200 50.3Disagree 198 49.7
NORMALLY USE HALLUCINOGENS BEFORE SCHOOL
Q24L3 Frequency Percent---------------------------Yes 2 0.5No 396 99.5
NORMALLY USE HALLUCINOGENS DURING SCHOOL
Q24L4 Frequency Percent---------------------------Yes 1 0.3No 397 99.7

8/6/2019 la joya isd - 9th grade center - 1996 Texas School Survey of Drug and Alcohol Use
http://slidepdf.com/reader/full/la-joya-isd-9th-grade-center-1996-texas-school-survey-of-drug-and-alcohol 135/353
NORMALLY USE HALLUCINOGENS AFTER SCHOOL
Q24L5 Frequency Percent---------------------------No 398 100.0
NOTE: The frequencies have been weighted so that theanalysis reflects the distribution of students by grade
level in the district
LA JOYA ISD - 9TH GRADE CENTERSPRING 1996
NORMALLY USE HALLUCINOGENS ON WEEKENDS
Q24L6 Frequency Percent

8/6/2019 la joya isd - 9th grade center - 1996 Texas School Survey of Drug and Alcohol Use
http://slidepdf.com/reader/full/la-joya-isd-9th-grade-center-1996-texas-school-survey-of-drug-and-alcohol 136/353
Q24L6 Frequency Percent---------------------------Yes 3 0.8No 395 99.2
NEVER HEARD OF UPPERS
Q24M1 Frequency Percent------------------------------Agree 83 20.9Disagree 315 79.1
NEVER USE UPPERS
Q24M2 Frequency Percent------------------------------Agree 202 50.8Disagree 196 49.2
NORMALLY USE UPPERS BEFORE SCHOOL
Q24M3 Frequency Percent---------------------------Yes 5 1.3No 393 98.7
NORMALLY USE UPPERS DURING SCHOOL
Q24M4 Frequency Percent---------------------------Yes 1 0.3No 397 99.7

8/6/2019 la joya isd - 9th grade center - 1996 Texas School Survey of Drug and Alcohol Use
http://slidepdf.com/reader/full/la-joya-isd-9th-grade-center-1996-texas-school-survey-of-drug-and-alcohol 137/353
NORMALLY USE UPPERS AFTER SCHOOL
Q24M5 Frequency Percent---------------------------Yes 2 0.5No 396 99.5
NOTE: The frequencies have been weighted so that theanalysis reflects the distribution of students by grade
level in the district
LA JOYA ISD - 9TH GRADE CENTERSPRING 1996
NORMALLY USE UPPERS ON WEEKENDS
Q24M6 Frequency Percent

8/6/2019 la joya isd - 9th grade center - 1996 Texas School Survey of Drug and Alcohol Use
http://slidepdf.com/reader/full/la-joya-isd-9th-grade-center-1996-texas-school-survey-of-drug-and-alcohol 138/353
Q q y---------------------------Yes 5 1.3No 393 98.7
NEVER HEARD OF DOWNERS
Q24N1 Frequency Percent------------------------------Agree 86 21.6Disagree 312 78.4
NEVER USE DOWNERS
Q24N2 Frequency Percent------------------------------Agree 196 49.2Disagree 202 50.8
NORMALLY USE DOWNERS BEFORE SCHOOL
Q24N3 Frequency Percent---------------------------Yes 3 0.8No 395 99.2
NORMALLY USE DOWNERS DURING SCHOOL

8/6/2019 la joya isd - 9th grade center - 1996 Texas School Survey of Drug and Alcohol Use
http://slidepdf.com/reader/full/la-joya-isd-9th-grade-center-1996-texas-school-survey-of-drug-and-alcohol 139/353
LA JOYA ISD - 9TH GRADE CENTERSPRING 1996
NORMALLY USE DOWNERS ON WEEKENDS
Q24N6 Frequency Percent
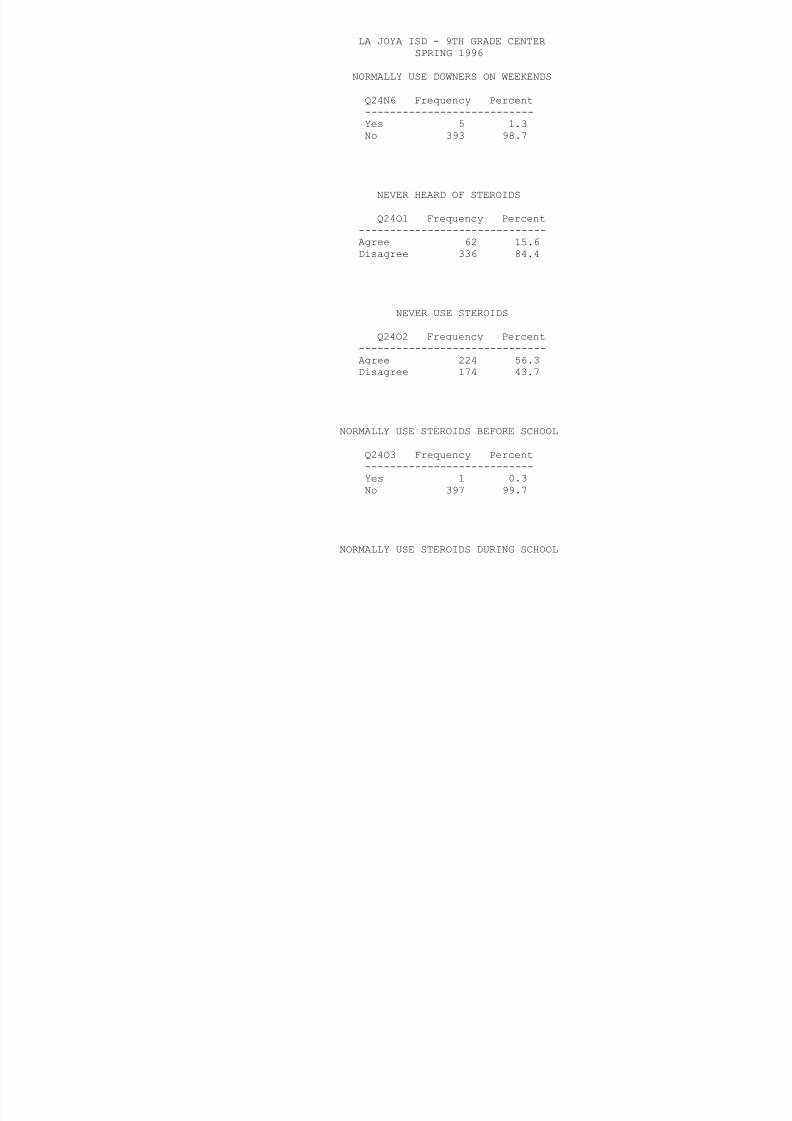
8/6/2019 la joya isd - 9th grade center - 1996 Texas School Survey of Drug and Alcohol Use
http://slidepdf.com/reader/full/la-joya-isd-9th-grade-center-1996-texas-school-survey-of-drug-and-alcohol 140/353
q y---------------------------Yes 5 1.3No 393 98.7
NEVER HEARD OF STEROIDS
Q24O1 Frequency Percent------------------------------Agree 62 15.6Disagree 336 84.4
NEVER USE STEROIDS
Q24O2 Frequency Percent------------------------------Agree 224 56.3Disagree 174 43.7
NORMALLY USE STEROIDS BEFORE SCHOOL
Q24O3 Frequency Percent---------------------------Yes 1 0.3No 397 99.7
NORMALLY USE STEROIDS DURING SCHOOL

8/6/2019 la joya isd - 9th grade center - 1996 Texas School Survey of Drug and Alcohol Use
http://slidepdf.com/reader/full/la-joya-isd-9th-grade-center-1996-texas-school-survey-of-drug-and-alcohol 141/353
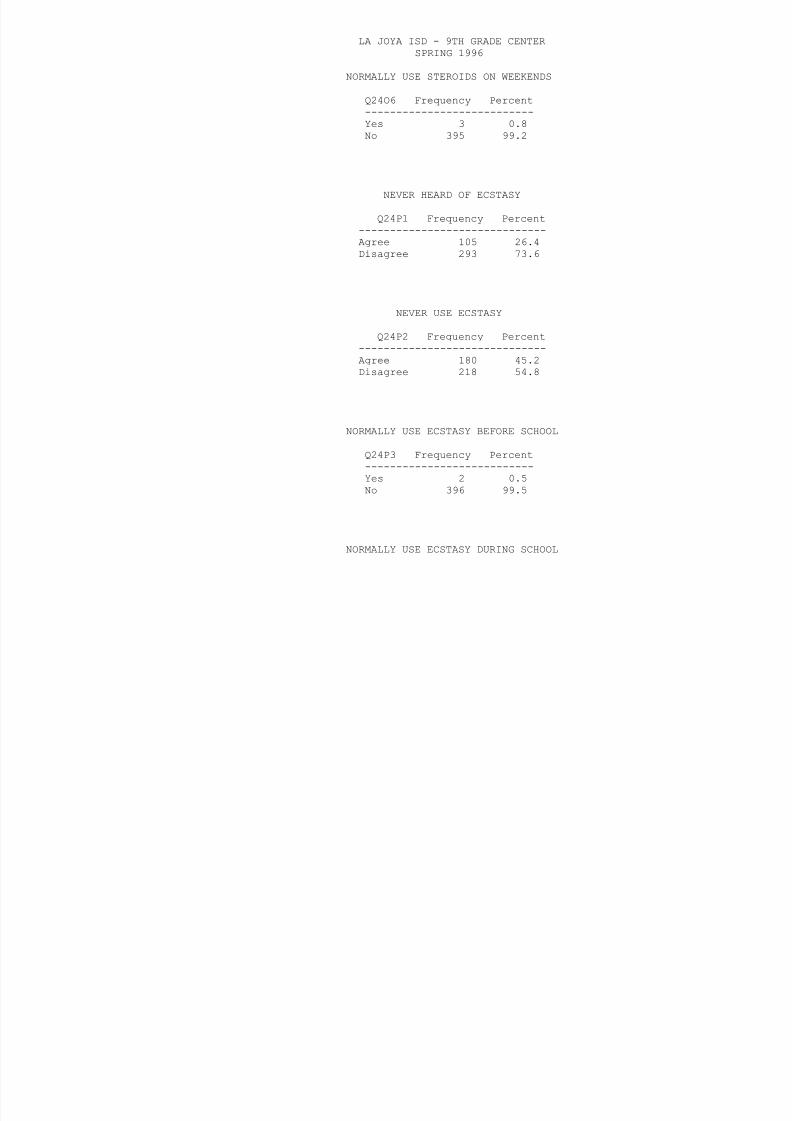
8/6/2019 la joya isd - 9th grade center - 1996 Texas School Survey of Drug and Alcohol Use
http://slidepdf.com/reader/full/la-joya-isd-9th-grade-center-1996-texas-school-survey-of-drug-and-alcohol 142/353
Q24P4 Frequency Percent---------------------------Yes 1 0.3No 397 99.7

8/6/2019 la joya isd - 9th grade center - 1996 Texas School Survey of Drug and Alcohol Use
http://slidepdf.com/reader/full/la-joya-isd-9th-grade-center-1996-texas-school-survey-of-drug-and-alcohol 143/353
NORMALLY USE ECSTASY AFTER SCHOOL
Q24P5 Frequency Percent---------------------------No 398 100.0
NOTE: The frequencies have been weighted so that theanalysis reflects the distribution of students by grade
level in the district
LA JOYA ISD - 9TH GRADE CENTERSPRING 1996
NORMALLY USE ECSTASY ON WEEKENDS
Q24P6 Frequency Percent

8/6/2019 la joya isd - 9th grade center - 1996 Texas School Survey of Drug and Alcohol Use
http://slidepdf.com/reader/full/la-joya-isd-9th-grade-center-1996-texas-school-survey-of-drug-and-alcohol 144/353
---------------------------Yes 1 0.3No 397 99.7
NEVER HEARD OF ECSTASY
Q24Q1 Frequency Percent------------------------------Agree 61 15.3Disagree 337 84.7
NEVER USE ROACH
Q24Q2 Frequency Percent------------------------------Agree 209 52.5Disagree 189 47.5
NORMALLY USE ROACH BEFORE SCHOOL
Q24Q3 Frequency Percent---------------------------Yes 3 0.8No 395 99.2
NORMALLY USE ROACH DURING SCHOOL
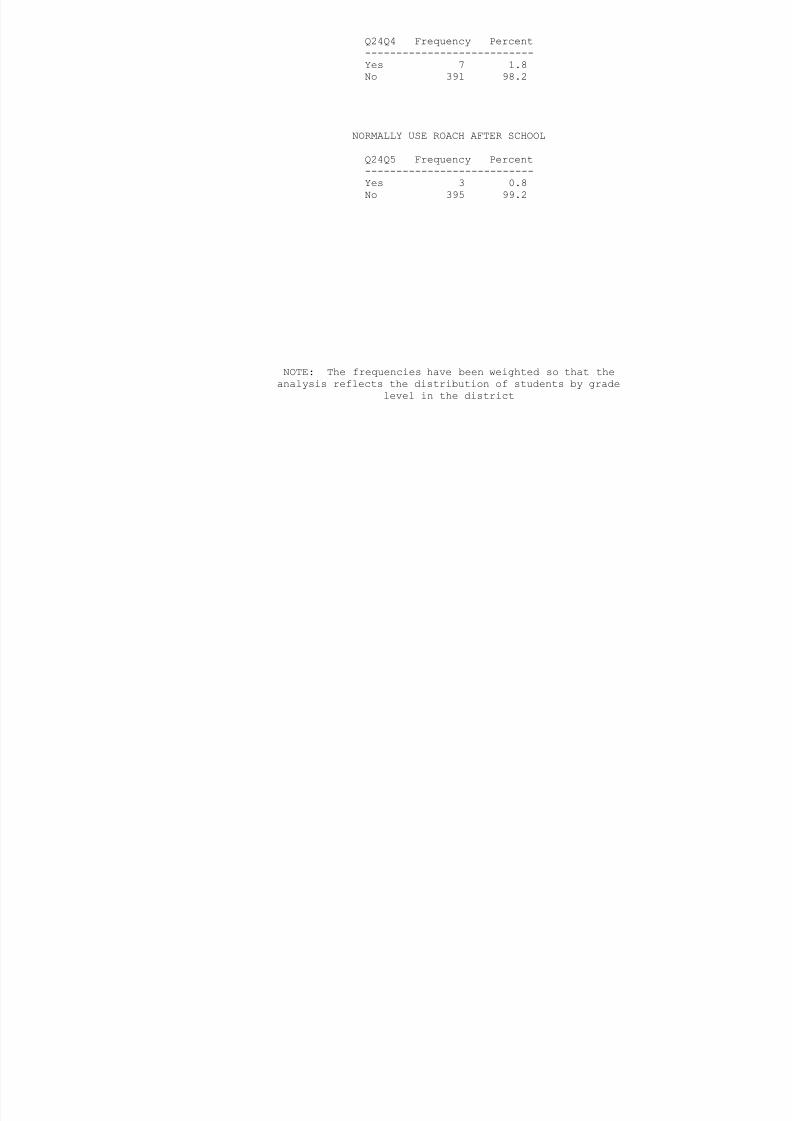
8/6/2019 la joya isd - 9th grade center - 1996 Texas School Survey of Drug and Alcohol Use
http://slidepdf.com/reader/full/la-joya-isd-9th-grade-center-1996-texas-school-survey-of-drug-and-alcohol 145/353

8/6/2019 la joya isd - 9th grade center - 1996 Texas School Survey of Drug and Alcohol Use
http://slidepdf.com/reader/full/la-joya-isd-9th-grade-center-1996-texas-school-survey-of-drug-and-alcohol 146/353
AMOUNT OF WINE AT ONE TIME
Q25C F P t

8/6/2019 la joya isd - 9th grade center - 1996 Texas School Survey of Drug and Alcohol Use
http://slidepdf.com/reader/full/la-joya-isd-9th-grade-center-1996-texas-school-survey-of-drug-and-alcohol 147/353
Q25C Frequency Percent--------------------------------------Never drink this 167 55.912+ drinks 13 4.3
9-11 drinks 6 2.05-8 drinks 10 3.33-4 drinks 22 7.42 drinks 20 6.71 drink 24 8.0< 1 drink 37 12.4
Frequency Missing = 99
NOTE: The frequencies have been weighted so that theanalysis reflects the distribution of students by grade
level in the district
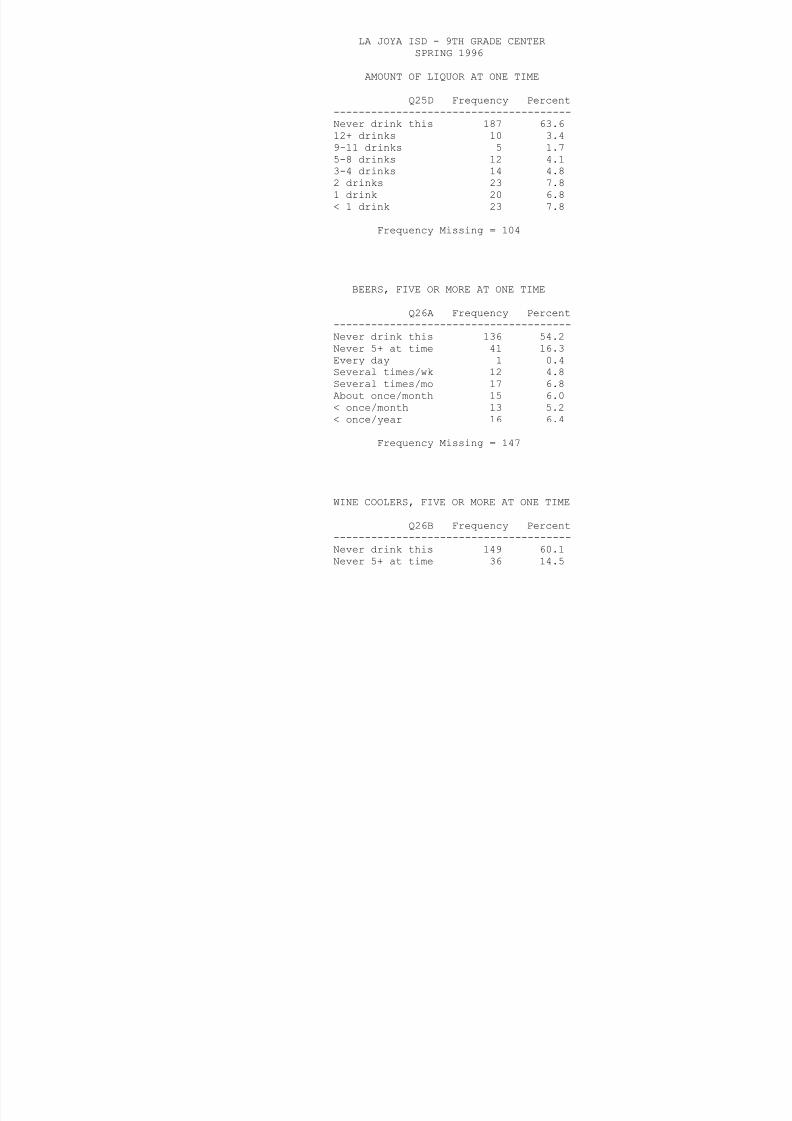
8/6/2019 la joya isd - 9th grade center - 1996 Texas School Survey of Drug and Alcohol Use
http://slidepdf.com/reader/full/la-joya-isd-9th-grade-center-1996-texas-school-survey-of-drug-and-alcohol 148/353
Every day 1 0.4Several times/wk 7 2.8Several times/mo 13 5.2About once/month 11 4.4< once/month 14 5.6< once/year 17 6.9
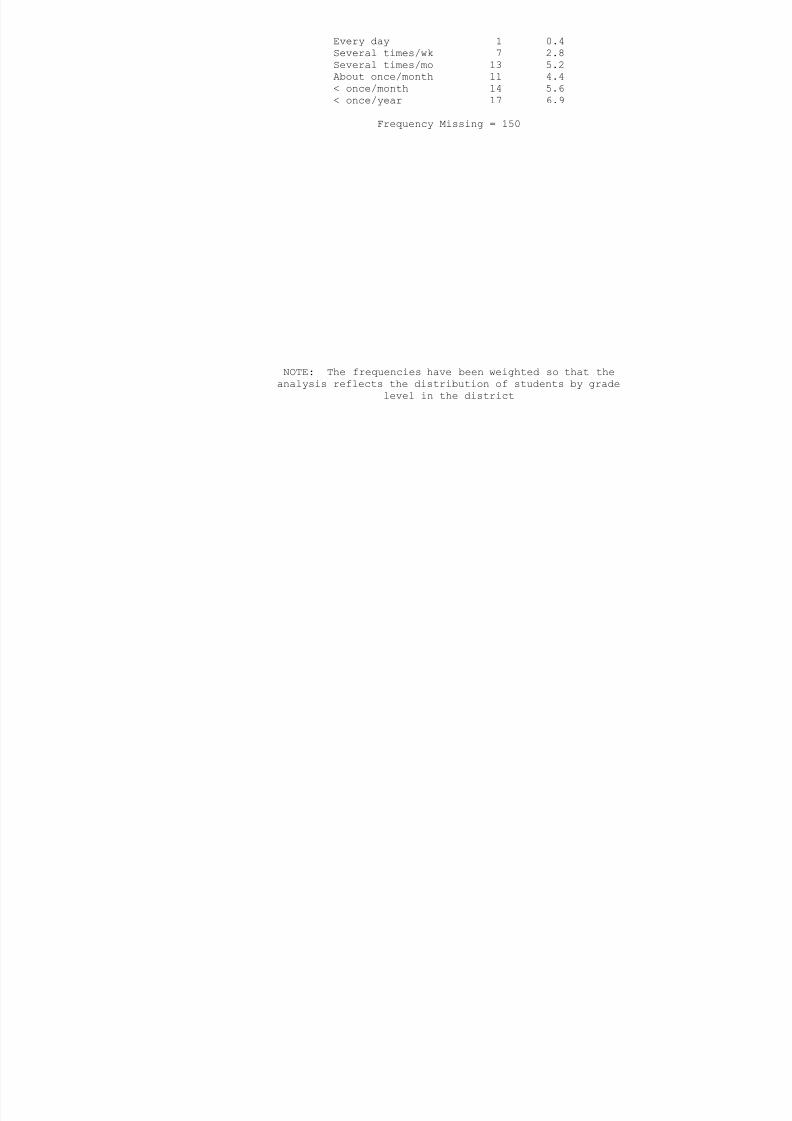
8/6/2019 la joya isd - 9th grade center - 1996 Texas School Survey of Drug and Alcohol Use
http://slidepdf.com/reader/full/la-joya-isd-9th-grade-center-1996-texas-school-survey-of-drug-and-alcohol 149/353
Frequency Missing = 150
NOTE: The frequencies have been weighted so that theanalysis reflects the distribution of students by grade
level in the district
LA JOYA ISD - 9TH GRADE CENTERSPRING 1996
WINE, FIVE OR MORE AT ONE TIME
Q26C Frequency Percent--------------------------------------

8/6/2019 la joya isd - 9th grade center - 1996 Texas School Survey of Drug and Alcohol Use
http://slidepdf.com/reader/full/la-joya-isd-9th-grade-center-1996-texas-school-survey-of-drug-and-alcohol 150/353
Never drink this 150 60.2Never 5+ at time 29 11.6Several times/wk 8 3.2
Several times/mo 14 5.6About once/month 11 4.4< once/month 14 5.6< once/year 23 9.2
Frequency Missing = 149
LIQUOR, FIVE OR MORE AT ONE TIME
Q26D Frequency Percent--------------------------------------Never drink this 161 64.9Never 5+ at time 26 10.5Every day 1 0.4Several times/wk 9 3.6Several times/mo 14 5.6About once/month 9 3.6< once/month 12 4.8< once/year 16 6.5
Frequency Missing = 150
GET ALCOHOLIC BEVERAGES FROM HOME
Q27A Frequency Percent--------------------------------------Do not Drink 203 85.7Never 19 8.0Most of the Time 2 0.8
Always 13 5.5
Frequency Missing = 161

8/6/2019 la joya isd - 9th grade center - 1996 Texas School Survey of Drug and Alcohol Use
http://slidepdf.com/reader/full/la-joya-isd-9th-grade-center-1996-texas-school-survey-of-drug-and-alcohol 151/353
GET ALCOHOLIC BEVERAGES FROM FRIENDS
Q27B Frequency Percent
--------------------------------------Do not Drink 104 34.7Never 87 29.0Seldom 45 15.0Most of the Time 49 16.3Always 15 5.0
Frequency Missing = 98
NOTE: The frequencies have been weighted so that theanalysis reflects the distribution of students by grade
level in the district
LA JOYA ISD - 9TH GRADE CENTERSPRING 1996
GET ALCOHOLIC BEVERAGES FROM A STORE
Q27C Frequency Percent--------------------------------------
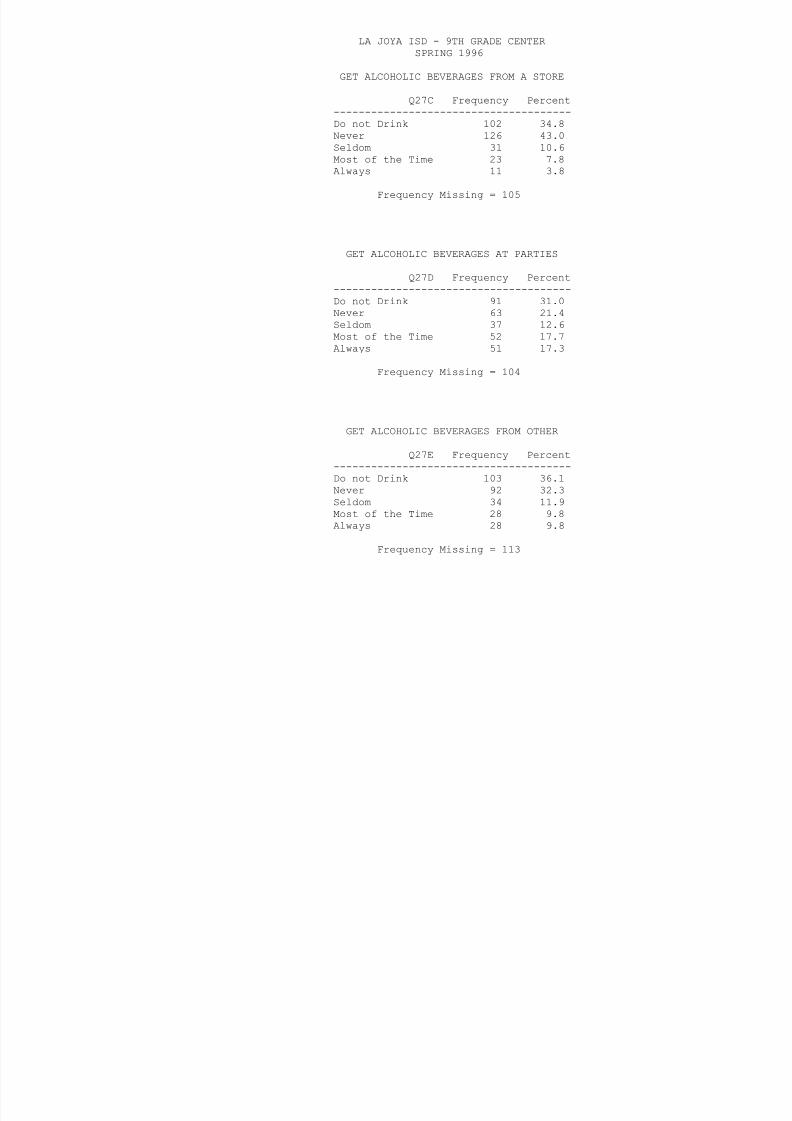
8/6/2019 la joya isd - 9th grade center - 1996 Texas School Survey of Drug and Alcohol Use
http://slidepdf.com/reader/full/la-joya-isd-9th-grade-center-1996-texas-school-survey-of-drug-and-alcohol 152/353
Do not Drink 102 34.8Never 126 43.0Seldom 31 10.6
Most of the Time 23 7.8Always 11 3.8
Frequency Missing = 105
GET ALCOHOLIC BEVERAGES AT PARTIES
Q27D Frequency Percent--------------------------------------
Do not Drink 91 31.0Never 63 21.4Seldom 37 12.6Most of the Time 52 17.7Always 51 17.3
Frequency Missing = 104
GET ALCOHOLIC BEVERAGES FROM OTHER
Q27E Frequency Percent--------------------------------------Do not Drink 103 36.1Never 92 32.3Seldom 34 11.9Most of the Time 28 9.8Always 28 9.8
Frequency Missing = 113
DANGEROUS FOR KIDS TO USE TOBACCO
Q28A Frequency Percent--------------------------------
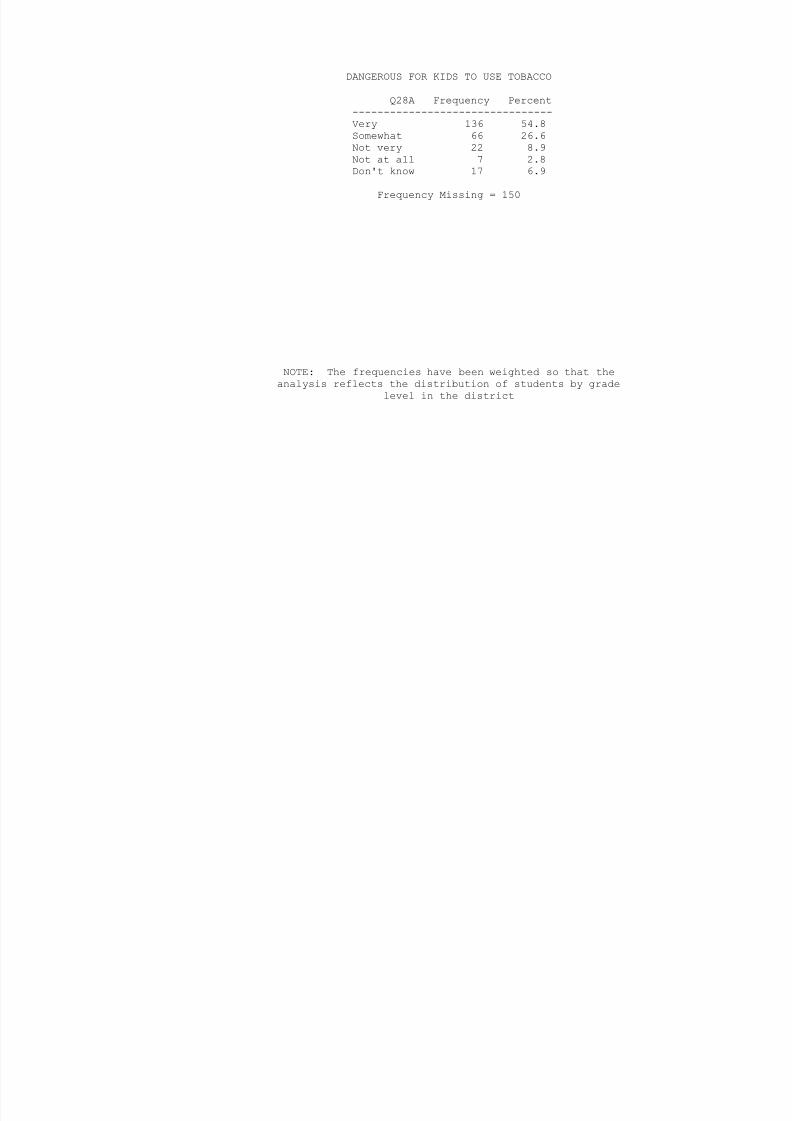
8/6/2019 la joya isd - 9th grade center - 1996 Texas School Survey of Drug and Alcohol Use
http://slidepdf.com/reader/full/la-joya-isd-9th-grade-center-1996-texas-school-survey-of-drug-and-alcohol 153/353
Very 136 54.8Somewhat 66 26.6Not very 22 8.9
Not at all 7 2.8Don't know 17 6.9
Frequency Missing = 150
NOTE: The frequencies have been weighted so that theanalysis reflects the distribution of students by grade
level in the district
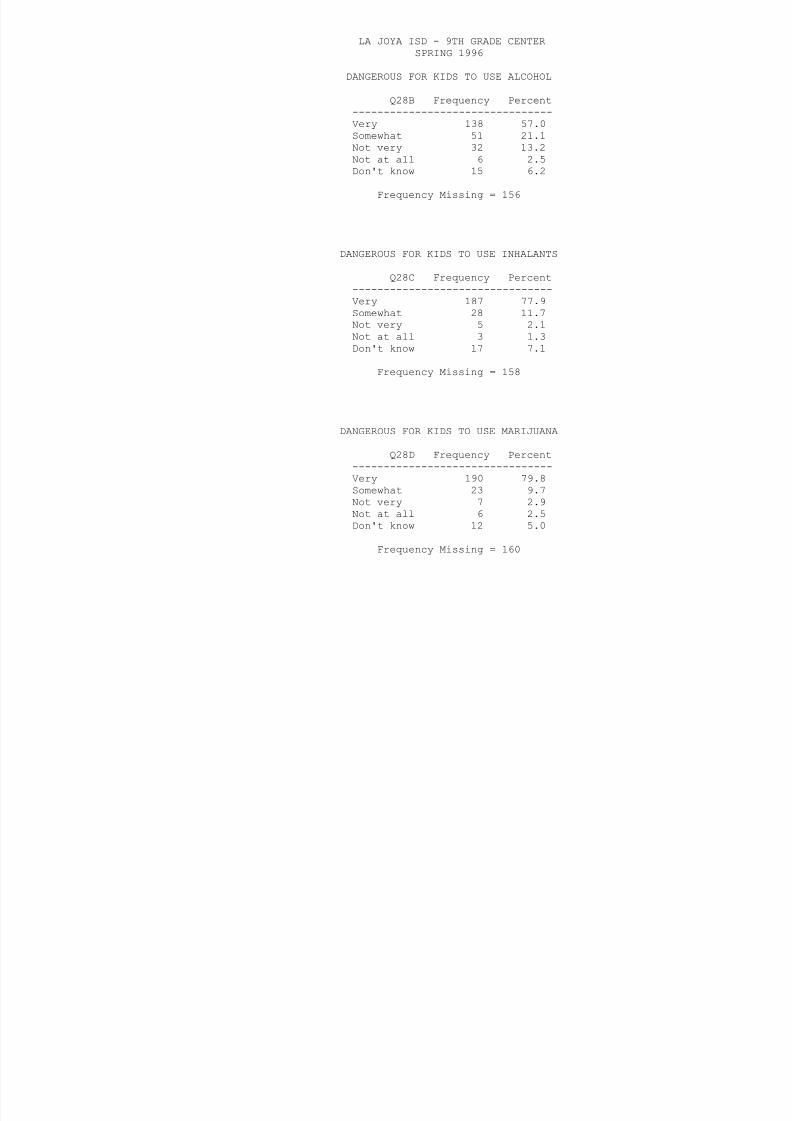
8/6/2019 la joya isd - 9th grade center - 1996 Texas School Survey of Drug and Alcohol Use
http://slidepdf.com/reader/full/la-joya-isd-9th-grade-center-1996-texas-school-survey-of-drug-and-alcohol 154/353
DANGEROUS FOR KIDS TO USE COCAINE
Q28E Frequency Percent--------------------------------

8/6/2019 la joya isd - 9th grade center - 1996 Texas School Survey of Drug and Alcohol Use
http://slidepdf.com/reader/full/la-joya-isd-9th-grade-center-1996-texas-school-survey-of-drug-and-alcohol 155/353
Very 200 84.4Somewhat 21 8.9Not at all 3 1.3
Don't know 13 5.5
Frequency Missing = 161
NOTE: The frequencies have been weighted so that theanalysis reflects the distribution of students by grade
level in the district
LA JOYA ISD - 9TH GRADE CENTERSPRING 1996
DANGEROUS FOR KIDS TO USE CRACK
Q28F Frequency Percent--------------------------------

8/6/2019 la joya isd - 9th grade center - 1996 Texas School Survey of Drug and Alcohol Use
http://slidepdf.com/reader/full/la-joya-isd-9th-grade-center-1996-texas-school-survey-of-drug-and-alcohol 156/353
Very 203 85.7Somewhat 19 8.0Not at all 2 0.8
Don't know 13 5.5
Frequency Missing = 161
DANGEROUS FOR KIDS TO USE ECSTASY
Q28G Frequency Percent--------------------------------Very 176 73.0
Somewhat 26 10.8Not very 2 0.8Not at all 3 1.2Don't know 34 14.1
Frequency Missing = 157
DANGEROUS FOR KIDS TO USE STEROIDS
Q28H Frequency Percent--------------------------------Very 186 76.9Somewhat 30 12.4Not very 4 1.7Not at all 3 1.2Don't know 19 7.9
Frequency Missing = 156

8/6/2019 la joya isd - 9th grade center - 1996 Texas School Survey of Drug and Alcohol Use
http://slidepdf.com/reader/full/la-joya-isd-9th-grade-center-1996-texas-school-survey-of-drug-and-alcohol 157/353

8/6/2019 la joya isd - 9th grade center - 1996 Texas School Survey of Drug and Alcohol Use
http://slidepdf.com/reader/full/la-joya-isd-9th-grade-center-1996-texas-school-survey-of-drug-and-alcohol 158/353

8/6/2019 la joya isd - 9th grade center - 1996 Texas School Survey of Drug and Alcohol Use
http://slidepdf.com/reader/full/la-joya-isd-9th-grade-center-1996-texas-school-survey-of-drug-and-alcohol 159/353
LA JOYA ISD - 9TH GRADE CENTERSPRING 1996
IN TROUBLE FOR DRINKING SINCE SEPTEMBER
Q29F Frequency Percent------------------------------
263 99 6

8/6/2019 la joya isd - 9th grade center - 1996 Texas School Survey of Drug and Alcohol Use
http://slidepdf.com/reader/full/la-joya-isd-9th-grade-center-1996-texas-school-survey-of-drug-and-alcohol 160/353
None 263 99.610+ days 1 0.4
Frequency Missing = 134
IN TROUBLE FOR DRUG USE SINCE SEPTEMBER
Q29G Frequency Percent------------------------------None 258 98.92-3 days 2 0.810+ days 1 0.4
Frequency Missing = 137
DAYS SKIPPED IN PAST MONTH
Q30A Frequency Percent------------------------------None 238 91.51 day 12 4.6
2-3 days 7 2.74-9 days 3 1.2
Frequency Missing = 138
DAYS ILL IN PAST MONTH
Q30B Frequency Percent
------------------------------None 148 58.71 day 52 20.62-3 days 39 15.54-9 days 12 4.810+ days 1 0.4
F Mi i 146

8/6/2019 la joya isd - 9th grade center - 1996 Texas School Survey of Drug and Alcohol Use
http://slidepdf.com/reader/full/la-joya-isd-9th-grade-center-1996-texas-school-survey-of-drug-and-alcohol 161/353
Frequency Missing = 146
OTHER DAYS MISSED IN PAST MONTH
Q30C Frequency Percent------------------------------None 190 74.21 day 39 15.22-3 days 20 7.84-9 days 6 2.310+ days 1 0.4
Frequency Missing = 142
NOTE: The frequencies have been weighted so that theanalysis reflects the distribution of students by grade
level in the district
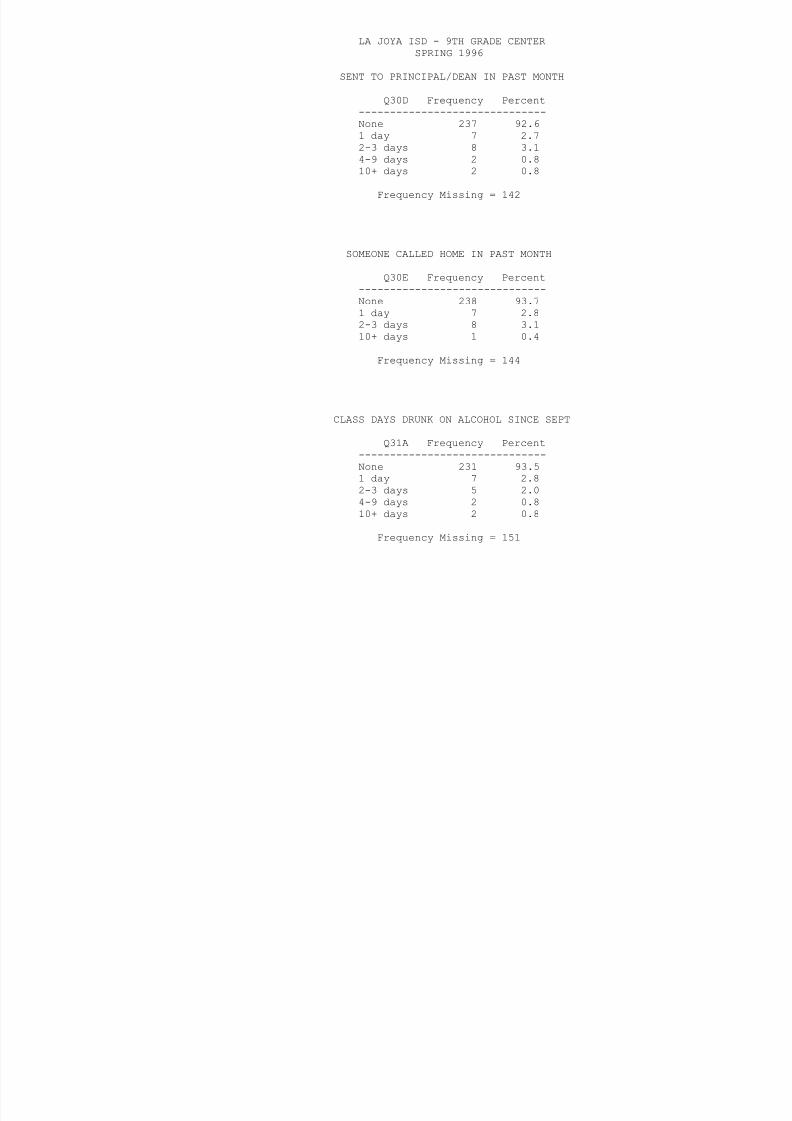
8/6/2019 la joya isd - 9th grade center - 1996 Texas School Survey of Drug and Alcohol Use
http://slidepdf.com/reader/full/la-joya-isd-9th-grade-center-1996-texas-school-survey-of-drug-and-alcohol 162/353

8/6/2019 la joya isd - 9th grade center - 1996 Texas School Survey of Drug and Alcohol Use
http://slidepdf.com/reader/full/la-joya-isd-9th-grade-center-1996-texas-school-survey-of-drug-and-alcohol 163/353
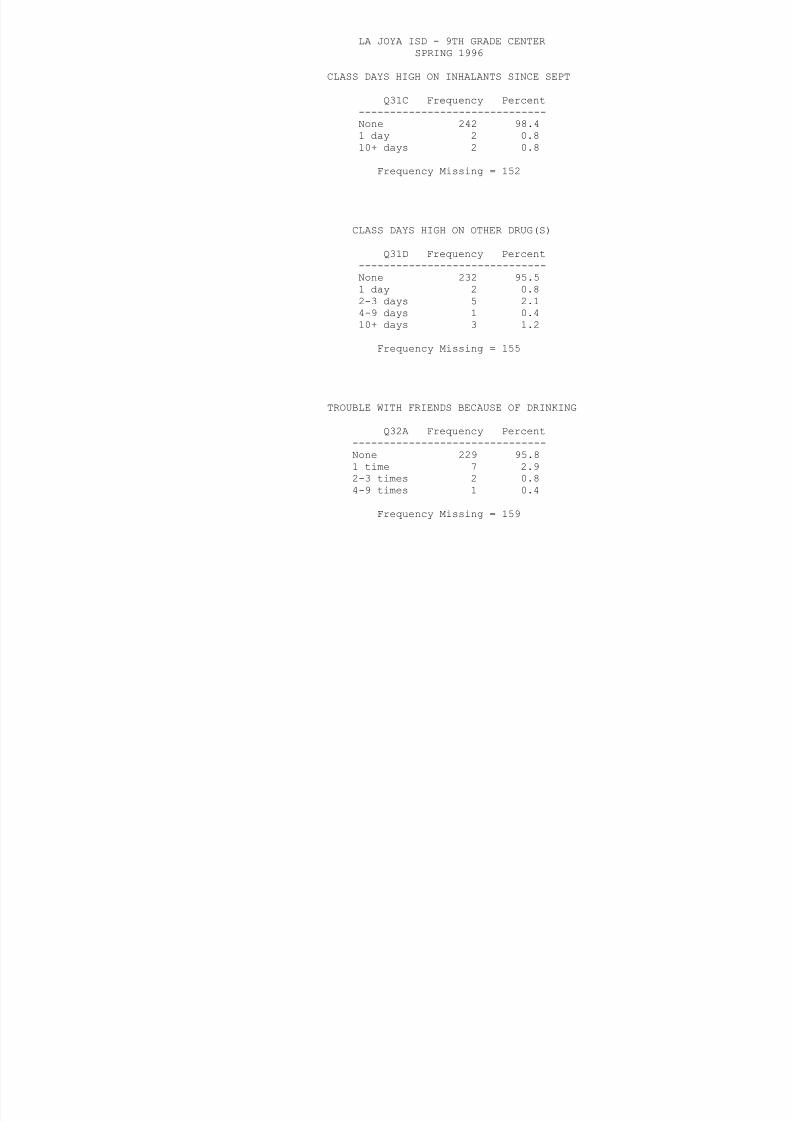
8/6/2019 la joya isd - 9th grade center - 1996 Texas School Survey of Drug and Alcohol Use
http://slidepdf.com/reader/full/la-joya-isd-9th-grade-center-1996-texas-school-survey-of-drug-and-alcohol 164/353
DRIVEN A CAR AFTER A GOOD BIT TO DRINK
Q32B Frequency Percent-------------------------------None 222 96.11 time 5 2.22-3 times 4 1.7
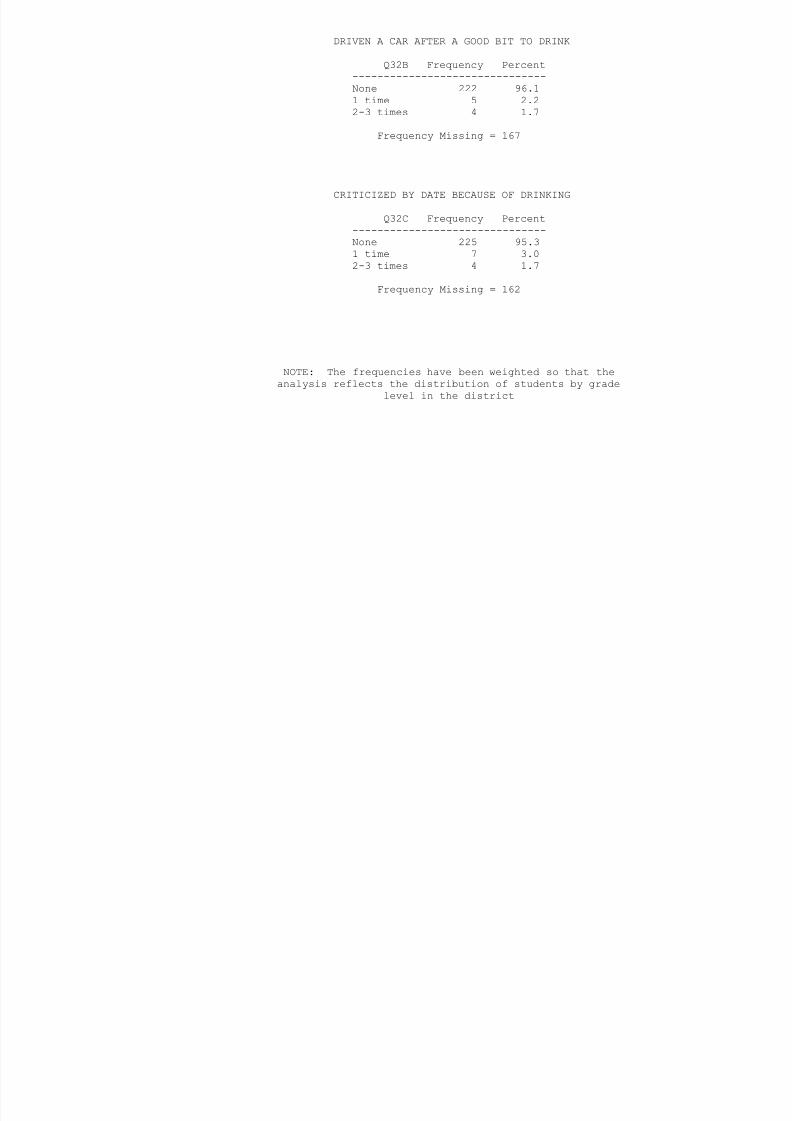
8/6/2019 la joya isd - 9th grade center - 1996 Texas School Survey of Drug and Alcohol Use
http://slidepdf.com/reader/full/la-joya-isd-9th-grade-center-1996-texas-school-survey-of-drug-and-alcohol 165/353
Frequency Missing = 167
CRITICIZED BY DATE BECAUSE OF DRINKING
Q32C Frequency Percent-------------------------------None 225 95.31 time 7 3.02-3 times 4 1.7
Frequency Missing = 162
NOTE: The frequencies have been weighted so that theanalysis reflects the distribution of students by grade
level in the district
LA JOYA ISD - 9TH GRADE CENTERSPRING 1996
TROUBLE WITH POLICE BECAUSE OF DRINKING
Q32D Frequency Percent-------------------------------None 232 99 1
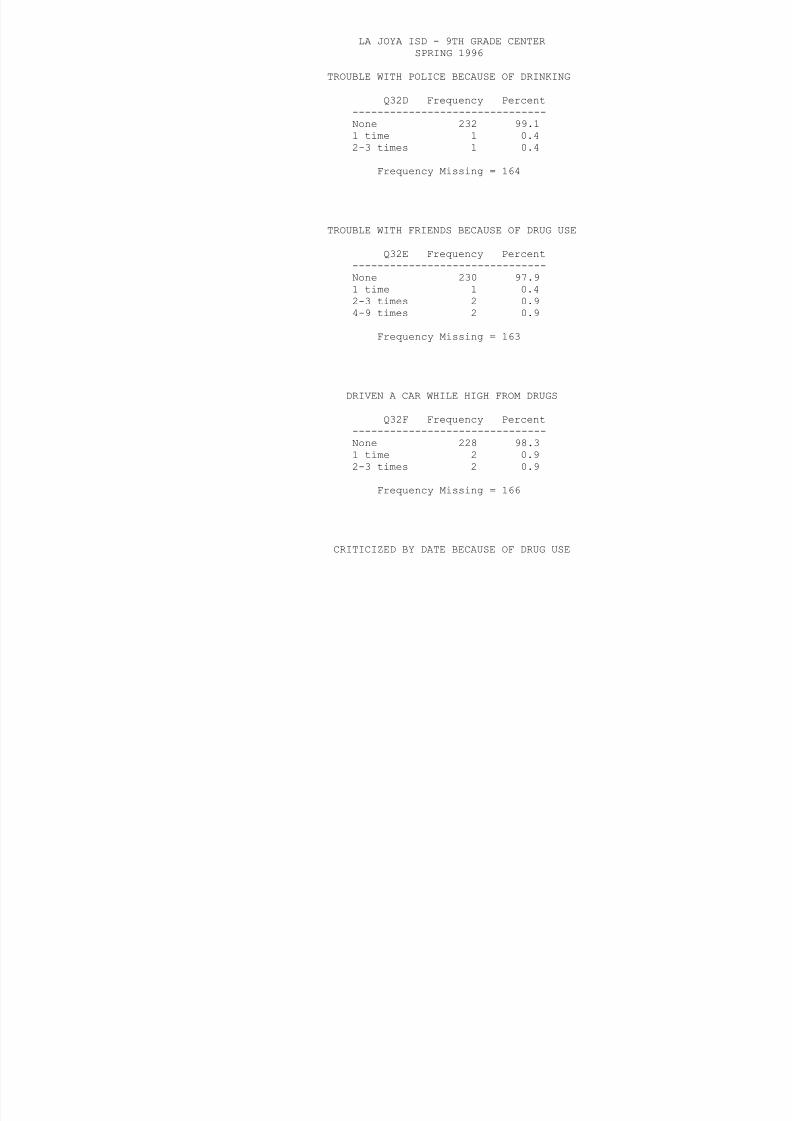
8/6/2019 la joya isd - 9th grade center - 1996 Texas School Survey of Drug and Alcohol Use
http://slidepdf.com/reader/full/la-joya-isd-9th-grade-center-1996-texas-school-survey-of-drug-and-alcohol 166/353
None 232 99.11 time 1 0.42-3 times 1 0.4
Frequency Missing = 164
TROUBLE WITH FRIENDS BECAUSE OF DRUG USE
Q32E Frequency Percent-------------------------------None 230 97.91 time 1 0.4
2-3 times 2 0.94-9 times 2 0.9
Frequency Missing = 163
DRIVEN A CAR WHILE HIGH FROM DRUGS
Q32F Frequency Percent-------------------------------
None 228 98.31 time 2 0.92-3 times 2 0.9
Frequency Missing = 166
CRITICIZED BY DATE BECAUSE OF DRUG USE
Q32G Frequency Percent-------------------------------None 228 97.41 time 4 1.72-3 times 2 0.9
Frequency Missing = 164
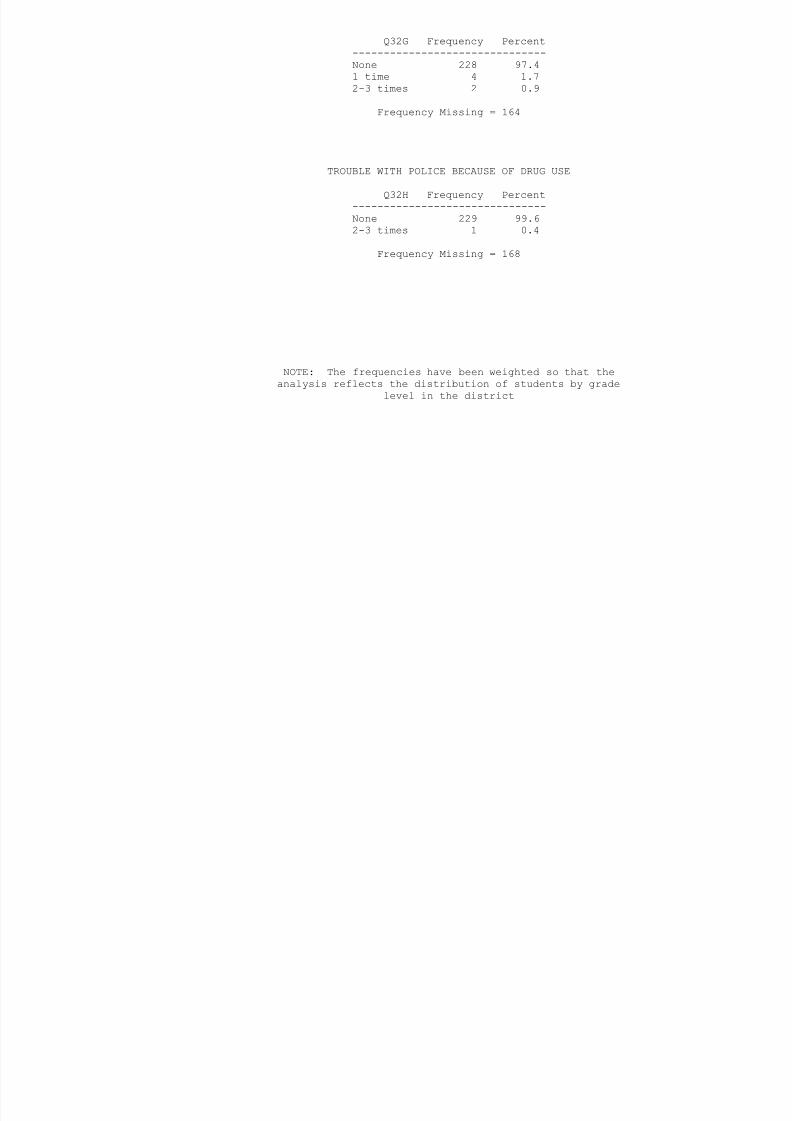
8/6/2019 la joya isd - 9th grade center - 1996 Texas School Survey of Drug and Alcohol Use
http://slidepdf.com/reader/full/la-joya-isd-9th-grade-center-1996-texas-school-survey-of-drug-and-alcohol 167/353
TROUBLE WITH POLICE BECAUSE OF DRUG USE
Q32H Frequency Percent-------------------------------None 229 99.62-3 times 1 0.4
Frequency Missing = 168
NOTE: The frequencies have been weighted so that theanalysis reflects the distribution of students by grade
level in the district
LA JOYA ISD - 9TH GRADE CENTERSPRING 1996
ALCOHOL USE AT PARTIES THIS SCHOOL YEAR
Q33A Frequency Percent--------------------------------------Never 101 42.4

8/6/2019 la joya isd - 9th grade center - 1996 Texas School Survey of Drug and Alcohol Use
http://slidepdf.com/reader/full/la-joya-isd-9th-grade-center-1996-texas-school-survey-of-drug-and-alcohol 168/353
Never 101 42.4Seldom 32 13.4Half the time 31 13.0Most of the time 25 10.5Always 25 10.5Don't know 5 2.1Didn't attend 19 8.0
Frequency Missing = 160
DRUG USE AT PARTIES THIS SCHOOL YEAR
Q33B Frequency Percent--------------------------------------Never 156 66.4Seldom 17 7.2Half the time 16 6.8Most of the time 10 4.3Always 10 4.3Don't know 6 2.6Didn't attend 20 8.5
Frequency Missing = 163
SOUGHT HELP FOR DRUG/ALCOHOL PROBLEM
Q34 Frequency Percent-------------------------Yes 23 11.1No 185 88.9
Frequency Missing = 190
WOULD SEEK HELP FROM SCHOOL COUNSELOR
Q35A Frequency Percent--------------------------

8/6/2019 la joya isd - 9th grade center - 1996 Texas School Survey of Drug and Alcohol Use
http://slidepdf.com/reader/full/la-joya-isd-9th-grade-center-1996-texas-school-survey-of-drug-and-alcohol 169/353
Yes 113 51.4No 107 48.6
Frequency Missing = 178
NOTE: The frequencies have been weighted so that theanalysis reflects the distribution of students by grade
level in the district
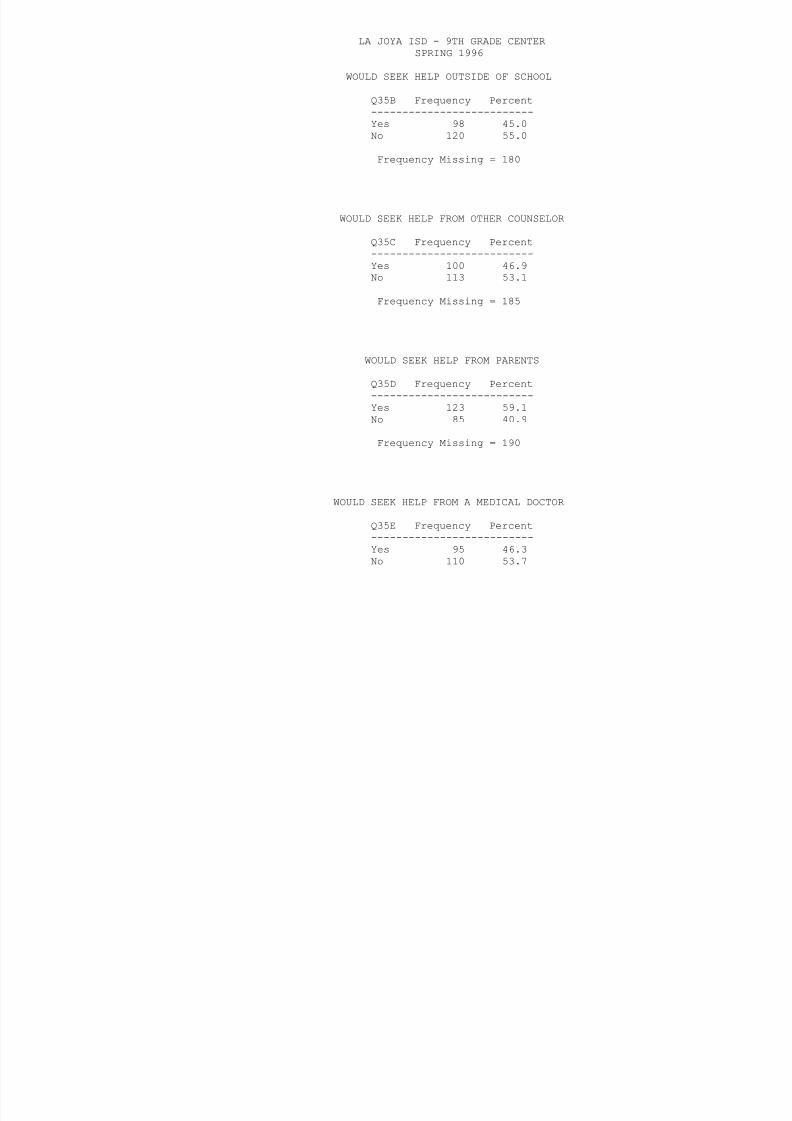
8/6/2019 la joya isd - 9th grade center - 1996 Texas School Survey of Drug and Alcohol Use
http://slidepdf.com/reader/full/la-joya-isd-9th-grade-center-1996-texas-school-survey-of-drug-and-alcohol 170/353

8/6/2019 la joya isd - 9th grade center - 1996 Texas School Survey of Drug and Alcohol Use
http://slidepdf.com/reader/full/la-joya-isd-9th-grade-center-1996-texas-school-survey-of-drug-and-alcohol 171/353

8/6/2019 la joya isd - 9th grade center - 1996 Texas School Survey of Drug and Alcohol Use
http://slidepdf.com/reader/full/la-joya-isd-9th-grade-center-1996-texas-school-survey-of-drug-and-alcohol 172/353
Frequency Missing = 201
DRUG/ALCOHOL INFO--GUIDANCE COUNSELOR

8/6/2019 la joya isd - 9th grade center - 1996 Texas School Survey of Drug and Alcohol Use
http://slidepdf.com/reader/full/la-joya-isd-9th-grade-center-1996-texas-school-survey-of-drug-and-alcohol 173/353
Q36C Frequency Percent--------------------------Yes 82 41.6No 115 58.4
Frequency Missing = 201
NOTE: The frequencies have been weighted so that theanalysis reflects the distribution of students by grade
level in the district
LA JOYA ISD - 9TH GRADE CENTERSPRING 1996
DRUG/ALCOHOL INFO--SCIENCE CLASS
Q36D Frequency Percent--------------------------Yes 97 49.2

8/6/2019 la joya isd - 9th grade center - 1996 Texas School Survey of Drug and Alcohol Use
http://slidepdf.com/reader/full/la-joya-isd-9th-grade-center-1996-texas-school-survey-of-drug-and-alcohol 174/353
No 100 50.8
Frequency Missing = 201
DRUG/ALCOHOL INFO--SOCIAL STUDIES CLASS
Q36E Frequency Percent--------------------------Yes 51 25.8No 147 74.2
Frequency Missing = 200
DRUG/ALCOHOL INFO--DRUG RAP SESSION
Q36F Frequency Percent--------------------------Yes 80 42.1No 110 57.9
Frequency Missing = 208
DRUG/ALCOHOL INFO--INVITED SCHOOL GUEST
Q36G Frequency Percent--------------------------Yes 112 58.0No 81 42.0
Frequency Missing = 205
DRUG/ALCOHOL INFO--OTHER SCHOOL SOURCE
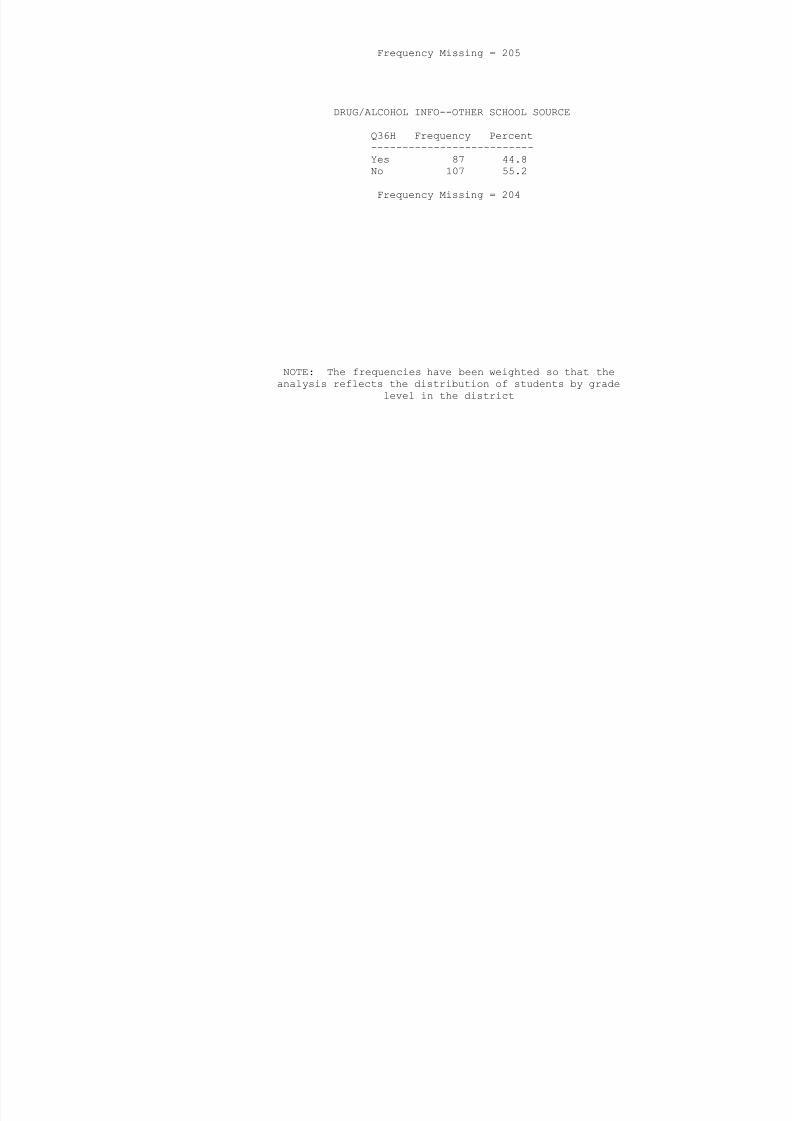
8/6/2019 la joya isd - 9th grade center - 1996 Texas School Survey of Drug and Alcohol Use
http://slidepdf.com/reader/full/la-joya-isd-9th-grade-center-1996-texas-school-survey-of-drug-and-alcohol 175/353
Q36H Frequency Percent--------------------------Yes 87 44.8
No 107 55.2
Frequency Missing = 204
NOTE: The frequencies have been weighted so that theanalysis reflects the distribution of students by grade
level in the district
LA JOYA ISD - 9TH GRADE CENTERSPRING 1996
PARENTS FEEL ABOUT KIDS DRINKING BEER
Q37A Frequency Percent--------------------------------------Strong disappro 154 72.0Mild di 30 14 0

8/6/2019 la joya isd - 9th grade center - 1996 Texas School Survey of Drug and Alcohol Use
http://slidepdf.com/reader/full/la-joya-isd-9th-grade-center-1996-texas-school-survey-of-drug-and-alcohol 176/353
Mild disapprove 30 14.0Neither 9 4.2Mildly approve 2 0.9
Strongly approve 2 0.9Don't know 17 7.9
Frequency Missing = 184
PARENTS FEEL ABOUT KIDS USING MARIJUANA
Q37B Frequency Percent
--------------------------------------Strong disappro 183 86.7Mild disapprove 8 3.8Neither 3 1.4Mildly approve 1 0.5Strongly approve 1 0.5Don't know 15 7.1
Frequency Missing = 187
8/6/2019 la joya isd - 9th grade center - 1996 Texas School Survey of Drug and Alcohol Use
http://slidepdf.com/reader/full/la-joya-isd-9th-grade-center-1996-texas-school-survey-of-drug-and-alcohol 177/353
NOTE: The frequencies have been weighted so that theanalysis reflects the distribution of students by grade
level in the district
LA JOYA ISD - 9TH GRADE CENTERSPRING 1996
TABLE B1: PREVALENCE AND RECENCY OF USE OF SELECTED SUBSTANCES--> ALL STUDENTS
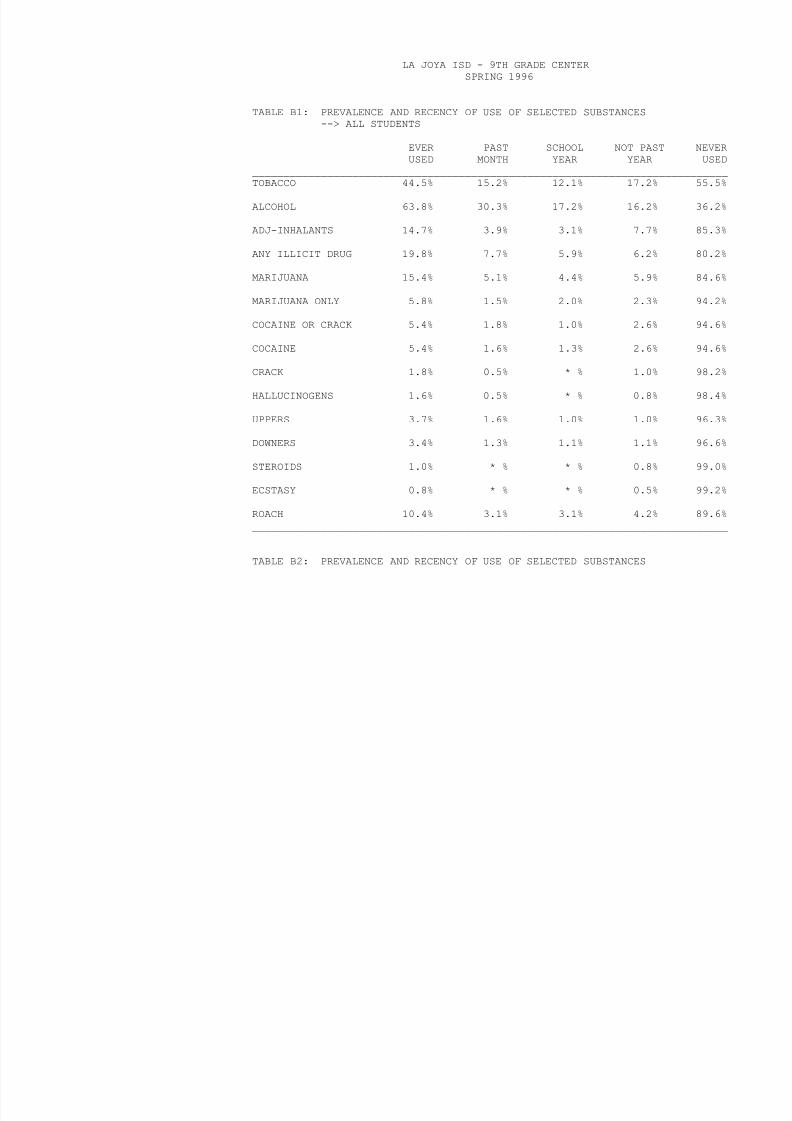
8/6/2019 la joya isd - 9th grade center - 1996 Texas School Survey of Drug and Alcohol Use
http://slidepdf.com/reader/full/la-joya-isd-9th-grade-center-1996-texas-school-survey-of-drug-and-alcohol 178/353
EVER PAST SCHOOL NOT PAST NEVERUSED MONTH YEAR YEAR USED
____________________________________________________________________________TOBACCO 44.5% 15.2% 12.1% 17.2% 55.5%
ALCOHOL 63.8% 30.3% 17.2% 16.2% 36.2%
ADJ-INHALANTS 14.7% 3.9% 3.1% 7.7% 85.3%
ANY ILLICIT DRUG 19.8% 7.7% 5.9% 6.2% 80.2%
MARIJUANA 15.4% 5.1% 4.4% 5.9% 84.6%
MARIJUANA ONLY 5.8% 1.5% 2.0% 2.3% 94.2% COCAINE OR CRACK 5.4% 1.8% 1.0% 2.6% 94.6%
COCAINE 5.4% 1.6% 1.3% 2.6% 94.6%
CRACK 1.8% 0.5% * % 1.0% 98.2%
HALLUCINOGENS 1.6% 0.5% * % 0.8% 98.4%
UPPERS 3.7% 1.6% 1.0% 1.0% 96.3%
DOWNERS 3.4% 1.3% 1.1% 1.1% 96.6%
STEROIDS 1.0% * % * % 0.8% 99.0%
ECSTASY 0.8% * % * % 0.5% 99.2%
ROACH 10.4% 3.1% 3.1% 4.2% 89.6%____________________________________________________________________________
TABLE B2: PREVALENCE AND RECENCY OF USE OF SELECTED SUBSTANCES
--> MALE STUDENTS
EVER PAST SCHOOL NOT PAST NEVERUSED MONTH YEAR YEAR USED
____________________________________________________________________________TOBACCO 56.0% 22.3% 13.7% 20.0% 44.0%
ALCOHOL 72.4% 35.6% 19.0% 17.8% 27.6%

8/6/2019 la joya isd - 9th grade center - 1996 Texas School Survey of Drug and Alcohol Use
http://slidepdf.com/reader/full/la-joya-isd-9th-grade-center-1996-texas-school-survey-of-drug-and-alcohol 179/353
ADJ-INHALANTS 14.3% 2.3% 2.9% 9.1% 85.7%
ANY ILLICIT DRUG 26.3% 9.7% 9.1% 7.4% 73.7%
MARIJUANA 22.9% 7.4% 7.4% 8.0% 77.1%
MARIJUANA ONLY 7.2% 1.1% 2.8% 3.3% 92.8%
COCAINE OR CRACK 9.8% 4.0% 1.7% 4.0% 90.2%
COCAINE 9.8% 3.5% 2.3% 4.0% 90.2%
CRACK 3.5% 1.2% 0.6% 1.8% 96.5%
HALLUCINOGENS 2.9% 1.2% * % 1.8% 97.1%
UPPERS 5.4% 1.2% 1.8% 2.4% 94.6%
DOWNERS 5.4% 1.2% 1.8% 2.4% 94.6%
STEROIDS 1.8% * % * % 1.8% 98.2%
ECSTASY 1.2% * % * % 1.2% 98.8%
ROACH 12.9% 3.5% 4.7% 4.7% 87.1%
____________________________________________________________________________
LA JOYA ISD - 9TH GRADE CENTERSPRING 1996
TABLE B3: PREVALENCE AND RECENCY OF USE OF SELECTED SUBSTANCES--> FEMALE STUDENTS
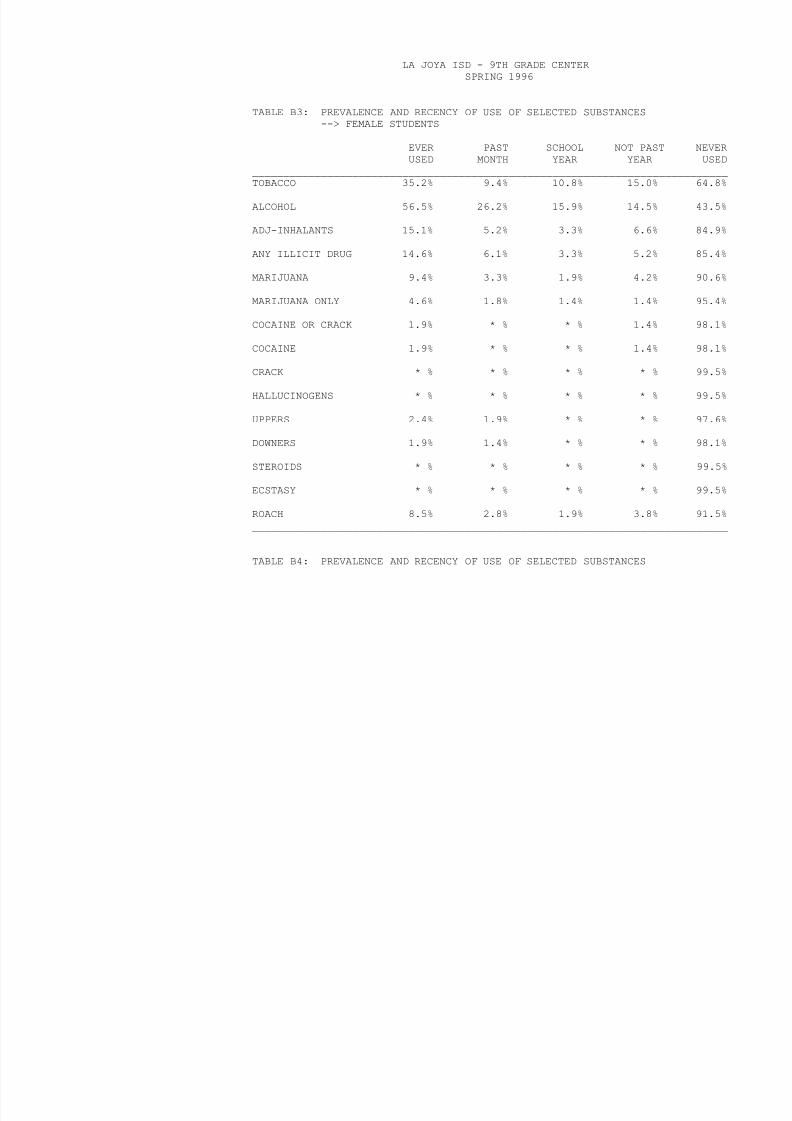
8/6/2019 la joya isd - 9th grade center - 1996 Texas School Survey of Drug and Alcohol Use
http://slidepdf.com/reader/full/la-joya-isd-9th-grade-center-1996-texas-school-survey-of-drug-and-alcohol 180/353
EVER PAST SCHOOL NOT PAST NEVERUSED MONTH YEAR YEAR USED
____________________________________________________________________________TOBACCO 35.2% 9.4% 10.8% 15.0% 64.8%
ALCOHOL 56.5% 26.2% 15.9% 14.5% 43.5%
ADJ-INHALANTS 15.1% 5.2% 3.3% 6.6% 84.9%
ANY ILLICIT DRUG 14.6% 6.1% 3.3% 5.2% 85.4%
MARIJUANA 9.4% 3.3% 1.9% 4.2% 90.6%
MARIJUANA ONLY 4.6% 1.8% 1.4% 1.4% 95.4% COCAINE OR CRACK 1.9% * % * % 1.4% 98.1%
COCAINE 1.9% * % * % 1.4% 98.1%
CRACK * % * % * % * % 99.5%
HALLUCINOGENS * % * % * % * % 99.5%
UPPERS 2.4% 1.9% * % * % 97.6%
DOWNERS 1.9% 1.4% * % * % 98.1%
STEROIDS * % * % * % * % 99.5%
ECSTASY * % * % * % * % 99.5%
ROACH 8.5% 2.8% 1.9% 3.8% 91.5%____________________________________________________________________________
TABLE B4: PREVALENCE AND RECENCY OF USE OF SELECTED SUBSTANCES
--> WHITE STUDENTS
EVER PAST SCHOOL NOT PAST NEVERUSED MONTH YEAR YEAR USED
____________________________________________________________________________TOBACCO * % * % * % * % * %
ALCOHOL * % * % * % * % * %

8/6/2019 la joya isd - 9th grade center - 1996 Texas School Survey of Drug and Alcohol Use
http://slidepdf.com/reader/full/la-joya-isd-9th-grade-center-1996-texas-school-survey-of-drug-and-alcohol 181/353
ADJ-INHALANTS * % * % * % * % * %
ANY ILLICIT DRUG * % * % * % * % * %
MARIJUANA * % * % * % * % * %
MARIJUANA ONLY * % * % * % * % * %
COCAINE OR CRACK * % * % * % * % * %
COCAINE * % * % * % * % * %
CRACK * % * % * % * % * %
HALLUCINOGENS * % * % * % * % * %
UPPERS * % * % * % * % * %
DOWNERS * % * % * % * % * %
STEROIDS * % * % * % * % * %
ECSTASY * % * % * % * % * %
ROACH * % * % * % * % * %
____________________________________________________________________________
LA JOYA ISD - 9TH GRADE CENTERSPRING 1996
TABLE B5: PREVALENCE AND RECENCY OF USE OF SELECTED SUBSTANCES--> AFRICAN/AMERICAN STUDENTS

8/6/2019 la joya isd - 9th grade center - 1996 Texas School Survey of Drug and Alcohol Use
http://slidepdf.com/reader/full/la-joya-isd-9th-grade-center-1996-texas-school-survey-of-drug-and-alcohol 182/353
EVER PAST SCHOOL NOT PAST NEVERUSED MONTH YEAR YEAR USED
____________________________________________________________________________TOBACCO * % * % * % * % * %
ALCOHOL * % * % * % * % * %
ADJ-INHALANTS * % * % * % * % * %
ANY ILLICIT DRUG * % * % * % * % * %
MARIJUANA * % * % * % * % * %
MARIJUANA ONLY * % * % * % * % * %
COCAINE OR CRACK * % * % * % * % * %
COCAINE * % * % * % * % * %
CRACK * % * % * % * % * %
HALLUCINOGENS * % * % * % * % * %
UPPERS * % * % * % * % * %
DOWNERS * % * % * % * % * %
STEROIDS * % * % * % * % * %
ECSTASY * % * % * % * % * %
ROACH * % * % * % * % * %____________________________________________________________________________
TABLE B6: PREVALENCE AND RECENCY OF USE OF SELECTED SUBSTANCES
--> MEXICAN/AMERICAN STUDENTS
EVER PAST SCHOOL NOT PAST NEVERUSED MONTH YEAR YEAR USED
____________________________________________________________________________TOBACCO 43.7% 14.8% 12.1% 16.7% 56.3%
ALCOHOL 62.6% 30.1% 16.7% 15.9% 37.4%

8/6/2019 la joya isd - 9th grade center - 1996 Texas School Survey of Drug and Alcohol Use
http://slidepdf.com/reader/full/la-joya-isd-9th-grade-center-1996-texas-school-survey-of-drug-and-alcohol 183/353
ADJ-INHALANTS 13.8% 3.8% 3.2% 6.8% 86.2%
ANY ILLICIT DRUG 19.4% 7.8% 5.7% 5.9% 80.6%
MARIJUANA 14.8% 5.1% 4.0% 5.7% 85.2%
MARIJUANA ONLY 5.8% 1.6% 1.8% 2.4% 94.2%
COCAINE OR CRACK 5.4% 1.9% 1.1% 2.4% 94.6%
COCAINE 5.4% 1.6% 1.4% 2.4% 94.6%
CRACK 1.6% 0.5% * % 0.8% 98.4%
HALLUCINOGENS 0.8% * % * % * % 99.2%
UPPERS 3.3% 1.4% 1.1% 0.8% 96.7%
DOWNERS 2.7% 1.1% 1.1% 0.5% 97.3%
STEROIDS 0.5% * % * % * % 99.5%
ECSTASY 0.5% * % * % * % 99.5%
ROACH 9.8% 3.0% 3.0% 3.8% 90.2%
____________________________________________________________________________

8/6/2019 la joya isd - 9th grade center - 1996 Texas School Survey of Drug and Alcohol Use
http://slidepdf.com/reader/full/la-joya-isd-9th-grade-center-1996-texas-school-survey-of-drug-and-alcohol 184/353

8/6/2019 la joya isd - 9th grade center - 1996 Texas School Survey of Drug and Alcohol Use
http://slidepdf.com/reader/full/la-joya-isd-9th-grade-center-1996-texas-school-survey-of-drug-and-alcohol 185/353
LA JOYA ISD - 9TH GRADE CENTERSPRING 1996
TABLE B9: PREVALENCE AND RECENCY OF USE OF SELECTED SUBSTANCES--> STUDENTS LIVING WITH TWO PARENTS
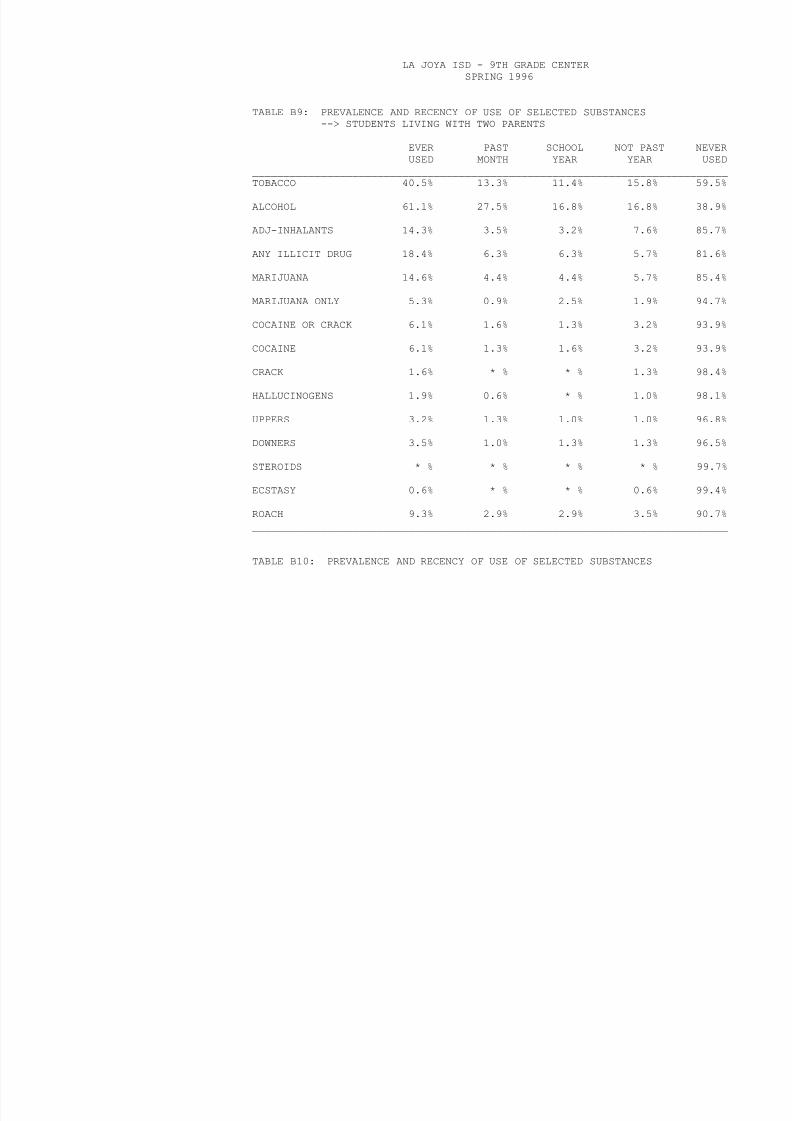
8/6/2019 la joya isd - 9th grade center - 1996 Texas School Survey of Drug and Alcohol Use
http://slidepdf.com/reader/full/la-joya-isd-9th-grade-center-1996-texas-school-survey-of-drug-and-alcohol 186/353
EVER PAST SCHOOL NOT PAST NEVERUSED MONTH YEAR YEAR USED
____________________________________________________________________________TOBACCO 40.5% 13.3% 11.4% 15.8% 59.5%
ALCOHOL 61.1% 27.5% 16.8% 16.8% 38.9%
ADJ-INHALANTS 14.3% 3.5% 3.2% 7.6% 85.7%
ANY ILLICIT DRUG 18.4% 6.3% 6.3% 5.7% 81.6%
MARIJUANA 14.6% 4.4% 4.4% 5.7% 85.4%
MARIJUANA ONLY 5.3% 0.9% 2.5% 1.9% 94.7%
COCAINE OR CRACK 6.1% 1.6% 1.3% 3.2% 93.9%
COCAINE 6.1% 1.3% 1.6% 3.2% 93.9%
CRACK 1.6% * % * % 1.3% 98.4%
HALLUCINOGENS 1.9% 0.6% * % 1.0% 98.1%
UPPERS 3.2% 1.3% 1.0% 1.0% 96.8%
DOWNERS 3.5% 1.0% 1.3% 1.3% 96.5% STEROIDS * % * % * % * % 99.7%
ECSTASY 0.6% * % * % 0.6% 99.4%
ROACH 9.3% 2.9% 2.9% 3.5% 90.7%____________________________________________________________________________
TABLE B10: PREVALENCE AND RECENCY OF USE OF SELECTED SUBSTANCES
--> STUDENTS NOT LIVING WITH TWO PARENTS
EVER PAST SCHOOL NOT PAST NEVERUSED MONTH YEAR YEAR USED
____________________________________________________________________________TOBACCO 62.0% 23.9% 15.5% 22.5% 38.0%
ALCOHOL 74.6% 42.3% 18.3% 14.1% 25.4%

8/6/2019 la joya isd - 9th grade center - 1996 Texas School Survey of Drug and Alcohol Use
http://slidepdf.com/reader/full/la-joya-isd-9th-grade-center-1996-texas-school-survey-of-drug-and-alcohol 187/353
ADJ-INHALANTS 16.9% 5.6% 2.8% 8.5% 83.1%
ANY ILLICIT DRUG 26.8% 14.1% 4.2% 8.5% 73.2%
MARIJUANA 19.7% 8.5% 4.2% 7.0% 80.3%
MARIJUANA ONLY 8.0% 4.0% * % 4.0% 92.0%
COCAINE OR CRACK 2.8% 2.8% * % * % 97.2%
COCAINE 2.8% 2.8% * % * % 97.2%
CRACK 2.9% 1.4% 1.4% * % 97.1%
HALLUCINOGENS * % * % * % * % 100%
UPPERS 5.7% 2.9% 1.4% 1.4% 94.3%
DOWNERS 2.9% 2.9% * % * % 97.1%
STEROIDS 4.2% * % 1.4% 2.8% 95.8%
ECSTASY 1.4% 1.4% * % * % 98.6%
ROACH 15.9% 4.3% 4.3% 7.2% 84.1%
____________________________________________________________________________
LA JOYA ISD - 9TH GRADE CENTERSPRING 1996
TABLE B11: PREVALENCE AND RECENCY OF USE OF SELECTED SUBSTANCES--> STUDENTS WHO WOULD SEEK HELP FROM ADULTS FOR SUBSTANCE ABUSE
PROBLEMS
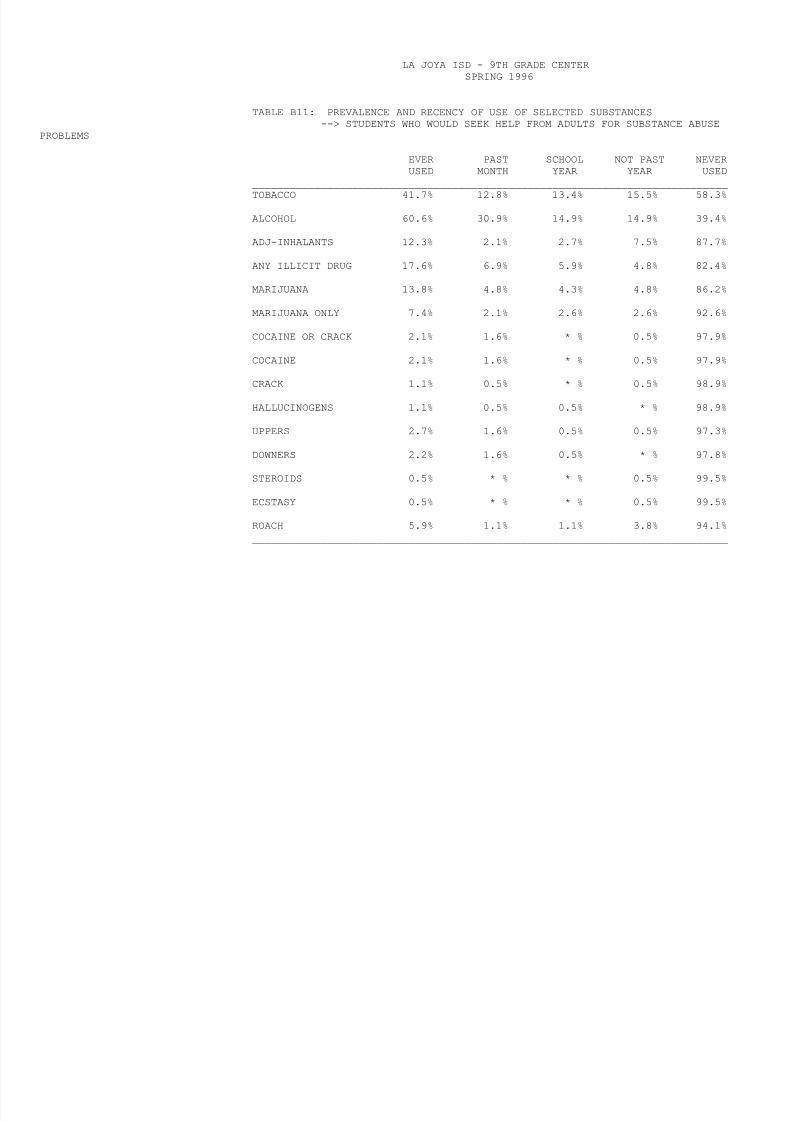
8/6/2019 la joya isd - 9th grade center - 1996 Texas School Survey of Drug and Alcohol Use
http://slidepdf.com/reader/full/la-joya-isd-9th-grade-center-1996-texas-school-survey-of-drug-and-alcohol 188/353
EVER PAST SCHOOL NOT PAST NEVER
USED MONTH YEAR YEAR USED____________________________________________________________________________TOBACCO 41.7% 12.8% 13.4% 15.5% 58.3%
ALCOHOL 60.6% 30.9% 14.9% 14.9% 39.4%
ADJ-INHALANTS 12.3% 2.1% 2.7% 7.5% 87.7%
ANY ILLICIT DRUG 17.6% 6.9% 5.9% 4.8% 82.4%
MARIJUANA 13.8% 4.8% 4.3% 4.8% 86.2%
MARIJUANA ONLY 7.4% 2.1% 2.6% 2.6% 92.6%
COCAINE OR CRACK 2.1% 1.6% * % 0.5% 97.9%
COCAINE 2.1% 1.6% * % 0.5% 97.9%
CRACK 1.1% 0.5% * % 0.5% 98.9%
HALLUCINOGENS 1.1% 0.5% 0.5% * % 98.9%
UPPERS 2.7% 1.6% 0.5% 0.5% 97.3%
DOWNERS 2.2% 1.6% 0.5% * % 97.8%
STEROIDS 0.5% * % * % 0.5% 99.5%
ECSTASY 0.5% * % * % 0.5% 99.5%
ROACH 5.9% 1.1% 1.1% 3.8% 94.1%____________________________________________________________________________

8/6/2019 la joya isd - 9th grade center - 1996 Texas School Survey of Drug and Alcohol Use
http://slidepdf.com/reader/full/la-joya-isd-9th-grade-center-1996-texas-school-survey-of-drug-and-alcohol 189/353
LA JOYA ISD - 9TH GRADE CENTERSPRING 1996
TABLE B13: PREVALENCE AND RECENCY OF USE OF SELECTED SUBSTANCES--> STUDENTS WHO LIVED IN THIS TOWN FOR 3 YEARS OR LESS

8/6/2019 la joya isd - 9th grade center - 1996 Texas School Survey of Drug and Alcohol Use
http://slidepdf.com/reader/full/la-joya-isd-9th-grade-center-1996-texas-school-survey-of-drug-and-alcohol 190/353
EVER PAST SCHOOL NOT PAST NEVERUSED MONTH YEAR YEAR USED
____________________________________________________________________________TOBACCO 40.4% 15.4% 11.5% 13.5% 59.6%
ALCOHOL 58.7% 34.6% 13.5% 10.6% 41.3%
ADJ-INHALANTS 16.3% 1.9% 2.9% 11.5% 83.7%
ANY ILLICIT DRUG 21.2% 7.7% 7.7% 5.8% 78.8%
MARIJUANA 17.3% 5.8% 3.8% 7.7% 82.7%
MARIJUANA ONLY 4.8% 1.9% 1.9% 1.0% 95.2%
COCAINE OR CRACK 5.8% 1.9% 1.0% 2.9% 94.2%
COCAINE 5.8% 1.9% 1.0% 2.9% 94.2%
CRACK 2.9% * % * % 2.9% 97.1%
HALLUCINOGENS 2.0% * % 1.0% 1.0% 98.0%
UPPERS 4.0% 1.0% 1.0% 2.0% 96.0%
DOWNERS 1.0% * % * % 1.0% 99.0% STEROIDS 2.9% * % * % 2.9% 97.1%
ECSTASY 2.0% * % * % 2.0% 98.0%
ROACH 10.7% 1.0% 3.9% 5.8% 89.3%____________________________________________________________________________
TABLE B14: PREVALENCE AND RECENCY OF USE OF SELECTED SUBSTANCES
--> STUDENTS WHO LIVED IN TOWN 4 OR MORE YEARS
EVER PAST SCHOOL NOT PAST NEVERUSED MONTH YEAR YEAR USED
____________________________________________________________________________TOBACCO 45.5% 14.7% 12.2% 18.6% 54.5%
ALCOHOL 65.7% 28.9% 18.6% 18.2% 34.3%
14 0% 4 3% 3 2% 6 5% 86 0%

8/6/2019 la joya isd - 9th grade center - 1996 Texas School Survey of Drug and Alcohol Use
http://slidepdf.com/reader/full/la-joya-isd-9th-grade-center-1996-texas-school-survey-of-drug-and-alcohol 191/353
ADJ-INHALANTS 14.0% 4.3% 3.2% 6.5% 86.0%
ANY ILLICIT DRUG 19.4% 7.9% 5.4% 6.1% 80.6%
MARIJUANA 15.1% 5.0% 4.7% 5.4% 84.9%
MARIJUANA ONLY 6.3% 1.4% 2.1% 2.8% 93.7%
COCAINE OR CRACK 5.4% 1.8% 1.1% 2.5% 94.6%
COCAINE 5.4% 1.4% 1.4% 2.5% 94.6%
CRACK 1.4% 0.7% * % * % 98.6%
HALLUCINOGENS 1.4% 0.7% * % 0.7% 98.6%
UPPERS 3.6% 1.8% 1.1% 0.7% 96.4%
DOWNERS 4.4% 1.8% 1.5% 1.1% 95.6%
STEROIDS * % * % * % * % 99.6%
ECSTASY * % * % * % * % 99.6%
ROACH 10.2% 4.0% 2.9% 3.3% 89.8%
____________________________________________________________________________
LA JOYA ISD - 9TH GRADE CENTERSPRING 1996
TABLE 1: ABOUT HOW MANY TIMES (IF ANY) HAVE YOU EVER SNIFFED, HUFFED, OR INHALED THEFOLLOWING INHALANTS FOR "KICKS" OR TO GET "HIGH"?
1A LIQUID OR SPRAY PAINT

8/6/2019 la joya isd - 9th grade center - 1996 Texas School Survey of Drug and Alcohol Use
http://slidepdf.com/reader/full/la-joya-isd-9th-grade-center-1996-texas-school-survey-of-drug-and-alcohol 192/353
1A. LIQUID OR SPRAY PAINT
NEVER EVER 1-2 TIMES 3-19 TIMES 20+ TIMES
ALL 94.0% 6.0% 4.4% 1.3% * %
1B. CORRECTION FLUID, LIQUID PAPER
NEVER EVER 1-2 TIMES 3-19 TIMES 20+ TIMES
ALL 90.0% 10.0% 7.6% 1.8% 0.5%
1C. GASOLINE
NEVER EVER 1-2 TIMES 3-19 TIMES 20+ TIMES
ALL 96.3% 3.7% 3.4% * % * %
1D. FREON
NEVER EVER 1-2 TIMES 3-19 TIMES 20+ TIMES
ALL 98.9% 1.1% 0.8% * % * %
1E. POPPERS, LOCKER ROOM, RUSH, MEDUSA, WHIPPETS, CO2
NEVER EVER 1-2 TIMES 3-19 TIMES 20+ TIMES
ALL 98.1% 1.9% 1.9% * % * %
1F. SHOE SHINE, TEXAS SHINE
NEVER EVER 1-2 TIMES 3-19 TIMES 20+ TIMES
ALL 98.4% 1.6% 1.3% * % * %
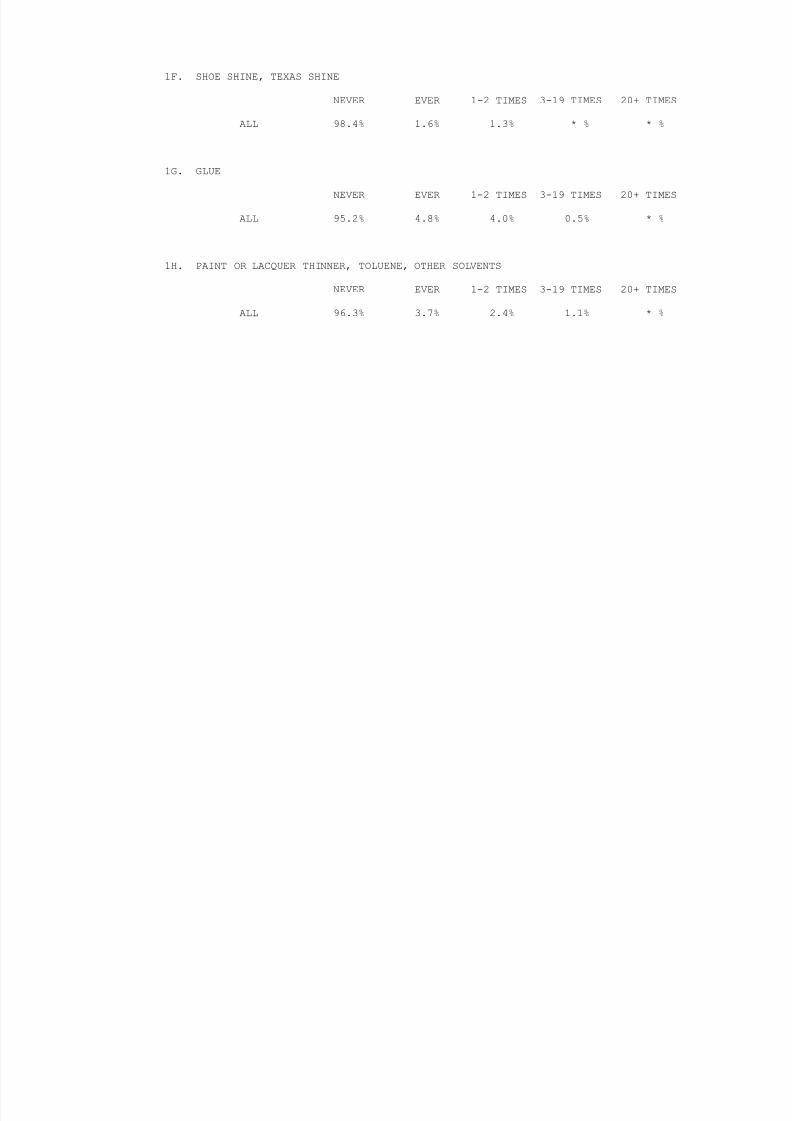
8/6/2019 la joya isd - 9th grade center - 1996 Texas School Survey of Drug and Alcohol Use
http://slidepdf.com/reader/full/la-joya-isd-9th-grade-center-1996-texas-school-survey-of-drug-and-alcohol 193/353
1G. GLUE
NEVER EVER 1-2 TIMES 3-19 TIMES 20+ TIMES
ALL 95.2% 4.8% 4.0% 0.5% * %
1H. PAINT OR LACQUER THINNER, TOLUENE, OTHER SOLVENTS
NEVER EVER 1-2 TIMES 3-19 TIMES 20+ TIMES
ALL 96.3% 3.7% 2.4% 1.1% * %
LA JOYA ISD - 9TH GRADE CENTERSPRING 1996
1I. OCTANE BOOSTER
NEVER EVER 1-2 TIMES 3-19 TIMES 20+ TIMES

8/6/2019 la joya isd - 9th grade center - 1996 Texas School Survey of Drug and Alcohol Use
http://slidepdf.com/reader/full/la-joya-isd-9th-grade-center-1996-texas-school-survey-of-drug-and-alcohol 194/353
ALL 99.5% 0.5% * % 0.5% * %
1J. OTHER SPRAYS (PAM, HAIR SPRAY, ETC.)
NEVER EVER 1-2 TIMES 3-19 TIMES 20+ TIMES
ALL 96.7% 3.3% 2.2% 0.8% * %
1K. OTHER INHALANTS
NEVER EVER 1-2 TIMES 3-19 TIMES 20+ TIMES
ALL 94.5% 5.5% 3.3% 1.6% 0.5%
TABLE 2: NUMBER OF DIFFERENT KINDS OF INHALANTS USED:
0 1 2-3 4+
ALL 85.7% 5.8% 5.0% 3.5%
TABLE 3: EXPERIMENTAL USE OF ANY ILLICIT DRUG(S):
NONE 1-2 TIMES 3+ TIMES
ALL 80.9% 7.8% 11.3%
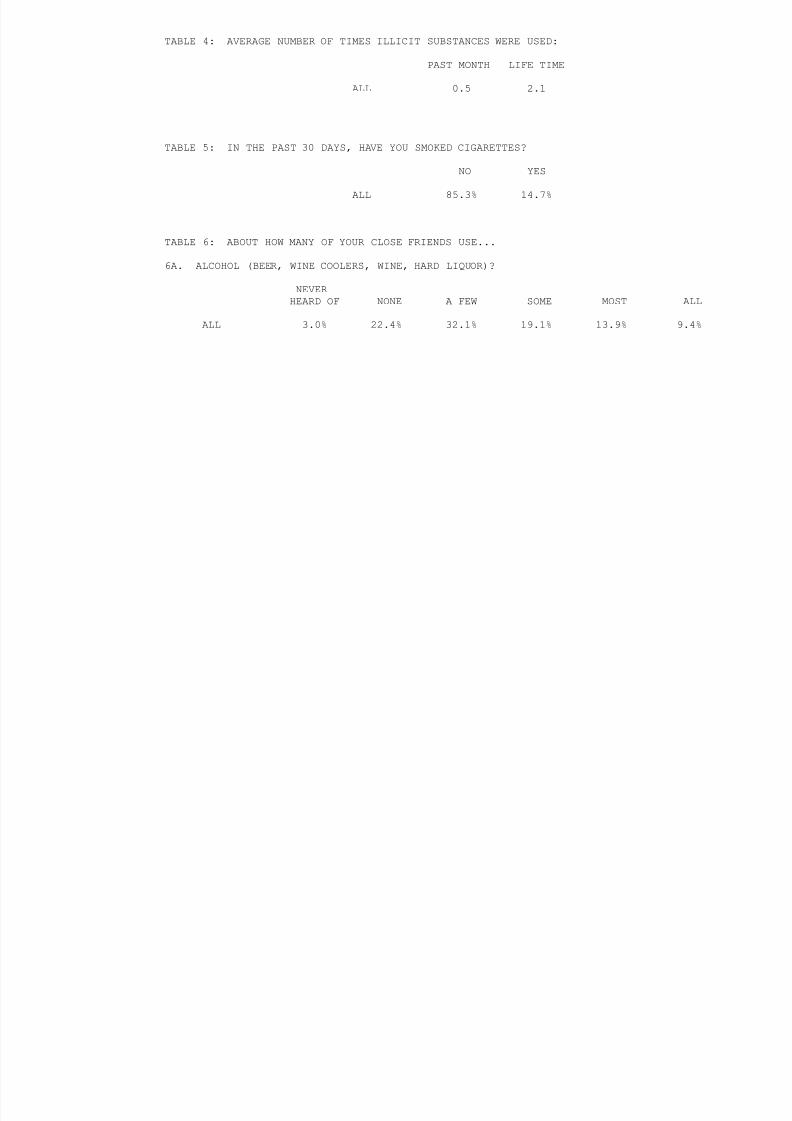
8/6/2019 la joya isd - 9th grade center - 1996 Texas School Survey of Drug and Alcohol Use
http://slidepdf.com/reader/full/la-joya-isd-9th-grade-center-1996-texas-school-survey-of-drug-and-alcohol 195/353
LA JOYA ISD - 9TH GRADE CENTERSPRING 1996
6B. INHALANTS (SPRAY, GLUE, GASOLINE, ETC.)?
NEVERHEARD OF NONE A FEW SOME MOST ALL
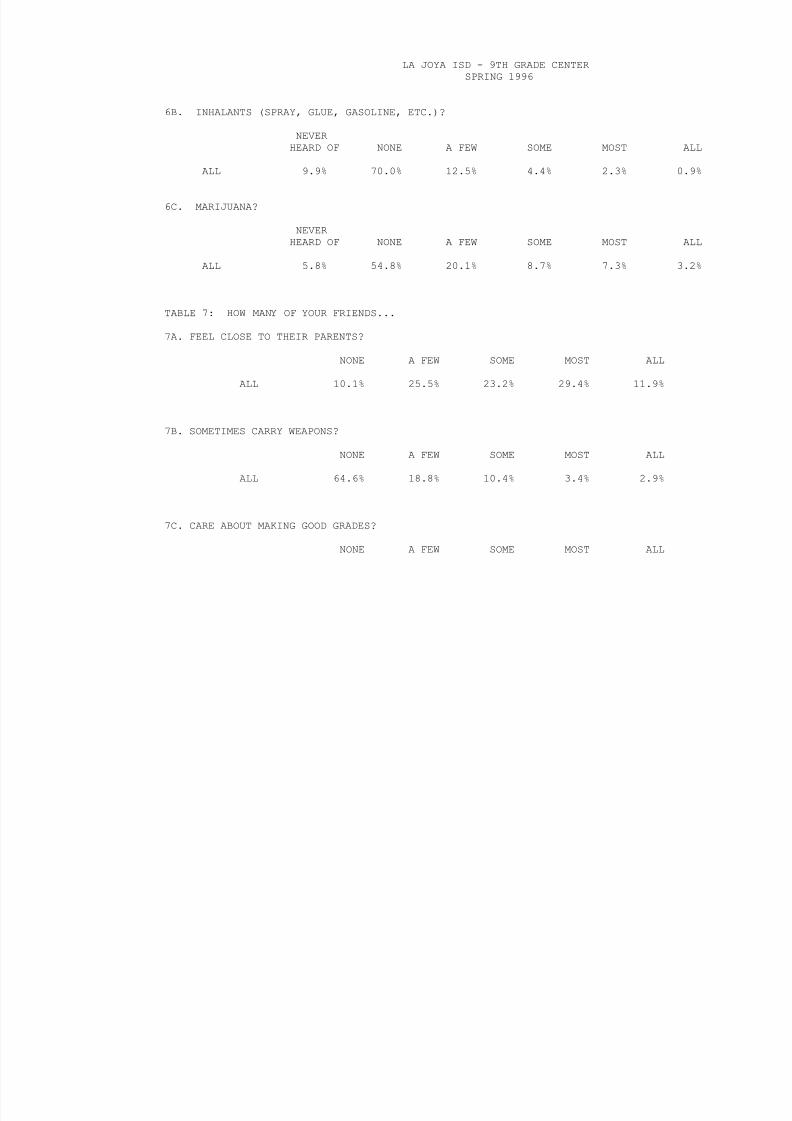
8/6/2019 la joya isd - 9th grade center - 1996 Texas School Survey of Drug and Alcohol Use
http://slidepdf.com/reader/full/la-joya-isd-9th-grade-center-1996-texas-school-survey-of-drug-and-alcohol 196/353
HEARD OF NONE A FEW SOME MOST ALL
ALL 9.9% 70.0% 12.5% 4.4% 2.3% 0.9%
6C. MARIJUANA?
NEVERHEARD OF NONE A FEW SOME MOST ALL
ALL 5.8% 54.8% 20.1% 8.7% 7.3% 3.2%
TABLE 7: HOW MANY OF YOUR FRIENDS...
7A. FEEL CLOSE TO THEIR PARENTS?
NONE A FEW SOME MOST ALL
ALL 10.1% 25.5% 23.2% 29.4% 11.9%
7B. SOMETIMES CARRY WEAPONS?
NONE A FEW SOME MOST ALL
ALL 64.6% 18.8% 10.4% 3.4% 2.9%
7C. CARE ABOUT MAKING GOOD GRADES?
NONE A FEW SOME MOST ALL
ALL 4.2% 19.2% 22.6% 34.5% 19.5%
7D. BELONG/WANT TO BELONG TO A GANG?
NONE A FEW SOME MOST ALL
ALL 50.3% 23.7% 14.0% 8.4% 3.6%

8/6/2019 la joya isd - 9th grade center - 1996 Texas School Survey of Drug and Alcohol Use
http://slidepdf.com/reader/full/la-joya-isd-9th-grade-center-1996-texas-school-survey-of-drug-and-alcohol 197/353
7E. WISH THEY COULD DROP OUT OF SCHOOL?
NONE A FEW SOME MOST ALL
ALL 49.4% 30.7% 11.5% 5.4% 3.1%
LA JOYA ISD - 9TH GRADE CENTERSPRING 1996
TABLE 8: AVERAGE AGE OF FIRST USE OF SELECTED SUBSTANCES:
ALL

8/6/2019 la joya isd - 9th grade center - 1996 Texas School Survey of Drug and Alcohol Use
http://slidepdf.com/reader/full/la-joya-isd-9th-grade-center-1996-texas-school-survey-of-drug-and-alcohol 198/353
TOBACCO 12.2
ALCOHOL 12.4BEER 12.2WINECOOL 13.0WINE 13.1LIQUOR 13.0INHALANT 12.7MARIJUAN 13.2COCAINE 14.0CRACK *HALLUCIN *UPPERS 14.1DOWNERS *
STEROIDS *ECSTASY *ROACH 13.6
TABLE 9: IF YOU WANTED SOME, HOW DIFFICULT WOULD IT BE TO GET...
9A. ALCOHOL (BEER, WINE COOLERS, WINE, HARD LIQUOR)?
NEVER VERY SOMEWHAT SOMEWHAT VERY
HEARD OF IMPOSSIBLE DIFFICULT DIFFICULT EASY EASY
ALL 10.3% 15.8% 5.8% 11.8% 18.5% 37.9%
9B. MARIJUANA?
NEVER VERY SOMEWHAT SOMEWHAT VERYHEARD OF IMPOSSIBLE DIFFICULT DIFFICULT EASY EASY
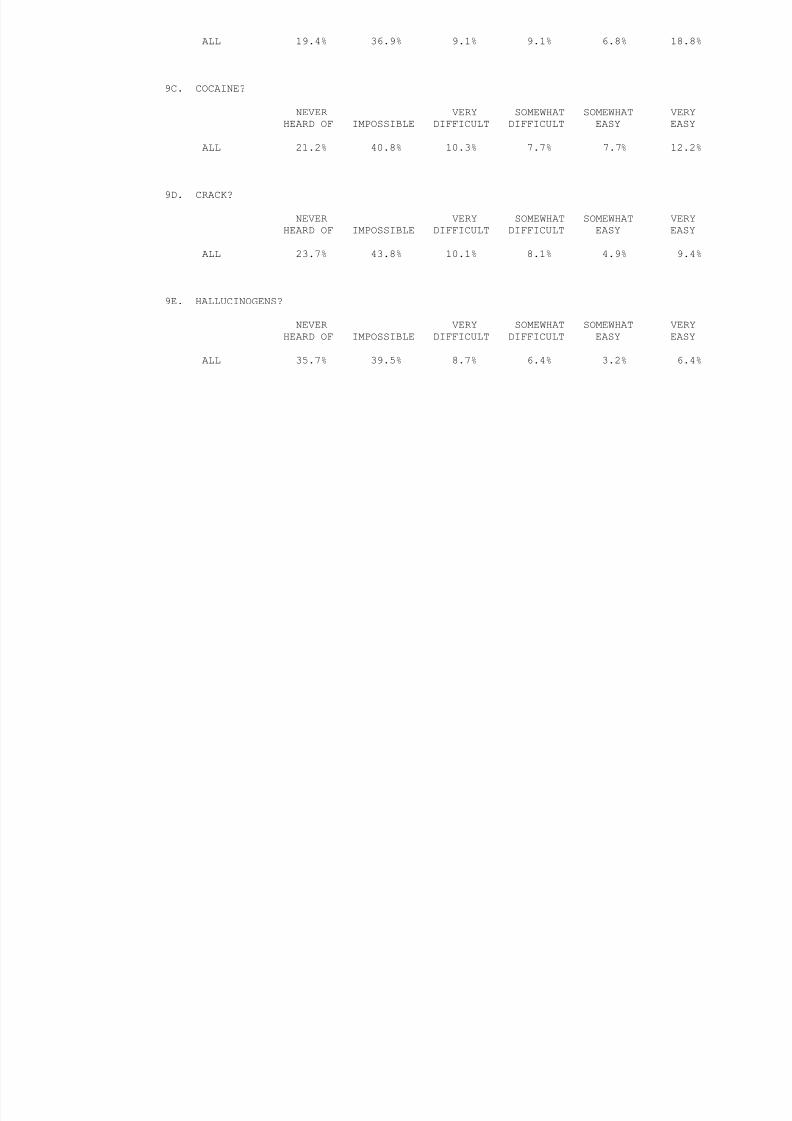
8/6/2019 la joya isd - 9th grade center - 1996 Texas School Survey of Drug and Alcohol Use
http://slidepdf.com/reader/full/la-joya-isd-9th-grade-center-1996-texas-school-survey-of-drug-and-alcohol 199/353
LA JOYA ISD - 9TH GRADE CENTERSPRING 1996
TABLE 10: SINCE SCHOOL BEGAN IN THE FALL, ON HOW MANY DAYS HAVE YOU GOTTEN INTO TROUBLEWITH YOUR TEACHERS BECAUSE OF YOUR DRINKING?
NONE 1 DAY 2-3 DAYS 4+ DAYS

8/6/2019 la joya isd - 9th grade center - 1996 Texas School Survey of Drug and Alcohol Use
http://slidepdf.com/reader/full/la-joya-isd-9th-grade-center-1996-texas-school-survey-of-drug-and-alcohol 200/353
ALL 99.6% * % * % * %
TABLE 11: SINCE SCHOOL BEGAN IN THE FALL, ON HOW MANY DAYS HAVE YOU GOTTEN INTO TROUBLEWITH YOUR TEACHERS BECAUSE OF YOUR DRUG USE?
NONE 1 DAY 2-3 DAYS 4+ DAYS
ALL 98.9% * % 0.8% * %
TABLE 12: 30-DAY PREVALENCE OF USE OF SELECTED SUBSTANCES:
12A. BY ABSENCES DUE TO ILLNESS OR OTHER REASONS
NONE 1 DAY 2-3 DAYS 4+ DAYS
ALCOHOL 20.8% 28.0% 29.8% 34.6%INHALANTS 8.3% 4.0% * % 3.2%MARIJUANA 10.4% 2.0% 3.5% 6.3%
12B. BY CONDUCT PROBLEMSNONE 1 DAY 2-3 DAYS 4+ DAYS
ALCOHOL 20.4% 52.9% 31.3% 53.7%INHALANTS 1.6% 8.8% 13.3% 4.9%MARIJUANA 3.1% 2.9% 6.7% 19.5%
TABLE 13: SINCE SCHOOL BEGAN IN THE FALL, ON HOW MANY DAYS (IF ANY) HAVE YOU ATTENDED
AT LEAST ONE CLASS WHILE "HIGH", "DRUNK", OR "STONED" ON...
13A. ALCOHOL (BEER, WINE COOLERS, WINE, OR HARD LIQUOR)?
NONE 1 DAY 2-3 DAYS 4+ DAYS
ALL 93.5% 2.8% 2.0% 1.6%

8/6/2019 la joya isd - 9th grade center - 1996 Texas School Survey of Drug and Alcohol Use
http://slidepdf.com/reader/full/la-joya-isd-9th-grade-center-1996-texas-school-survey-of-drug-and-alcohol 201/353
13B. MARIJUANA?
NONE 1 DAY 2-3 DAYS 4+ DAYS
ALL 95.5% 2.0% 1.6% 0.8%
13C. INHALANTS (SPRAY, GLUE, GASOLINE, ETC.)?
NONE 1 DAY 2-3 DAYS 4+ DAYS
ALL 98.4% 0.8% * % 0.8%
13D. SOME OTHER DRUG(S)?
NONE 1 DAY 2-3 DAYS 4+ DAYS
ALL 95.5% 0.8% 2.1% 1.6%

8/6/2019 la joya isd - 9th grade center - 1996 Texas School Survey of Drug and Alcohol Use
http://slidepdf.com/reader/full/la-joya-isd-9th-grade-center-1996-texas-school-survey-of-drug-and-alcohol 202/353
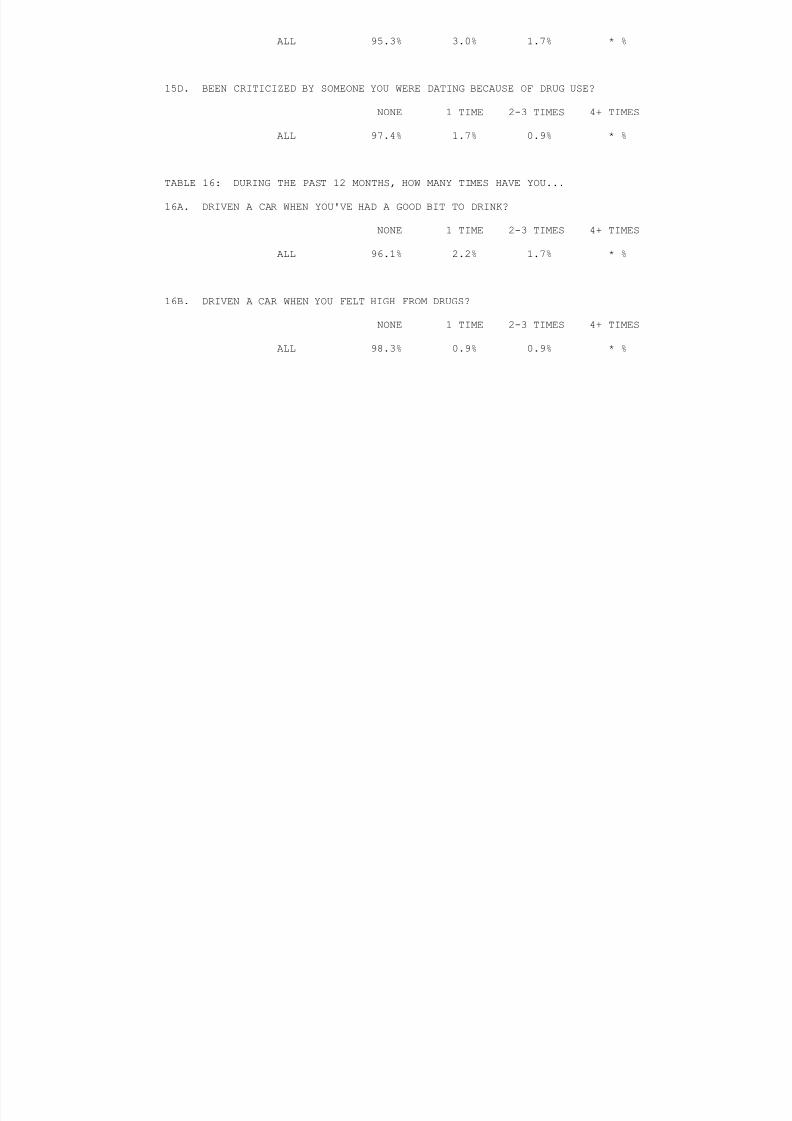
8/6/2019 la joya isd - 9th grade center - 1996 Texas School Survey of Drug and Alcohol Use
http://slidepdf.com/reader/full/la-joya-isd-9th-grade-center-1996-texas-school-survey-of-drug-and-alcohol 203/353
LA JOYA ISD - 9TH GRADE CENTERSPRING 1996
16C. GOTTEN INTO TROUBLE WITH THE POLICE BECAUSE OF DRINKING?
NONE 1 TIME 2-3 TIMES 4+ TIMES

8/6/2019 la joya isd - 9th grade center - 1996 Texas School Survey of Drug and Alcohol Use
http://slidepdf.com/reader/full/la-joya-isd-9th-grade-center-1996-texas-school-survey-of-drug-and-alcohol 204/353
ALL 99.1% * % * % * %
16D. GOTTEN INTO TROUBLE WITH THE POLICE BECAUSE OF DRUG USE?
NONE 1 TIME 2-3 TIMES 4+ TIMES
ALL 99.6% * % * % * %
TABLE 17: HOW DANGEROUS DO YOU THINK IT IS FOR KIDS YOUR AGE TO USE ...
17A. TOBACCO (CIGARETTES, SNUFF, CHEWING TOBACCO)?
VERY SOMEWHAT NOT VERY NOT AT ALL DO NOTDANGEROUS DANGEROUS DANGEROUS DANGEROUS KNOW
ALL 54.8% 26.6% 8.9% 2.8% 6.9%
17B. ALCHOHOL (BEER, WINE, WINE COOLERS, LIQUOR)?
VERY SOMEWHAT NOT VERY NOT AT ALL DO NOTDANGEROUS DANGEROUS DANGEROUS DANGEROUS KNOW
ALL 57.0% 21.1% 13.2% 2.5% 6.2%
17C. INHALANTS?
VERY SOMEWHAT NOT VERY NOT AT ALL DO NOTDANGEROUS DANGEROUS DANGEROUS DANGEROUS KNOW
ALL 77.9% 11.7% 2.1% 1.3% 7.1%
17D. MARIJUANA?
VERY SOMEWHAT NOT VERY NOT AT ALL DO NOTDANGEROUS DANGEROUS DANGEROUS DANGEROUS KNOW

8/6/2019 la joya isd - 9th grade center - 1996 Texas School Survey of Drug and Alcohol Use
http://slidepdf.com/reader/full/la-joya-isd-9th-grade-center-1996-texas-school-survey-of-drug-and-alcohol 205/353
ALL 79.8% 9.7% 2.9% 2.5% 5.0%
17E. COCAINE?
VERY SOMEWHAT NOT VERY NOT AT ALL DO NOTDANGEROUS DANGEROUS DANGEROUS DANGEROUS KNOW
ALL 84.4% 8.9% * % 1.3% 5.5%
17F. CRACK?
VERY SOMEWHAT NOT VERY NOT AT ALL DO NOTDANGEROUS DANGEROUS DANGEROUS DANGEROUS KNOW
ALL 85.7% 8.0% * % 0.8% 5.5%
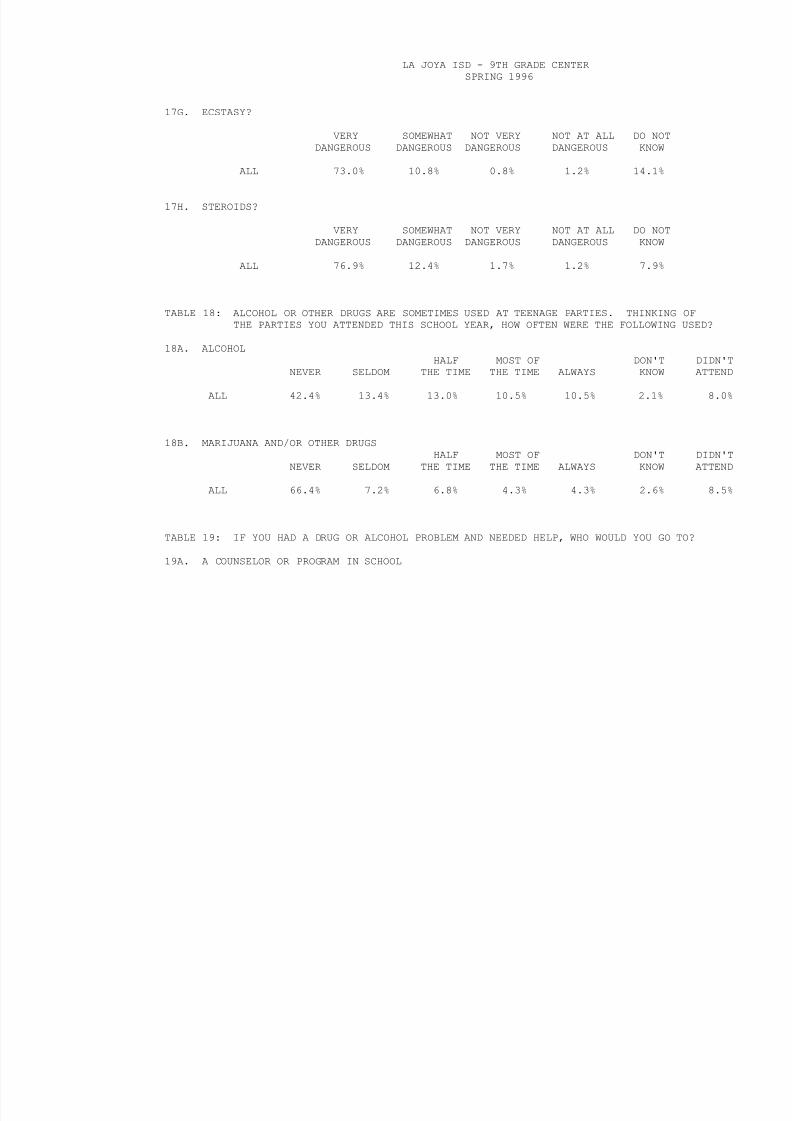
8/6/2019 la joya isd - 9th grade center - 1996 Texas School Survey of Drug and Alcohol Use
http://slidepdf.com/reader/full/la-joya-isd-9th-grade-center-1996-texas-school-survey-of-drug-and-alcohol 206/353
NO YES
ALL 48.6% 51.4%
19B. ANOTHER ADULT IN SCHOOL (SUCH AS A NURSE OR TEACHER)
NO YES

8/6/2019 la joya isd - 9th grade center - 1996 Texas School Survey of Drug and Alcohol Use
http://slidepdf.com/reader/full/la-joya-isd-9th-grade-center-1996-texas-school-survey-of-drug-and-alcohol 207/353
ALL 55.0% 45.0%
19C. A COUNSELOR OR PROGRAM OUTSIDE OF SCHOOL
NO YES
ALL 53.1% 46.9%
LA JOYA ISD - 9TH GRADE CENTERSPRING 1996
19D. YOUR PARENTS
NO YES
ALL 40 9% 59 1%

8/6/2019 la joya isd - 9th grade center - 1996 Texas School Survey of Drug and Alcohol Use
http://slidepdf.com/reader/full/la-joya-isd-9th-grade-center-1996-texas-school-survey-of-drug-and-alcohol 208/353
ALL 40.9% 59.1%
19E. A MEDICAL DOCTOR
NO YES
ALL 53.7% 46.3%
19F. YOUR FRIENDS
NO YES
ALL 29.3% 70.7%
19G. ANOTHER ADULT (SUCH AS RELATIVE, CLERGYMAN, OR OTHER FAMILY FRIEND)
NO YES
ALL 37.2% 62.8%
TABLE 20: SINCE SCHOOL BEGAN IN THE FALL, HAVE YOU GOTTEN ANY INFORMATION ON DRUGS ORALCOHOL FROM THE FOLLOWING SCHOOL SOURCES?
20A. HEALTH CLASS
NO YES
ALL 59.4% 40.6%

8/6/2019 la joya isd - 9th grade center - 1996 Texas School Survey of Drug and Alcohol Use
http://slidepdf.com/reader/full/la-joya-isd-9th-grade-center-1996-texas-school-survey-of-drug-and-alcohol 209/353
LA JOYA ISD - 9TH GRADE CENTERSPRING 1996
20E. SOCIAL STUDIES CLASS
NO YES
ALL 74 2% 25 8%

8/6/2019 la joya isd - 9th grade center - 1996 Texas School Survey of Drug and Alcohol Use
http://slidepdf.com/reader/full/la-joya-isd-9th-grade-center-1996-texas-school-survey-of-drug-and-alcohol 210/353
ALL 74.2% 25.8%
20F. DRUG PROGRAM RAP SESSION
NO YES
ALL 57.9% 42.1%
20G. AN INVITED SCHOOL GUEST
NO YES
ALL 42.0% 58.0%
20H. SOME OTHER SCHOOL SOURCE
NO YES
ALL 55.2% 44.8%
20I. ANY SCHOOL SOURCE
NO YES
ALL 17.8% 82.2%
TABLE 21: SINCE SCHOOL BEGAN IN THE FALL, HAVE YOU SOUGHT HELP, OTHER THAN FROM FAMILY ORFRIENDS, FOR PROBLEMS IN ANY WAY CONNECTED WITH YOUR USE OF ALCOHOL, MARIJUANA,OR OTHER DRUGS?
NO YES
ALL 88.9% 11.1%
TABLE 22: HOW DO YOUR PARENTS FEEL ABOUT KIDS YOUR AGE
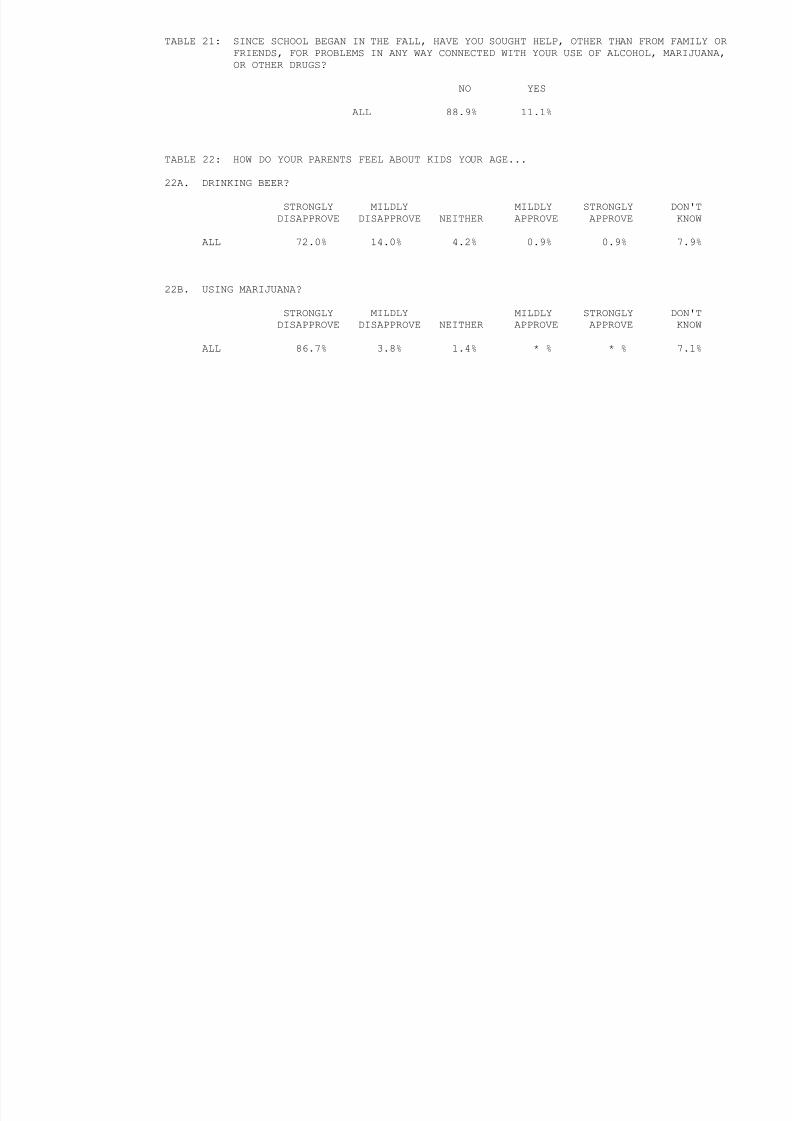
8/6/2019 la joya isd - 9th grade center - 1996 Texas School Survey of Drug and Alcohol Use
http://slidepdf.com/reader/full/la-joya-isd-9th-grade-center-1996-texas-school-survey-of-drug-and-alcohol 211/353
TABLE 22: HOW DO YOUR PARENTS FEEL ABOUT KIDS YOUR AGE...
22A. DRINKING BEER?
STRONGLY MILDLY MILDLY STRONGLY DON'TDISAPPROVE DISAPPROVE NEITHER APPROVE APPROVE KNOW
ALL 72.0% 14.0% 4.2% 0.9% 0.9% 7.9%
22B. USING MARIJUANA?
STRONGLY MILDLY MILDLY STRONGLY DON'TDISAPPROVE DISAPPROVE NEITHER APPROVE APPROVE KNOW
ALL 86.7% 3.8% 1.4% * % * % 7.1%
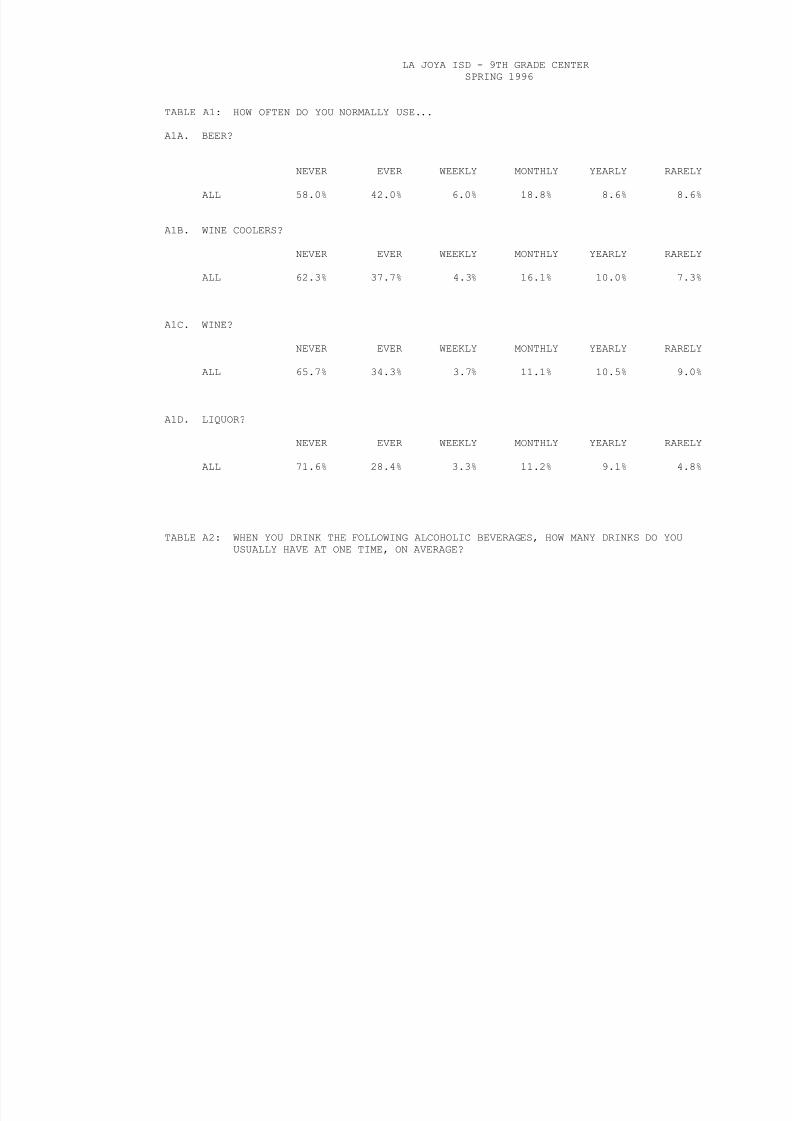
8/6/2019 la joya isd - 9th grade center - 1996 Texas School Survey of Drug and Alcohol Use
http://slidepdf.com/reader/full/la-joya-isd-9th-grade-center-1996-texas-school-survey-of-drug-and-alcohol 212/353
A2A. BEER
NEVER EVER 5 OR MORE 1 TO 4 LESS THAN 1
ALL 48.8% 51.2% 14.6% 25.6% 11.0%
A2B. WINE COOLERS

8/6/2019 la joya isd - 9th grade center - 1996 Texas School Survey of Drug and Alcohol Use
http://slidepdf.com/reader/full/la-joya-isd-9th-grade-center-1996-texas-school-survey-of-drug-and-alcohol 213/353
NEVER EVER 5 OR MORE 1 TO 4 LESS THAN 1
ALL 52.0% 48.0% 13.2% 25.7% 9.2%
A2C. WINE
NEVER EVER 5 OR MORE 1 TO 4 LESS THAN 1
ALL 55.9% 44.1% 9.7% 22.1% 12.4%
A2D. LIQUOR
NEVER EVER 5 OR MORE 1 TO 4 LESS THAN 1
ALL 63.6% 36.4% 9.2% 19.4% 7.8%
LA JOYA ISD - 9TH GRADE CENTERSPRING 1996
TABLE A3: DURING THE PAST YEAR (12 MONTHS), HOW OFTEN HAVE YOU HAD 5 OR MORE DRINKSAT ONE TIME?

8/6/2019 la joya isd - 9th grade center - 1996 Texas School Survey of Drug and Alcohol Use
http://slidepdf.com/reader/full/la-joya-isd-9th-grade-center-1996-texas-school-survey-of-drug-and-alcohol 214/353
A3A. BEER
SEVERAL SEVERAL LESS THANNEVER EVER TIMES/WEEK TIMES/MONTH ONCE/MONTH
ALL 70.5% 29.5% 5.2% 12.7% 11.6%
A3B. WINE COOLERS
SEVERAL SEVERAL LESS THANNEVER EVER TIMES/WEEK TIMES/MONTH ONCE/MONTH
ALL 74.6% 25.4% 3.2% 9.7% 12.5%
A3C. WINE
SEVERAL SEVERAL LESS THANNEVER EVER TIMES/WEEK TIMES/MONTH ONCE/MONTH
ALL 71.9% 28.1% 3.2% 10.0% 14.9%
A3D. LIQUOR
SEVERAL SEVERAL LESS THANNEVER EVER TIMES/WEEK TIMES/MONTH ONCE/MONTH
ALL 75.4% 24.6% 4.0% 9.3% 11.3%

8/6/2019 la joya isd - 9th grade center - 1996 Texas School Survey of Drug and Alcohol Use
http://slidepdf.com/reader/full/la-joya-isd-9th-grade-center-1996-texas-school-survey-of-drug-and-alcohol 215/353
LA JOYA ISD - 9TH GRADE CENTERSPRING 1996
GENDER
Q1 Frequency Percent----------------------------Male 180 45.3Female 217 54.7
Frequency Missing = 1
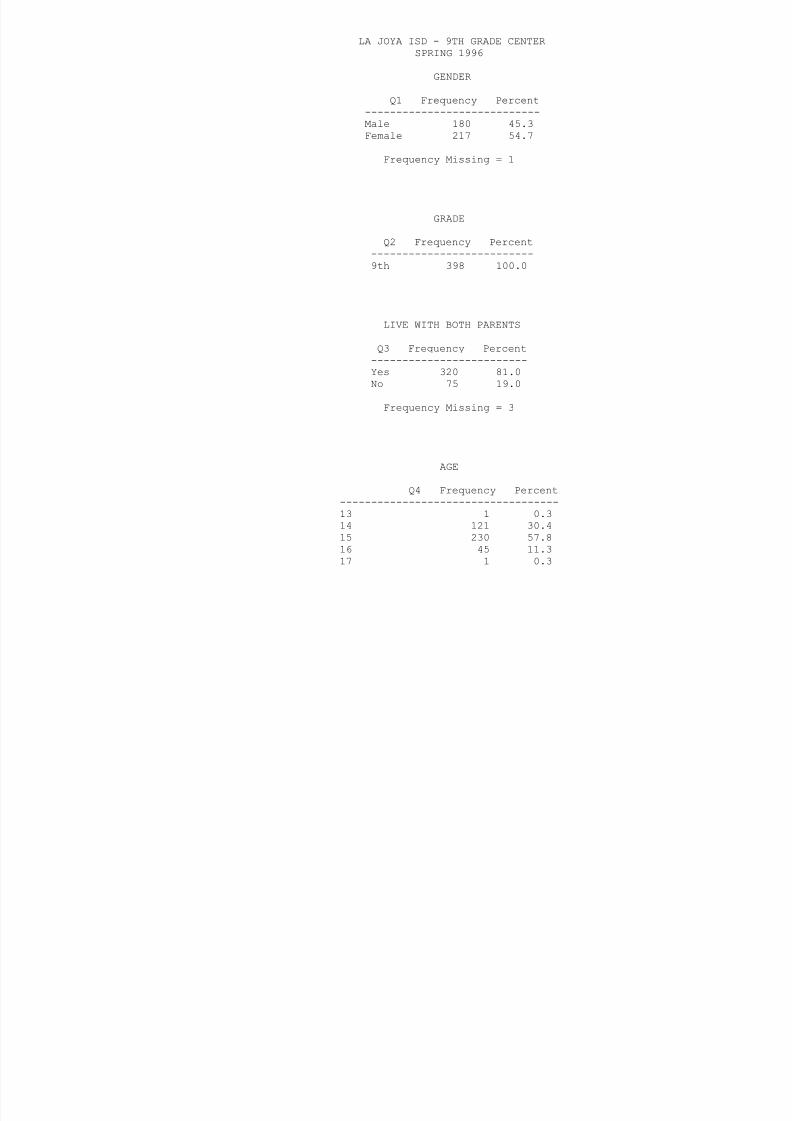
8/6/2019 la joya isd - 9th grade center - 1996 Texas School Survey of Drug and Alcohol Use
http://slidepdf.com/reader/full/la-joya-isd-9th-grade-center-1996-texas-school-survey-of-drug-and-alcohol 216/353
q y g
GRADE
Q2 Frequency Percent--------------------------9th 398 100.0
LIVE WITH BOTH PARENTS
Q3 Frequency Percent-------------------------Yes 320 81.0No 75 19.0
Frequency Missing = 3
AGE
Q4 Frequency Percent-----------------------------------13 1 0.314 121 30.415 230 57.816 45 11.317 1 0.3
ETHNICITY
Q5 Frequency Percent--------------------------------------White 1 0.3African/American 2 0.5Mexican/American 380 97.4

8/6/2019 la joya isd - 9th grade center - 1996 Texas School Survey of Drug and Alcohol Use
http://slidepdf.com/reader/full/la-joya-isd-9th-grade-center-1996-texas-school-survey-of-drug-and-alcohol 217/353
Asian/American 1 0.3Other 6 1.5
Frequency Missing = 8
NOTE: The frequencies have been weighted so that theanalysis reflects the distribution of students by grade
level in the district

8/6/2019 la joya isd - 9th grade center - 1996 Texas School Survey of Drug and Alcohol Use
http://slidepdf.com/reader/full/la-joya-isd-9th-grade-center-1996-texas-school-survey-of-drug-and-alcohol 218/353
Q9 Frequency Percent-------------------------Yes 201 51.9No 186 48.1
Frequency Missing = 11
EITHER PARENT COLLEGE GRADUATE

8/6/2019 la joya isd - 9th grade center - 1996 Texas School Survey of Drug and Alcohol Use
http://slidepdf.com/reader/full/la-joya-isd-9th-grade-center-1996-texas-school-survey-of-drug-and-alcohol 219/353
Q10 Frequency Percent----------------------------------Yes 59 15.0No 265 67.3I Don't Know 70 17.8
Frequency Missing = 4
NOTE: The frequencies have been weighted so that theanalysis reflects the distribution of students by grade
level in the district

8/6/2019 la joya isd - 9th grade center - 1996 Texas School Survey of Drug and Alcohol Use
http://slidepdf.com/reader/full/la-joya-isd-9th-grade-center-1996-texas-school-survey-of-drug-and-alcohol 220/353

8/6/2019 la joya isd - 9th grade center - 1996 Texas School Survey of Drug and Alcohol Use
http://slidepdf.com/reader/full/la-joya-isd-9th-grade-center-1996-texas-school-survey-of-drug-and-alcohol 221/353
LA JOYA ISD - 9TH GRADE CENTERSPRING 1996
PARTICIPATE IN DRILL TEAM/CHEERLEADING
Q12E Frequency Percent--------------------------Yes 32 9.2No 315 90.8
Frequency Missing = 51

8/6/2019 la joya isd - 9th grade center - 1996 Texas School Survey of Drug and Alcohol Use
http://slidepdf.com/reader/full/la-joya-isd-9th-grade-center-1996-texas-school-survey-of-drug-and-alcohol 222/353
PARTICIPATE IN STUDENT GOVERNMENT
Q12F Frequency Percent--------------------------Yes 9 2.7No 330 97.3
Frequency Missing = 59
PARTICIPATE IN SCHOOL NEWSPAPER/YEARBOOK
Q12G Frequency Percent--------------------------Yes 30 8.8No 311 91.2
Frequency Missing = 57
PARTICIPATE IN ACADEMIC CLUBS/SOCIETIES
Q12H Frequency Percent--------------------------Yes 90 26.1No 255 73.9

8/6/2019 la joya isd - 9th grade center - 1996 Texas School Survey of Drug and Alcohol Use
http://slidepdf.com/reader/full/la-joya-isd-9th-grade-center-1996-texas-school-survey-of-drug-and-alcohol 223/353
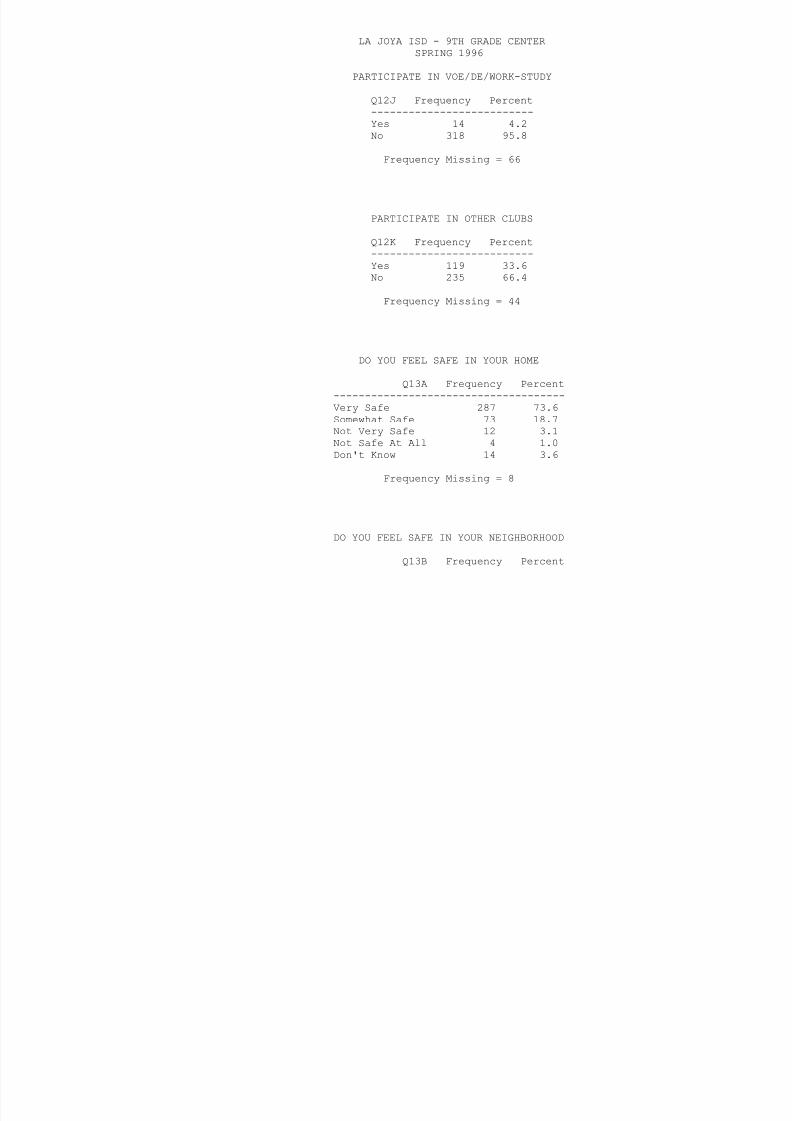
8/6/2019 la joya isd - 9th grade center - 1996 Texas School Survey of Drug and Alcohol Use
http://slidepdf.com/reader/full/la-joya-isd-9th-grade-center-1996-texas-school-survey-of-drug-and-alcohol 224/353

8/6/2019 la joya isd - 9th grade center - 1996 Texas School Survey of Drug and Alcohol Use
http://slidepdf.com/reader/full/la-joya-isd-9th-grade-center-1996-texas-school-survey-of-drug-and-alcohol 225/353
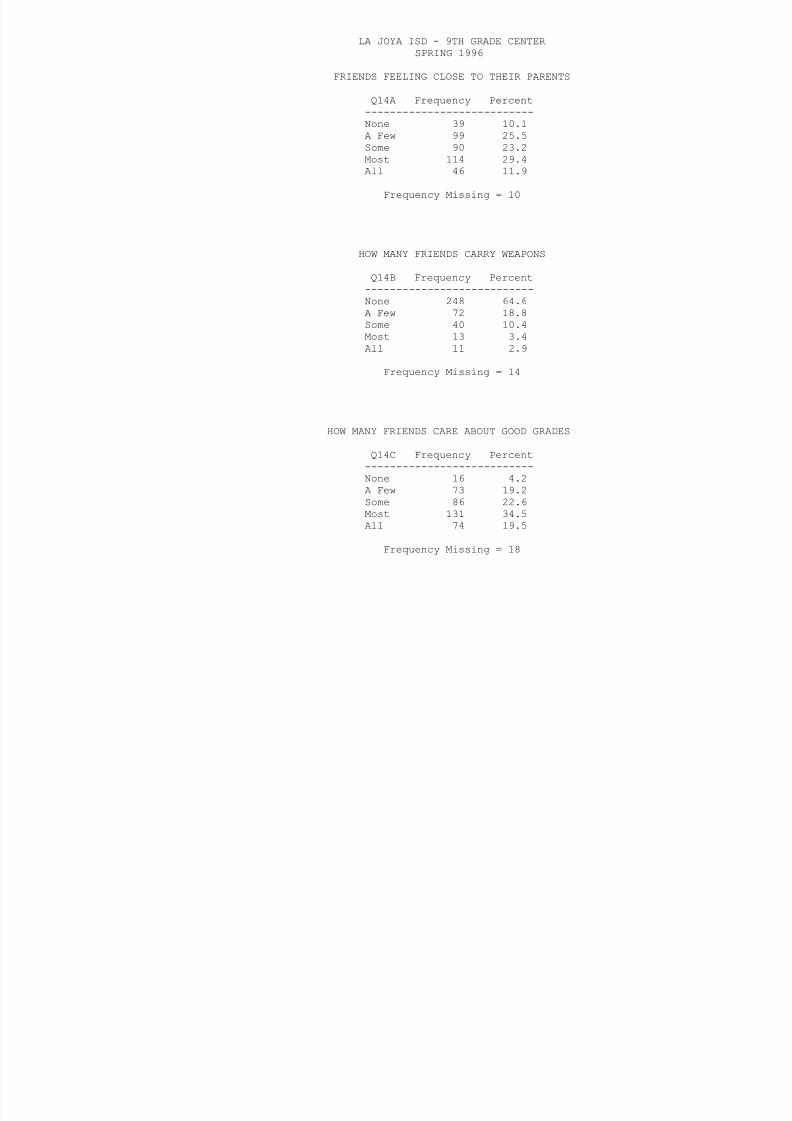
8/6/2019 la joya isd - 9th grade center - 1996 Texas School Survey of Drug and Alcohol Use
http://slidepdf.com/reader/full/la-joya-isd-9th-grade-center-1996-texas-school-survey-of-drug-and-alcohol 226/353
HOW MANY FRIENDS BELONG TO A GANG
Q14D Frequency Percent---------------------------None 197 50.3A Few 93 23.7Some 55 14.0Most 33 8.4All 14 3 6

8/6/2019 la joya isd - 9th grade center - 1996 Texas School Survey of Drug and Alcohol Use
http://slidepdf.com/reader/full/la-joya-isd-9th-grade-center-1996-texas-school-survey-of-drug-and-alcohol 227/353
All 14 3.6
Frequency Missing = 6
NOTE: The frequencies have been weighted so that theanalysis reflects the distribution of students by grade
level in the district

8/6/2019 la joya isd - 9th grade center - 1996 Texas School Survey of Drug and Alcohol Use
http://slidepdf.com/reader/full/la-joya-isd-9th-grade-center-1996-texas-school-survey-of-drug-and-alcohol 228/353
EVER INHALED LIQUID PAPER FOR KICKS
Q16B Frequency Percent------------------------------------Never heard of 68 17.8Never used 275 72.21-2 times 29 7.63-10 times 7 1.820+ times 2 0.5
Frequency Missing = 17
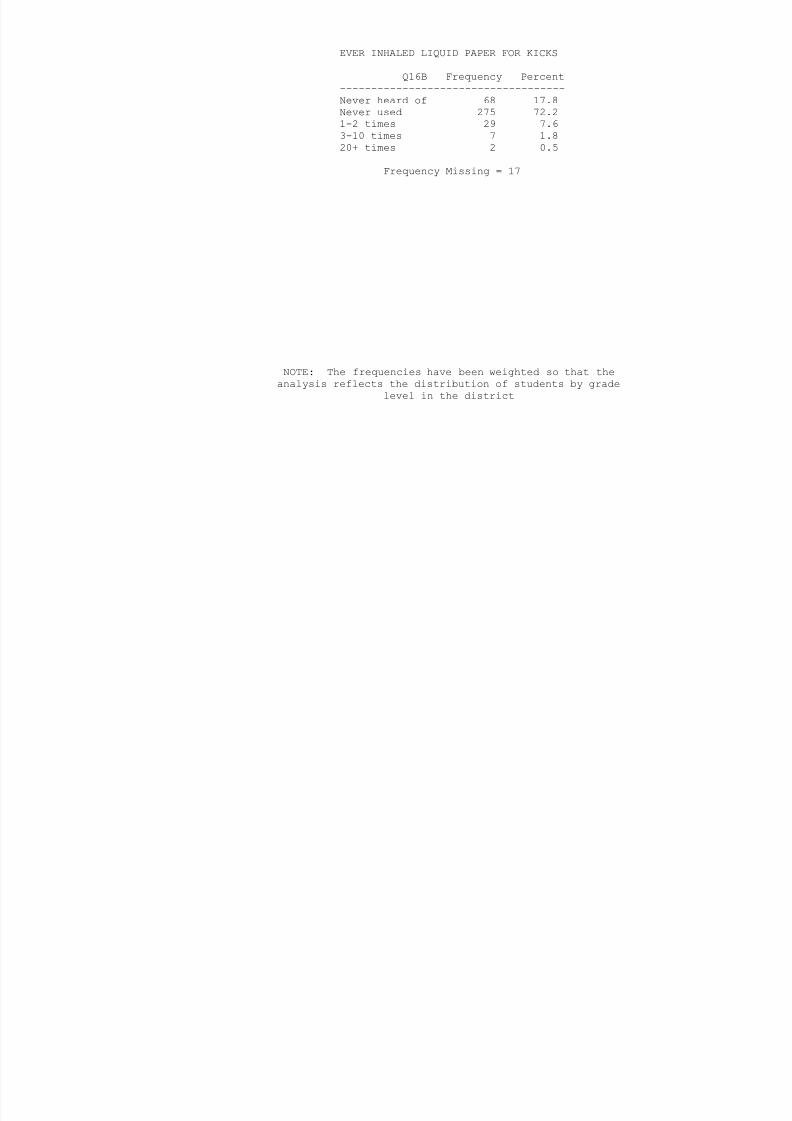
8/6/2019 la joya isd - 9th grade center - 1996 Texas School Survey of Drug and Alcohol Use
http://slidepdf.com/reader/full/la-joya-isd-9th-grade-center-1996-texas-school-survey-of-drug-and-alcohol 229/353
Frequency Missing 17
NOTE: The frequencies have been weighted so that theanalysis reflects the distribution of students by grade
level in the district
LA JOYA ISD - 9TH GRADE CENTERSPRING 1996
EVER INHALED GASOLINE FOR KICKS
Q16C Frequency Percent------------------------------------Never heard of 59 15.5Never used 307 80.81-2 times 13 3.43-10 times 1 0.3
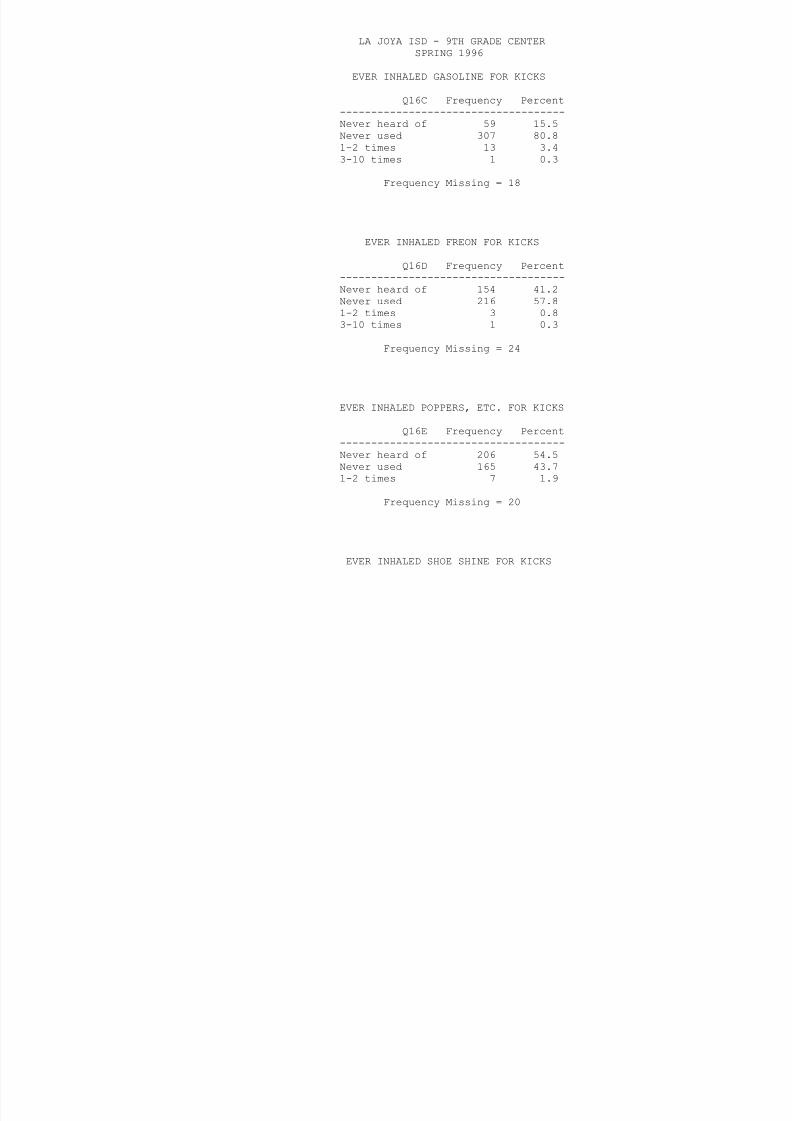
8/6/2019 la joya isd - 9th grade center - 1996 Texas School Survey of Drug and Alcohol Use
http://slidepdf.com/reader/full/la-joya-isd-9th-grade-center-1996-texas-school-survey-of-drug-and-alcohol 230/353
Frequency Missing = 18
EVER INHALED FREON FOR KICKS
Q16D Frequency Percent------------------------------------Never heard of 154 41.2Never used 216 57.8
1-2 times 3 0.83-10 times 1 0.3
Frequency Missing = 24
EVER INHALED POPPERS, ETC. FOR KICKS
Q16E Frequency Percent------------------------------------
Never heard of 206 54.5Never used 165 43.71-2 times 7 1.9
Frequency Missing = 20
EVER INHALED SHOE SHINE FOR KICKS
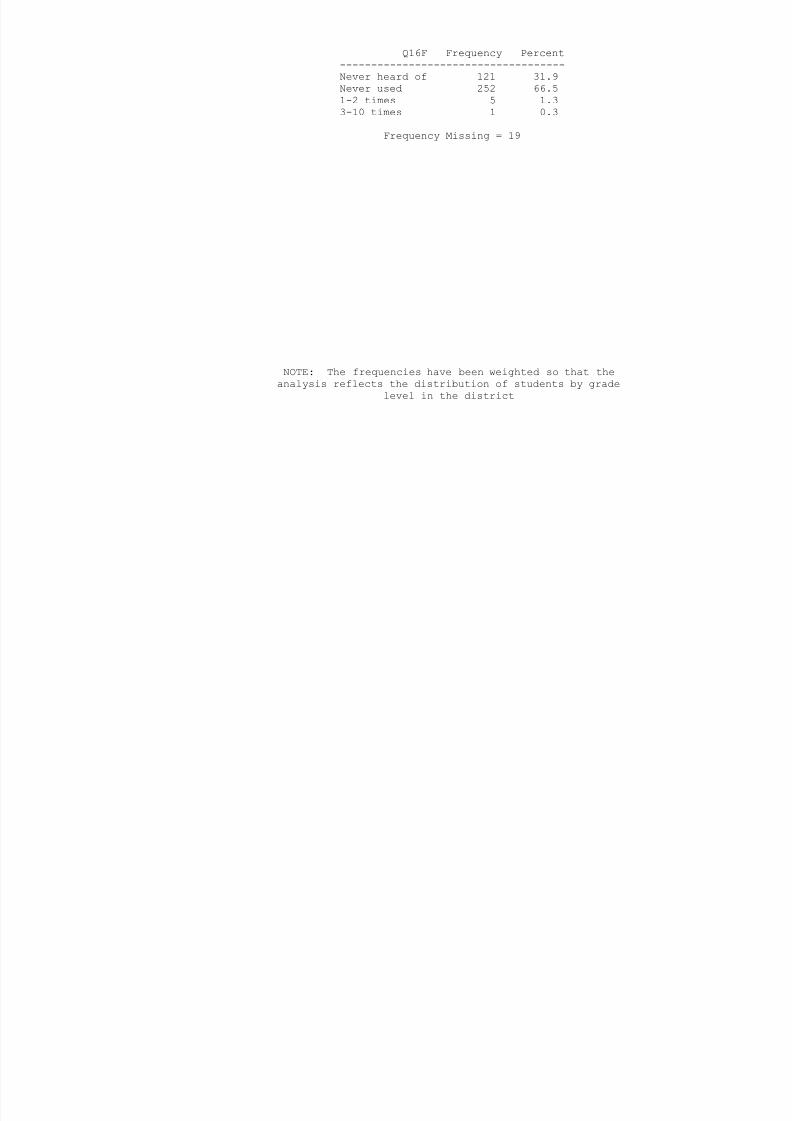
8/6/2019 la joya isd - 9th grade center - 1996 Texas School Survey of Drug and Alcohol Use
http://slidepdf.com/reader/full/la-joya-isd-9th-grade-center-1996-texas-school-survey-of-drug-and-alcohol 231/353
LA JOYA ISD - 9TH GRADE CENTERSPRING 1996
EVER INHALED GLUE FOR KICKS
Q16G Frequency Percent------------------------------------Never heard of 63 16.9Never used 292 78.31-2 times 15 4.03-10 times 2 0.520+ times 1 0.3

8/6/2019 la joya isd - 9th grade center - 1996 Texas School Survey of Drug and Alcohol Use
http://slidepdf.com/reader/full/la-joya-isd-9th-grade-center-1996-texas-school-survey-of-drug-and-alcohol 232/353
Frequency Missing = 25
EVER INHALED PAINT THINNERS FOR KICKS
Q16H Frequency Percent------------------------------------Never heard of 114 30.3
Never used 248 66.01-2 times 9 2.43-10 times 2 0.511-19 times 2 0.520+ times 1 0.3
Frequency Missing = 22
EVER INHALED OCTANE BOOSTER FOR KICKS
Q16I Frequency Percent------------------------------------Never heard of 202 54.2Never used 169 45.33-10 times 2 0.5
Frequency Missing = 25
EVER INHALED OTHER SPRAYS FOR KICKS
Q16J Frequency Percent------------------------------------Never heard of 65 17.9Never used 286 78.81-2 times 8 2.23-10 times 3 0.820+ times 1 0.3

8/6/2019 la joya isd - 9th grade center - 1996 Texas School Survey of Drug and Alcohol Use
http://slidepdf.com/reader/full/la-joya-isd-9th-grade-center-1996-texas-school-survey-of-drug-and-alcohol 233/353
Frequency Missing = 35
NOTE: The frequencies have been weighted so that theanalysis reflects the distribution of students by grade
level in the district
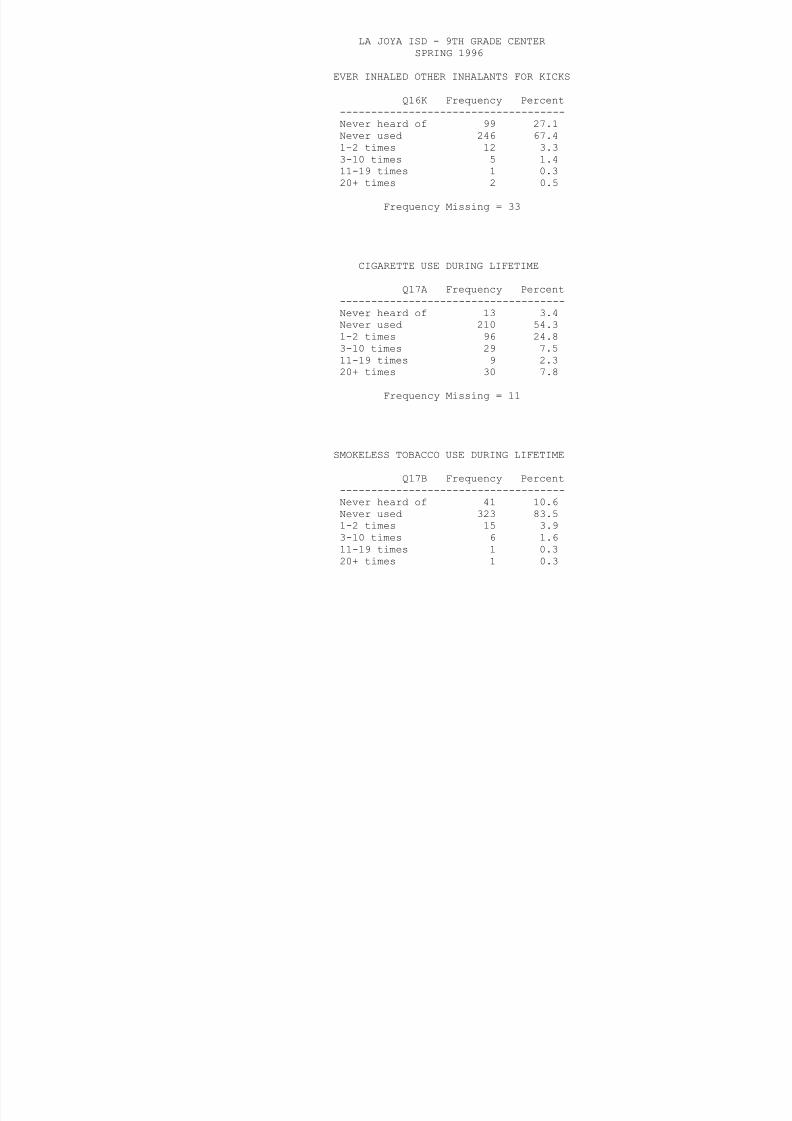
8/6/2019 la joya isd - 9th grade center - 1996 Texas School Survey of Drug and Alcohol Use
http://slidepdf.com/reader/full/la-joya-isd-9th-grade-center-1996-texas-school-survey-of-drug-and-alcohol 234/353
Frequency Missing = 11
BEER USE DURING LIFETIME
Q17C Frequency Percent------------------------------------Never heard of 10 2.6Never used 186 48.3

8/6/2019 la joya isd - 9th grade center - 1996 Texas School Survey of Drug and Alcohol Use
http://slidepdf.com/reader/full/la-joya-isd-9th-grade-center-1996-texas-school-survey-of-drug-and-alcohol 235/353
1-2 times 108 28.13-10 times 29 7.511-19 times 15 3.920+ times 37 9.6
Frequency Missing = 13
NOTE: The frequencies have been weighted so that theanalysis reflects the distribution of students by grade
level in the district
LA JOYA ISD - 9TH GRADE CENTERSPRING 1996
WINE COOLER USE DURING LIFETIME
Q17D Frequency Percent------------------------------------Never heard of 18 4.7Never used 186 48.31-2 times 103 26.83-10 times 39 10.111-19 times 7 1.8

8/6/2019 la joya isd - 9th grade center - 1996 Texas School Survey of Drug and Alcohol Use
http://slidepdf.com/reader/full/la-joya-isd-9th-grade-center-1996-texas-school-survey-of-drug-and-alcohol 236/353
20+ times 32 8.3
Frequency Missing = 13
WINE USE DURING LIFETIME
Q17E Frequency Percent------------------------------------
Never heard of 17 4.4Never used 204 53.31-2 times 102 26.63-10 times 32 8.411-19 times 8 2.120+ times 20 5.2
Frequency Missing = 15
LIQUOR USE DURING LIFETIME
Q17F Frequency Percent------------------------------------Never heard of 18 4.8Never used 236 63.11-2 times 68 18.23-10 times 20 5.311-19 times 9 2.420+ times 23 6.1
Frequency Missing = 24
INHALANT USE DURING LIFETIME
Q17G Frequency Percent------------------------------------Never heard of 36 9.4Never used 319 82.91 2 i 18 4 7

8/6/2019 la joya isd - 9th grade center - 1996 Texas School Survey of Drug and Alcohol Use
http://slidepdf.com/reader/full/la-joya-isd-9th-grade-center-1996-texas-school-survey-of-drug-and-alcohol 237/353
1-2 times 18 4.73-10 times 9 2.320+ times 3 0.8
Frequency Missing = 13
NOTE: The frequencies have been weighted so that theanalysis reflects the distribution of students by grade
level in the district

8/6/2019 la joya isd - 9th grade center - 1996 Texas School Survey of Drug and Alcohol Use
http://slidepdf.com/reader/full/la-joya-isd-9th-grade-center-1996-texas-school-survey-of-drug-and-alcohol 238/353
HALLUCINOGEN USE DURING LIFETIME
Q17L Frequency Percent------------------------------------Never heard of 112 29.5Never used 262 68.91-2 times 5 1.33-10 times 1 0.3
F Mi i 18

8/6/2019 la joya isd - 9th grade center - 1996 Texas School Survey of Drug and Alcohol Use
http://slidepdf.com/reader/full/la-joya-isd-9th-grade-center-1996-texas-school-survey-of-drug-and-alcohol 239/353
Frequency Missing = 18
NOTE: The frequencies have been weighted so that theanalysis reflects the distribution of students by grade
level in the district
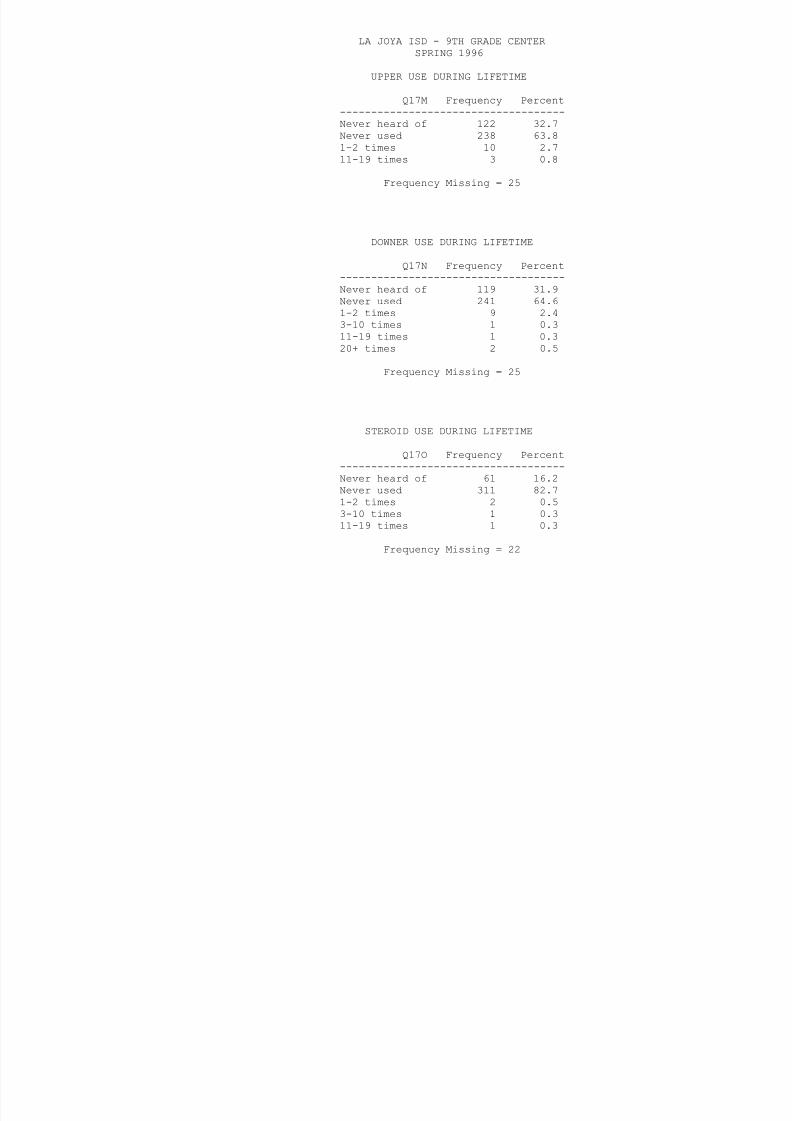
8/6/2019 la joya isd - 9th grade center - 1996 Texas School Survey of Drug and Alcohol Use
http://slidepdf.com/reader/full/la-joya-isd-9th-grade-center-1996-texas-school-survey-of-drug-and-alcohol 240/353

8/6/2019 la joya isd - 9th grade center - 1996 Texas School Survey of Drug and Alcohol Use
http://slidepdf.com/reader/full/la-joya-isd-9th-grade-center-1996-texas-school-survey-of-drug-and-alcohol 241/353
LA JOYA ISD - 9TH GRADE CENTERSPRING 1996
ROACH USE DURING LIFETIME
Q17Q Frequency Percent------------------------------------Never heard of 66 17.6Never used 270 72.01-2 times 27 7.23-10 times 6 1.611-19 times 5 1.3
20+ times 1 0 3

8/6/2019 la joya isd - 9th grade center - 1996 Texas School Survey of Drug and Alcohol Use
http://slidepdf.com/reader/full/la-joya-isd-9th-grade-center-1996-texas-school-survey-of-drug-and-alcohol 242/353
20+ times 1 0.3
Frequency Missing = 23
CIGARETTE USE IN PAST SCHOOL YEAR
Q18A Frequency Percent------------------------------------
Never heard of 18 4.7Never used 268 70.51-2 times 52 13.73-10 times 19 5.011-19 times 7 1.820+ times 16 4.2
Frequency Missing = 18
SMOKELESS TOBACCO USE IN PAST SCHOOL YR
Q18B Frequency Percent------------------------------------Never heard of 30 8.0Never used 328 87.91-2 times 5 1.33-10 times 3 0.811-19 times 3 0.820+ times 4 1.1
Frequency Missing = 25
BEER USE IN PAST SCHOOL YEAR
Q18C Frequency Percent------------------------------------Never heard of 14 3.8Never used 233 63.1
1-2 times 70 19 0
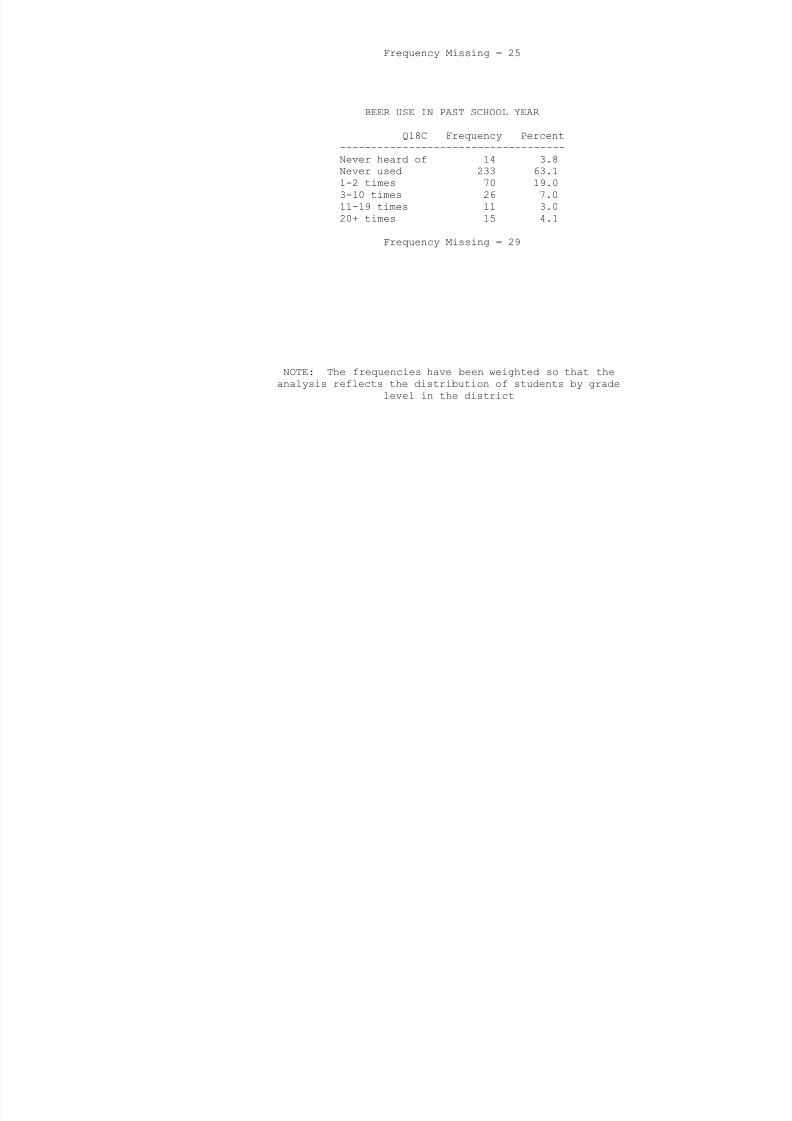
8/6/2019 la joya isd - 9th grade center - 1996 Texas School Survey of Drug and Alcohol Use
http://slidepdf.com/reader/full/la-joya-isd-9th-grade-center-1996-texas-school-survey-of-drug-and-alcohol 243/353
1 2 times 70 19.03-10 times 26 7.011-19 times 11 3.020+ times 15 4.1
Frequency Missing = 29
NOTE: The frequencies have been weighted so that theanalysis reflects the distribution of students by grade
level in the district
LA JOYA ISD - 9TH GRADE CENTERSPRING 1996
WINE COOLER USE IN PAST SCHOOL YEAR
Q18D Frequency Percent------------------------------------Never heard of 23 6.2Never used 238 64.31-2 times 68 18.43-10 times 19 5.111-19 times 13 3.5
20+ times 9 2 4

8/6/2019 la joya isd - 9th grade center - 1996 Texas School Survey of Drug and Alcohol Use
http://slidepdf.com/reader/full/la-joya-isd-9th-grade-center-1996-texas-school-survey-of-drug-and-alcohol 244/353
20+ times 9 2.4
Frequency Missing = 28
WINE USE IN PAST SCHOOL YEAR
Q18E Frequency Percent------------------------------------
Never heard of 19 5.1Never used 241 65.31-2 times 70 19.03-10 times 21 5.711-19 times 8 2.220+ times 10 2.7
Frequency Missing = 29
LIQUOR USE IN PAST SCHOOL YEAR
Q18F Frequency Percent------------------------------------Never heard of 19 5.2Never used 258 70.91-2 times 54 14.83-10 times 17 4.711-19 times 7 1.920+ times 9 2.5

8/6/2019 la joya isd - 9th grade center - 1996 Texas School Survey of Drug and Alcohol Use
http://slidepdf.com/reader/full/la-joya-isd-9th-grade-center-1996-texas-school-survey-of-drug-and-alcohol 245/353
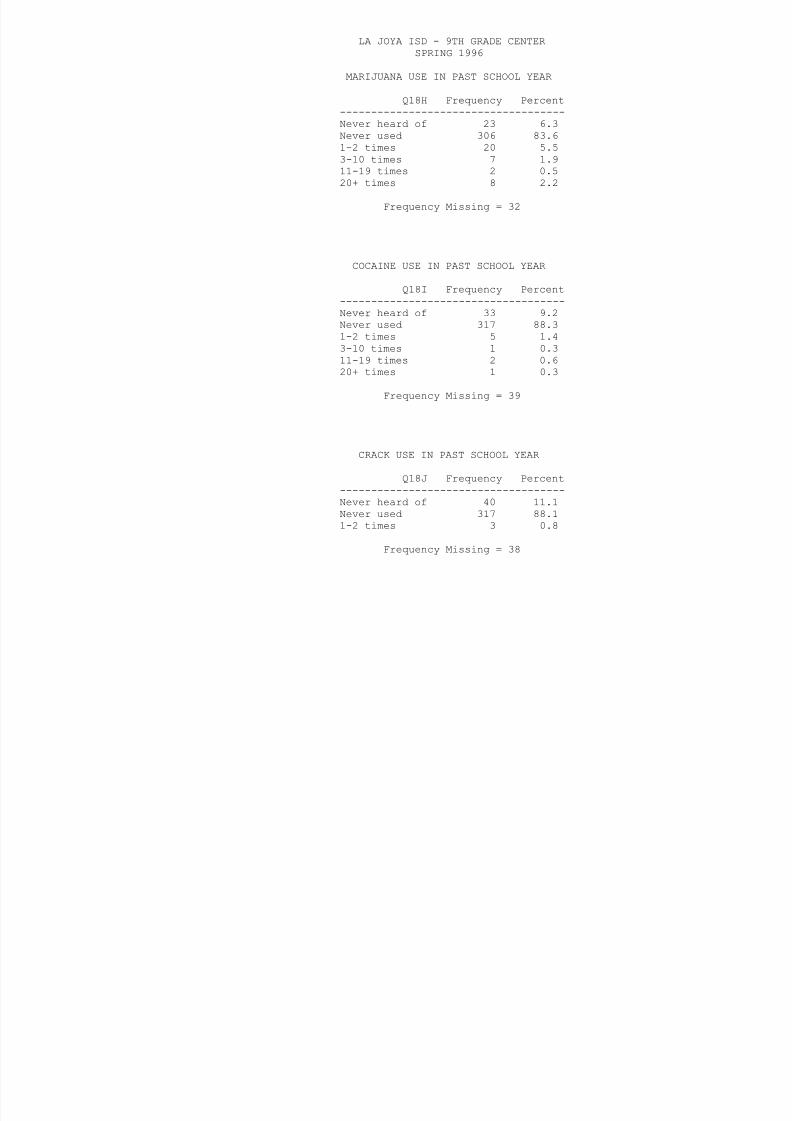
8/6/2019 la joya isd - 9th grade center - 1996 Texas School Survey of Drug and Alcohol Use
http://slidepdf.com/reader/full/la-joya-isd-9th-grade-center-1996-texas-school-survey-of-drug-and-alcohol 246/353
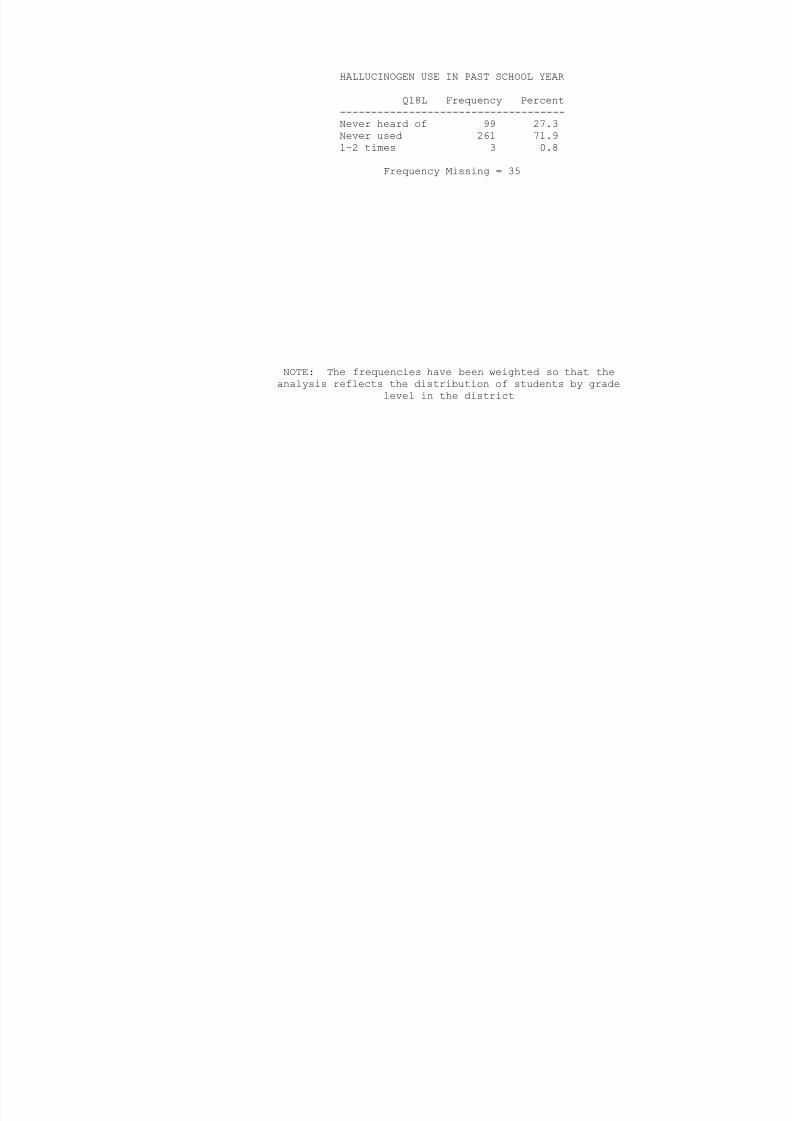
8/6/2019 la joya isd - 9th grade center - 1996 Texas School Survey of Drug and Alcohol Use
http://slidepdf.com/reader/full/la-joya-isd-9th-grade-center-1996-texas-school-survey-of-drug-and-alcohol 247/353
LA JOYA ISD - 9TH GRADE CENTERSPRING 1996
UPPER USE IN PAST SCHOOL YEAR
Q18M Frequency Percent------------------------------------Never heard of 103 29.3Never used 239 68.11-2 times 7 2.03-10 times 2 0.6
Frequency Missing = 47
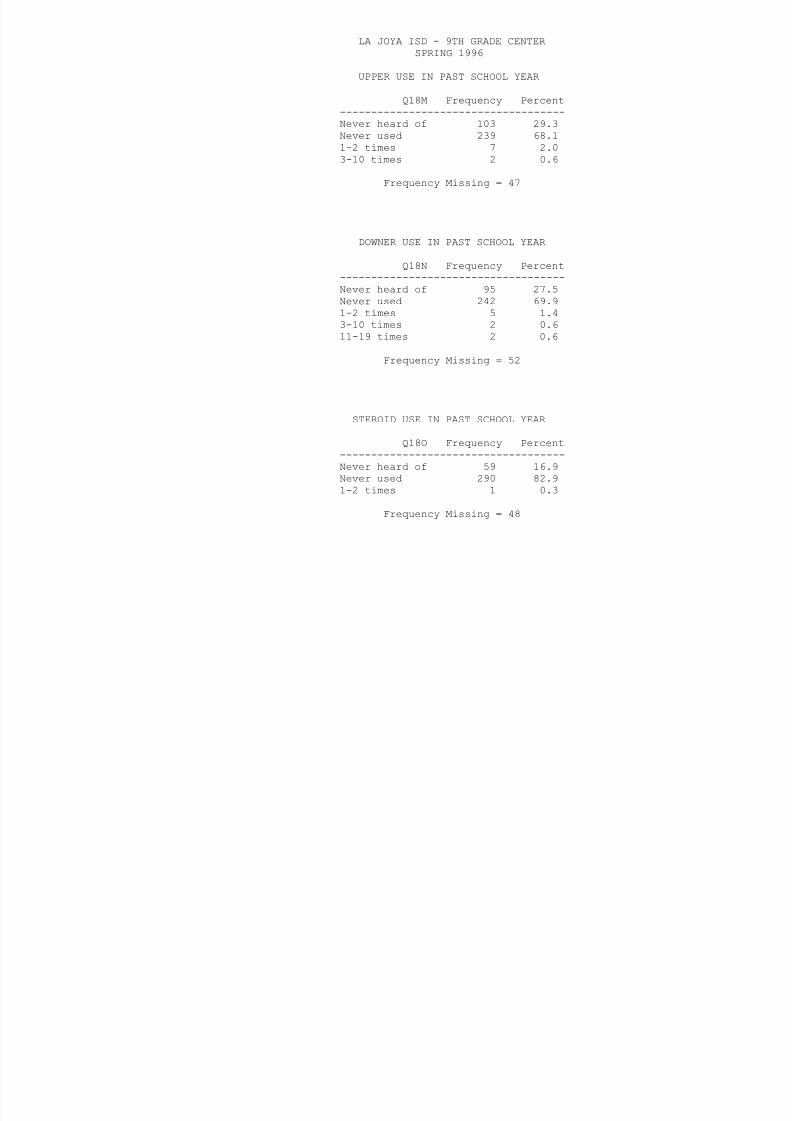
8/6/2019 la joya isd - 9th grade center - 1996 Texas School Survey of Drug and Alcohol Use
http://slidepdf.com/reader/full/la-joya-isd-9th-grade-center-1996-texas-school-survey-of-drug-and-alcohol 248/353
q y g
DOWNER USE IN PAST SCHOOL YEAR
Q18N Frequency Percent------------------------------------Never heard of 95 27.5Never used 242 69.9
1-2 times 5 1.43-10 times 2 0.611-19 times 2 0.6
Frequency Missing = 52
STEROID USE IN PAST SCHOOL YEAR
Q18O Frequency Percent
------------------------------------Never heard of 59 16.9Never used 290 82.91-2 times 1 0.3
Frequency Missing = 48
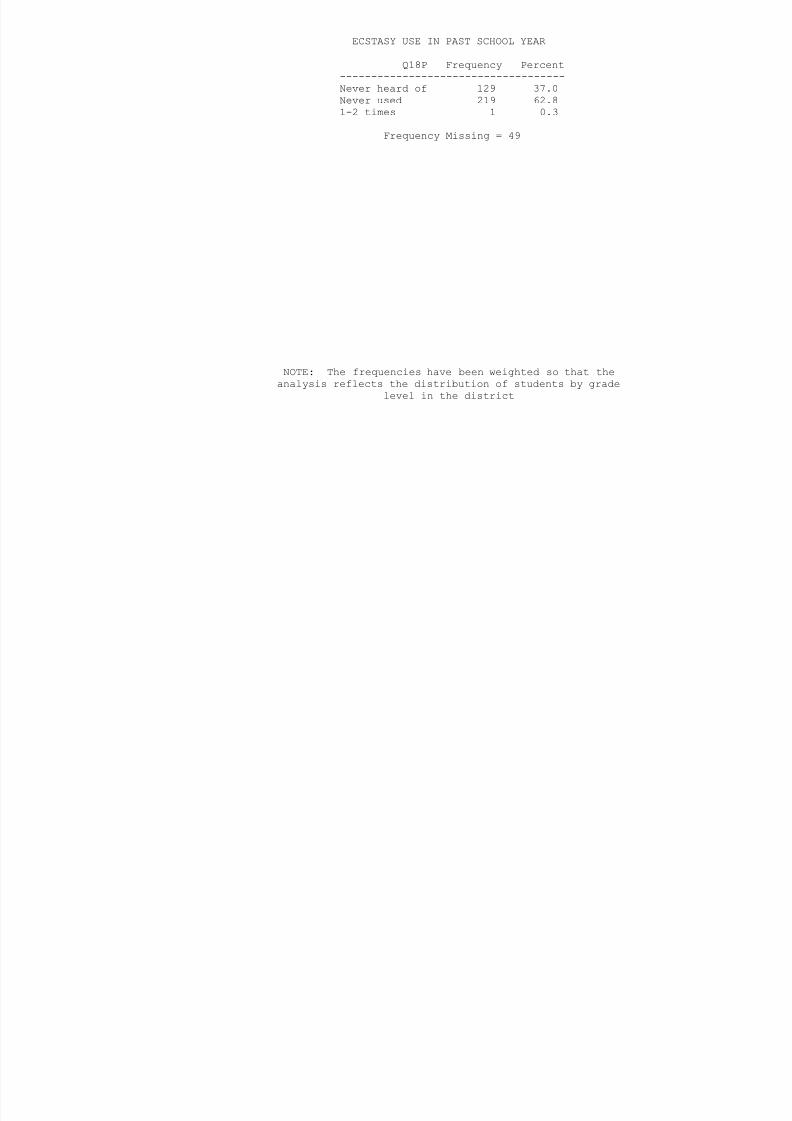
8/6/2019 la joya isd - 9th grade center - 1996 Texas School Survey of Drug and Alcohol Use
http://slidepdf.com/reader/full/la-joya-isd-9th-grade-center-1996-texas-school-survey-of-drug-and-alcohol 249/353
LA JOYA ISD - 9TH GRADE CENTERSPRING 1996
ROACH USE IN PAST SCHOOL YEAR
Q18Q Frequency Percent------------------------------------Never heard of 61 16.9Never used 278 77.01-2 times 17 4.73-10 times 3 0.811-19 times 1 0.3
20+ times 1 0.3

8/6/2019 la joya isd - 9th grade center - 1996 Texas School Survey of Drug and Alcohol Use
http://slidepdf.com/reader/full/la-joya-isd-9th-grade-center-1996-texas-school-survey-of-drug-and-alcohol 250/353
Frequency Missing = 37
CIGARETTE USE IN PAST 30 DAYS
Q19A Frequency Percent------------------------------------Never heard of 57 15.4Never used 256 69.21-2 times 32 8.63-10 times 14 3.811-19 times 4 1.120+ times 7 1.9
Frequency Missing = 28
SMOKELESS TOBACCO USE IN PAST 30 DAYS
Q19B Frequency Percent------------------------------------Never heard of 79 21.8Never used 273 75.41-2 times 4 1.13-10 times 5 1.411-19 times 1 0.3
Frequency Missing = 36
BEER USE IN PAST 30 DAYS
Q19C Frequency Percent------------------------------------Never heard of 48 13.2Never used 230 63.41-2 times 50 13.8
3-10 times 25 6.9

8/6/2019 la joya isd - 9th grade center - 1996 Texas School Survey of Drug and Alcohol Use
http://slidepdf.com/reader/full/la-joya-isd-9th-grade-center-1996-texas-school-survey-of-drug-and-alcohol 251/353
11-19 times 3 0.820+ times 7 1.9
Frequency Missing = 35
NOTE: The frequencies have been weighted so that theanalysis reflects the distribution of students by grade
level in the district
LA JOYA ISD - 9TH GRADE CENTERSPRING 1996
WINE COOLER USE IN PAST 30 DAYS
Q19D Frequency Percent------------------------------------Never heard of 58 16.2Never used 234 65.41-2 times 38 10.63-10 times 22 6.111-19 times 1 0.3
20+ times 5 1.4

8/6/2019 la joya isd - 9th grade center - 1996 Texas School Survey of Drug and Alcohol Use
http://slidepdf.com/reader/full/la-joya-isd-9th-grade-center-1996-texas-school-survey-of-drug-and-alcohol 252/353
Frequency Missing = 40
WINE USE IN PAST 30 DAYS
Q19E Frequency Percent------------------------------------Never heard of 54 15.1Never used 237 66.21-2 times 46 12.83-10 times 16 4.511-19 times 2 0.620+ times 3 0.8
Frequency Missing = 40
LIQUOR USE IN PAST 30 DAYS
Q19F Frequency Percent------------------------------------Never heard of 56 15.7Never used 250 70.21-2 times 31 8.73-10 times 13 3.711-19 times 2 0.620+ times 4 1.1
Frequency Missing = 42
INHALANT USE IN PAST 30 DAYS
Q19G Frequency Percent------------------------------------Never heard of 90 24.9Never used 263 72.9
1-2 times 6 1.711 19 ti 1 0 3

8/6/2019 la joya isd - 9th grade center - 1996 Texas School Survey of Drug and Alcohol Use
http://slidepdf.com/reader/full/la-joya-isd-9th-grade-center-1996-texas-school-survey-of-drug-and-alcohol 253/353
11-19 times 1 0.320+ times 1 0.3
Frequency Missing = 37
NOTE: The frequencies have been weighted so that theanalysis reflects the distribution of students by grade
level in the district
LA JOYA ISD - 9TH GRADE CENTERSPRING 1996
MARIJUANA USE IN PAST 30 DAYS
Q19H Frequency Percent------------------------------------Never heard of 70 20.1Never used 259 74.21-2 times 10 2.93-10 times 4 1.111-19 times 4 1.1
20+ times 2 0.6

8/6/2019 la joya isd - 9th grade center - 1996 Texas School Survey of Drug and Alcohol Use
http://slidepdf.com/reader/full/la-joya-isd-9th-grade-center-1996-texas-school-survey-of-drug-and-alcohol 254/353
Frequency Missing = 49
COCAINE USE IN PAST 30 DAYS
Q19I Frequency Percent------------------------------------Never heard of 84 23.5Never used 268 74.91-2 times 4 1.13-10 times 2 0.6
Frequency Missing = 40
CRACK USE IN PAST 30 DAYS
Q19J Frequency Percent------------------------------------Never heard of 89 25.5Never used 258 73.91-2 times 2 0.6
Frequency Missing = 49
HALLUCINOGEN USE IN PAST 30 DAYS
Q19L Frequency Percent------------------------------------Never heard of 130 37.0Never used 219 62.41-2 times 2 0.6
Frequency Missing = 47

8/6/2019 la joya isd - 9th grade center - 1996 Texas School Survey of Drug and Alcohol Use
http://slidepdf.com/reader/full/la-joya-isd-9th-grade-center-1996-texas-school-survey-of-drug-and-alcohol 255/353
UPPER USE IN PAST 30 DAYS
Q19M Frequency Percent------------------------------------Never heard of 131 37.8Never used 210 60.51-2 times 6 1.7
Frequency Missing = 51
NOTE: The frequencies have been weighted so that theanalysis reflects the distribution of students by grade
level in the district
LA JOYA ISD - 9TH GRADE CENTERSPRING 1996
DOWNER USE IN PAST 30 DAYS
Q19N Frequency Percent------------------------------------Never heard of 127 37.0Never used 211 61.51-2 times 4 1.23-10 times 1 0.3
Frequency Missing = 55

8/6/2019 la joya isd - 9th grade center - 1996 Texas School Survey of Drug and Alcohol Use
http://slidepdf.com/reader/full/la-joya-isd-9th-grade-center-1996-texas-school-survey-of-drug-and-alcohol 256/353
STEROID USE IN PAST 30 DAYS
Q19O Frequency Percent------------------------------------Never heard of 104 29.5Never used 248 70.5
Frequency Missing = 46
ECSTASY USE IN PAST 30 DAYS
Q19P Frequency Percent------------------------------------Never heard of 153 43.7Never used 196 56.0
1-2 times 1 0.3
Frequency Missing = 48
ROACH USE IN PAST 30 DAYS
Q19Q Frequency Percent
------------------------------------Never heard of 105 30.0Never used 233 66.61-2 times 10 2.93-10 times 2 0.6
Frequency Missing = 48
CLOSE FRIENDS USE CIGARETTES
Q20A Frequency Percent

8/6/2019 la joya isd - 9th grade center - 1996 Texas School Survey of Drug and Alcohol Use
http://slidepdf.com/reader/full/la-joya-isd-9th-grade-center-1996-texas-school-survey-of-drug-and-alcohol 257/353
Q20A Frequency Percent------------------------------------Never heard of 14 3.9None 129 35.5A few 108 29.8Some 67 18.5Most 29 8.0All 16 4.4
Frequency Missing = 35
NOTE: The frequencies have been weighted so that theanalysis reflects the distribution of students by grade
level in the district
LA JOYA ISD - 9TH GRADE CENTERSPRING 1996
CLOSE FRIENDS USE SMOKELESS TOBACCO
Q20B Frequency Percent------------------------------------Never heard of 20 5.7None 263 74.7A few 47 13.4Some 15 4.3Most 5 1.4
All 2 0.6

8/6/2019 la joya isd - 9th grade center - 1996 Texas School Survey of Drug and Alcohol Use
http://slidepdf.com/reader/full/la-joya-isd-9th-grade-center-1996-texas-school-survey-of-drug-and-alcohol 258/353
Frequency Missing = 46
CLOSE FRIENDS USE BEER
Q20C Frequency Percent------------------------------------Never heard of 12 3.4None 95 27.1A few 105 29.9Some 66 18.8Most 47 13.4All 26 7.4
Frequency Missing = 47
CLOSE FRIENDS USE WINE COOLERS
Q20D Frequency Percent------------------------------------Never heard of 19 5.6None 118 34.5A few 100 29.2Some 58 17.0Most 26 7.6All 21 6.1
Frequency Missing = 56
CLOSE FRIENDS USE WINE
Q20E Frequency Percent------------------------------------Never heard of 12 3.6None 138 40.8
A few 103 30.5Some 44 13.0

8/6/2019 la joya isd - 9th grade center - 1996 Texas School Survey of Drug and Alcohol Use
http://slidepdf.com/reader/full/la-joya-isd-9th-grade-center-1996-texas-school-survey-of-drug-and-alcohol 259/353
Some 44 13.0Most 25 7.4All 16 4.7
Frequency Missing = 60
NOTE: The frequencies have been weighted so that theanalysis reflects the distribution of students by grade
level in the district

8/6/2019 la joya isd - 9th grade center - 1996 Texas School Survey of Drug and Alcohol Use
http://slidepdf.com/reader/full/la-joya-isd-9th-grade-center-1996-texas-school-survey-of-drug-and-alcohol 260/353
Frequency Missing = 55
CLOSE FRIENDS USE COCAINE
Q20I Frequency Percent------------------------------------Never heard of 22 6.5None 227 67.2
A few 51 15.1Some 24 7.1

8/6/2019 la joya isd - 9th grade center - 1996 Texas School Survey of Drug and Alcohol Use
http://slidepdf.com/reader/full/la-joya-isd-9th-grade-center-1996-texas-school-survey-of-drug-and-alcohol 261/353
Most 11 3.3All 3 0.9
Frequency Missing = 60
NOTE: The frequencies have been weighted so that theanalysis reflects the distribution of students by grade
level in the district
LA JOYA ISD - 9TH GRADE CENTERSPRING 1996
CLOSE FRIENDS USE CRACK
Q20J Frequency Percent------------------------------------Never heard of 26 8.0None 238 72.8A few 44 13.5Some 10 3.1Most 8 2.4
All 1 0.3
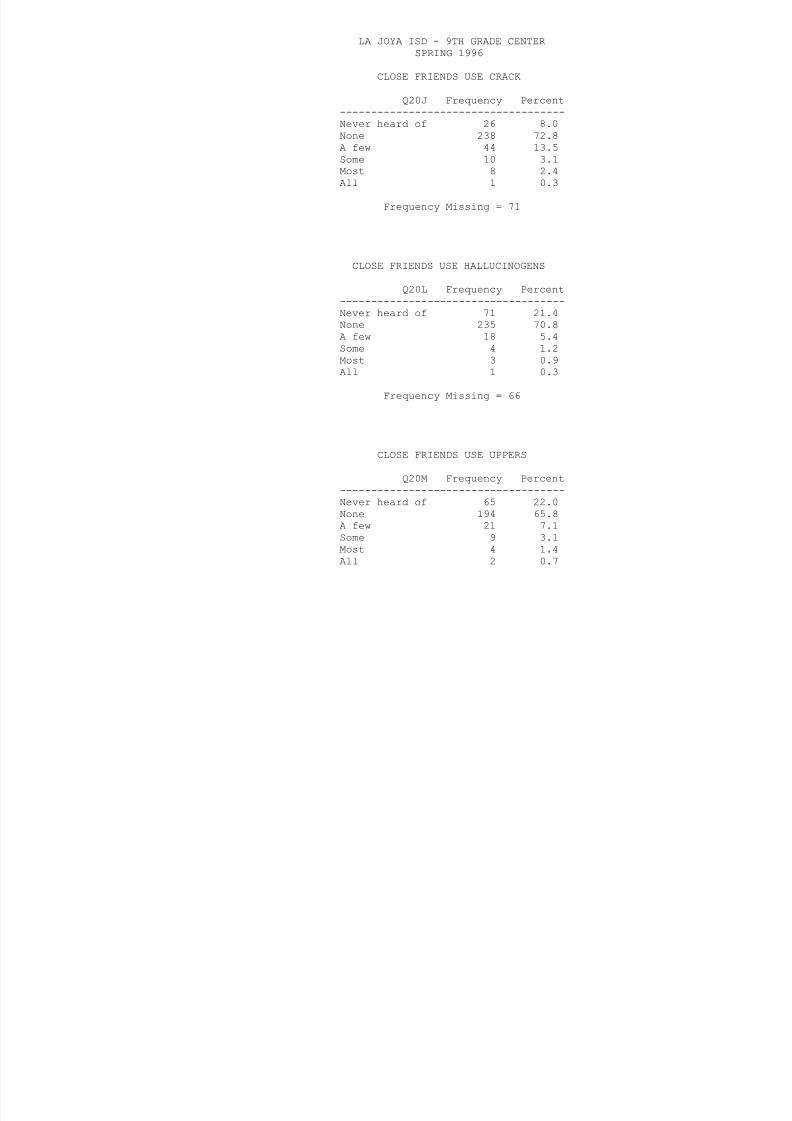
8/6/2019 la joya isd - 9th grade center - 1996 Texas School Survey of Drug and Alcohol Use
http://slidepdf.com/reader/full/la-joya-isd-9th-grade-center-1996-texas-school-survey-of-drug-and-alcohol 262/353
Frequency Missing = 71
CLOSE FRIENDS USE HALLUCINOGENS
Q20L Frequency Percent------------------------------------Never heard of 71 21.4None 235 70.8A few 18 5.4Some 4 1.2Most 3 0.9All 1 0.3
Frequency Missing = 66
CLOSE FRIENDS USE UPPERS
Q20M Frequency Percent------------------------------------Never heard of 65 22.0None 194 65.8A few 21 7.1Some 9 3.1Most 4 1.4All 2 0.7
Frequency Missing = 103
CLOSE FRIENDS USE DOWNERS
Q20N Frequency Percent------------------------------------Never heard of 70 23.1None 193 63.7
A few 27 8.9Some 9 3.0

8/6/2019 la joya isd - 9th grade center - 1996 Texas School Survey of Drug and Alcohol Use
http://slidepdf.com/reader/full/la-joya-isd-9th-grade-center-1996-texas-school-survey-of-drug-and-alcohol 263/353
Most 3 1.0All 1 0.3
Frequency Missing = 95
NOTE: The frequencies have been weighted so that theanalysis reflects the distribution of students by grade
level in the district
LA JOYA ISD - 9TH GRADE CENTERSPRING 1996
CLOSE FRIENDS USE STEROIDS
Q20O Frequency Percent------------------------------------Never heard of 44 14.2None 228 73.8A few 29 9.4Some 5 1.6Most 3 1.0
Frequency Missing = 89
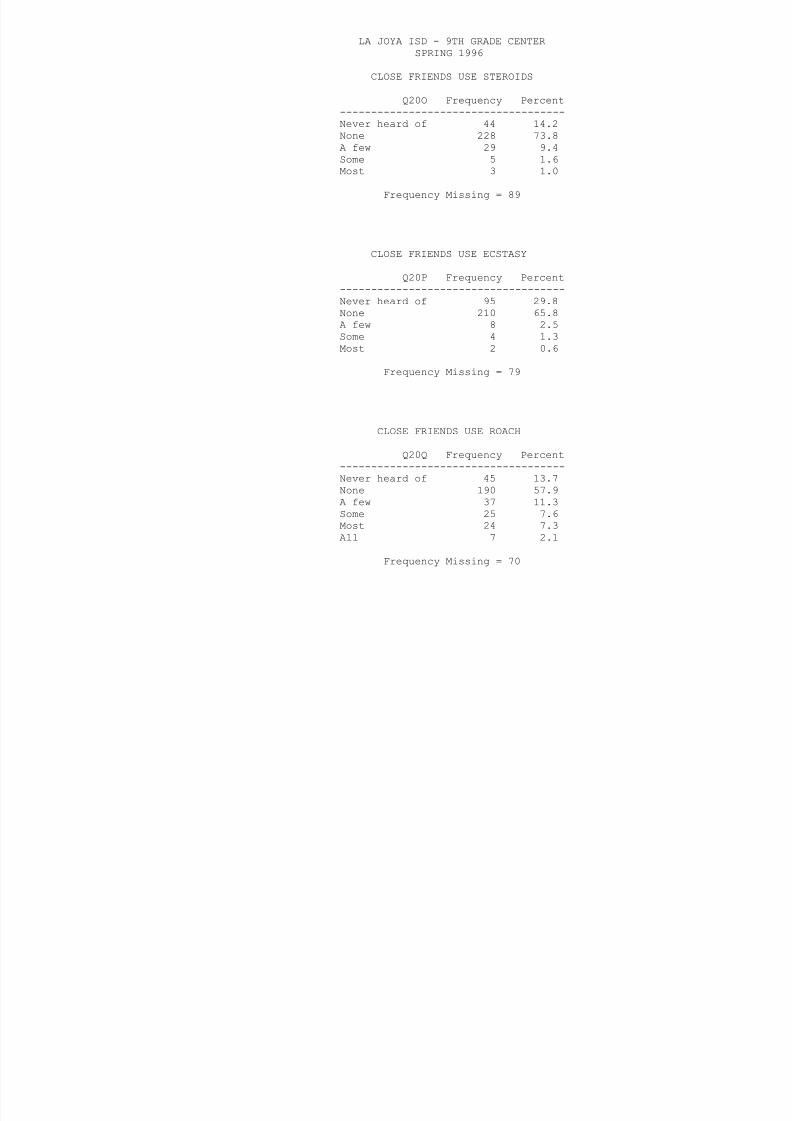
8/6/2019 la joya isd - 9th grade center - 1996 Texas School Survey of Drug and Alcohol Use
http://slidepdf.com/reader/full/la-joya-isd-9th-grade-center-1996-texas-school-survey-of-drug-and-alcohol 264/353
CLOSE FRIENDS USE ECSTASY
Q20P Frequency Percent------------------------------------Never heard of 95 29.8None 210 65.8
A few 8 2.5Some 4 1.3Most 2 0.6
Frequency Missing = 79
CLOSE FRIENDS USE ROACH
Q20Q Frequency Percent------------------------------------Never heard of 45 13.7None 190 57.9A few 37 11.3Some 25 7.6Most 24 7.3All 7 2.1
Frequency Missing = 70
AGE WHEN FIRST USED CIGARETTES
Q21A Frequency Percent-----------------------------------Never used it 210 58.0<9 years old 22 6.110 years old 14 3.911 years old 14 3.9
12 years old 17 4.713 years old 43 11.9
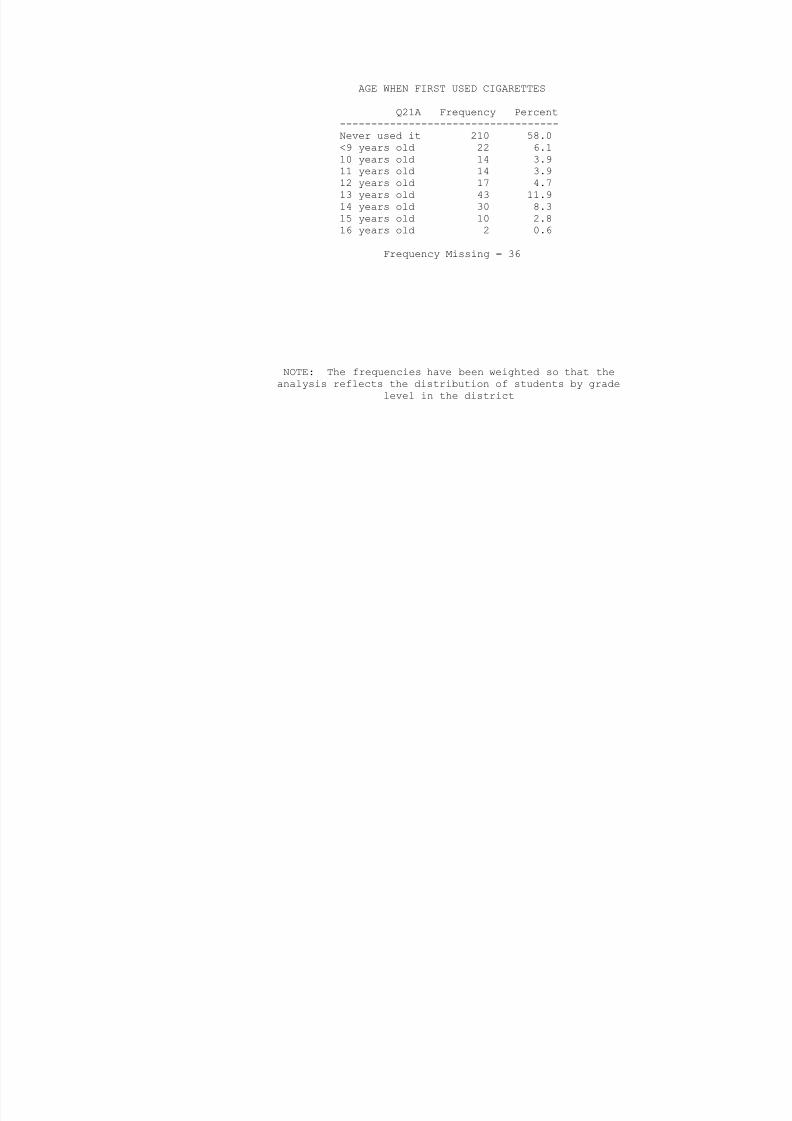
8/6/2019 la joya isd - 9th grade center - 1996 Texas School Survey of Drug and Alcohol Use
http://slidepdf.com/reader/full/la-joya-isd-9th-grade-center-1996-texas-school-survey-of-drug-and-alcohol 265/353
14 years old 30 8.315 years old 10 2.816 years old 2 0.6
Frequency Missing = 36
NOTE: The frequencies have been weighted so that theanalysis reflects the distribution of students by grade
level in the district
LA JOYA ISD - 9TH GRADE CENTERSPRING 1996
AGE WHEN FIRST USED SMOKELESS TOBACCO
Q21B Frequency Percent-----------------------------------10 years old 3 9.111 years old 3 9.112 years old 3 9.113 years old 10 30.314 years old 7 21.2
15 years old 5 15.216 years old 1 3.0
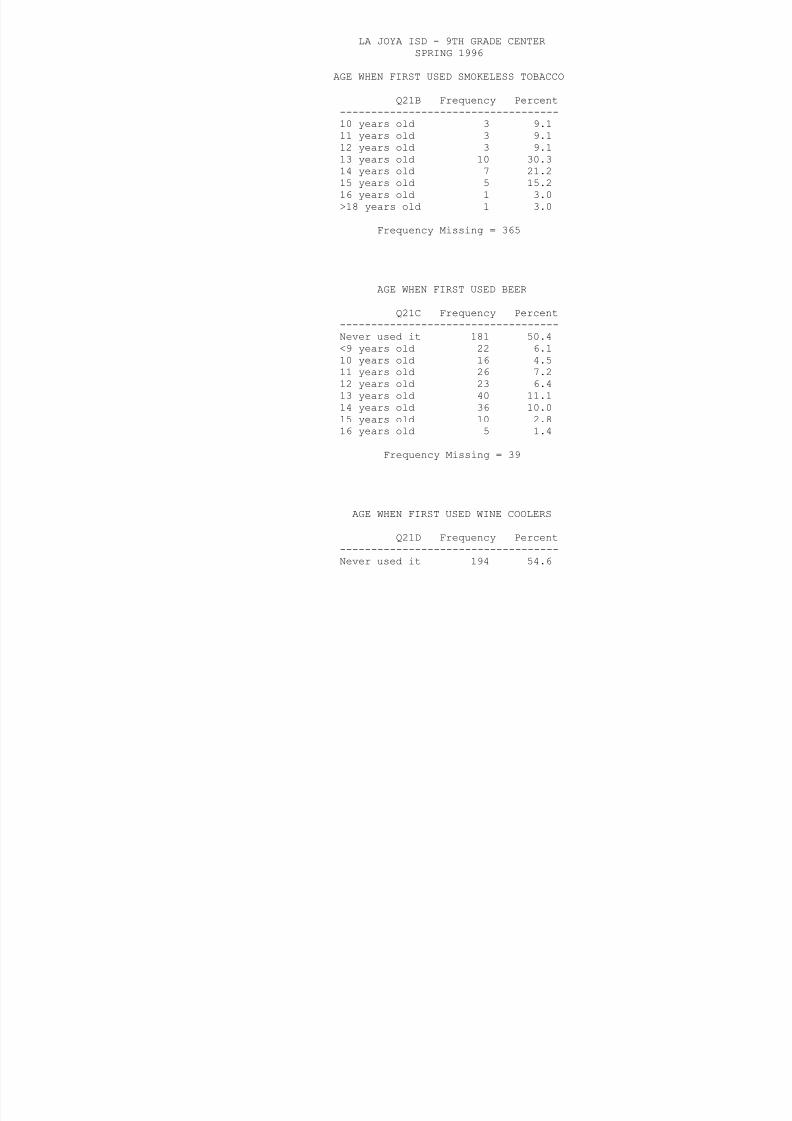
8/6/2019 la joya isd - 9th grade center - 1996 Texas School Survey of Drug and Alcohol Use
http://slidepdf.com/reader/full/la-joya-isd-9th-grade-center-1996-texas-school-survey-of-drug-and-alcohol 266/353
>18 years old 1 3.0
Frequency Missing = 365
AGE WHEN FIRST USED BEER
Q21C Frequency Percent
-----------------------------------Never used it 181 50.4<9 years old 22 6.110 years old 16 4.511 years old 26 7.212 years old 23 6.413 years old 40 11.114 years old 36 10.015 years old 10 2.816 years old 5 1.4
Frequency Missing = 39
AGE WHEN FIRST USED WINE COOLERS
Q21D Frequency Percent-----------------------------------Never used it 194 54.6
<9 years old 5 1.410 years old 8 2.311 years old 17 4.812 years old 13 3.713 years old 57 16.114 years old 39 11.015 years old 16 4.516 years old 6 1.7
Frequency Missing = 43

8/6/2019 la joya isd - 9th grade center - 1996 Texas School Survey of Drug and Alcohol Use
http://slidepdf.com/reader/full/la-joya-isd-9th-grade-center-1996-texas-school-survey-of-drug-and-alcohol 267/353
NOTE: The frequencies have been weighted so that theanalysis reflects the distribution of students by grade
level in the district
LA JOYA ISD - 9TH GRADE CENTERSPRING 1996
AGE WHEN FIRST USED WINE
Q21E Frequency Percent-----------------------------------Never used it 210 59.8<9 years old 6 1.710 years old 3 0.911 years old 13 3.712 years old 13 3.7
13 years old 43 12.314 years old 38 10.815 ld 21 6 0

8/6/2019 la joya isd - 9th grade center - 1996 Texas School Survey of Drug and Alcohol Use
http://slidepdf.com/reader/full/la-joya-isd-9th-grade-center-1996-texas-school-survey-of-drug-and-alcohol 268/353
15 years old 21 6.016 years old 4 1.1
Frequency Missing = 47
AGE WHEN FIRST USED LIQUOR
Q21F Frequency Percent-----------------------------------Never used it 249 71.3<9 years old 4 1.110 years old 4 1.111 years old 13 3.712 years old 7 2.013 years old 30 8.614 years old 25 7.215 years old 13 3.716 years old 4 1.1
Frequency Missing = 49
AGE WHEN FIRST USED INHALANTS
Q21G Frequency Percent-----------------------------------
Never used it 324 93.4<9 years old 2 0.611 years old 3 0.912 years old 5 1.413 years old 2 0.614 years old 11 3.2
Frequency Missing = 51

8/6/2019 la joya isd - 9th grade center - 1996 Texas School Survey of Drug and Alcohol Use
http://slidepdf.com/reader/full/la-joya-isd-9th-grade-center-1996-texas-school-survey-of-drug-and-alcohol 269/353
NOTE: The frequencies have been weighted so that theanalysis reflects the distribution of students by grade
level in the district
LA JOYA ISD - 9TH GRADE CENTERSPRING 1996
AGE WHEN FIRST USED MARIJUANA
Q21H Frequency Percent-----------------------------------Never used it 295 85.0<9 years old 1 0.310 years old 5 1.411 years old 2 0.612 years old 6 1.7
13 years old 13 3.714 years old 12 3.515 ea s old 11 3 2

8/6/2019 la joya isd - 9th grade center - 1996 Texas School Survey of Drug and Alcohol Use
http://slidepdf.com/reader/full/la-joya-isd-9th-grade-center-1996-texas-school-survey-of-drug-and-alcohol 270/353
15 years old 11 3.216 years old 2 0.6
Frequency Missing = 51
AGE WHEN FIRST USED COCAINE
Q21I Frequency Percent-----------------------------------Never used it 331 96.213 years old 3 0.914 years old 8 2.315 years old 1 0.316 years old 1 0.3
Frequency Missing = 54
AGE WHEN FIRST USED CRACK
Q21J Frequency Percent-----------------------------------Never used it 340 98.011 years old 1 0.314 years old 4 1.215 years old 1 0.3
16 years old 1 0.3
Frequency Missing = 51
AGE WHEN FIRST USED HALLUCINOGENS
Q21L Frequency Percent-----------------------------------Never used it 339 98.3
13 years old 2 0.614 years old 2 0.615 years old 2 0 6

8/6/2019 la joya isd - 9th grade center - 1996 Texas School Survey of Drug and Alcohol Use
http://slidepdf.com/reader/full/la-joya-isd-9th-grade-center-1996-texas-school-survey-of-drug-and-alcohol 271/353
15 years old 2 0.6
Frequency Missing = 53
NOTE: The frequencies have been weighted so that theanalysis reflects the distribution of students by grade
level in the district
LA JOYA ISD - 9TH GRADE CENTERSPRING 1996
AGE WHEN FIRST USED UPPERS
Q21M Frequency Percent-----------------------------------Never used it 331 97.113 years old 2 0.614 years old 5 1.515 years old 3 0.9
Frequency Missing = 57

8/6/2019 la joya isd - 9th grade center - 1996 Texas School Survey of Drug and Alcohol Use
http://slidepdf.com/reader/full/la-joya-isd-9th-grade-center-1996-texas-school-survey-of-drug-and-alcohol 272/353
AGE WHEN FIRST USED DOWNERS
Q21N Frequency Percent-----------------------------------Never used it 330 97.312 years old 1 0.313 years old 2 0.6
14 years old 3 0.915 years old 3 0.9
Frequency Missing = 59
AGE WHEN FIRST USED STEROIDS
Q21O Frequency Percent-----------------------------------Never used it 339 99.1<9 years old 1 0.310 years old 1 0.314 years old 1 0.3
Frequency Missing = 56
AGE WHEN FIRST USED ECSTASY
Q21P Frequency Percent-----------------------------------Never used it 341 99.112 years old 1 0.313 years old 1 0.315 years old 1 0.3
Frequency Missing = 54

8/6/2019 la joya isd - 9th grade center - 1996 Texas School Survey of Drug and Alcohol Use
http://slidepdf.com/reader/full/la-joya-isd-9th-grade-center-1996-texas-school-survey-of-drug-and-alcohol 273/353
NOTE: The frequencies have been weighted so that theanalysis reflects the distribution of students by grade
level in the district
LA JOYA ISD - 9TH GRADE CENTERSPRING 1996
AGE WHEN FIRST USED ROACH
Q21Q Frequency Percent-----------------------------------Never used it 312 90.412 years old 7 2.013 years old 5 1.414 years old 15 4.315 years old 5 1.4
16 years old 1 0.3
Frequency Missing = 53
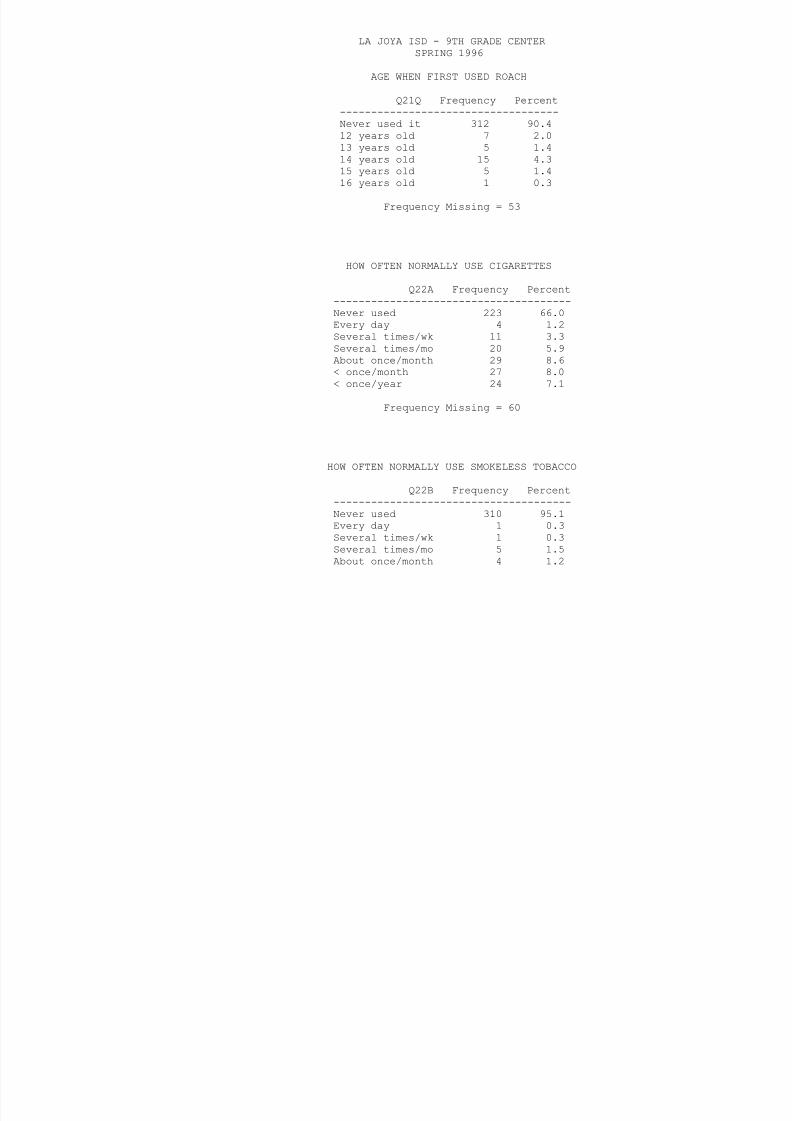
8/6/2019 la joya isd - 9th grade center - 1996 Texas School Survey of Drug and Alcohol Use
http://slidepdf.com/reader/full/la-joya-isd-9th-grade-center-1996-texas-school-survey-of-drug-and-alcohol 274/353
Frequency Missing 53
HOW OFTEN NORMALLY USE CIGARETTES
Q22A Frequency Percent--------------------------------------Never used 223 66.0
Every day 4 1.2Several times/wk 11 3.3Several times/mo 20 5.9About once/month 29 8.6< once/month 27 8.0< once/year 24 7.1
Frequency Missing = 60
HOW OFTEN NORMALLY USE SMOKELESS TOBACCO
Q22B Frequency Percent--------------------------------------Never used 310 95.1Every day 1 0.3Several times/wk 1 0.3Several times/mo 5 1.5About once/month 4 1.2
< once/month 3 0.9< once/year 2 0.6
Frequency Missing = 72
HOW OFTEN NORMALLY USE BEER
Q22C Frequency Percent--------------------------------------
Never used 195 58.0Every day 1 0.3Several times/wk 19 5.7

8/6/2019 la joya isd - 9th grade center - 1996 Texas School Survey of Drug and Alcohol Use
http://slidepdf.com/reader/full/la-joya-isd-9th-grade-center-1996-texas-school-survey-of-drug-and-alcohol 275/353
Several times/wk 19 5.7Several times/mo 36 10.7About once/month 27 8.0< once/month 29 8.6< once/year 29 8.6
Frequency Missing = 62
NOTE: The frequencies have been weighted so that theanalysis reflects the distribution of students by grade
level in the district
LA JOYA ISD - 9TH GRADE CENTERSPRING 1996
HOW OFTEN NORMALLY USE WINE COOLERS
Q22D Frequency Percent--------------------------------------Never used 205 62.3Every day 2 0.6Several times/wk 12 3.6Several times/mo 31 9.4About once/month 22 6.7
< once/month 33 10.0< once/year 24 7.3

8/6/2019 la joya isd - 9th grade center - 1996 Texas School Survey of Drug and Alcohol Use
http://slidepdf.com/reader/full/la-joya-isd-9th-grade-center-1996-texas-school-survey-of-drug-and-alcohol 276/353
Frequency Missing = 69
HOW OFTEN NORMALLY USE WINE
Q22E Frequency Percent--------------------------------------
Never used 213 65.7Every day 1 0.3Several times/wk 11 3.4Several times/mo 19 5.9About once/month 17 5.2< once/month 34 10.5< once/year 29 9.0
Frequency Missing = 74
HOW OFTEN NORMALLY USE LIQUOR
Q22F Frequency Percent--------------------------------------Never used 237 71.6Several times/wk 11 3.3Several times/mo 20 6.0About once/month 17 5.1
< once/month 30 9.1< once/year 16 4.8
Frequency Missing = 67
HOW OFTEN NORMALLY USE INHALANTS
Q22G Frequency Percent--------------------------------------
Never used 313 94.8Several times/wk 1 0.3Several times/mo 2 0.6
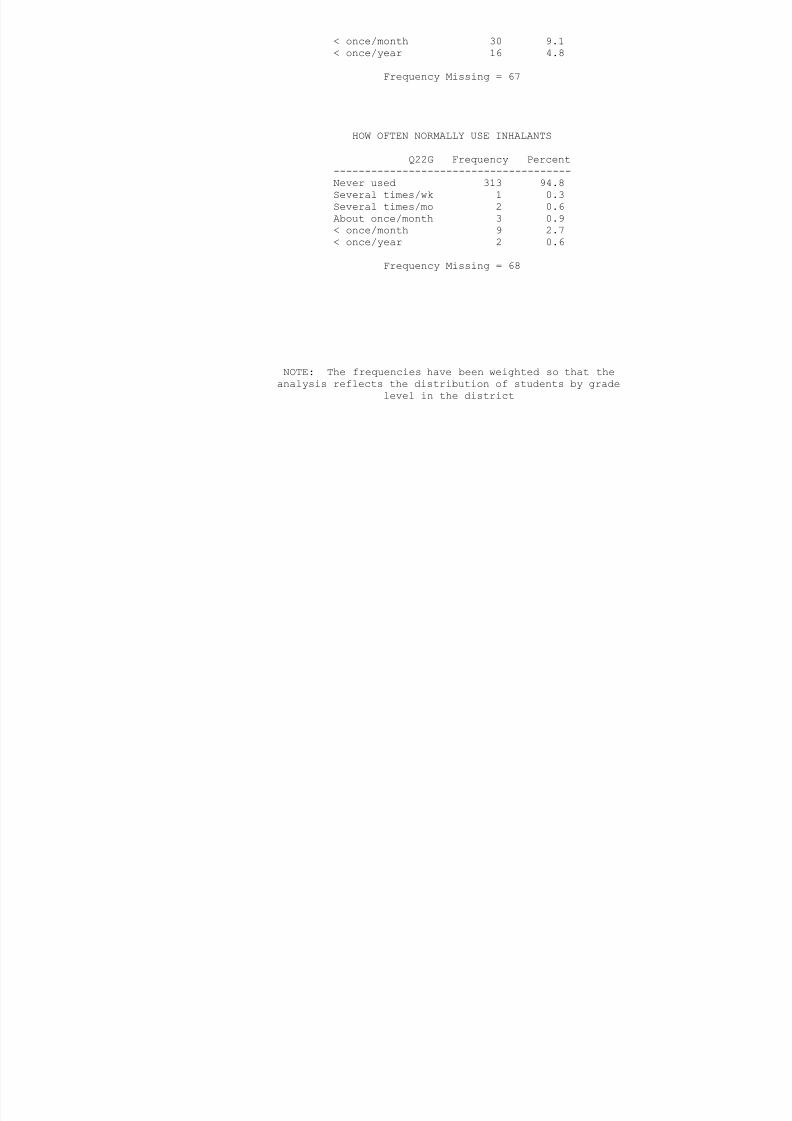
8/6/2019 la joya isd - 9th grade center - 1996 Texas School Survey of Drug and Alcohol Use
http://slidepdf.com/reader/full/la-joya-isd-9th-grade-center-1996-texas-school-survey-of-drug-and-alcohol 277/353
/About once/month 3 0.9< once/month 9 2.7< once/year 2 0.6
Frequency Missing = 68
NOTE: The frequencies have been weighted so that theanalysis reflects the distribution of students by grade
level in the district
LA JOYA ISD - 9TH GRADE CENTERSPRING 1996
HOW OFTEN NORMALLY USE MARIJUANA
Q22H Frequency Percent--------------------------------------Never used 279 87.7Every day 3 0.9Several times/wk 4 1.3Several times/mo 3 0.9About once/month 8 2.5
< once/month 9 2.8< once/year 12 3.8
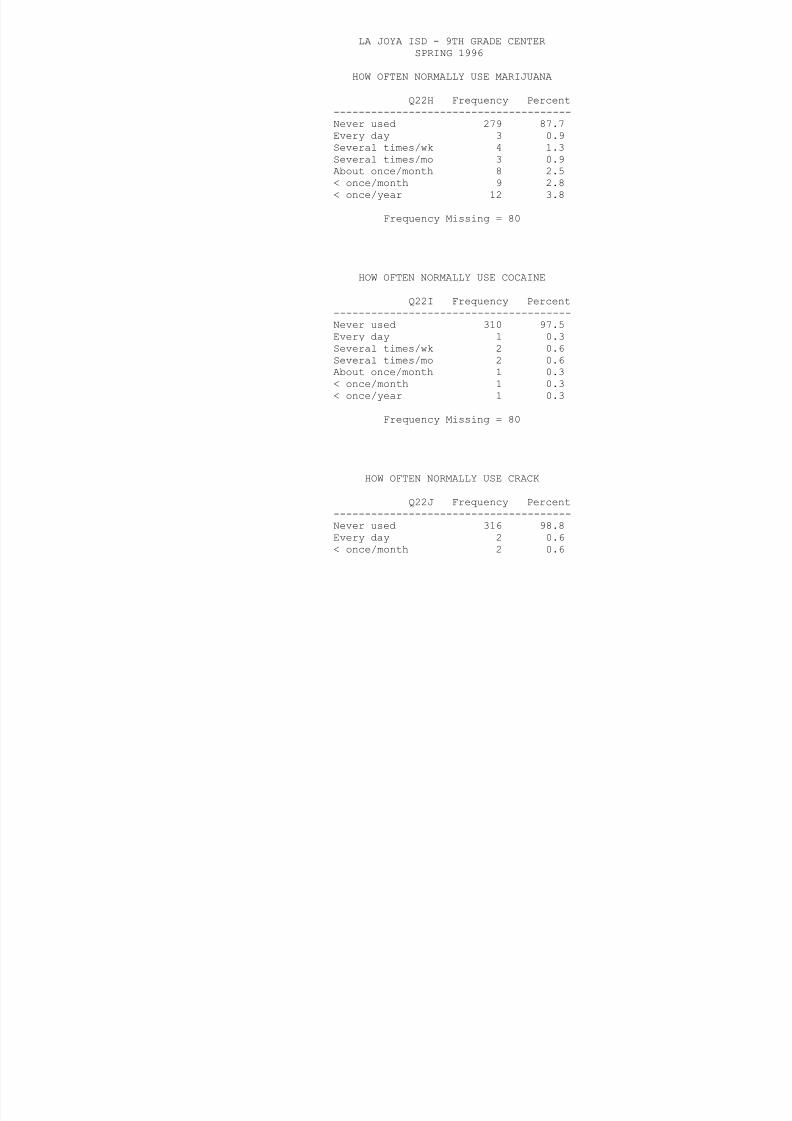
8/6/2019 la joya isd - 9th grade center - 1996 Texas School Survey of Drug and Alcohol Use
http://slidepdf.com/reader/full/la-joya-isd-9th-grade-center-1996-texas-school-survey-of-drug-and-alcohol 278/353
Frequency Missing = 80
HOW OFTEN NORMALLY USE COCAINE
Q22I Frequency Percent--------------------------------------
Never used 310 97.5Every day 1 0.3Several times/wk 2 0.6Several times/mo 2 0.6About once/month 1 0.3< once/month 1 0.3< once/year 1 0.3
Frequency Missing = 80
HOW OFTEN NORMALLY USE CRACK
Q22J Frequency Percent--------------------------------------Never used 316 98.8Every day 2 0.6< once/month 2 0.6
Frequency Missing = 78
HOW OFTEN NORMALLY USE HALLUCINOGENS
Q22L Frequency Percent--------------------------------------Never used 319 98.8About once/month 1 0.3< once/month 1 0.3
< once/year 2 0.6
Frequency Missing = 75
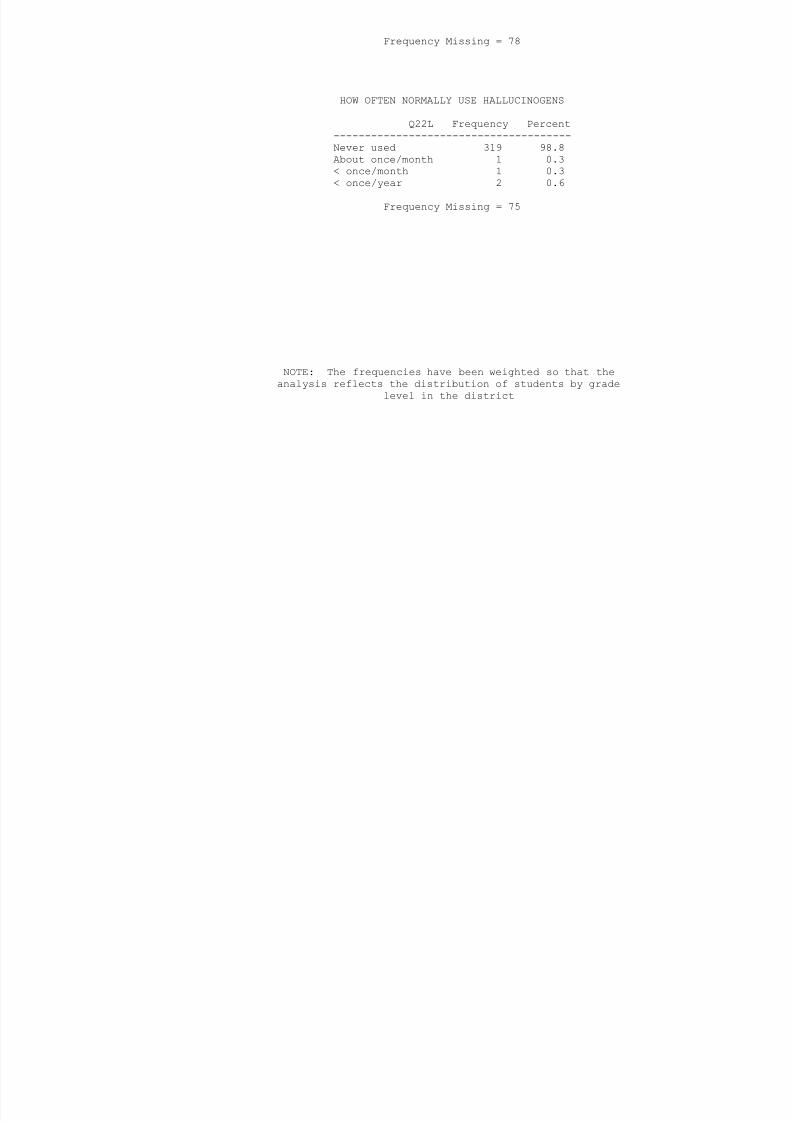
8/6/2019 la joya isd - 9th grade center - 1996 Texas School Survey of Drug and Alcohol Use
http://slidepdf.com/reader/full/la-joya-isd-9th-grade-center-1996-texas-school-survey-of-drug-and-alcohol 279/353
NOTE: The frequencies have been weighted so that theanalysis reflects the distribution of students by grade
level in the district
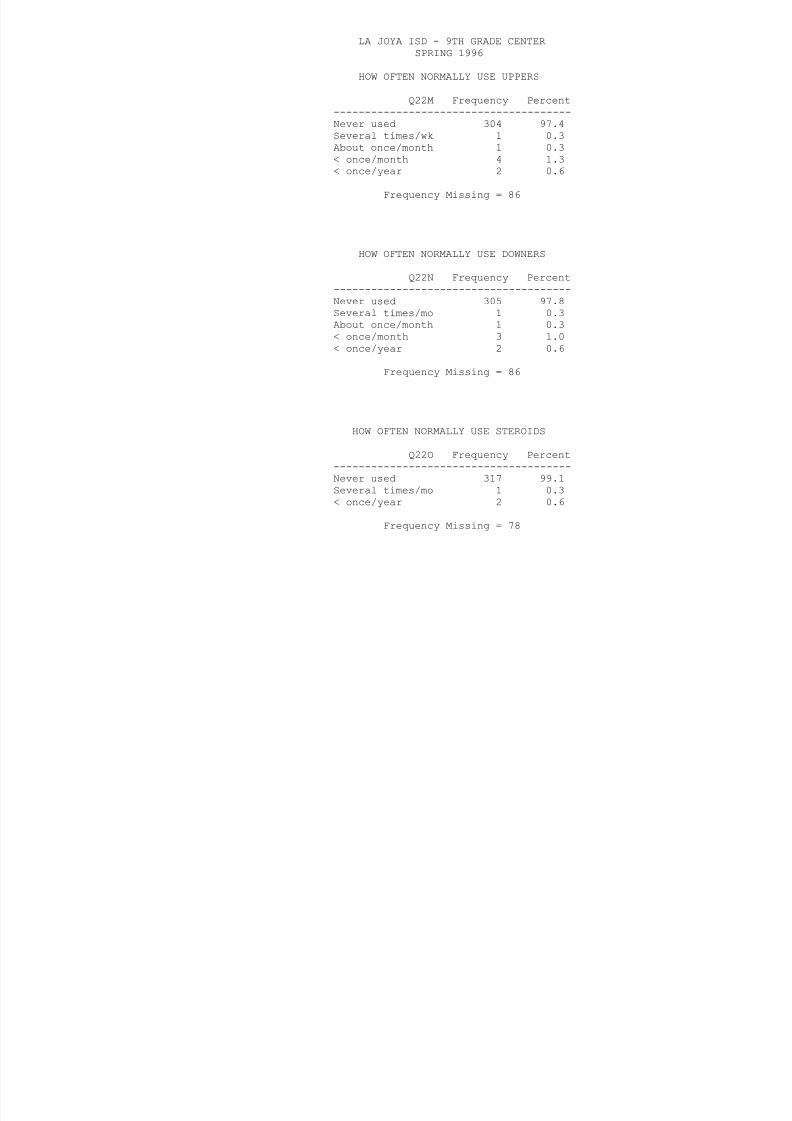
8/6/2019 la joya isd - 9th grade center - 1996 Texas School Survey of Drug and Alcohol Use
http://slidepdf.com/reader/full/la-joya-isd-9th-grade-center-1996-texas-school-survey-of-drug-and-alcohol 280/353
HOW OFTEN NORMALLY USE ECSTASY
Q22P Frequency Percent--------------------------------------Never used 312 99.4Several times/mo 1 0.3< once/month 1 0.3
Frequency Missing = 84

8/6/2019 la joya isd - 9th grade center - 1996 Texas School Survey of Drug and Alcohol Use
http://slidepdf.com/reader/full/la-joya-isd-9th-grade-center-1996-texas-school-survey-of-drug-and-alcohol 281/353
NOTE: The frequencies have been weighted so that theanalysis reflects the distribution of students by grade
level in the district
LA JOYA ISD - 9TH GRADE CENTERSPRING 1996
HOW OFTEN NORMALLY USE ROACH
Q22Q Frequency Percent--------------------------------------Never used 298 92.3Every day 2 0.6Several times/wk 3 0.9Several times/mo 3 0.9About once/month 4 1.2
< once/month 5 1.5< once/year 8 2.5

8/6/2019 la joya isd - 9th grade center - 1996 Texas School Survey of Drug and Alcohol Use
http://slidepdf.com/reader/full/la-joya-isd-9th-grade-center-1996-texas-school-survey-of-drug-and-alcohol 282/353
Frequency Missing = 75
DIFFICULT TO GET CIGARETTES
Q23A Frequency Percent------------------------------------
Never heard of 42 12.6Impossible 69 20.7Very difficult 22 6.6Somewhat diff 31 9.3Somewhat easy 52 15.6Very easy 117 35.1
Frequency Missing = 65
DIFFICULT TO GET SMOKELESS TOBACCO
Q23B Frequency Percent------------------------------------Never heard of 68 21.7Impossible 106 33.9Very difficult 31 9.9Somewhat diff 28 8.9Somewhat easy 35 11.2
Very easy 45 14.4
Frequency Missing = 85
DIFFICULT TO GET BEER
Q23C Frequency Percent------------------------------------Never heard of 34 10.7
Impossible 56 17.6Very difficult 22 6.9Somewhat diff 42 13.2
8 18 2
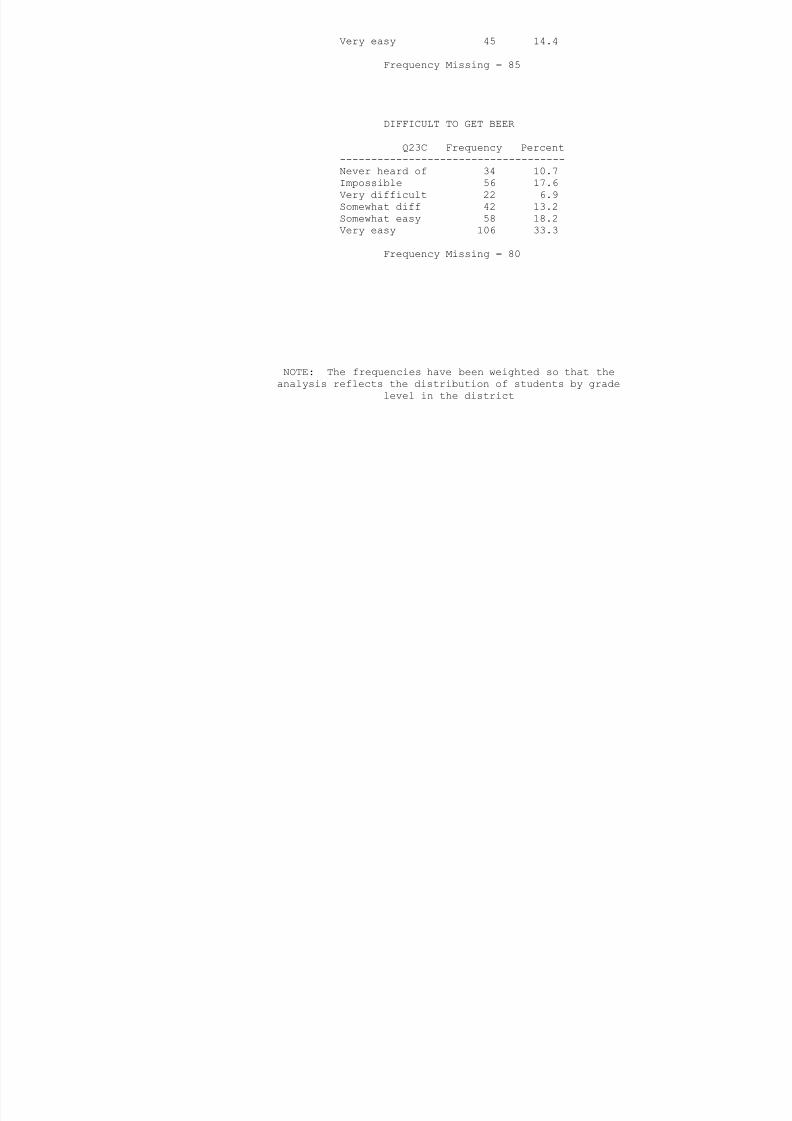
8/6/2019 la joya isd - 9th grade center - 1996 Texas School Survey of Drug and Alcohol Use
http://slidepdf.com/reader/full/la-joya-isd-9th-grade-center-1996-texas-school-survey-of-drug-and-alcohol 283/353
Somewhat easy 58 18.2Very easy 106 33.3
Frequency Missing = 80
NOTE: The frequencies have been weighted so that theanalysis reflects the distribution of students by grade
level in the district
LA JOYA ISD - 9TH GRADE CENTERSPRING 1996
DIFFICULT TO GET WINE COOLERS
Q23D Frequency Percent------------------------------------Never heard of 45 14.1Impossible 65 20.3Very difficult 22 6.9Somewhat diff 34 10.6Somewhat easy 56 17.5
Very easy 98 30.6
Frequency Missing = 78
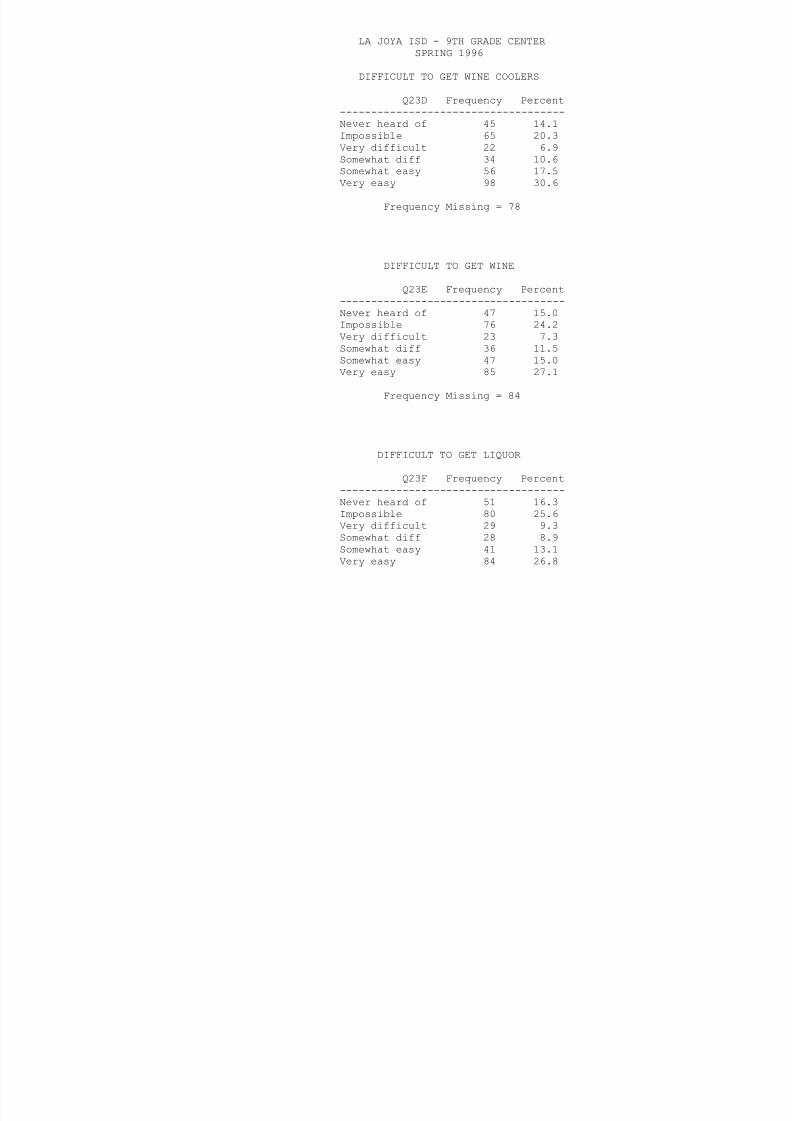
8/6/2019 la joya isd - 9th grade center - 1996 Texas School Survey of Drug and Alcohol Use
http://slidepdf.com/reader/full/la-joya-isd-9th-grade-center-1996-texas-school-survey-of-drug-and-alcohol 284/353
DIFFICULT TO GET WINE
Q23E Frequency Percent------------------------------------Never heard of 47 15.0
Impossible 76 24.2Very difficult 23 7.3Somewhat diff 36 11.5Somewhat easy 47 15.0Very easy 85 27.1
Frequency Missing = 84
DIFFICULT TO GET LIQUOR
Q23F Frequency Percent------------------------------------Never heard of 51 16.3Impossible 80 25.6Very difficult 29 9.3Somewhat diff 28 8.9Somewhat easy 41 13.1Very easy 84 26.8
Frequency Missing = 85
DIFFICULT TO GET INHALANTS
Q23G Frequency Percent------------------------------------Never heard of 79 24.9Impossible 98 30.9
Very difficult 13 4.1Somewhat diff 15 4.7Somewhat easy 24 7.6V 88 27 8

8/6/2019 la joya isd - 9th grade center - 1996 Texas School Survey of Drug and Alcohol Use
http://slidepdf.com/reader/full/la-joya-isd-9th-grade-center-1996-texas-school-survey-of-drug-and-alcohol 285/353
Very easy 88 27.8
Frequency Missing = 81
NOTE: The frequencies have been weighted so that theanalysis reflects the distribution of students by grade
level in the district
LA JOYA ISD - 9TH GRADE CENTERSPRING 1996
DIFFICULT TO GET MARIJUANA
Q23H Frequency Percent------------------------------------Never heard of 60 19.4Impossible 114 36.9Very difficult 28 9.1Somewhat diff 28 9.1Somewhat easy 21 6.8
Very easy 58 18.8
Frequency Missing = 89

8/6/2019 la joya isd - 9th grade center - 1996 Texas School Survey of Drug and Alcohol Use
http://slidepdf.com/reader/full/la-joya-isd-9th-grade-center-1996-texas-school-survey-of-drug-and-alcohol 286/353
DIFFICULT TO GET COCAINE
Q23I Frequency Percent------------------------------------Never heard of 66 21.2
Impossible 127 40.8Very difficult 32 10.3Somewhat diff 24 7.7Somewhat easy 24 7.7Very easy 38 12.2
Frequency Missing = 87
DIFFICULT TO GET CRACK
Q23J Frequency Percent------------------------------------Never heard of 73 23.7Impossible 135 43.8Very difficult 31 10.1Somewhat diff 25 8.1Somewhat easy 15 4.9Very easy 29 9.4
Frequency Missing = 90
DIFFICULT TO GET HALLUCINOGENS
Q23L Frequency Percent------------------------------------Never heard of 111 35.7Impossible 123 39.5
Very difficult 27 8.7Somewhat diff 20 6.4Somewhat easy 10 3.2Very easy 20 6 4

8/6/2019 la joya isd - 9th grade center - 1996 Texas School Survey of Drug and Alcohol Use
http://slidepdf.com/reader/full/la-joya-isd-9th-grade-center-1996-texas-school-survey-of-drug-and-alcohol 287/353
Very easy 20 6.4
Frequency Missing = 87
NOTE: The frequencies have been weighted so that theanalysis reflects the distribution of students by grade
level in the district
LA JOYA ISD - 9TH GRADE CENTERSPRING 1996
DIFFICULT TO GET UPPERS
Q23M Frequency Percent------------------------------------Never heard of 115 37.7Impossible 108 35.4Very difficult 22 7.2Somewhat diff 18 5.9Somewhat easy 15 4.9
Very easy 27 8.9
Frequency Missing = 93
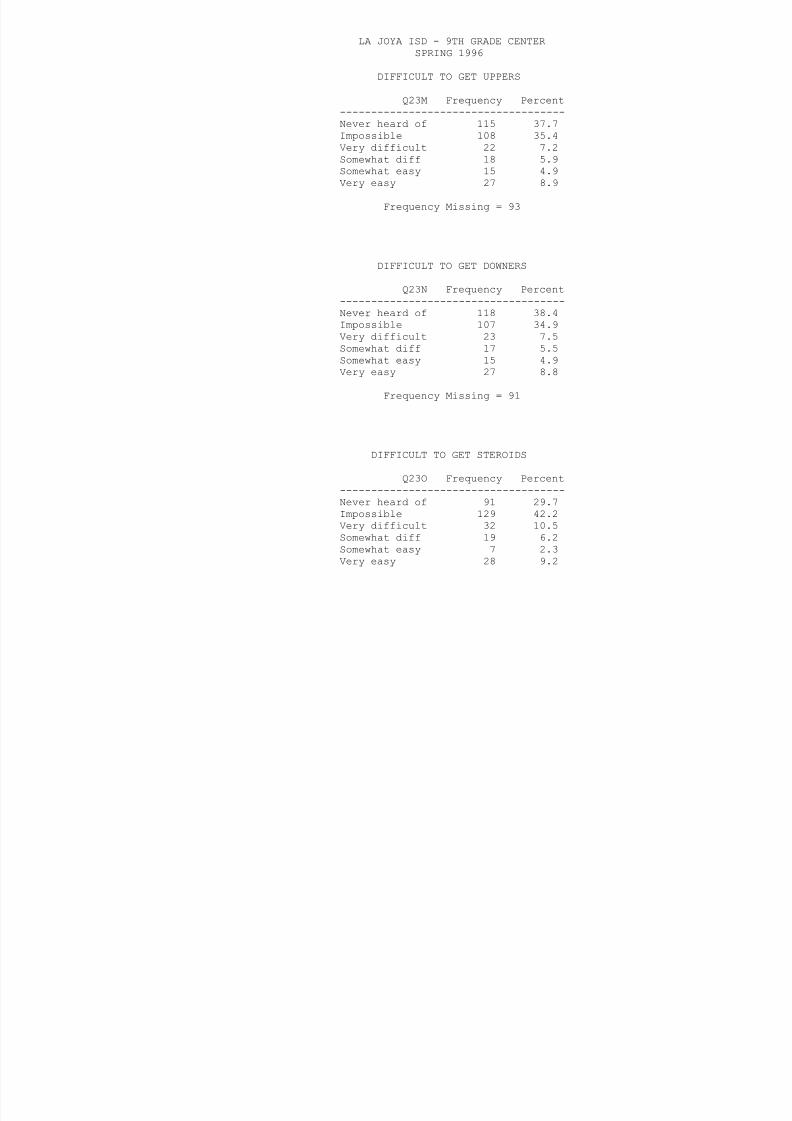
8/6/2019 la joya isd - 9th grade center - 1996 Texas School Survey of Drug and Alcohol Use
http://slidepdf.com/reader/full/la-joya-isd-9th-grade-center-1996-texas-school-survey-of-drug-and-alcohol 288/353
DIFFICULT TO GET DOWNERS
Q23N Frequency Percent------------------------------------Never heard of 118 38.4
Impossible 107 34.9Very difficult 23 7.5Somewhat diff 17 5.5Somewhat easy 15 4.9Very easy 27 8.8
Frequency Missing = 91
DIFFICULT TO GET STEROIDS
Q23O Frequency Percent------------------------------------Never heard of 91 29.7Impossible 129 42.2Very difficult 32 10.5Somewhat diff 19 6.2Somewhat easy 7 2.3Very easy 28 9.2

8/6/2019 la joya isd - 9th grade center - 1996 Texas School Survey of Drug and Alcohol Use
http://slidepdf.com/reader/full/la-joya-isd-9th-grade-center-1996-texas-school-survey-of-drug-and-alcohol 289/353
LA JOYA ISD - 9TH GRADE CENTER
SPRING 1996
DIFFICULT TO GET ROACH
Q23Q Frequency Percent------------------------------------Never heard of 84 27.0Impossible 113 36.3Very difficult 21 6.8Somewhat diff 15 4.8Somewhat easy 27 8.7
Very easy 51 16.4
Frequency Missing = 87

8/6/2019 la joya isd - 9th grade center - 1996 Texas School Survey of Drug and Alcohol Use
http://slidepdf.com/reader/full/la-joya-isd-9th-grade-center-1996-texas-school-survey-of-drug-and-alcohol 290/353
NEVER HEARD OF CIGARETTES
Q24A1 Frequency Percent------------------------------Agree 22 5.5
Disagree 376 94.5
NEVER USE CIGARETTES
Q24A2 Frequency Percent------------------------------Agree 194 48.7Disagree 204 51.3
NORMALLY USE CIGARETTES BEFORE SCHOOL
Q24A3 Frequency Percent---------------------------Yes 5 1.3No 393 98.7
NORMALLY USE CIGARETTES DURING SCHOOL
Q24A4 Frequency Percent---------------------------Yes 4 1.0No 394 99.0
NORMALLY USE CIGARETTES AFTER SCHOOL

8/6/2019 la joya isd - 9th grade center - 1996 Texas School Survey of Drug and Alcohol Use
http://slidepdf.com/reader/full/la-joya-isd-9th-grade-center-1996-texas-school-survey-of-drug-and-alcohol 291/353
Q24A5 Frequency Percent---------------------------Yes 21 5.3No 377 94.7
NOTE: The frequencies have been weighted so that theanalysis reflects the distribution of students by grade
level in the district
LA JOYA ISD - 9TH GRADE CENTER
SPRING 1996
NORMALLY USE CIGARETTES ON WEEKENDS
Q24A6 Frequency Percent---------------------------Yes 86 21.6No 312 78.4
NEVER HEARD OF SMOKELESS TOBACCO
Q24B1 Frequency Percent

8/6/2019 la joya isd - 9th grade center - 1996 Texas School Survey of Drug and Alcohol Use
http://slidepdf.com/reader/full/la-joya-isd-9th-grade-center-1996-texas-school-survey-of-drug-and-alcohol 292/353
Q q y------------------------------Agree 42 10.6Disagree 356 89.4
NEVER USE SMOKELESS TOBACCO
Q24B2 Frequency Percent------------------------------Agree 250 62.8Disagree 148 37.2
USE SMOKELESS TOBACCO BEFORE SCHOOL
Q24B3 Frequency Percent
---------------------------Yes 2 0.5No 396 99.5
USE SMOKELESS TOBACCO DURING SCHOOL
Q24B4 Frequency Percent
---------------------------Yes 2 0.5No 396 99.5
USE SMOKELESS TOBACCO AFTER SCHOOL
Q24B5 Frequency Percent---------------------------
Yes 2 0.5No 396 99.5

8/6/2019 la joya isd - 9th grade center - 1996 Texas School Survey of Drug and Alcohol Use
http://slidepdf.com/reader/full/la-joya-isd-9th-grade-center-1996-texas-school-survey-of-drug-and-alcohol 293/353
NOTE: The frequencies have been weighted so that theanalysis reflects the distribution of students by grade
level in the district
LA JOYA ISD - 9TH GRADE CENTER
SPRING 1996
USE SMOKELESS TOBACCO ON WEEKENDS
Q24B6 Frequency Percent---------------------------Yes 12 3.0No 386 97.0
NEVER HEARD OF BEER
Q24C1 Frequency Percent

8/6/2019 la joya isd - 9th grade center - 1996 Texas School Survey of Drug and Alcohol Use
http://slidepdf.com/reader/full/la-joya-isd-9th-grade-center-1996-texas-school-survey-of-drug-and-alcohol 294/353
------------------------------Agree 21 5.3Disagree 377 94.7
NEVER USE BEER
Q24C2 Frequency Percent------------------------------Agree 162 40.7Disagree 236 59.3
NORMALLY USE BEER BEFORE SCHOOL
Q24C3 Frequency Percent
---------------------------Yes 4 1.0No 394 99.0
NORMALLY USE BEER DURING SCHOOL
Q24C4 Frequency Percent
---------------------------Yes 2 0.5No 396 99.5
NORMALLY USE BEER AFTER SCHOOL
Q24C5 Frequency Percent---------------------------Yes 10 2.5No 388 97.5

8/6/2019 la joya isd - 9th grade center - 1996 Texas School Survey of Drug and Alcohol Use
http://slidepdf.com/reader/full/la-joya-isd-9th-grade-center-1996-texas-school-survey-of-drug-and-alcohol 295/353
NOTE: The frequencies have been weighted so that theanalysis reflects the distribution of students by grade
level in the district
LA JOYA ISD - 9TH GRADE CENTER
SPRING 1996
NORMALLY USE BEER ON WEEKENDS
Q24C6 Frequency Percent---------------------------Yes 115 28.9No 283 71.1
NEVER HEARD OF WINE COOLERS
Q24D1 Frequency Percent
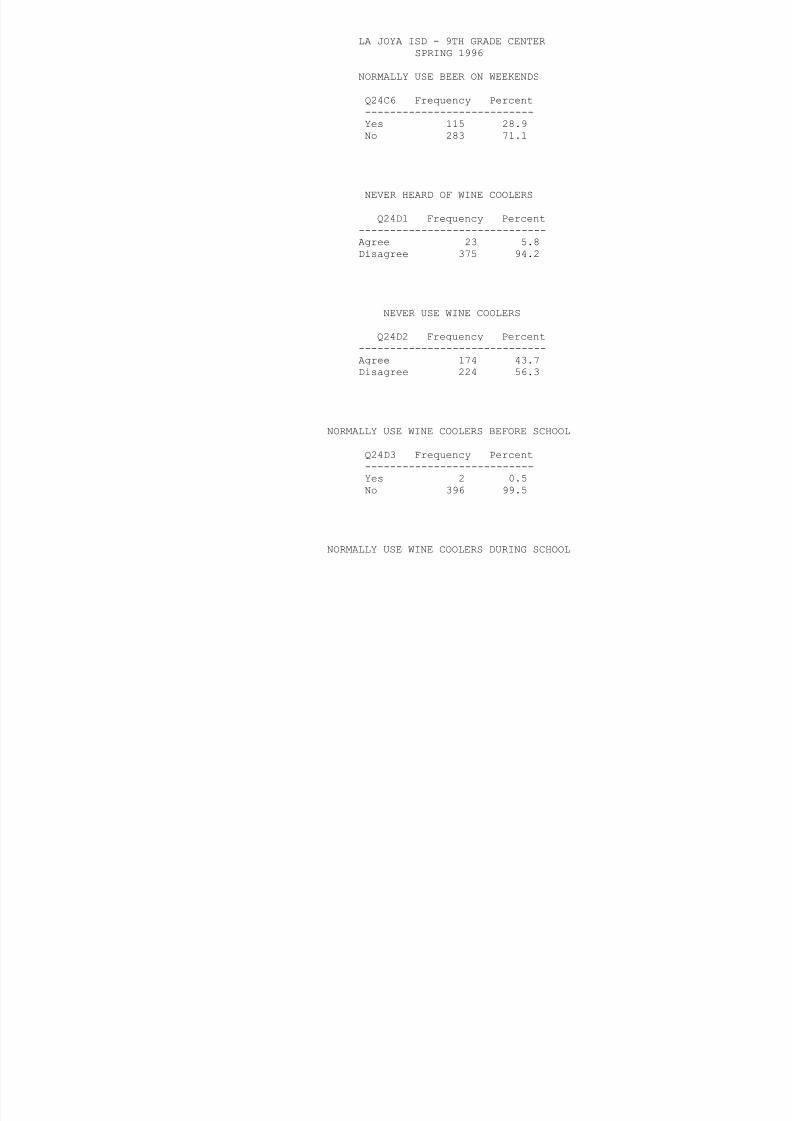
8/6/2019 la joya isd - 9th grade center - 1996 Texas School Survey of Drug and Alcohol Use
http://slidepdf.com/reader/full/la-joya-isd-9th-grade-center-1996-texas-school-survey-of-drug-and-alcohol 296/353
------------------------------Agree 23 5.8Disagree 375 94.2
NEVER USE WINE COOLERS
Q24D2 Frequency Percent------------------------------Agree 174 43.7Disagree 224 56.3
NORMALLY USE WINE COOLERS BEFORE SCHOOL
Q24D3 Frequency Percent
---------------------------Yes 2 0.5No 396 99.5
NORMALLY USE WINE COOLERS DURING SCHOOL
Q24D4 Frequency Percent
---------------------------Yes 3 0.8No 395 99.2
NORMALLY USE WINE COOLERS AFTER SCHOOL
Q24D5 Frequency Percent---------------------------Yes 10 2.5No 388 97.5

8/6/2019 la joya isd - 9th grade center - 1996 Texas School Survey of Drug and Alcohol Use
http://slidepdf.com/reader/full/la-joya-isd-9th-grade-center-1996-texas-school-survey-of-drug-and-alcohol 297/353
NOTE: The frequencies have been weighted so that theanalysis reflects the distribution of students by grade
level in the district
LA JOYA ISD - 9TH GRADE CENTER
SPRING 1996
NORMALLY USE WINE COOLERS ON WEEKENDS
Q24D6 Frequency Percent---------------------------Yes 103 25.9No 295 74.1
NEVER HEARD OF WINE
Q24E1 Frequency Percent

8/6/2019 la joya isd - 9th grade center - 1996 Texas School Survey of Drug and Alcohol Use
http://slidepdf.com/reader/full/la-joya-isd-9th-grade-center-1996-texas-school-survey-of-drug-and-alcohol 298/353
------------------------------Agree 23 5.8Disagree 375 94.2
NEVER USE WINE
Q24E2 Frequency Percent------------------------------Agree 185 46.5Disagree 213 53.5
NORMALLY USE WINE BEFORE SCHOOL
Q24E3 Frequency Percent
---------------------------Yes 2 0.5No 396 99.5
NORMALLY USE WINE DURING SCHOOL
Q24E4 Frequency Percent
---------------------------Yes 2 0.5No 396 99.5
NORMALLY USE WINE AFTER SCHOOL
Q24E5 Frequency Percent---------------------------Yes 6 1.5No 392 98.5

8/6/2019 la joya isd - 9th grade center - 1996 Texas School Survey of Drug and Alcohol Use
http://slidepdf.com/reader/full/la-joya-isd-9th-grade-center-1996-texas-school-survey-of-drug-and-alcohol 299/353
NOTE: The frequencies have been weighted so that theanalysis reflects the distribution of students by grade
level in the district

8/6/2019 la joya isd - 9th grade center - 1996 Texas School Survey of Drug and Alcohol Use
http://slidepdf.com/reader/full/la-joya-isd-9th-grade-center-1996-texas-school-survey-of-drug-and-alcohol 300/353
Q24F4 Frequency Percent
---------------------------Yes 2 0.5No 396 99.5
NORMALLY USE LIQUOR AFTER SCHOOL
Q24F5 Frequency Percent---------------------------Yes 8 2.0No 390 98.0

8/6/2019 la joya isd - 9th grade center - 1996 Texas School Survey of Drug and Alcohol Use
http://slidepdf.com/reader/full/la-joya-isd-9th-grade-center-1996-texas-school-survey-of-drug-and-alcohol 301/353
NOTE: The frequencies have been weighted so that theanalysis reflects the distribution of students by grade
level in the district
LA JOYA ISD - 9TH GRADE CENTER
SPRING 1996
NORMALLY USE LIQUOR ON WEEKENDS
Q24F6 Frequency Percent---------------------------Yes 76 19.1No 322 80.9
NEVER HEARD OF INHALANTS
Q24G1 Frequency Percent

8/6/2019 la joya isd - 9th grade center - 1996 Texas School Survey of Drug and Alcohol Use
http://slidepdf.com/reader/full/la-joya-isd-9th-grade-center-1996-texas-school-survey-of-drug-and-alcohol 302/353
------------------------------Agree 56 14.1Disagree 342 85.9
NEVER USE INHALANTS
Q24G2 Frequency Percent------------------------------Agree 227 57.0Disagree 171 43.0
NORMALLY USE INHALANTS BEFORE SCHOOL
Q24G3 Frequency Percent
---------------------------Yes 2 0.5No 396 99.5
NORMALLY USE INHALANTS DURING SCHOOL
Q24G4 Frequency Percent
---------------------------Yes 6 1.5No 392 98.5
NORMALLY USE INHALANTS AFTER SCHOOL
Q24G5 Frequency Percent---------------------------Yes 10 2.5No 388 97.5

8/6/2019 la joya isd - 9th grade center - 1996 Texas School Survey of Drug and Alcohol Use
http://slidepdf.com/reader/full/la-joya-isd-9th-grade-center-1996-texas-school-survey-of-drug-and-alcohol 303/353
NOTE: The frequencies have been weighted so that theanalysis reflects the distribution of students by grade
level in the district
LA JOYA ISD - 9TH GRADE CENTER
SPRING 1996
NORMALLY USE INHALANTS ON WEEKENDS
Q24G6 Frequency Percent---------------------------Yes 5 1.3No 393 98.7
NEVER HEARD OF MARIJUANA
Q24H1 Frequency Percent------------------------------

8/6/2019 la joya isd - 9th grade center - 1996 Texas School Survey of Drug and Alcohol Use
http://slidepdf.com/reader/full/la-joya-isd-9th-grade-center-1996-texas-school-survey-of-drug-and-alcohol 304/353
Agree 32 8.0Disagree 366 92.0
NEVER USE MARIJUANA
Q24H2 Frequency Percent------------------------------Agree 238 59.8Disagree 160 40.2
NORMALLY USE MARIJUANA BEFORE SCHOOL
Q24H3 Frequency Percent
---------------------------Yes 4 1.0No 394 99.0
NORMALLY USE MARIJUANA DURING SCHOOL
Q24H4 Frequency Percent
---------------------------Yes 3 0.8No 395 99.2
NORMALLY USE MARIJUANA AFTER SCHOOL
Q24H5 Frequency Percent---------------------------Yes 5 1.3No 393 98.7

8/6/2019 la joya isd - 9th grade center - 1996 Texas School Survey of Drug and Alcohol Use
http://slidepdf.com/reader/full/la-joya-isd-9th-grade-center-1996-texas-school-survey-of-drug-and-alcohol 305/353
NOTE: The frequencies have been weighted so that theanalysis reflects the distribution of students by grade
level in the district
LA JOYA ISD - 9TH GRADE CENTER
SPRING 1996
NORMALLY USE MARIJUANA ON WEEKENDS
Q24H6 Frequency Percent---------------------------Yes 23 5.8No 375 94.2
NEVER HEARD OF COCAINE
Q24I1 Frequency Percent------------------------------

8/6/2019 la joya isd - 9th grade center - 1996 Texas School Survey of Drug and Alcohol Use
http://slidepdf.com/reader/full/la-joya-isd-9th-grade-center-1996-texas-school-survey-of-drug-and-alcohol 306/353
Agree 45 11.3Disagree 353 88.7
NEVER USE COCAINE
Q24I2 Frequency Percent------------------------------Agree 248 62.3Disagree 150 37.7
NORMALLY USE COCAINE BEFORE SCHOOL
Q24I3 Frequency Percent
---------------------------Yes 3 0.8No 395 99.2
NORMALLY USE COCAINE DURING SCHOOL
Q24I4 Frequency Percent
---------------------------Yes 3 0.8No 395 99.2
NORMALLY USE COCAINE AFTER SCHOOL
Q24I5 Frequency Percent---------------------------Yes 1 0.3No 397 99.7

8/6/2019 la joya isd - 9th grade center - 1996 Texas School Survey of Drug and Alcohol Use
http://slidepdf.com/reader/full/la-joya-isd-9th-grade-center-1996-texas-school-survey-of-drug-and-alcohol 307/353
NOTE: The frequencies have been weighted so that theanalysis reflects the distribution of students by grade
level in the district
LA JOYA ISD - 9TH GRADE CENTER
SPRING 1996
NORMALLY USE COCAINE ON WEEKENDS
Q24I6 Frequency Percent---------------------------Yes 2 0.5No 396 99.5
NEVER HEARD OF CRACK
Q24J1 Frequency Percent------------------------------

8/6/2019 la joya isd - 9th grade center - 1996 Texas School Survey of Drug and Alcohol Use
http://slidepdf.com/reader/full/la-joya-isd-9th-grade-center-1996-texas-school-survey-of-drug-and-alcohol 308/353
Agree 56 14.1Disagree 342 85.9
NEVER USE CRACK
Q24J2 Frequency Percent------------------------------Agree 240 60.3Disagree 158 39.7
NORMALLY USE CRACK BEFORE SCHOOL
Q24J3 Frequency Percent
---------------------------Yes 1 0.3No 397 99.7
NORMALLY USE CRACK DURING SCHOOL
Q24J4 Frequency Percent
---------------------------Yes 1 0.3No 397 99.7
NORMALLY USE CRACK AFTER SCHOOL
Q24J5 Frequency Percent---------------------------No 398 100.0

8/6/2019 la joya isd - 9th grade center - 1996 Texas School Survey of Drug and Alcohol Use
http://slidepdf.com/reader/full/la-joya-isd-9th-grade-center-1996-texas-school-survey-of-drug-and-alcohol 309/353
NOTE: The frequencies have been weighted so that theanalysis reflects the distribution of students by grade
level in the district
LA JOYA ISD - 9TH GRADE CENTER
SPRING 1996
NORMALLY USE CRACK ON WEEKENDS
Q24J6 Frequency Percent---------------------------Yes 4 1.0No 394 99.0
NEVER HEARD OF HALLUCINOGENS
Q24L1 Frequency Percent------------------------------

8/6/2019 la joya isd - 9th grade center - 1996 Texas School Survey of Drug and Alcohol Use
http://slidepdf.com/reader/full/la-joya-isd-9th-grade-center-1996-texas-school-survey-of-drug-and-alcohol 310/353
Agree 88 22.1Disagree 310 77.9
NEVER USE HALLUCINOGENS
Q24L2 Frequency Percent------------------------------Agree 200 50.3Disagree 198 49.7
NORMALLY USE HALLUCINOGENS BEFORE SCHOOL
Q24L3 Frequency Percent
---------------------------Yes 2 0.5No 396 99.5
NORMALLY USE HALLUCINOGENS DURING SCHOOL
Q24L4 Frequency Percent
---------------------------Yes 1 0.3No 397 99.7
NORMALLY USE HALLUCINOGENS AFTER SCHOOL
Q24L5 Frequency Percent---------------------------No 398 100.0

8/6/2019 la joya isd - 9th grade center - 1996 Texas School Survey of Drug and Alcohol Use
http://slidepdf.com/reader/full/la-joya-isd-9th-grade-center-1996-texas-school-survey-of-drug-and-alcohol 311/353
NOTE: The frequencies have been weighted so that theanalysis reflects the distribution of students by grade
level in the district
LA JOYA ISD - 9TH GRADE CENTER
SPRING 1996
NORMALLY USE HALLUCINOGENS ON WEEKENDS
Q24L6 Frequency Percent---------------------------Yes 3 0.8No 395 99.2
NEVER HEARD OF UPPERS
Q24M1 Frequency Percent------------------------------

8/6/2019 la joya isd - 9th grade center - 1996 Texas School Survey of Drug and Alcohol Use
http://slidepdf.com/reader/full/la-joya-isd-9th-grade-center-1996-texas-school-survey-of-drug-and-alcohol 312/353
Agree 83 20.9Disagree 315 79.1
NEVER USE UPPERS
Q24M2 Frequency Percent------------------------------Agree 202 50.8Disagree 196 49.2
NORMALLY USE UPPERS BEFORE SCHOOL
Q24M3 Frequency Percent
---------------------------Yes 5 1.3No 393 98.7
NORMALLY USE UPPERS DURING SCHOOL
Q24M4 Frequency Percent
---------------------------Yes 1 0.3No 397 99.7
NORMALLY USE UPPERS AFTER SCHOOL
Q24M5 Frequency Percent---------------------------Yes 2 0.5
No 396 99.5

8/6/2019 la joya isd - 9th grade center - 1996 Texas School Survey of Drug and Alcohol Use
http://slidepdf.com/reader/full/la-joya-isd-9th-grade-center-1996-texas-school-survey-of-drug-and-alcohol 313/353
NOTE: The frequencies have been weighted so that theanalysis reflects the distribution of students by grade
level in the district
LA JOYA ISD - 9TH GRADE CENTER
SPRING 1996
NORMALLY USE UPPERS ON WEEKENDS
Q24M6 Frequency Percent---------------------------Yes 5 1.3No 393 98.7
NEVER HEARD OF DOWNERS
Q24N1 Frequency Percent------------------------------
86 21 6
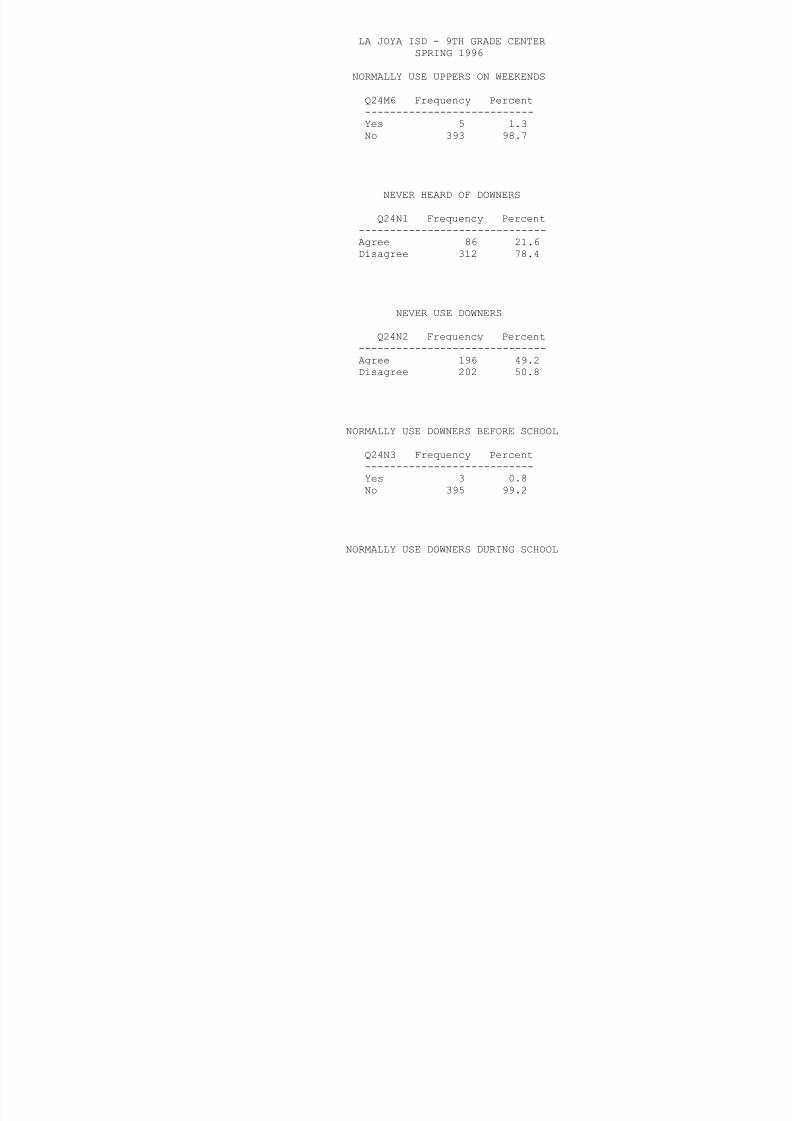
8/6/2019 la joya isd - 9th grade center - 1996 Texas School Survey of Drug and Alcohol Use
http://slidepdf.com/reader/full/la-joya-isd-9th-grade-center-1996-texas-school-survey-of-drug-and-alcohol 314/353
Agree 86 21.6Disagree 312 78.4
NEVER USE DOWNERS
Q24N2 Frequency Percent------------------------------Agree 196 49.2Disagree 202 50.8
NORMALLY USE DOWNERS BEFORE SCHOOL
Q24N3 Frequency Percent
---------------------------Yes 3 0.8No 395 99.2
NORMALLY USE DOWNERS DURING SCHOOL
Q24N4 Frequency Percent
---------------------------Yes 1 0.3No 397 99.7
NORMALLY USE DOWNERS AFTER SCHOOL
Q24N5 Frequency Percent---------------------------Yes 3 0.8
No 395 99.2

8/6/2019 la joya isd - 9th grade center - 1996 Texas School Survey of Drug and Alcohol Use
http://slidepdf.com/reader/full/la-joya-isd-9th-grade-center-1996-texas-school-survey-of-drug-and-alcohol 315/353
NOTE: The frequencies have been weighted so that theanalysis reflects the distribution of students by grade
level in the district
LA JOYA ISD - 9TH GRADE CENTER
SPRING 1996
NORMALLY USE DOWNERS ON WEEKENDS
Q24N6 Frequency Percent---------------------------Yes 5 1.3No 393 98.7
NEVER HEARD OF STEROIDS
Q24O1 Frequency Percent------------------------------Ag ee 62 15 6

8/6/2019 la joya isd - 9th grade center - 1996 Texas School Survey of Drug and Alcohol Use
http://slidepdf.com/reader/full/la-joya-isd-9th-grade-center-1996-texas-school-survey-of-drug-and-alcohol 316/353
Agree 62 15.6Disagree 336 84.4
NEVER USE STEROIDS
Q24O2 Frequency Percent------------------------------Agree 224 56.3Disagree 174 43.7
NORMALLY USE STEROIDS BEFORE SCHOOL
Q24O3 Frequency Percent
---------------------------Yes 1 0.3No 397 99.7
NORMALLY USE STEROIDS DURING SCHOOL
Q24O4 Frequency Percent
---------------------------No 398 100.0
NORMALLY USE STEROIDS AFTER SCHOOL
Q24O5 Frequency Percent---------------------------Yes 1 0.3No 397 99.7

8/6/2019 la joya isd - 9th grade center - 1996 Texas School Survey of Drug and Alcohol Use
http://slidepdf.com/reader/full/la-joya-isd-9th-grade-center-1996-texas-school-survey-of-drug-and-alcohol 317/353
NOTE: The frequencies have been weighted so that theanalysis reflects the distribution of students by grade
level in the district
LA JOYA ISD - 9TH GRADE CENTER
SPRING 1996
NORMALLY USE STEROIDS ON WEEKENDS
Q24O6 Frequency Percent---------------------------Yes 3 0.8No 395 99.2
NEVER HEARD OF ECSTASY
Q24P1 Frequency Percent------------------------------Agree 105 26 4

8/6/2019 la joya isd - 9th grade center - 1996 Texas School Survey of Drug and Alcohol Use
http://slidepdf.com/reader/full/la-joya-isd-9th-grade-center-1996-texas-school-survey-of-drug-and-alcohol 318/353
Agree 105 26.4Disagree 293 73.6
NEVER USE ECSTASY
Q24P2 Frequency Percent------------------------------Agree 180 45.2Disagree 218 54.8
NORMALLY USE ECSTASY BEFORE SCHOOL
Q24P3 Frequency Percent
---------------------------Yes 2 0.5No 396 99.5
NORMALLY USE ECSTASY DURING SCHOOL
Q24P4 Frequency Percent
---------------------------Yes 1 0.3No 397 99.7
NORMALLY USE ECSTASY AFTER SCHOOL
Q24P5 Frequency Percent---------------------------No 398 100.0
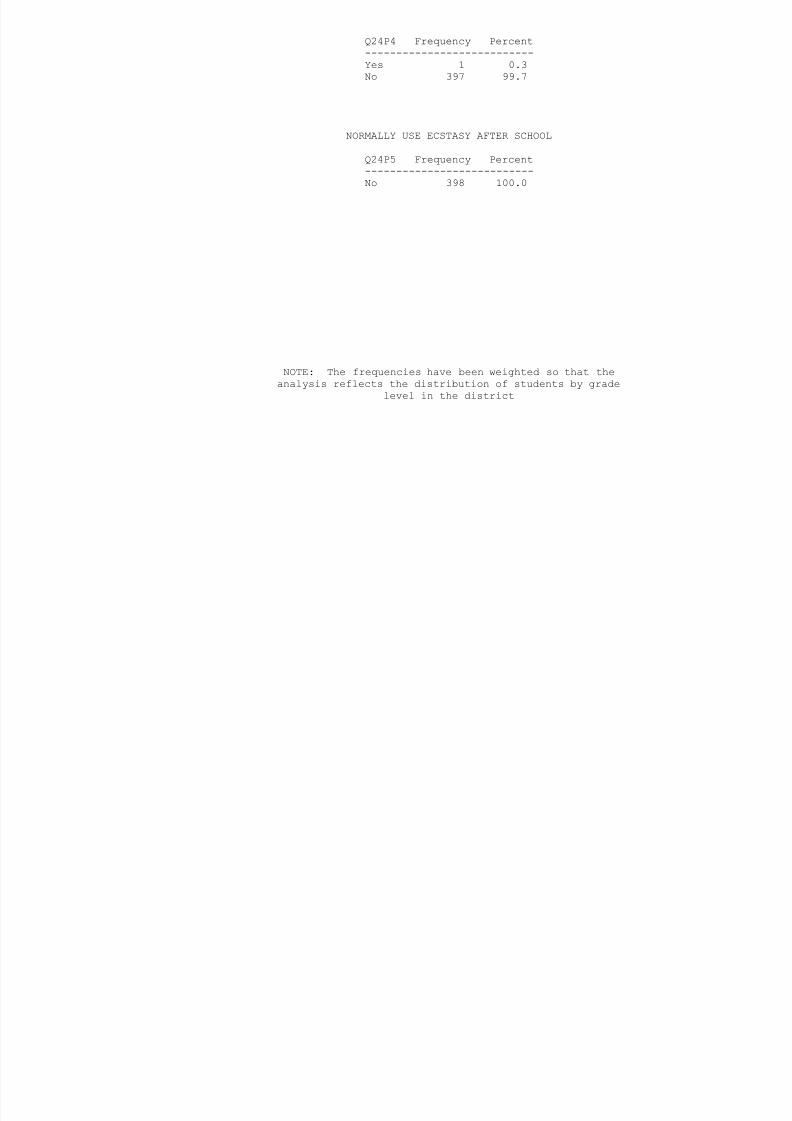
8/6/2019 la joya isd - 9th grade center - 1996 Texas School Survey of Drug and Alcohol Use
http://slidepdf.com/reader/full/la-joya-isd-9th-grade-center-1996-texas-school-survey-of-drug-and-alcohol 319/353
NOTE: The frequencies have been weighted so that theanalysis reflects the distribution of students by grade
level in the district
LA JOYA ISD - 9TH GRADE CENTER
SPRING 1996
NORMALLY USE ECSTASY ON WEEKENDS
Q24P6 Frequency Percent---------------------------Yes 1 0.3No 397 99.7
NEVER HEARD OF ECSTASY
Q24Q1 Frequency Percent------------------------------Agree 61 15 3
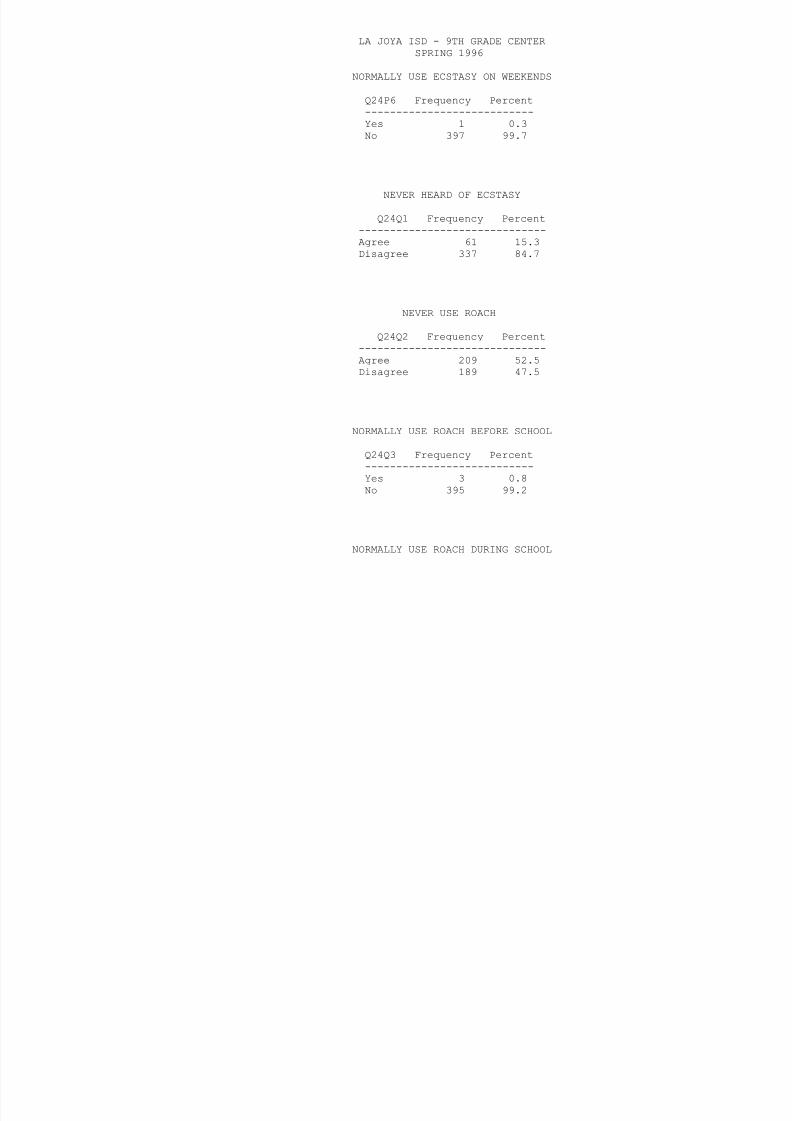
8/6/2019 la joya isd - 9th grade center - 1996 Texas School Survey of Drug and Alcohol Use
http://slidepdf.com/reader/full/la-joya-isd-9th-grade-center-1996-texas-school-survey-of-drug-and-alcohol 320/353
Agree 61 15.3Disagree 337 84.7
NEVER USE ROACH
Q24Q2 Frequency Percent------------------------------Agree 209 52.5Disagree 189 47.5
NORMALLY USE ROACH BEFORE SCHOOL
Q24Q3 Frequency Percent
---------------------------Yes 3 0.8No 395 99.2
NORMALLY USE ROACH DURING SCHOOL
Q24Q4 Frequency Percent
---------------------------Yes 7 1.8No 391 98.2
NORMALLY USE ROACH AFTER SCHOOL
Q24Q5 Frequency Percent---------------------------Yes 3 0.8
No 395 99.2

8/6/2019 la joya isd - 9th grade center - 1996 Texas School Survey of Drug and Alcohol Use
http://slidepdf.com/reader/full/la-joya-isd-9th-grade-center-1996-texas-school-survey-of-drug-and-alcohol 321/353
NOTE: The frequencies have been weighted so that theanalysis reflects the distribution of students by grade
level in the district
LA JOYA ISD - 9TH GRADE CENTER
SPRING 1996
NORMALLY USE ROACH ON WEEKENDS
Q24Q6 Frequency Percent---------------------------Yes 14 3.5No 384 96.5
AMOUNT OF BEER AT ONE TIME
Q25A Frequency Percent--------------------------------------Never drink this 147 48.8
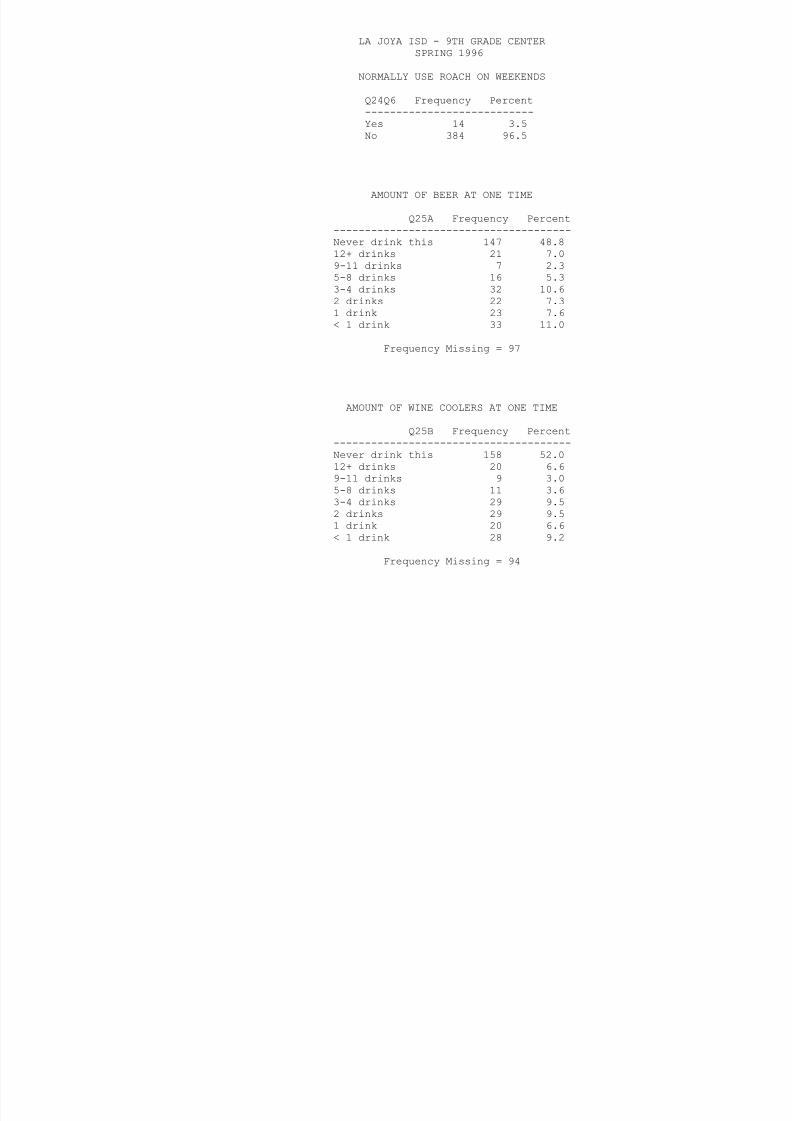
8/6/2019 la joya isd - 9th grade center - 1996 Texas School Survey of Drug and Alcohol Use
http://slidepdf.com/reader/full/la-joya-isd-9th-grade-center-1996-texas-school-survey-of-drug-and-alcohol 322/353
e e d t s 8.812+ drinks 21 7.09-11 drinks 7 2.35-8 drinks 16 5.33-4 drinks 32 10.62 drinks 22 7.31 drink 23 7.6< 1 drink 33 11.0
Frequency Missing = 97
AMOUNT OF WINE COOLERS AT ONE TIME
Q25B Frequency Percent--------------------------------------Never drink this 158 52.0
12+ drinks 20 6.69-11 drinks 9 3.05-8 drinks 11 3.63-4 drinks 29 9.52 drinks 29 9.51 drink 20 6.6< 1 drink 28 9.2
Frequency Missing = 94
AMOUNT OF WINE AT ONE TIME
Q25C Frequency Percent--------------------------------------Never drink this 167 55.912+ drinks 13 4.39-11 drinks 6 2.05-8 drinks 10 3.33-4 drinks 22 7.4
2 drinks 20 6.71 drink 24 8.0< 1 drink 37 12.4
Frequency Missing = 99

8/6/2019 la joya isd - 9th grade center - 1996 Texas School Survey of Drug and Alcohol Use
http://slidepdf.com/reader/full/la-joya-isd-9th-grade-center-1996-texas-school-survey-of-drug-and-alcohol 323/353
q y g
NOTE: The frequencies have been weighted so that theanalysis reflects the distribution of students by grade
level in the district
LA JOYA ISD - 9TH GRADE CENTER
SPRING 1996
AMOUNT OF LIQUOR AT ONE TIME
Q25D Frequency Percent--------------------------------------Never drink this 187 63.612+ drinks 10 3.49-11 drinks 5 1.75-8 drinks 12 4.13-4 drinks 14 4.82 drinks 23 7.8
1 drink 20 6.8< 1 drink 23 7.8
Frequency Missing = 104

8/6/2019 la joya isd - 9th grade center - 1996 Texas School Survey of Drug and Alcohol Use
http://slidepdf.com/reader/full/la-joya-isd-9th-grade-center-1996-texas-school-survey-of-drug-and-alcohol 324/353
BEERS, FIVE OR MORE AT ONE TIME
Q26A Frequency Percent--------------------------------------Never drink this 136 54.2Never 5+ at time 41 16.3Every day 1 0.4Several times/wk 12 4.8Several times/mo 17 6.8About once/month 15 6.0< once/month 13 5.2< once/year 16 6.4
Frequency Missing = 147
WINE COOLERS, FIVE OR MORE AT ONE TIME
Q26B Frequency Percent--------------------------------------Never drink this 149 60.1Never 5+ at time 36 14.5
Every day 1 0.4
Several times/wk 7 2.8Several times/mo 13 5.2About once/month 11 4.4< once/month 14 5.6< once/year 17 6.9
Frequency Missing = 150

8/6/2019 la joya isd - 9th grade center - 1996 Texas School Survey of Drug and Alcohol Use
http://slidepdf.com/reader/full/la-joya-isd-9th-grade-center-1996-texas-school-survey-of-drug-and-alcohol 325/353
NOTE: The frequencies have been weighted so that theanalysis reflects the distribution of students by grade
level in the district
LA JOYA ISD - 9TH GRADE CENTER
SPRING 1996
WINE, FIVE OR MORE AT ONE TIME
Q26C Frequency Percent--------------------------------------Never drink this 150 60.2Never 5+ at time 29 11.6Several times/wk 8 3.2Several times/mo 14 5.6About once/month 11 4.4< once/month 14 5.6
< once/year 23 9.2
Frequency Missing = 149
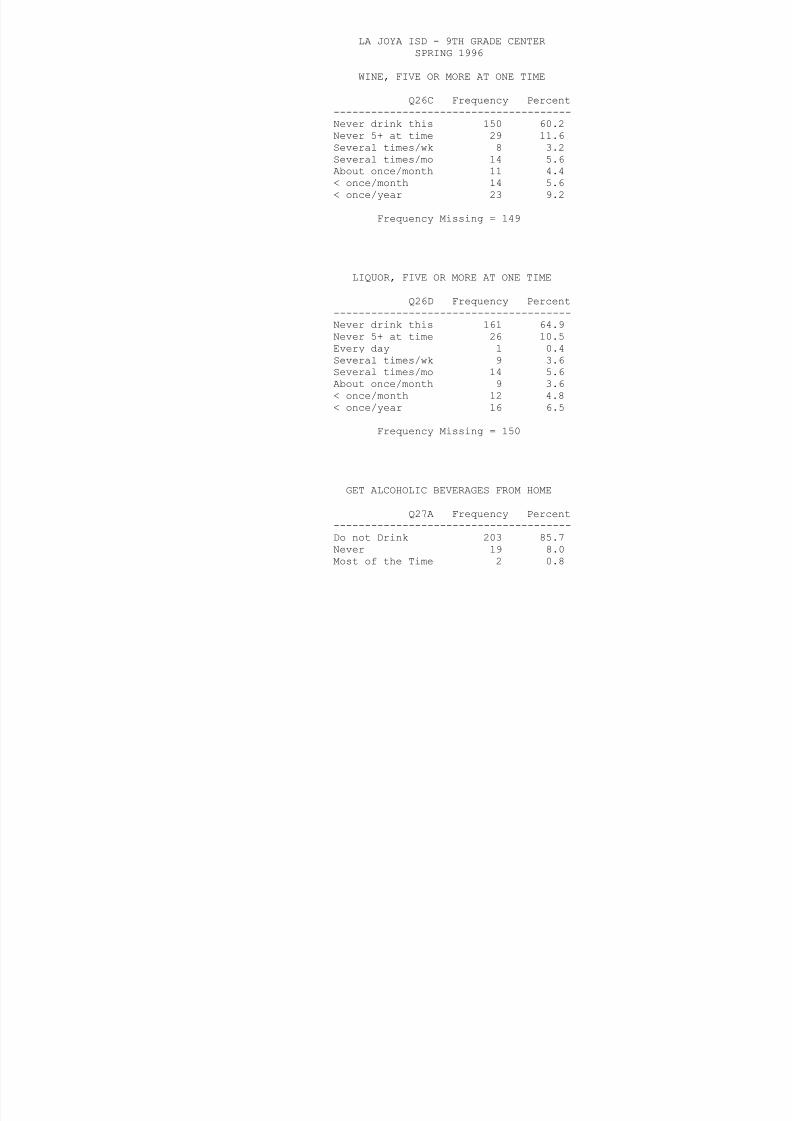
8/6/2019 la joya isd - 9th grade center - 1996 Texas School Survey of Drug and Alcohol Use
http://slidepdf.com/reader/full/la-joya-isd-9th-grade-center-1996-texas-school-survey-of-drug-and-alcohol 326/353
LIQUOR, FIVE OR MORE AT ONE TIME
Q26D Frequency Percent--------------------------------------Never drink this 161 64.9Never 5+ at time 26 10.5Every day 1 0.4Several times/wk 9 3.6Several times/mo 14 5.6About once/month 9 3.6< once/month 12 4.8< once/year 16 6.5
Frequency Missing = 150
GET ALCOHOLIC BEVERAGES FROM HOME
Q27A Frequency Percent--------------------------------------Do not Drink 203 85.7Never 19 8.0Most of the Time 2 0.8
Always 13 5.5
Frequency Missing = 161
GET ALCOHOLIC BEVERAGES FROM FRIENDS
Q27B Frequency Percent--------------------------------------Do not Drink 104 34.7Never 87 29.0
Seldom 45 15.0Most of the Time 49 16.3Always 15 5.0
Frequency Missing = 98

8/6/2019 la joya isd - 9th grade center - 1996 Texas School Survey of Drug and Alcohol Use
http://slidepdf.com/reader/full/la-joya-isd-9th-grade-center-1996-texas-school-survey-of-drug-and-alcohol 327/353
NOTE: The frequencies have been weighted so that theanalysis reflects the distribution of students by grade
level in the district
LA JOYA ISD - 9TH GRADE CENTER
SPRING 1996
GET ALCOHOLIC BEVERAGES FROM A STORE
Q27C Frequency Percent--------------------------------------Do not Drink 102 34.8Never 126 43.0Seldom 31 10.6Most of the Time 23 7.8Always 11 3.8
Frequency Missing = 105

8/6/2019 la joya isd - 9th grade center - 1996 Texas School Survey of Drug and Alcohol Use
http://slidepdf.com/reader/full/la-joya-isd-9th-grade-center-1996-texas-school-survey-of-drug-and-alcohol 328/353
GET ALCOHOLIC BEVERAGES AT PARTIES
Q27D Frequency Percent--------------------------------------Do not Drink 91 31.0Never 63 21.4Seldom 37 12.6Most of the Time 52 17.7Always 51 17.3
Frequency Missing = 104
GET ALCOHOLIC BEVERAGES FROM OTHER
Q27E Frequency Percent
--------------------------------------Do not Drink 103 36.1Never 92 32.3Seldom 34 11.9Most of the Time 28 9.8Always 28 9.8
Frequency Missing = 113
DANGEROUS FOR KIDS TO USE TOBACCO
Q28A Frequency Percent--------------------------------Very 136 54.8Somewhat 66 26.6Not very 22 8.9Not at all 7 2.8Don't know 17 6.9
Frequency Missing = 150

8/6/2019 la joya isd - 9th grade center - 1996 Texas School Survey of Drug and Alcohol Use
http://slidepdf.com/reader/full/la-joya-isd-9th-grade-center-1996-texas-school-survey-of-drug-and-alcohol 329/353
NOTE: The frequencies have been weighted so that theanalysis reflects the distribution of students by grade
level in the district
LA JOYA ISD - 9TH GRADE CENTER
SPRING 1996
DANGEROUS FOR KIDS TO USE ALCOHOL
Q28B Frequency Percent--------------------------------Very 138 57.0Somewhat 51 21.1Not very 32 13.2Not at all 6 2.5Don't know 15 6.2
Frequency Missing = 156
DANGEROUS FOR KIDS TO USE INHALANTS

8/6/2019 la joya isd - 9th grade center - 1996 Texas School Survey of Drug and Alcohol Use
http://slidepdf.com/reader/full/la-joya-isd-9th-grade-center-1996-texas-school-survey-of-drug-and-alcohol 330/353
DANGEROUS FOR KIDS TO USE INHALANTS
Q28C Frequency Percent--------------------------------Very 187 77.9Somewhat 28 11.7Not very 5 2.1Not at all 3 1.3Don't know 17 7.1
Frequency Missing = 158
DANGEROUS FOR KIDS TO USE MARIJUANA
Q28D Frequency Percent
--------------------------------Very 190 79.8Somewhat 23 9.7Not very 7 2.9Not at all 6 2.5Don't know 12 5.0
Frequency Missing = 160
DANGEROUS FOR KIDS TO USE COCAINE
Q28E Frequency Percent--------------------------------Very 200 84.4Somewhat 21 8.9Not at all 3 1.3Don't know 13 5.5
Frequency Missing = 161

8/6/2019 la joya isd - 9th grade center - 1996 Texas School Survey of Drug and Alcohol Use
http://slidepdf.com/reader/full/la-joya-isd-9th-grade-center-1996-texas-school-survey-of-drug-and-alcohol 331/353
NOTE: The frequencies have been weighted so that theanalysis reflects the distribution of students by grade
level in the district
LA JOYA ISD - 9TH GRADE CENTER
SPRING 1996
DANGEROUS FOR KIDS TO USE CRACK
Q28F Frequency Percent--------------------------------Very 203 85.7Somewhat 19 8.0Not at all 2 0.8Don't know 13 5.5
Frequency Missing = 161
DANGEROUS FOR KIDS TO USE ECSTASY
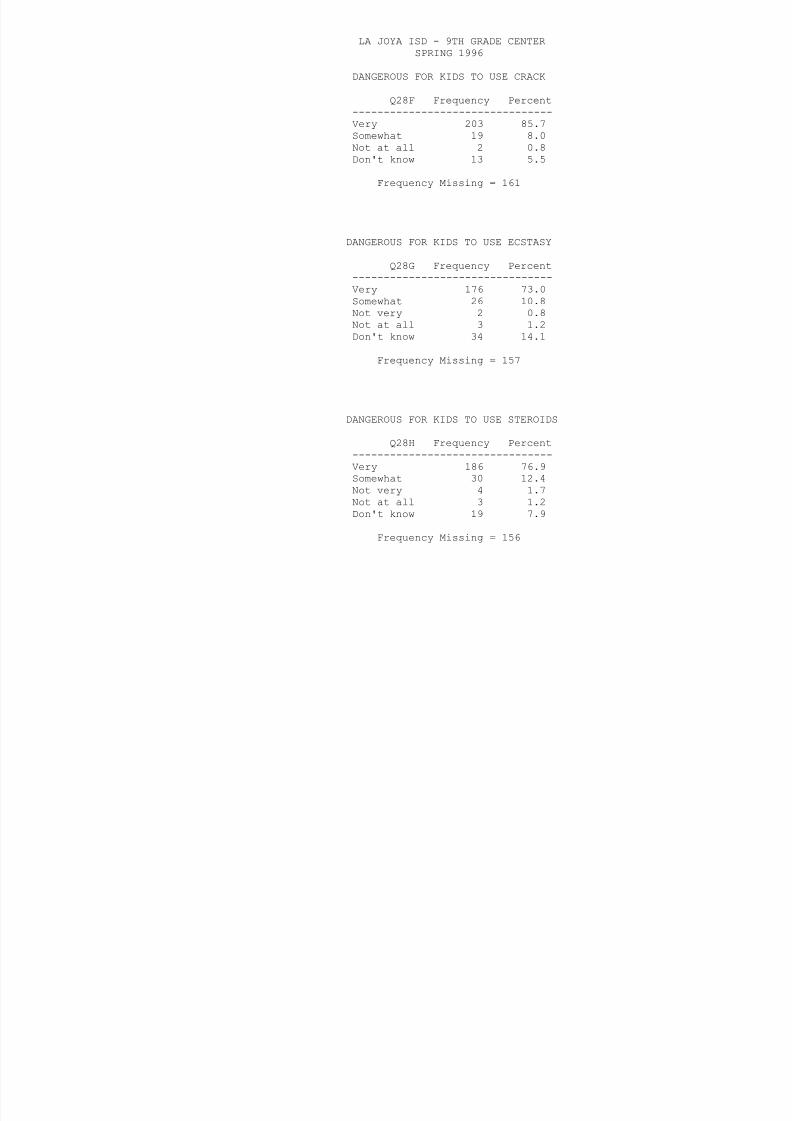
8/6/2019 la joya isd - 9th grade center - 1996 Texas School Survey of Drug and Alcohol Use
http://slidepdf.com/reader/full/la-joya-isd-9th-grade-center-1996-texas-school-survey-of-drug-and-alcohol 332/353
Q28G Frequency Percent--------------------------------Very 176 73.0Somewhat 26 10.8Not very 2 0.8Not at all 3 1.2
Don't know 34 14.1
Frequency Missing = 157
DANGEROUS FOR KIDS TO USE STEROIDS
Q28H Frequency Percent--------------------------------
Very 186 76.9Somewhat 30 12.4Not very 4 1.7Not at all 3 1.2Don't know 19 7.9
Frequency Missing = 156
DAYS SKIPPED SINCE SEPTEMBER
Q29A Frequency Percent------------------------------None 238 85.61 day 19 6.82-3 days 14 5.04-9 days 6 2.210+ days 1 0.4
Frequency Missing = 120

8/6/2019 la joya isd - 9th grade center - 1996 Texas School Survey of Drug and Alcohol Use
http://slidepdf.com/reader/full/la-joya-isd-9th-grade-center-1996-texas-school-survey-of-drug-and-alcohol 333/353
NOTE: The frequencies have been weighted so that theanalysis reflects the distribution of students by grade
level in the district
LA JOYA ISD - 9TH GRADE CENTER
SPRING 1996
DAYS ILL SINCE SEPTEMBER
Q29B Frequency Percent------------------------------None 77 28.01 day 58 21.12-3 days 77 28.04-9 days 47 17.110+ days 16 5.8
Frequency Missing = 123
OTHER DAYS MISSED SINCE SEPTEMBER
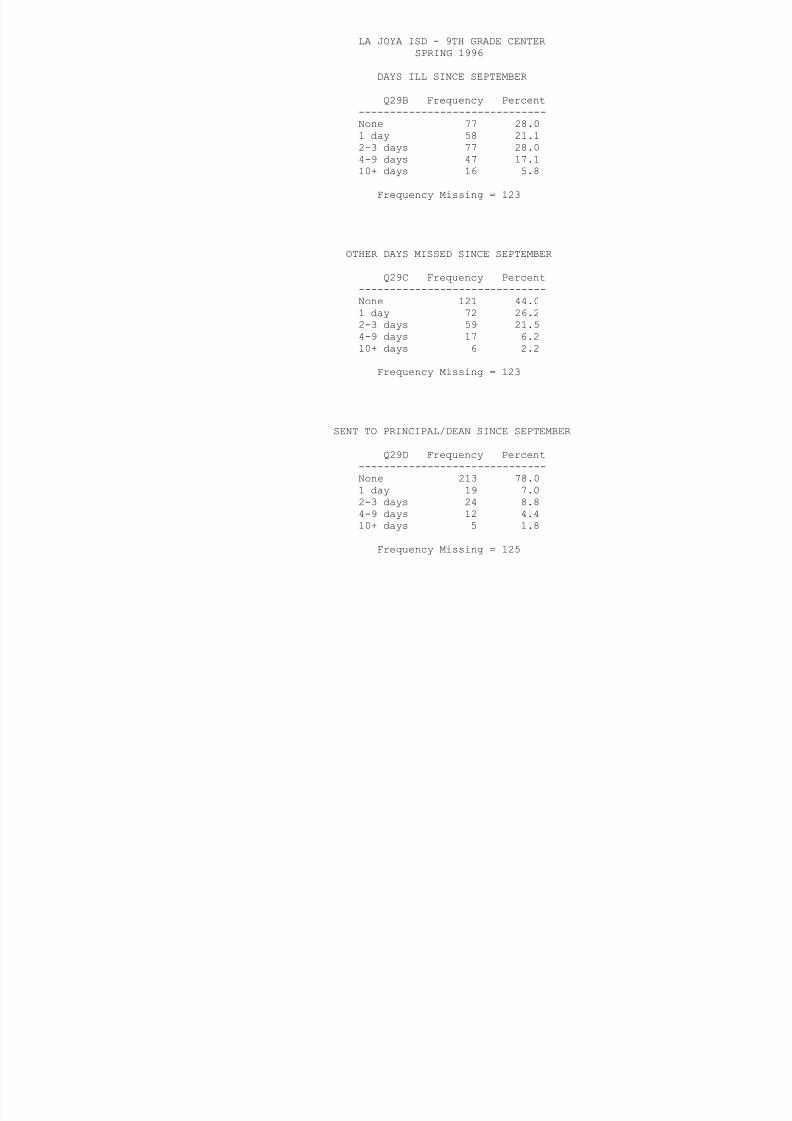
8/6/2019 la joya isd - 9th grade center - 1996 Texas School Survey of Drug and Alcohol Use
http://slidepdf.com/reader/full/la-joya-isd-9th-grade-center-1996-texas-school-survey-of-drug-and-alcohol 334/353
OTHER DAYS MISSED SINCE SEPTEMBER
Q29C Frequency Percent------------------------------None 121 44.01 day 72 26.22-3 days 59 21.5
4-9 days 17 6.210+ days 6 2.2
Frequency Missing = 123
SENT TO PRINCIPAL/DEAN SINCE SEPTEMBER
Q29D Frequency Percent
------------------------------None 213 78.01 day 19 7.02-3 days 24 8.84-9 days 12 4.410+ days 5 1.8
Frequency Missing = 125
SOMEONE CALLED HOME SINCE SEPTEMBER
Q29E Frequency Percent------------------------------None 221 81.91 day 24 8.92-3 days 12 4.44-9 days 8 3.010+ days 5 1.9
Frequency Missing = 128

8/6/2019 la joya isd - 9th grade center - 1996 Texas School Survey of Drug and Alcohol Use
http://slidepdf.com/reader/full/la-joya-isd-9th-grade-center-1996-texas-school-survey-of-drug-and-alcohol 335/353
NOTE: The frequencies have been weighted so that theanalysis reflects the distribution of students by grade
level in the district
LA JOYA ISD - 9TH GRADE CENTER
SPRING 1996
IN TROUBLE FOR DRINKING SINCE SEPTEMBER
Q29F Frequency Percent------------------------------None 263 99.610+ days 1 0.4
Frequency Missing = 134
IN TROUBLE FOR DRUG USE SINCE SEPTEMBER
Q29G Frequency Percent------------------------------
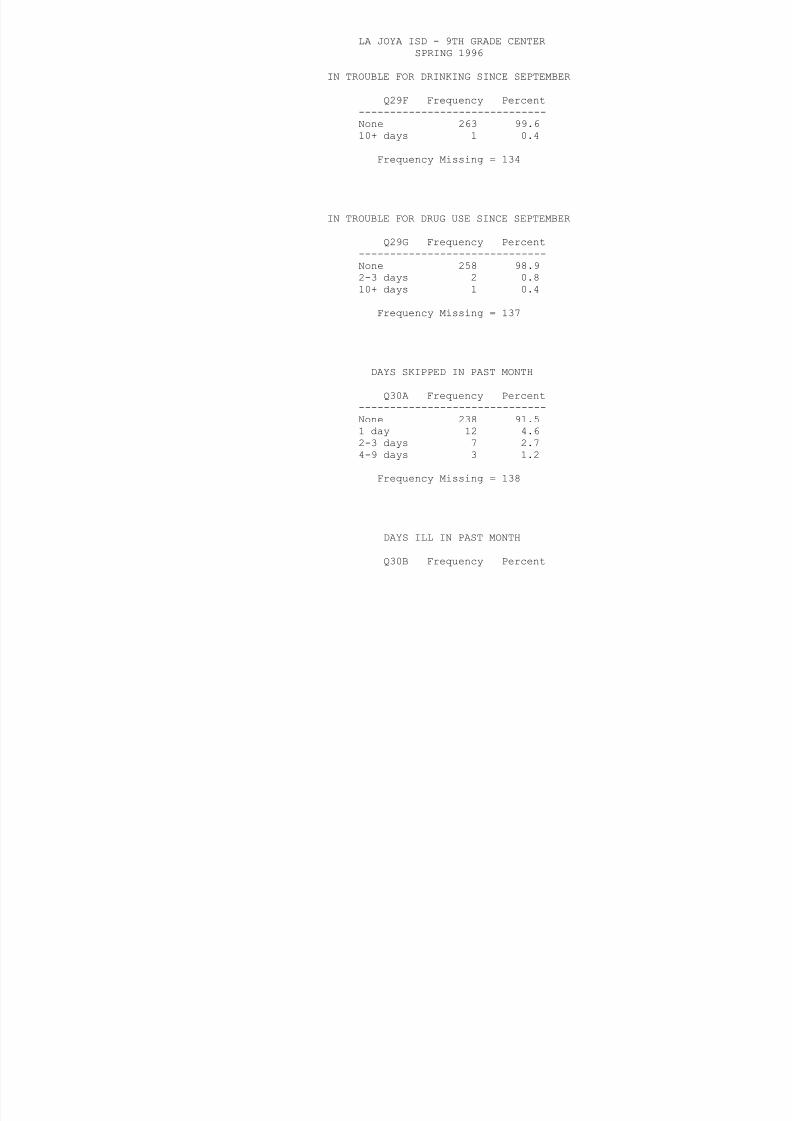
8/6/2019 la joya isd - 9th grade center - 1996 Texas School Survey of Drug and Alcohol Use
http://slidepdf.com/reader/full/la-joya-isd-9th-grade-center-1996-texas-school-survey-of-drug-and-alcohol 336/353
None 258 98.92-3 days 2 0.810+ days 1 0.4
Frequency Missing = 137
DAYS SKIPPED IN PAST MONTH
Q30A Frequency Percent------------------------------None 238 91.51 day 12 4.62-3 days 7 2.74-9 days 3 1.2
Frequency Missing = 138
DAYS ILL IN PAST MONTH
Q30B Frequency Percent
------------------------------
None 148 58.71 day 52 20.62-3 days 39 15.54-9 days 12 4.810+ days 1 0.4
Frequency Missing = 146
OTHER DAYS MISSED IN PAST MONTH
Q30C Frequency Percent------------------------------None 190 74.21 day 39 15.22-3 days 20 7.8
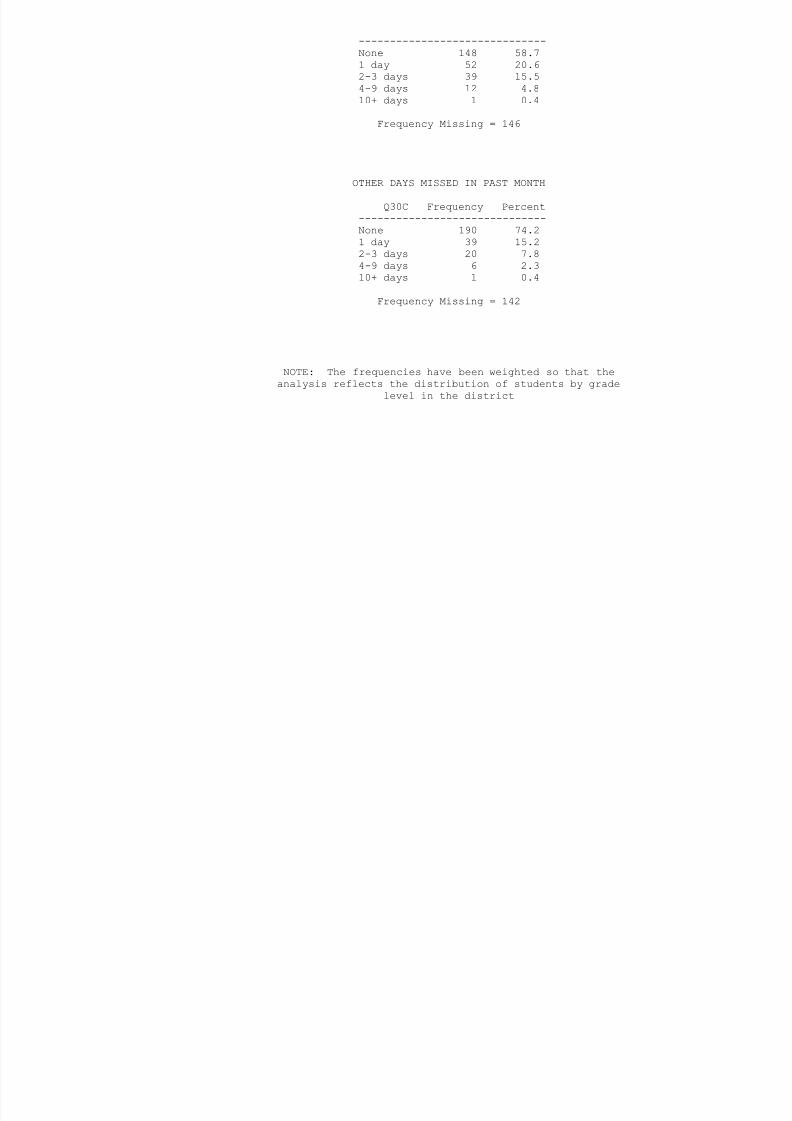
8/6/2019 la joya isd - 9th grade center - 1996 Texas School Survey of Drug and Alcohol Use
http://slidepdf.com/reader/full/la-joya-isd-9th-grade-center-1996-texas-school-survey-of-drug-and-alcohol 337/353
2 3 days 20 7.84-9 days 6 2.310+ days 1 0.4
Frequency Missing = 142
NOTE: The frequencies have been weighted so that theanalysis reflects the distribution of students by grade
level in the district
LA JOYA ISD - 9TH GRADE CENTER
SPRING 1996
SENT TO PRINCIPAL/DEAN IN PAST MONTH
Q30D Frequency Percent------------------------------None 237 92.61 day 7 2.72-3 days 8 3.14-9 days 2 0.810+ days 2 0.8
Frequency Missing = 142
SOMEONE CALLED HOME IN PAST MONTH

8/6/2019 la joya isd - 9th grade center - 1996 Texas School Survey of Drug and Alcohol Use
http://slidepdf.com/reader/full/la-joya-isd-9th-grade-center-1996-texas-school-survey-of-drug-and-alcohol 338/353
Q30E Frequency Percent------------------------------None 238 93.71 day 7 2.82-3 days 8 3.1
10+ days 1 0.4
Frequency Missing = 144
CLASS DAYS DRUNK ON ALCOHOL SINCE SEPT
Q31A Frequency Percent------------------------------None 231 93.51 day 7 2.82-3 days 5 2.04-9 days 2 0.810+ days 2 0.8
Frequency Missing = 151
CLASS DAYS HIGH ON MARIJUANA SINCE SEPT
Q31B Frequency Percent------------------------------None 233 95.51 day 5 2.02-3 days 4 1.610+ days 2 0.8
Frequency Missing = 154
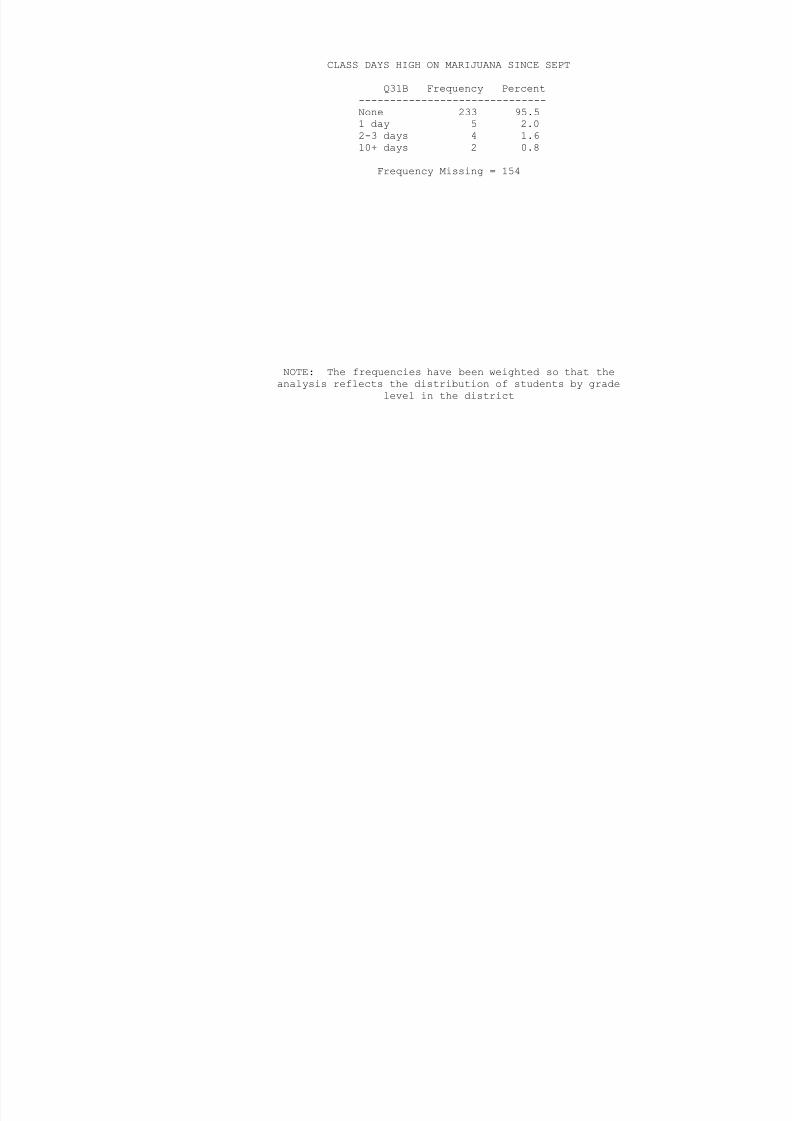
8/6/2019 la joya isd - 9th grade center - 1996 Texas School Survey of Drug and Alcohol Use
http://slidepdf.com/reader/full/la-joya-isd-9th-grade-center-1996-texas-school-survey-of-drug-and-alcohol 339/353
NOTE: The frequencies have been weighted so that theanalysis reflects the distribution of students by grade
level in the district
LA JOYA ISD - 9TH GRADE CENTER
SPRING 1996
CLASS DAYS HIGH ON INHALANTS SINCE SEPT
Q31C Frequency Percent------------------------------None 242 98.41 day 2 0.810+ days 2 0.8
Frequency Missing = 152
CLASS DAYS HIGH ON OTHER DRUG(S)
Q31D Frequency Percent

8/6/2019 la joya isd - 9th grade center - 1996 Texas School Survey of Drug and Alcohol Use
http://slidepdf.com/reader/full/la-joya-isd-9th-grade-center-1996-texas-school-survey-of-drug-and-alcohol 340/353
------------------------------None 232 95.51 day 2 0.82-3 days 5 2.14-9 days 1 0.410+ days 3 1.2
Frequency Missing = 155
TROUBLE WITH FRIENDS BECAUSE OF DRINKING
Q32A Frequency Percent-------------------------------None 229 95.81 time 7 2.92-3 times 2 0.84-9 times 1 0.4
Frequency Missing = 159
DRIVEN A CAR AFTER A GOOD BIT TO DRINK
Q32B Frequency Percent-------------------------------None 222 96.11 time 5 2.22-3 times 4 1.7
Frequency Missing = 167
CRITICIZED BY DATE BECAUSE OF DRINKING
Q32C Frequency Percent-------------------------------None 225 95.31 time 7 3.0

8/6/2019 la joya isd - 9th grade center - 1996 Texas School Survey of Drug and Alcohol Use
http://slidepdf.com/reader/full/la-joya-isd-9th-grade-center-1996-texas-school-survey-of-drug-and-alcohol 341/353
2-3 times 4 1.7
Frequency Missing = 162
NOTE: The frequencies have been weighted so that theanalysis reflects the distribution of students by grade
level in the district
LA JOYA ISD - 9TH GRADE CENTERSPRING 1996
TROUBLE WITH POLICE BECAUSE OF DRINKING
Q32D Frequency Percent-------------------------------None 232 99.11 time 1 0.42-3 times 1 0.4
Frequency Missing = 164
TROUBLE WITH FRIENDS BECAUSE OF DRUG USE
Q32E Frequency Percent

8/6/2019 la joya isd - 9th grade center - 1996 Texas School Survey of Drug and Alcohol Use
http://slidepdf.com/reader/full/la-joya-isd-9th-grade-center-1996-texas-school-survey-of-drug-and-alcohol 342/353
-------------------------------None 230 97.91 time 1 0.42-3 times 2 0.94-9 times 2 0.9
Frequency Missing = 163
DRIVEN A CAR WHILE HIGH FROM DRUGS
Q32F Frequency Percent-------------------------------None 228 98.31 time 2 0.92-3 times 2 0.9
Frequency Missing = 166
CRITICIZED BY DATE BECAUSE OF DRUG USE
Q32G Frequency Percent-------------------------------None 228 97.41 time 4 1.72-3 times 2 0.9
Frequency Missing = 164
TROUBLE WITH POLICE BECAUSE OF DRUG USE
Q32H Frequency Percent-------------------------------None 229 99.62-3 times 1 0.4
Frequency Missing = 168

8/6/2019 la joya isd - 9th grade center - 1996 Texas School Survey of Drug and Alcohol Use
http://slidepdf.com/reader/full/la-joya-isd-9th-grade-center-1996-texas-school-survey-of-drug-and-alcohol 343/353
NOTE: The frequencies have been weighted so that theanalysis reflects the distribution of students by grade
level in the district
LA JOYA ISD - 9TH GRADE CENTERSPRING 1996
ALCOHOL USE AT PARTIES THIS SCHOOL YEAR
Q33A Frequency Percent--------------------------------------Never 101 42.4Seldom 32 13.4Half the time 31 13.0Most of the time 25 10.5Always 25 10.5Don't know 5 2.1
Didn't attend 19 8.0
Frequency Missing = 160
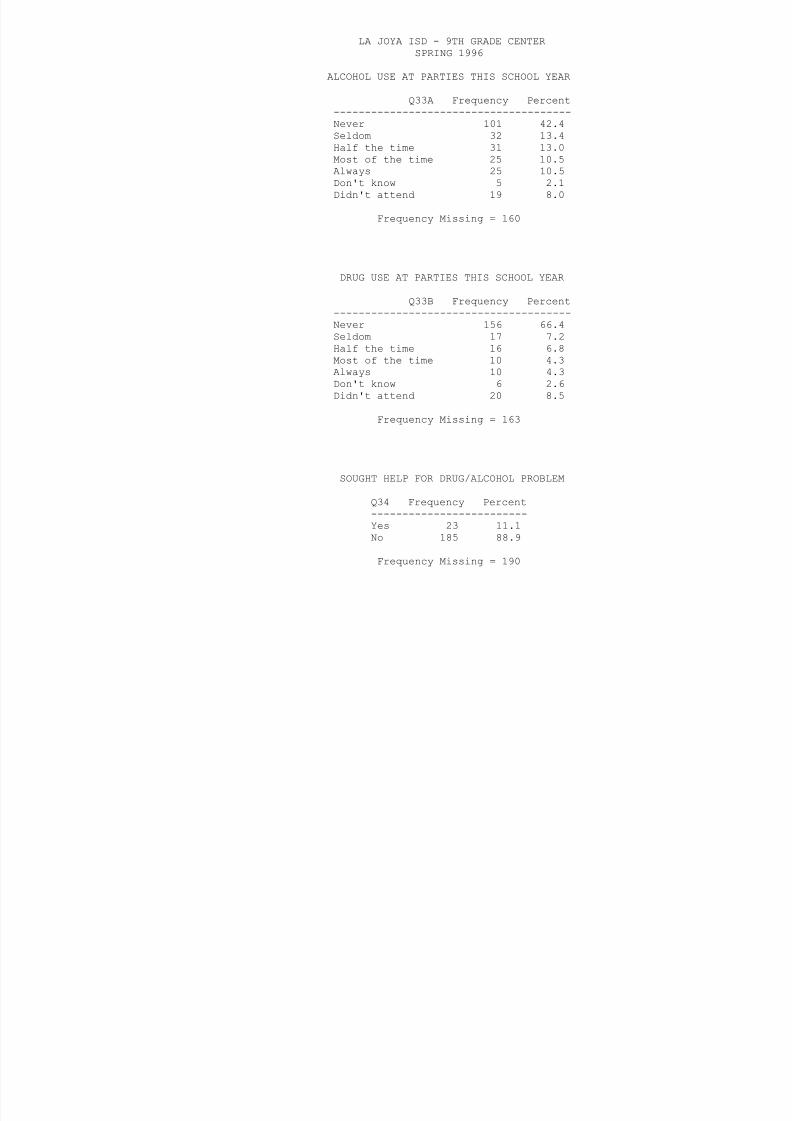
8/6/2019 la joya isd - 9th grade center - 1996 Texas School Survey of Drug and Alcohol Use
http://slidepdf.com/reader/full/la-joya-isd-9th-grade-center-1996-texas-school-survey-of-drug-and-alcohol 344/353
DRUG USE AT PARTIES THIS SCHOOL YEAR
Q33B Frequency Percent--------------------------------------Never 156 66.4
Seldom 17 7.2Half the time 16 6.8Most of the time 10 4.3Always 10 4.3Don't know 6 2.6Didn't attend 20 8.5
Frequency Missing = 163
SOUGHT HELP FOR DRUG/ALCOHOL PROBLEM
Q34 Frequency Percent-------------------------Yes 23 11.1No 185 88.9
Frequency Missing = 190
WOULD SEEK HELP FROM SCHOOL COUNSELOR
Q35A Frequency Percent--------------------------Yes 113 51.4No 107 48.6
Frequency Missing = 178

8/6/2019 la joya isd - 9th grade center - 1996 Texas School Survey of Drug and Alcohol Use
http://slidepdf.com/reader/full/la-joya-isd-9th-grade-center-1996-texas-school-survey-of-drug-and-alcohol 345/353
NOTE: The frequencies have been weighted so that theanalysis reflects the distribution of students by grade
level in the district
LA JOYA ISD - 9TH GRADE CENTERSPRING 1996
WOULD SEEK HELP OUTSIDE OF SCHOOL
Q35B Frequency Percent--------------------------Yes 98 45.0No 120 55.0
Frequency Missing = 180
WOULD SEEK HELP FROM OTHER COUNSELOR
Q35C Frequency Percent--------------------------Y 100 46 9

8/6/2019 la joya isd - 9th grade center - 1996 Texas School Survey of Drug and Alcohol Use
http://slidepdf.com/reader/full/la-joya-isd-9th-grade-center-1996-texas-school-survey-of-drug-and-alcohol 346/353
Yes 100 46.9No 113 53.1
Frequency Missing = 185
WOULD SEEK HELP FROM PARENTS
Q35D Frequency Percent--------------------------Yes 123 59.1No 85 40.9
Frequency Missing = 190
WOULD SEEK HELP FROM A MEDICAL DOCTOR
Q35E Frequency Percent--------------------------Yes 95 46.3No 110 53.7
Frequency Missing = 193
WOULD SEEK HELP FROM FRIENDS
Q35F Frequency Percent--------------------------Yes 147 70.7No 61 29.3
Frequency Missing = 190

8/6/2019 la joya isd - 9th grade center - 1996 Texas School Survey of Drug and Alcohol Use
http://slidepdf.com/reader/full/la-joya-isd-9th-grade-center-1996-texas-school-survey-of-drug-and-alcohol 347/353
NOTE: The frequencies have been weighted so that theanalysis reflects the distribution of students by grade
level in the district
LA JOYA ISD - 9TH GRADE CENTERSPRING 1996
WOULD SEEK HELP FROM ANOTHER ADULT
Q35G Frequency Percent--------------------------Yes 130 62.8No 77 37.2
Frequency Missing = 191
WOULD NOT SEEK HELP
Q35H Frequency Percent--------------------------Yes 62 29 8

8/6/2019 la joya isd - 9th grade center - 1996 Texas School Survey of Drug and Alcohol Use
http://slidepdf.com/reader/full/la-joya-isd-9th-grade-center-1996-texas-school-survey-of-drug-and-alcohol 348/353
Yes 62 29.8No 146 70.2
Frequency Missing = 190
DRUG/ALCOHOL INFO--HEALTH CLASS
Q36A Frequency Percent--------------------------Yes 82 40.6No 120 59.4
Frequency Missing = 196
DRUG/ALCOHOL INFO--ASSEMBLY PROGRAM
Q36B Frequency Percent--------------------------Yes 121 61.4No 76 38.6
Frequency Missing = 201
DRUG/ALCOHOL INFO--GUIDANCE COUNSELOR
Q36C Frequency Percent--------------------------Yes 82 41.6No 115 58.4
Frequency Missing = 201

8/6/2019 la joya isd - 9th grade center - 1996 Texas School Survey of Drug and Alcohol Use
http://slidepdf.com/reader/full/la-joya-isd-9th-grade-center-1996-texas-school-survey-of-drug-and-alcohol 349/353
NOTE: The frequencies have been weighted so that theanalysis reflects the distribution of students by grade
level in the district
LA JOYA ISD - 9TH GRADE CENTERSPRING 1996
DRUG/ALCOHOL INFO--SCIENCE CLASS
Q36D Frequency Percent--------------------------Yes 97 49.2No 100 50.8
Frequency Missing = 201
DRUG/ALCOHOL INFO--SOCIAL STUDIES CLASS
Q36E Frequency Percent--------------------------Yes 51 25 8
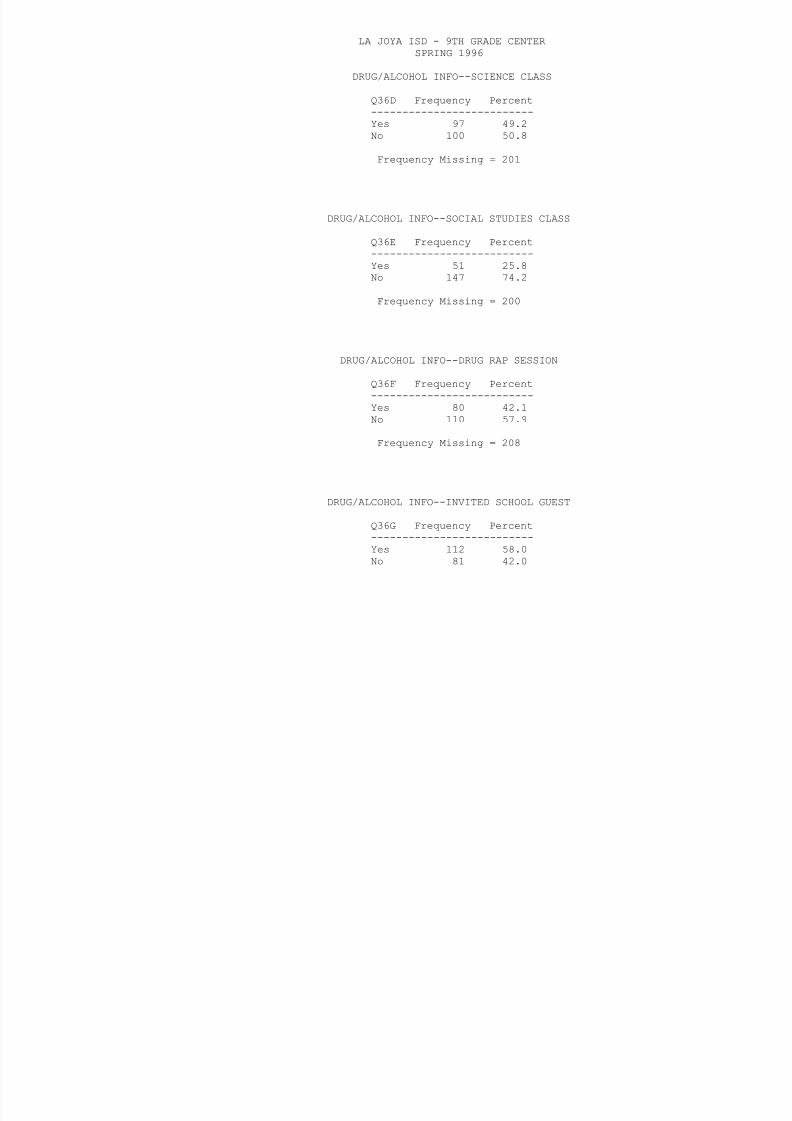
8/6/2019 la joya isd - 9th grade center - 1996 Texas School Survey of Drug and Alcohol Use
http://slidepdf.com/reader/full/la-joya-isd-9th-grade-center-1996-texas-school-survey-of-drug-and-alcohol 350/353
Yes 51 25.8No 147 74.2
Frequency Missing = 200
DRUG/ALCOHOL INFO--DRUG RAP SESSION
Q36F Frequency Percent--------------------------Yes 80 42.1No 110 57.9
Frequency Missing = 208
DRUG/ALCOHOL INFO--INVITED SCHOOL GUEST
Q36G Frequency Percent--------------------------Yes 112 58.0No 81 42.0
Frequency Missing = 205
DRUG/ALCOHOL INFO--OTHER SCHOOL SOURCE
Q36H Frequency Percent--------------------------Yes 87 44.8No 107 55.2
Frequency Missing = 204

8/6/2019 la joya isd - 9th grade center - 1996 Texas School Survey of Drug and Alcohol Use
http://slidepdf.com/reader/full/la-joya-isd-9th-grade-center-1996-texas-school-survey-of-drug-and-alcohol 351/353
NOTE: The frequencies have been weighted so that theanalysis reflects the distribution of students by grade
level in the district
LA JOYA ISD - 9TH GRADE CENTERSPRING 1996
PARENTS FEEL ABOUT KIDS DRINKING BEER
Q37A Frequency Percent--------------------------------------Strong disappro 154 72.0Mild disapprove 30 14.0Neither 9 4.2Mildly approve 2 0.9Strongly approve 2 0.9Don't know 17 7.9
Frequency Missing = 184
PARENTS FEEL ABOUT KIDS USING MARIJUANA
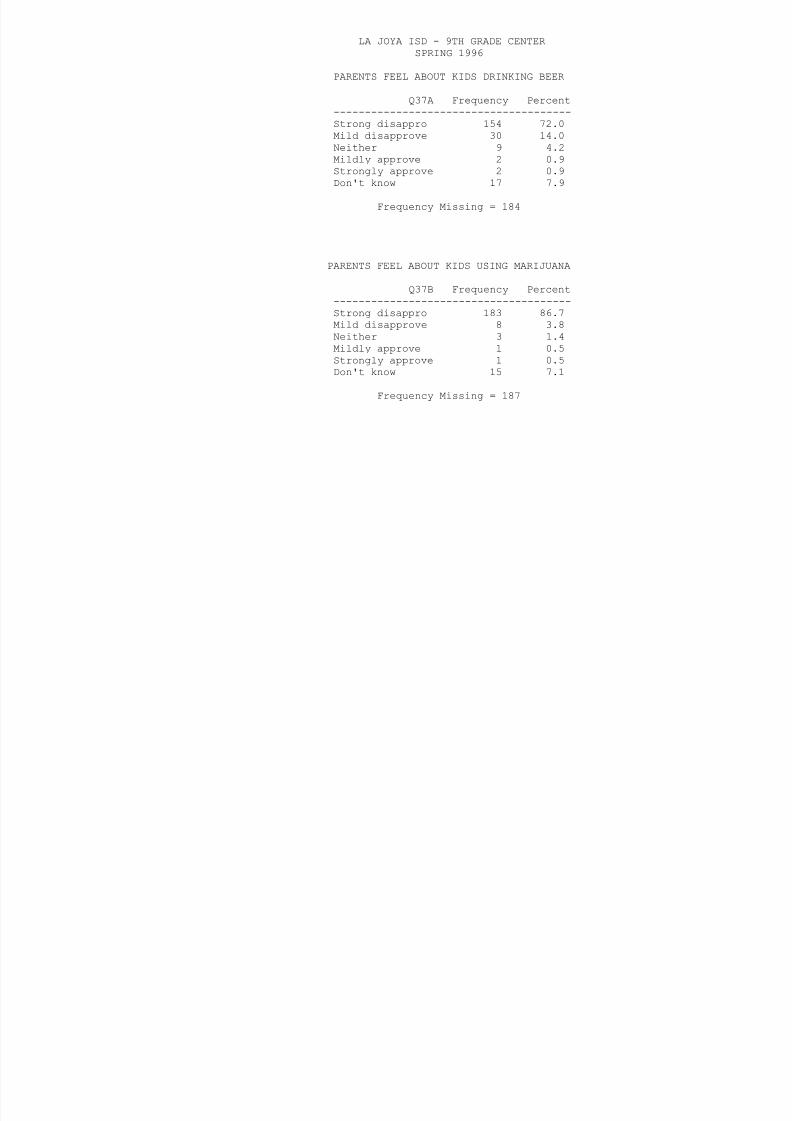
8/6/2019 la joya isd - 9th grade center - 1996 Texas School Survey of Drug and Alcohol Use
http://slidepdf.com/reader/full/la-joya-isd-9th-grade-center-1996-texas-school-survey-of-drug-and-alcohol 352/353
PARENTS FEEL ABOUT KIDS USING MARIJUANA
Q37B Frequency Percent--------------------------------------Strong disappro 183 86.7Mild disapprove 8 3.8
Neither 3 1.4Mildly approve 1 0.5Strongly approve 1 0.5Don't know 15 7.1
Frequency Missing = 187

8/6/2019 la joya isd - 9th grade center - 1996 Texas School Survey of Drug and Alcohol Use
http://slidepdf.com/reader/full/la-joya-isd-9th-grade-center-1996-texas-school-survey-of-drug-and-alcohol 353/353