Embed Size (px)
Citation preview
Wireshark Lab 1
Lab Exercise – Protocol Layers and Ethernet
Objective To learn how protocols and layering are represented in packets, as discussed in Lecture 3, and to explore
the details of Ethernet frames. Ethernet is a popular link layer protocol that we covered in Lecture 6.
Requirements Wireshark: This lab uses the Wireshark software tool to capture and examine a packet trace. A packet
trace is a record of traffic at a location on the network, as if a snapshot was taken of all the bits that
passed across a particular wire. The packet trace records a timestamp for each packet, along with the
bits that make up the packet, from the lower-layer headers to the higher-layer contents. Wireshark runs
on most operating systems, including Windows, Mac and Linux. It provides a graphical UI that shows the
sequence of packets and the meaning of the bits when interpreted as protocol headers and data. It col-
or-codes packets by their type, and has various ways to filter and analyze packets to let you investigate
the behavior of network protocols. Wireshark is widely used to troubleshoot networks. You can down-
load it from www.wireshark.org if it is not already installed on your computer.
wget / curl: This lab uses wget (Linux and Windows) and curl (Mac) to fetch web resources. wget
and curl are command-line programs that let you fetch a URL. Unlike a web browser, which fetches
and executes entire pages, wget and curl give you control over exactly which URLs you fetch and
when you fetch them. Under Linux, wget can be installed via your package manager. Under Windows,
wget is available as a binary; look for download information on http://www.gnu.org/software/wget/.
Under Mac, curl comes installed with the OS. Both have many options (try “wget --help” or
“curl --help” to see) but a URL can be fetched simply with “wget URL” or “curl URL ”.
ping: This lab uses “ping” to send and receive messages. ping is a standard command-line utility for
checking that another computer is responsive. It is widely used for network troubleshooting and comes
pre-installed on Window, Linux, and Mac. While ping has various options, simply issuing the command
“ping www.bing.com” will cause your computer to send a small number of ICMP ping requests to
the remote computer (here www.bing.com), each of which should elicit an ICMP ping response.
Step 1: Capture a Trace Proceed as follows to capture a trace of network traffic; alternatively, you may use a supplied trace. We
want this trace to look at the protocol structure of packets. A simple Web fetch of a URL from a server of
your choice to your computer, which is the client, will serve as traffic.
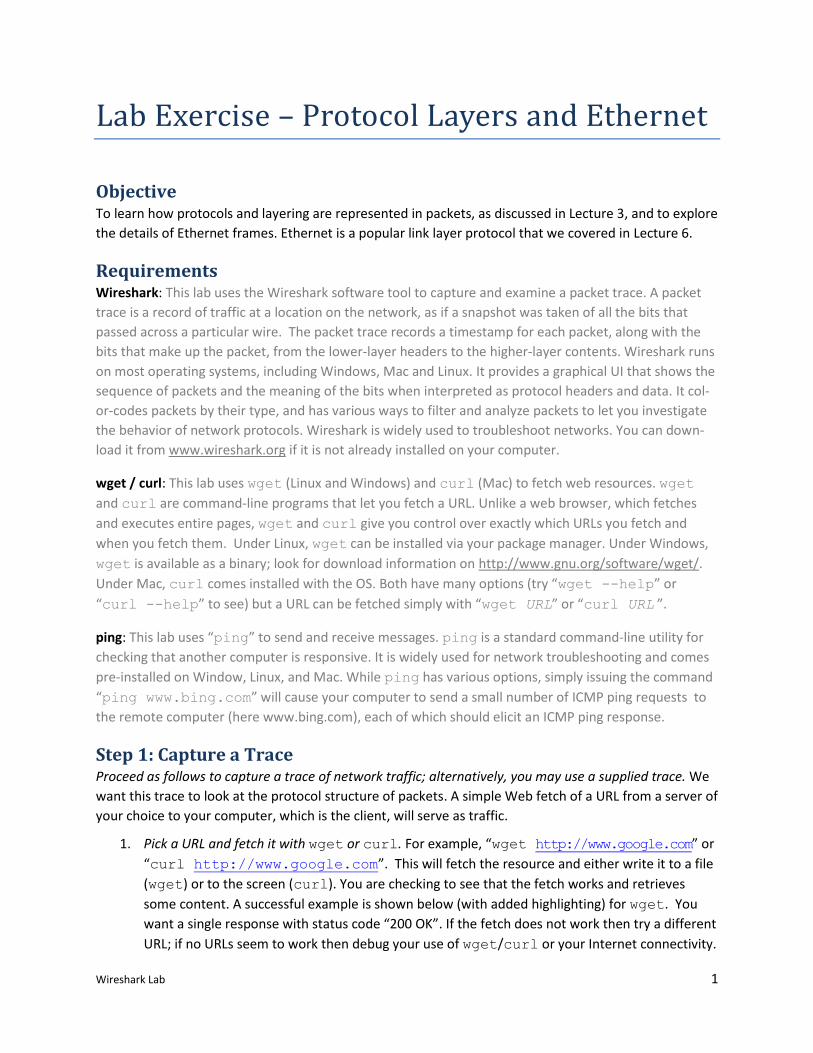
1. Pick a URL and fetch it with wget or curl. For example, “wget http://www.google.com” or
“curl http://www.google.com”. This will fetch the resource and either write it to a file
(wget) or to the screen (curl). You are checking to see that the fetch works and retrieves
some content. A successful example is shown below (with added highlighting) for wget. You
want a single response with status code “200 OK”. If the fetch does not work then try a different
URL; if no URLs seem to work then debug your use of wget/curl or your Internet connectivity.
Wireshark Lab 2
Figure 1: Using wget to fetch a URL
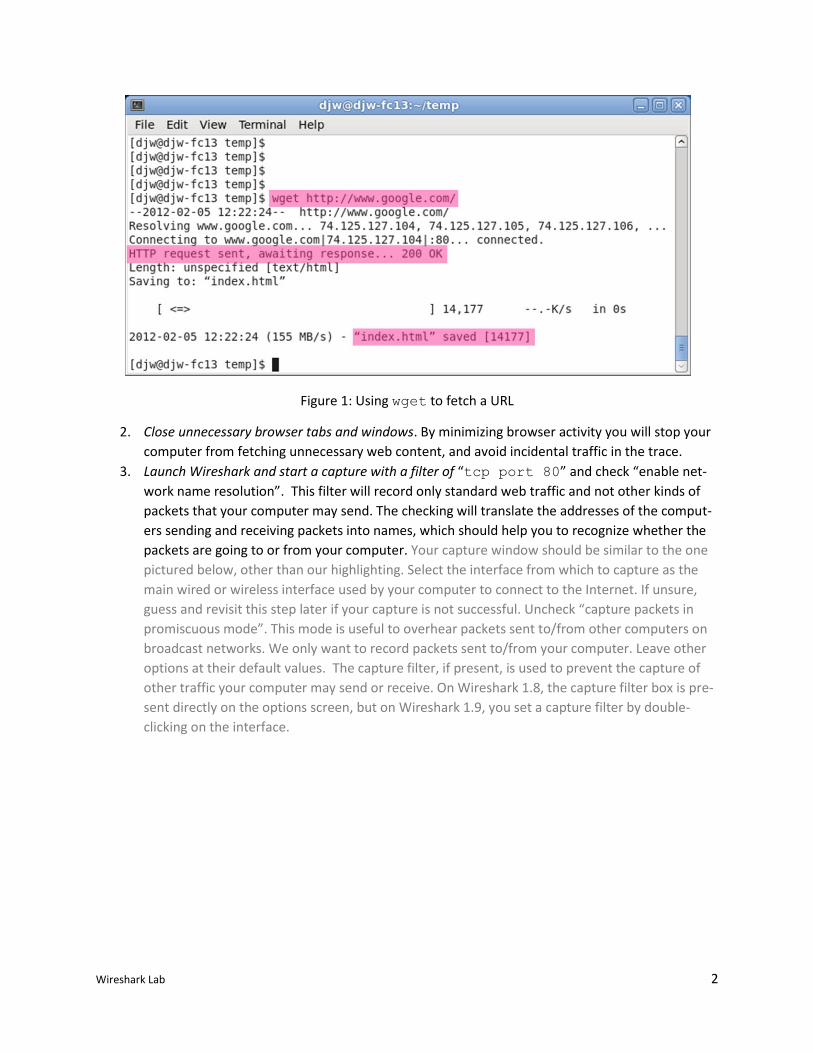
2. Close unnecessary browser tabs and windows. By minimizing browser activity you will stop your
computer from fetching unnecessary web content, and avoid incidental traffic in the trace.
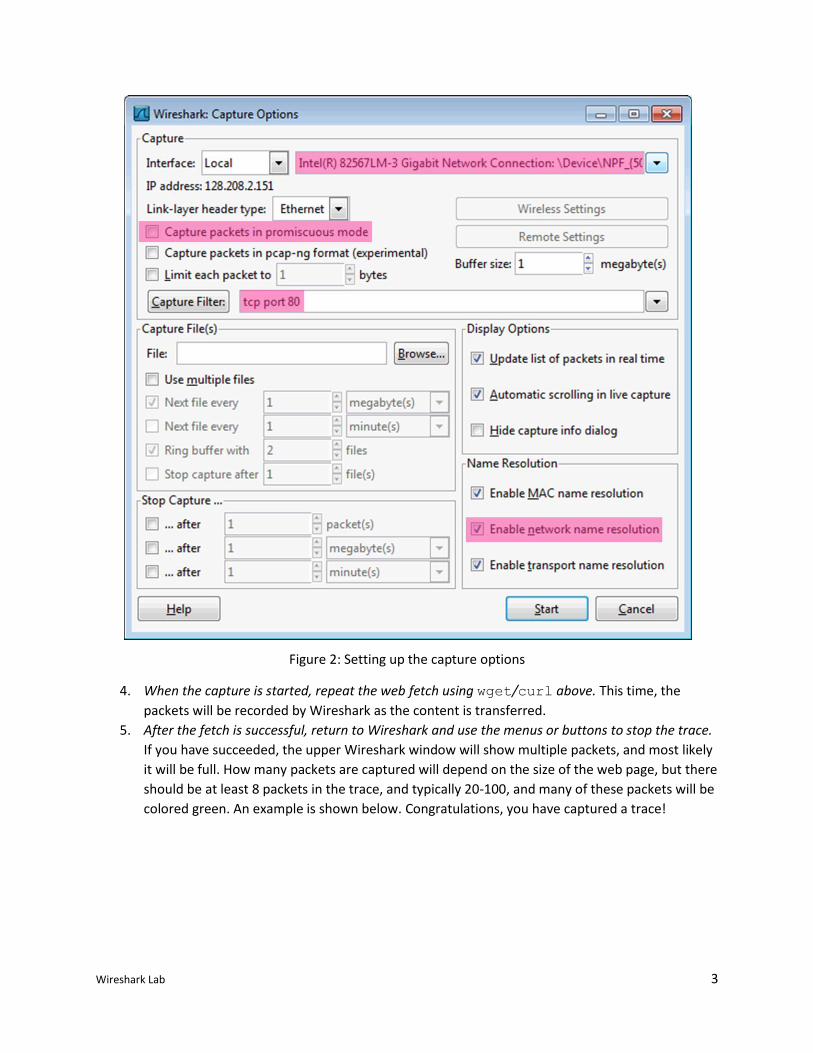
3. Launch Wireshark and start a capture with a filter of “tcp port 80” and check “enable net-
work name resolution”. This filter will record only standard web traffic and not other kinds of
packets that your computer may send. The checking will translate the addresses of the comput-
ers sending and receiving packets into names, which should help you to recognize whether the
packets are going to or from your computer. Your capture window should be similar to the one
pictured below, other than our highlighting. Select the interface from which to capture as the
main wired or wireless interface used by your computer to connect to the Internet. If unsure,
guess and revisit this step later if your capture is not successful. Uncheck “capture packets in
promiscuous mode”. This mode is useful to overhear packets sent to/from other computers on
broadcast networks. We only want to record packets sent to/from your computer. Leave other
options at their default values. The capture filter, if present, is used to prevent the capture of
other traffic your computer may send or receive. On Wireshark 1.8, the capture filter box is pre-
sent directly on the options screen, but on Wireshark 1.9, you set a capture filter by double-
clicking on the interface.
Wireshark Lab 3
Figure 2: Setting up the capture options
4. When the capture is started, repeat the web fetch using wget/curl above. This time, the
packets will be recorded by Wireshark as the content is transferred.
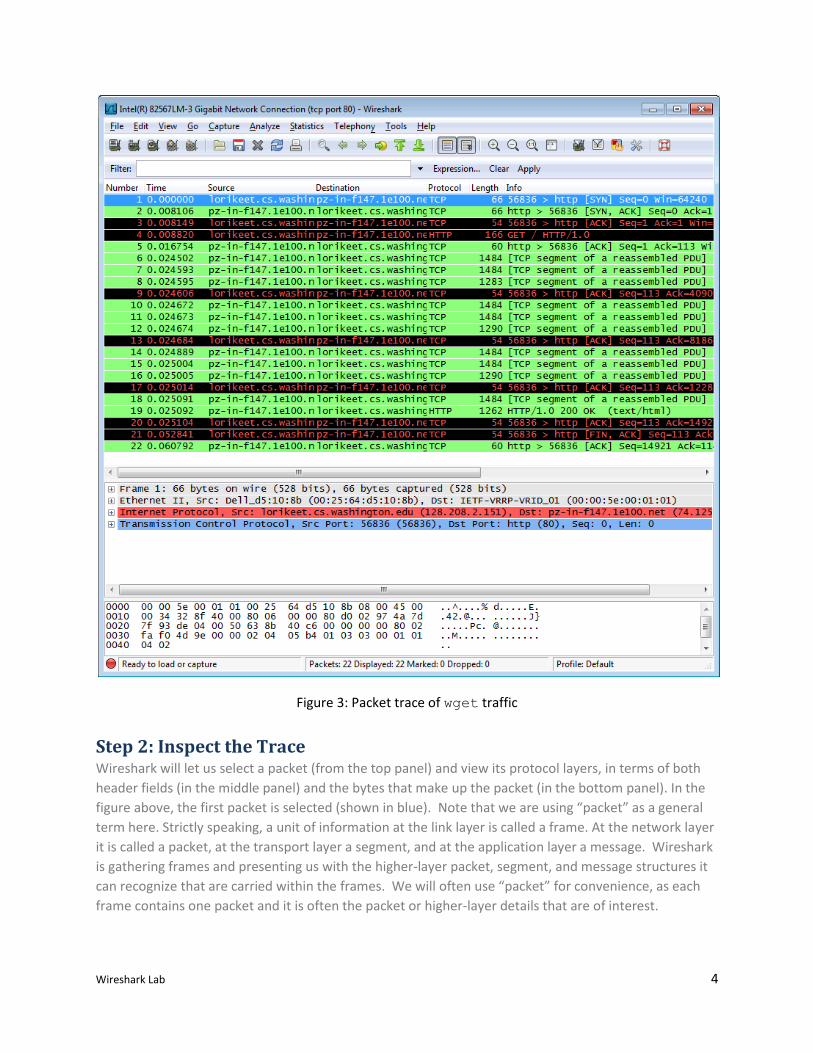
5. After the fetch is successful, return to Wireshark and use the menus or buttons to stop the trace.
If you have succeeded, the upper Wireshark window will show multiple packets, and most likely
it will be full. How many packets are captured will depend on the size of the web page, but there
should be at least 8 packets in the trace, and typically 20-100, and many of these packets will be
colored green. An example is shown below. Congratulations, you have captured a trace!
Wireshark Lab 4
Figure 3: Packet trace of wget traffic
Step 2: Inspect the Trace Wireshark will let us select a packet (from the top panel) and view its protocol layers, in terms of both
header fields (in the middle panel) and the bytes that make up the packet (in the bottom panel). In the
figure above, the first packet is selected (shown in blue). Note that we are using “packet” as a general
term here. Strictly speaking, a unit of information at the link layer is called a frame. At the network layer
it is called a packet, at the transport layer a segment, and at the application layer a message. Wireshark
is gathering frames and presenting us with the higher-layer packet, segment, and message structures it
can recognize that are carried within the frames. We will often use “packet” for convenience, as each
frame contains one packet and it is often the packet or higher-layer details that are of interest.
Wireshark Lab 5
Select a packet for which the Protocol column is “HTTP” and the Info column says it is a GET. It is the
packet that carries the web (HTTP) request sent from your computer to the server. (You can click the
column headings to sort by that value, though it should not be difficult to find an HTTP packet by inspec-
tion.) Let’s have a closer look to see how the packet structure reflects the protocols that are in use.
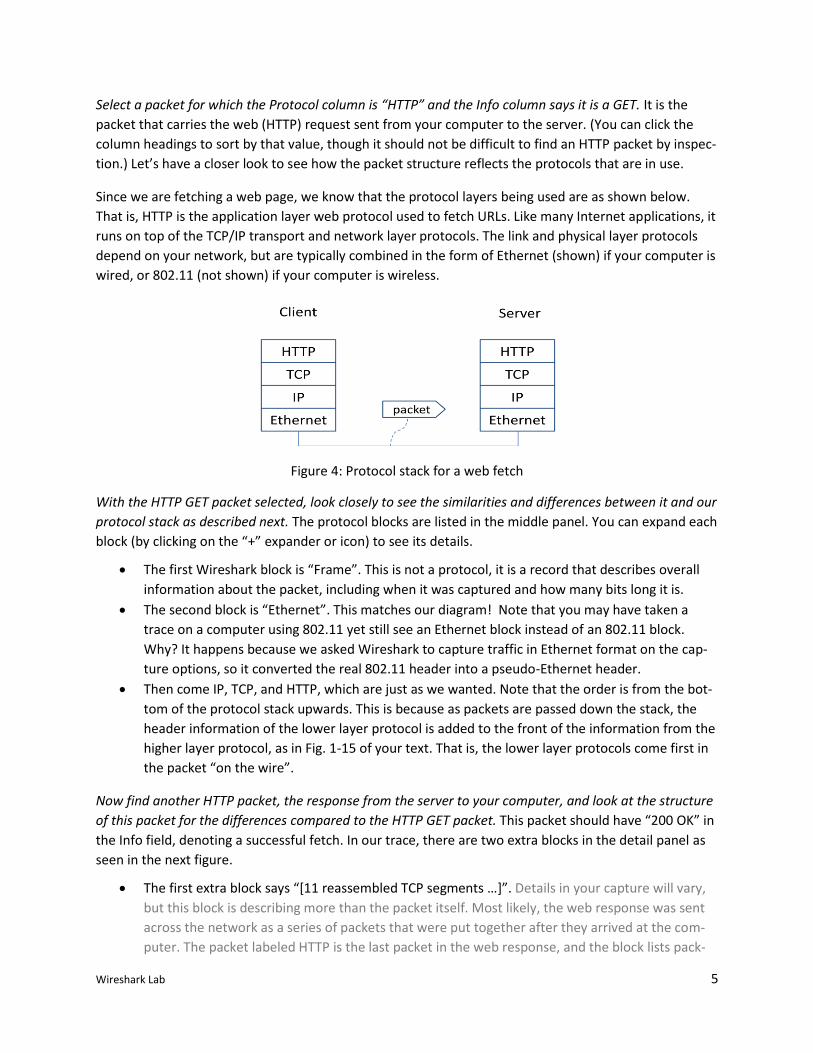
Since we are fetching a web page, we know that the protocol layers being used are as shown below.
That is, HTTP is the application layer web protocol used to fetch URLs. Like many Internet applications, it
runs on top of the TCP/IP transport and network layer protocols. The link and physical layer protocols
depend on your network, but are typically combined in the form of Ethernet (shown) if your computer is
wired, or 802.11 (not shown) if your computer is wireless.
Figure 4: Protocol stack for a web fetch
With the HTTP GET packet selected, look closely to see the similarities and differences between it and our
protocol stack as described next. The protocol blocks are listed in the middle panel. You can expand each
block (by clicking on the “+” expander or icon) to see its details.
The first Wireshark block is “Frame”. This is not a protocol, it is a record that describes overall
information about the packet, including when it was captured and how many bits long it is.
The second block is “Ethernet”. This matches our diagram! Note that you may have taken a
trace on a computer using 802.11 yet still see an Ethernet block instead of an 802.11 block.
Why? It happens because we asked Wireshark to capture traffic in Ethernet format on the cap-
ture options, so it converted the real 802.11 header into a pseudo-Ethernet header.
Then come IP, TCP, and HTTP, which are just as we wanted. Note that the order is from the bot-
tom of the protocol stack upwards. This is because as packets are passed down the stack, the
header information of the lower layer protocol is added to the front of the information from the
higher layer protocol, as in Fig. 1-15 of your text. That is, the lower layer protocols come first in
the packet “on the wire”.
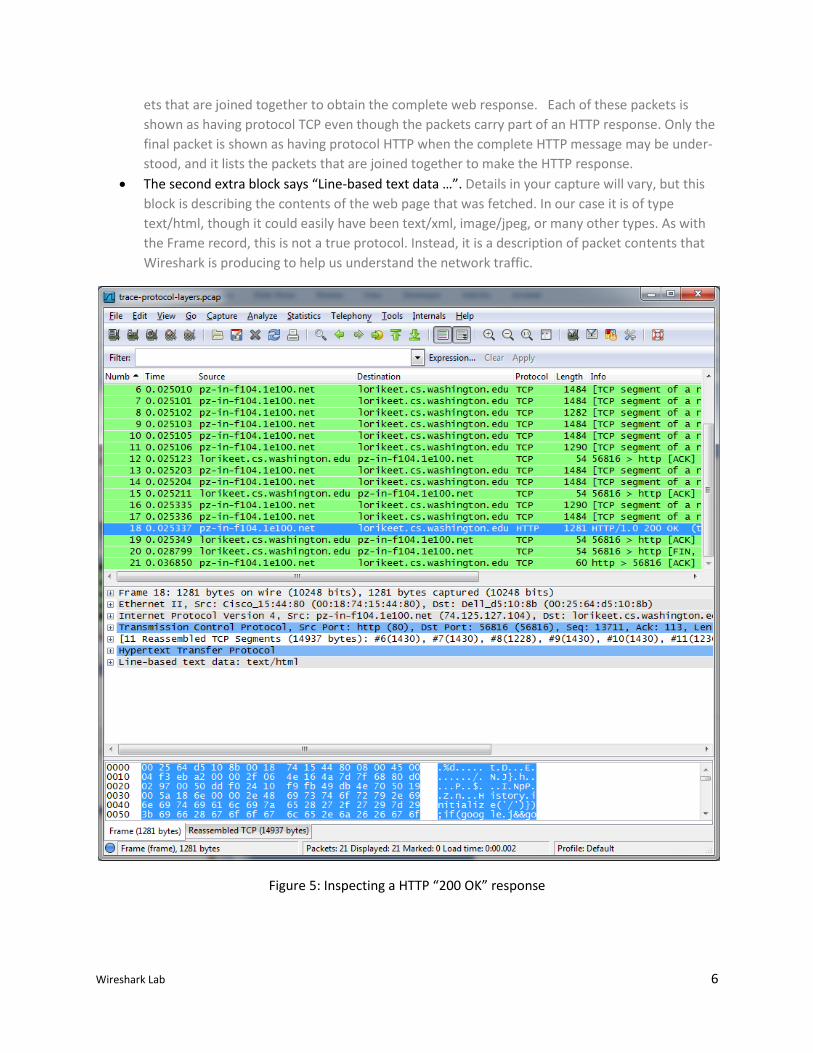
Now find another HTTP packet, the response from the server to your computer, and look at the structure
of this packet for the differences compared to the HTTP GET packet. This packet should have “200 OK” in
the Info field, denoting a successful fetch. In our trace, there are two extra blocks in the detail panel as
seen in the next figure.
The first extra block says “[11 reassembled TCP segments …]”. Details in your capture will vary,
but this block is describing more than the packet itself. Most likely, the web response was sent
across the network as a series of packets that were put together after they arrived at the com-
puter. The packet labeled HTTP is the last packet in the web response, and the block lists pack-
Wireshark Lab 6
ets that are joined together to obtain the complete web response. Each of these packets is
shown as having protocol TCP even though the packets carry part of an HTTP response. Only the
final packet is shown as having protocol HTTP when the complete HTTP message may be under-
stood, and it lists the packets that are joined together to make the HTTP response.
The second extra block says “Line-based text data …”. Details in your capture will vary, but this
block is describing the contents of the web page that was fetched. In our case it is of type
text/html, though it could easily have been text/xml, image/jpeg, or many other types. As with
the Frame record, this is not a true protocol. Instead, it is a description of packet contents that
Wireshark is producing to help us understand the network traffic.
Figure 5: Inspecting a HTTP “200 OK” response
Wireshark Lab 7
Step 3: Packet Structure To show your understanding of packet structure, draw a figure of an HTTP GET packet that shows the
position and size in bytes of the TCP, IP and Ethernet protocol headers. Your figure can simply show the
overall packet as a long, thin rectangle. Leftmost elements are the first sent on the wire. On this draw-
ing, show the range of the Ethernet header and the Ethernet payload that IP passed to Ethernet to send
over the network. To show the nesting structure of protocol layers, note the range of the IP header and
the IP payload. You may have questions about the fields in each protocol as you look at them. We will
explore these protocols and fields in detail in future labs.
To work out sizes, observe that when you click on a protocol block in the middle panel (the block itself,
not the “+” expander) then Wireshark will highlight the bytes it corresponds to in the packet in the low-
er panel and display the length at the bottom of the window. For instance, clicking on the IP version 4
header of a packet in our trace shows us that the length is 20 bytes. (Your trace will be different if it is
IPv6, and may be different even with IPv4 depending on various options.) You may also use the overall
packet size shown in the Length column or Frame detail block.
Step 4: Protocol Overhead Estimate the download protocol overhead, or percentage of the download bytes taken up by protocol
overhead. To do this, consider HTTP data (headers and message) to be useful data for the network to
carry, and lower layer headers (TCP, IP, and Ethernet) to be the overhead. We would like this overhead
to be small, so that most bits are used to carry content that applications care about. To work this out,
first look at only the packets in the download direction for a single web fetch. You might sort on the Des-
tination column to find them. The packets should start with a short TCP packet described as a SYN ACK,
which is the beginning of a connection. They will be followed by mostly longer packets in the middle (of
roughly 1 to 1.5KB), of which the last one is an HTTP packet. This is the main portion of the download.
And they will likely end with a short TCP packet that is part of ending the connection. For each packet,
you can inspect how much overhead it has in the form of Ethernet / IP / TCP headers, and how much
useful HTTP data it carries in the TCP payload. You may also look at the HTTP packet in Wireshark to
learn how much data is in the TCP payloads over all download packets.
Step 5: Demultiplexing Keys When an Ethernet frame arrives at a computer, the Ethernet layer must hand the packet that it contains
to the next higher layer to be processed. The act of finding the right higher layer to process received
packets is called demultiplexing. We know that in our case the higher layer is IP. But how does the
Ethernet protocol know this? After all, the higher-layer could have been another protocol entirely (such
as ARP). We have the same issue at the IP layer – IP must be able to determine that the contents of IP
message is a TCP packet so that it can hand it to the TCP protocol to process. The answer is that proto-
cols use information in their header known as a “demultiplexing key” to determine the higher layer.
Look at the Ethernet and IP headers of a download packet in detail to answer the following questions:
1. Which Ethernet header field is the demultiplexing key that tells it the next higher layer is IP?
What value is used in this field to indicate “IP”?
Wireshark Lab 8
2. Which IP header field is the demultiplexing key that tells it the next higher layer is TCP? What
value is used in this field to indicate “TCP”?
Step 6: Capture the Trace for a Ping Proceed as follows to capture a trace of ping packets; alternatively you may use a supplied trace. We will
use ping simply as an easy way to collect a small trace.
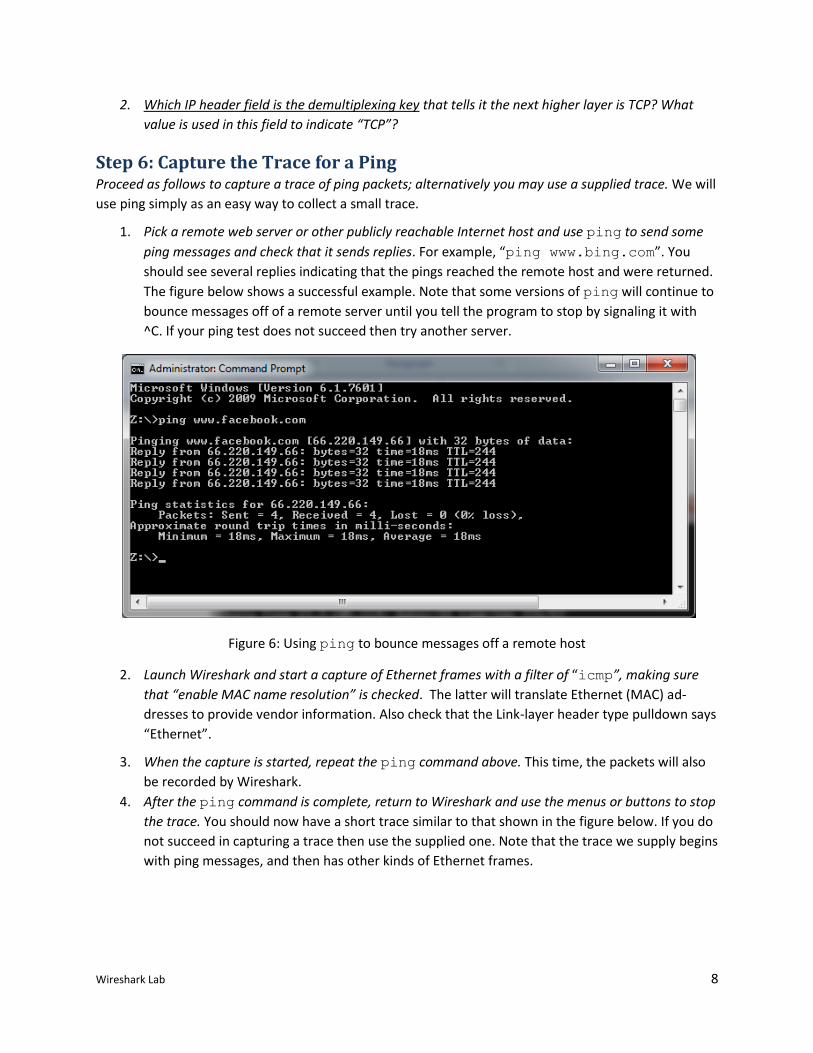
1. Pick a remote web server or other publicly reachable Internet host and use ping to send some
ping messages and check that it sends replies. For example, “ping www.bing.com”. You
should see several replies indicating that the pings reached the remote host and were returned.
The figure below shows a successful example. Note that some versions of ping will continue to
bounce messages off of a remote server until you tell the program to stop by signaling it with
^C. If your ping test does not succeed then try another server.
Figure 6: Using ping to bounce messages off a remote host
2. Launch Wireshark and start a capture of Ethernet frames with a filter of “icmp”, making sure
that “enable MAC name resolution” is checked. The latter will translate Ethernet (MAC) ad-
dresses to provide vendor information. Also check that the Link-layer header type pulldown says
“Ethernet”.
3. When the capture is started, repeat the ping command above. This time, the packets will also
be recorded by Wireshark.
4. After the ping command is complete, return to Wireshark and use the menus or buttons to stop
the trace. You should now have a short trace similar to that shown in the figure below. If you do
not succeed in capturing a trace then use the supplied one. Note that the trace we supply begins
with ping messages, and then has other kinds of Ethernet frames.
Wireshark Lab 9
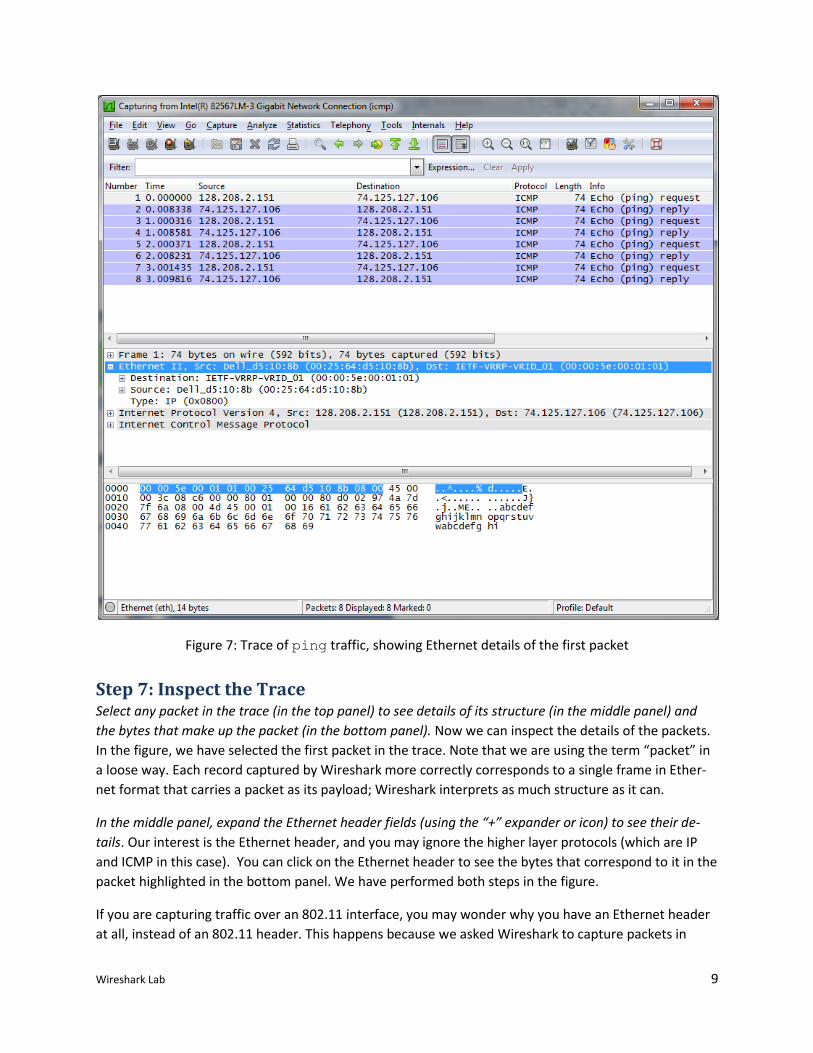
Figure 7: Trace of ping traffic, showing Ethernet details of the first packet
Step 7: Inspect the Trace Select any packet in the trace (in the top panel) to see details of its structure (in the middle panel) and
the bytes that make up the packet (in the bottom panel). Now we can inspect the details of the packets.
In the figure, we have selected the first packet in the trace. Note that we are using the term “packet” in
a loose way. Each record captured by Wireshark more correctly corresponds to a single frame in Ether-
net format that carries a packet as its payload; Wireshark interprets as much structure as it can.
In the middle panel, expand the Ethernet header fields (using the “+” expander or icon) to see their de-
tails. Our interest is the Ethernet header, and you may ignore the higher layer protocols (which are IP
and ICMP in this case). You can click on the Ethernet header to see the bytes that correspond to it in the
packet highlighted in the bottom panel. We have performed both steps in the figure.
If you are capturing traffic over an 802.11 interface, you may wonder why you have an Ethernet header
at all, instead of an 802.11 header. This happens because we asked Wireshark to capture packets in
Wireshark Lab 10
Ethernet format on the capture options (in Figure 2). In this case, the OS software converted the real
802.11 header into a pseudo-Ethernet header. We are seeing the pseudo-Ethernet header.
Compare the fields you see with the picture of an Ethernet frame in Fig. 4-14 of your text. You will see
both similarities and differences:
There are two kinds of Ethernet shown in the slides, IEEE 802.3 and DIX Ethernet. The latter is
rare. The frames in the figure and your capture are DIX, called “Ethernet II” in Wireshark.
There is no preamble in the fields shown in Wireshark. The preamble is a physical layer mecha-
nism to help the NIC identify the start of a frame. It carries no useful data and is not received
like other fields.
There is a destination address and a source address. Wireshark is decoding some of these bits in
the OUI (Organizationally Unique Identifier) portion of the address to tell us the vendor of the
NIC, e.g., Dell for the source address.
There is a Type field. For the ping messages, the Ethernet type is IP, meaning the Ethernet pay-
load carries an IP packet. (There is no Length field as in the IEEE 802.3 format. Instead, the
length of a DIX Ethernet frame is determined by the hardware of a receiving computer, which
looks for valid frames that start with a preamble and end with a correct checksum, and passed
up to higher layers along with the packet.)
There is no Data field per se – the data starts with the IP header right after the Ethernet header.
There is no pad. A pad will be present at the end if the frame would otherwise be less than 64
bytes, the minimum Ethernet frame size.
There is no checksum in most traces, even though it really does exist. Typically, Ethernet hard-
ware that is sending or receiving frames computes or checks this field and adds or strips it. Thus
it is simply not visible to the OS or Wireshark in most capture setups.
There are also no VLAN fields such as the Tag shown in Fig. 4-49. If VLANs are in use, the VLAN
tags are normally added and removed by switch ports so they will not be visible at host comput-
ers using the network.
Step 8: Ethernet Frame Structure To show your understanding of the Ethernet frame format, draw a figure of the ping message that shows
the position and size in bytes of the Ethernet header fields. Your figure can simply show the frame as a
long, thin rectangle. The leftmost fields come first in the packet and are sent on the wire first. On this
drawing, show the range of the Ethernet header and the Ethernet payload. Add a dashed box at the end
to represent the 4-byte checksum; we know it is there even if Wireshark does not show us this field.
To work out sizes, observe that when you click on a protocol block in the middle panel (the block itself,
not the “+” expander) then Wireshark will highlight the bytes it corresponds to in the packet in the low-
er panel and display the length at the bottom of the window. You may also use the overall packet size
shown in the Length column or Frame detail block.
Step 9: Scope of Ethernet Addresses Each Ethernet frame carries a source and destination address. One of these addresses is that of your
computer. It is the source for frames that are sent, and the destination for frames that are received. But
Wireshark Lab 11
what is the other address? Assuming you pinged a remote Internet server, it cannot be the Ethernet ad-
dress of the remote server because an Ethernet frame is only addressed to go within one LAN. Instead, it
will be the Ethernet address of the router or default gateway, such as your AP in the case of 802.11. This
is the device that connects your LAN to the rest of the Internet. In contrast, the IP addresses in the IP
block of each packet do indicate the overall source and destination endpoints. They are your computer
and the remote server.
Draw a figure that shows the relative positions of your computer, the router, and the remote server. La-
bel your computer and the router with their Ethernet addresses. Label your computer and the remote
server with their IP addresses. Show where the Ethernet and the rest of the Internet fit on the drawing.
Step 10: Broadcast Frames The trace that you gathered above captured unicast Ethernet traffic sent between a specific source and
destination, e.g., your computer to the router. It is also possible to send multicast or broadcast Ethernet
traffic, destined for a group of computers or all computers on the Ethernet, respectively. We can tell
from the address whether it is unicast, multicast, or broadcast. Broadcast traffic is sent to a reserved
Ethernet address that has all bits set to “1”. Multicast traffic is sent to addresses that have a “1” in the
first bit sent on the wire; broadcast is a special case of multicast. Broadcast and multicast traffic is widely
used for discovery protocols, e.g., a packet sent to everyone in an effort to find the local printer.
Start a capture for broadcast and multicast Ethernet frames with a filter of “ether multicast”, wait
up to 30 seconds to record background traffic, and then stop the capture. If you do not capture any
packets with this filter then use the trace that we supplied. On most Ethernets, there is a steady chatter
of background traffic as computers exchange messages to maintain network state, which is why we try
to capture traffic without running any other programs. The capture filter of “ether multicast” will
capture both multicast and broadcast Ethernet frames, but not regular unicast frames. You may have to
wait a little while for these packets to be captured, but on most LANs with multiple computers you will
see at least a packet every few seconds.
Examine the multicast and broadcast packets that you captured, looking at the details of the source and
destination addresses. Most likely one has the broadcast Ethernet address, as broadcast frames tend to
be more common than multicast frames. Look at a broadcast frame to see what address is used for
broadcast by Ethernet. Expand the Ethernet address fields of either broadcast or multicast frames to see
which bit is set to distinguish broadcast/multicast or group traffic from unicast traffic.
Answer the following questions:
1. What is the broadcast Ethernet address, written in standard form as Wireshark displays it?
2. Which bit of the Ethernet address is used to determine whether it is unicast or mul-
ticast/broadcast?
Explore on your own We encourage you to explore protocols and layering once you have completed this lab. Some ideas:
Wireshark Lab 12
Look at a short TCP packet that carries no higher-layer data. To what entity is this packet des-
tined? After all, if it carries no higher-layer data then it does not seem very useful to a higher
layer protocol such as HTTP!
In a classic layered model, one message from a higher layer has a header appended by the lower
layer and becomes one new message. But this is not always the case. Above, we saw a trace in
which the web response (one HTTP message comprised of an HTTP header and an HTTP pay-
load) was converted into multiple lower layer messages (being multiple TCP packets). Imagine
that you have drawn the packet structure (as in step 2) for the first and last TCP packet carrying
the web response. How will the drawings differ?
In the classic layered model described above, lower layers append headers to the messages
passed down from higher layers. How will this model change if a lower layer adds encryption?
In the classic layered model described above, lower layers append headers to the messages
passed down from higher layers. How will this model change if a lower layer adds compression?