Embed Size (px)
Citation preview
Lab on a Chip
Publ
ishe
d on
30
Mar
ch 2
015.
Dow
nloa
ded
by P
rinc
eton
Uni
vers
ity o
n 09
/04/
2015
13:
15:4
3.
PAPER View Article OnlineView Journal
This journal is © The Royal Society of Chemistry 2015
aDepartment of Electrical Engineering, Princeton University, Princeton, NJ 08540,
USA. E-mail: [email protected] of Physics, Princeton University, Princeton, NJ 08540, USA
Cite this: DOI: 10.1039/c4lc01409j
Received 2nd December 2014,Accepted 30th March 2015
DOI: 10.1039/c4lc01409j
www.rsc.org/loc
Inhibition of clot formation in deterministic lateraldisplacement arrays for processing large volumesof blood for rare cell capture
Joseph D'Silva,*a Robert H. Austinb and James C. Sturma
Microfluidic deterministic lateral displacement (DLD) arrays have been applied for fractionation and analysis
of cells in quantities of ~100 μL of blood, with processing of larger quantities limited by clogging in the
chip. In this paper, we (i) demonstrate that this clogging phenomenon is due to conventional platelet-
driven clot formation, (ii) identify and inhibit the two dominant biological mechanisms driving this process,
and (iii) characterize how further reductions in clot formation can be achieved through higher flow rates
and blood dilution. Following from these three advances, we demonstrate processing of 14 mL equivalent
volume of undiluted whole blood through a single DLD array in 38 minutes to harvest PC3 cancer cells
with ~86% yield. It is possible to fit more than 10 such DLD arrays on a single chip, which would then pro-
vide the capability to process well over 100 mL of undiluted whole blood on a single chip in less than one
hour.
I. Introduction
Deterministic lateral displacement (DLD) arrays are micro-fluidic devices that offer continuous-flow separation of parti-cles suspended in a fluid based on size. The mechanism ofaction is that suspended particles in a fluid that are largerthan a critical size experience sequential displacement(“bumping”) from one streamtube to an adjacent one in adirection perpendicular to the flow by micro-posts that arearranged in a tilted rectangular array.1 The critical size abovewhich particles are bumped is controlled by the gap betweenthe posts in the array and the tilt angle.2 Since blood containscells that range in size from 1 μm to 20 μm with the size of acell often being related to its biological function, DLD arraysare well suited to fractionation of blood into leukocytes, eryth-rocytes, and platelet-rich plasma.3
Recent work has focused on using DLD arrays to selec-tively capture rare cells of biological interest. D. W. Ingliset al. demonstrated that DLD arrays can be used to separatemalignant lymphocytes from healthy lymphocytes.4 L. R.Huang et al. have used DLD arrays to capture nucleated redblood cells from the peripheral blood of pregnant women forapplications in prenatal diagnostics.5 S. H. Holm et al. haveused DLD arrays to separate parasites from human blood.6 B.Zhang et al. have used DLD arrays to separate cardiomyocytes
from blood.7 Typical volumes of blood processed for suchapplications have been limited to 100 μL per DLD array.
While the capture efficiencies achievable with DLD arraysare sufficiently high to be useful in rare cell capture (>85%),capturing biologically useful quantities of rare cells requiresprocessing of large volumes of blood. Recently, K.Loutherback et al. operated DLD arrays at flow rates as highas 10 mL min−1, removing one key barrier to processing largevolumes of blood.8 However, even at this high flow rate, thevolume of blood processed was limited to less than 200 μLper DLD array due to clogging in the array. In this paper, wedemonstrate that this clogging process is due to the forma-tion of blood clots and identify and inhibit the underlyingphysical and biological mechanisms driving this process.
Clot formation in DLD arrays imposes three significantlimitations on device performance. First, the clot increasesthe fluidic resistance of the array, limiting the flow rate for agiven pressure. Second, the clot formation can alter the flowpattern in a way that affects the critical size or simply dis-place cells below the critical size, making it appear that thesecells behave similar to cells above the critical size and thusdecreasing the enrichment. Third, the clot formation cap-tures target cells thus decreasing the yield of a separationprocess.
The limitations imposed by clot formation in the DLDarray have been addressed in recent work. S. Zheng et al.showed that clogging occurred where the cells entered thearray and explore the effects of dilution and age of the bloodon clogging.9 S. H. Holm et al. reported no clot formationwith coagulation of blood being prevented by EDTA at a
Lab Chip
Lab on a ChipPaper
Publ
ishe
d on
30
Mar
ch 2
015.
Dow
nloa
ded
by P
rinc
eton
Uni
vers
ity o
n 09
/04/
2015
13:
15:4
3.
View Article Online
concentration of 6 mM. However, the volumes of blood beingprocessed were still very small (~10 μL), the dilution was high(20×), and the flow rate was low (~3 μL min−1).5 D. W. Ingliset al. mentioned the regular observation of blockages arisingin the array from large clot-like structures in the blooddespite the removal of such clot-like structures via pre-filtration before blood is loaded onto the array.10
The effect of surface properties on clot formation in sili-con microfluidic devices has been studied extensively.11 Clotformation in DLD arrays has been observed in both silicondevices and PDMS devices, suggesting that activation of thecontact activation coagulation pathway due to contact withsilicon dioxide (glass) is not the dominant mechanism driv-ing clot formation in DLD arrays.5,9,10 In both silicon andPDMS DLD arrays, bovine serum albumin (BSA) has beenused at a concentration of 1% (1 g per 100 mL) to reducenon-specific adhesion.3–8,10 We use BSA in this work at thisconcentration as a control in order to allow comparison withprevious work.
Our experiments are conducted using DLD arraysreactively-etched in silicon to a depth of 160 μm by an isotro-pic deep-etching process. The arrays are lidded with apressure-sealing tape consisting of a thin silicone layer with apolyolefin backing. The lidded device is mounted in anacrylic manifold to which fluidic connections are made via O-rings. A dual-syringe pump is used to drive buffer and sample(diluted blood) through the chip. Flow velocities in the arrayare reported as the syringe volume flow rate divided by thecross section formed by the depth of the channel (160 μm)and the period of the array (post width + gap width = 100μm) times the number of gaps through which the fluid isflowing (14 for a typical array) for a total effective width of1.4 mm.
Whole adult human blood from healthy donors was pur-chased from Interstate Blood Bank (Memphis, TN) for use inour experiments. Blood samples were shipped overnight in
Lab Chip
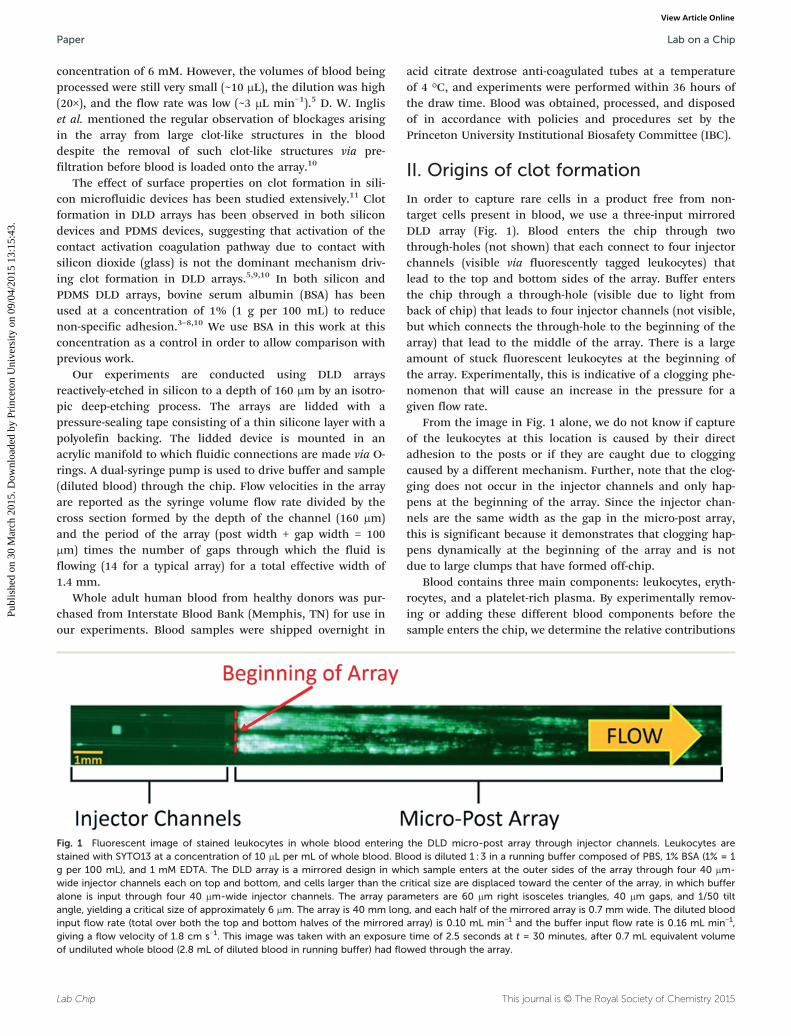
Fig. 1 Fluorescent image of stained leukocytes in whole blood enteringstained with SYTO13 at a concentration of 10 μL per mL of whole blood. Blg per 100 mL), and 1 mM EDTA. The DLD array is a mirrored design in whwide injector channels each on top and bottom, and cells larger than the calone is input through four 40 μm-wide injector channels. The array paraangle, yielding a critical size of approximately 6 μm. The array is 40 mm loninput flow rate (total over both the top and bottom halves of the mirroredgiving a flow velocity of 1.8 cm s−1. This image was taken with an exposureof undiluted whole blood (2.8 mL of diluted blood in running buffer) had flo
acid citrate dextrose anti-coagulated tubes at a temperatureof 4 °C, and experiments were performed within 36 hours ofthe draw time. Blood was obtained, processed, and disposedof in accordance with policies and procedures set by thePrinceton University Institutional Biosafety Committee (IBC).
II. Origins of clot formation
In order to capture rare cells in a product free from non-target cells present in blood, we use a three-input mirroredDLD array (Fig. 1). Blood enters the chip through twothrough-holes (not shown) that each connect to four injectorchannels (visible via fluorescently tagged leukocytes) thatlead to the top and bottom sides of the array. Buffer entersthe chip through a through-hole (visible due to light fromback of chip) that leads to four injector channels (not visible,but which connects the through-hole to the beginning of thearray) that lead to the middle of the array. There is a largeamount of stuck fluorescent leukocytes at the beginning ofthe array. Experimentally, this is indicative of a clogging phe-nomenon that will cause an increase in the pressure for agiven flow rate.
From the image in Fig. 1 alone, we do not know if captureof the leukocytes at this location is caused by their directadhesion to the posts or if they are caught due to cloggingcaused by a different mechanism. Further, note that the clog-ging does not occur in the injector channels and only hap-pens at the beginning of the array. Since the injector chan-nels are the same width as the gap in the micro-post array,this is significant because it demonstrates that clogging hap-pens dynamically at the beginning of the array and is notdue to large clumps that have formed off-chip.
Blood contains three main components: leukocytes, eryth-rocytes, and a platelet-rich plasma. By experimentally remov-ing or adding these different blood components before thesample enters the chip, we determine the relative contributions
This journal is © The Royal Society of Chemistry 2015
the DLD micro-post array through injector channels. Leukocytes areood is diluted 1 : 3 in a running buffer composed of PBS, 1% BSA (1% = 1ich sample enters at the outer sides of the array through four 40 μm-ritical size are displaced toward the center of the array, in which buffermeters are 60 μm right isosceles triangles, 40 μm gaps, and 1/50 tiltg, and each half of the mirrored array is 0.7 mm wide. The diluted bloodarray) is 0.10 mL min−1 and the buffer input flow rate is 0.16 mL min−1,time of 2.5 seconds at t = 30 minutes, after 0.7 mL equivalent volumewed through the array.
Lab on a Chip Paper
Publ
ishe
d on
30
Mar
ch 2
015.
Dow
nloa
ded
by P
rinc
eton
Uni
vers
ity o
n 09
/04/
2015
13:
15:4
3.
View Article Online
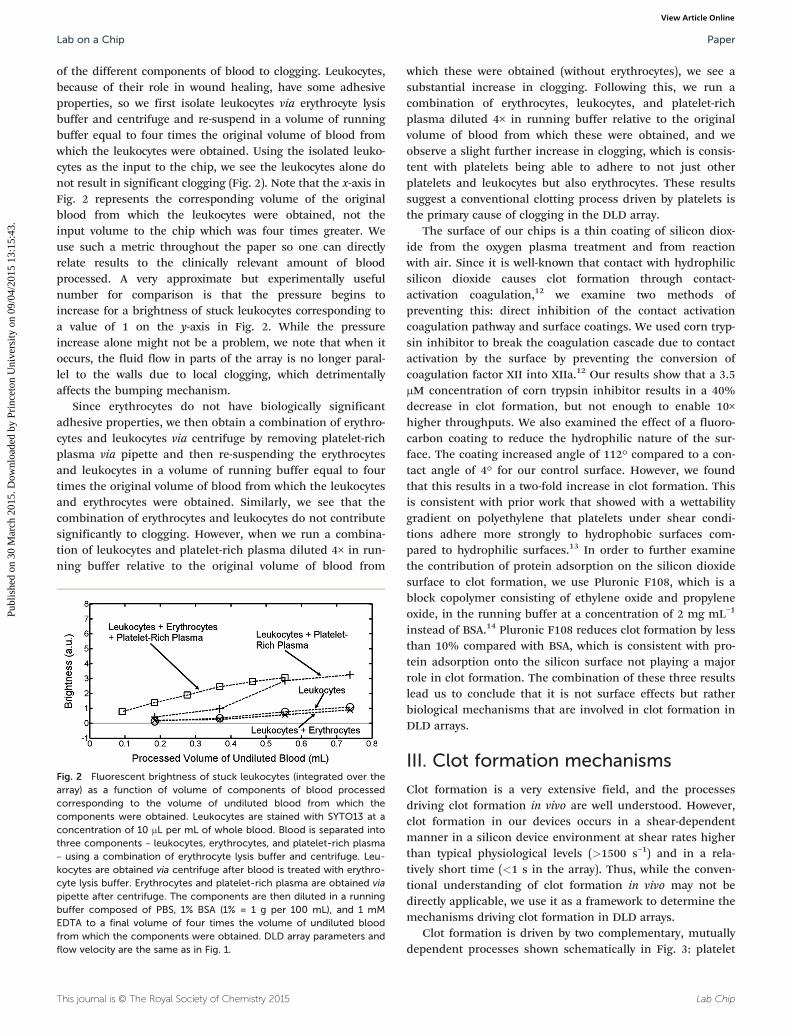
of the different components of blood to clogging. Leukocytes,because of their role in wound healing, have some adhesiveproperties, so we first isolate leukocytes via erythrocyte lysisbuffer and centrifuge and re-suspend in a volume of runningbuffer equal to four times the original volume of blood fromwhich the leukocytes were obtained. Using the isolated leuko-cytes as the input to the chip, we see the leukocytes alone donot result in significant clogging (Fig. 2). Note that the x-axis inFig. 2 represents the corresponding volume of the originalblood from which the leukocytes were obtained, not theinput volume to the chip which was four times greater. Weuse such a metric throughout the paper so one can directlyrelate results to the clinically relevant amount of bloodprocessed. A very approximate but experimentally usefulnumber for comparison is that the pressure begins toincrease for a brightness of stuck leukocytes corresponding toa value of 1 on the y-axis in Fig. 2. While the pressureincrease alone might not be a problem, we note that when itoccurs, the fluid flow in parts of the array is no longer paral-lel to the walls due to local clogging, which detrimentallyaffects the bumping mechanism.
Since erythrocytes do not have biologically significantadhesive properties, we then obtain a combination of erythro-cytes and leukocytes via centrifuge by removing platelet-richplasma via pipette and then re-suspending the erythrocytesand leukocytes in a volume of running buffer equal to fourtimes the original volume of blood from which the leukocytesand erythrocytes were obtained. Similarly, we see that thecombination of erythrocytes and leukocytes do not contributesignificantly to clogging. However, when we run a combina-tion of leukocytes and platelet-rich plasma diluted 4× in run-ning buffer relative to the original volume of blood from
This journal is © The Royal Society of Chemistry 2015
Fig. 2 Fluorescent brightness of stuck leukocytes (integrated over thearray) as a function of volume of components of blood processedcorresponding to the volume of undiluted blood from which thecomponents were obtained. Leukocytes are stained with SYTO13 at aconcentration of 10 μL per mL of whole blood. Blood is separated intothree components – leukocytes, erythrocytes, and platelet-rich plasma– using a combination of erythrocyte lysis buffer and centrifuge. Leu-kocytes are obtained via centrifuge after blood is treated with erythro-cyte lysis buffer. Erythrocytes and platelet-rich plasma are obtained viapipette after centrifuge. The components are then diluted in a runningbuffer composed of PBS, 1% BSA (1% = 1 g per 100 mL), and 1 mMEDTA to a final volume of four times the volume of undiluted bloodfrom which the components were obtained. DLD array parameters andflow velocity are the same as in Fig. 1.
which these were obtained (without erythrocytes), we see asubstantial increase in clogging. Following this, we run acombination of erythrocytes, leukocytes, and platelet-richplasma diluted 4× in running buffer relative to the originalvolume of blood from which these were obtained, and weobserve a slight further increase in clogging, which is consis-tent with platelets being able to adhere to not just otherplatelets and leukocytes but also erythrocytes. These resultssuggest a conventional clotting process driven by platelets isthe primary cause of clogging in the DLD array.
The surface of our chips is a thin coating of silicon diox-ide from the oxygen plasma treatment and from reactionwith air. Since it is well-known that contact with hydrophilicsilicon dioxide causes clot formation through contact-activation coagulation,12 we examine two methods ofpreventing this: direct inhibition of the contact activationcoagulation pathway and surface coatings. We used corn tryp-sin inhibitor to break the coagulation cascade due to contactactivation by the surface by preventing the conversion ofcoagulation factor XII into XIIa.12 Our results show that a 3.5μM concentration of corn trypsin inhibitor results in a 40%decrease in clot formation, but not enough to enable 10×higher throughputs. We also examined the effect of a fluoro-carbon coating to reduce the hydrophilic nature of the sur-face. The coating increased angle of 112° compared to a con-tact angle of 4° for our control surface. However, we foundthat this results in a two-fold increase in clot formation. Thisis consistent with prior work that showed with a wettabilitygradient on polyethylene that platelets under shear condi-tions adhere more strongly to hydrophobic surfaces com-pared to hydrophilic surfaces.13 In order to further examinethe contribution of protein adsorption on the silicon dioxidesurface to clot formation, we use Pluronic F108, which is ablock copolymer consisting of ethylene oxide and propyleneoxide, in the running buffer at a concentration of 2 mg mL−1
instead of BSA.14 Pluronic F108 reduces clot formation by lessthan 10% compared with BSA, which is consistent with pro-tein adsorption onto the silicon surface not playing a majorrole in clot formation. The combination of these three resultslead us to conclude that it is not surface effects but ratherbiological mechanisms that are involved in clot formation inDLD arrays.
III. Clot formation mechanisms
Clot formation is a very extensive field, and the processesdriving clot formation in vivo are well understood. However,clot formation in our devices occurs in a shear-dependentmanner in a silicon device environment at shear rates higherthan typical physiological levels (>1500 s−1) and in a rela-tively short time (<1 s in the array). Thus, while the conven-tional understanding of clot formation in vivo may not bedirectly applicable, we use it as a framework to determine themechanisms driving clot formation in DLD arrays.
Clot formation is driven by two complementary, mutuallydependent processes shown schematically in Fig. 3: platelet
Lab Chip
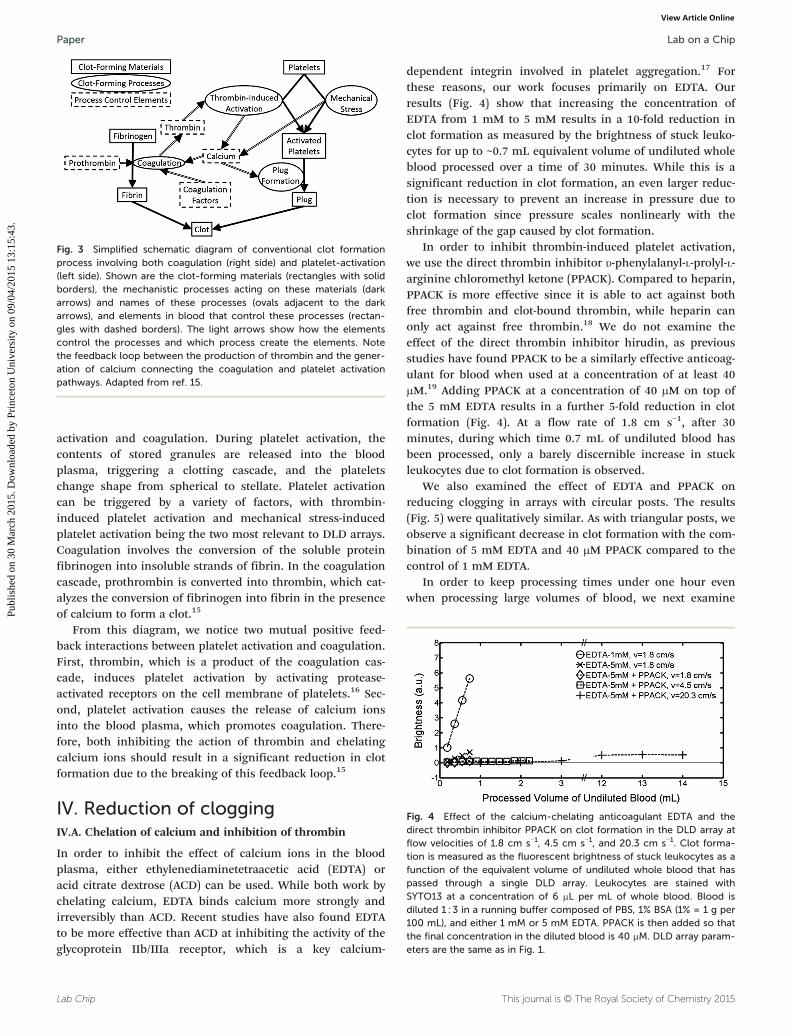
Fig. 3 Simplified schematic diagram of conventional clot formationprocess involving both coagulation (right side) and platelet-activation(left side). Shown are the clot-forming materials (rectangles with solidborders), the mechanistic processes acting on these materials (darkarrows) and names of these processes (ovals adjacent to the darkarrows), and elements in blood that control these processes (rectan-gles with dashed borders). The light arrows show how the elementscontrol the processes and which process create the elements. Notethe feedback loop between the production of thrombin and the gener-ation of calcium connecting the coagulation and platelet activationpathways. Adapted from ref. 15.
Fig. 4 Effect of the calcium-chelating anticoagulant EDTA and thedirect thrombin inhibitor PPACK on clot formation in the DLD array atflow velocities of 1.8 cm s−1, 4.5 cm s−1, and 20.3 cm s−1. Clot forma-tion is measured as the fluorescent brightness of stuck leukocytes as afunction of the equivalent volume of undiluted whole blood that haspassed through a single DLD array. Leukocytes are stained withSYTO13 at a concentration of 6 μL per mL of whole blood. Blood isdiluted 1 : 3 in a running buffer composed of PBS, 1% BSA (1% = 1 g per100 mL), and either 1 mM or 5 mM EDTA. PPACK is then added so thatthe final concentration in the diluted blood is 40 μM. DLD array param-eters are the same as in Fig. 1.
Lab on a ChipPaper
Publ
ishe
d on
30
Mar
ch 2
015.
Dow
nloa
ded
by P
rinc
eton
Uni
vers
ity o
n 09
/04/
2015
13:
15:4
3.
View Article Online
activation and coagulation. During platelet activation, thecontents of stored granules are released into the bloodplasma, triggering a clotting cascade, and the plateletschange shape from spherical to stellate. Platelet activationcan be triggered by a variety of factors, with thrombin-induced platelet activation and mechanical stress-inducedplatelet activation being the two most relevant to DLD arrays.Coagulation involves the conversion of the soluble proteinfibrinogen into insoluble strands of fibrin. In the coagulationcascade, prothrombin is converted into thrombin, which cat-alyzes the conversion of fibrinogen into fibrin in the presenceof calcium to form a clot.15
From this diagram, we notice two mutual positive feed-back interactions between platelet activation and coagulation.First, thrombin, which is a product of the coagulation cas-cade, induces platelet activation by activating protease-activated receptors on the cell membrane of platelets.16 Sec-ond, platelet activation causes the release of calcium ionsinto the blood plasma, which promotes coagulation. There-fore, both inhibiting the action of thrombin and chelatingcalcium ions should result in a significant reduction in clotformation due to the breaking of this feedback loop.15
IV. Reduction of cloggingIV.A. Chelation of calcium and inhibition of thrombin
In order to inhibit the effect of calcium ions in the bloodplasma, either ethylenediaminetetraacetic acid (EDTA) oracid citrate dextrose (ACD) can be used. While both work bychelating calcium, EDTA binds calcium more strongly andirreversibly than ACD. Recent studies have also found EDTAto be more effective than ACD at inhibiting the activity of theglycoprotein IIb/IIIa receptor, which is a key calcium-
Lab Chip
dependent integrin involved in platelet aggregation.17 Forthese reasons, our work focuses primarily on EDTA. Ourresults (Fig. 4) show that increasing the concentration ofEDTA from 1 mM to 5 mM results in a 10-fold reduction inclot formation as measured by the brightness of stuck leuko-cytes for up to ~0.7 mL equivalent volume of undiluted wholeblood processed over a time of 30 minutes. While this is asignificant reduction in clot formation, an even larger reduc-tion is necessary to prevent an increase in pressure due toclot formation since pressure scales nonlinearly with theshrinkage of the gap caused by clot formation.
In order to inhibit thrombin-induced platelet activation,we use the direct thrombin inhibitor D-phenylalanyl-L-prolyl-L-arginine chloromethyl ketone (PPACK). Compared to heparin,PPACK is more effective since it is able to act against bothfree thrombin and clot-bound thrombin, while heparin canonly act against free thrombin.18 We do not examine theeffect of the direct thrombin inhibitor hirudin, as previousstudies have found PPACK to be a similarly effective anticoag-ulant for blood when used at a concentration of at least 40μM.19 Adding PPACK at a concentration of 40 μM on top ofthe 5 mM EDTA results in a further 5-fold reduction in clotformation (Fig. 4). At a flow rate of 1.8 cm s−1, after 30minutes, during which time 0.7 mL of undiluted blood hasbeen processed, only a barely discernible increase in stuckleukocytes due to clot formation is observed.
We also examined the effect of EDTA and PPACK onreducing clogging in arrays with circular posts. The results(Fig. 5) were qualitatively similar. As with triangular posts, weobserve a significant decrease in clot formation with the com-bination of 5 mM EDTA and 40 μM PPACK compared to thecontrol of 1 mM EDTA.
In order to keep processing times under one hour evenwhen processing large volumes of blood, we next examine
This journal is © The Royal Society of Chemistry 2015
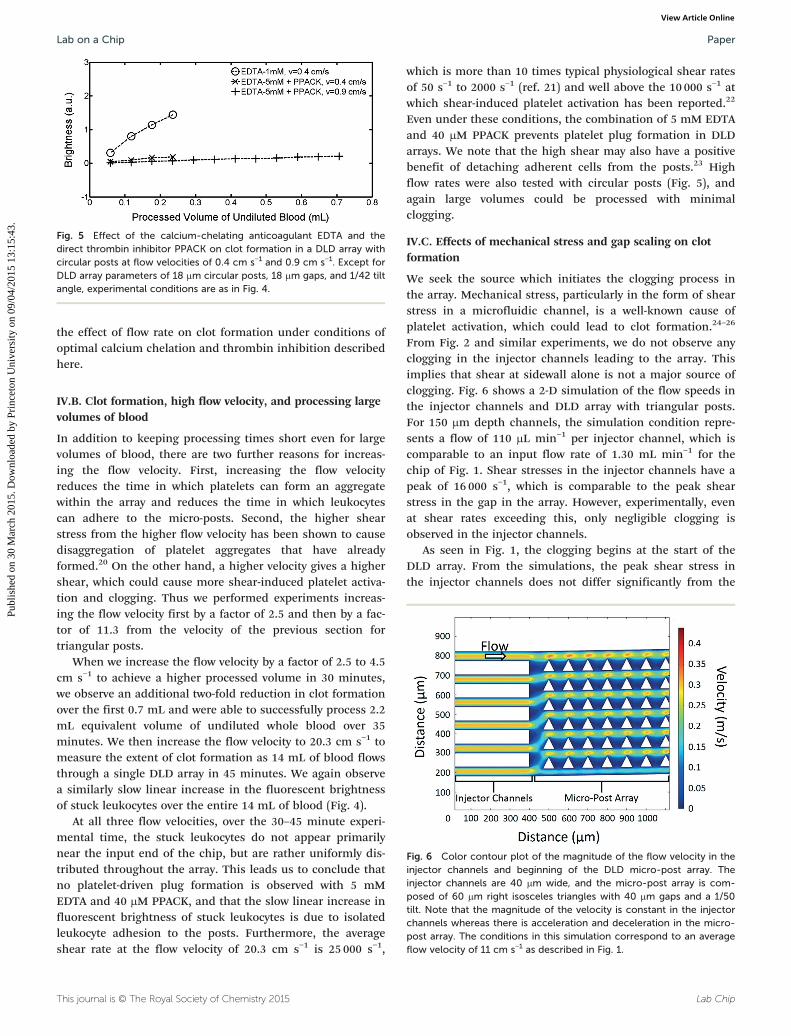
Fig. 5 Effect of the calcium-chelating anticoagulant EDTA and thedirect thrombin inhibitor PPACK on clot formation in a DLD array withcircular posts at flow velocities of 0.4 cm s−1 and 0.9 cm s−1. Except forDLD array parameters of 18 μm circular posts, 18 μm gaps, and 1/42 tiltangle, experimental conditions are as in Fig. 4.
Fig. 6 Color contour plot of the magnitude of the flow velocity in theinjector channels and beginning of the DLD micro-post array. Theinjector channels are 40 μm wide, and the micro-post array is com-posed of 60 μm right isosceles triangles with 40 μm gaps and a 1/50tilt. Note that the magnitude of the velocity is constant in the injectorchannels whereas there is acceleration and deceleration in the micro-post array. The conditions in this simulation correspond to an averageflow velocity of 11 cm s−1 as described in Fig. 1.
Lab on a Chip Paper
Publ
ishe
d on
30
Mar
ch 2
015.
Dow
nloa
ded
by P
rinc
eton
Uni
vers
ity o
n 09
/04/
2015
13:
15:4
3.
View Article Online
the effect of flow rate on clot formation under conditions ofoptimal calcium chelation and thrombin inhibition describedhere.
IV.B. Clot formation, high flow velocity, and processing largevolumes of blood
In addition to keeping processing times short even for largevolumes of blood, there are two further reasons for increas-ing the flow velocity. First, increasing the flow velocityreduces the time in which platelets can form an aggregatewithin the array and reduces the time in which leukocytescan adhere to the micro-posts. Second, the higher shearstress from the higher flow velocity has been shown to causedisaggregation of platelet aggregates that have alreadyformed.20 On the other hand, a higher velocity gives a highershear, which could cause more shear-induced platelet activa-tion and clogging. Thus we performed experiments increas-ing the flow velocity first by a factor of 2.5 and then by a fac-tor of 11.3 from the velocity of the previous section fortriangular posts.
When we increase the flow velocity by a factor of 2.5 to 4.5cm s−1 to achieve a higher processed volume in 30 minutes,we observe an additional two-fold reduction in clot formationover the first 0.7 mL and were able to successfully process 2.2mL equivalent volume of undiluted whole blood over 35minutes. We then increase the flow velocity to 20.3 cm s−1 tomeasure the extent of clot formation as 14 mL of blood flowsthrough a single DLD array in 45 minutes. We again observea similarly slow linear increase in the fluorescent brightnessof stuck leukocytes over the entire 14 mL of blood (Fig. 4).
At all three flow velocities, over the 30–45 minute experi-mental time, the stuck leukocytes do not appear primarilynear the input end of the chip, but are rather uniformly dis-tributed throughout the array. This leads us to conclude thatno platelet-driven plug formation is observed with 5 mMEDTA and 40 μM PPACK, and that the slow linear increase influorescent brightness of stuck leukocytes is due to isolatedleukocyte adhesion to the posts. Furthermore, the averageshear rate at the flow velocity of 20.3 cm s−1 is 25 000 s−1,
This journal is © The Royal Society of Chemistry 2015
which is more than 10 times typical physiological shear ratesof 50 s−1 to 2000 s−1 (ref. 21) and well above the 10 000 s−1 atwhich shear-induced platelet activation has been reported.22
Even under these conditions, the combination of 5 mM EDTAand 40 μM PPACK prevents platelet plug formation in DLDarrays. We note that the high shear may also have a positivebenefit of detaching adherent cells from the posts.23 Highflow rates were also tested with circular posts (Fig. 5), andagain large volumes could be processed with minimalclogging.
IV.C. Effects of mechanical stress and gap scaling on clotformation
We seek the source which initiates the clogging process inthe array. Mechanical stress, particularly in the form of shearstress in a microfluidic channel, is a well-known cause ofplatelet activation, which could lead to clot formation.24–26
From Fig. 2 and similar experiments, we do not observe anyclogging in the injector channels leading to the array. Thisimplies that shear at sidewall alone is not a major source ofclogging. Fig. 6 shows a 2-D simulation of the flow speeds inthe injector channels and DLD array with triangular posts.For 150 μm depth channels, the simulation condition repre-sents a flow of 110 μL min−1 per injector channel, which iscomparable to an input flow rate of 1.30 mL min−1 for thechip of Fig. 1. Shear stresses in the injector channels have apeak of 16 000 s−1, which is comparable to the peak shearstress in the gap in the array. However, experimentally, evenat shear rates exceeding this, only negligible clogging isobserved in the injector channels.
As seen in Fig. 1, the clogging begins at the start of theDLD array. From the simulations, the peak shear stress inthe injector channels does not differ significantly from the
Lab Chip
Lab on a ChipPaper
Publ
ishe
d on
30
Mar
ch 2
015.
Dow
nloa
ded
by P
rinc
eton
Uni
vers
ity o
n 09
/04/
2015
13:
15:4
3.
View Article Online
peak shear stress in the array, but the shear stress increasesand decreases rapidly vs. time as the fluid accelerates anddecelerates in the array. It has previously been shown that fora single constriction, similar to a single gap in the array, in ablood vessel, a clot expands from a small aggregate of plate-lets through adhesion of platelets in the low-shear zones atthe downstream face of the clot.27 While no such low-shearzones exist in the injector channels, the acceleration anddeceleration of the fluid in the gaps provide a number ofsuch low-shear zones for a clot to form.
Shear-induced platelet activation requires platelet mem-brane glycoproteins Ib and IIb-IIIa as well as the presence ofvon Willebrand factor.28 We measure the effect of the glyco-protein IIb-IIIa inhibitor tirofiban at a concentration of 100ng mL−1 of blood to test the contribution of shear-inducedplatelet aggregation to clot formation.29 Our results (with 1mM EDTA) show that tirofiban at this concentration reducesclot formation by 40% at a flow velocity of 1.8 cm s−1 for thefirst 0.7 mL of blood through the array. This provides furthersupport that mechanical shear stress is an important factorin initiating the clogging process in the array.
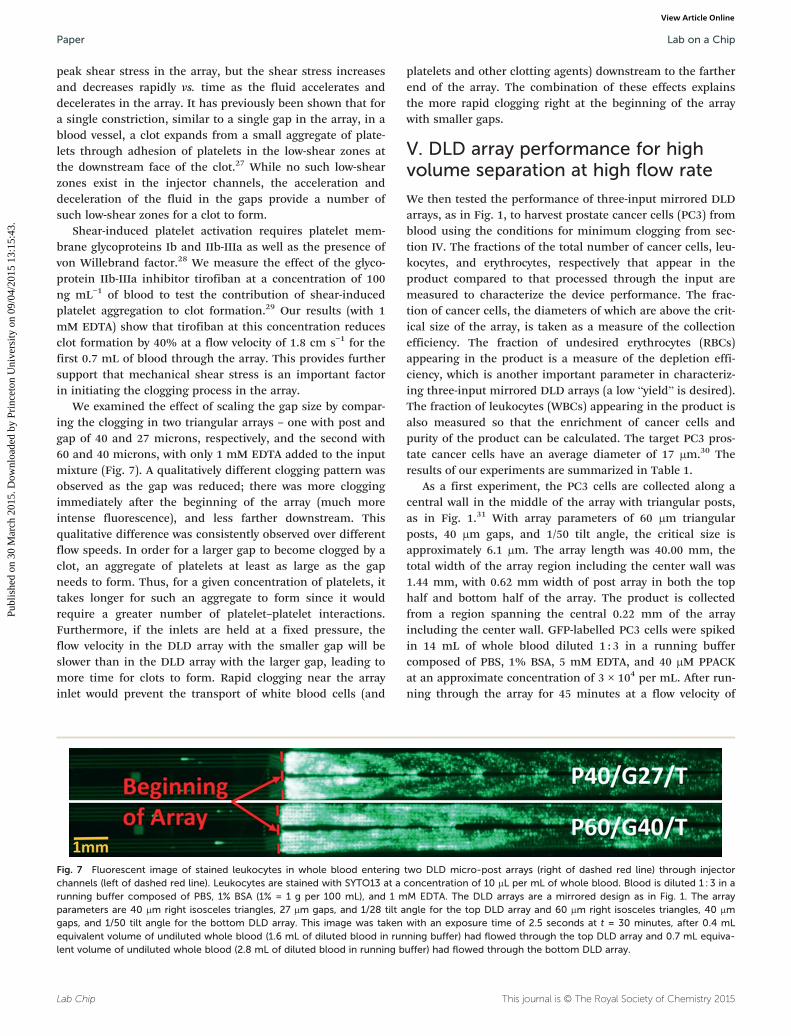
We examined the effect of scaling the gap size by compar-ing the clogging in two triangular arrays – one with post andgap of 40 and 27 microns, respectively, and the second with60 and 40 microns, with only 1 mM EDTA added to the inputmixture (Fig. 7). A qualitatively different clogging pattern wasobserved as the gap was reduced; there was more cloggingimmediately after the beginning of the array (much moreintense fluorescence), and less farther downstream. Thisqualitative difference was consistently observed over differentflow speeds. In order for a larger gap to become clogged by aclot, an aggregate of platelets at least as large as the gapneeds to form. Thus, for a given concentration of platelets, ittakes longer for such an aggregate to form since it wouldrequire a greater number of platelet–platelet interactions.Furthermore, if the inlets are held at a fixed pressure, theflow velocity in the DLD array with the smaller gap will beslower than in the DLD array with the larger gap, leading tomore time for clots to form. Rapid clogging near the arrayinlet would prevent the transport of white blood cells (and
Lab Chip
Fig. 7 Fluorescent image of stained leukocytes in whole blood enteringchannels (left of dashed red line). Leukocytes are stained with SYTO13 at arunning buffer composed of PBS, 1% BSA (1% = 1 g per 100 mL), and 1 mparameters are 40 μm right isosceles triangles, 27 μm gaps, and 1/28 tilt agaps, and 1/50 tilt angle for the bottom DLD array. This image was takenequivalent volume of undiluted whole blood (1.6 mL of diluted blood in runlent volume of undiluted whole blood (2.8 mL of diluted blood in running b
platelets and other clotting agents) downstream to the fartherend of the array. The combination of these effects explainsthe more rapid clogging right at the beginning of the arraywith smaller gaps.
V. DLD array performance for highvolume separation at high flow rate
We then tested the performance of three-input mirrored DLDarrays, as in Fig. 1, to harvest prostate cancer cells (PC3) fromblood using the conditions for minimum clogging from sec-tion IV. The fractions of the total number of cancer cells, leu-kocytes, and erythrocytes, respectively that appear in theproduct compared to that processed through the input aremeasured to characterize the device performance. The frac-tion of cancer cells, the diameters of which are above the crit-ical size of the array, is taken as a measure of the collectionefficiency. The fraction of undesired erythrocytes (RBCs)appearing in the product is a measure of the depletion effi-ciency, which is another important parameter in characteriz-ing three-input mirrored DLD arrays (a low “yield” is desired).The fraction of leukocytes (WBCs) appearing in the product isalso measured so that the enrichment of cancer cells andpurity of the product can be calculated. The target PC3 pros-tate cancer cells have an average diameter of 17 μm.30 Theresults of our experiments are summarized in Table 1.
As a first experiment, the PC3 cells are collected along acentral wall in the middle of the array with triangular posts,as in Fig. 1.31 With array parameters of 60 μm triangularposts, 40 μm gaps, and 1/50 tilt angle, the critical size isapproximately 6.1 μm. The array length was 40.00 mm, thetotal width of the array region including the center wall was1.44 mm, with 0.62 mm width of post array in both the tophalf and bottom half of the array. The product is collectedfrom a region spanning the central 0.22 mm of the arrayincluding the center wall. GFP-labelled PC3 cells were spikedin 14 mL of whole blood diluted 1 : 3 in a running buffercomposed of PBS, 1% BSA, 5 mM EDTA, and 40 μM PPACKat an approximate concentration of 3 × 10⁴ per mL. After run-ning through the array for 45 minutes at a flow velocity of
This journal is © The Royal Society of Chemistry 2015
two DLD micro-post arrays (right of dashed red line) through injectorconcentration of 10 μL per mL of whole blood. Blood is diluted 1 : 3 in aM EDTA. The DLD arrays are a mirrored design as in Fig. 1. The arrayngle for the top DLD array and 60 μm right isosceles triangles, 40 μmwith an exposure time of 2.5 seconds at t = 30 minutes, after 0.4 mLning buffer) had flowed through the top DLD array and 0.7 mL equiva-uffer) had flowed through the bottom DLD array.
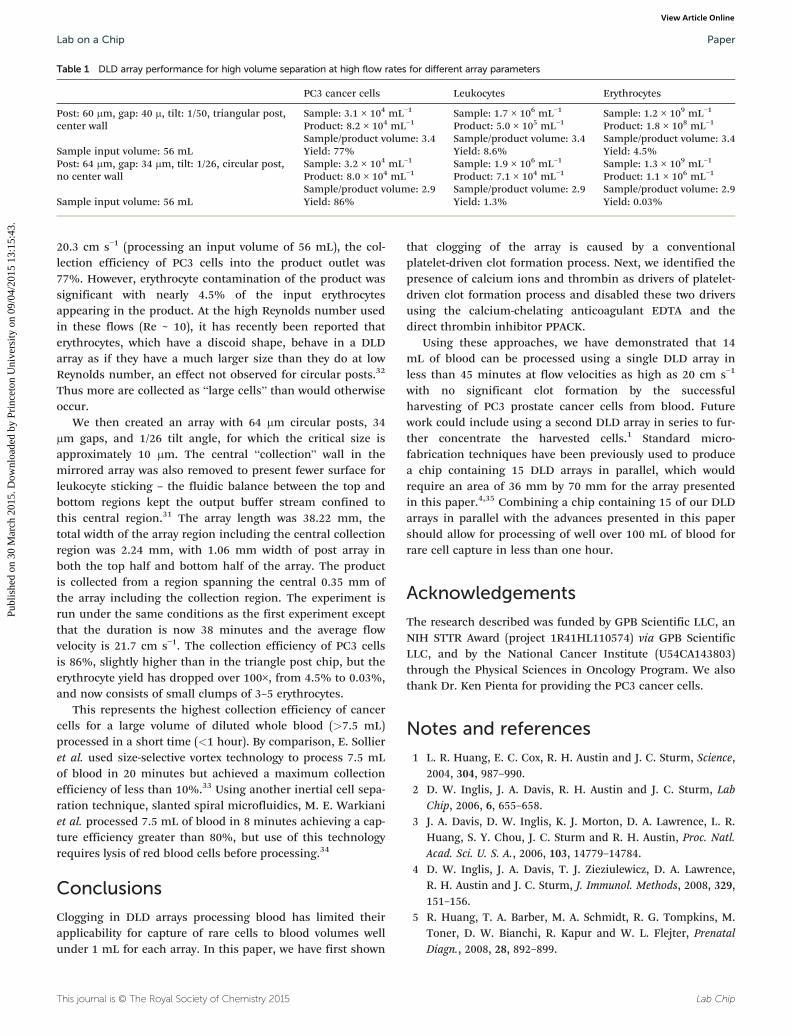
Table 1 DLD array performance for high volume separation at high flow rates for different array parameters
PC3 cancer cells Leukocytes Erythrocytes
Post: 60 μm, gap: 40 μ, tilt: 1/50, triangular post,center wall
Sample: 3.1 × 10⁴ mL−1 Sample: 1.7 × 10⁶ mL−1 Sample: 1.2 × 10⁹ mL−1
Product: 8.2 × 10⁴ mL−1 Product: 5.0 × 10⁵ mL−1 Product: 1.8 × 10⁸ mL−1
Sample/product volume: 3.4 Sample/product volume: 3.4 Sample/product volume: 3.4Sample input volume: 56 mL Yield: 77% Yield: 8.6% Yield: 4.5%Post: 64 μm, gap: 34 μm, tilt: 1/26, circular post,no center wall
Sample: 3.2 × 10⁴ mL−1 Sample: 1.9 × 10⁶ mL−1 Sample: 1.3 × 10⁹ mL−1
Product: 8.0 × 10⁴ mL−1 Product: 7.1 × 10⁴ mL−1 Product: 1.1 × 10⁶ mL−1
Sample/product volume: 2.9 Sample/product volume: 2.9 Sample/product volume: 2.9Sample input volume: 56 mL Yield: 86% Yield: 1.3% Yield: 0.03%
Lab on a Chip Paper
Publ
ishe
d on
30
Mar
ch 2
015.
Dow
nloa
ded
by P
rinc
eton
Uni
vers
ity o
n 09
/04/
2015
13:
15:4
3.
View Article Online
20.3 cm s−1 (processing an input volume of 56 mL), the col-lection efficiency of PC3 cells into the product outlet was77%. However, erythrocyte contamination of the product wassignificant with nearly 4.5% of the input erythrocytesappearing in the product. At the high Reynolds number usedin these flows (Re ~ 10), it has recently been reported thaterythrocytes, which have a discoid shape, behave in a DLDarray as if they have a much larger size than they do at lowReynolds number, an effect not observed for circular posts.32
Thus more are collected as “large cells” than would otherwiseoccur.
We then created an array with 64 μm circular posts, 34μm gaps, and 1/26 tilt angle, for which the critical size isapproximately 10 μm. The central “collection” wall in themirrored array was also removed to present fewer surface forleukocyte sticking – the fluidic balance between the top andbottom regions kept the output buffer stream confined tothis central region.31 The array length was 38.22 mm, thetotal width of the array region including the central collectionregion was 2.24 mm, with 1.06 mm width of post array inboth the top half and bottom half of the array. The productis collected from a region spanning the central 0.35 mm ofthe array including the collection region. The experiment isrun under the same conditions as the first experiment exceptthat the duration is now 38 minutes and the average flowvelocity is 21.7 cm s−1. The collection efficiency of PC3 cellsis 86%, slightly higher than in the triangle post chip, but theerythrocyte yield has dropped over 100×, from 4.5% to 0.03%,and now consists of small clumps of 3–5 erythrocytes.
This represents the highest collection efficiency of cancercells for a large volume of diluted whole blood (>7.5 mL)processed in a short time (<1 hour). By comparison, E. Sollieret al. used size-selective vortex technology to process 7.5 mLof blood in 20 minutes but achieved a maximum collectionefficiency of less than 10%.33 Using another inertial cell sepa-ration technique, slanted spiral microfluidics, M. E. Warkianiet al. processed 7.5 mL of blood in 8 minutes achieving a cap-ture efficiency greater than 80%, but use of this technologyrequires lysis of red blood cells before processing.34
Conclusions
Clogging in DLD arrays processing blood has limited theirapplicability for capture of rare cells to blood volumes wellunder 1 mL for each array. In this paper, we have first shown
This journal is © The Royal Society of Chemistry 2015
that clogging of the array is caused by a conventionalplatelet-driven clot formation process. Next, we identified thepresence of calcium ions and thrombin as drivers of platelet-driven clot formation process and disabled these two driversusing the calcium-chelating anticoagulant EDTA and thedirect thrombin inhibitor PPACK.
Using these approaches, we have demonstrated that 14mL of blood can be processed using a single DLD array inless than 45 minutes at flow velocities as high as 20 cm s−1
with no significant clot formation by the successfulharvesting of PC3 prostate cancer cells from blood. Futurework could include using a second DLD array in series to fur-ther concentrate the harvested cells.1 Standard micro-fabrication techniques have been previously used to producea chip containing 15 DLD arrays in parallel, which wouldrequire an area of 36 mm by 70 mm for the array presentedin this paper.4,35 Combining a chip containing 15 of our DLDarrays in parallel with the advances presented in this papershould allow for processing of well over 100 mL of blood forrare cell capture in less than one hour.
Acknowledgements
The research described was funded by GPB Scientific LLC, anNIH STTR Award (project 1R41HL110574) via GPB ScientificLLC, and by the National Cancer Institute (U54CA143803)through the Physical Sciences in Oncology Program. We alsothank Dr. Ken Pienta for providing the PC3 cancer cells.
Notes and references
1 L. R. Huang, E. C. Cox, R. H. Austin and J. C. Sturm, Science,
2004, 304, 987–990.2 D. W. Inglis, J. A. Davis, R. H. Austin and J. C. Sturm, Lab
Chip, 2006, 6, 655–658.3 J. A. Davis, D. W. Inglis, K. J. Morton, D. A. Lawrence, L. R.
Huang, S. Y. Chou, J. C. Sturm and R. H. Austin, Proc. Natl.Acad. Sci. U. S. A., 2006, 103, 14779–14784.4 D. W. Inglis, J. A. Davis, T. J. Zieziulewicz, D. A. Lawrence,
R. H. Austin and J. C. Sturm, J. Immunol. Methods, 2008, 329,151–156.5 R. Huang, T. A. Barber, M. A. Schmidt, R. G. Tompkins, M.
Toner, D. W. Bianchi, R. Kapur and W. L. Flejter, PrenatalDiagn., 2008, 28, 892–899.Lab Chip
Lab on a ChipPaper
Publ
ishe
d on
30
Mar
ch 2
015.
Dow
nloa
ded
by P
rinc
eton
Uni
vers
ity o
n 09
/04/
2015
13:
15:4
3.
View Article Online
6 S. H. Holm, J. P. Beech, M. P. Barrett and J. O. Tegenfeldt,
Lab Chip, 2011, 11, 1326–1332.7 B. Zhang, J. V. Green, S. K. Murthy and M. Radisic, PLoS
One, 2012, 7, e37619.8 K. Loutherback, J. D'Silva, L. Liu, A. Wu, R. H. Austin and
J. C. Sturm, AIP Adv., 2012, 2, 042107.9 S. Zheng, R. Yung, Y. C. Tai and H. Kasdan, in Micro Electro
Mechanical Systems, 2005. MEMS 2005. 18th IEEEInternational Conference on, 2005, pp. 851–854.10 D. W. Inglis, M. Lord and R. E. Nordon, J. Micromech.
Microeng., 2011, 21, 054024.11 P. Vadgama, Surfaces and interfaces for biomaterials, CRC
Press, 2005.12 J. Bäck, M. H. Lang, G. Elgue, M. Kalbitz, J. Sanchez, K. N.
Ekdahl and B. Nilsson, Biomaterials, 2009, 30(34), 6573–6580.13 H. T. Spijker, R. Bos, H. J. Busscher, T. G. van Kooten and
W. van Oeveren, Biomaterials, 2002, 23(3), 757–766.14 Microfluidic devices for biomedical applications, ed. X. J. Li
and Y. Zhou, Elsevier, 2013.15 J. W. M. Heemskerk, E. M. Bevers and T. Lindhout, Thromb.
Haemostasis, 2002, 88, 186–194.16 S. Nylander and C. Mattsson, Blood Coagulation Fibrinolysis,
2003, 14, 159–167.17 T. V. Colace, G. W. Tormoen, O. J. T. McCarty and S. L.
Diamond, Annu. Rev. Biomed. Eng., 2013, 15, 283–303.18 J. I. Weitz, Am. J. Cardiol., 1995, 75, 18B–22B.
19 J. A. May and S. Heptinstall, in Platelets and Megakaryocytes,Humana Press, 2004, pp. 3–11.20 P. Y. Huang and J. D. Hellums, Biophys. J., 1993, 65, 54–361.
21 R. A. Freitas. Jr., Nanomedicine, vol. I, Basic Capabilities,Landes Bioscience, 1999.22 P. A. Holme, U. Ørvim, M. J. A. G. Hamers, N. O. Solum,
F. R. Brosstad, R. M. Barstad and K. S. Sakariassen,Arterioscler., Thromb., Vasc. Biol., 1997, 17, 646–653.
Lab Chip
23 H. Lu, L. Y. Koo, W. M. Wang, D. A. Lauffenburger, L. G.
Griffith and K. F. Jensen, Anal. Chem., 2004, 76(18),5257–5264.24 J. M. Ramstack, L. Zuckerman and L. F. Mockros, J. Biomech.
Eng., 1979, 12, 113–125.25 P. A. Holme, U. Ørvim, M. J. A. G. Hamers, N. O. Solum,
F. R. Brosstad, R. M. Barstad and K. S. Sakariassen,Arterioscler., Thromb., Vasc. Biol., 1997, 17, 646–653.26 J. D. Hellums, D. M. Peterson, N. A. Stathopoulos,
J. L. Moake and T. D. Giorgio, Cerebral ischemiaand hemorheology, Springer, Berlin Heidelberg, 1987,pp. 80–89.27 W. S. Nesbitt, E. Westein, F. J. Tovar-Lopez, E. Tolouei, A.
Mitchell, J. Fu, J. Carberry, A. Fouras and S. P. Jackson, Nat.Med., 2009, 15, 665–673.28 D. M. Peterson, N. A. Stathopoulos, T. D. Giorgio, J. D.
Hellums and J. L. Moake, Blood, 1987, 69, 625–628.29 D. J. Schneider, P. Q. Baumann, D. A. Whitaker and B. E.
Sobel, J. Cardiovasc. Pharmacol., 2005, 46, 41–45.30 B. Lu, T. Xu, S. Zheng, A. Goldkorn and Y. C. Tai, in Micro
Electro Mechanical Systems (MEMS), 2010 IEEE 23rdInternational Conference on, 2010, pp. 935–938.31 D. W. Inglis, Appl. Phys. Lett., 2009, 94, 013510.
32 S. Ranjan, K. K. Zeming, R. Jureen, D. Fisher and Y. Zhang,Lab Chip, 2014, 14, 4250–4262.33 E. Sollier, D. E. Go, J. Che, D. R. Gossett, S. O'Byrne,
W. M. Weaver and N. Kummer, et al., Lab Chip, 2014, 14,63–77.
34 M. E. Warkiani, G. Guan, K. B. Luan, W. C. Lee, A. A. S.
Bhagat, P. K. Chaudhuri and D. S. W. Tan, et al., Lab Chip,2014, 14, 128–137.35 N. M. Karabacak, P. S. Spuhler, F. Fachin, E. J. Lim, V. Pai,
E. Ozkumur and J. M. Martel, et al., Nat. Protoc., 2014, 9,694–710.This journal is © The Royal Society of Chemistry 2015