Embed Size (px)
Citation preview
Lab on a Chip
Publ
ishe
d on
10
Nov
embe
r 20
14. D
ownl
oade
d by
Pri
ncet
on U
nive
rsity
on
07/0
1/20
16 2
3:07
:24.
PAPER View Article OnlineView Journal | View Issue
524 | Lab Chip, 2015, 15, 524–531 This journal is © The R
a Lewis-Sigler Institute for integrative Genomics, Princeton University, Princeton,
NJ 08544, USA. E-mail: [email protected] of Electrical Engineering, Princeton University, Princeton,
NJ 08544, USAc Department of Mechanical and Aerospace Engineering, Princeton University,
Princeton, NJ 08544, USAdDepartment of Molecular Biology, Princeton University, Princeton,
NJ 08544, USA
† Electronic supplementary information (ESI) available. See DOI: 10.1039/c4lc01028k
Cite this: Lab Chip, 2015, 15, 524
Received 2nd September 2014,Accepted 6th November 2014
DOI: 10.1039/c4lc01028k
www.rsc.org/loc
A microfluidic device and automatic counting systemfor the study of C. elegans reproductive aging†
Siran Li,ab Howard A. Stonec and Coleen T. Murphy*ad
The nematode Caenorhabditis elegans (C. elegans) is an excellent model to study reproductive aging
because of its short life span, its cessation of reproduction in mid-adulthood, and the strong conservation
of pathways that regulate longevity. During its lifetime, a wild-type C. elegans hermaphrodite usually lays
about 200–300 self-fertilized hatchable eggs, which mainly occurs in the first three to five days of
adulthood. Here, we report the development of a microfluidic assay and a real-time, automatic progeny
counting system that records progeny counting information from many individual C. elegans hermaphro-
dites. This system offers many advantages compared to conventional plate assays. The flow of non-
proliferating bacteria not only feeds the worms but also flushes the just-hatched young progeny through a
filter that separates mothers from their offspring. The progeny that are flushed out of the chamber are
detected and recorded using a novel algorithm. In our current design, one device contains as many as
16 individual chambers. Here we show examples of real-time progeny production information from
wild-type (N2) and daf-2 (insulin receptor) mutants. We believe that this system has the potential to
become a powerful, high time-resolution tool to study the detailed reproduction of C. elegans.
Introduction
The decline in female reproductive ability, which is one ofthe earliest aging phenotypes that human beings experience,is not well understood. For women over 35 years of age, thereis a rapidly rising risk of infertility, birth defects, and miscar-riage, due to age-related decline of oocyte quality.1 The causeof this decline remains elusive, but is likely to be geneticallyregulated. Therefore, the ability to identify genetic regulatorsof reproductive aging is an important goal for human health.
Caenorhabditis elegans (C. elegans) is a good model to studyreproductive aging for two main reasons. First, C. elegans hasa short life span and an even shorter reproductive span, witha post-reproductive lifespan that is proportionately similarto that of women. A wild-type worm raised on agar platesusually lives for 2–3 weeks but ceases reproduction betweenday 3 and day 6 of adulthood.2–4 Second, similar to humanfemales, the reproductive ability of C. elegans also is limited
by oocyte quality.5 More than 80% of worm proteins havehuman orthologs,6 and many longevity regulatory mecha-nisms are evolutionarily conserved,7 suggesting that identify-ing regulators of reproductive aging in C. elegans will be rele-vant for understanding and regulation of human reproductiveaging. We and others have developed C. elegans as a modelto study reproductive aging,2,5 and we have found thatthe TGF-β signalling pathway,4 the insulin/IGF-1 signallingpathway,2,4,5 and the caloric restriction pathway4,8 all regu-late the reproductive aging process, although the former isspecific to reproduction, while the latter two regulate bothreproductive aging and longevity.
However, for reproductive aging studies of C. elegans, it isdifficult to record and analyze the number and timing ofthe laying of fertilized eggs. In conventional reproductiveaging studies that are performed on 35 mm single-well agarplates or 12-well plates, researchers must transfer individualworms daily to a new plate and manually count the numberof progeny that have hatched on the old plate after severaldays.5 This procedure is inconvenient and labor-intensive.Furthermore, since the time resolution is at the level of oneday and the reproductive span of wild-type C. elegans is usu-ally 3–5 days, to achieve statistically significant results, it isnecessary to pick at least 40 worms per strain at the begin-ning of the experiment. As a result, this plate assay not onlyhas low time resolution, but is also labor-intensive.
In the past ten years, microfluidic technologies haveprovided new tools for C. elegans research.9 In particular,
oyal Society of Chemistry 2015
Lab on a Chip Paper
Publ
ishe
d on
10
Nov
embe
r 20
14. D
ownl
oade
d by
Pri
ncet
on U
nive
rsity
on
07/0
1/20
16 2
3:07
:24.
View Article Online
fluidic chambers can be micro-fabricated to confine andguide the worm's movement and to conduct on-line or off-lineanalyses. These microfluidic methods have advantages overplate assays in many applications, for example, immobilizingworms for imaging or laser ablation,10–16 analyzing C. elegans'response or behavior when exposed to different chemicalsor bacteria,17,18 worm sorting and screening,19–23 and long-term liquid culture for aging studies,24–26 as well as otherinvestigations.27–29
Here, we report the development of a high time-resolution,automatic C. elegans progeny counting system that isbased on microfluidic methods and a simple optical setup.This system, with a single hermaphrodite in a single micro-fluidic chamber throughout its reproductive period, can auto-matically detect and count in real time every progeny in itsL1 stage (first larval stage, just after hatching from eggs) fromeach hermaphrodite mother. Using this experimental system,we obtain progeny production frequency and progeny profileinformation. Our method reveals valuable progeny informa-tion that cannot be collected easily in conventional plateassays, and provides researchers a new way to compare thereproductive spans of different C. elegans mutants, which willbe important in developing high-throughput methods for thegenetic analyses of reproductive aging regulation.
ResultsReproductive microfluidic device design
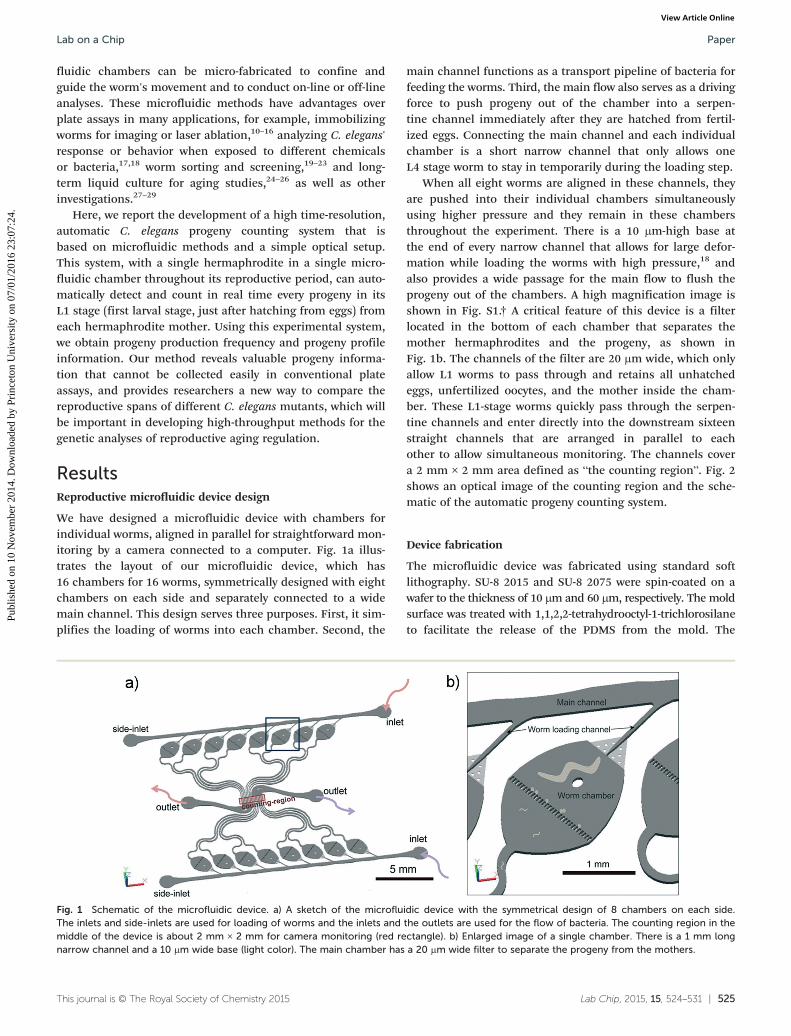
We have designed a microfluidic device with chambers forindividual worms, aligned in parallel for straightforward mon-itoring by a camera connected to a computer. Fig. 1a illus-trates the layout of our microfluidic device, which has16 chambers for 16 worms, symmetrically designed with eightchambers on each side and separately connected to a widemain channel. This design serves three purposes. First, it sim-plifies the loading of worms into each chamber. Second, the
This journal is © The Royal Society of Chemistry 2015
Fig. 1 Schematic of the microfluidic device. a) A sketch of the microfluThe inlets and side-inlets are used for loading of worms and the inlets andmiddle of the device is about 2 mm × 2 mm for camera monitoring (red renarrow channel and a 10 μm wide base (light color). The main chamber has
main channel functions as a transport pipeline of bacteria forfeeding the worms. Third, the main flow also serves as a drivingforce to push progeny out of the chamber into a serpen-tine channel immediately after they are hatched from fertil-ized eggs. Connecting the main channel and each individualchamber is a short narrow channel that only allows oneL4 stage worm to stay in temporarily during the loading step.
When all eight worms are aligned in these channels, theyare pushed into their individual chambers simultaneouslyusing higher pressure and they remain in these chambersthroughout the experiment. There is a 10 μm-high base atthe end of every narrow channel that allows for large defor-mation while loading the worms with high pressure,18 andalso provides a wide passage for the main flow to flush theprogeny out of the chambers. A high magnification image isshown in Fig. S1.† A critical feature of this device is a filterlocated in the bottom of each chamber that separates themother hermaphrodites and the progeny, as shown inFig. 1b. The channels of the filter are 20 μm wide, which onlyallow L1 worms to pass through and retains all unhatchedeggs, unfertilized oocytes, and the mother inside the cham-ber. These L1-stage worms quickly pass through the serpen-tine channels and enter directly into the downstream sixteenstraight channels that are arranged in parallel to eachother to allow simultaneous monitoring. The channels covera 2 mm × 2 mm area defined as “the counting region”. Fig. 2shows an optical image of the counting region and the sche-matic of the automatic progeny counting system.
Device fabrication
The microfluidic device was fabricated using standard softlithography. SU-8 2015 and SU-8 2075 were spin-coated on awafer to the thickness of 10 μm and 60 μm, respectively. The moldsurface was treated with 1,1,2,2-tetrahydrooctyl-1-trichlorosilaneto facilitate the release of the PDMS from the mold. The
Lab Chip, 2015, 15, 524–531 | 525
idic device with the symmetrical design of 8 chambers on each side.the outlets are used for the flow of bacteria. The counting region in thectangle). b) Enlarged image of a single chamber. There is a 1 mm longa 20 μm wide filter to separate the progeny from the mothers.
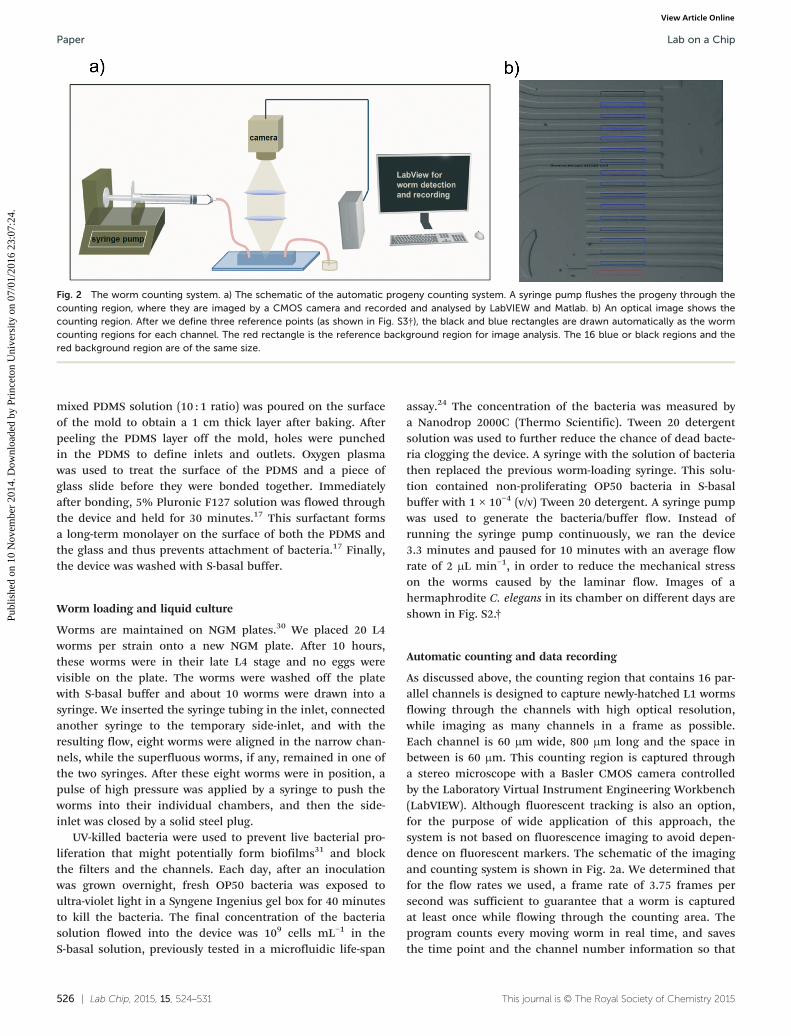
Fig. 2 The worm counting system. a) The schematic of the automatic progeny counting system. A syringe pump flushes the progeny through thecounting region, where they are imaged by a CMOS camera and recorded and analysed by LabVIEW and Matlab. b) An optical image shows thecounting region. After we define three reference points (as shown in Fig. S3†), the black and blue rectangles are drawn automatically as the wormcounting regions for each channel. The red rectangle is the reference background region for image analysis. The 16 blue or black regions and thered background region are of the same size.
Lab on a ChipPaper
Publ
ishe
d on
10
Nov
embe
r 20
14. D
ownl
oade
d by
Pri
ncet
on U
nive
rsity
on
07/0
1/20
16 2
3:07
:24.
View Article Online
mixed PDMS solution (10 : 1 ratio) was poured on the surfaceof the mold to obtain a 1 cm thick layer after baking. Afterpeeling the PDMS layer off the mold, holes were punchedin the PDMS to define inlets and outlets. Oxygen plasmawas used to treat the surface of the PDMS and a piece ofglass slide before they were bonded together. Immediatelyafter bonding, 5% Pluronic F127 solution was flowed throughthe device and held for 30 minutes.17 This surfactant formsa long-term monolayer on the surface of both the PDMS andthe glass and thus prevents attachment of bacteria.17 Finally,the device was washed with S-basal buffer.
Worm loading and liquid culture
Worms are maintained on NGM plates.30 We placed 20 L4worms per strain onto a new NGM plate. After 10 hours,these worms were in their late L4 stage and no eggs werevisible on the plate. The worms were washed off the platewith S-basal buffer and about 10 worms were drawn into asyringe. We inserted the syringe tubing in the inlet, connectedanother syringe to the temporary side-inlet, and with theresulting flow, eight worms were aligned in the narrow chan-nels, while the superfluous worms, if any, remained in one ofthe two syringes. After these eight worms were in position, apulse of high pressure was applied by a syringe to push theworms into their individual chambers, and then the side-inlet was closed by a solid steel plug.
UV-killed bacteria were used to prevent live bacterial pro-liferation that might potentially form biofilms31 and blockthe filters and the channels. Each day, after an inoculationwas grown overnight, fresh OP50 bacteria was exposed toultra-violet light in a Syngene Ingenius gel box for 40 minutesto kill the bacteria. The final concentration of the bacteriasolution flowed into the device was 109 cells mL−1 in theS-basal solution, previously tested in a microfluidic life-span
526 | Lab Chip, 2015, 15, 524–531
assay.24 The concentration of the bacteria was measured bya Nanodrop 2000C (Thermo Scientific). Tween 20 detergentsolution was used to further reduce the chance of dead bacte-ria clogging the device. A syringe with the solution of bacteriathen replaced the previous worm-loading syringe. This solu-tion contained non-proliferating OP50 bacteria in S-basalbuffer with 1 × 10⁻⁴ IJv/v) Tween 20 detergent. A syringe pumpwas used to generate the bacteria/buffer flow. Instead ofrunning the syringe pump continuously, we ran the device3.3 minutes and paused for 10 minutes with an average flowrate of 2 μL min−1, in order to reduce the mechanical stresson the worms caused by the laminar flow. Images of ahermaphrodite C. elegans in its chamber on different days areshown in Fig. S2.†
Automatic counting and data recording
As discussed above, the counting region that contains 16 par-allel channels is designed to capture newly-hatched L1 wormsflowing through the channels with high optical resolution,while imaging as many channels in a frame as possible.Each channel is 60 μm wide, 800 μm long and the space inbetween is 60 μm. This counting region is captured througha stereo microscope with a Basler CMOS camera controlledby the Laboratory Virtual Instrument Engineering Workbench(LabVIEW). Although fluorescent tracking is also an option,for the purpose of wide application of this approach, thesystem is not based on fluorescence imaging to avoid depen-dence on fluorescent markers. The schematic of the imagingand counting system is shown in Fig. 2a. We determined thatfor the flow rates we used, a frame rate of 3.75 frames persecond was sufficient to guarantee that a worm is capturedat least once while flowing through the counting area. Theprogram counts every moving worm in real time, and savesthe time point and the channel number information so that
This journal is © The Royal Society of Chemistry 2015
Lab on a Chip Paper
Publ
ishe
d on
10
Nov
embe
r 20
14. D
ownl
oade
d by
Pri
ncet
on U
nive
rsity
on
07/0
1/20
16 2
3:07
:24.
View Article Online
it is not necessary to save large video files for later imageanalysis.
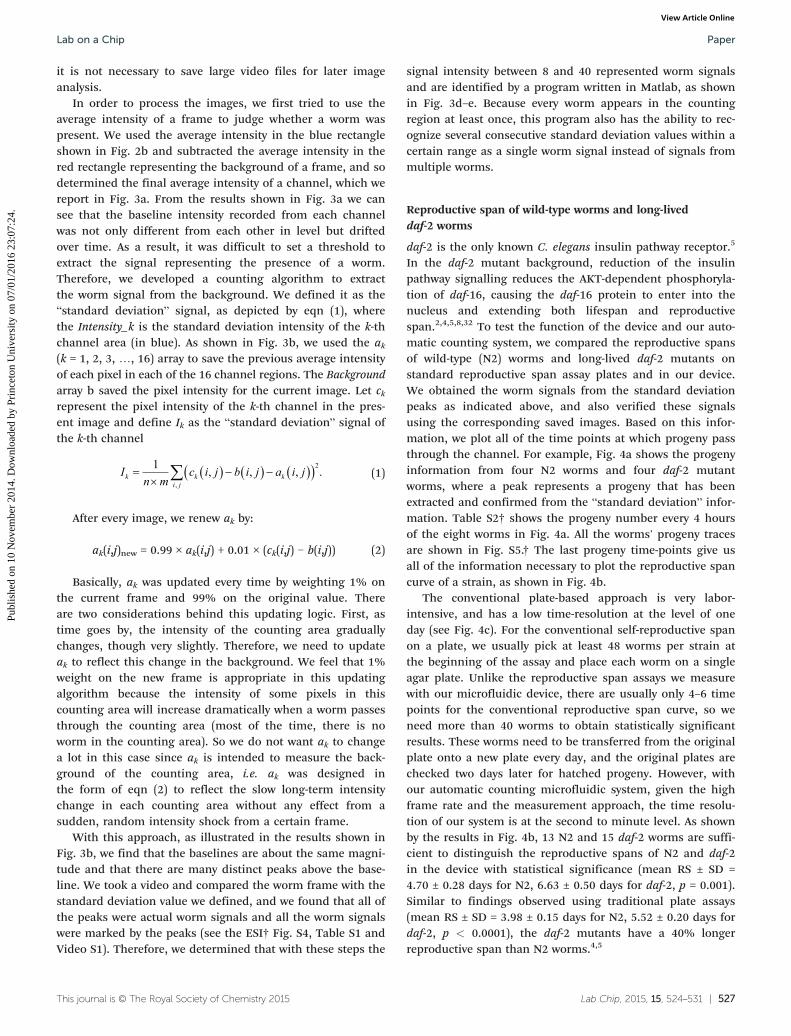
In order to process the images, we first tried to use theaverage intensity of a frame to judge whether a worm waspresent. We used the average intensity in the blue rectangleshown in Fig. 2b and subtracted the average intensity in thered rectangle representing the background of a frame, and sodetermined the final average intensity of a channel, which wereport in Fig. 3a. From the results shown in Fig. 3a we cansee that the baseline intensity recorded from each channelwas not only different from each other in level but driftedover time. As a result, it was difficult to set a threshold toextract the signal representing the presence of a worm.Therefore, we developed a counting algorithm to extractthe worm signal from the background. We defined it as the“standard deviation” signal, as depicted by eqn (1), wherethe Intensity_k is the standard deviation intensity of the k-thchannel area (in blue). As shown in Fig. 3b, we used the ak(k = 1, 2, 3, …, 16) array to save the previous average intensityof each pixel in each of the 16 channel regions. The Backgroundarray b saved the pixel intensity for the current image. Let ckrepresent the pixel intensity of the k-th channel in the pres-ent image and define Ik as the “standard deviation” signal ofthe k-th channel
In m
c i j b i j a i jk k ki j
1 2, , , .
,(1)
After every image, we renew ak by:
ak(i,j)new = 0.99 × ak(i,j) + 0.01 × (ck(i,j) − b(i,j)) (2)
Basically, ak was updated every time by weighting 1% onthe current frame and 99% on the original value. Thereare two considerations behind this updating logic. First, astime goes by, the intensity of the counting area graduallychanges, though very slightly. Therefore, we need to updateak to reflect this change in the background. We feel that 1%weight on the new frame is appropriate in this updatingalgorithm because the intensity of some pixels in thiscounting area will increase dramatically when a worm passesthrough the counting area (most of the time, there is noworm in the counting area). So we do not want ak to changea lot in this case since ak is intended to measure the back-ground of the counting area, i.e. ak was designed inthe form of eqn (2) to reflect the slow long-term intensitychange in each counting area without any effect from asudden, random intensity shock from a certain frame.
With this approach, as illustrated in the results shown inFig. 3b, we find that the baselines are about the same magni-tude and that there are many distinct peaks above the base-line. We took a video and compared the worm frame with thestandard deviation value we defined, and we found that all ofthe peaks were actual worm signals and all the worm signalswere marked by the peaks (see the ESI† Fig. S4, Table S1 andVideo S1). Therefore, we determined that with these steps the
This journal is © The Royal Society of Chemistry 2015
signal intensity between 8 and 40 represented worm signalsand are identified by a program written in Matlab, as shownin Fig. 3d–e. Because every worm appears in the countingregion at least once, this program also has the ability to rec-ognize several consecutive standard deviation values within acertain range as a single worm signal instead of signals frommultiple worms.
Reproductive span of wild-type worms and long-liveddaf-2 worms
daf-2 is the only known C. elegans insulin pathway receptor.5
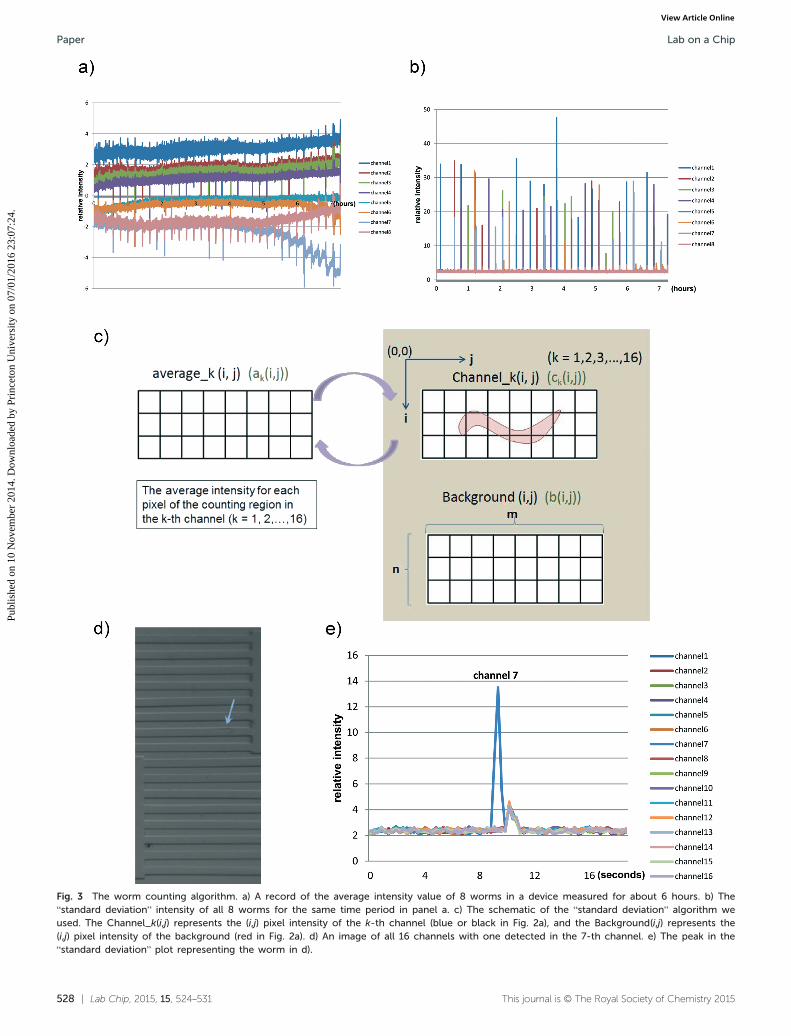
In the daf-2 mutant background, reduction of the insulinpathway signalling reduces the AKT-dependent phosphoryla-tion of daf-16, causing the daf-16 protein to enter into thenucleus and extending both lifespan and reproductivespan.2,4,5,8,32 To test the function of the device and our auto-matic counting system, we compared the reproductive spansof wild-type (N2) worms and long-lived daf-2 mutants onstandard reproductive span assay plates and in our device.We obtained the worm signals from the standard deviationpeaks as indicated above, and also verified these signalsusing the corresponding saved images. Based on this infor-mation, we plot all of the time points at which progeny passthrough the channel. For example, Fig. 4a shows the progenyinformation from four N2 worms and four daf-2 mutantworms, where a peak represents a progeny that has beenextracted and confirmed from the “standard deviation” infor-mation. Table S2† shows the progeny number every 4 hoursof the eight worms in Fig. 4a. All the worms' progeny tracesare shown in Fig. S5.† The last progeny time-points give usall of the information necessary to plot the reproductive spancurve of a strain, as shown in Fig. 4b.
The conventional plate-based approach is very labor-intensive, and has a low time-resolution at the level of oneday (see Fig. 4c). For the conventional self-reproductive spanon a plate, we usually pick at least 48 worms per strain atthe beginning of the assay and place each worm on a singleagar plate. Unlike the reproductive span assays we measurewith our microfluidic device, there are usually only 4–6 timepoints for the conventional reproductive span curve, so weneed more than 40 worms to obtain statistically significantresults. These worms need to be transferred from the originalplate onto a new plate every day, and the original plates arechecked two days later for hatched progeny. However, withour automatic counting microfluidic system, given the highframe rate and the measurement approach, the time resolu-tion of our system is at the second to minute level. As shownby the results in Fig. 4b, 13 N2 and 15 daf-2 worms are suffi-cient to distinguish the reproductive spans of N2 and daf-2in the device with statistical significance (mean RS ± SD =4.70 ± 0.28 days for N2, 6.63 ± 0.50 days for daf-2, p = 0.001).Similar to findings observed using traditional plate assays(mean RS ± SD = 3.98 ± 0.15 days for N2, 5.52 ± 0.20 days fordaf-2, p < 0.0001), the daf-2 mutants have a 40% longerreproductive span than N2 worms.4,5
Lab Chip, 2015, 15, 524–531 | 527
528 | Lab Chip, 2015, 15, 524–531 This journal is © The Royal Society of Chemistry 2015
Fig. 3 The worm counting algorithm. a) A record of the average intensity value of 8 worms in a device measured for about 6 hours. b) The“standard deviation” intensity of all 8 worms for the same time period in panel a. c) The schematic of the “standard deviation” algorithm weused. The Channel_kIJi,j) represents the (i,j) pixel intensity of the k-th channel (blue or black in Fig. 2a), and the BackgroundIJi,j) represents the(i,j) pixel intensity of the background (red in Fig. 2a). d) An image of all 16 channels with one detected in the 7-th channel. e) The peak in the“standard deviation” plot representing the worm in d).
Lab on a ChipPaper
Publ
ishe
d on
10
Nov
embe
r 20
14. D
ownl
oade
d by
Pri
ncet
on U
nive
rsity
on
07/0
1/20
16 2
3:07
:24.
View Article Online
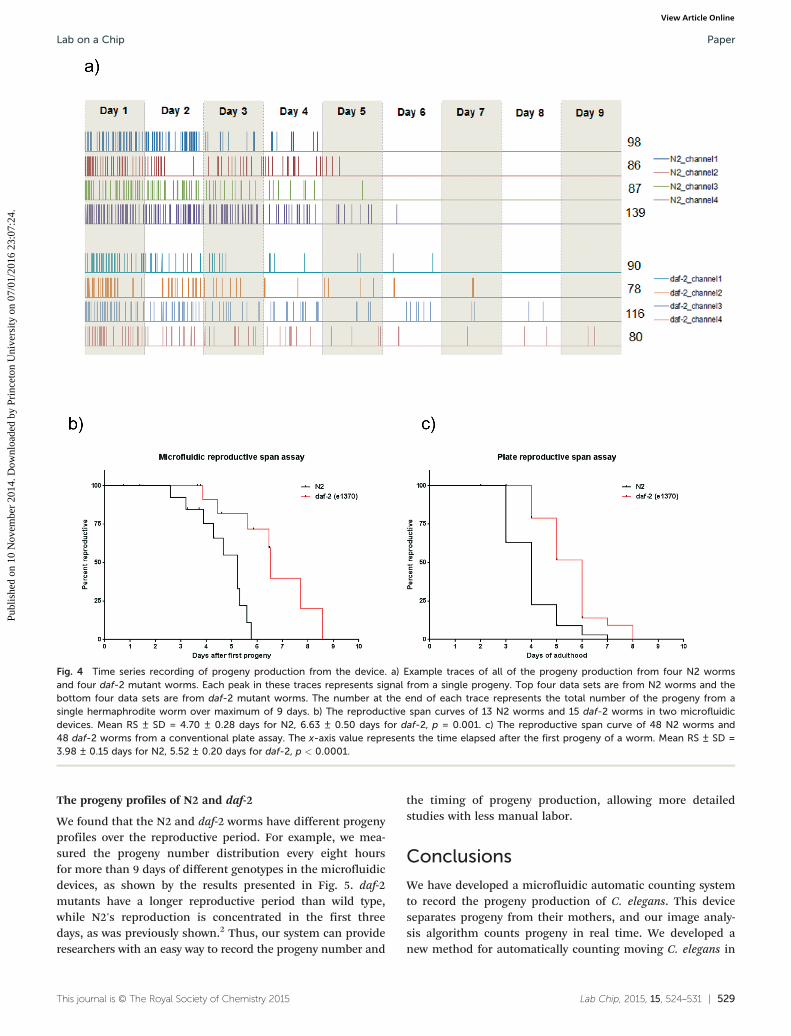
Fig. 4 Time series recording of progeny production from the device. a) Example traces of all of the progeny production from four N2 wormsand four daf-2 mutant worms. Each peak in these traces represents signal from a single progeny. Top four data sets are from N2 worms and thebottom four data sets are from daf-2 mutant worms. The number at the end of each trace represents the total number of the progeny from asingle hermaphrodite worm over maximum of 9 days. b) The reproductive span curves of 13 N2 worms and 15 daf-2 worms in two microfluidicdevices. Mean RS ± SD = 4.70 ± 0.28 days for N2, 6.63 ± 0.50 days for daf-2, p = 0.001. c) The reproductive span curve of 48 N2 worms and48 daf-2 worms from a conventional plate assay. The x-axis value represents the time elapsed after the first progeny of a worm. Mean RS ± SD =3.98 ± 0.15 days for N2, 5.52 ± 0.20 days for daf-2, p < 0.0001.
Lab on a Chip Paper
Publ
ishe
d on
10
Nov
embe
r 20
14. D
ownl
oade
d by
Pri
ncet
on U
nive
rsity
on
07/0
1/20
16 2
3:07
:24.
View Article Online
The progeny profiles of N2 and daf-2
We found that the N2 and daf-2 worms have different progenyprofiles over the reproductive period. For example, we mea-sured the progeny number distribution every eight hoursfor more than 9 days of different genotypes in the microfluidicdevices, as shown by the results presented in Fig. 5. daf-2mutants have a longer reproductive period than wild type,while N2's reproduction is concentrated in the first threedays, as was previously shown.2 Thus, our system can provideresearchers with an easy way to record the progeny number and
This journal is © The Royal Society of Chemistry 2015
the timing of progeny production, allowing more detailedstudies with less manual labor.
Conclusions
We have developed a microfluidic automatic counting systemto record the progeny production of C. elegans. This deviceseparates progeny from their mothers, and our image analy-sis algorithm counts progeny in real time. We developed anew method for automatically counting moving C. elegans in
Lab Chip, 2015, 15, 524–531 | 529
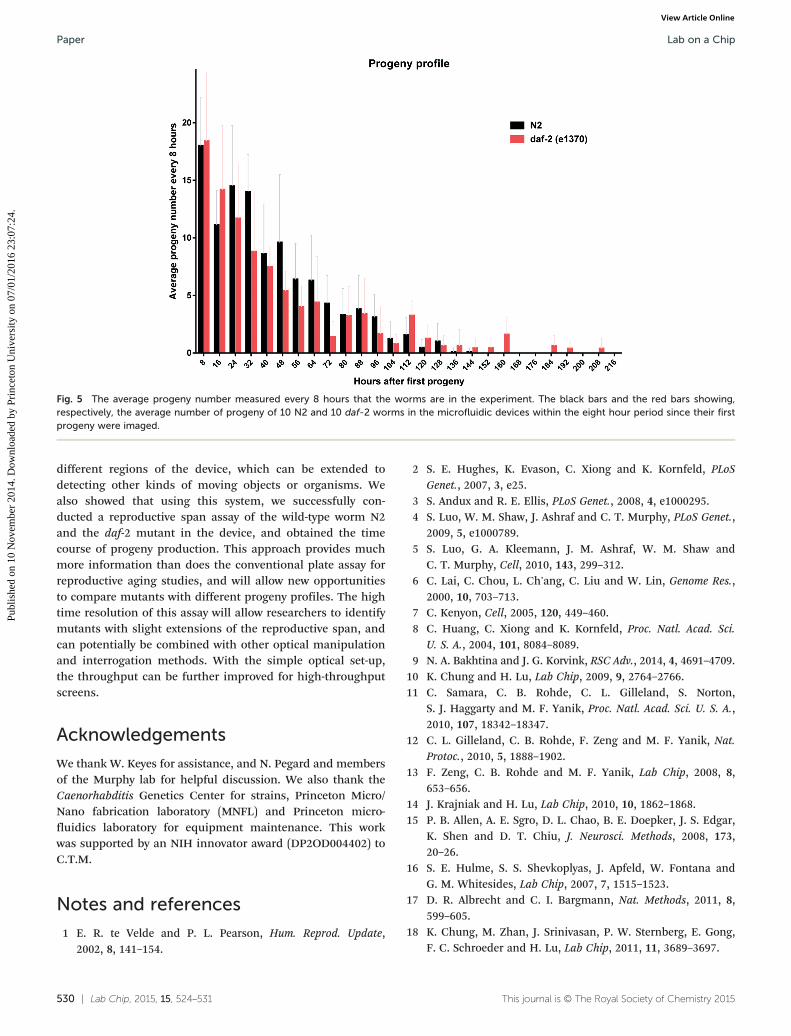
Fig. 5 The average progeny number measured every 8 hours that the worms are in the experiment. The black bars and the red bars showing,respectively, the average number of progeny of 10 N2 and 10 daf-2 worms in the microfluidic devices within the eight hour period since their firstprogeny were imaged.
Lab on a ChipPaper
Publ
ishe
d on
10
Nov
embe
r 20
14. D
ownl
oade
d by
Pri
ncet
on U
nive
rsity
on
07/0
1/20
16 2
3:07
:24.
View Article Online
different regions of the device, which can be extended todetecting other kinds of moving objects or organisms. Wealso showed that using this system, we successfully con-ducted a reproductive span assay of the wild-type worm N2and the daf-2 mutant in the device, and obtained the timecourse of progeny production. This approach provides muchmore information than does the conventional plate assay forreproductive aging studies, and will allow new opportunitiesto compare mutants with different progeny profiles. The hightime resolution of this assay will allow researchers to identifymutants with slight extensions of the reproductive span, andcan potentially be combined with other optical manipulationand interrogation methods. With the simple optical set-up,the throughput can be further improved for high-throughputscreens.
Acknowledgements
We thank W. Keyes for assistance, and N. Pegard and membersof the Murphy lab for helpful discussion. We also thank theCaenorhabditis Genetics Center for strains, Princeton Micro/Nano fabrication laboratory (MNFL) and Princeton micro-fluidics laboratory for equipment maintenance. This workwas supported by an NIH innovator award (DP2OD004402) toC.T.M.
Notes and references
1 E. R. te Velde and P. L. Pearson, Hum. Reprod. Update,
2002, 8, 141–154.530 | Lab Chip, 2015, 15, 524–531
2 S. E. Hughes, K. Evason, C. Xiong and K. Kornfeld, PLoS
Genet., 2007, 3, e25.3 S. Andux and R. E. Ellis, PLoS Genet., 2008, 4, e1000295.
4 S. Luo, W. M. Shaw, J. Ashraf and C. T. Murphy, PLoS Genet.,2009, 5, e1000789.5 S. Luo, G. A. Kleemann, J. M. Ashraf, W. M. Shaw and
C. T. Murphy, Cell, 2010, 143, 299–312.6 C. Lai, C. Chou, L. Ch'ang, C. Liu and W. Lin, Genome Res.,
2000, 10, 703–713.7 C. Kenyon, Cell, 2005, 120, 449–460.
8 C. Huang, C. Xiong and K. Kornfeld, Proc. Natl. Acad. Sci.U. S. A., 2004, 101, 8084–8089.9 N. A. Bakhtina and J. G. Korvink, RSC Adv., 2014, 4, 4691–4709.
10 K. Chung and H. Lu, Lab Chip, 2009, 9, 2764–2766.
11 C. Samara, C. B. Rohde, C. L. Gilleland, S. Norton,S. J. Haggarty and M. F. Yanik, Proc. Natl. Acad. Sci. U. S. A.,2010, 107, 18342–18347.
12 C. L. Gilleland, C. B. Rohde, F. Zeng and M. F. Yanik, Nat.
Protoc., 2010, 5, 1888–1902.13 F. Zeng, C. B. Rohde and M. F. Yanik, Lab Chip, 2008, 8,
653–656.14 J. Krajniak and H. Lu, Lab Chip, 2010, 10, 1862–1868.
15 P. B. Allen, A. E. Sgro, D. L. Chao, B. E. Doepker, J. S. Edgar,K. Shen and D. T. Chiu, J. Neurosci. Methods, 2008, 173,20–26.
16 S. E. Hulme, S. S. Shevkoplyas, J. Apfeld, W. Fontana and
G. M. Whitesides, Lab Chip, 2007, 7, 1515–1523.17 D. R. Albrecht and C. I. Bargmann, Nat. Methods, 2011, 8,
599–605.18 K. Chung, M. Zhan, J. Srinivasan, P. W. Sternberg, E. Gong,
F. C. Schroeder and H. Lu, Lab Chip, 2011, 11, 3689–3697.This journal is © The Royal Society of Chemistry 2015
Lab on a Chip Paper
Publ
ishe
d on
10
Nov
embe
r 20
14. D
ownl
oade
d by
Pri
ncet
on U
nive
rsity
on
07/0
1/20
16 2
3:07
:24.
View Article Online
19 C. B. Rohde, F. Zeng, R. Gonzalez-Rubio, M. Angel and
M. F. Yanik, Proc. Natl. Acad. Sci. U. S. A., 2007, 104,13891–13895.20 P. Rezai, S. Salam, P. R. Selvaganapathy and B. P. Gupta,
Lab Chip, 2012, 12, 1831–1840.21 K. Chung, M. M. Crane and H. Lu, Nat. Methods, 2008, 5,
637–643.22 S. R. Lockery, S. E. Hulme, W. M. Roberts, K. J. Robinson,
A. Laromaine, T. H. Lindsay, G. M. Whitesides andJ. C. Weeks, Lab Chip, 2012, 12, 2211–2220.23 P. Rezai, A. Siddiqui, P. R. Selvaganapathy and B. P. Gupta,
Lab Chip, 2010, 10, 220–226.24 S. E. Hulme, S. S. Shevkoplyas, A. P. McGuigan, J. Apfeld,
W. Fontana and G. M. Whitesides, Lab Chip, 2010, 10,589–597.This journal is © The Royal Society of Chemistry 2015
25 H. Wen, W. Shi and J. Qin, Biomed. Microdevices, 2012, 14,
721–728.26 B. Xian, J. Shen, W. Chen, N. Sun, N. Qiao, D. Jiang and
T. Yu, Aging Cell, 2013, 12, 398–409.27 H. Chuang, D. M. Raizen, A. Lamb, N. Dabbish and
H. H. Bau, Lab Chip, 2011, 11, 599–604.28 H. Ma, L. Jiang, W. Shi, J. Qin and B. Lin, Biomicrofluidics,
2009, 3, 044114.29 J. Yang, Z. Chen, P. Ching, Q. Shi and X. Li, Lab Chip,
2013, 13, 3373–3382.30 S. Brenner, Genetics, 1974, 77, 71–94.
31 K. Drescher, Y. Shen, B. L. Bassler and H. A. Stone, Proc.Natl. Acad. Sci. U. S. A., 2013, 110, 4345–4350.32 K. Lin, H. Hsin, N. Libina and C. Kenyon, Nat. Genet.,
2001, 28, 139–145.
Lab Chip, 2015, 15, 524–531 | 531