Embed Size (px)
Citation preview
Lab Validation Report NetApp Solutions for Hadoop
Ready-to-deploy Enterprise-class Storage Platform for Hadoop
By Tony Palmer, Senior ESG Lab Analyst and Jack Poller, ESG Lab Analyst
November 2015 © 2015 by The Enterprise Strategy Group, Inc. All Rights Reserved.
Lab Validation: NetApp Solutions for Hadoop 2
© 2015 by The Enterprise Strategy Group, Inc. All Rights Reserved.
Contents
Introduction .................................................................................................................................................. 3 Background ............................................................................................................................................................... 3 NetApp Solutions for Hadoop .................................................................................................................................. 5
ESG Lab Validation ........................................................................................................................................ 6 Getting Started ......................................................................................................................................................... 6 Performance and Scalability ..................................................................................................................................... 6 Efficiency ................................................................................................................................................................. 12 Recoverability ......................................................................................................................................................... 14
ESG Lab Validation Highlights ..................................................................................................................... 18
Issues to Consider ....................................................................................................................................... 18
The Bigger Truth ......................................................................................................................................... 19
Appendix ..................................................................................................................................................... 20
All trademark names are property of their respective companies. Information contained in this publication has been obtained by sources The Enterprise Strategy Group (ESG) considers to be reliable but is not warranted by ESG. This publication may contain opinions of ESG, which are subject to change from time to time. This publication is copyrighted by The Enterprise Strategy Group, Inc. Any reproduction or redistribution of this publication, in whole or in part, whether in hard-copy format, electronically, or otherwise to persons not authorized to receive it, without the express consent of The Enterprise Strategy Group, Inc., is in violation of U.S. copyright law and will be subject to an action for civil damages and, if applicable, criminal prosecution. Should you have any questions, please contact ESG Client Relations at 508.482.0188.
ESG Lab Reports
The goal of ESG Lab reports is to educate IT professionals about data center technology products for companies of all types and sizes. ESG Lab reports are not meant to replace the evaluation process that should be conducted before making purchasing decisions, but rather to provide insight into these emerging technologies. Our objective is to go over some of the more valuable feature/functions of products, show how they can be used to solve real customer problems and identify any areas needing improvement. ESG Lab's expert third-party perspective is based on our own hands-on testing as well as on interviews with customers who use these products in production environments. This ESG Lab report was sponsored by NetApp.
Lab Validation: NetApp Solutions for Hadoop 3
© 2015 by The Enterprise Strategy Group, Inc. All Rights Reserved.
Introduction
This ESG Lab Report presents the results of hands-on testing of the NetApp Solutions for Hadoop, with a focus on the ability of the solutions to provide ready-to-deploy, enterprise-class infrastructures for the Hadoop platform and enable fast, actionable insights while improving cluster uptime and reducing capital and operating costs.
Background
The need for real-time data processing and data analytics as well as the increasing complexity and variety of data sources have been driving broad adoption of advanced data processing and analytics frameworks, and ESG expects this trend to continue. These frameworks require storing, integrating, and processing vast and growing amounts of data.
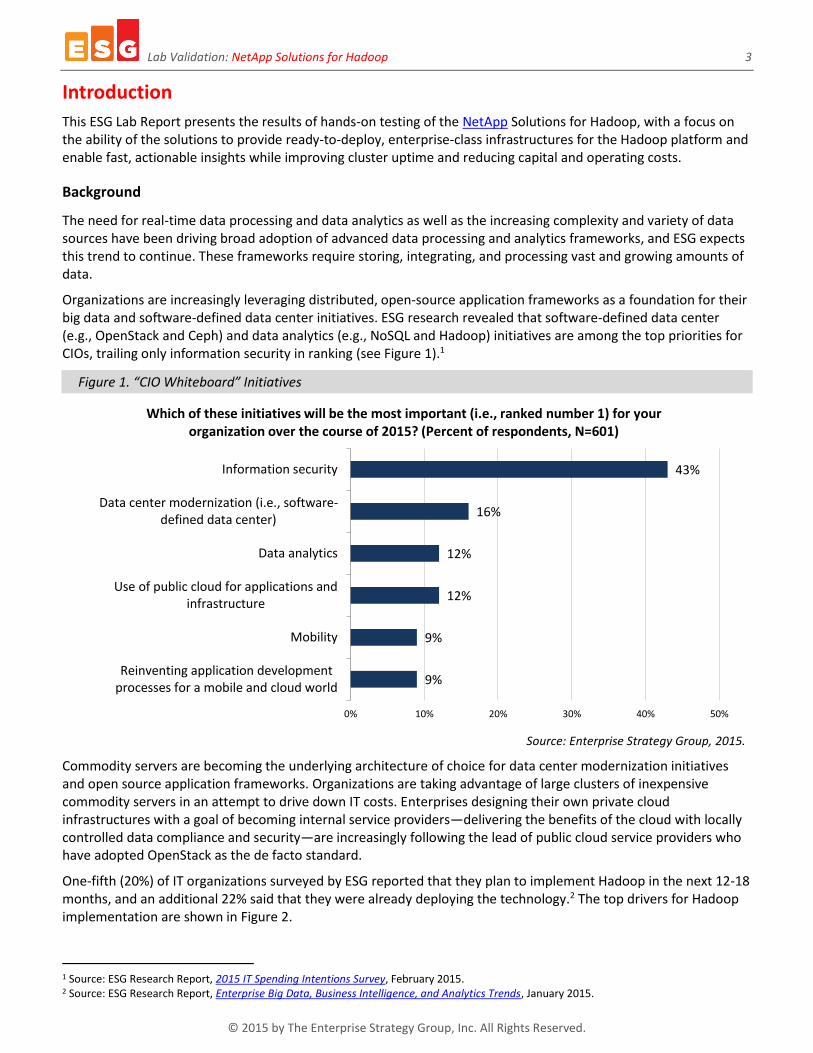
Organizations are increasingly leveraging distributed, open-source application frameworks as a foundation for their big data and software-defined data center initiatives. ESG research revealed that software-defined data center (e.g., OpenStack and Ceph) and data analytics (e.g., NoSQL and Hadoop) initiatives are among the top priorities for CIOs, trailing only information security in ranking (see Figure 1).1
Figure 1. “CIO Whiteboard” Initiatives
Source: Enterprise Strategy Group, 2015.
Commodity servers are becoming the underlying architecture of choice for data center modernization initiatives and open source application frameworks. Organizations are taking advantage of large clusters of inexpensive commodity servers in an attempt to drive down IT costs. Enterprises designing their own private cloud infrastructures with a goal of becoming internal service providers—delivering the benefits of the cloud with locally controlled data compliance and security—are increasingly following the lead of public cloud service providers who have adopted OpenStack as the de facto standard.
One-fifth (20%) of IT organizations surveyed by ESG reported that they plan to implement Hadoop in the next 12-18 months, and an additional 22% said that they were already deploying the technology.2 The top drivers for Hadoop implementation are shown in Figure 2.
1 Source: ESG Research Report, 2015 IT Spending Intentions Survey, February 2015. 2 Source: ESG Research Report, Enterprise Big Data, Business Intelligence, and Analytics Trends, January 2015.
9%
9%
12%
12%
16%
43%
0% 10% 20% 30% 40% 50%
Reinventing application developmentprocesses for a mobile and cloud world
Mobility
Use of public cloud for applications andinfrastructure
Data analytics
Data center modernization (i.e., software-defined data center)
Information security
Which of these initiatives will be the most important (i.e., ranked number 1) for your organization over the course of 2015? (Percent of respondents, N=601)
Lab Validation: NetApp Solutions for Hadoop 4
© 2015 by The Enterprise Strategy Group, Inc. All Rights Reserved.
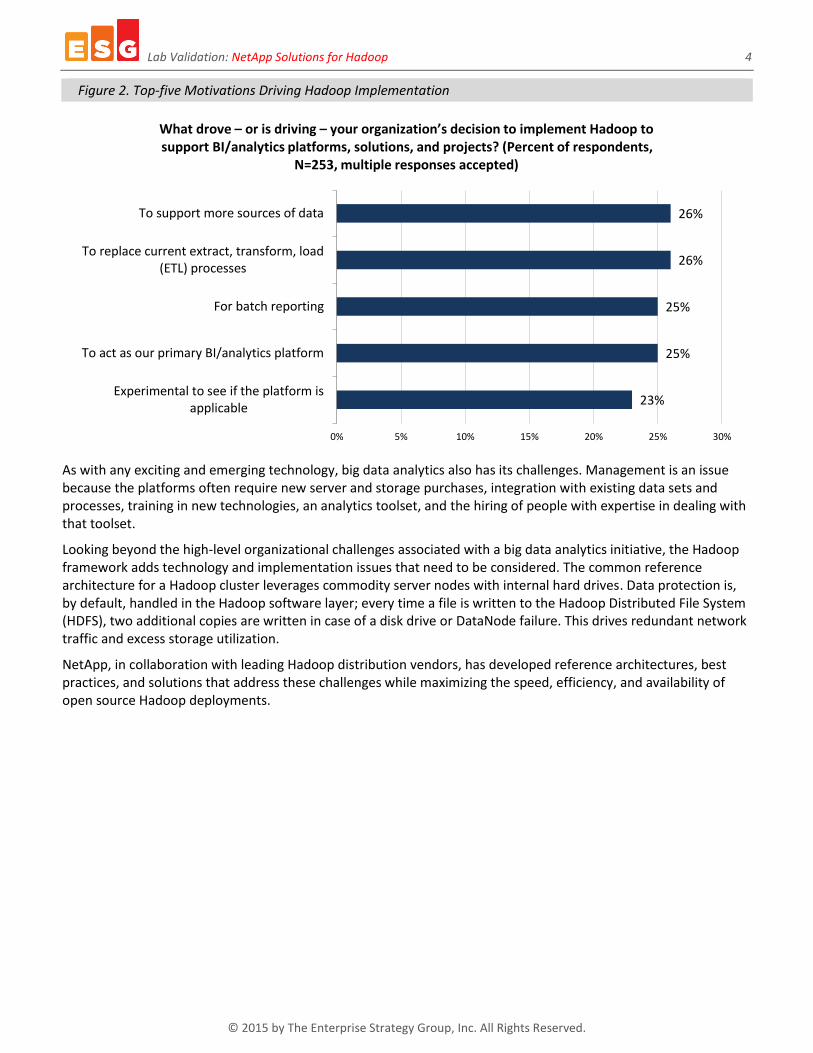
Figure 2. Top-five Motivations Driving Hadoop Implementation
As with any exciting and emerging technology, big data analytics also has its challenges. Management is an issue because the platforms often require new server and storage purchases, integration with existing data sets and processes, training in new technologies, an analytics toolset, and the hiring of people with expertise in dealing with that toolset.
Looking beyond the high-level organizational challenges associated with a big data analytics initiative, the Hadoop framework adds technology and implementation issues that need to be considered. The common reference architecture for a Hadoop cluster leverages commodity server nodes with internal hard drives. Data protection is, by default, handled in the Hadoop software layer; every time a file is written to the Hadoop Distributed File System (HDFS), two additional copies are written in case of a disk drive or DataNode failure. This drives redundant network traffic and excess storage utilization.
NetApp, in collaboration with leading Hadoop distribution vendors, has developed reference architectures, best practices, and solutions that address these challenges while maximizing the speed, efficiency, and availability of open source Hadoop deployments.
23%
25%
25%
26%
26%
0% 5% 10% 15% 20% 25% 30%
Experimental to see if the platform isapplicable
To act as our primary BI/analytics platform
For batch reporting
To replace current extract, transform, load(ETL) processes
To support more sources of data
What drove – or is driving – your organization’s decision to implement Hadoop to support BI/analytics platforms, solutions, and projects? (Percent of respondents,
N=253, multiple responses accepted)
Lab Validation: NetApp Solutions for Hadoop 5
© 2015 by The Enterprise Strategy Group, Inc. All Rights Reserved.
NetApp Solutions for Hadoop
Hadoop is an open source and significant emerging technology for solving business problems around large volumes of mostly unstructured data that cannot be analyzed with traditional database tools. The NetApp Solutions for Hadoop combine the power of the Hadoop framework with flexible storage, professional support, and services provided by NetApp and its partners to deliver higher Hadoop cluster availability and efficiency. Based on a reference architecture, it focuses on scaling Hadoop from its departmental origins to an enterprise infrastructure with independent compute and storage scaling, faster cluster ingest, and faster job completion under failure conditions.
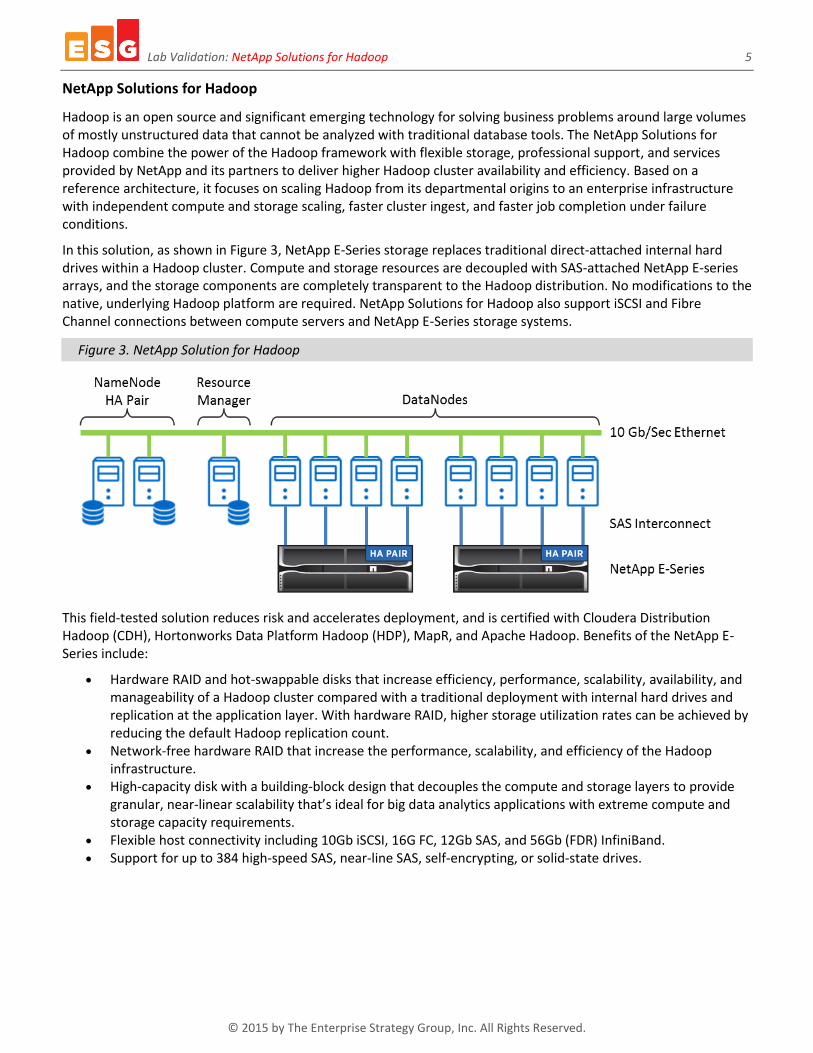
In this solution, as shown in Figure 3, NetApp E-Series storage replaces traditional direct-attached internal hard drives within a Hadoop cluster. Compute and storage resources are decoupled with SAS-attached NetApp E-series arrays, and the storage components are completely transparent to the Hadoop distribution. No modifications to the native, underlying Hadoop platform are required. NetApp Solutions for Hadoop also support iSCSI and Fibre Channel connections between compute servers and NetApp E-Series storage systems.
Figure 3. NetApp Solution for Hadoop
This field-tested solution reduces risk and accelerates deployment, and is certified with Cloudera Distribution Hadoop (CDH), Hortonworks Data Platform Hadoop (HDP), MapR, and Apache Hadoop. Benefits of the NetApp E-Series include:
Hardware RAID and hot-swappable disks that increase efficiency, performance, scalability, availability, and manageability of a Hadoop cluster compared with a traditional deployment with internal hard drives and replication at the application layer. With hardware RAID, higher storage utilization rates can be achieved by reducing the default Hadoop replication count.
Network-free hardware RAID that increase the performance, scalability, and efficiency of the Hadoop infrastructure.
High-capacity disk with a building-block design that decouples the compute and storage layers to provide granular, near-linear scalability that’s ideal for big data analytics applications with extreme compute and storage capacity requirements.
Flexible host connectivity including 10Gb iSCSI, 16G FC, 12Gb SAS, and 56Gb (FDR) InfiniBand. Support for up to 384 high-speed SAS, near-line SAS, self-encrypting, or solid-state drives.
Lab Validation: NetApp Solutions for Hadoop 6
© 2015 by The Enterprise Strategy Group, Inc. All Rights Reserved.
ESG Lab Validation
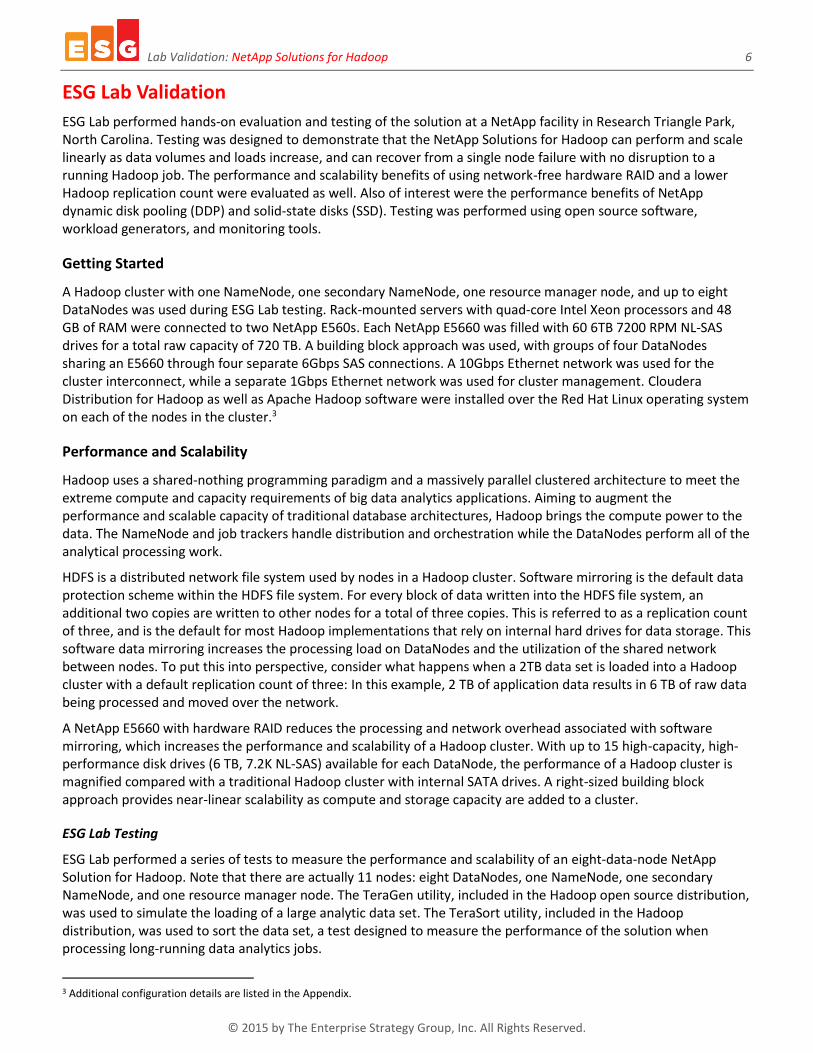
ESG Lab performed hands-on evaluation and testing of the solution at a NetApp facility in Research Triangle Park, North Carolina. Testing was designed to demonstrate that the NetApp Solutions for Hadoop can perform and scale linearly as data volumes and loads increase, and can recover from a single node failure with no disruption to a running Hadoop job. The performance and scalability benefits of using network-free hardware RAID and a lower Hadoop replication count were evaluated as well. Also of interest were the performance benefits of NetApp dynamic disk pooling (DDP) and solid-state disks (SSD). Testing was performed using open source software, workload generators, and monitoring tools.
Getting Started
A Hadoop cluster with one NameNode, one secondary NameNode, one resource manager node, and up to eight DataNodes was used during ESG Lab testing. Rack-mounted servers with quad-core Intel Xeon processors and 48 GB of RAM were connected to two NetApp E560s. Each NetApp E5660 was filled with 60 6TB 7200 RPM NL-SAS drives for a total raw capacity of 720 TB. A building block approach was used, with groups of four DataNodes sharing an E5660 through four separate 6Gbps SAS connections. A 10Gbps Ethernet network was used for the cluster interconnect, while a separate 1Gbps Ethernet network was used for cluster management. Cloudera Distribution for Hadoop as well as Apache Hadoop software were installed over the Red Hat Linux operating system on each of the nodes in the cluster.3
Performance and Scalability
Hadoop uses a shared-nothing programming paradigm and a massively parallel clustered architecture to meet the extreme compute and capacity requirements of big data analytics applications. Aiming to augment the performance and scalable capacity of traditional database architectures, Hadoop brings the compute power to the data. The NameNode and job trackers handle distribution and orchestration while the DataNodes perform all of the analytical processing work.
HDFS is a distributed network file system used by nodes in a Hadoop cluster. Software mirroring is the default data protection scheme within the HDFS file system. For every block of data written into the HDFS file system, an additional two copies are written to other nodes for a total of three copies. This is referred to as a replication count of three, and is the default for most Hadoop implementations that rely on internal hard drives for data storage. This software data mirroring increases the processing load on DataNodes and the utilization of the shared network between nodes. To put this into perspective, consider what happens when a 2TB data set is loaded into a Hadoop cluster with a default replication count of three: In this example, 2 TB of application data results in 6 TB of raw data being processed and moved over the network.
A NetApp E5660 with hardware RAID reduces the processing and network overhead associated with software mirroring, which increases the performance and scalability of a Hadoop cluster. With up to 15 high-capacity, high-performance disk drives (6 TB, 7.2K NL-SAS) available for each DataNode, the performance of a Hadoop cluster is magnified compared with a traditional Hadoop cluster with internal SATA drives. A right-sized building block approach provides near-linear scalability as compute and storage capacity are added to a cluster.
ESG Lab Testing
ESG Lab performed a series of tests to measure the performance and scalability of an eight-data-node NetApp Solution for Hadoop. Note that there are actually 11 nodes: eight DataNodes, one NameNode, one secondary NameNode, and one resource manager node. The TeraGen utility, included in the Hadoop open source distribution, was used to simulate the loading of a large analytic data set. The TeraSort utility, included in the Hadoop distribution, was used to sort the data set, a test designed to measure the performance of the solution when processing long-running data analytics jobs.
3 Additional configuration details are listed in the Appendix.
Lab Validation: NetApp Solutions for Hadoop 7
© 2015 by The Enterprise Strategy Group, Inc. All Rights Reserved.
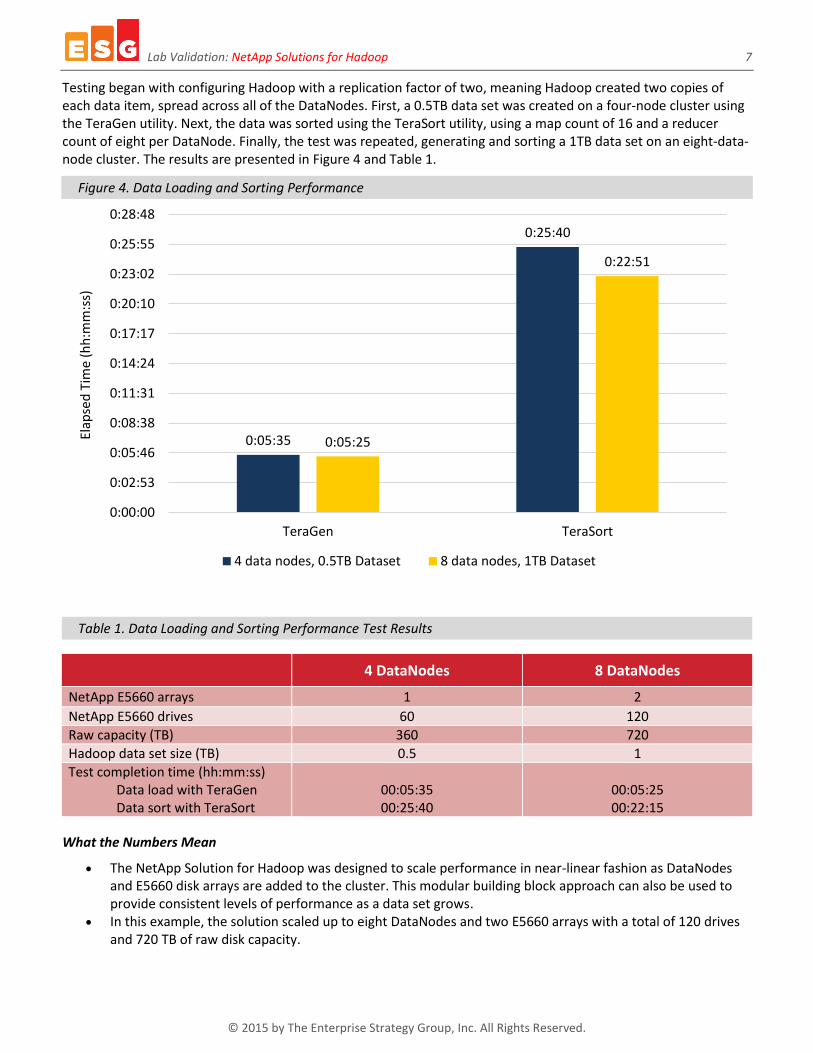
Testing began with configuring Hadoop with a replication factor of two, meaning Hadoop created two copies of each data item, spread across all of the DataNodes. First, a 0.5TB data set was created on a four-node cluster using the TeraGen utility. Next, the data was sorted using the TeraSort utility, using a map count of 16 and a reducer count of eight per DataNode. Finally, the test was repeated, generating and sorting a 1TB data set on an eight-data-node cluster. The results are presented in Figure 4 and Table 1.
Figure 4. Data Loading and Sorting Performance
Table 1. Data Loading and Sorting Performance Test Results
4 DataNodes 8 DataNodes
NetApp E5660 arrays 1 2
NetApp E5660 drives 60 120
Raw capacity (TB) 360 720
Hadoop data set size (TB) 0.5 1
Test completion time (hh:mm:ss) Data load with TeraGen Data sort with TeraSort
00:05:35 00:25:40
00:05:25 00:22:15
What the Numbers Mean
The NetApp Solution for Hadoop was designed to scale performance in near-linear fashion as DataNodes and E5660 disk arrays are added to the cluster. This modular building block approach can also be used to provide consistent levels of performance as a data set grows.
In this example, the solution scaled up to eight DataNodes and two E5660 arrays with a total of 120 drives and 720 TB of raw disk capacity.
0:05:35
0:25:40
0:05:25
0:22:51
0:00:00
0:02:53
0:05:46
0:08:38
0:11:31
0:14:24
0:17:17
0:20:10
0:23:02
0:25:55
0:28:48
TeraGen TeraSort
Elap
sed
Tim
e (h
h:m
m:s
s)
4 data nodes, 0.5TB Dataset 8 data nodes, 1TB Dataset
Lab Validation: NetApp Solutions for Hadoop 8
© 2015 by The Enterprise Strategy Group, Inc. All Rights Reserved.
As the number of DataNodes increased and the volume of data generated increased linearly, the TeraGen data loading completion time remained flat, at approximately five and a half minutes (+/- 2%). This demonstrates the linear performance scalability of the NetApp Solution for Hadoop.
As the number of DataNodes increased and the volume of data generated increased linearly, the TeraSort data sorting completion time decreased 11%, from 25:40 to 22:51, demonstrating the performance scalability of the NetApp Solution for Hadoop.
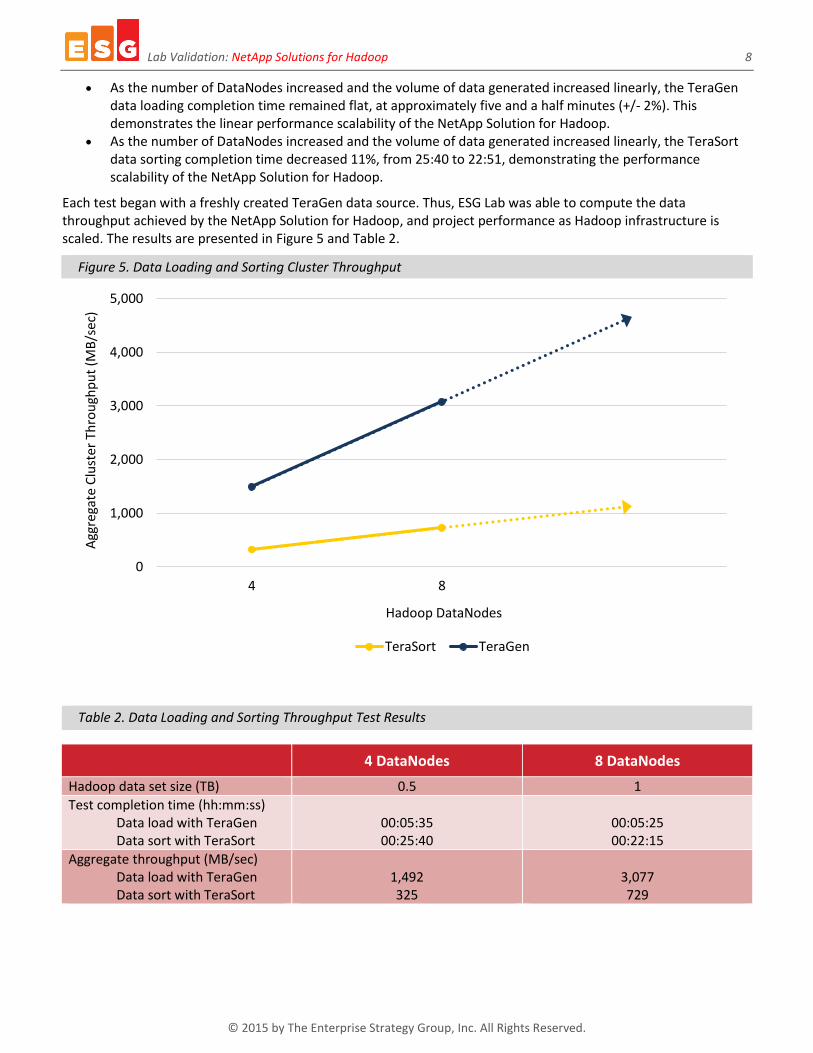
Each test began with a freshly created TeraGen data source. Thus, ESG Lab was able to compute the data throughput achieved by the NetApp Solution for Hadoop, and project performance as Hadoop infrastructure is scaled. The results are presented in Figure 5 and Table 2.
Figure 5. Data Loading and Sorting Cluster Throughput
Table 2. Data Loading and Sorting Throughput Test Results
4 DataNodes 8 DataNodes
Hadoop data set size (TB) 0.5 1
Test completion time (hh:mm:ss) Data load with TeraGen Data sort with TeraSort
00:05:35 00:25:40
00:05:25 00:22:15
Aggregate throughput (MB/sec) Data load with TeraGen Data sort with TeraSort
1,492 325
3,077 729
0
1,000
2,000
3,000
4,000
5,000
4 8
Agg
rega
te C
lust
er T
hro
ugh
pu
t (M
B/s
ec)
Hadoop DataNodes
TeraSort TeraGen
Lab Validation: NetApp Solutions for Hadoop 9
© 2015 by The Enterprise Strategy Group, Inc. All Rights Reserved.
What the Numbers Mean
As shown in Figure 5, aggregate analytics throughput doubled when the number of DataNodes and E5660 arrays were doubled in the cluster. In previous testing, NSH demonstrated near-linear scaling when 24 nodes were added to a cluster.4
A job completion time of five and a half minutes for the creation of a 1TB data set indicates that the eight-node NetApp solution sustained a high aggregate throughput rate of 3.077 GB/sec.
An aggregate data creation rate of 3.077 GB/sec means that an eight-node cluster can be used to create 11 TB of data per hour.
NetApp DDP
NetApp Dynamic Disk Pools (DDP) is a data protection schema designed to provide greater simplicity, flexibility, and availability than traditional RAID. DDP distributes data, parity information, and spare capacity across a pool of drives, defining which drives are used for segment placement to ensure data is fully protected. Disk Pools can be flexibly sized from 11 to 384 drives to optimize utilization for virtually any configuration. DDP is designed to deliver and maintain high performance while recovering from a drive failure.
Traditional RAID requires an administrator to allocate drives to RAID groups and designate dedicated drives as hot spares, which sit idle until invoked after a drive failure. In the case of a drive failure, the remaining drives in a RAID group must rebuild the data from the failed drive while performing application I/O. This process can take many hours to days, depending on the size of the drives and load on the Hadoop compute server.
With DDP, all disks are utilized in a pool, with volumes spread across all drives on a random 10-drive (8+2) per segment basis. Note that spare capacity on each drive is available for allocation into a new pool or for use in a rebuild of a failed drive. Essentially, every disk in a pool is a “hot spare” and all disks share in the rebuild. Another benefit of DDP is that only actual volume data needs to be rebuilt after a drive failure.
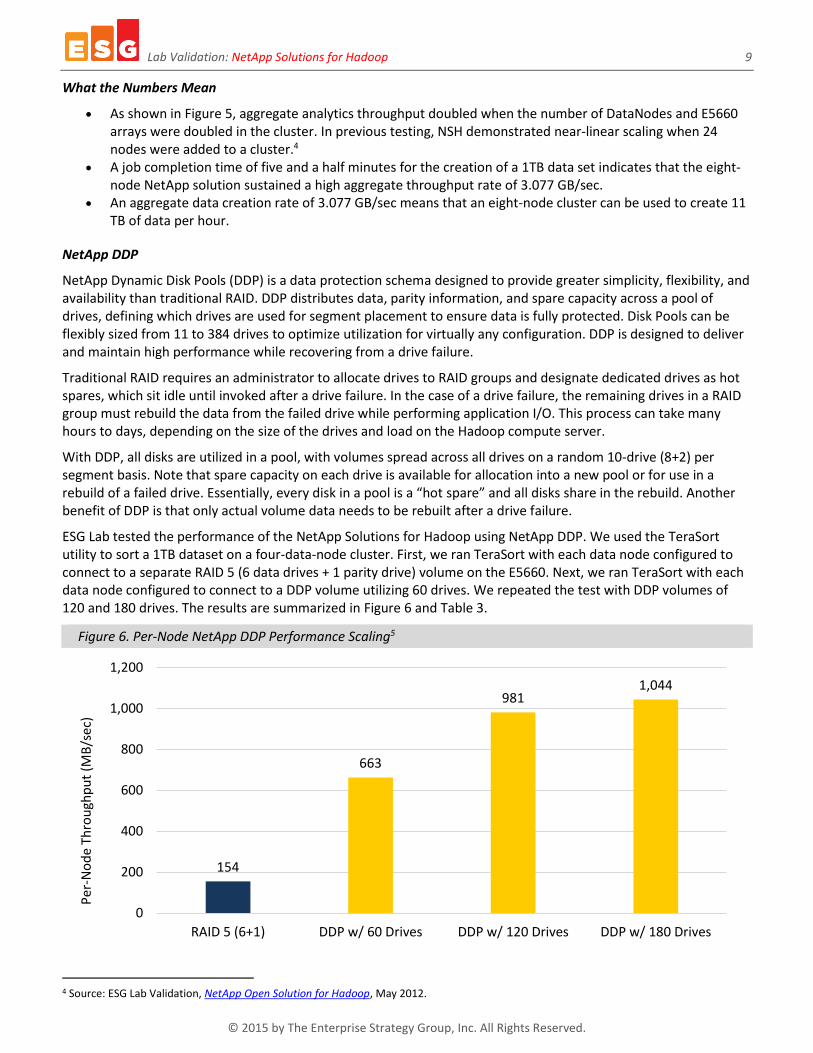
ESG Lab tested the performance of the NetApp Solutions for Hadoop using NetApp DDP. We used the TeraSort utility to sort a 1TB dataset on a four-data-node cluster. First, we ran TeraSort with each data node configured to connect to a separate RAID 5 (6 data drives + 1 parity drive) volume on the E5660. Next, we ran TeraSort with each data node configured to connect to a DDP volume utilizing 60 drives. We repeated the test with DDP volumes of 120 and 180 drives. The results are summarized in Figure 6 and Table 3.
Figure 6. Per-Node NetApp DDP Performance Scaling5
4 Source: ESG Lab Validation, NetApp Open Solution for Hadoop, May 2012.
154
663
9811,044
0
200
400
600
800
1,000
1,200
RAID 5 (6+1) DDP w/ 60 Drives DDP w/ 120 Drives DDP w/ 180 Drives
Per
-No
de
Thro
ugh
pu
t (M
B/s
ec)
Lab Validation: NetApp Solutions for Hadoop 10
© 2015 by The Enterprise Strategy Group, Inc. All Rights Reserved.
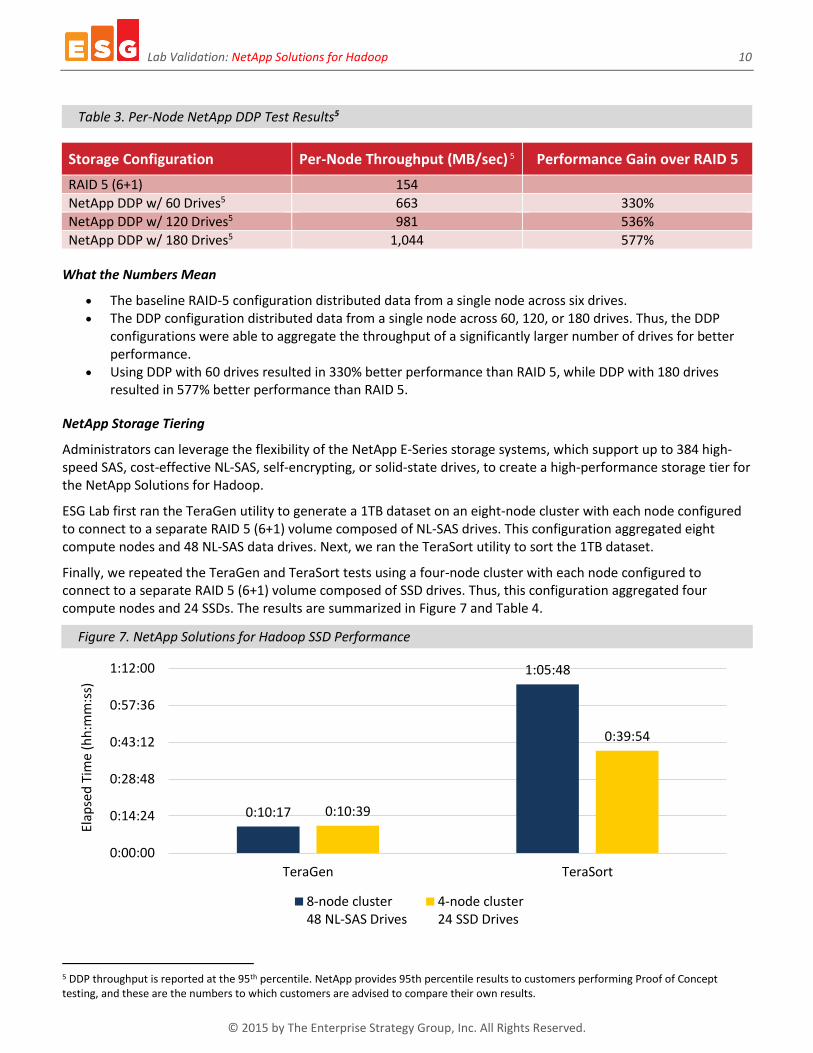
Table 3. Per-Node NetApp DDP Test Results5
Storage Configuration Per-Node Throughput (MB/sec) 5 Performance Gain over RAID 5
RAID 5 (6+1) 154
NetApp DDP w/ 60 Drives5 663 330%
NetApp DDP w/ 120 Drives5 981 536%
NetApp DDP w/ 180 Drives5 1,044 577%
What the Numbers Mean
The baseline RAID-5 configuration distributed data from a single node across six drives. The DDP configuration distributed data from a single node across 60, 120, or 180 drives. Thus, the DDP
configurations were able to aggregate the throughput of a significantly larger number of drives for better performance.
Using DDP with 60 drives resulted in 330% better performance than RAID 5, while DDP with 180 drives resulted in 577% better performance than RAID 5.
NetApp Storage Tiering
Administrators can leverage the flexibility of the NetApp E-Series storage systems, which support up to 384 high-speed SAS, cost-effective NL-SAS, self-encrypting, or solid-state drives, to create a high-performance storage tier for the NetApp Solutions for Hadoop.
ESG Lab first ran the TeraGen utility to generate a 1TB dataset on an eight-node cluster with each node configured to connect to a separate RAID 5 (6+1) volume composed of NL-SAS drives. This configuration aggregated eight compute nodes and 48 NL-SAS data drives. Next, we ran the TeraSort utility to sort the 1TB dataset.
Finally, we repeated the TeraGen and TeraSort tests using a four-node cluster with each node configured to connect to a separate RAID 5 (6+1) volume composed of SSD drives. Thus, this configuration aggregated four compute nodes and 24 SSDs. The results are summarized in Figure 7 and Table 4.
Figure 7. NetApp Solutions for Hadoop SSD Performance
5 DDP throughput is reported at the 95th percentile. NetApp provides 95th percentile results to customers performing Proof of Concept testing, and these are the numbers to which customers are advised to compare their own results.
0:10:17
1:05:48
0:10:39
0:39:54
0:00:00
0:14:24
0:28:48
0:43:12
0:57:36
1:12:00
TeraGen TeraSort
Elap
sed
Tim
e (h
h:m
m:s
s)
8-node cluster48 NL-SAS Drives
4-node cluster24 SSD Drives
Lab Validation: NetApp Solutions for Hadoop 11
© 2015 by The Enterprise Strategy Group, Inc. All Rights Reserved.
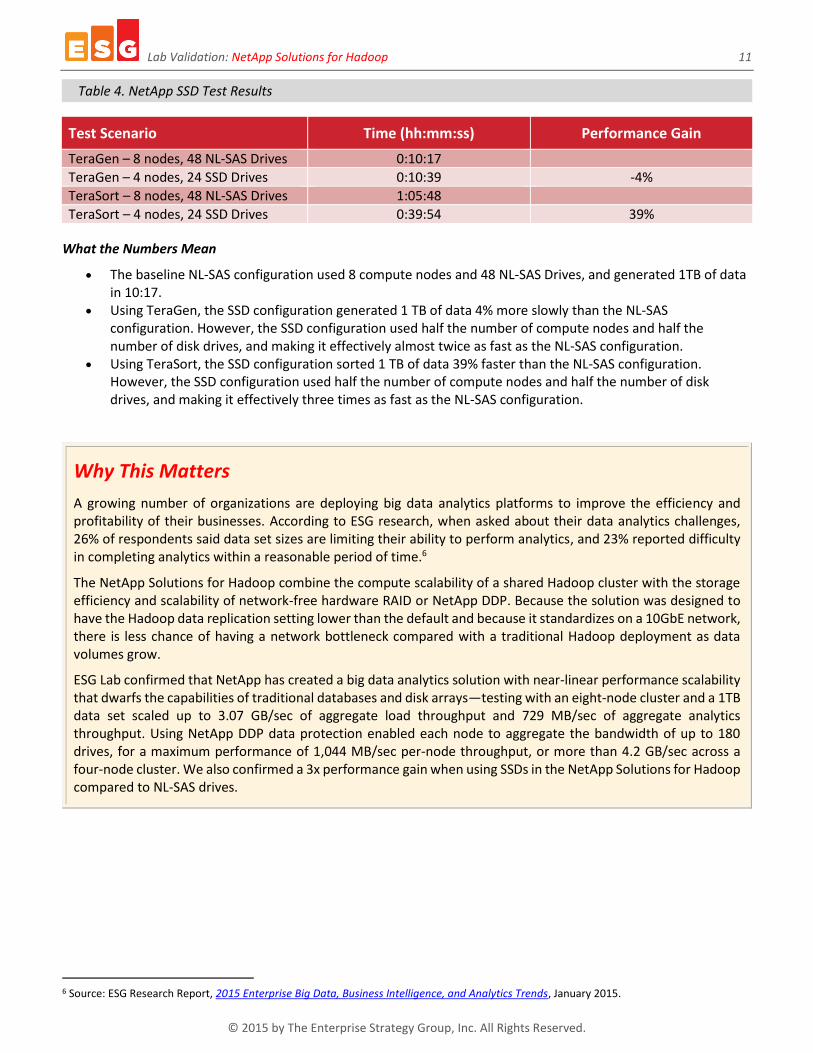
Table 4. NetApp SSD Test Results
Test Scenario Time (hh:mm:ss) Performance Gain
TeraGen – 8 nodes, 48 NL-SAS Drives 0:10:17
TeraGen – 4 nodes, 24 SSD Drives 0:10:39 -4%
TeraSort – 8 nodes, 48 NL-SAS Drives 1:05:48
TeraSort – 4 nodes, 24 SSD Drives 0:39:54 39%
What the Numbers Mean
The baseline NL-SAS configuration used 8 compute nodes and 48 NL-SAS Drives, and generated 1TB of data in 10:17.
Using TeraGen, the SSD configuration generated 1 TB of data 4% more slowly than the NL-SAS configuration. However, the SSD configuration used half the number of compute nodes and half the number of disk drives, and making it effectively almost twice as fast as the NL-SAS configuration.
Using TeraSort, the SSD configuration sorted 1 TB of data 39% faster than the NL-SAS configuration. However, the SSD configuration used half the number of compute nodes and half the number of disk drives, and making it effectively three times as fast as the NL-SAS configuration.
Why This Matters
A growing number of organizations are deploying big data analytics platforms to improve the efficiency and profitability of their businesses. According to ESG research, when asked about their data analytics challenges, 26% of respondents said data set sizes are limiting their ability to perform analytics, and 23% reported difficulty in completing analytics within a reasonable period of time.6
The NetApp Solutions for Hadoop combine the compute scalability of a shared Hadoop cluster with the storage efficiency and scalability of network-free hardware RAID or NetApp DDP. Because the solution was designed to have the Hadoop data replication setting lower than the default and because it standardizes on a 10GbE network, there is less chance of having a network bottleneck compared with a traditional Hadoop deployment as data volumes grow.
ESG Lab confirmed that NetApp has created a big data analytics solution with near-linear performance scalability that dwarfs the capabilities of traditional databases and disk arrays—testing with an eight-node cluster and a 1TB data set scaled up to 3.07 GB/sec of aggregate load throughput and 729 MB/sec of aggregate analytics throughput. Using NetApp DDP data protection enabled each node to aggregate the bandwidth of up to 180 drives, for a maximum performance of 1,044 MB/sec per-node throughput, or more than 4.2 GB/sec across a four-node cluster. We also confirmed a 3x performance gain when using SSDs in the NetApp Solutions for Hadoop compared to NL-SAS drives.
6 Source: ESG Research Report, 2015 Enterprise Big Data, Business Intelligence, and Analytics Trends, January 2015.
Lab Validation: NetApp Solutions for Hadoop 12
© 2015 by The Enterprise Strategy Group, Inc. All Rights Reserved.
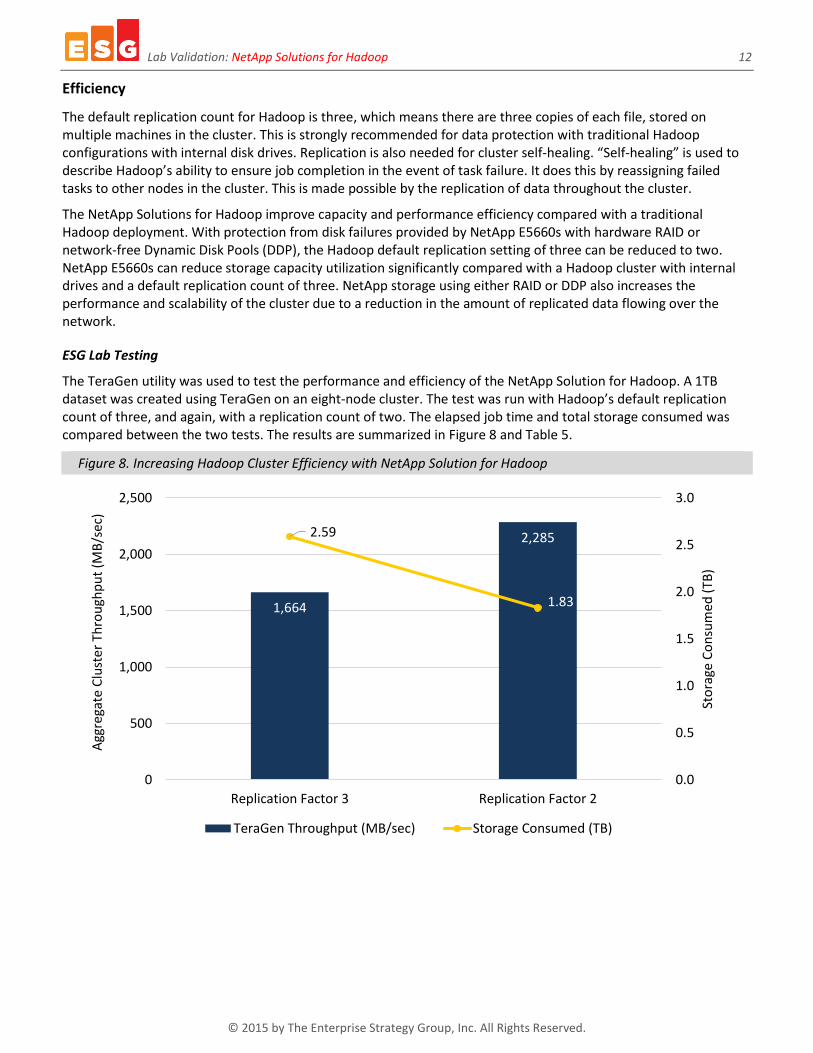
Efficiency
The default replication count for Hadoop is three, which means there are three copies of each file, stored on multiple machines in the cluster. This is strongly recommended for data protection with traditional Hadoop configurations with internal disk drives. Replication is also needed for cluster self-healing. “Self-healing” is used to describe Hadoop’s ability to ensure job completion in the event of task failure. It does this by reassigning failed tasks to other nodes in the cluster. This is made possible by the replication of data throughout the cluster.
The NetApp Solutions for Hadoop improve capacity and performance efficiency compared with a traditional Hadoop deployment. With protection from disk failures provided by NetApp E5660s with hardware RAID or network-free Dynamic Disk Pools (DDP), the Hadoop default replication setting of three can be reduced to two. NetApp E5660s can reduce storage capacity utilization significantly compared with a Hadoop cluster with internal drives and a default replication count of three. NetApp storage using either RAID or DDP also increases the performance and scalability of the cluster due to a reduction in the amount of replicated data flowing over the network.
ESG Lab Testing
The TeraGen utility was used to test the performance and efficiency of the NetApp Solution for Hadoop. A 1TB dataset was created using TeraGen on an eight-node cluster. The test was run with Hadoop’s default replication count of three, and again, with a replication count of two. The elapsed job time and total storage consumed was compared between the two tests. The results are summarized in Figure 8 and Table 5.
Figure 8. Increasing Hadoop Cluster Efficiency with NetApp Solution for Hadoop
1,664
2,2852.59
1.83
0.0
0.5
1.0
1.5
2.0
2.5
3.0
0
500
1,000
1,500
2,000
2,500
Replication Factor 3 Replication Factor 2
Sto
rage
Co
nsu
me
d (
TB)
Agg
rega
te C
lust
er
Thro
ugh
pu
t (M
B/s
ec)
TeraGen Throughput (MB/sec) Storage Consumed (TB)
Lab Validation: NetApp Solutions for Hadoop 13
© 2015 by The Enterprise Strategy Group, Inc. All Rights Reserved.
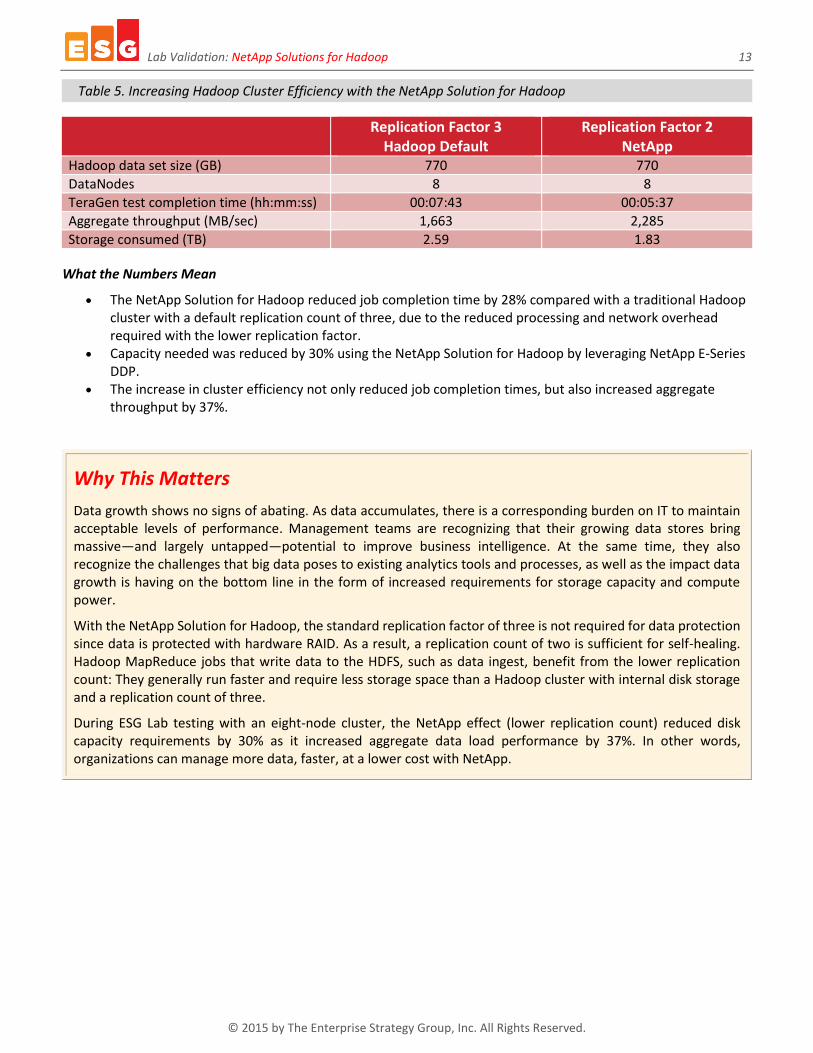
Table 5. Increasing Hadoop Cluster Efficiency with the NetApp Solution for Hadoop
Replication Factor 3 Hadoop Default
Replication Factor 2 NetApp
Hadoop data set size (GB) 770 770
DataNodes 8 8
TeraGen test completion time (hh:mm:ss) 00:07:43 00:05:37
Aggregate throughput (MB/sec) 1,663 2,285
Storage consumed (TB) 2.59 1.83
What the Numbers Mean
The NetApp Solution for Hadoop reduced job completion time by 28% compared with a traditional Hadoop cluster with a default replication count of three, due to the reduced processing and network overhead required with the lower replication factor.
Capacity needed was reduced by 30% using the NetApp Solution for Hadoop by leveraging NetApp E-Series DDP.
The increase in cluster efficiency not only reduced job completion times, but also increased aggregate throughput by 37%.
Why This Matters
Data growth shows no signs of abating. As data accumulates, there is a corresponding burden on IT to maintain acceptable levels of performance. Management teams are recognizing that their growing data stores bring massive—and largely untapped—potential to improve business intelligence. At the same time, they also recognize the challenges that big data poses to existing analytics tools and processes, as well as the impact data growth is having on the bottom line in the form of increased requirements for storage capacity and compute power.
With the NetApp Solution for Hadoop, the standard replication factor of three is not required for data protection since data is protected with hardware RAID. As a result, a replication count of two is sufficient for self-healing. Hadoop MapReduce jobs that write data to the HDFS, such as data ingest, benefit from the lower replication count: They generally run faster and require less storage space than a Hadoop cluster with internal disk storage and a replication count of three.
During ESG Lab testing with an eight-node cluster, the NetApp effect (lower replication count) reduced disk capacity requirements by 30% as it increased aggregate data load performance by 37%. In other words, organizations can manage more data, faster, at a lower cost with NetApp.
Lab Validation: NetApp Solutions for Hadoop 14
© 2015 by The Enterprise Strategy Group, Inc. All Rights Reserved.
Recoverability
In a Hadoop server cluster with internal storage, when a disk drive fails, the entire DataNode is “blacklisted” and no longer available to execute tasks. This can result in degraded performance and the need for a Hadoop administrator to take the DataNode offline, service and replace the failed component, and then redeploy. This process can take several hours to complete. This single point of failure is being addressed by the open source Hadoop community, but a solution was not yet generally available when this report was published.
NetApp Solution for Hadoop increases the availability and recoverability of a Hadoop cluster in two significant ways:
1. NetApp E5660s with hardware RAID provide transparent recovery from hard drive failures. The DataNode is not blacklisted and any job tasks that were running continue uninterrupted.
2. The NetApp E5660 management console (SANtricity) provides a centralized management GUI for monitoring and managing drive failures. This reduces the complexity associated with manually recovering from drive failures in a Hadoop cluster with internal drives.
ESG Lab Testing
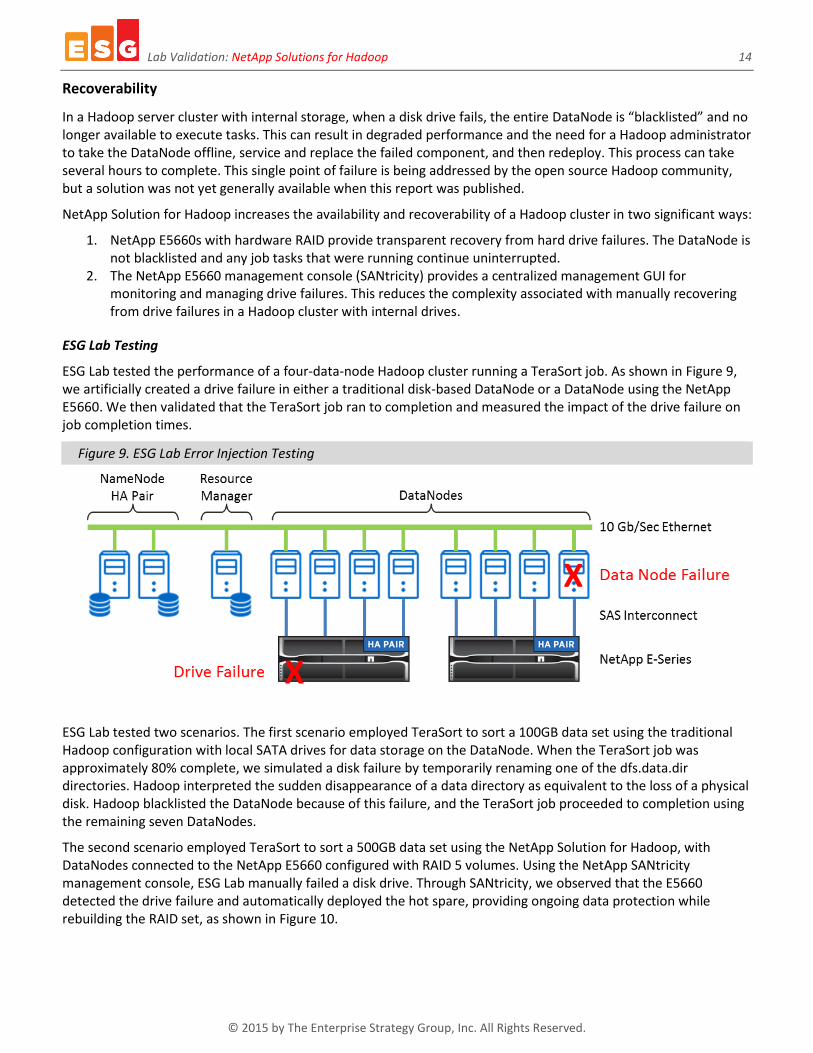
ESG Lab tested the performance of a four-data-node Hadoop cluster running a TeraSort job. As shown in Figure 9, we artificially created a drive failure in either a traditional disk-based DataNode or a DataNode using the NetApp E5660. We then validated that the TeraSort job ran to completion and measured the impact of the drive failure on job completion times.
Figure 9. ESG Lab Error Injection Testing
ESG Lab tested two scenarios. The first scenario employed TeraSort to sort a 100GB data set using the traditional Hadoop configuration with local SATA drives for data storage on the DataNode. When the TeraSort job was approximately 80% complete, we simulated a disk failure by temporarily renaming one of the dfs.data.dir directories. Hadoop interpreted the sudden disappearance of a data directory as equivalent to the loss of a physical disk. Hadoop blacklisted the DataNode because of this failure, and the TeraSort job proceeded to completion using the remaining seven DataNodes.
The second scenario employed TeraSort to sort a 500GB data set using the NetApp Solution for Hadoop, with DataNodes connected to the NetApp E5660 configured with RAID 5 volumes. Using the NetApp SANtricity management console, ESG Lab manually failed a disk drive. Through SANtricity, we observed that the E5660 detected the drive failure and automatically deployed the hot spare, providing ongoing data protection while rebuilding the RAID set, as shown in Figure 10.
Lab Validation: NetApp Solutions for Hadoop 15
© 2015 by The Enterprise Strategy Group, Inc. All Rights Reserved.
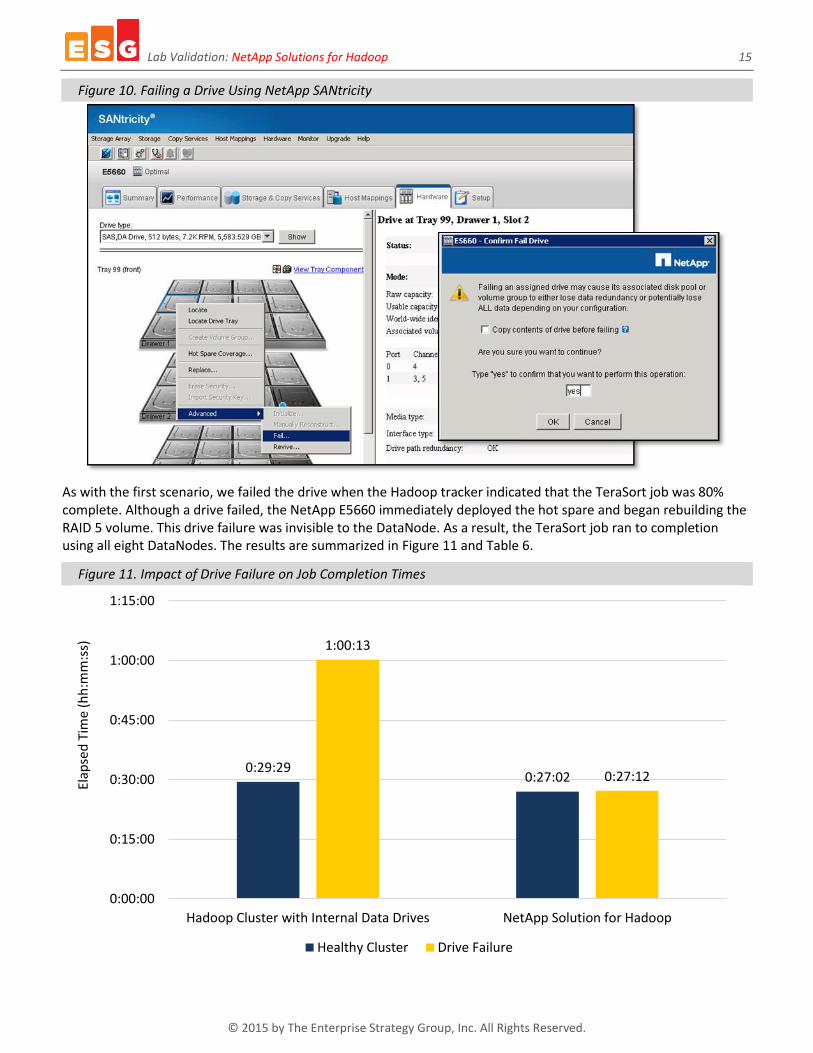
Figure 10. Failing a Drive Using NetApp SANtricity
As with the first scenario, we failed the drive when the Hadoop tracker indicated that the TeraSort job was 80% complete. Although a drive failed, the NetApp E5660 immediately deployed the hot spare and began rebuilding the RAID 5 volume. This drive failure was invisible to the DataNode. As a result, the TeraSort job ran to completion using all eight DataNodes. The results are summarized in Figure 11 and Table 6.
Figure 11. Impact of Drive Failure on Job Completion Times
0:29:290:27:02
1:00:13
0:27:12
0:00:00
0:15:00
0:30:00
0:45:00
1:00:00
1:15:00
Hadoop Cluster with Internal Data Drives NetApp Solution for Hadoop
Elap
sed
Tim
e (h
h:m
m:s
s)
Healthy Cluster Drive Failure
Lab Validation: NetApp Solutions for Hadoop 16
© 2015 by The Enterprise Strategy Group, Inc. All Rights Reserved.
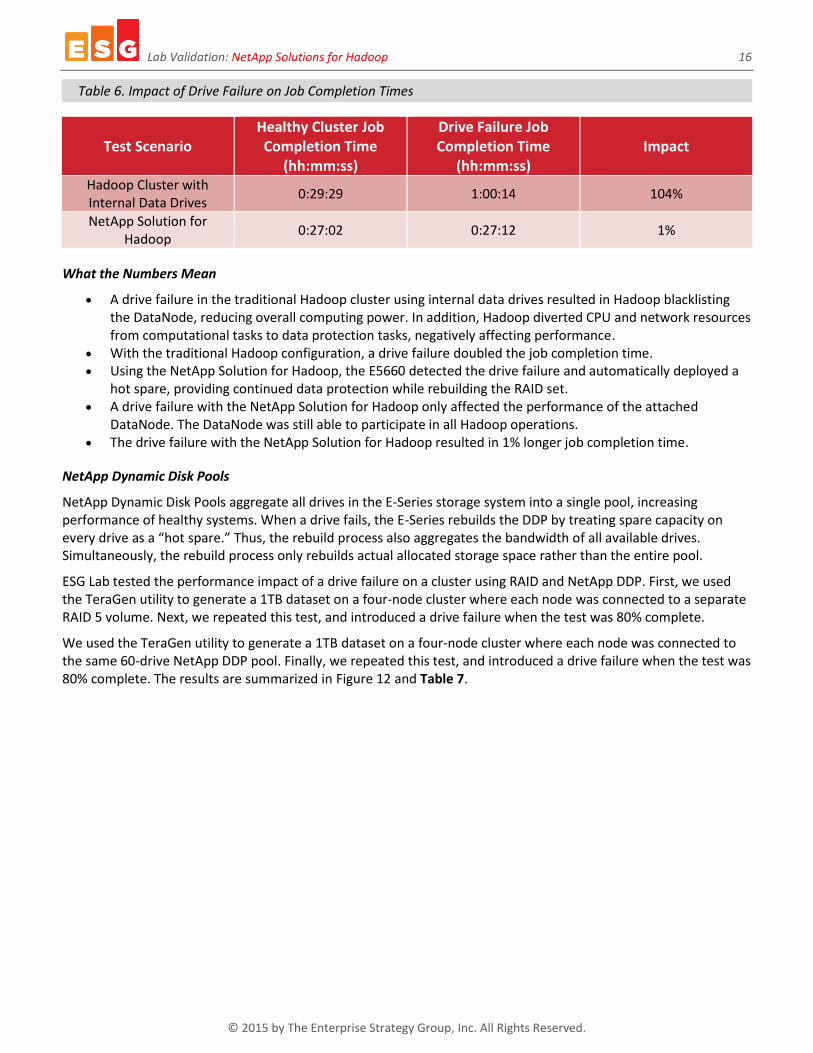
Table 6. Impact of Drive Failure on Job Completion Times
Test Scenario Healthy Cluster Job Completion Time
(hh:mm:ss)
Drive Failure Job Completion Time
(hh:mm:ss) Impact
Hadoop Cluster with Internal Data Drives
0:29:29 1:00:14 104%
NetApp Solution for Hadoop
0:27:02 0:27:12 1%
What the Numbers Mean
A drive failure in the traditional Hadoop cluster using internal data drives resulted in Hadoop blacklisting the DataNode, reducing overall computing power. In addition, Hadoop diverted CPU and network resources from computational tasks to data protection tasks, negatively affecting performance.
With the traditional Hadoop configuration, a drive failure doubled the job completion time. Using the NetApp Solution for Hadoop, the E5660 detected the drive failure and automatically deployed a
hot spare, providing continued data protection while rebuilding the RAID set. A drive failure with the NetApp Solution for Hadoop only affected the performance of the attached
DataNode. The DataNode was still able to participate in all Hadoop operations. The drive failure with the NetApp Solution for Hadoop resulted in 1% longer job completion time.
NetApp Dynamic Disk Pools
NetApp Dynamic Disk Pools aggregate all drives in the E-Series storage system into a single pool, increasing performance of healthy systems. When a drive fails, the E-Series rebuilds the DDP by treating spare capacity on every drive as a “hot spare.” Thus, the rebuild process also aggregates the bandwidth of all available drives. Simultaneously, the rebuild process only rebuilds actual allocated storage space rather than the entire pool.
ESG Lab tested the performance impact of a drive failure on a cluster using RAID and NetApp DDP. First, we used the TeraGen utility to generate a 1TB dataset on a four-node cluster where each node was connected to a separate RAID 5 volume. Next, we repeated this test, and introduced a drive failure when the test was 80% complete.
We used the TeraGen utility to generate a 1TB dataset on a four-node cluster where each node was connected to the same 60-drive NetApp DDP pool. Finally, we repeated this test, and introduced a drive failure when the test was 80% complete. The results are summarized in Figure 12 and Table 7.
Lab Validation: NetApp Solutions for Hadoop 17
© 2015 by The Enterprise Strategy Group, Inc. All Rights Reserved.
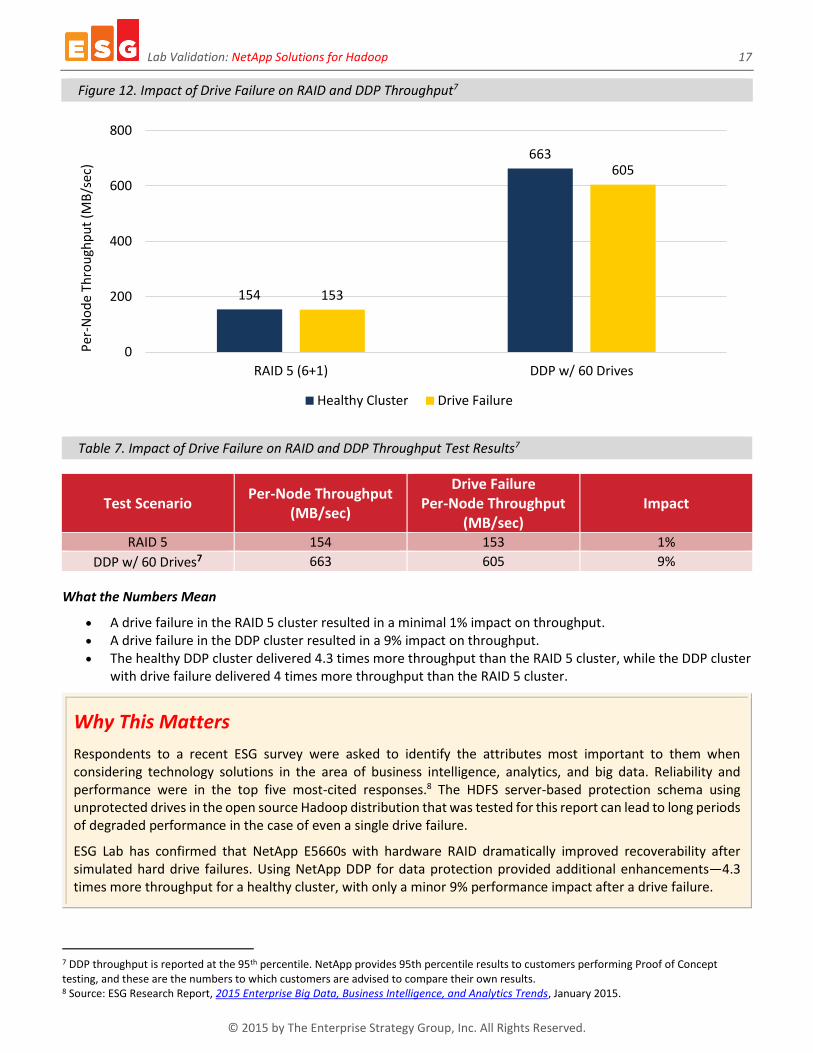
Figure 12. Impact of Drive Failure on RAID and DDP Throughput7
Table 7. Impact of Drive Failure on RAID and DDP Throughput Test Results7
Test Scenario Per-Node Throughput
(MB/sec)
Drive Failure Per-Node Throughput
(MB/sec) Impact
RAID 5 154 153 1%
DDP w/ 60 Drives7 663 605 9%
What the Numbers Mean
A drive failure in the RAID 5 cluster resulted in a minimal 1% impact on throughput. A drive failure in the DDP cluster resulted in a 9% impact on throughput. The healthy DDP cluster delivered 4.3 times more throughput than the RAID 5 cluster, while the DDP cluster
with drive failure delivered 4 times more throughput than the RAID 5 cluster.
Why This Matters
Respondents to a recent ESG survey were asked to identify the attributes most important to them when considering technology solutions in the area of business intelligence, analytics, and big data. Reliability and performance were in the top five most-cited responses.8 The HDFS server-based protection schema using unprotected drives in the open source Hadoop distribution that was tested for this report can lead to long periods of degraded performance in the case of even a single drive failure.
ESG Lab has confirmed that NetApp E5660s with hardware RAID dramatically improved recoverability after simulated hard drive failures. Using NetApp DDP for data protection provided additional enhancements—4.3 times more throughput for a healthy cluster, with only a minor 9% performance impact after a drive failure.
7 DDP throughput is reported at the 95th percentile. NetApp provides 95th percentile results to customers performing Proof of Concept testing, and these are the numbers to which customers are advised to compare their own results. 8 Source: ESG Research Report, 2015 Enterprise Big Data, Business Intelligence, and Analytics Trends, January 2015.
154
663
153
605
0
200
400
600
800
RAID 5 (6+1) DDP w/ 60 Drives
Per
-No
de
Thro
ugh
pu
t (M
B/s
ec)
Healthy Cluster Drive Failure
Lab Validation: NetApp Solutions for Hadoop 18
© 2015 by The Enterprise Strategy Group, Inc. All Rights Reserved.
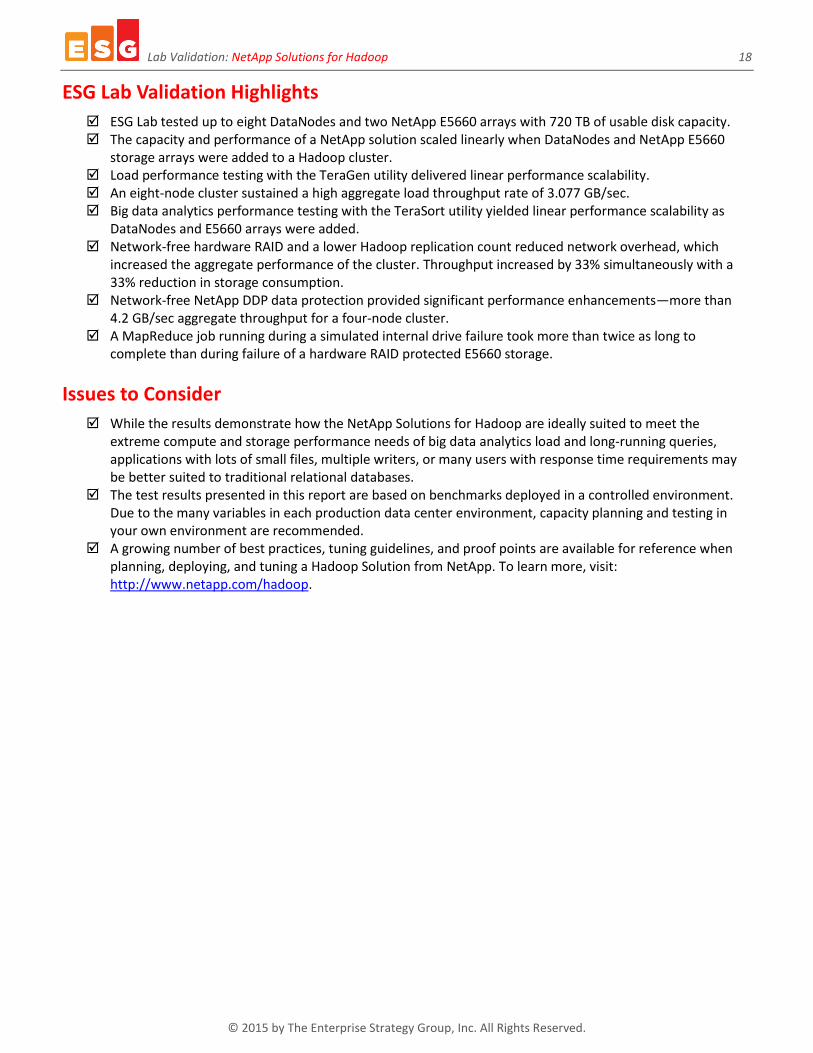
ESG Lab Validation Highlights
ESG Lab tested up to eight DataNodes and two NetApp E5660 arrays with 720 TB of usable disk capacity. The capacity and performance of a NetApp solution scaled linearly when DataNodes and NetApp E5660
storage arrays were added to a Hadoop cluster. Load performance testing with the TeraGen utility delivered linear performance scalability. An eight-node cluster sustained a high aggregate load throughput rate of 3.077 GB/sec. Big data analytics performance testing with the TeraSort utility yielded linear performance scalability as
DataNodes and E5660 arrays were added. Network-free hardware RAID and a lower Hadoop replication count reduced network overhead, which
increased the aggregate performance of the cluster. Throughput increased by 33% simultaneously with a 33% reduction in storage consumption.
Network-free NetApp DDP data protection provided significant performance enhancements—more than 4.2 GB/sec aggregate throughput for a four-node cluster.
A MapReduce job running during a simulated internal drive failure took more than twice as long to complete than during failure of a hardware RAID protected E5660 storage.
Issues to Consider
While the results demonstrate how the NetApp Solutions for Hadoop are ideally suited to meet the extreme compute and storage performance needs of big data analytics load and long-running queries, applications with lots of small files, multiple writers, or many users with response time requirements may be better suited to traditional relational databases.
The test results presented in this report are based on benchmarks deployed in a controlled environment. Due to the many variables in each production data center environment, capacity planning and testing in your own environment are recommended.
A growing number of best practices, tuning guidelines, and proof points are available for reference when planning, deploying, and tuning a Hadoop Solution from NetApp. To learn more, visit: http://www.netapp.com/hadoop.
Lab Validation: NetApp Solutions for Hadoop 19
© 2015 by The Enterprise Strategy Group, Inc. All Rights Reserved.
The Bigger Truth
For the innovators and early adopters, big data and the software-defined data center have transitioned from lab experiments to production environments. Awareness of the value that these organizations are achieving with these innovative technologies is driving rapid experimentation by the majority, with multiple proof of concept deployments. ESG research reveals that data analytics and data center modernization are just behind information security as the most important CIO whiteboard initiatives.9
Whether measured by increased revenues, market share gains, reduced costs, or scientific breakthroughs, data analytics have always played a key role in the ability to harness value from electronically stored information. What has changed recently is that as more business processes have become automated, information that was once stored in separate online and offline repositories and formats is now readily available for amalgamation and analysis to increase business insight and enhance decision support. Business executives are asking more of their data and are expecting faster and more impactful answers. The result is an ever-increasing priority on data analytics activities and more pressure on existing business analyst and IT teams to deliver.
NetApp has embraced the open source Hadoop model and is working with major distributors to support open source Hadoop software running on industry-standard servers. Instead of promoting the use of a proprietary clustered file system, NetApp has embraced the use of the open source Hadoop file system. Instead of promoting the use of SAN or NAS storage, NetApp has embraced the use of direct-attached storage. Using SAS direct-connected NetApp E5660 arrays with hardware protected RAID, the NetApp solution improves performance, scalability, and availability compared with typical internal hard drive Hadoop deployments.
With up to 3 GB/sec of aggregate TeraGen load performance on an eight-node cluster, ESG Lab has confirmed that the NetApp Solution for Hadoop provides excellent near-linear performance scalability that dwarfs the capabilities of commodity servers with internal disk arrays. NetApp E5660s using either RAID or DDP improved the efficiency and performance of the cluster by 33% compared with a traditional Hadoop deployment with triple mirroring. The value of transparent RAID recovery was obvious after drive failures were simulated: The performance impact on a long-running sort job was less than 1% compared with more than 100% for a simulated internal drive failure that blacklisted a Hadoop DataNode.
The ESG analysis and hands-on testing presented in this report quantify the tangible benefits that an organization can achieve with a distributed, open application framework (e.g., Hadoop, NoSQL, OpenStack, and Ceph) that leverages purpose-built, direct-attached NetApp E-Series storage as you move from proof of concept to production. For line of business managers looking to accelerate insights and profitability for the business, IT architects looking to reap the benefits of an open framework with better performance and less risk, or IT administrators looking to save time and money, ESG recommends that you consider NetApp E-Series storage for your next distributed open application project.
If you’re looking to accelerate the delivery of insights to your business with an enterprise-class big data analytics infrastructure, ESG Lab recommends a close look at the NetApp Solutions for Hadoop—it reduces risk with a storage solution that delivers reliability, fast deployment, and scalability for open source Hadoop in the enterprise.
9 Source: ESG Research Report, 2015 IT Spending Intentions Survey, February 2015.
Lab Validation: NetApp Solutions for Hadoop 20
© 2015 by The Enterprise Strategy Group, Inc. All Rights Reserved.
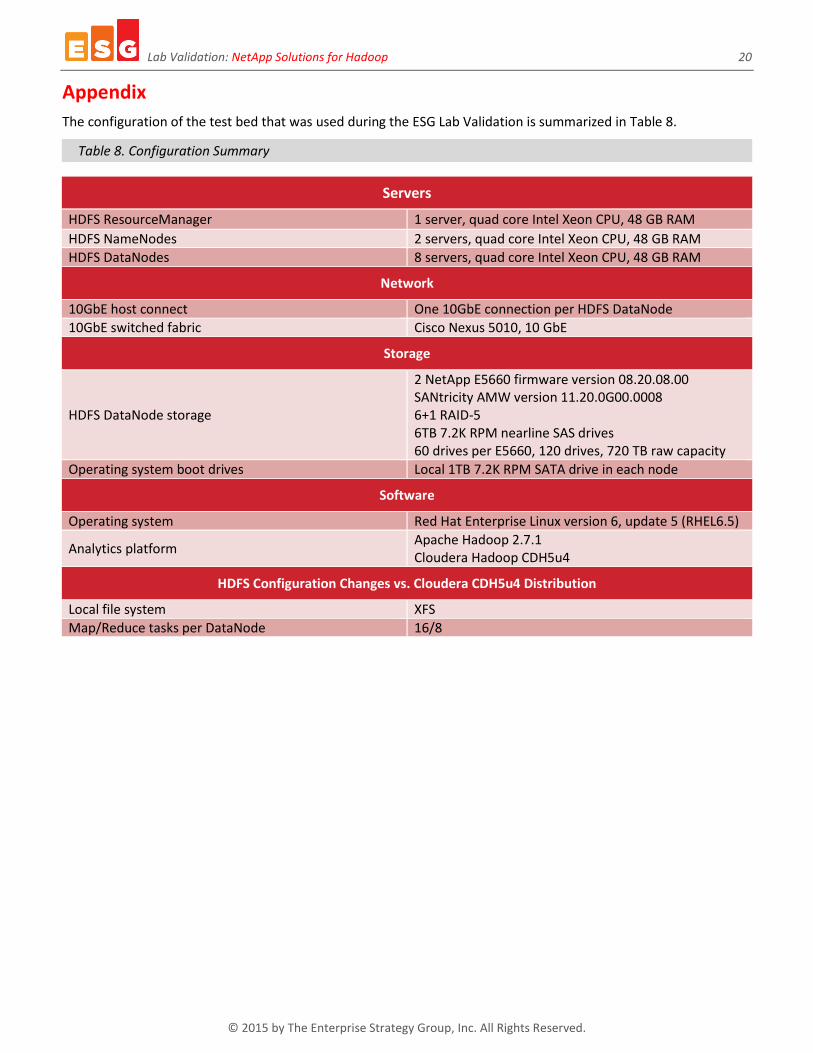
Appendix
The configuration of the test bed that was used during the ESG Lab Validation is summarized in Table 8.
Table 8. Configuration Summary
Servers
HDFS ResourceManager 1 server, quad core Intel Xeon CPU, 48 GB RAM
HDFS NameNodes 2 servers, quad core Intel Xeon CPU, 48 GB RAM
HDFS DataNodes 8 servers, quad core Intel Xeon CPU, 48 GB RAM
Network
10GbE host connect One 10GbE connection per HDFS DataNode
10GbE switched fabric Cisco Nexus 5010, 10 GbE
Storage
HDFS DataNode storage
2 NetApp E5660 firmware version 08.20.08.00 SANtricity AMW version 11.20.0G00.0008 6+1 RAID-5 6TB 7.2K RPM nearline SAS drives 60 drives per E5660, 120 drives, 720 TB raw capacity
Operating system boot drives Local 1TB 7.2K RPM SATA drive in each node
Software
Operating system Red Hat Enterprise Linux version 6, update 5 (RHEL6.5)
Analytics platform Apache Hadoop 2.7.1 Cloudera Hadoop CDH5u4
HDFS Configuration Changes vs. Cloudera CDH5u4 Distribution
Local file system XFS
Map/Reduce tasks per DataNode 16/8
Lab Validation: NetApp Solutions for Hadoop 21
© 2015 by The Enterprise Strategy Group, Inc. All Rights Reserved.
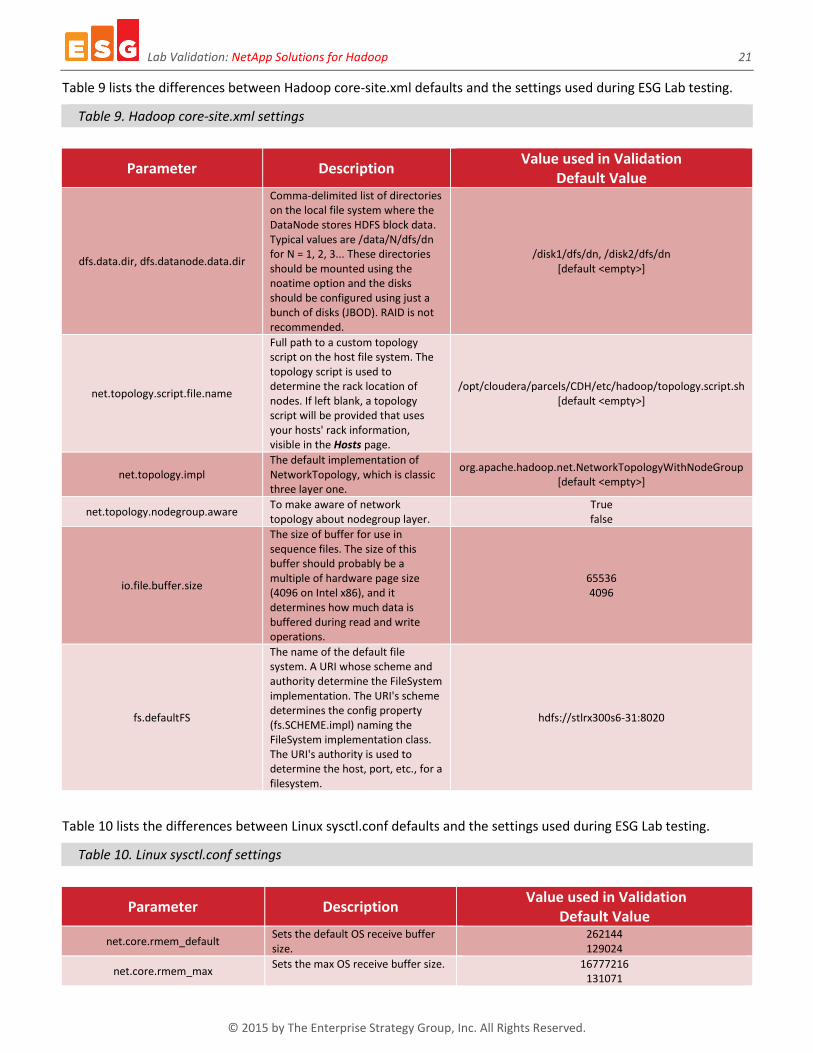
Table 9 lists the differences between Hadoop core-site.xml defaults and the settings used during ESG Lab testing.
Table 9. Hadoop core-site.xml settings
Parameter Description Value used in Validation
Default Value
dfs.data.dir, dfs.datanode.data.dir
Comma-delimited list of directories on the local file system where the DataNode stores HDFS block data. Typical values are /data/N/dfs/dn for N = 1, 2, 3... These directories should be mounted using the noatime option and the disks should be configured using just a bunch of disks (JBOD). RAID is not recommended.
/disk1/dfs/dn, /disk2/dfs/dn [default <empty>]
net.topology.script.file.name
Full path to a custom topology script on the host file system. The topology script is used to determine the rack location of nodes. If left blank, a topology script will be provided that uses your hosts' rack information, visible in the Hosts page.
/opt/cloudera/parcels/CDH/etc/hadoop/topology.script.sh [default <empty>]
net.topology.impl The default implementation of NetworkTopology, which is classic three layer one.
org.apache.hadoop.net.NetworkTopologyWithNodeGroup [default <empty>]
net.topology.nodegroup.aware To make aware of network topology about nodegroup layer.
True false
io.file.buffer.size
The size of buffer for use in sequence files. The size of this buffer should probably be a multiple of hardware page size (4096 on Intel x86), and it determines how much data is buffered during read and write operations.
65536 4096
fs.defaultFS
The name of the default file system. A URI whose scheme and authority determine the FileSystem implementation. The URI's scheme determines the config property (fs.SCHEME.impl) naming the FileSystem implementation class. The URI's authority is used to determine the host, port, etc., for a filesystem.
hdfs://stlrx300s6-31:8020
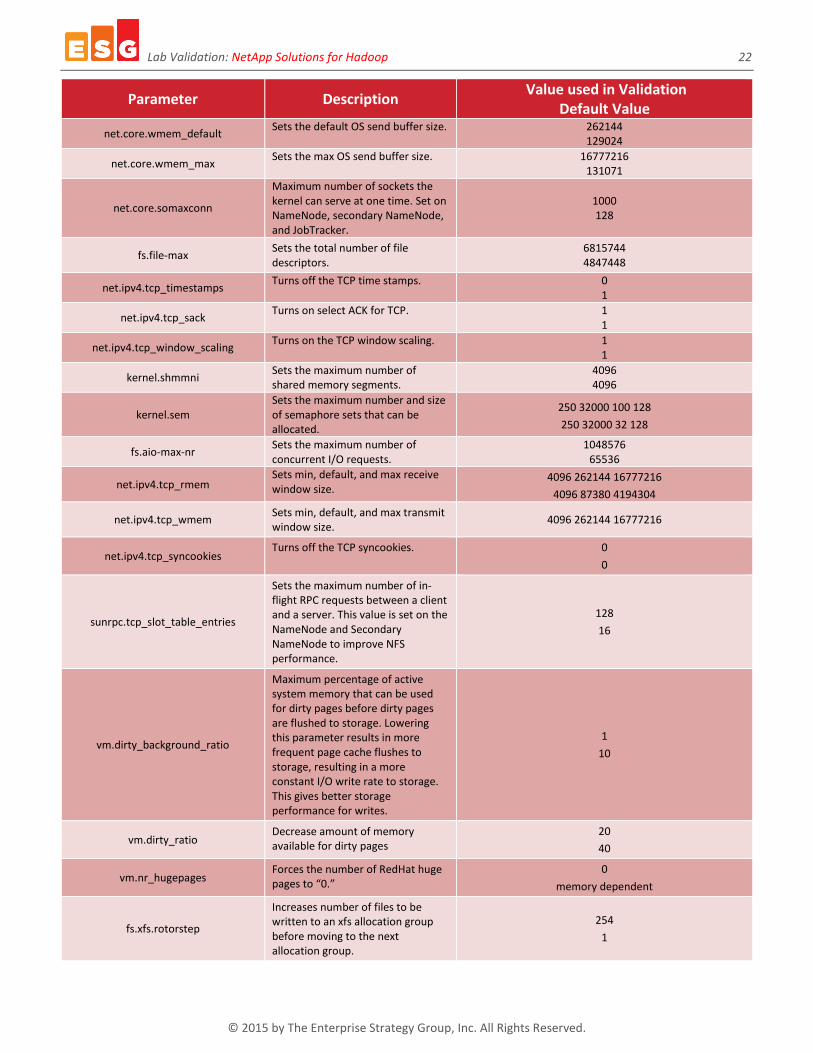
Table 10 lists the differences between Linux sysctl.conf defaults and the settings used during ESG Lab testing.
Table 10. Linux sysctl.conf settings
Parameter Description Value used in Validation
Default Value
net.core.rmem_default Sets the default OS receive buffer size.
262144 129024
net.core.rmem_max Sets the max OS receive buffer size. 16777216
131071
Lab Validation: NetApp Solutions for Hadoop 22
© 2015 by The Enterprise Strategy Group, Inc. All Rights Reserved.
Parameter Description Value used in Validation
Default Value
net.core.wmem_default Sets the default OS send buffer size. 262144
129024
net.core.wmem_max Sets the max OS send buffer size. 16777216
131071
net.core.somaxconn
Maximum number of sockets the kernel can serve at one time. Set on NameNode, secondary NameNode, and JobTracker.
1000 128
fs.file-max Sets the total number of file descriptors.
6815744 4847448
net.ipv4.tcp_timestamps Turns off the TCP time stamps. 0
1
net.ipv4.tcp_sack Turns on select ACK for TCP. 1
1
net.ipv4.tcp_window_scaling Turns on the TCP window scaling. 1
1
kernel.shmmni Sets the maximum number of shared memory segments.
4096 4096
kernel.sem Sets the maximum number and size of semaphore sets that can be allocated.
250 32000 100 128
250 32000 32 128
fs.aio-max-nr Sets the maximum number of concurrent I/O requests.
1048576 65536
net.ipv4.tcp_rmem Sets min, default, and max receive window size.
4096 262144 16777216
4096 87380 4194304
net.ipv4.tcp_wmem Sets min, default, and max transmit window size.
4096 262144 16777216
net.ipv4.tcp_syncookies Turns off the TCP syncookies. 0
0
sunrpc.tcp_slot_table_entries
Sets the maximum number of in-flight RPC requests between a client and a server. This value is set on the NameNode and Secondary NameNode to improve NFS performance.
128
16
vm.dirty_background_ratio
Maximum percentage of active system memory that can be used for dirty pages before dirty pages are flushed to storage. Lowering this parameter results in more frequent page cache flushes to storage, resulting in a more constant I/O write rate to storage. This gives better storage performance for writes.
1
10
vm.dirty_ratio Decrease amount of memory available for dirty pages
20
40
vm.nr_hugepages Forces the number of RedHat huge pages to “0.”
0
memory dependent
fs.xfs.rotorstep
Increases number of files to be written to an xfs allocation group before moving to the next allocation group.
254
1
Lab Validation: NetApp Solutions for Hadoop 23
© 2015 by The Enterprise Strategy Group, Inc. All Rights Reserved.
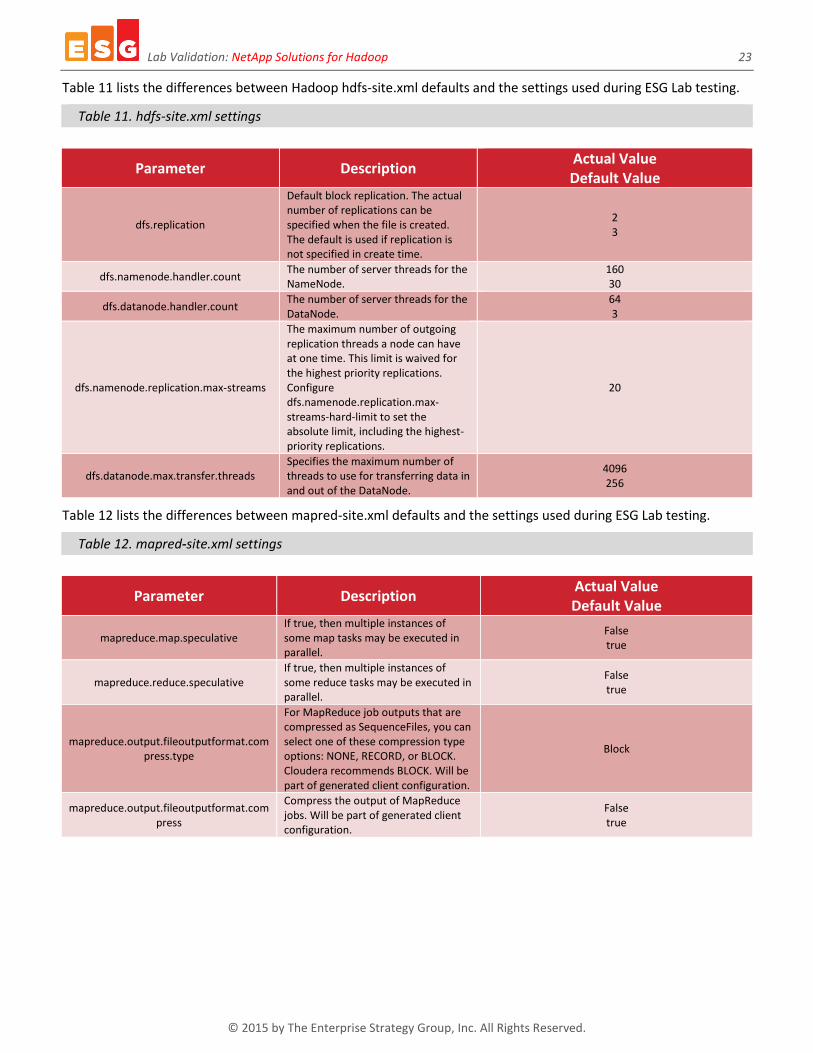
Table 11 lists the differences between Hadoop hdfs-site.xml defaults and the settings used during ESG Lab testing.
Table 11. hdfs-site.xml settings
Parameter Description Actual Value Default Value
dfs.replication
Default block replication. The actual number of replications can be specified when the file is created. The default is used if replication is not specified in create time.
2 3
dfs.namenode.handler.count The number of server threads for the NameNode.
160 30
dfs.datanode.handler.count The number of server threads for the DataNode.
64 3
dfs.namenode.replication.max-streams
The maximum number of outgoing replication threads a node can have at one time. This limit is waived for the highest priority replications. Configure dfs.namenode.replication.max-streams-hard-limit to set the absolute limit, including the highest-priority replications.
20
dfs.datanode.max.transfer.threads Specifies the maximum number of threads to use for transferring data in and out of the DataNode.
4096 256
Table 12 lists the differences between mapred-site.xml defaults and the settings used during ESG Lab testing.
Table 12. mapred-site.xml settings
Parameter Description Actual Value Default Value
mapreduce.map.speculative If true, then multiple instances of some map tasks may be executed in parallel.
False true
mapreduce.reduce.speculative If true, then multiple instances of some reduce tasks may be executed in parallel.
False true
mapreduce.output.fileoutputformat.compress.type
For MapReduce job outputs that are compressed as SequenceFiles, you can select one of these compression type options: NONE, RECORD, or BLOCK. Cloudera recommends BLOCK. Will be part of generated client configuration.
Block
mapreduce.output.fileoutputformat.compress
Compress the output of MapReduce jobs. Will be part of generated client configuration.
False true
Lab Validation: NetApp Solutions for Hadoop 24
© 2015 by The Enterprise Strategy Group, Inc. All Rights Reserved.
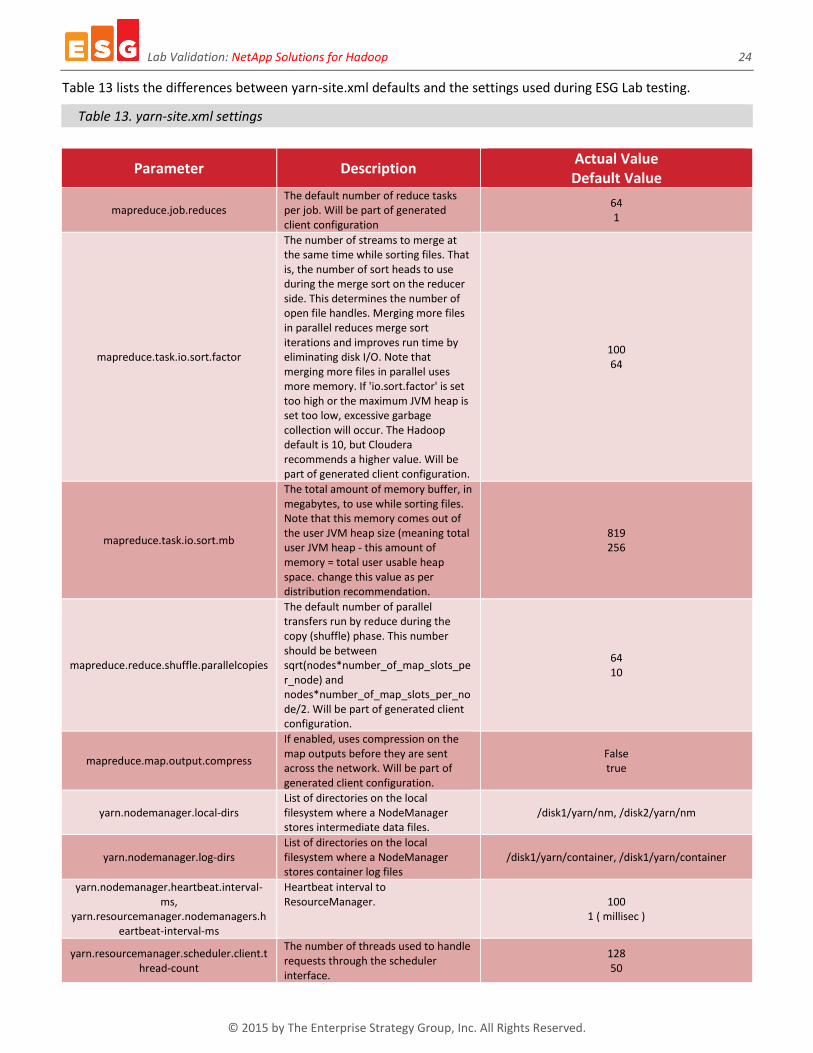
Table 13 lists the differences between yarn-site.xml defaults and the settings used during ESG Lab testing.
Table 13. yarn-site.xml settings
Parameter Description Actual Value Default Value
mapreduce.job.reduces The default number of reduce tasks per job. Will be part of generated client configuration
64 1
mapreduce.task.io.sort.factor
The number of streams to merge at the same time while sorting files. That is, the number of sort heads to use during the merge sort on the reducer side. This determines the number of open file handles. Merging more files in parallel reduces merge sort iterations and improves run time by eliminating disk I/O. Note that merging more files in parallel uses more memory. If 'io.sort.factor' is set too high or the maximum JVM heap is set too low, excessive garbage collection will occur. The Hadoop default is 10, but Cloudera recommends a higher value. Will be part of generated client configuration.
100 64
mapreduce.task.io.sort.mb
The total amount of memory buffer, in megabytes, to use while sorting files. Note that this memory comes out of the user JVM heap size (meaning total user JVM heap - this amount of memory = total user usable heap space. change this value as per distribution recommendation.
819 256
mapreduce.reduce.shuffle.parallelcopies
The default number of parallel transfers run by reduce during the copy (shuffle) phase. This number should be between sqrt(nodes*number_of_map_slots_per_node) and nodes*number_of_map_slots_per_node/2. Will be part of generated client configuration.
64 10
mapreduce.map.output.compress
If enabled, uses compression on the map outputs before they are sent across the network. Will be part of generated client configuration.
False true
yarn.nodemanager.local-dirs List of directories on the local filesystem where a NodeManager stores intermediate data files.
/disk1/yarn/nm, /disk2/yarn/nm
yarn.nodemanager.log-dirs List of directories on the local filesystem where a NodeManager stores container log files
/disk1/yarn/container, /disk1/yarn/container
yarn.nodemanager.heartbeat.interval-ms,
yarn.resourcemanager.nodemanagers.heartbeat-interval-ms
Heartbeat interval to ResourceManager. 100
1 ( millisec )
yarn.resourcemanager.scheduler.client.thread-count
The number of threads used to handle requests through the scheduler interface.
128 50

Lab Validation: NetApp Solutions for Hadoop 25
© 2015 by The Enterprise Strategy Group, Inc. All Rights Reserved.
Parameter Description Actual Value Default Value
mapred.jobtracker.nodegroup.aware True
mapred.task.cache.levels 3
yarn.app.mapreduce.am.resource.mb The physical memory requirement, in MiB, for the ApplicationMaster.
4 GB 1 GB
mapreduce.map.memory.mb The amount of physical memory, in MiB, allocated for each map task of a job.
2 GB 1 GB
mapreduce.reduce.memory.mb
The amount of physical memory, in MiB, allocated for each reduce task of a job. This parameter does not affect distributions based on Apache Hadoop 1.x or earlier.
4 GB 1 GB
mapreduce.map.java.opts.max.heap
The maximum Java heap size, in bytes, of the map processes. This number will be formatted and concatenated with 'Map Task Java Opts Base' to pass to Hadoop.
3435973837 825955249
mapreduce.reduce.java.opts.max.heap
The maximum Java heap size, in bytes, of the reduce processes. This number will be formatted and concatenated with 'Reduce Task Java Opts Base' to pass to Hadoop.
3435973837 825955249
yarn.nodemanager.resource.memory-mb
Amount of physical memory, in MiB, that can be allocated for containers.
42 GB 8 GB
yarn.nodemanager.resource.cpu-vcores Number of virtual CPU cores that can be allocated for containers.
16 8
yarn.scheduler.minimum-allocation-mb
The smallest amount of physical memory, in MiB, that can be requested for a container. If using the Capacity or FIFO scheduler, memory requests will be rounded up to the nearest multiple of this number. This parameter does not affect distributions based on Apache Hadoop 1.x or earlier.
2 GB 1 GB
yarn.scheduler.increment-allocation-mb
If using the Fair Scheduler, memory requests will be rounded up to the nearest multiple of this number. This parameter does not affect distributions based on Apache Hadoop 1.x or earlier.
1 MB 512 MB
yarn.scheduler.maximum-allocation-mb The largest amount of physical memory, in MiB, that can be requested for a container.
42 GB 64 GB
yarn.scheduler.minimum-allocation-vcores
The smallest number of virtual CPU cores that can be requested for a container. If using the Capacity or FIFO scheduler), virtual core requests will be rounded up to the nearest multiple of this number. This parameter does not affect distributions based on Apache Hadoop 1.x or earlier.
1
yarn.scheduler.maximum-allocation-vcores
The largest number of virtual CPU cores that can be requested for a container. This parameter does not affect distributions based on Apache Hadoop 1.x or earlier.
16

20 Asylum Street | Milford, MA 01757 | Tel: 508.482.0188 Fax: 508.482.0218 | www.esg-global.com