Embed Size (px)
Citation preview

__________________________________________________________________________________________________________________1
Lab 3: Calibration of a Melting Point Apparatus
Written by Danielle M. Solano & Jesse Bergkamp
Department of Chemistry & Biochemistry California State University, Bakersfield
Objectives By the end of this laboratory, you should have developed the skills to do the following:
• Accurately record the melting point of an organic solid.
• Develop and use a calibration curve.
• Understand how melting points will be affected by impurities.
Recommended Resources • Tutorial ~ Introduction to Melting Points
https://www.youtube.com/playlist?list=PLF809C05302C525C3
• Video ~ Melting Point DanceChemistry http://youtu.be/iZeQSg1fI4Y
Background The melting point of a solid is useful information in determining its identity and purity. In this lab, you will calibrate a melting point apparatus and learn to be proficient in taking a melting point. The calibration is necessary to ensure that the data obtained is as reliable as possible.
There are different types of melting point apparatuses that chemists may use. The traditional analog melting point apparatus uses an internal oil bath which stirs to heat the sample. The temperature in then read on a thermometer. A digital melting point apparatus uses a digital display to show the temperature.
The melting point apparatus that we will use is the Vernier Go Direct Melt Station. The apparatus will send temperature and time data to a computer, Chromebook, or mobile device (currently only iPhone…android will be coming soon!) so that it may be recorded and graphed. You may connect to any of these devices via Bluetooth or USB connection.
Lab 3: Calibration of a Melting Point Apparatus
__________________________________________________________________________________________________________________2
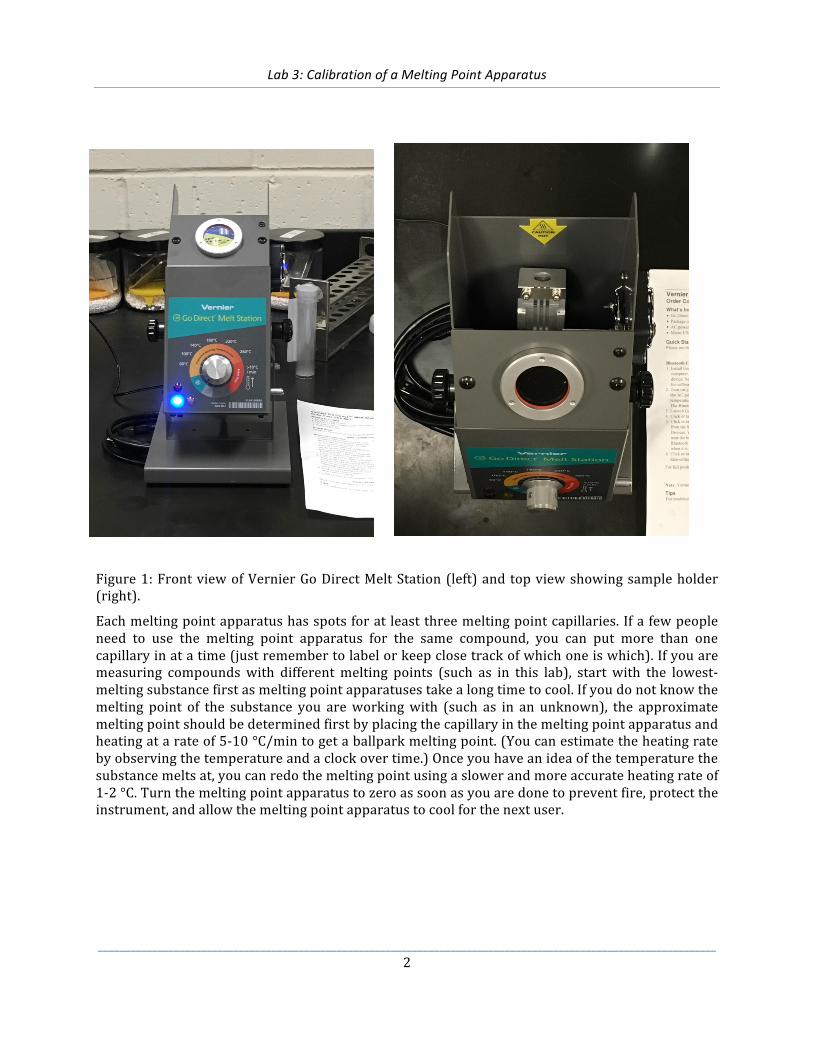
Figure 1: Front view of Vernier Go Direct Melt Station (left) and top view showing sample holder (right).
Each melting point apparatus has spots for at least three melting point capillaries. If a few people need to use the melting point apparatus for the same compound, you can put more than one capillary in at a time (just remember to label or keep close track of which one is which). If you are measuring compounds with different melting points (such as in this lab), start with the lowest-‐‑melting substance first as melting point apparatuses take a long time to cool. If you do not know the melting point of the substance you are working with (such as in an unknown), the approximate melting point should be determined first by placing the capillary in the melting point apparatus and heating at a rate of 5-‐‑10 °C/min to get a ballpark melting point. (You can estimate the heating rate by observing the temperature and a clock over time.) Once you have an idea of the temperature the substance melts at, you can redo the melting point using a slower and more accurate heating rate of 1-‐‑2 °C. Turn the melting point apparatus to zero as soon as you are done to prevent fire, protect the instrument, and allow the melting point apparatus to cool for the next user.

Lab 3: Calibration of a Melting Point Apparatus
__________________________________________________________________________________________________________________3
Calibration Standards m.p. (°C)
diphenylamine 54
m-dinitrobenzene 90
benzoic acid 122.5
salicylic acid 159
3,5-dinitrobenzoic acid 205
Your team will work together to acquire the data for calibration of your melting point apparatus. Each person will be responsible for accurately measuring the melting point of one calibration standard. You will need to repeat your measurements until you have at least two narrow and reproducible melting point measurements for your calibration standard. Narrow measurements are considered those whose range is less than 2.0 °C and reproducible measurements are considered those whose final melting values are within 1.0 °C. Slightly broader ranges are acceptable for high melting points if there are more than two reproducible measurements and these measurements were taken with a heating rate of 1 °C/min or slower.
Lab Notebook Preparation Before coming to lab, the following items must be in your lab notebook:
1. Title of the experiment & date the experiment is to be performed
2. Structures of diphenylamine, m-‐‑dinitrobenzene, benzoic acid, salicylic acid, and 3,5-‐‑dinitrobenzoic acid
3. Melting points of diphenylamine, m-‐‑dinitrobenzene, benzoic acid, salicylic acid, and 3,5-‐‑dinitrobenzoic acid
4. References
Lab Preparation Before coming to lab, download/install Graphical Analysis 4 on your computer, Chromebook, or mobile (iPhone) device.
1. Go to www.vernier.com/ga4 for software availability.
Directions 1. Decide which team member will measure which calibration standard and decide who will work
during which lab period. If you have a team of less than five, be sure that you will be measuring the lowest-‐‑melting standard (diphenylamine) and the highest-‐‑melting standard (3,5-‐‑dinitrobenzoic acid).
2. Prepare the calibration standard that you have been assigned for measurement using the following steps.

Lab 3: Calibration of a Melting Point Apparatus
__________________________________________________________________________________________________________________4
a. Transfer a small amount of the sample to a watch glass.
b. Grind the crystals to a powder using a glass rod.
c. Collect the crushed sample into a small pile.
d. Press open end of the melting point capillary into pile of sample.
e. Invert the tube and gently tap it to pack the crystals. (If this method does not work, the capillary tube can be dropped through a long tube.)
f. The sample in the tube should be about 2 mm high (less is okay as long as you can clearly see the sample in the tube). Repeat steps c-‐‑e if more sample needs to be added to the tube.
3. Record the serial number of your apparatus.
4. Connect to the Go Direct Melt Station that you are using by either USB or Bluetooth.
a. Open Graphical Analysis on your computer or mobile device
b. Follow the “Getting Started” section of the melt station manual.
5. Check the temperature of the melting point apparatus to ensure that it has cooled well below the melting point of your sample.
6. Wipe the outside surface of the capillary tube with a paper towel, and then insert the sample into the melting point apparatus. Make sure the SEALED END IS DOWN when inserting your sample.
7. Adjust the knob until your sample is being heated at a rate of 5-‐‑10 °C/min.
8. When you have reached 20 °C below your expected melting point, adjust the knob until your sample is being heated at a rate of 1-‐‑2°C/min.
9. Note the temperature at which melting starts (first drop of liquid appears) and note the temperature at which melting stops (when the last bit of solid is gone). This is your melting range.
10. Continue taking melting point measurements with fresh samples (do not use a sample that has already been melted) until you have at least two narrow and reproducible results.
11. Enter the data into Microsoft Excel or a similar program. Graph the data, and then calculate the line of best fit and the R2 value. You should graph the midpoint of each melting range (x-‐‑axis) against its literature value (y-‐‑axis).
a. Enter the midpoints of each melting range in a column. (Note: Use Excel to calculate your midpoints.)
b. Enter the corresponding literature value in the column just to the right of the column containing the midpoints.
c. Highlight both columns.
d. Go to "Insert" and select "Chart", then choose "X Y (Scatter)".
e. Pick "Marked Scatter".

Lab 3: Calibration of a Melting Point Apparatus
__________________________________________________________________________________________________________________5
f. After the graph has appeared, right-‐‑click on a data point and then select "Add Trendline".
g. Under options, check the boxes "Display equation on chart" and "Display R-‐‑squared value on chart" the hit "OK" to update your chart.
h. If you need to change the data associated with each axis or want to check which column is associated with each axis, right click on the graph and choose "Select data".
12. Further check the accuracy of your calibration curve by plugging your uncorrected melting point ranges into the equation of your calibration curve. If your calibration curve is good, they should be corrected to the literature values.
13. Predict what will happen when an unknown contains impurities. Test your hypothesis by mixing a small amount of a different standard with your standard and taking the melting point of the mixture. (Since you do not know the melting point of the mixture, first get a rough estimation of the melting point by heating your sample at a rate of 5-‐‑10 °C/min. Then proceed with a fresh sample at a slower rate.)
14. Dispose of used capillaries in designated receptacles.
Reporting your Results Please submit your lab report as an excel file. This is not a formal lab report.
For this lab report, you will have to graph your data as indicated in the prelab by entering the data into Microsoft Excel or a similar program. Graph the midpoint of each melting range (x-‐‑axis) against its literature value (y-‐‑axis), then calculate the line of best fit and the R2 value.
In your excel file, be sure to include:
1. All authors. Work with your team of 4-‐‑5 on this report. Please remember to list everybody’s names on the lab report. It is only necessary to turn in one copy.
2. Your melting point apparatus serial number.
3. Your group's melting point ranges (you should have 2 ranges for each standard).
4. The x values (midpoints) and y values (literature values) that you entered into Excel.
5. Your graph with the equation and R2 value on it.
6. The corrected melting point ranges that your equation gives for each standard (i.e., plug the uncorrected melting point ranges your group took back into the equation you generated for your calibration curve).
7. Melting point ranges for mixed sample(s).
8. Discussion of your results and your conclusions. Comment on the narrowness of the ranges that you recorded for each standard, the reproducibility of each standard, the R2 value, the corrected melting point ranges your curve gave for the standards, and the results for the mixed sample(s). What do you conclude about the accuracy of your calibration curve? Will your calibration curve be effective in determining the identity and purity of future samples?

Lab 3: Calibration of a Melting Point Apparatus
__________________________________________________________________________________________________________________6
Go Direct™ Melt Station (Order Code GDX-MLT)
The Go Direct Melt Station is a sensor used to measure the melting temperature of solid substances. Note: Vernier products are designed for educational use. Our products are not designed nor are they recommended for any industrial, medical, or commercial process such as life support, patient diagnosis, control of a manufacturing process, or industrial testing of any kind. What's Included • Go Direct Melt Station • Package of 100 capillary tubes, each with a closed end • AC power supply • Micro USB Cable
Compatible Software See www.vemier.com/manuals/gdx-‐‑mlt for a list of software compatible with the Go Direct Melt Station. Getting Started Please see the following link for platform-‐‑specific connection information: www.vemier.com/start/gdx-‐‑mlt Bluetooth Connection: 1. Install Graphical Analysis 4 on your computer, Chromebook™, or mobile device. See www.vemier.com/ga4
for software availability. 2. Tum on your sensor by plugging in the AC power and tum the temperature knob to the cooling fan. The Bluetooth® LED will blink red.
3. Launch Graphical Analysis 4. 4. Click or tap Sensor Data Collection.
5. Click or tap your Go Direct sensor from the list of Discovered Wireless Devices. Your sensor's ID is located near the barcode on the sensor. The Bluetooth LED will blink green when it is successfully connected.
6. Click or tap Done to enter data collection mode

Lab 3: Calibration of a Melting Point Apparatus
__________________________________________________________________________________________________________________7
USB Connection: 1. Install Graphical Analysis 4 on your computer or Chromebook. See www.vemier.com/ga4 for software availability.
2. Plug the sensor into AC power and turn the temperature knob to the cooling fan.
3. Connect the sensor to the USB port. 4. Start the Graphical Analysis 4 app. The app will identify the sensor.