Embed Size (px)
Citation preview

Maine State LibraryMaine State DocumentsCenter for Workforce Research and InformationDocuments Labor
1-1-2003
Labor Market Digest, January 2003Maine Department of Labor
Maine Center for Workforce Research and Information
Follow this and additional works at: http://digitalmaine.com/cwri_docs
This Text is brought to you for free and open access by the Labor at Maine State Documents. It has been accepted for inclusion in Center for WorkforceResearch and Information Documents by an authorized administrator of Maine State Documents. For more information, please [email protected].
Recommended CitationMaine Department of Labor and Maine Center for Workforce Research and Information, "Labor Market Digest, January 2003"(2003). Center for Workforce Research and Information Documents. Paper 906.http://digitalmaine.com/cwri_docs/906

~MAINE
•
DEPARTMENT OF
LABOR Labor Market Information
INSIDE . ..
Cumberland County records the lowest unemployment rate at 2.6 percent ... ... .... .. page 3
Adjusted statewide unem-1loyment rate rose from
4.1 in O ctober to 4.3 percent in November ........ page 4
Nonfarm employment increases by 1,900 over the year ........... ..... ............ page 6
A pub/ ication of the
MAINE DEPARTMENT OF LABOR
Labor Market Information Services
Raynold A. Fongemie Division Director
Dana A. Evans Editor
The Maine Department of Labor provides equal
opportunity in employment and programs. Auxiliary
aids and services provided upon request.
For more information,
Telephone (207) 287-2271 FAX (207) 287-2947 TTY 1-800-794-1110 E-Mail : [email protected]
Visit our Home Page at www.Maine.gov/labor/lmis
BRARYUSE O L
LJillOJR M AJRJKET DTIGJE§T November Data
Percent Change
~ in Population of the
New England States
July 2000 to July 2002
Vermont
New Hampshire
3.2%
Massachusetts 1.2%
Maine 1.5%
Connecticut 1.6% ~~
Rhode Island 2.0%
January 2003
Since 2000 the p o p u latio n of New Engl a nd h a s g rown m o re slowly than the national population, continuing the trend of the 1990s.
Between July 2000 and July 2002, the population of New England increased 1.6 percent compared to 2.2 percent nationally. Growth rates ranged from a low of 1.2 percent in Massachusetts to a high of 3.2 percent in New Hampshire, the only state in the region to grow faster than the national average.
See page 8 for population estimates and components of change.
FEB O o 2 03

2 Maine L\BoR 1\1.\RKET D1c;EsT
Civilian Labor Force, Employed, and Unemployed by Labor Market Area Not Seasonally Adjusted
' AREA
CIVILIAN LABOR FORCE1 EMPLOYED2 UNEMPLOYED3 UNEMPLOYMENT RATE4
Nov 02 Oct 02 Nov 01 Nov 02 Oct 02 Nov 01 Nov 02 Oct 02 Nov 01 Nov 02 Oct 02 Nov 01
LABOR MARKET AREAS
Augusta 47,240 47,810 46,580 45,350 46, 150 44,710 1,890 1,660 1,870 4.0% 3.5%
Bangor MSA 53,800 53,600 53,200 52,200 52,300 51,700 1,600 1,300 1,500 3.0 2.4
Bath-Brunswick 34,090 34,640 34,320 32,950 33,610 33, 160 1,140 1,020 1,160 3.3 3.0
Belfast 18, 120 18,480 18,860 17,450 17,940 18, 130 670 530 730 3.7 2.9
Biddeford 41,070 43,290 40,620 39,700 42, 140 39,330 1,370 1,150 1,300 3.3 2.6
Boothbay Harbor 9,020 9,950 8,780 8,760 9,810 8,520 260 140 250 2.9 1.4
Bucksport 5,060 5,150 4,950 4,830 4,970 4,760 230 190 190 4.5 3.6
Calais 5, 110 4,920 5,230 4,580 4,500 4,860 530 420 370 10.4 8.5
Dexter-Pittsfield 12,280 12,410 12, 180 11,080 11,350 11,200 1,200 1,060 980 9.8 8.6
Dover-Foxcroft 6,970 7,100 7,130 6,470 6,700 6,720 500 400 410 7.2 5.6
Ellsworth-Bar Harbor 21, 190 22,570 20,960 20,020 22,010 19,850 1,170 570 1,120 5.5 2.5
Farmington 17,150 17, 170 17,000 16, 120 16,270 15,900 1,020 900 1,100 6.0 5.2
Fort Kent 3,990 4,010 4,240 3,820 3,830 4,090 170 180 150 4.4 4.5
Greenville 1,010 1,030 980 930 980 920 80 50 60 7.6 4.5
Houlton 6,150 6,240 6,130 5,910 6,030 5,890 240 210 240 3.9 3.4 Jonesport-Milbridge 4,560 4,300 4,650 4,300 4,080 4,410 260 220 250 5.7 5.1 Kittery-York5 21,000 21,430 21,070 20,410 20,290 20,390 600 1, 140 680 2.8 5.3 Lewiston-Auburn MSA 53,800 53,500 54,200 51,700 51,500 51,900 2,100 2,100 2,300 4.0 3.8 Lincoln-Howland 5,720 5,830 5,800 5,330 5,520 5,500 390 310 290 6.8 5.2 Machias-Eastport 7,060 6,830 7,000 6,450 6,270 6,480 610 560 520 8.7 8.2 Madawaska 3,600 3,630 3,680 3,470 3,520 3,570 140 11 0 11 0 3.8 2.9 Millinocket-East Millinocket 5,160 4,990 4,980 4,590 4,640 4,680 570 350 300 11 .1 7.0 Norway-Paris 11,680 11,780 11,940 10,880 11,090 11 , 1 90 800 690 750 6.9 5.9 Outer Bangor 9,690 10,040 9,350 9,240 9,590 8,890 460 450 460 4.7 4.4 Patten-Island Falls 1,850 1,830 1,980 1,690 1,720 1,810 150 11 0 170 8.3 5.9 Portland MSA 140,300 140,100 138,800 136,700 136,500 134,900 3,600 3,600 3,900 2.6 2.6 Presque Isle-Caribou 20,790 20,910 20,940 19,820 20,260 20,050 970 650 890 4.7 3.1
Rockland 24,330 25, 100 23,250 23,600 24,530 22,590 720 570 660 3.0 2.3 Rumford 9,590 9,420 9,650 8,840 8,780 8,840 760 640 810 7.9 6.7 Sanford 22,840 23,220 21,820 21, 120 21,500 19,960 1,710 1,710 1,860 7.5 7.4 Sebago Lakes Region 13,290 14,790 13,010 12,770 14,240 12,420 510 550 580 3.9 3.7 Skowhegan 15,740 16,090 16,060 14,450 14,970 14,800 1,300 1, 120 1,260 8.2 7.0 Stonington 6,050 6,250 6,020 5,870 6,130 5,830 180 130 200 3.0 2.0 Van Buren 1,270 1,340 1,310 1,210 1,270 1,250 70 80 60 5.2 5.6 Waterville 25,360 25, 110 25,350 23,860 23,930 24,220 1,500 1, 180 1,130 5.9 4.7
MAINE 685,900 694,900 682,000 656,400 668,900 653,400 29,500 26,000 28,500 4.3 3.7
UNITED STATES (000) 142,405 142,878 141,911 134,358 135,237 134,359 8,047 7,640 7,551 5.7 5.3
1 Civilian labor force, employed, and unemployed estimates are by place of residence. Current month estimates are preliminary; prior month and year-ago estimates are revised. Items may not add due to rounding. All data exclude members of the Armed Forces. MSA stands for Metropolitan Statistical Area.
4.0% 2.8 3.4 3.9 3.2 2.9 3.8 7.1 8.0 5.7 5.3 6.5 3.4 6.2 3.9 5.3 3.2 4.3 5.0 7.5 3.0 6.0
6.3 . 4.9 8.6 2.8 4.3 2.8 8.4 8.5 4.5 7.8 3.3 4.6 4.5
4.2
5.3
2 Total employment includes nonfarm wage and salary workers, agricultural workers, unpaid family workers, domestics, the self employed, and workers involved in labor disputes.
3 People are classified as unemployed, regardless of their eligibility for unemployment benefits or public assistance, if they meet all of the following criteria: 1) they were not employed during the survey week; 2) they were available for work at that time; and 3) they made specific efforts to find employment some time during the prior four weeks. Persons laid off from their former jobs and awaiting recall and those expecting to report to a job within 30 days need not be looking for work to be counted as unemployed.
4 The unemployment rate is calculated by dividing the total number of unemployed by the total civilian labor force, and is expressed as a percent.
5 Kittery-York is the five -town Maine portion of the Portsmouth-Rochester PMSA which includes towns in both Maine and New Hampshire.
Source: Maine Department of Labor, Labor Market Information Services, in cooperation with the U.S. Department of Labor, Bureau of Labor Statistics .
Labor Market Inforrnation Services
•

- - ----------- Maine L\BoR I\L\RKET D1cEsT 3
Civilian Labor Force, Employed, and Unemployed by County, Not Seasonally Adjusted1
AREA CIVILIAN LABOR FORCE EMPLOYED UNEMPLOYED UNEMPLOYMENT RATE Nov 02 Oct 02 Nov 01 Nov 02 Oct 02 Nov 01 Nov 02 Oct 02 Nov 01 Nov 02 Oct 02 Nov 01
'JNTY
~ ndroscoggin 60,180 59,970 60,540 57,680 57,580 57,900 2,510 2,390 2,640 4.2% 4.0% 4.4% iOOStook 37,230 37,560 37,780 35,520 36,230 36,230 1,710 1,330 1,560 4.6 3.6 4.1 1mberland 146,600 147,380 145,130 142,770 143,540 141 ,060 3,830 3,840 4,070 2.6 2.6 2.8 anklin 14,390 14,400 14,310 13,610 13,730 13,420 790 680 890 5.5 4.7 6.2 ncock 29,640 31,110 29,290 28, 150 30,330 27,880 1,490 780 1,400 5.0 2.5 4.8 rinebec 61,990 62,350 61,340 59,200 59,990 58,880 2,790 2,370 2,460 4.5 3.8 4.0 ox 21,300 21,960 20,350 20,640 21,460 19,760 660 500 590 3.1 2.3 2.9
rcoln 17,810 18,870 17,380 17,220 18,490 16,840 590 380 540 3.3 2.0 3.1 ford 25,730 26,280 25,920 24,000 24,730 24, 130 1,730 1,540 1,790 6.7 5.9 6.9 nobscot 81,120 81,460 80, 170 77,480 78,490 77,050 3,640 2,970 3, 110 4.5 3.6 3.9
1scataquis 8,100 8,240 8,230 7,510 7,790 7,750 590 450 480 7.3 5.5 5.8 . ..iagadahoc 15,930 16,200 16,050 15,410 15,720 15,510 510 480 540 3.2 2.9 3.4 (' .JOmerset 25,080 25,450 25,350 22,950 23,600 23,410 2,140 1,850 1,940 8.5 7.3 7.6 Waldo 23,830 24, 160 24,520 22,900 23,420 23,550 930 740 980 3.9 3.0 4.0 Nashington 17,180 16,540 17,330 15,760 15,340 16, 160 1,420 1,210 1, 160 8.3 7.3 6.7 ork 99,840 102,960 98,280 95,650 98,510 93,880 4,190 4,450 4,400 4.2 4.3 4.5
AINE 685,900 694,900 682,000 656,400 668,900 653,400 29,500 26,000 28,500 4.3 3.7 4.2 NITED STATES (000) 142,405 142,878 141,911 134,358 135,237 134,359 8,047 7,640 7,551 5.7 5.3 5.3
See page 2 for footnotes 1 through 4 and source.
Area Analyst's Corner
Central Maine Ken Bridges (207) 624-5199
V\icrodyne is closing the Augusta facility and transferring
perations to its Orono facility. The closing affects 275
10rkers , some of which will transfer to Orono. +Solon anufacturing is laying off 30 workers at its Solon
nd Skowhegan plants. +Verizon Communications laying off approximately 100 workers statewide,
he majority of which will occur in the Augusta
ea.+Ken's Restaurant in Winslow closed New
ear' s Day, idling 46 workers.+A developer is
urchasing properties near the Senator
·. n in Augusta for a mall anchored by a
Target Department Store.
Western Maine Gerard Dennison (207) 753-9045
Unemployment rates went up in all five of
the Western Maine LMAs in November.
From a historical perspective unemploy
ment is low, but the economy is not
expanding. +Dyeables Inc. in Auburn
closed on December 27. The footwear
m anufacturing plant will reopen in the old
Franklin Shoe building in Farmington in
J anuary with about 40 employees.+Inter-
ational Paper in Jay announced in early November
at about 100 hourly employees will be laid off over the next
few months. +University College Bath-Brunswick will be
moving from Brunswick to the Mid Coast Center for Higher Education in Bath in January.
North/East Maine Craig Holland (207) 941-3076
Two major manufacturing firms in northern
Maine have sought to reorganize under the
protection of the Federal Bankruptcy Court
under a Chapter 11 filing. Kent Inc. , the
largest employer in Fort Kent, and Great Northern Paper, the preeminent firm in the
Millinocket-East Millinocket labor market
area , both have sought protection from the courts. These firms, with approximately
150 employees and 1, 100 employees respectively, are major economic
forces in their communities. Their failure to successfully emerge from bankruptcy would be a major
economic blow to both the St. John Valley and the Katahdin area.
Southern Maine Merrill Huhtala (207) 822-0216
Howell Laboratories of Bridgton won a $5.98 million U.S.
Navy contract to provide dehydrators for electronic equipment.
+Biddeford Blankets temporarily laid off 90 workers in mid
December.+Aetna, Inc. now has over 200 employees in
Portland. The decision to consolidate service center operations
there was influenced by the "Maine work ethic " and "insurance
knowledge" of local workers. +Disability Reinsurance Management announced consolidation of its three Portland locations to a
new office building in Westbrook. The site will include a 500-car
garage and room for expansion.
Labor Market Information Services
4 Maine LAsoR MARKET D1cEsT
Civilian Labor Force, Employed, and Unemployed in Maine, Seasonally Adjusted (in thousands)
ITEM 2002 2001 • Nov Oct Sep Aug Jul Jun May Apr Mar Feb Jan Dec Nov
Civilian Labor Force 689.7 692.6 684.1 686.5 687.3 684.0 681.6 685.0 684.9 683.3 682.8 689.1 686.0 Employed 659.7 664.3 656.2 659.2 658.3 656.8 656.4 657.5 657.0 656.6 656.8 654.9 656.6 Unemployed 29.9 28.3 27.8 27.3 29.0 27.2 25.2 27.4 27.9 26.7 26.0 29.2 29.4 Unem~loyment Rate (%) 4.3 4.1 4.1 4.0 4.2 4.0 3.7 4.0 4.1 3.9 3.8 4.3 4.3 1 See page 2 for footnotes 1 through 4 and source.
Noni arm Wage and Salary Employment in Maine, Seasonally Adjusted1 (in thousands>
INDUSTRY 2002 2001
Nov Oct Sep Aug Jul Jun May Apr Mar Feb Jan Dec Nov
Nonfarm Wage and Salary Employment2 610.4 610.4 610.8 610.8 611.9 610.6 611.6 609.9 609.0 609.0 609.4 608.1 608.3 Construction 30.2 30.0 30.3 30.3 30.2 29.9 29.5 29.5 29.8 30.1 29.9 29.7 29.6 Manufacturing 73.8 74.6 74.8 75.2 76.1 76.1 75.7 76.4 76.4 77.0 77.3 78.0 78.3
Durable Goods 38.1 38.4 38.8 39.0 39.4 39.1 38.7 39.0 39.0 39.4 39.7 39.8 40.2 Nondurable Goods 35.7 36.2 36.0 36.2 36.7 37.0 37.0 37.4 37.4 37.6 37.6 38.2 38.1
Transportation and Public Utilities 24.1 24.2 24.4 24.7 24.7 24.7 24.7 24.5 24.4 24.5 24.7 24.4 24.5 Wholesale Trade 27.0 26.7 26.6 26.7 26.7 26.6 26.7 26.6 26.9 26.9 27.0 26.6 26.7 Retail Trade 125.8 126.3 126.3 126.3 126.6 126.8 126.1 125.7 125.0 124.4 124.3 124.1 124.3 Finance, Insurance, and Real Estate 34.0 33.9 33.9 34.0 33.9 33.9 34.1 34.0 33.9 33.8 33.8 33.9 33.9 Services 189.8 189.6 189.7 189.5 189.1 189.0 189.3 188.7 188.2 187.9 188.0 187.3 187.3 Government 105.6 105.0 104.9 104.0 104.5 103.5 105.4 104.4 104.3 104.3 104.3 104.0 103.6
1 See footnotes 1 and 2 on page 6. 2 Mining employment is not suitable for seasonal adjustment because it has very little seasonal and irregular movement. Thus, the not-seasonally-adjusted series is used as a component of the seasonally adjusted total nonfarm wage and salary employment estimate. Source: See page 2.
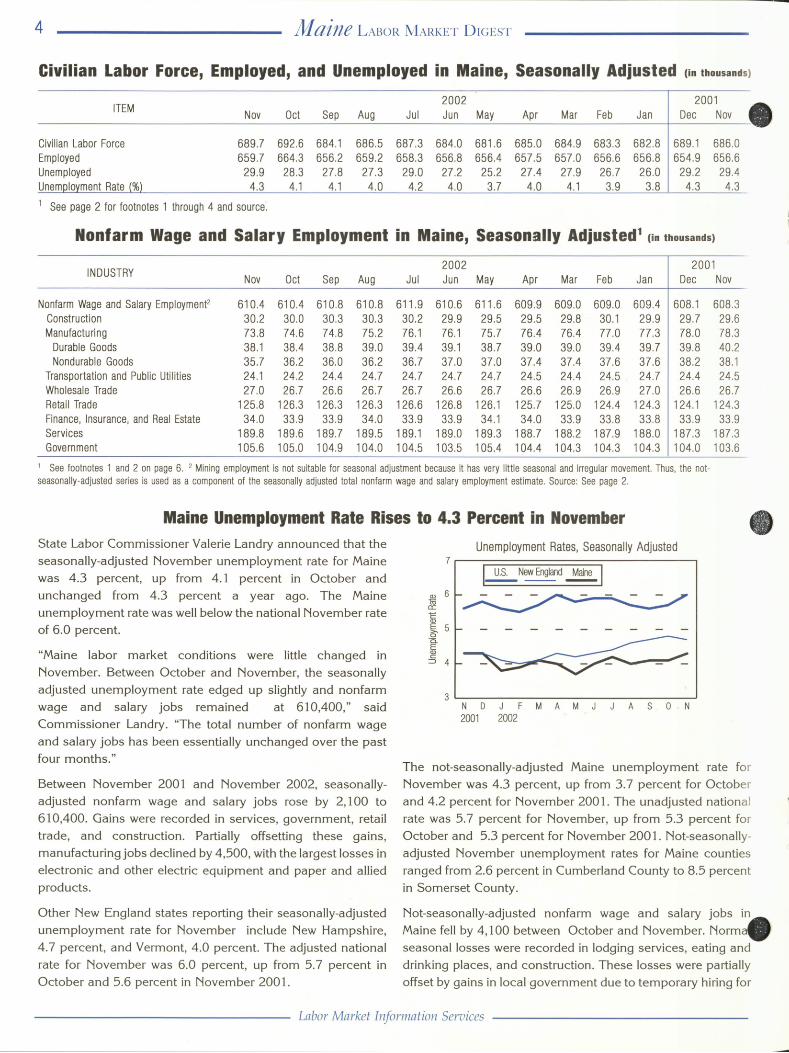
Maine Unemployment Rate Rises to 4.3 Percent in November • State Labor Commissioner Valerie Landry announced that the seasonally-adjusted November unemployment rate for Maine was 4.3 percent, up from 4.1 percent in October and unchanged from 4.3 percent a year ago. The Maine unemployment rate was well below the national November rate of 6.0 percent.
"Maine labor market conditions were little changed in November. Between October and November, the seasonally adjusted unemployment rate edged up slightly and nonfarm wage and salary jobs remained at 610,400," said Commissioner Landry. "The total number of nonfarm wage and salary jobs has been essentially unchanged over the past four months."
Between November 2001 and November 2002, seasonallyadjusted nonfarm wage and salary jobs rose by 2, 100 to 610,400. Gains were recorded in services, government, retail trade, and construction. Partially offsetting these gains, manufacturing jobs declined by 4,500, with the largest losses in electronic and other electric equipment and paper and allied products.
Other New England states reporting their seasonally-adjusted unemployment rate for November include New Hampshire, 4.7 percent, and Vermont, 4.0 percent. The adjusted national rate for November was 6.0 percent, up from 5. 7 percent in October and 5.6 percent in November 2001.
Unemployment Rates, Seasonally Adjusted 7~~~~~~~~~~~~~~~--
a:, 6 ta a: 1= ~ 5 ~ a. E a:, c: :::, 4
,~N~d~,
ND J FMAMJ A S O N 2001 2002
The not-seasonally-adjusted Maine unemployment rate for November was 4.3 percent, up from 3. 7 percent for October and 4.2 percent for November 2001. The unadjusted national rate was 5.7 percent for November, up from 5.3 percent fo r October and 5.3 percent for November 2001. Not-seasonallyadjusted November unemployment rates for Maine counties ranged from 2.6 percent in Cumberland County to 8.5 percent in Somerset County.
Not-seasonally-adjusted nonfarm wage and salary jobs in. Maine fell by 4, 100 between October and November. Norma seasonal losses were recorded in lodging services, eating and drinking places, and construction. These losses were partially offset by gains in local government due to temporary hiring for
Labor Market Information Services

•
•
- ----------- Maine L Aso R M ARKET DicEsT
Week
2002
Week
Selected Regular Unemployment Compensation Program Indicators
Key Data
Average Duration Average Weekly Benefit Amount* Exhaustees
Nov 2002
17.1 $220.53
799
• For totally unemployed claimants, excluding dependency allowances.
Weekly Initial Claims
12/7 11 /30 11 /23 11 /16 11 /9 11 /2 10/26
2,104 1,664 1,870 1,673 1,910 1,689 1,801
12/8 12/1 11 /24 11 /17 11/10 11 /3 10/27
Oct 2002
17.0 $225.29
855
Nov 2001
14.3 $217.51
652
Continued Claims Less Partials*
Nov 2002 Oct 2002 Nov 2001
7,672 5,861 7,801
• For the week including the 121h of the month.
2001 2, 192 2,777 1,744 1,625 1,651 1,762 1,681
$475 Monthly Unemployment Insurance Trust Fund Balance
$410
en c $345 ~ ~ E $280
$215
$150 J F M A M J J A S O N D J F M A M J J A S O N D J F M A M J J A S O N D J F M A M J J A S O N 1999 2000 2001 2002
elections and miscellaneous retail trade establishments gearing up for the holidays. U.S. Consumer Price Index
for all urban consumers (CPI-U)
5
Between November 2001 and November 2002, not-seasonallyadjusted nonfarm wage and salary jobs increased by 1,900. The services industry division led job growth, with the largest gains in social services and health services. Local government, retail trade, and construction also registered job gains. The manufacturing division lost 4,500 jobs, with the largest declines in electronic and other electrical equipment and paper and allied products.
Item Nov 02 Oct 02 Nov 01 Dec 01
Unemployment Rates for Maine
5.5 r---;:::::====================::::::--. .$ 5.0 ttl a: t 4.5 E ~ f4.0 Q.)
5 3.5
Seasonal~ Adjusted Not Seasonal~ Adjusted
/ 7
3.o N D J F M A M J J A S O N 2001 2002
(1982-1984 = 100) All Items 181.3 181.3 177.4 176.7
Percent Change from Prior Month +0.0% Percent Change from 12 Months Ago +2.2% Percent change from Last December +2.6%
Q.) en
4.0
3.5 -
§ 3.0 -.c (.)
~ 25 -~ Q.)
o... 20 -
1.5
Over-the-Year Change in CPI-U
1.0 IUJ.&"-L.U.1.L'-'.LU.L.IL.&.LLL"-L.U.1..1.'-'.LU.L.IL.&.LLL.LLLLLU.L.IL.&.LLL"-L.U.LLI.U
1!J<J8 1999 2001 2002
---------------- Labor Market Information Services
6 Maine LABOR MARKET D1c;EsT
Noni arm Wage and Salary Employment, Not Seasonally Adjusted (in thousands)
INDUSTRY MAINE PORTLAND MSA LEWISTON-AUBURN MSA
Nov 02 Oct 02 Nov 01 Nov 02 Oct 02 Nov 01 Nov 02 Oct 02 Nov 01
Nonfarm Wage and Salary Employment1 615.4 619.5 613.5 158.3 157.9 157.9 46.3 46.1 47.0
Goods Producing 105.5 106.3 109.4 21.5 21.3 21.3 8.8 8.9 9.1
Mining 0.1 0.1 0.1 * * * * * * Construction 30.7 31.5 30.1 8.6 8.5 7.7 2.2 2.4 2.3
Building Construction 7.0 7.1 6.9 * * * * * *
Heavy Construction 4.2 4.3 4.1 * * * * * *
Special Trade Contractors 19.5 20.1 19.1 5.8 5.8 5.7 * * *
Manufacturing 74.7 74.7 79.2 12.9 12.8 13.6 6.6 6.5 6.8
Durable Goods 39.0 38.6 41.1 6.9 6.9 7.4 2.2 2.2 2.3
Lumber and Wood Products 9.5 9.6 9.9 * * * * * *
Primary and Fabricated Metals 3.9 3.9 3.9 * * * * * *
Industrial Machinery and Equipment 4.4 4.5 4.8 1.4 1.4 1.5 * * *
Electronic and Other Electrical Equipment 4.9 5.1 5.7 2.7 2.8 3.0 * * *
Transportation Equipment 10.4 10.4 10.7 * * * * * *
Other Durable Goods 5.9 5.1 6.1 2.8 2.7 2.9 * * *
Nondurable Goods 35.7 36.1 38.1 6.0 5.9 6.2 4.4 4.3 4.5
Food and Kindred Products 6.0 5.9 6.5 1.9 1.9 1.9 * * *
Textile Mill Products 2.7 2.8 3.0 * * * * * *
Apparel and Other Textile Products 1.7 1.8 2.2 * * * * * *
Paper and Allied Products 11.8 12.0 12.5 * * * * * *
Printing and Publishing 5.8 5.7 5.9 1.8 1.7 1.8 * * *
Rubber and Misc. Plastic Products 2.4 2.4 2.4 * * * * * *
Leather and Leather Products 3.3 3.3 3.7 * * * 0.5 0.5 0.6
Other Nondurable Goods 2.0 2.2 1.9 2.3 2.3 2.5 3.9 3.8 3.9
Service Producing 509.9 513.2 504.1 136.8 136.6 136.6 37.5 37.2 37.9
Transportation and Public Utilities 24.2 24.6 24.6 7.3 7.4 7.3 1.8 1.8 1.9
Wholesale Trade 26.8 27.0 26.5 9.7 9.9 9.6 2.5 2.5 2.7
Retail Trade 128.2 128.3 126.8 35.6 34.6 36.8 9.4 9.1 9.7
General Merchandise Stores 12.3 11.6 12.4 * * * * * *
Food Stores 24.3 24.5 24.0 * * * * * *
Automotive Sales and Services 14.3 14.1 13.7 * * * * * *
Eating and Drinking Places 35.8 38.1 35.4 9.4 9.6 9.4 * * *
Other Retail Trade 41.5 40.0 41.3 * * * * * *
Finance, Insurance, and Real Estate 33.8 33.8 33.7 14.5 14.5 14.0 2.8 2.9 2.7
Banking 10.0 10.0 9.7 * * * * * *
Insurance Carriers, Brokers and Agents 12.7 12.7 12.9 * * * * * *
Other Finance, Insurance, and Real Estate 11 .1 11 .1 11.1 * * * * * *
Services 186.6 191.1 184.2 49.8 50.5 49.4 15.5 15.4 15.3
Hotels and Other Lodging Places 9.1 12.2 8.9 * * * * * *
Business Services 22.2 22.5 23.9 * * * * * *
Health Services 61.0 61 .0 59.8 * * * * * *
Educational Services 18.4 18.5 17.8 * * * * * *
Social Services 27.9 27.9 26.5 * * * * * *
Other Services 48.0 49.0 47.3 * * * * * *
Government 110.3 108.4 108.3 18.7 17.7 19.5 5.5 5.5 5.6
Federal 13.9 13.7 13.9 2.3 2.3 2.4 0.3 0.3 0.3
State 29.5 29.3 29.1 5.1 5.0 5.0 0.9 0.9 0.9
Local2 66.9 65.4 65.3 12.5 12.4 12.1 4.3 4.3 4.4
1 Nonfarm wage and salary employment estimates include all full- and part-time wage and salary workers who worked during or received pay for the pay period
which includes the 12th of the month. Domestic workers in private households, proprietors, the self-employed, and unpaid family workers are excluded.
Estimates measure the number of jobs by industry. Current month's estimates are preliminary; prior month and year-ago estimates are revised. These estimates
are benchmarked to March 2001 . As a measure of reliability, the March 2001 benchmark revision for total nonfarm wage and salary employment was .08
percent higher than the original sample-based estimate. 2 Regular teachers are included in summer months whether or not specifically paid in those months.
* Where an employment estimate is not entered, either the data is not available in sufficient detail for publication or is nondisclosable by law.
Source: See page 2.
Labor Market Information Services
•
•

•
•
------------- Maine LABOR MARKET D1 c;EsT
Earnings and Hours of Production Workers in Manufacturing Industries 1
Not Seasonally Adjusted
7
AVERAGE WEEKLY AVERAGE WEEKLY AVERAGE HOURLY ANNUAL AVERAGE AREA AND INDUSTRY EARNINGS HOURS EARNINGS HOURLY EARNINGS
Nov 02 Oct 02 Nov 01 Nov 02 Oct 02 Nov 01 Nov 02 Oct 02 Nov 01 2001 2000 1999
STATEWIDE
Manufacturing $658.53 $674.94 $632.01 41.6 42.0 41.2 $15.83 $16.07 $15.34 $15.17 $14.28 $13.94
Durable Goods 602.91 617.59 592.81 40.6 41.2 40.3 14.85 14.99 14.71 14.47 13.50 13.12
Lumber and Wood Products 500.91 547.01 489.24 41.5 44.8 40.5 12.07 12.21 12.08 11.83 11.42 10.84
Primary and Fabricated Metals 536.96 512.45 556.01 41.4 38.1 41 .9 12.97 13.45 13.27 13.28 12.72 12.50
Industrial Machinery and Equipment 779.15 769.70 734.81 41 .8 41.9 40.8 18.64 18.37 18.01 17.24 15.75 14.68
Electronic and Other Electric Equipment 518.16 513.48 532*.03 40.8 40.4 41.5 12.70 12.71 12.82 12.39 11 .91 11 .65 Transportation Equipment 746.85 760.26 728.83 38.3 38.3 38.4 19.50 19.85 18.98 19.13 18.11 17.78
Other Durable Goods 506.32 507.03 501.40 41.4 41.8 41.2 12.23 12.13 12.17 12.05 11.03 10.53
Nondurable Goods 719.92 736.59 675.62 42.7 42.9 42.2 16.86 17.17 16.01 15.90 15.10 14.82
Food and Kindred Products 517.16 517.10 512.10 42.6 43.6 45.0 12.14 11.86 11.38 11 .27 10.62 10.20
Textile Mill Products 499.03 481.80 445.04 41.9 40.9 39.7 11 .91 11 .78 11.21 11.18 11.42 10.98
Apparel and Other Textile Products 411.81 396.36 423.77 37.1 36.0 38.7 11 .10 11 .01 10.95 10.34 10.21 10.01
Paper and Allied Products 1041.37 1081.38 979.67 43.7 43.1 42.3 23.83 25.09 23.16 23 .1 4 22.24 21.93
Leather and Leather Products 483.34 469.86 458.96 41.1 41.0 42.3 11.76 11.46 10.85 10.92 10.32 9.80 Other Nondurable Goods 630.60 654.21 571.29 43.4 45.4 41.7 14.53 14.41 13.70 13.50 13.02 12.66
PORTLAND MSA
Manufacturing 574.48 569.42 577.64 43.0 43.5 44.4 13.36 13.09 13.01 12.47 12.14 11.66
LEWISTON-AUBURN MSA
Manufacturing 592.42 576.42 553.96 38.0 39.0 40.2 15.59 14.78 13.78 13.79 12.82 12.32
I Hours worked and earnings data are computed based on payroll figures for the week including the 12th of the month for manufacturing production workers. Average hourly
earnings are calculated on a gross basis, and include such factors as premium pay for overtime and shift differential, as well as changes in basic hourly and incentive rates of
pay. Average weekly earnings are the product of weekly hours worked and hourly earnings.
Source: See page 2.
450
c E 350
~ ~ 250 w
150
150,000 1:: Q)
E ~ 100,000 Cl.. E
LJ..J
50,000
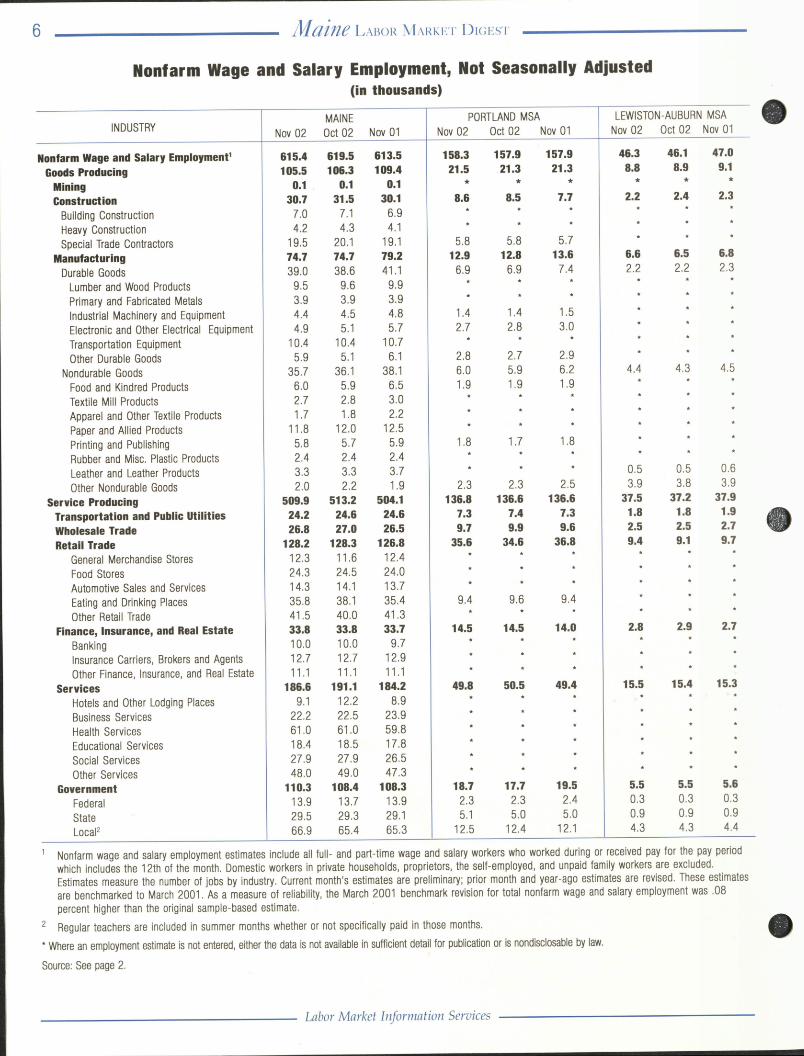
Nonfarm Employment by Sector January 1997-November 2002, Maine1
ro cr, cr,
cr, cr, cr,
0 0 N
Nonfarm Employment by Industry Division Maine, November 20022
~ ::::, 0 :r: >,
::S2 Cl) Cl)
~ Cl) 0)
~ Cl)
~
43
42
41
40
39
Hours Worked by Manufacturing Production Workers, Maine2
NDJFMAMJJASON 2001 2002
Nonfarm Employment by Industry Division Maine, Over-the-Year Change, November 20022
...... 1,000 c: Q)
E
{-1.000 E
LJ..J
-3,000
1 Seasonally Adjusted. 2 Not Seasonally Adjusted. Labor Market Information Services

8----------------------- Maine LAsoR MARKET D1cEsT
Population Change of the New England States The demographic components of population change consist of natural change and net migration. Natural change is the difference between the number of births and deaths. Net migration is the difference between the number of people moving into and out of an area.
The U.S. Census Bureau recently released state population estimates for 2002. The 2002 population of Maine was estimated at 1,294,464, an increase of 19,541 over 2000. The natural change accounted for 1,4 76 of the increase and net inmigration accounted for 16,050. 1
The impact of the recent national recession on migration patterns to and from Maine has been different than in the previous recession in the early 1990s. The net inmigration of 16,050 between 2000 and 2002 matches the total for the entire decade of the 1990s. The recession of the early 1990s was deeper in Maine than in most of the rest of the nation. Combined with the closure of Loring Air Force Base in Limestone, there was a large net outmigration from Maine in the first half of the 1990s. As labor market conditions improved in the second half of the 1990s, net inmigration resumed and the decade ended with a net inmigration of about 16,000. The early 2000s recession has not been as severe in Maine as in much of the rest of the nation keeping migration patterns on the positive side.
Population and Components of Change, July, 2000 to July 2002
Area
New England Maine New Hampshire Vermont Massachusetts Rhode Island Connecticut
Year 2000 2002
13,922,517 14,144,141 1,274,923 1,294,464 1,235,786 1,275,056
608,827 616,592 6,349,097 6,427,801 1,048,3 19 1,069,725 3,405,565 3,460,503
Change Net Percent
221,624 1.6 19,541 1.5 39,270 3.2
7,765 1.3 78,704 1.2 21,406 2.0 54,938 1.6
Births
339,278 26,630 28,582 12,474
161,887 24,451 85,254
Components of Change Natural Net
Deaths Change Migration 1
252,164 25, 154 19,926 10,621
115,438 19,725 61,300
87, 114 109,830 1,476 16,050 8,656 25,905 1,853 5,027
46,449 22, 194 4,726 14,773
23,954 25,881
Population and Components of Change, July 2001 to July 2002
Comeonents of Change Year Change Natural Net
Area 2001 2002 Net Percent Births Deaths Change Migration1
New England 14,052,232 14,144,141 91,909 0.7 170,599 127,474 43,125 50,521 Maine 1,284,470 1,294,464 9,994 0.8 13,503 12,831 672 9,430 New Hampshire 1,259,359 1,275,056 15,697 1.2 14,406 10,082 4,324 11,468 Vermont 612,978 616,592 3,614 0.6 6,231 5,389 842 2,823 Massachusetts 6,401, 164 6,427,801 26,637 0.4 81,408 58,462 22,946 4,170 Rhode Island 1,059,659 1,069,725 10,066 0.9 12, 197 9,877 2,320 7,965 Connecticut 3,434,602 3,460,503 25,901 0.8 42,854 30,833 12,021 14,665
1 The natural change and the net migration figures do not match the net change in population due to a statistical residual component which is not shown in the table. Source: U.S. Department of Commerce, Bureau of the Census.
If you do NOT desire to continue receiving this publication, check here D and return this cover to the address below.
If your address has changed, please indicate change and return this cover to the address below.
Maine Department of Labor Labor Market Information Services 20 Union Street Augusta, Maine 04330-6826
OFFICIAL BUSINESS PENALTY FOR PRIVATE USE $300
RETURN SERVICE REQUESTED
PRESORTED FIRST CLASS MAIL POSTAGE PAID
US DEPT. OF LABOR PERMIT NO. G-12
•
•