Embed Size (px)
DESCRIPTION
Labor Market Information Methodology and uses Part 3. Dennis Reid Bureau of Labor Statistics San Francisco Regional Office October 2014. Bureau of Labor Statistics. The BLS is the principal fact-finding agency for the Federal Government in the broad field of labor economics and statistics - PowerPoint PPT Presentation
Citation preview

Labor Market Information Methodology and uses
Part 3
Dennis ReidBureau of Labor Statistics San Francisco Regional
OfficeOctober 2014

2
Bureau of Labor Statistics The BLS is the principal fact-finding agency for
the Federal Government in the broad field of labor economics and statistics
The BLS mission is to collect, process, analyze and disseminate data
BLS is an independent statistical agency. It serves its diverse user communities by providing products and services that are objective, timely, accurate, and relevant.
Users include the American public, Congress, Federal agencies, state and local governments, businesses, labor organizations

3
Fed/State Cooperative Programs
Partnership with eight States & GuamContract: LMI & OSHS Cooperative
Agreements
BLS → States– $, procedures, sample selection, systems, manuals,
training (OSHS: 50% funding by law)
– Ensure consistency across all states
States → BLS– Collect, process and edit the data– Analyze/publish State and area data
BLS ↔ States– Policy collaboration via Workforce Information Council
and Program Policy Councils

4
Labor Force Programs Overview
BLS and the Federal/State Cooperative Programs
Comparison of programs NAICS (North American Industry Classification System)
QCEW (Quarterly Census of Employment & Wages “ES-202”)
CES (Current Employment Statistics)
OES (Occupational Employment Statistics)
CPS (Current Population Survey)
LAUS (Local Area Unemployment Statistics)
JOLTS (Job Openings and Labor Turnover Survey)
OSHS (Occupational Safety & Health Statistics)

Comparison of Labor Force and OSHS Programs
QCEW CES OES CPS LAUS JOLTS SOII CFOI
Data Collected by
States & BLS BLS States & BLS ROs Census BureauInput from CPS, CES,
UIBLS States and BLS States and BLS
Data Collected from
Establishments Establishments Establishments HouseholdsInput from CPS, CES,
UIEstablishments Establishments various sources
Estimate or Universe Count?
Universe Estimate Estimate Estimate Estimate Estimate Estimate Universe
Frequency of Collection
Quarterly for monthly data
Monthly Semi-Annual Monthly Monthly Monthly Annual on a flow basis
Frequency of Publication
Quarterly & Annual
Monthly Annual Monthly Monthly Monthly Annual Annual
Major Data Types Published
UI covered employment &
wages by industry
Nonfarm employment, hours, hourly earnings by
industry
Occupational employment &
wages by area and industry
Civilian labor force, employment,
unemployment, Unemp. rate for
the nation
Civilian labor force, employment,
unemployment, Unemp. rate for
States & local areas
Nonfarm job openings, hires, and separations by industry and
region
Workplace Injuries and Illnesses
Workplace Fatalities
Geographic Detail Published
County, MSAs, State, USA
MSAs, State, USA
MSAs, State, USA USA
Cities & towns 25,000+, County, LMA, MSA, State, Census Division &
Region
Census Region and USA
USA and most States
MSAs, State, USA
Demographic Detail Published
None Women Workers NoneExtensive
Demographic Detail
None NoneGender, age, race/ethnicity
Gender, age, race/ethnicity
Are Data Benchmarked?
No, QCEW is a benchmark
Yes, to QCEW Yes, to QCEW No Yes, to CPS Yes, to CES Yes, to QCEWNo, CFOI is a universe count
Major Uses Sample frame & benchmark
Economic Indicator
Foreign Labor Certification,
Planning training & educational programs
Economic IndicatorEconomic Indicator, Allocation of funds
Economic Indicator
Workplace safety programs
Workplace safety programs
Time from Reference Period to 1st BLS Publication
6 months or more
USA- 3 weeks; States- 5 weeks; MSAs- 7 weeks
10 months 3 weeksStates- 5 weeks; Areas- 7 weeks
4-6 weeks after reference month
10 months 8 months

6
Occupational Employment Statistics (OES)
www.bls.gov/oes

7
OES Survey
OES collects detailed occupational and wage information by industry and area
Semi-annual establishment survey
Primarily a mail survey
NOT a time series (no overlapping sample units to measure change)
All 50 statesPlus DC, Guam, Puerto Rico, and the Virgin Islands
Big change in 1996: wage collection for all States

8
OES Sample Design
1.2 million establishments
3-year collection cycle
400,000 surveyed annually in two panels(May and November)
Estimates are based on the total sample of 1.2 million collected over three years (6 panels)
Wage data for 2.5 previous years (5 panels) are updated using ECI-based factors
(ECI = Employment Cost Index)

9
OES Universe and Sampling Frame
BLS draws sample twice a year (2nd, 4th quarters)
QCEW is the sampling frame
Includes establishments in Nonfarm industries Agricultural services Federal, State, and Local governments
Stratified by Area, Industry and Size Class
The larger an establishment, the more likely it will be included in the 3-year OES sample
Sample distribution across states was “fixed” since 1996; dynamic starting in 2010

10
Workers in scope of OES survey
Full or part-time paid workers
Workers on paid leave
Workers assigned temporarily to other units
Paid owners, officers, and staff of incorporated firms

11
Workers not in scope of OES survey
Proprietors, owners, and partners of unincorporated firms
Self-employed individuals
Unpaid family workers
Workers on unpaid leave
Contractors & temporary help (not on the establishment’s payroll)

12
What is an OES Wage?
Straight-time gross pay exclusive of premium pay. OES Wage Includes:
Base Rate Cost-of-Living
Allowances Guaranteed Pay Hazardous Duty
Pay Portal-to-Portal Pay
Incentive Pay, e.g. Commissions, Piece Rates & Production Bonuses
Length-of-Service Allowances [Longevity Pay]
Tips Deadheading Pay

13
OES Wage excludes:
Attendance Bonuses Back Pay Draw Premium Pay for
Holidays/Weekends Jury Duty Pay
Meal & Lodging Allowances
Merchandise Discounts
Non-Production Bonuses
Holiday Bonuses Overtime Pay Profit Sharing Relocation Allowances Severance Pay Shift Differentials Stock Bonuses Uniform Allowance

14
OES Survey Activities
Draw sample from the universe Survey form production - by central
printer
Mail-out of survey forms - by central printer
Data collection Data entry Data review and editing Estimation Publication

15
OES Data Collected
Occupation and wage data of all employees for units sampled
This information is stored listing the occupational employment distribution for each unit sampled by wage interval (or range)
16
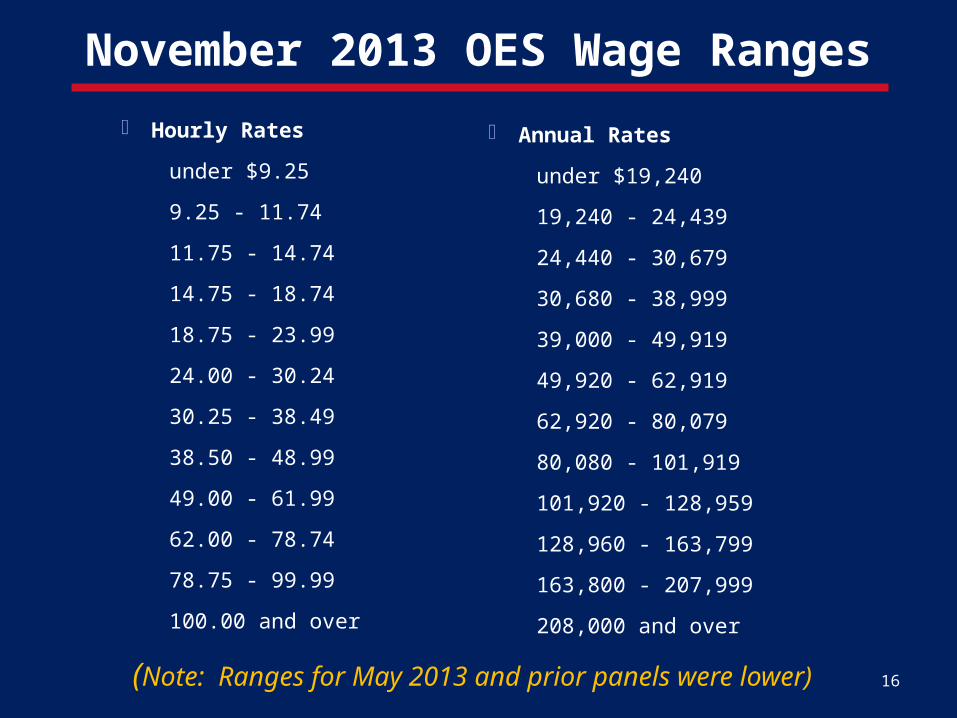
November 2013 OES Wage Ranges
Hourly Rates
under $9.25
9.25 - 11.74
11.75 - 14.74
14.75 - 18.74
18.75 - 23.99
24.00 - 30.24
30.25 - 38.49
38.50 - 48.99
49.00 - 61.99
62.00 - 78.74
78.75 - 99.99
100.00 and over
(Note: Ranges for May 2013 and prior panels were lower)
Annual Rates
under $19,240
19,240 - 24,439
24,440 - 30,679
30,680 - 38,999
39,000 - 49,919
49,920 - 62,919
62,920 - 80,079
80,080 - 101,919
101,920 - 128,959
128,960 - 163,799
163,800 - 207,999
208,000 and over

17
OES Survey Forms
Are specific to industries or groups of industries (~100 industry-specific versions)
List occupations that occur in the surveyed industry (longest has 225 occupations)
“Non form” reporting Collection by phone/email; files/printouts
In 2009: Web-lite (downloaded fillable form)

18
`

19
Non-form OES Reporting
Some firms return printouts or electronic payroll files, which are coded by OES State or regional office staff
Some data are collected/coded by regional office National Compensation Survey staff
Many firms report data over the phone
E-mail collection
2009: Web-lite (downloaded fillable form)

20
Standard Occupational Classification
The standard occupational classification (SOC) is a system designed to:
Classify all occupations in the economy, including private, public, and military occupations
Provide a means to compare occupational data across government agencies
Revised periodically:
2010 revision, finalized in 2009, implemented in 2010
Net new job count is 19; 2 of them “green” http://www.bls.gov/soc/soc2010.pdf
2018 SOC revision in the works

21
SOC Classification Levels
Broad categories lead to unique 6-digit codes for each occupation:
22 Major groups ; divided into...
98 Minor groups; divided into...
450 Broad occupations; divided into...
800+ Detailed occupations

22
SOC Structure Example :
Major Group: 25-0000 Education, Training, and Library Occupations
Minor Group: 25-2000 Teachers, Primary, Secondary
& Special Education
Broad Occupation: 25-2020 Teachers, Elementary
& Middle School
Detailed Occupation: 25-2021 Teachers, Elementary

23
OES Data Produced by BLS
Types of estimates Employment Wages (mean, median, 10th, 25th, 75th 90th wage rate
percentiles)
Industry Cross-industry and by 3- and 4-digit NAICS
Examples: Cross Industry: All Nurses By NAICS industry: Nurses working
in hospitals Geography
National, State, MSAs
Special wages for Foreign Labor Certification (FLC) Produced, but not published by BLS
States use Estimates Delivery System (EDS)

24
Some Hawaii OES Data
Source: Hawaii State Department of Labor and Industrial Relations, Research and Statistics Office

25
Users of OES Data
Employment and Training Administration’s Foreign Labor Certification program (FLC)
Job Seekers and Counselors
Vocational Educational Planners
Business Associations
Employers
BLS (for occupational projections)

Employment Projections Background
10-year projections made every 2 years
2012-22 projections cover over 800 occupations and 300 industries
BLS projections prepared at the national level only
26

Labor Force Change by Age Group: Projected
2012-22
16-24
25-34
35-44
45-54
55-64
65+
-2,823
3,321
2,076
-3,454
3,607
5,749
27
In thousands of people

Employment Outlook: 2012-22
Industry Employment
28

Employment
2002 2012 Projected 2022
131.0
134.4
149.8
29
Millions of jobs
Nonagricultural Wage and Salary Employment

Employment Growth Projections
30
Uni
ted
Stat
es
Haw
aii S
tate
wid
e
Hon
olul
u M
SA
Haw
aii C
ount
y
Mau
i Cou
nty
Kaua
i Cou
nty
2012-2022 2010-2020
0.0%
2.0%
4.0%
6.0%
8.0%
10.0%
12.0%
14.0%
16.0%
18.0%
10.8% 9.7% 10.5%
14.2% 15.1% 15.4%
Source: Bureau of Labor Statistics. Hawaii State Department of Labor and Industrial Relations, Research and Statistics Office

Employment Change by Industry Sector: Projected
2012-22
Health care and social assistance Professional and business services
Construction Leisure and hospitality
Retail trade State and local government
Financial activities Educational services
Other services Wholesale trade
Transportation and warehousing Mining
Utilities Information
Federal government Manufacturing
4,994.13,482.8
1,622.11,289.2
1,090.9929.0
751.0675.3648.9
470.4327.3
121.2-56.4-65.2
-407.5-549.5 31
Thousands of wage and salary jobs
Service providing
Goods producing

Rate of Change in Employment by Industry Sector: Projected
2012-22
Health care and social assistance Construction
Educational services Professional and business services
Mining Other services
Financial activities Leisure and hospitality
Wholesale trade Transportation and warehousing
Retail trade State and local government
Information Manufacturing
Utilities Federal government
2.6%2.6%
1.9%1.8%
1.4%1.0%0.9%0.9%
0.8%0.7%0.7%0.5%
-0.2%-0.5%
-1.1%-1.6%
32
Annual rate of change for wage and salary employment
Service providingGoods producing
Total nonagricultura
l wage and salary annual growth= 1.0%

Employment Outlook: 2012-22
Occupational Employment
33

Percent Change vs. Numeric Change
34
Audiologists
Retail salespersons
33.6%9.8
%
Percent employment growth in two occupations, projected 2012-22
Audiologists
Retail salespersons
4.3434.
7
Numeric employment growth in two occupations, projected 2012-22, in thousands

(Continued on next
slide)
Percent Change in Employment
by Major Occupational Group
Healthcare support
Healthcare practitioners and technical
Construction and extraction
Personal care and service
Computer and mathematical
Community and social service
Business and financial operations
Building and grounds cleaning and maintenance
Education, training, and library
Legal
Life, physical, and social science
28.1%
21.5%
21.4%
20.9%
18.0%
17.2%
12.5%
12.5%
11.1%
10.7%
10.1%35
Projected 2012-22Average=
10.8%

Percent Change in Employment
by Major Occupational Group
Installation, maintenance, and repair
Food preparation and serving related
Transportation and material moving
Protective service
Architecture and engineering
Sales and related
Management
Arts, design, entertainment, sports, and media
Office and administrative support
Production
Farming, fishing, and forestry
9.6%
9.4%
8.6%
7.9%
7.3%
7.3%
7.2%
7.0%
6.8%
0.8%
-3.4%36
Projected 2012-22
Average, all occupations = 10.8%
(Continued)

Employment Change by Major Occupational
GroupHealthcare practitioners and technical
Office and administrative support
Construction and extraction
Healthcare support
Personal care and service
Food preparation and serving related
Sales and related
Education, training, and library
Business and financial operations
Transportation and material moving
Building and grounds cleaning and main-tenance
1,732.9
1,534.0
1,301.9
1,155.8
1,122.9
1,101.8
1,095.5
1,015.8
898.1
790.6
691.0
37
Thousands of jobs, projected 2012-22
(Continued on next
slide)

Employment Change by Major Occupational
GroupComputer and mathematical
Management
Installation, maintenance, and repair
Community and social service
Protective service
Arts, design, entertainment, sports, and media
Architecture and engineering
Legal
Life, physical, and social science
Production
Farming, fishing, and forestry
685.8
636.6
531.2
408.8
263.0
180.6
179.6
132.9
125.7
75.6
-32.238
Thousands of jobs, projected 2012-22(Continued)

Employment Growth vs. Replacement Needs
39
Registered nurses
Cashiers
526.8
86.5
Numeric employment growth in two occupations, projected 2012-22, in thousands
Registered nurses
Cashiers
526.8
86.5
525.7
1,443.4
Job openings for two occupations, projected 2012-22, in thousands
From growth Replacement needs
1,530.
1,052.6

Job Openings by Major Occupational Group
Office and administrative support
Sales and related
Food preparation and serving related
Healthcare practitioners and technical
Transportation and material moving
Education, training, and library
Management
Construction and extraction
Business and financial operations
Personal care and service
Production
6,401.6
5,599.6
5,509.7
3,378.2
2,964.0
2,896.8
2,397.2
2,352.6
2,340.9
2,286.3
1,881.1
Replacement needs
Series3
40
Thousands of job openings, projected 2012-22
(Continued on next
slide)

Job Openings by Major Occupational Group
Healthcare support
Building and grounds cleaning and main-tenance
Installation, maintenance, and repair
Computer and mathematical
Protective service
Community and social service
Arts, design, entertainment, sports, and media
Architecture and engineering
Life, physical, and social science
Legal
Farming, fishing, and forestry
1,938.4
1,825.5
1,809.9
1,308.5
1,146.8
962.0
783.3
758.5
486.7
333.6
233.3
Replace-ment needs
Series3
41
Thousands of job openings, projected 2012-22(Continued)

Fastest Growing Occupations
42
Percent change, projected 2012-22
Median annual wages, May 2012
$83,580
$19,910
$20,820
$39,170
$45,430
$65,860
$28,220
$53,240
$56,800
$52,160
Industrial-organizational psychologists
Personal care aides
Home health aides
Insulation workers, mechanical
Interpreters and translators
Diagnostic medical sonographersHelpers--brickmasons, blockmasons,
stonemasons, and tile and marble set-ters
Occupational therapy assistants
Genetic counselors
Physical therapist assistants
53.4%
48.8%
48.5%
46.7%
46.1%
46.0%
43.0%
42.6%
41.2%
41.0%

Median annual wages, May 2012
$19,910
$65,470
$21,110
$20,820
$18,260
$24,420
$32,410
$30,580
$22,320
$29,990
Thousands of jobs, projected 2012-22
Occupations with the Largest Job Growth
Personal care aides
Registered nurses
Retail salespersons
Home health aides
Combined food preparation and serv-ing workers, including fast food
Nursing assistantsSecretaries and administrative assis-tants, except legal, medical, and ex-
ecutiveCustomer service representatives
Janitors and cleaners, except maids and housekeeping cleaners
Construction laborers
580.8
526.8
434.7
424.2
421.9
312.2
307.8
298.7
280.0
259.843

Occupations with the Most Job Openings
44
Thousands of job openings, projected 2012-22
Median annual wages, May 2012
$21,110
$18,260
$18,970
$18,540
$65,470
$30,580
$23,890
$27,470
$22,320
$19,910
Retail salespersons
Combined food preparation and serv-ing workers, including fast food
Cashiers
Waiters and waitresses
Registered nurses
Customer service representatives
Laborers and freight, stock, and ma-terial movers, hand
Office clerks, general
Janitors and cleaners, except maids and housekeeping cleaners
Personal care aides
1,955.7
1,555.7
1,530.0
1,268.3
1,052.6941.6
922.5
810.9
717.3
666.0
Growth Replacement needs

Fastest Declining Occupations
45
Percent change, projected 2012-22
Median annual wages, May 2012
$35,250
$44,920
$24,310
$53,090
$32,880
$53,090
$33,020
$24,050
$56,490
$19,830
Fallers
Locomotive firers
Shoe machine operators and tenders
Postal service clerks
Log graders and scalersPostal service mail sorters, pro-
cessors, and processing machine operators
Semiconductor processors
Textile cutting machine setters, operators, and tenders
Postal service mail carriers
Motion picture projectionists
-43.3%
-42.0%
-35.3%
-31.8%
-31.6%
-29.8%
-27.1%
-27.1%
-26.8%
-26.5%

Occupations with the Largest
Employment Declines
46
Thousands of jobs, projected 2012-22
Median annual wages, May 2012
$69,300
$56,490
$28,010
$21,270
$53,090
$18,670
$35,270
$53,090
$32,400
$28,630
Farmers, ranchers, and other agricultural managers
Postal service mail carriers
Data entry keyers
Sewing machine operators
Postal service mail sorters, processors, and processing machine operators
Farmworkers and laborers, crop, nursery, and greenhouse
Word processors and typists
Postal service clerks
Reservation and transportation ticket agents and travel clerks
Molding, coremaking, and casting machine setters, operators, and ten-
ders, metal and plastic
-179.9
-79.2
-54.2
-41.7
-38.6
-29.2
-26.2
-21.3
-19.5
-19.2

Hawaii: Short-term Forecasts
47

Contact Information
Dennis ReidAssistant Regional Commissioner
San Francisco415-625-2260