Embed Size (px)
Citation preview
Cornell University ILR SchoolDigitalCommons@ILR
Articles and Chapters ILR Collection
2001
Labor Pains: Change in Organizational Models andEmployee Turnover in Young, High-Tech FirmsJames N. BaronStanford University
Michael T. HannanStanford University
M. Diane BurtonCornell University, [email protected]
Follow this and additional works at: https://digitalcommons.ilr.cornell.edu/articles
Part of the Human Resources Management Commons, Labor Relations Commons,Organizational Behavior and Theory Commons, and the Technology and Innovation CommonsThank you for downloading an article from [email protected] this valuable resource today!
This Article is brought to you for free and open access by the ILR Collection at DigitalCommons@ILR. It has been accepted for inclusion in Articlesand Chapters by an authorized administrator of DigitalCommons@ILR. For more information, please contact [email protected].
Labor Pains: Change in Organizational Models and Employee Turnoverin Young, High-Tech Firms
Abstract[Excerpt] Organizational theories, especially ecological perspectives, emphasize the disruptive effects ofchange. However, the mechanisms producing these effects are seldom examined explicitly. This article ex-amines one such mechanism-employee turnover. Analyzing a sample of high-technology start-ups, we showthat changes in the employment models or blueprints embraced by organizational leaders increase turnover,which in turn adversely affects subsequent organizational performance. Turnover associated withorganizational change appears to be concentrated among the most senior employees, suggesting "old guarddisenchantment" as the primary cause. The results are consistent with the claim of neoinstitutionalist scholarsthat founders impose cultural blueprints on nascent organizations and with the claim of organizationalecologists that altering such blueprints is disruptive and destabilizing.
Keywordsemployment relations, management, organizations, turnover, high technology, human resource management
DisciplinesHuman Resources Management | Labor Relations | Organizational Behavior and Theory | Technology andInnovation
CommentsSuggested CitationBaron, J. N., Hannan, M. T. & Burton, M. D. (2001). Labor pains: Change in organizational models andemployee turnover in young, high-tech firms [Electronic version]. American Journal of Sociology, 106(4),960-1012. http://digitalcommons.ilr.cornell.edu/articles/251/Required Publisher Statement©2001 by the University of Chicago Press.
This article is available at DigitalCommons@ILR: https://digitalcommons.ilr.cornell.edu/articles/251
Labor Pains: Change in Organizational Models and Employee Turnover in Young, High-Tech Firms'
James N. Baron and Michael T. Hannan
Stanford University
M. Diane Burton Massachusetts Institute of Technology
Organizational theories, especially ecological perspectives, empha- size the disruptive effects of change. However, the mechanisms pro- ducing these effects are seldom examined explicitly. This article ex- amines one such mechanism-employee turnover. Analyzing a sample of high-technology start-ups, we show that changes in the employment models or blueprints embraced by organizational lead- ers increase turnover, which in turn adversely affects subsequent organizational performance. Turnover associated with organiza- tional change appears to be concentrated among the most senior employees, suggesting "old guard disenchantment" as the primary cause. The results are consistent with the claim of neoinstitutionalist scholars that founders impose cultural blueprints on nascent organ- izations and with the claim of organizational ecologists that altering such blueprints is disruptive and destabilizing.
INTRODUCTION
Models of the employment relationship play an important-if not always explicit-role in contemporary theories of organizations. Notwithstanding
1 This research was supported by the Alfred P. Sloan Foundation and the Stanford Graduate School of Business, particularly the Center for Entrepreneurial Studies. Baron also received generous support from a Marvin Bower Fellowship at Harvard Business School and from the Robert and Marilyn Jaedicke Faculty Fellowship at Stanford Business School while conducting this research; Hannan was supported by the Stanford Graduate School of Business Faculty Trust. We received helpful comments and suggestions from Bill Barnett, Peter Cappelli, Glenn Carroll, Robert Gibbons, Charles Holloway, David Kreps, Barbara Lubben, Craig Olson, Charles O'Reilly, Canice Prendergast, Toby Stuart, and seminar participants at the University of Wis-
? 2001 by The University of Chicago. All rights reserved. 0002 -9602/2001/10604-0004$02.50
960 AJS Volume 106 Number 4 (January 2001): 960-1012
Labor Pains
their other differences, numerous perspectives affirm the idea that organ- izations embrace particular culturally accepted logics or blueprints for organizing, including a model of how employment relations should be structured. These models are claimed, in turn, to guide subsequent or- ganizational evolution and to be resistant to change. For instance, in discussing organizational inertia, population ecologists have argued that survival prospects are enhanced by organizational features that promote reliability and accountability, including a coherent system for managing employees: "Testing for accountability is especially intense during organ- ization building.... When membership involves an employment relation, potential members often want guarantees that careers within the organ- ization are managed in some rational way" (Hannan and Freeman 1984, p. 153). Among the most important factors in fostering reliability and accountability, according to organizational ecologists, are clearly specified forms of authority and well-understood bases of exchange between mem- bers and the organization. Hence, organizations stand to benefit by de- veloping and institutionalizing coherent blueprints for employment re- lations that can foster reliability and accountability; once such a blueprint gets adopted, it is risky and costly for organizations to alter it.
Neoinstitutional perspectives also emphasize the importance of nor- mative or cultural blueprints in shaping organization building and or- ganizational evolution (e.g., Guillen 1994; Fligstein and Byrkjeflot 1996). According to these accounts, the designers of organizations draw on cul- turally appropriate templates and conceptions of control in crafting struc- tures, work roles, and employment relations because this enhances or- ganizational legitimacy and because their own prior socialization and enculturation presumably preclude doing otherwise (Fligstein 1987, 1990).
Organizational economists have made similar arguments about the value of distinctive and coherent human-resources systems and their in- ertial tendencies (Milgrom and Roberts 1995). Organizations benefit from a coherent, consistent, and well-understood philosophy and set of practices governing human resource management because: (1) they benefit from technical complementarities among specific personnel practices (Milgrom and Roberts 1992, chap. 4)-for instance, investments in training increase the value of policies that reduce turnover, and vice versa; (2) learning is simplified and accelerated; and (3) the organization can more readily dif- ferentiate itself from competitors, helping it attract workers well-suited to the kinds of jobs and values the firm has on offer. These benefits are particularly likely to be realized when the organization's model (e.g., an
consin, the University of Chicago, and the Wharton School, none of whom should be blamed for any remaining defects in the finished product. Direct correspondence to James N. Baron, Graduate School of Business, Stanford University, Stanford, Cali- fornia 94305-5015. E-mail: [email protected]
961
American Journal of Sociology
ironclad bureaucracy or a familial clan) resonates with behavioral scripts or blueprints familiar to prospective and current employees from their experiences in other settings (Baron and Kreps 1999, chap. 3). Yet strong complementarities and interdependencies among various facets of an or- ganization's model make changes in any particular element more difficult and costly.
These various arguments suggest that organizational models regarding employment relations should be resistant to change and that efforts to redraw blueprints should be disruptive. Indeed, according to organiza- tional ecologists, efforts to alter the premises governing employment re- lations should be among the most disruptive types of organizational change. Changes in these premises can obsolesce skills and routines that employees have learned, alter bases of power and status within the or- ganization, and violate the implicit or explicit contracts specifying the expectations and entitlements of employees vis-a-vis the firm. Therefore, efforts by firms to implement change along these dimensions should in- crease discord and employee turnover. For instance, consider recent efforts by health care organizations to implement performance evaluation and reward systems for physicians based on patient volume. These changes have proved enormously contentious and sparked unionization efforts and rancor within the profession, precisely because they promote behaviors and values that conflict with most physicians' basic premises about their role (Greenhouse 1999).
Yet, the destabilizing effects of fundamental organizational changes have been assumed more than tested in organizational research. Numerous studies have documented that some type of organizational change (in strategy, top leadership, etc.) has deleterious consequences for organiza- tional performance or survival (for reviews, see Barnett and Carroll [1995] and Carroll and Hannan [2000]), which are often attributed to the internal disruption, rancor, and turnover of personnel wrought by changes in val- ues, routines, working relationships, and requisite skills. In this article, we examine empirically whether changes to the organizational model embraced by the founder(s) have disruptive effects, which we operation- alize by focusing on labor force turnover and organizational performance. Turnover is particularly disruptive in the setting we examine-high-tech start-ups in Silicon Valley-for at least two reasons: the acute shortage of scientific, technical, and engineering talent facing these organizations; and the fact that, for many technology start-ups, employee turnover risks losing the firm's most precious asset, its human capital.
These analyses speak to several important issues for organizational scholarship. First, they explore the validity and utility of the notion that culturally based scripts, templates, or blueprints are imprinted on organ- izations at their founding. In prior research, we have documented the
962
Labor Pains
existence of distinct organizational blueprints or models-different sets of premises governing the employment relation-among the founders of high-technology start-ups in Silicon Valley. We have demonstrated that these blueprints shaped various aspects of organizational evolution, in- cluding bureaucratization and administrative intensity, the development of the HR function, and even the odds of replacing the founder with a new chief executive officer (CEO) and of going public (Baron, Burton, and Hannan 1996, 1999; Baron, Hannan, and Burton 1999a, 1999b; Han- nan, Burton, and Baron 1996; Burton 1995). If these blueprints represent part of the "hard wiring" of an enterprise and shape the expectations that employees and firms have of one another, then changing the blueprint should have demonstrable consequences, including heightened turnover. Second, our analyses address the general claim that fundamental change destabilizes organizations. Third, labor force turnover is, of course, an inherently important organizational outcome, which has received consid- erable attention from social scientists (for reviews, see Price [1977] and Mobley [1982]). Whatever its relation to performance, turnover surely affects organizational life (Staw 1980; Pfeffer 1983). Two otherwise iden- tical organizations with persistent differences in turnover will evolve very different tenure distributions, with implications for stability and change in organizational culture (Carroll and Harrison 1998). Finally, we believe the models and methods we employ might prove useful to researchers interested in depicting organizational founding conditions and assessing their enduring effects.
We begin by describing the sample, the organizational setting, and our typology of employment models. We then formulate and test predictions relating labor force turnover to changes in the employment blueprint. We assess whether the turnover wrought by changing the employment blue- print is disruptive for organizations in two ways: (1) by specifying and testing hypotheses concerning how that turnover is patterned (i.e., who is most likely to depart); and (2) by analyzing the effects of labor force turnover on organizational performance (revenue growth). We test these predictions with pooled cross-section time-series data describing annual turnover rates and various organizational change events for more than 100 organizations between 1991 and 1995.
THE STANFORD PROJECT ON EMERGING COMPANIES (SPEC)
A panel study of young, high-technology firms in California's Silicon Valley, SPEC examines the evolution of employment practices, organi- zational designs, and business strategies. The SPEC project seeks to un- derstand how human resource systems get established. The focus on firms
963
American Journal of Sociology
in a single region and sector of economic activity holds constant key labor market and environmental conditions, as well as some of the institutional influences asserted to shape labor force turnover. Within the Silicon Valley region, we sought industries containing sufficient numbers of comparable firms to allow quantitative comparisons; accordingly, we concentrated on firms engaged in computer hardware and/or software, telecommunications
(including networking equipment), medical and biological technologies, and semiconductors. We assumed organizations must reach a minimum size before needing formal systems or practices; accordingly, we required that firms in our study have at least 10 employees when sampled.2 We also wanted to understand how founding conditions and early decisions affect subsequent organizational evolution, which necessitates information about the earliest days of the organization. We assumed individuals could
only reliably recall fairly recent information; consequently, we limited the
sample to firms no more than 10 years old when first visited in 1994-95
(the typical firm was six years old).3
DATA COLLECTION
Survey, interview, and archival methods were used to gather information on each firm (see Burton 1995). Trained MBA and doctoral students con- ducted semistructured interviews with the current CEO. The CEO was
2 In 1994, we identified 676 technology firms in Silicon Valley founded within these industries during the previous ten years and having more than 10 employees, according to two commercial databases on Silicon Valley technology companies: Rich's Everyday Sales Prospecting Guide (1994); and the Technology Resource Guide to Greater Silicon Valley (1993/4), published by CorpTech. From that group, 250 firms were selected according to a stratified sampling plan described in Baron, Burton, and Hannan (1996, fig. 1). Of the 250 firms to whom we wrote (some of which had gone out of business, left the area, or been acquired by the time we contacted them), 109 agreed to participate. Utilizing the same sampling frame, we contacted 94 additional companies in 1995 (of 168 that were added to the 1995 edition of the CorpTech directory); 42 agreed to be studied. Finally, we supplemented the sample by contacting 32 very young firms (not listed in CorpTech), which we identified by tracking the Silicon Valley business press; 22 of these firms participated. We further enlarged the sample in 1997-98 by soliciting participation from very young firms, including enterprises in the newly emerging In- ternet sector. However, we were only able to obtain turnover data for several of these firms, whose responses conceivably reflect a different time period, labor market, and business environment than the rest of the firms in our sample confronted. Consequently, we did not include those several firms in the analyses reported here. 3 About 10% of firms proved to be more than 10 years old when we first visited them. In some cases, for example, our interviews revealed that the inception of the organi- zation occurred somewhat earlier than the date of legal incorporation used in con- structing our sampling plan. Even employing the most liberal definition of "founding," however, only three firms in the sample analyzed here had existed for more than 12 years when we first visited them.
964
Labor Pains
asked to identify the founder (or member of the founding team) best equipped to provide information regarding the firm's origins; and the best informant regarding human resources (HR) practices in the organization. We followed up with these informants about company history and HR (respectively) and asked them to return completed surveys to us prior to being interviewed. The company history survey solicited details about the firm's founding and subsequent milestones. The HR survey sought in- formation about workforce demographics and a variety of employment policies and practices. Information from the surveys, when available, was used to guide interviews with informants in each company.
FOUNDERS' ORGANIZATIONAL MODELS
As noted above, recent neoinstitutional work invokes the notion of cul- turally based logics, blueprints, scripts, or conceptions of control. Yet researchers have seldom tried to operationalize such blueprints directly, tending instead to infer their existence from other sources of information. Testing the proposition that altering founders' initial blueprints for or- ganizing and for structuring employment relations is disruptive demands a method for measuring those blueprints.
In designing the study, we knew from the extant literature that con- ceptions of employment relationships could vary along numerous dimen- sions, and we were unsure a priori which dimension(s) would be most relevant in our setting. Accordingly, we used open-ended interviews to gather information. We asked each founder whether he or she had "an organizational model or blueprint in mind when (you) founded the com- pany." (The CEO was asked a parallel question about the period corre- sponding to the date of the interview.) We inductively analyzed transcripts of interviews with founders and CEOs. Those analyses indicated that interviewee's images regarding how work and employment should be organized varied along three main dimensions-attachment, coordination/ control, and selection-each characterized by three or four fairly distinct options or approaches from which organizational architects seemed to be selecting. (For descriptions of these different response categories and il- lustrative quotes from interview transcripts, see Burton [1999].) Based on the interview transcripts, members of the research team coded or classified responses of each founder and each CEO on these three dimensions, unless missing data precluded this.4 In previous work, we have shown that these
4 Two senior researchers on the project independently coded the three dimensions for all firms, based on transcripts of interviews with founders and with CEOs. Many respondents indicated that more than one option for a dimension was relevant to their conception of the employment model; for instance, almost all regarded compensation
965

American Journal of Sociology
three dimensions cohere and can be used to characterize the implicit organizational model or blueprint of the founder and of the CEO at the time our team first visited each firm (for an overview and additional details, see Burton [1995] and Baron and Kreps [1999], chap. 19). Here we briefly summarize the approach.
Attachment.-Founders articulated three different bases of employee attachment, which we label love, work, and money. Some founders en- visioned creating a strong family-like feeling and an intense emotional bond with the workforce that would inspire superior effort and increase retention of highly sought employees, thereby avoiding the frequent mo- bility of key technical personnel that plagues Silicon Valley start-ups. What binds the employee to the firm in this model is a sense of personal belonging and identification with the company-in a sense, love. Many SPEC firms pursue cutting-edge technology, and the primary motivator for their employees is the desire to work at the technological frontier. Recognizing this, many founders anticipated providing opportunities for interesting and challenging work as the basis for attracting, motivating, and (perhaps) retaining employees.5 Here, employees were not expected to be loyal to the organization, the supervisor, or even coworkers per se, but instead to a project. Finally, other founders' responses indicated that they regarded the employment relationship as a simple exchange of labor for money.
Basis of coordination and control.-A second dimension concerned the principal means of coordinating and controlling work. The most common conception involved extensive reliance on informal control through peers
as relevant to retention, even if they regarded, say, exciting work as more important. Hence, the coding task sought to select the option on each dimension that the re- spondent indicated as dominant in his/her thinking about the dimension. Some re- spondents were unable or unwilling to give priority to one option. Therefore, it was important that we use explicit default rules for responses that did not fall neatly into one of our categories. We used the following defaults: skills for selection, work for attachment, and peer-based control for coordination/control. In effect, this makes the engineering model the default (see below). We interpreted the default rules as follows: unless the respondent clearly indicated that some other option was more important than the default, we coded the response as the default category. After independently coding each firm on all three dimensions for the founder and CEO responses, the two researchers compared their two sets of codings. In the large majority of cases, they were the same. When they were not, we scrutinized the transcripts looking for am- biguities that might have led the two coders to disagree. In most cases, we decided that the difference was due to some opacity in the response and therefore settled on the default code. 5 A few founders also spoke about providing unrivaled "opportunity" for prospective employees. Although opportunity is potentially a conceptually distinct basis of attach- ment, it was closely aligned with "challenging work" and there were very few such cases in our sample. Hence, we treated these cases as instances of attachment based on "work."
966
Labor Pains
or organizational culture. Other founders intended to rely on professional control, even if they did not explicitly use this terminology. They took it for granted that workers were committed to excellence in their work and could perform at high levels because they had been professionally so- cialized to do so. (Not surprisingly, this approach tends to be accompanied by an emphasis on hiring high-potential individuals from elite institu- tions.) Professional control emphasizes autonomy and independence rather than enculturation. A third group of founders espoused a more traditional view of control as embedded in formal procedures and systems. Finally, some founders indicated that they planned to control and coordinate work personally, by direct oversight, reminiscent of Edwards's (1979) descrip- tion of the simple-control paradigm that characterized small capitalist firms in the late nineteenth and early twentieth century.
Selection.-The third dimension concerns the primary basis for se- lecting employees. Some founders' responses suggested that they con- ceived of the firm as a bundle of tasks and sought employees to carry out particular tasks effectively. Time and money tended to be the paramount concerns here, so the focus was on selecting employees who could be brought on board and up to speed as quickly and cheaply as possible. In these cases, founders envisioned selecting employees having the skills and experience needed to accomplish some immediate task(s). Other founders focused less on immediate and well-defined tasks than on a series of projects (often not yet even envisioned) through which employees would move over time. Accordingly, they focused on long-term potential. Finally, some founders focused primarily on values and cultural fit, emphasizing how a prospective hire would connect with others in the organization.
Relationships among the three dimensions. These blueprints can be classified into three types of attachment and selection and four types of control, yielding 3 x 3 x 4 = 36 possible combinations. However, the observations cluster into a few cells (see Burton 2001), which we will refer to as five basic model types for employment relations, summarized in table 1.
The engineering model involves attachment through challenging work, peer group control, and selection based on specific task abilities. This model parallels standard descriptions of the default culture among high- tech Silicon Valley start-ups (e.g., Saxenian 1994), and it is the modal employment blueprint among founders of SPEC firms. The star model refers to attachment based on challenging work, reliance on autonomy and professional control, and selecting elite personnel based on long-term potential. The commitment model entails reliance on emotional-familial attachments of employees to the organization, selection based on cultural fit, and peer group control. The bureaucracy model involves attachment based on challenging work and/or opportunities for development, selecting
967
American Journal of Sociology
TABLE 1 FIVE BASIC EMPLOYMENT MODEL TYPES
DIMENSIONS
BASIC MODEL TYPE Attachment Selection Coordination/Control
Star ................. Work Potential Professional Engineering ........ Work Skills Peer/cultural Commitment ....... Love Fit Peer/cultural Bureaucracy ........ Work Skills Formal Autocracy .......... Money Skills Direct
individuals based on their qualifications for a particular role, and for- malized control (for further discussion of this model type, see Baron, Hannan, and Burton [1999b], appendix). Finally, the autocracy model refers to employment premised on monetary motivations, control and coordination through close personal oversight, and selection of employees to perform pre-specified tasks.
We refer to these five blueprints as the basic model types. We do so not only because they are the most prevalent combinations observed within this sample, but because they also display several other important properties. First, each of these blueprints exhibits a high degree of co- herence or internal consistency among the three dimensions, suggesting that they complement one another to form an overarching system. For instance, consider a founder intending to emphasize control and coordi- nation through organizational norms and seeking emotional bonds to the company itself (rather than attachment based on the specific work as- signment), perhaps in order to create overarching goals among differen- tiated subunits. Here there would be a clear technical complementarity with selection mechanisms that screen for values and cultural fit, as is found under the commitment model. Second, these types display cultural resonance and salience within this population and its setting. When we have described these archetypes to Silicon Valley employers, employees, and other knowledgeable parties, they understand the distinctions and frequently begin classifying organizations with which they have experi- ence in these terms.
Furthermore, the five basic types reflect different logics of organizing within other institutions that actors in this organizational field have ex- perienced; indeed, the labels for the types are fairly evocative of the char- acteristics. For instance, the star model-particularly prevalent among firms developing medical technology or pursuing research6-resonates
6 Among SPEC firms in the medical technology or research sectors (including bio-
technology), 42.3% were founded along star model lines, compared to only 1.6% of firms in other industry sectors.
968
Labor Pains
closely with the model that underlies academic science, from which many of the founders and key scientific personnel sought for these start-ups are recruited. The commitment model draws instead on familial imagery and the revered legend of Hewlett-Packard within Silicon Valley. The engi- neering model resonates with the socialization that engineers receive in professional school and suits the Valley's highly mobile labor force. The bureaucratic model is readily familiar from encounters with bureaucracies in numerous contexts. Finally, the austere, no-nonsense autocracy model communicates a powerful and consistent message that employees certainly have encountered elsewhere before: "You work [for me, the boss], you get paid [by me]-nothing more, nothing less." We make no claim that these basic model types are generic, or even generalizable outside this popu- lation of organizations. Rather, we simply claim that these basic model types capture blueprints for organizing that have a systemic quality and display cultural resonance within this setting.
A significant number of companies differed from one (and only one) of the basic model types on only one dimension. We will refer to these as near-model types. For instance, about 3% of founders envisioned basing attachment on love, selecting based on fit, and utilizing direct control. This combination represents a near-commitment blueprint: it differs from the basic commitment model firm in terms of control (only), and differs substantially (i.e., on two or more dimensions) from the other four model types. Such an organization suggests an autocratic cult variant on the commitment model. Finally, we will use the terms aberrant or nontype to refer to all other blueprints-firms in which the blueprint either (1) differs from two or more basic model types on one dimension (and does not fall into any of the basic types) or (2) differs along two or more dimensions from every basic model type.
Methodological concerns.-This effort to characterize the organiza- tional blueprints of entrepreneurs raises a host of conceptual and meth- odological issues (see Baron, Hannan, and Burton 1999b). Here we touch briefly on several concerns. First, our coding effort and our conceptual- ization of organizational blueprints sought to measure the premises of founders and CEOs. Blueprints might or might not bear a relationship to organizational reality (for some evidence that they do in this sample, see Baron et al. 1996). In classifying firms on the three dimensions, we took pains to rely not on what respondents claimed they were actually doing, but instead on what they recounted about their underlying organ- izational model or conception.
Second, founders might have selectively reconstructed the past. Al- though we cannot definitively rule out retrospection bias, some previous results provide reassurance on this score. For instance, Baron et al. (1999a) reported that the founder's initial organizational blueprint is strongly and
969
American Journal of Sociology
systematically related to an objective, independent measure of present- day managerial and administrative intensity-suggesting that the bur- eaucratization process was path dependent-whereas the current CEO's blueprint was unrelated to present-day administrative intensity. If re- spondents were selectively tailoring their stories to match or rationalize reality, then the responses of present-day CEOs should do a better job of predicting present-day organizational arrangements than do founders' recollection of their organization-building premises at the start-up phase. Furthermore, some founders acknowledged during interviews that their original models were naive or ill conceived. Their ability and willingness to be self-critical suggests that they were not simply reporting ex post a self-serving conception tailored to actual developments. On the other hand, given the retrospective nature of founders' accounts and other lim- itations of the available data, our findings and inferences regarding the effect of changing organizational models should be treated as suggestive, not definitive.
Third, we cannot tell for sure when employment models changed (if they did), and hence causality could run in the other direction: firms experiencing higher turnover might change their employment models in an effort to stem that turnover. Though we cannot rule out this competing account, several important pieces of evidence argue against it, as we discuss below.
As noted above, previous research on the SPEC firms has documented that founders' initial organizational blueprints shaped not only the evo- lution of human resource practices and the HR function, but numerous other facets of organizational evolution as well. The fact that founders' models predict how firms develop over time provides some evidence of the validity of the typology of basic employment models. We can also assess whether the taxonomy captures real and meaningful distinctions in founders' organization-building templates by examining whether model change disrupts the enterprise, as manifested in increased turnover.
HYPOTHESES
Effects of Organizational Model and Model Change on Turnover
It is important to distinguish between two potentially competing effects of changing the organizational model on turnover. The first concerns what Barnett and Carroll (1995) call the process effects of change: the disruptive and destabilizing effects of altering deeply embedded organizational prem- ises. If our basic model types in fact capture distinctive systems or recipes for organizing, then efforts to change the founder's initial employment model should be disruptive. We therefore predict
970
Labor Pains
HYPOTHESIS 1.-The more that an organization's blueprint or model has changed from what the founder initially envisioned, the higher the rate of employee turnover.7
Barnett and Carroll argue, however, that analysts can gain more precise and informative results by also taking account of a second set of effects associated with organizational change-which they term content ef- fects-which reflect the potential improvement in consistency (and, pre- sumably, a concomitant decline in labor force turnover) from abandoning an initial model that was incoherent and relatively unfamiliar. (For re- views of the evidence on these two types of effects of organizational change, see Barnett and Carroll [1995] and Carroll and Hannan [2000], chap. 16). In our context, this implies that the potentially disruptive effects of model change might depend on an interaction between origins (the particular blueprint initially espoused by the founder) and destinations (the new blueprint). Altering deeply embedded organizational premises is likely to be most disruptive for firms that began with a coherent blueprint (i.e., one of the five basic model types). Changing the model should be less disruptive for firms that began with an aberrant blueprint. In par- ticular, for moves from a nontype blueprint to one of the five basic model types, the disruptive effects of change might be more than offset by en- hanced consistency of premises governing employment relations, serving to dampen turnover. Conversely, moves from one aberrant model to an- other presumably engender little or no improvement in consistency to offset the disruptive effects of change, leading us to expect that such transitions provoke particularly high turnover.
HYPOTHESIS la.-Changing the employment model increases turnover most in organizations that began with one of the basic employment models and least in organizations that began with an aberrant (nontype) blueprint.
HYPOTHESIS lb.-The effect of model change on turnover is larger (smaller)for transitions that increase (decrease) afirm's distance from one of the basic employment models.
Some transitions among basic model types are likely to be more dis- ruptive than others. We expect that abandoning the commitment and star models is particularly destabilizing, especially when the transition is to a bureaucratic model. Firms founded along commitment or star lines are more likely to bring in a nonfounder CEO and to do so sooner (Hannan et al. 1996). Hannan et al. speculate that these two models most strongly implicate the founders in implicit contracts with early employees: in star firms, star employees are often recruited to the enterprise by a prior per- sonal connection to the founder(s); in commitment firms, the founder
'All hypotheses assume that all other relevant determinants of turnover are held constant (i.e., ceteris paribus assumptions apply).
971
American Journal of Sociology
represents the central figure in the clan. In contrast, the engineering model seems to represent the Silicon Valley default (Saxenian 1994) and to have an affinity with bureaucratic culture (Shenhav 1995), suggesting that the engineering blueprint might be easier both to reach and to abandon (es- pecially if it is being abandoned for bureaucracy) than other models. Accordingly, we predict:
HYPOTHESIS Ic.-Abandoning the commitment or star model is more disruptive than abandoning the engineering model, especially for transi- tions to the bureaucratic model.
Among companies that retained their employment blueprint over time, it seems reasonable to expect turnover to be particularly low in firms that adhered to a commitment model. Conversely, as firms age, grow, and become more complex, retaining star or autocracy models might prove increasingly contentious-in the former case, due to tension between the early stars and the rest of the organization, with whom they are increas- ingly interdependent; in the latter case, because autocratic control appears increasingly capricious and untenable as enterprises become larger, more complex, and more differentiated. Hence, we would expect to see higher turnover among firms that have retained a star or autocracy model throughout their existence.
We do not advance predictions about the main effect of founder's em- ployment model on turnover. Gross differences in turnover as a function of founder's employment model might reflect the fact that some blueprints are inherently less stable (i.e., less likely to persist over time) than others. As we shall see below, turnover rates differ significantly among founders' employment models, even after we control for an extensive array of or- ganizational and environmental characteristics. However, the pattern is subtle and, in some ways, counterintuitive; it reflects differences in the persistence of the various model types as well as their underlying turnover propensities. Therefore, rather than offering specific hypotheses, we un- ravel the issue empirically below. To capture both the process and content effects of organizational change, we examine the effects of changing the organizational blueprint per se, supplemented with more fine-grained analyses of how turnover varies as a function of stability and change in founder's model (i.e., taking into account both the origin and destination blueprint).
THE DISRUPTIVE NATURE OF TURNOVER
Ecological perspectives imply that the turnover occasioned by altering the premises on which an organization was built should be disruptive. If this disruption reflects changes in skills, values, working relationships,
972
Labor Pains
and routines associated with a change in the organizational blueprint, there is a clear implication for the observed pattern of turnover:
HYPOTHESIS 2.-The turnover associated with change in an organi- zation's employment model is concentrated disproportionately among high-tenure employees.
Note that there is a plausible alternative hypothesis.8 A distinctive and coherent blueprint helps organizations create and sustain a reputation in the labor market (Baron and Kreps 1999, chap. 3). Employees who con- sider joining a firm that has a history of espousing a particular model are likely to have a good sense of what they will encounter. If that model subsequently changes, however, it presumably takes some time before this change gets recognized widely within the labor market, especially if the new model lacks consistency and distinctiveness. Hence, employees who
join a firm following a change in its model might be more likely to be mismatched to the organization and therefore to depart promptly. Ac- cording to this argument, changing the model prompts higher turnover among recently hired personnel who come to conclude that they do not fit the organization. If this story has merit, then we would expect that turnover in firms that have changed their employment models gets con- centrated among a mismatched new guard, rather than among a disen- chanted old guard.
Another implication of the ecological perspective is that employee turn- over should adversely affect organizational performance (at least in the short run), particularly in young, knowledge-intensive, technology com-
panies. To be sure, turnover can have beneficial organizational conse- quences, including enhanced innovation and adaptability (Pfeffer 1983). And numerous observers of Silicon Valley (e.g., Saxenian 1994) have em- phasized the beneficial effects of abundant labor mobility in fostering innovation and entrepreneurial opportunity. But the alleged benefits of turnover usually pertain to the industry or regional level, rather than to individual firms. Moreover, the assertion that turnover on balance proves beneficial seems somewhat at odds with the lengths to which many Silicon Valley start-up firms go in trying to bind employees (e.g., stock options, noncompete agreements, extensive benefits) and the frequency with which we heard senior executives in these companies fret about turnover as "a
problem." Accordingly, we also predict that: HYPOTHESIS 3.-Employee turnover has a negative effect on organi-
zational performance.
8 We are indebted to Craig Olson for stimulating our thinking on this point.
973
American Journal of Sociology
OTHER DETERMINANTS OF TURNOVER
Other factors must be controlled in assessing the net effect of change in organizational blueprints on turnover. In particular, CEO succession prompts change in start-up companies. Organizational researchers have demonstrated that changes in top management regimes can have powerful effects on employee turnover (Friedman and Saul 1991; Kesner and Dalton 1994; Virany, Tushman, and Romanelli 1992), although past studies have focused almost exclusively on turnover among top management teams within large corporations. CEO succession likely has broader effects on employee turnover within the companies that we examine, in which the CEO (and particularly the initial founder-CEO) typically is the architect of strategy, the chief spokesperson of the organization's culture, and often the catalyst for recruiting key scientific, technical, marketing, and sales personnel into the venture in the first place. Hence, the departure of the organization's leader likely disrupts goals, values, routines, social rela- tionships, and implicit contracts regarding the nature of employment. Not surprisingly, organizational models change more frequently among SPEC companies that have changed CEOs,9 so it is important to ensure that any observed effects of model change do not simply reflect CEO change.
Although these relatively small, young, high-technology companies might be more dependent on their founders and leaders than other types of organizations, there are ways in which founders can institutionalize their conception of the organization's employment model so that it per- sists, even after they depart. In particular, we expect that the longer an organization's initial leadership regime has been in place, the lower the subsequent rate of turnover. This prediction is relatively straightforward for companies still led by the initial regime: the longer the regime has been in place, the more likely it is to have institutionalized a distinctive organizational blueprint and screened out employees who do not fit that blueprint. But the duration of the initial regime might influence turnover even after that regime has ended. This is because longer-lived founding regimes will have been better able to establish and institutionalize a co- herent organizational model and supporting culture that enables the en- terprise to attract and retain employees who suit that setting.?1
Our analyses hold constant the cumulative number of CEOs a firm has
9 Among firms in which a founder was still CEO, 64.3% were coded as not having changed on any of the three dimensions of the employment blueprint; among firms whose CEO in 1994-95 was not a founder, the corresponding figure was 23.6%.
O1 In supplementary analyses, we examined whether any effects of CEO succession on turnover depend on the tenure of the outgoing CEO and/or characteristics of the incoming CEO, such as whether he/she was promoted from within and, if so, was a member of the founding team. However, we did not detect any systematic interaction effects.
974
Labor Pains
had at a given point in time. One might imagine that leadership changes have cumulative disruptive effects, so that turnover increases with the number of CEOs an organization has had over a given interval of time, controlling for when the last succession event occurred. Alternatively, organizations might become habituated to executive succession, so that the first regime change produces considerably more disruption than do subsequent ones.1' Given these competing predictions, we do not offer a specific directional hypothesis.
We control for two key milestone events: procuring venture capital and making an initial public offering (IPO) of stock. These events might have opposing effects on employee turnover, insofar as they generally involve an infusion of resources into the organization while also bringing about significant changes in organizational arrangements, routines, and (in many cases) leadership. In supplementary analyses, we also include controls for industry, occupational composition, and the gender mix in the firm's first year of operations to capture variations in the mix of jobs and workers across SPEC companies.
Organizational size, growth, and age also may influence labor force turnover. Turnover is likely to be higher in rapidly growing firms for various reasons: (1) rapid growth often strains an organization and its members; (2) organizations that must scale up their workforce rapidly are more likely to make hiring errors, resulting in short-lived appointments that are reflected in high turnover; and (3) if organizational growth is correlated with economic growth in Silicon Valley generally (e.g., semi- conductor firms are expanding because the cyclical semiconductor in- dustry has rebounded), firms might face more labor market competition during periods of rapid growth.
As organizations mature, they systematize employment relations and presumably become better informed about the needs and desires of their employees. Consequently, it seems reasonable to expect that turnover rates will decline with organizational age. Furthermore, older firms seem less likely going forward to face the need for major changes in employment relationships and employment levels (of the sort that would produce high turnover) than firms that are still in their infancy. Nonetheless, we predict that turnover actually increases with organizational age in our sample. First, growing routinization and bureaucratization as firms age might
1 The same negative relationship between cumulative number of CEOs and turnover could obtain if early generations of leaders confront more fundamental sources of uncertainty that could influence strategy or if the actions of early leaders constrain the options of subsequent leaders. For instance, it seems easier to imagine the first CEO of a firm needing to completely reformulate the firm's strategy or shrink the firm's workforce by 50% than it is to envision the fifth CEO of a firm facing those same challenges.
975
American Journal of Sociology
impede adaptation to rapidly changing environments (as suggested by stories of senescence and obsolescence-see Hannan 1998) and encourage employees to migrate to firms that appear better suited to current con- ditions. Second, the relevant technical labor force has a renowned antip- athy to rigid bureaucracy. Moreover, it is widely believed among Silicon Valley's labor force that superior financial rewards and technical chal- lenges come from getting in on the ground floor of a new enterprise, suggesting that employees might become more likely to depart as their firm ages.
DATA, MEASURES, AND METHODS
Data
We sent a survey to the executive designated by the CEO as having oversight of HR (sometimes, the CEO himself or herself). The survey asked the respondent to provide the firm's annual turnover rate for 1991, 1992, 1993, and 1994. (For firms that were visited in summer or fall of 1994, the survey asked about turnover annualized for the first six months of 1994, rather than the entire year.) A few firms visited in 1995 provided turnover data for the first half of 1995. The survey also requested infor- mation on various facets of the company's HR system and attributes of its workforce, including the current tenure distribution and occupational and gender composition at the end of the first year of operations and at the time of the survey. Of the 173 firms in the study, 101 (59%) returned surveys with usable turnover data. We found no evidence of bias asso- ciated with the pattern of missing data resulting from some firms not returning the HR survey (Baron et al. 1999b, appendix).
Because some independent variables vary over time, we constructed multiple spells for each firm corresponding to the reporting periods for which it provided turnover information (calendar years, except for in- stances in which firms reported turnover for the first half of the year in which they were interviewed). We use pooled cross-section time-series techniques to analyze the data (see below). The data set we analyze con- tains 327 spells for the 101 firms that provided usable turnover data on the HR survey. Of the 101 companies, 8 provided usable information for one turnover spell, 18 for two spells, 17 for three spells, and 58 for four spells.
Measures
Our dependent variable is the square root of the firm's annual turnover rate. We use the square root transformation to normalize what is otherwise
976
Labor Pains
a skewed distribution (for a variable that can take on zero values) and because we suspect that most factors that increase turnover (e.g., age, size) do so at a diminishing rate.12
We measure leadership change with an indicator variable denoting whether a CEO was appointed or left the firm during the spell.13 We also include a measure of the firm's cumulative number of CEOs as of the start of a spell.14 We measure the tenure of the firm's first leadership regime as the tenure of the company's first CEO in the firm, as of the start of the spell.'1 (This is a time-varying covariate because it increments in value over time for firms that have only had one CEO.) By definition, this measure is missing for firms that had yet to designate a CEO as of the start of a spell. (Some Silicon Valley start-ups do not designate a CEO
12 The HR survey requested information on the "annual turnover rate" for specific calendar years. (It was not feasible to gather data on turnover rates by occupation within these companies.) We were concerned that respondents might have varied in how they defined this rate. We followed up by telephone with a sample of respondents, asking how they had defined the turnover rate in filling out the survey. Most respon- dents apparently defined turnover as the fraction of employees present at the beginning of the period who departed by the end of the period, and a number told us that this is how turnover is generally construed by Silicon Valley companies. Variations in how respondents defined turnover should add noise to the data, reducing the likelihood of uncovering significant statistical relationships. Moreover, in supplementary analyses, we estimated the effects of time-varying covariates on turnover in fixed-effects spec- ifications that control for stable characteristics of each firm (including how it defined turnover). The results were largely unchanged, further suggesting that our findings are unlikely to reflect differences in how respondents defined the annual turnover rate. 13 Data on executive succession were obtained from a variety of sources, including interviews with firm informants, business press articles, annual reports, other public documents (e.g., 10K filings), and company web sites. When our data sources indicated that one chief executive departed in a given month and another person began in that role during the following month, we treated this as if there had been no interruption between the two. Due to imprecision in dating the exact founding date of each company, we treated a CEO as having served since the inception of the firm if, according to our data sources, his/her tenure as CEO commenced within three months of the company's founding. (Otherwise, the data record for that company would indicate that it did not have a CEO at the beginning of the spell in question.) In the same vein, because we could not always time venture capital financings or transitions to public status precisely, we treated a company as having had venture capital or being a publicly traded entity as of the start of a given spell if our records indicated that it had received venture capital or went public by the end of the first month within that spell. 14 The key contrast in the data was between firms being led by their first CEO vs. a subsequent CEO; accordingly, we dichotomized this measure. "5 Notice that the measure captures how long the first CEO had been in the firm, not how long he or she had been CEO. This reflects our belief that it is whether the first CEO was part of the founding team and how much of the firm's history he or she witnessed that affects the ability to institutionalize an organizational blueprint that employees will perceive as legitimate, even if the first CEO was not appointed to the top job until some time after joining the company.
977
American Journal of Sociology
until this is required by investors, the exigencies of going public, and the like. This was the case for about 2.5% of the firm-spells in our sample). Consequently, in supplementary analyses, we also created an alternative measure of the duration of the firm's first leadership regime: first-leader tenure within the firm as of the start of a spell, for firms that have had a CEO; or the organization's age at the start of the spell, if the firm had not yet appointed a CEO. We reasoned that the first leadership regime for firms without a CEO involves some sort of shared power arrangement, in place since the firm's inception. The findings were unchanged when we utilized this alternative measure (results available upon request). To simplify the exposition, we report results only from analyses of spells for firms that had had one or more CEOs as of the start of the spell. This has the effect of reducing slightly the number of available cases, thereby raising our burden in detecting significant effects.
We represent founders' organizational models with binary variables corresponding to the typology in table 1. Unless otherwise noted, near- model types (i.e., firms that differed along only one of the three dimensions from one and only one of the five basic types) are grouped with their corresponding types. This potentially mutes some of the contrasts among model categories, but it also increases the number of cases in several categories, thereby providing more statistical power for detecting system- atic differences. We measure the magnitude of change in the organiza- tional model by the number of dimensions (0-3) that changed between the founder's blueprint and the blueprint coded from the responses of the (then-current) CEO. We also report more fine-grained analyses that allow the impact of stability or change in a firm's model to vary as a function of which particular model it started with and/or migrated to.
We control for how long (in years) the firm had received venture capital financing and/or been publicly traded, as of the start of each spell. We transform both variables by taking the square root, because we suspect that the effect of getting venture capital and/or going public on turnover declines sharply with duration, with the major effect capturing the dif- ference between firms that had versus had not experienced these events.
We capture organizational growth by controlling for employment size (in the square root metric) at the end of the year preceding each spell and at the end of the firm's first year of operations.16 Organizational age equals years since founding, as of the start of each spell. Based on information
16 The former measure was obtained from secondary sources (corporate directories, etc.), interpolated between intervals as necessary. Employment at the end of the first year of operations was measured based on the HR survey provided by the company. (For firms that did not provide an HR survey, this variable was imputed statistically from the secondary-source data and other variables related to employment size.)
978
Labor Pains
provided by founders concerning the timing of various events, we defined the founding date to be the earliest of three events: legal incorporation, hiring the first employee, and start of "normal business operations." In supplementary analyses, we also included controls for time (a linear time trend or dummy variables corresponding to the calendar year to which each spell corresponded), but these controls were insignificant and did not alter the pattern of results.
Finally, we represent industry with two dummy variables, one denoting firms engaged in manufacturing and the other denoting firms engaged in research; the omitted category represents firms in computer hardware or software, telecommunications and networking, semiconductors, or med- ical devices and biotechnology. (Other industry contrasts were not sig- nificant.) In various supplementary analyses, we also controlled for the distribution of the firm's employees in the first year across various broad occupational categories (e.g., scientific and engineering; administrative and managerial; clerical; sales) and the proportion of the work force that was female. These did not alter the basic pattern of effects of change in organizational model on turnover; accordingly, their effects are not re- ported here (results available on request).
Estimation
Our data structure is a pooled cross section and time series. The data are unbalanced: the number of observations varies among firms. Recent or- ganizational research typically models such data with fixed-effect esti- mators, which analyze only the within-firm over-time variation. This choice is unappealing in this context because some key independent var- iables (e.g., founders' organizational blueprints and whether the blueprint changed) do not vary over time. Instead, we use robust estimators that analyze both between-firm and within-firm variation. Specifically, we use the method of generalized estimating equations (GEE) developed by Liang and Zeger (1986; also see Zeger and Liang 1986). This approach generalizes quasi-likelihood estimation to the panel context. Like quasi- likelihood, GEE requires specification of only the first and second mo- ments of the distribution of the outcome, rather than the full distribution as is required for maximum likelihood. Under mild regularity conditions, GEE estimators are consistent and asymptotically normal.
The setup we estimate is the following. The outcome is a firm's turnover rate (square root) in a given year. For the ith firm, we have ni observations,
Yi (Yil, Yi2, **. Yini),
and the vector of outcomes can be written as
979
American Journal of Sociology
y = (Yi, Y2, -- , ym) -
The covariates vary over firms and (in some cases) over time for given firms:
X = (xll, x1, ... , XK1 ... ,XKI)I
Xki = (Xkil, Xki2, ... Xkini)
If we represent the disturbances as
Ui = (Uil,Ui2, ... ,Uini)
then we can write the structural model to be estimated as
y = Xb + u.
We expect that the disturbance process will exhibit autocorrelation of the usual panel type: observations for the same firm will tend to be cor- related due to permanent and gradually changing, unobserved firm prop- erties. However, we assume that observations are uncorrelated for dif- ferent firms. In particular, we assume that the covariance matrix of disturbances has the following form:
-A, 0 . . 0
0 A, 0 . 0
E(uu') 0 . 0 . . . . O
0 . 0 A,_
where 4is a scale parameter,
Ai = iaR,
and the matrix R satisfies the properties of a correlation matrix. GEE requires a specification of a working correlation matrix. The implemen- tation we used-the XTGEE routine within version 6.0 of STATA (StataCorp 1999)-allows a menu of choices for the working correlation matrix. We experimented with several, including the classic exchangeable correlation structure from the standard random-effects setup, as well as first- and second-order serial autocorrelation. We found that models fit best when we used a completely unstructured working correlation matrix, in which each off-diagonal entry is unconstrained and estimated from the data. That is, we used as a working correlation matrix:
980
Labor Pains
rl 1 R = r13 r23 1
r14 r24 r34 1
r15 r25 r35 r45 1
where the rows and columns correspond to the calendar years represented in our data set (1991-95).
We conjectured that autocorrelation would decline over time and across waves of panels, because the hazard of major shocks that would coun- teract autocorrelation in the determinants of turnover is likely to increase as firms grow older. Consistent with our conjecture, autocorrelation did decline with the temporal distance between spells and across waves of panels (e.g., there was stronger autocorrelation between 1991 and 1992 observations than between the 1991 and 1993 panels or between the 1992 and 1993 panels), and models permitting this error structure fit consid- erably better than models that impose a more constrained error structure. We report robust standard errors, using the so-called sandwich estimators developed by Huber (1967) and White (1982).
DESCRIPTIVE STATISTICS
Table 2 summarizes the pattern of transitions from founder to CEO mod- els. Among firms that we classified as having a particular model at found- ing, the table reports the fraction that we classified as having each type of organizational model in 1994-95, based on our interviews with CEOs. Row (1) in the table reports results based on classifying the founder's model as aberrant unless it corresponded perfectly to one of the five basic model types in table 1. Row (2) groups near-model-type firms (i.e., those that differed in only one dimension from only one of the five basic types) with their corresponding basic type category. The parenthesized results in table 2 pertain to the entire sample of SPEC firms for which we had the requisite information to code the founder's and CEO's organizational model, whereas the results without parentheses are for the subset of firms providing valid data on employee turnover (and thus used in our analyses).
Table 2 provides descriptive background, but it is substantively infor- mative in several respects. The diagonal entries in table 2 reveal that the commitment and bureaucratic models-which in many respects represent polar extremes-are the most persistent over time (i.e., have the smallest fraction of firms that transitioned to a different model). And, despite the relatively frequent shifts in the sample toward bureaucracy, no firms founded along commitment model lines made that transition. Table 2 also portrays the engineering model as relatively compatible with other or-
981
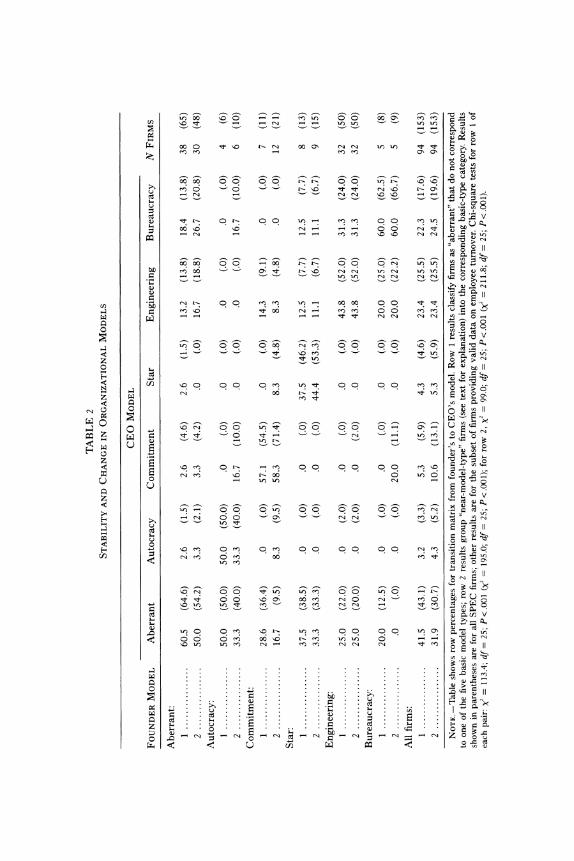
TABLE 2 STABILITY AND CHANGE IN ORGANIZATIONAL MODELS
CEO MODEL
FOUNDER MODEL Aberrant Autocracy Commitment Star Engineering Bureaucracy N FIRMS
Aberrant: 1 ................ 60.5 (64.6) 2 ................ 50.0 (54.2)
Autocracy:
2.6 (1.5) 2.6 (4.6) 3.3 (2.1) 3.3 (4.2)
2.6 (1.5) 13.2 (13.8) 18.4 (13.8) 38 (65) .0 (.0) 16.7 (18.8) 26.7 (20.8) 30 (48)
................ 50.0 (50.0) 50.0 (50.0) .0 (.0) .0 (.0) .0 (.0) 2 ................ 33.3 (40.0) 33.3 (40.0) 16.7 (10.0) .0 (.0) .0 (.0)
Commitment: 1................ 28.6 (36.4) .0 (.0) 57.1 (54.5) .0 (.0) 14.3 (9.1) 2 ................ 16.7 (9.5) 8.3 (9.5) 58.3 (71.4) 8.3 (4.8) 8.3 (4.8)
Star: 1 ................ 37.5 (38.5) 2 ................ 33.3 (33.3)
Engineering: 1 ................ 25.0 (22.0) 2 ................ 25.0 (20.0)
Bureaucracy: 1 ................ 20.0 (12.5) 2 ................ .0 (.0)
.0 (.0) 16.7 (10.0)
4 (6) 6 (10)
.0 (.0) 7 (11)
.0 (.0) 12 (21)
.0 (.0) .0 (.0) 37.5 (46.2) 12.5 (7.7) 12.5 (7.7)
.0 (.0) .0 (.0) 44.4 (53.3) 11.1 (6.7) 11.1 (6.7) 8 (13) 9 (15)
.0 (2.0) .0 (.0) .0 (.0) 43.8 (52.0) 31.3 (24.0) 32 (50)
.0 (2.0) .0 (2.0) .0 (.0) 43.8 (52.0) 31.3 (24.0) 32 (50)
.0 (.0) .0 (.0)
.0 (.0) 20.0 (11.1) .0 (.0) 20.0 (25.0) 60.0 (62.5) .0 (.0) 20.0 (22.2) 60.0 (66.7)
5 (8) 5 (9)
All firms: 1 ................ 41.5 (43.1) 3.2 (3.3) 5.3 (5.9) 4.3 (4.6) 23.4 (25.5) 22.3 (17.6) 94 (153) 2 ................ 31.9 (30.7) 4.3 (5.2) 10.6 (13.1) 5.3 (5.9) 23.4 (25.5) 24.5 (19.6) 94 (153)
NOTE.-Table shows row percentages for transition matrix from founder's to CEO's model. Row 1 results classify firms as "aberrant" that do not correspond to one of the five basic model types; row 2 results group "near-model-type" firms (see text for explanation) into the corresponding basic-type category. Results shown in parentheses are for all SPEC firms; other results are for the subset of firms providing valid data on employee turnover. Chi-square tests for row 1 of each pair: X2 = 113.4; df = 25; P<.001 (X2 = 195.0; df = 25; P<.001); for row 2, x2 = 99.0; df = 25; P<.001 (X2 = 211.8; df= 25; P<.001).
Labor Pains
ganizational models: a relatively high fraction of firms founded along engineering model lines transitioned to a bureaucratic model (and vice versa), and the engineering model seems to be a destination that is reached with some frequency by firms irrespective of their founding model (except for firms founded as autocracies). As we shall see below (table 5), the transitions that occur with relatively low (high) frequency in table 2 are generally the transitions that occasion relatively more (less) employee turn- over. In other words, firms seem less likely to have made the most "turn- over-prone" transitions than to undertake the less turnover-prone ones. This gives us some confidence that the model types capture distinct or- ganizational blueprints and suggests that the architects and leaders of firms are mindful of the disruptive consequences of changing organiza- tional blueprints.
Table 3 reports descriptive statistics for all 327 spells containing valid turnover data. The annual turnover rate averages approximately 13%, though there is obviously substantial variation. (Though not reported in table 3, among the 93 firms with two or more turnover spells, 54.9% of the variation in turnover is between firms; for the square root of turnover, the corresponding figure is 62.6%.) Note that modest differences in turn- over, if sustained over time, can have quite dramatic implications for organizations. For instance, according to table 3, firms in the sample were on average about 4.5 years old at the start of a spell.17 Consider the cumulative effect of being one standard deviation above the sample mean on turnover (26% vs. 13%). If annual turnover remained constant at 13% for a cohort over time, then after four years, 57% of the original cohort would remain; after six years, the fraction is 43%. In a firm experiencing 26% turnover, just under 30% of the original employees would still be there after four years, and only 16% after six years. (The picture does not change much if we incorporate more reasonable assumptions about turn- over declining with tenure.) Such differences in the representation of the old guard seem likely to have significant organizational implications.
A change in top leadership occurred during 11.6% of the spells. In about 2.5% of the spells, firms had not yet appointed a CEO; for nearly
17 Note that the minimum organizational age reported in table 3 is -0.42%. For a few cases (just under 4% of spells), the birth of the organization (based on our criteria for defining age-see text) occurred sometime during the spell. To be treated as a valid observation and included in our sample, a firm must have existed for more than half the year to which the turnover data corresponded, and the company had to have provided turnover information for the year in question. This was done to avoid cases in which, for instance, a firm might have reported turnover data for 1991 but our measure of organizational age indicated that the firm came into existence in November or December of 1991, so the firm's turnover report pertained to an extremely short period and thus was error-prone.
983
TABLE 3 DESCRIPTIVE STATISTICS
Variable Mean Median SD Min Max N spells N firms
Turnover rate: During annual spell ............................. 13.23 During annual spell (square root) .............. 3.16
Employment: Start of spell (FTEs, square root) .............. 8.39 End of year 1 (FTEs, square root) ............ 4.77
Duration of first leadership (years) ............... 3.67 Duration of first CEO (years) ..................... 3.77 Change in CEO during spell ...................... .12 No CEO at start of spell .......................... .02 2 + CEOs as of start of spell ....................... .25 Cumulative N of CEOs as of start of spell ...... 1.36 Duration of VC funding (years, square root) .... 1.15 Duration of public status (years, square root) ... .23 Age at start of spell (years) ........................ 4.50 Founder's model:*
Commitment ..................................... .13 Star .........................................11 Engineering ...................................... .34 A utocracy ......................................... .07 H ybrid ............................. ............. .30 Bureaucracy ...................................... .06
10.00 12.94 3.16 1.80
6.32 4.12 3.00 3.00
.00
.00
.00 1.00 1.22 .00
4.25
.00 100.00 327
.00 10.00 327
6.53 .00 3.83 1.00 2.66 -.09 2.64 .08
.00
.00
.00 .84 .00
1.04 .00 .56 .00
2.99 -.42
.00
.00
.00
.00
.00
.00
40.74 314 25.17 315 12.50 314 12.50 306 1.00 327 1.00 327 1.00 327 6.00 327 3.30 327 2.77 327
13.91 327
.00 1.00 302
.00 1.00 302
.00 1.00 302
.00 1.00 302
.00 1.00 302
.00 1.00 302
101 101
95 95 88 83
101 101 101 101 101 101 101
93 93 93 93 93 93
CEO's vs. founder's model: N dimensions changed .......................... .84 1.00 .87 .00 3.00 302 93
Industry: Research ........................................ .02 .00 .00 1.00 327 101
Manufacturing ................................... .04 .00 .00 1.00 327 101
Computer hardware/software .................. .44 .00 .00 1.00 327 101
Telecommunications/networking ............... .20 .00 .00 1.00 327 101 Medical devices or biotech ..................... .18 .00 .00 1.00 327 101 Semiconductors .................................. .11 .00 .00 1.00 327 101
Proportion employees, end of year 1, in: Science/engineering roles ........................ .37 .42 .23 .00 .78 263 77 Sales roles ........................................ .08 .05 .10 .00 .43 259 76 Clerical roles ..................................... .04 .00 .06 .00 .29 259 76 Administrative/senior management roles ...... .40 .33 .23 .09 1.00 260 76
<D Proportion female, end of year 1 ................. .24 .22 .15 .00 .64 265 78 00 cIt NOTE.- SDs are not shown for binary variables.
* "Near-type" firms grouped with corresponding "pure type" firms in each category (see text for explanation).
American Journal of Sociology
a quarter of the spells, the firm had already experienced two or more CEOs as of the start of the spell.
Among founders, the engineering model was the most prevalent (34%). We coded roughly 7% of the founders as having an autocratic model, 13% as commitment, 11% as star, and just under 6% as bureaucratic.18 Thirty percent of founders gave responses that did not fit into any basic model type (or one of the near-types); we coded their blueprints as aberrant or nontype. The typical firm in our sample experienced change in its organizational model along one dimension, based on our classification of the blueprints associated with CEOs at the time of our interviews versus the models envisioned by founders. (For 44.1% of the firms and 42.4% of the spells, the founder and CEO models were identical on all three dimensions.) Not surprisingly, model changes were more frequent and extensive in firms that had also changed leadership. Among companies with valid employee turnover data, 44% were still led by a founder in 1994-95; of those, 57% were coded as not having changed the blueprint on any dimension and only 12% had changed on two or more dimensions. Among companies with a nonfounder CEO by 1994-95, only 23% had not changed the model on any of the three dimensions, whereas 40% changed on two or more dimensions.
RESULTS
Effects of Organizational Model and Change in Model on Turnover
Table 4 reports results from multivariate analyses predicting the square root of turnover for each firm-year spell. In a simple bivariate regression (not shown in table 4), the gross effect of blueprint change (number of dimensions that differed between the founder's and CEO's blueprints) is 0.660 (z = 5.084, P < .001). Thus, relative to firms with stable employment blueprints, a firm in which the blueprint changed on all three dimensions is predicted to have a turnover rate that is (3 x .660)2 = 3.92 points higher.19 This strong positive effect persists after controlling for other determinants of turnover. Model 1 in table 4, for instance, adds dummy variables depicting the founder's blueprint (with bureaucracy as the omit- ted category). Unexpectedly, firms founded on a bureaucracy model have lower turnover rates than firms founded on different blueprints, and that
18 These percentages are based on combining "near-type" cases with their model-type counterparts. For "basic model type" firms alone, autocracy is 4.3%, commitment is 6.3%; star is 9.3%; engineering is 33.8%, and bureaucracy is 5.6%. 19 This bivariate regression (based on 302 observations, 93 firms) has a constant of 2.594 (z = 14.440, P<.001); scale perameter = 2.863; Wald X2 = 25.85 (df = 1, P< .00 1).
986
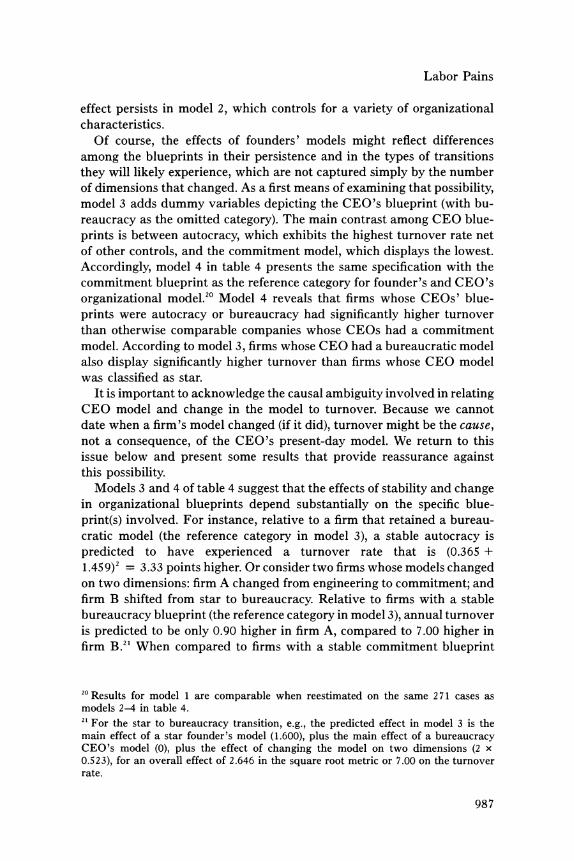
Labor Pains
effect persists in model 2, which controls for a variety of organizational characteristics.
Of course, the effects of founders' models might reflect differences among the blueprints in their persistence and in the types of transitions they will likely experience, which are not captured simply by the number of dimensions that changed. As a first means of examining that possibility, model 3 adds dummy variables depicting the CEO's blueprint (with bu- reaucracy as the omitted category). The main contrast among CEO blue- prints is between autocracy, which exhibits the highest turnover rate net of other controls, and the commitment model, which displays the lowest. Accordingly, model 4 in table 4 presents the same specification with the commitment blueprint as the reference category for founder's and CEO's organizational model.20 Model 4 reveals that firms whose CEOs' blue- prints were autocracy or bureaucracy had significantly higher turnover than otherwise comparable companies whose CEOs had a commitment model. According to model 3, firms whose CEO had a bureaucratic model also display significantly higher turnover than firms whose CEO model was classified as star.
It is important to acknowledge the causal ambiguity involved in relating CEO model and change in the model to turnover. Because we cannot date when a firm's model changed (if it did), turnover might be the cause, not a consequence, of the CEO's present-day model. We return to this issue below and present some results that provide reassurance against this possibility.
Models 3 and 4 of table 4 suggest that the effects of stability and change in organizational blueprints depend substantially on the specific blue- print(s) involved. For instance, relative to a firm that retained a bureau- cratic model (the reference category in model 3), a stable autocracy is predicted to have experienced a turnover rate that is (0.365 + 1.459)2 = 3.33 points higher. Or consider two firms whose models changed on two dimensions: firm A changed from engineering to commitment; and firm B shifted from star to bureaucracy. Relative to firms with a stable bureaucracy blueprint (the reference category in model 3), annual turnover is predicted to be only 0.90 higher in firm A, compared to 7.00 higher in firm B.21 When compared to firms with a stable commitment blueprint
20 Results for model 1 are comparable when reestimated on the same 271 cases as models 2-4 in table 4. 21 For the star to bureaucracy transition, e.g., the predicted effect in model 3 is the main effect of a star founder's model (1.600), plus the main effect of a bureaucracy CEO's model (0), plus the effect of changing the model on two dimensions (2 x 0.523), for an overall effect of 2.646 in the square root metric or 7.00 on the turnover rate.
987
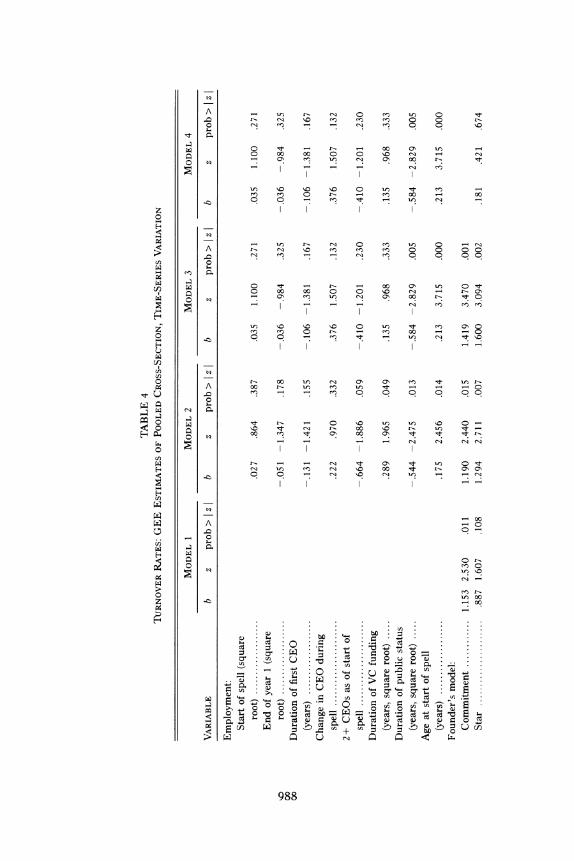
TABLE 4 TURNOVER RATES: GEE ESTIMATES OF POOLED CROSS-SECTION, TIME-SERIES VARIATION
MODEL 1 MODEL 2 MODEL 3 MODEL 4
VARIABLE b z prob > I z b z prob > I z b z prob > I z I b z prob > I z I
Employment: Start of spell (square
root) ................... End of year 1 (square
co root) ................... oo Duration of first CEO
(years) ................... Change in CEO during
spell ...................... 2+ CEOs as of start of
spell ...................... Duration of VC funding
(years, square root) ..... Duration of public status
(years, square root) ..... Age at start of spell
(years) ................... Founder's model:
Commitment ............ 1.153 2.530 .011 Star ...................... .887 1.607 .108
.027 .864 .387
-.051 -1.347 .178
-.131 -1.421 .155
.222 .970 .332
-.664 -1.886 .059
.289 1.965 .049
-.544 -2.475 .013
.175 2.456 .014
1.190 2.440 .015 1.294 2.711 .007
.035 1.100 .271
-.036 -.984 .325
-.106 -1.381 .167
.376 1.507 .132
-.410 -1.201 .230
.135 .968 .333
-.584 -2.829 .005
.213 3.715 .000
1.419 3.470 .001 1.600 3.094 .002
.035 1.100 .271
-.036 -.984 .325
-.106 -1.381 .167
.376 1.507 .132
-.410 -1.201 .230
.135 .968 .333
-.584 -2.829 .005
.213 3.715 .000
.181 .421 .674
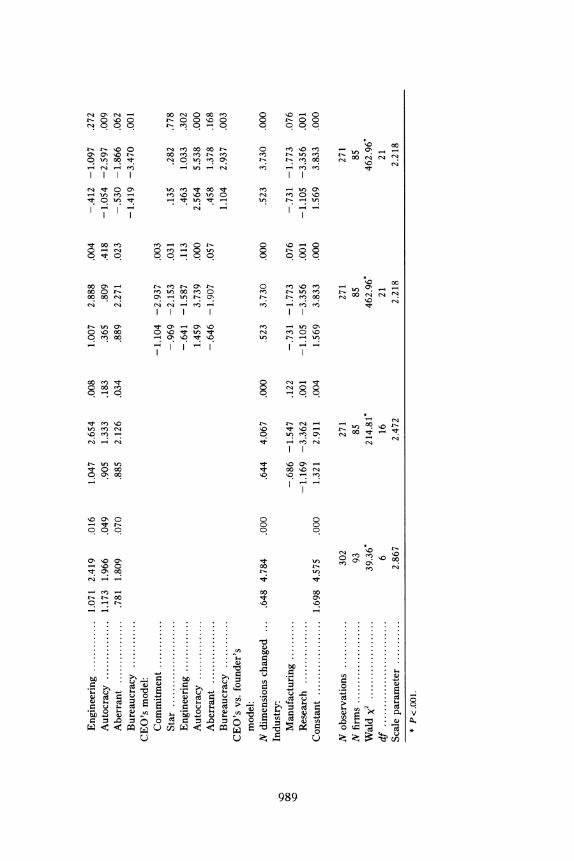
Engineering ............ 1.071 2.419 .016 Autocracy . ............ 1.173 1.966 .049 Aberrant ................ .781 1.809 .070 Bureaucracy ............
CEO's model: Commitment ............ Star ...................... Engineering ............. Autocracy ............... Aberrant ................ Bureaucracy ............
CEO's vs. founder's model:
N dimensions changed ... .648 4.784 .000 Industry:
Manufacturing .......... Research ................
Constant ................... 1.698 4.575 .000
'o 00 ~O
1.047 2.654 .008
.905 1.333 .183
.885 2.126 .034
1.007 2.888 .004 .365 .809 .418 .889 2.271 .023
-1.104 -2.937 .003 -.969 -2.153 .031 -.641 -1.587 .113
1.459 3.739 .000 -.646 -1.907 .057
.644 4.067 .000 .523 3.730 .000
-.686 -1.547 .122 -.731 -1.773 .076
-1.169 -3.362 .001 -1.105 -3.356 .001 1.321 2.911 .004 1.569 3.833 .000
-.412 -1.097 .272
-1.054 -2.597 .009 -.530 -1.866 .062
-1.419 -3.470 .001
.135 .282 .778
.463 1.033 .302 2.564 5.538 .000
.458 1.378 .168 1.104 2.937 .003
.523 3.730 .000
-.731 -1.773 .076 -1.105 -3.356 .001
1.569 3.833 .000
N observations ............ N firms ..................... Wald x2 .................... d f ........................... Scale parameter ...........
* P<.001.
302 93
39.36* 6
2.867
271 85
214.81* 16
2.472
271 85
462.96* 21
2.218
271 85
462.96* 21
2.218
American Journal of Sociology
(the reference category in model 4), firm B is predicted to have an annual turnover rate that is 5.43 higher, whereas firm A's is only 1.51 higher.
Changing the Organizational Model: A Closer Look
The additive specification in table 4 potentially masks interactive effects of origins and destinations in determining the disruptive effects of chang- ing the organizational blueprint. To differentiate between the process and content effects of organizational change, table 5 provides a finer-grained portrait of how turnover varies as a function of stability and change in founders' employment blueprints. It reports estimates of specifications that incorporate the same set of covariates as in model 2 of table 4, but we replace the covariates representing founders' blueprints and the num- ber of dimensions that changed with a vector of dummy variables rep- resenting specific combinations of founder and CEO blueprints. The par- ticular combinations of origin and destination states incorporated in table 5 capture the main contrasts that we thought interesting (how close to one of the five basic model types; distance between origin and destination model; and so forth) and the main transitions observed in our data. (For several transitions of particular substantive interest, the number of cases was very small, but we have nonetheless reported the detailed results.) The coefficients in table 5 represent predicted differences in turnover (square-root metric) between firms that experienced a given transition and two different reference categories: stable bureaucracies (the first set of coefficients in table 5); or all firms that did not change their employment blueprint (the second set of coefficients). Table 6 reports significance tests on contrasts between specific coefficients (rows) in table 5, rather than contrasts vis-a-vis the reference categories.
Table 5 suggests two basic conclusions. First, abandoning a basic model type was generally associated with higher turnover, in support of hy- pothesis la (but see below). Consistent with hypothesis lc, the disruptive effect of abandoning a basic model type in favor of an aberrant blueprint seems especially large for firms founded along commitment or star lines (see comparison in table 6 between rows 7 and 8).22 Second, consistent with hypothesis lb, changing to a basic model type was less disruptive than moving to an aberrant blueprint. For instance, among firms that abandoned the commitment or star model, those migrating to the engi- neering model had somewhat lower turnover than those adopting an
22 Even moving to the engineering model (a model that seems robust and flexible) from the commitment or star model seems slightly more disruptive than migrating to the engineering blueprint from any other pure model (cf. rows 12 and 13), though table 6 reveals that the contrast is not significant (P = .15).
990
Labor Pains
aberrant blueprint (see comparison in table 6 between rows 7 and 12; P = .097, two-tailed).23
The bureaucracy and autocracy models do not fit this pattern, however. Generally, moving to either of them increased turnover, whereas aban- doning either of them reduced turnover. Moving from any other basic model to bureaucracy increased turnover considerably, though the ap- parent dislocation was considerably smaller among firms that migrated to bureaucracy from the engineering model (cf. rows 10 and 11), consistent with the claimed compatibility between engineering culture and bureau- cratic culture. This result illustrates that origins and destinations matter: movement to bureaucracy from either the engineering model or an ab- errant blueprint produced significantly less turnover than did abandonment of another basic model (especially the star type) for bu- reaucracy (row 11). Similarly, in one case abandoning a basic model seems to have reduced turnover: movement from bureaucracy to engineering (row 13).
These findings suggest that, in at least some cases, the disruptive effects associated with altering an organization's employment model are more than offset by an increase in the attractiveness of the new model. In short, the content of organizational changes affects how disruptive they are. Dismantling the commitment and star models apparently was most de- stabilizing, whereas any disruptive effects associated with dismantling bureaucracy seem to have been more than offset by favorable responses to the change, resulting in lower turnover. Conversely, in shifts to bu- reaucracy or autocracy, the virtues of a clear and consistent model as a destination state were offset considerably by employees' apparent strong dislike for these particular models.
Another result in table 5 suggests that the basic model types represent relatively desirable origin and destination states, in terms of minimizing labor turnover: companies that replaced one aberrant or nontype blueprint with another experienced especially high turnover (row 9). Only firms that retained or adopted autocracy or that migrated to bureaucracy from an- other basic model other than engineering had higher predicted turnover levels (cf. rows 14, 15, 15a, and 15b).
In other words, if a founder adopted an aberrant HR model, then changing to another aberrant model made the organization especially vulnerable to turnover. The contrasts among these effects are not highly significant, however, for several reasons. First, the transition from an
23 All firms that migrated to bureaucracy from a model type other than engineering were founded along star-model lines (see row 11). This transition was characterized by particularly high turnover, because abandoning the star model and migrating to bureaucracy both seem to be destabilizing for technology companies.
991
TABLE 5 EFFECTS ON TURNOVER OF STABILITY AND CHANGE IN FOUNDER'S EMPLOYMENT MODELS
REFERENCE CATEGORY
Stable Bureaucracy All Stable Firms
Row (FOUNDER'S MODEL) => (CEO'S MODEL) N SPELLS N FIRMS Coefficient z prob > z | Coefficient z prob > | z I
1 ...... Stable autocracy 2 ...... Stable commitment 3 ...... Stable star 4 ...... Stable engineering 5 ...... Stable near-type model* 6 ...... Stable aberrant (nontype) model 7 ...... (Commitment or star) = aberrant 8 ...... (Basic model other than commitment or
star) = aberrant 9 ...... (Aberrant or near-type) = (different aber-
rant or near-type) 10 .... (Engineering or aberrant) =* bureaucracy 11 .... (Basic model other than engineering)
bureaucracy*
4 2 2.151 2.571 .010 11 4 .630 .826 .409 10 3 1.053 2.108 .035 36 10 .463 .826 .409 12 3 .232 .398 .691 27 9 -.202 -.444 .657 14 5 2.061 3.828 .000
33 10 .943 1.501 .133
30 8 2.077 3.094 .002 50 16 1.345 2.971 .003
3 2.551 5.260 .000
1.196 2.903 .004
.302 .632 .527
1.198 2.114 .034 .651 1.740 .082
1.739 4.516 .000
12 .... (Commitment or star) = (different basic model other than bureaucracy)t
13 .... (Basic model other than commitment or star) = (different basic model other than bureaucracy)t?
14 .... (Aberrant or near-type) = (commitment or star)
15 .... (Aberrant or near-type) = (basic model other than commitment or star)
15a ... (Aberrant or near-type) = engineering 15b ... (Aberrant or near-type) > autocracy
3 2 .464 .486 .627
3 1 -.788 -2.155 .031
8 2 .944 1.442 .149
18 6 1.550 2.460 .014 14 5 1.160 1.879 .060 4 1 3.004 5.902 .000
-.304 -.354 .723
-1.480 -5.868 .000
.286 .478 .632
.975 1.910 .056
.694 1.244 .214 2.178 5.037 .000
NOTE. -Predicted effects on turnover (square root) from model controlling for same covariates as in model 2 of table 4. Results pertaining to rows 15a and 15b are based on a supplementary specification replacing transition in row 15 with transitions shown in rows 15a and 15b; all other results are from a specification including the contrasts in rows 1-15.
* All cases of stable near-type models are near-commitment firms. * All transitions originated from star model t All transitions involve move to engineering model ? All transitions originated from bureaucratic model
x0 (ao
American Journal of Sociology
TABLE 6 ADDITIONAL CONTRASTS AMONG COEFFICIENTS IN TABLE 5
Row Contrasts Coefficient z prob > z |
7 versus (2, 3) ....... 1.244 2.161 .031 7 versus 8 ............ 1.118 1.930 .054 7 versus 12 .......... 1.598 1.659 .097 9 versus (5, 6) ....... 2.183 3.888 .000 9 versus 8 ............ 1.134 1.771 .077 9 versus 14 .......... 1.134 1.583 .114 9 versus 15 ...........528 .766 .444 9 versus 15a ..........918 1.279 .201 9 versus 15b ......... -.925 -1.698 .090 10 versus (4, 5, 6) ... 1.114 2.577 .010 10 versus 11 ......... -1.205 -2.774 .006 10 versus 13 ......... 2.134 6.514 .000 12 versus 13 ......... 1.252 1.433 .152 14 versus (5, 6) ...... 1.031 1.847 .065 14 versus 15 ......... -.606 -.909 .363 14 versus 15b ....... -2.073 -3.495 .000 15a versus 15b ...... -1.843 -2.718 .007 15 versus (5, 6) ...... 1.629 3.432 .001
aberrant blueprint to one of the five basic models compounds two op- posing effects-the disruptive effects of altering the employment model, and the (presumably) beneficial effect of adopting a consistent model. Second, the benefit associated with shifting to a basic model type depends on the underlying attractiveness of that model. For instance, relative to firms that retained an aberrant blueprint, companies that shifted to one of the basic types generally experienced higher turnover, consistent with the notion that changing the premises governing employment relations disrupts an organization's equilibrium.
The magnitude of the effect of change depends significantly on the destination (the new blueprint). Consider several examples. For transitions to the commitment or star blueprint from an aberrant model (which were few in number), predicted turnover was only modestly higher (1.031) than among firms that stayed with a particular aberrant blueprint (z =
1.847; P = .065). Moving to the engineering model from a nontype blue-
print occasioned somewhat higher turnover, significantly more than among firms that retained a particular aberrant blueprint (if row 15a in table 5 is contrasted against rows 5 and 6, b = 1.300; z = 2.704; P =
.007; supplementary analyses not shown in table 6). The transition from an aberrant model to bureaucracy also produced significantly higher turn- over than occurred among companies that retained their founder's ab-
994
Labor Pains
errant blueprint.24 Migrating from an aberrant form to autocracy, although quite rare, seems to have been even more disruptive; firms making this transition experienced significantly higher turnover than companies that retained an aberrant blueprint (b = 3.193; z = 6.389; P < .001; supple- mentary analyses not reported in table 6), and even somewhat higher than in companies that cycled from one aberrant model to another (see contrast between rows 9 and 15b in table 6).
In short, model consistency and cultural resonance are not virtues in- dependent of the model's content. Rather, the effect of abandoning or moving to one of the five basic models seems to depend quite a bit on the specific model. The commitment and star models appear to be par- ticularly risky to dismantle and less contentious to adopt. In contrast, moving from bureaucracy and autocracy entails little disruption, whereas moving toward these models seems especially unsettling.
The fine-grained analyses in tables 5 and 6 cast light on the differences in turnover rates as a function of founder's employment model that were reported in table 4. Among firms that retained their original employment blueprints, the only model types with significantly higher turnover than bureaucracy were autocracy and star. According to table 5, autoc- racy-whether adopted at the firm's inception or subsequently (cf. rows 1 and 15b)-fosters high levels of employee turnover. This is hardly sur- prising, given the considerable education, experience, and professionalism among Silicon Valley's labor force; the intense competition among em- ployers for key personnel; and employees' high expectations for autonomy and self-actualization at work. The star model is widely perceived in Silicon Valley as turnover-prone, due to perceived inequities it can foster, the high mobility of scientific and technical stars to whom the model is targeted, and the tendency of star-oriented firms to rely more on stock options (which either stay underwater or else vest and are exercised, in either case making the firm vulnerable to turnover).
Other differences in turnover rates as a function of the founder's model are not significant (in table 5) after controlling for the specific transitions that firms experienced. Although turnover appeared (in table 4) to be lower in firms founded along bureaucratic lines than in companies founded on commitment, engineering, or hybrid models, tables 5 and 6 reveal that this is simply because the latter firms were more likely to change their employment models-which on its own is destabilizing-and
24 In supplementary analyses, we subdivided row 10 into firms that transitioned to bureaucracy from the engineering model versus from an aberrant (nontype) blueprint. Turnover within the latter group was significantly higher than among firms with a stable near-type or nontype blueprint (b = 1.735; z = 2.899; P = .004).
995
American Journal of Sociology
to make the kinds of changes that foster higher turnover (i.e., toward bureaucracy, autocracy, or an aberrant blueprint).
Yet table 5 indicates that no other employment model, retained over time, displays significantly lower turnover than bureaucracy. We find this result somewhat surprising in light of the apparent low regard with which Silicon Valley employees view bureaucracy, as evidenced by the reductions (increases) in turnover that seem to accompany firms' abandoning (em- bracing) a bureaucratic model (see rows 10, 11 and 13 in table 5). We speculate that firms founded along bureaucratic lines might have antic- ipated long-term growth and hired employees better prepared to handle the transition to a more mature organization, whereas that transition requires more "churning" of personnel in firms built on other models.25 (This is especially plausible to the extent that founders who embraced a bureaucratic model had prior exposure to larger, well-established tech- nology companies.) Some evidence consistent with this speculation comes from the summary notes provided by a member of our research team after interviewing a founder of one of the firms we coded as adhering to a stable bureaucratic model. That founder had previously worked in one of Silicon Valley's largest and most prominent companies:
During her tenure, Z (one of the founders) has put in place systems and controls that would be appropriate for a far larger company. Z has prepared for the growth (little so far) that the company anticipates and she points out that some of the company's systems have yet to be fully utilized. The firm under Z seems to be employee friendly. Z has a reputation for great relations with her employees-or her "people," as she's been known to call them-a fact that is borne out in the firm's low turnover. She mentioned two former employers (large, well-established technology companies) as in- fluences with regard to organizational design .... CEO Z says she is the person most responsible for HR at the company. HR at the firm is part of strategic planning. When the company reaches 50 employees . . . a full- time HR specialist will be hired. Indeed, Z knew exactly where in her file cabinet to find the company's employee handbook, developed in the com- pany's first year as Z's first task as CEO. ... In addition to the employee handbook, she also instituted in the first year written performance evalu- ations, nondisclosure agreements (NDAs), and instituted regular company- wide meetings. (ID #141)
Another company that we classified as a stable bureaucracy seems to fit a similar pattern-planning in advance for rapid growth by a founder
25 Precisely because bureaucracies are rather atypical within Silicon Valley, it is also possible that firms founded along such lines transmit clearer and more accurate pre- employment expectations for individuals joining the firm, relative to organizations built on other models (particularly the commitment, star, and autocracy models), re- sulting in higher posthiring attrition in the latter.
996
Labor Pains
with prior work experience in large, well-established technology com- panies. This firm's founder-CEO, a Ph.D. scientist who had worked pre- viously in several large electronics, semiconductor, and defense companies, anticipated the explosive growth in portable computers and in "smart devices" (digital cameras, mobile phones, personal digital assistants) and hoped to compete against Intel and Advanced Micro Devices in producing flash memory storage devices. He sought to capture early mover advan- tage by developing technology, key supplier and customer partnerships, and organizational capability in advance of a market that was only just emerging when the company was launched:
Founder: The catalyst for starting the company was that I believed that there was going to be a need in the marketplace for the kind of products that I had in mind several years after we were going to start a company. ... I felt I had a solution to a problem that was not yet evident as a problem.
Interviewer: (Did you have) a model or a blueprint for organizing the com- pany at the beginning, whether from your past experience or from other companies that you admired? Founder: Yeah, it was basically, the first five years we would be a functional organization, we would have VP's for the various functions, no separate divisions .. ., and have very good executive staff, hire a good CFO, a good VP of engineering, VP of technology, VP of operations, traditional structure. And I did not expect that (to) change in the first five years. I did not look beyond the first five years. (ID #19)26
In sum, differences in turnover across founder models for the most part reflect differences in the vulnerabilities of the particular models to sub- sequent change and the dislocating effects of such changes. More broadly, the results in tables 5 and 6 provide some indirect validation of our typology of employment models. For instance, the high turnover char- acteristic of firms that moved between aberrant blueprints suggests that consistency of the organization's employment model does indeed reduce turnover. Moreover, transitions among particular origin and destination models vary in sensible and predictable ways in affecting turnover (e.g., the dislocating effects of abandoning the commitment or star model and of migrating toward bureaucracy or autocracy). Altering the employment blueprint generally destabilizes organizations, especially when the blue- print is relatively coherent. However, the content of the changes can attenuate or exacerbate the process effect (the tendency for changing the employment model to foster turnover).
26 Interestingly, when asked whether he had any specific company in mind as an organizational model, the founder mentioned Intel, the largest firm in the industry.
997
American Journal of Sociology
OTHER DETERMINANTS OF TURNOVER RATES
We briefly summarize the effects of other variables on firms' turnover rates in table 4. We find no net effect of change in CEO during a spell on turnover. Interestingly, the gross effect (not shown in table 4) is sizable and statistically significant (b = 0.687; z = 2.539; P = 0.011), but it be- comes insignificant once we control for change in the founder's organi- zational model.27 In other words, executive succession is associated with turnover primarily because it is associated with model change. The fact that the (time-varying) effect of executive succession is mediated by the
(time-invariant) effect of the number of model dimensions that changed is substantively important. It gives us some confidence that change in the
blueprint operates as a cause, rather than as a consequence or correlate, of turnover, even though we cannot be certain that all changes in blue-
prints preceded the turnover spells they are supposed to predict.28 We find only weak evidence of the hypothesized imprinting effect of
the organization's first CEO. Controlling for organizational age, the more of the firm's history that was "presided over" by the first CEO, the lower the subsequent turnover.29 However, this effect is moderated somewhat and becomes statistically insignificant when other variables (specifically, blueprint change) are controlled for.
According to model 2 of table 4, firms led by their second or subsequent CEO experienced slightly lower turnover.30 However, this effect tends to be pronounced only in specifications that also control for model change.
27 In a specification with CEO change (time-varying) and number of dimensions of model change (time-invariant) as regressors, the effect of CEO change is 0.280 (z =
1.494; P = .135), whereas the effect of model change remains strong and significant (b = 0.643; z = 4.931; P <.001). 28 We also find a modest positive effect of changing the CEO on turnover in a standard "fixed effects" model that controls entirely for between-firm variation in turnover and includes only time-varying independent variables (results available on request). How- ever, the size and significance of the effects are reduced considerably if a time-varying measure of the cumulative number of CEOs in the firm is also added to the specification, which has a significant negative effect on turnover in the fixed-effects model. 29 In a specification with just those two covariates, first CEO duration has a strong negative effect on turnover (b = -0.186; z = -2.345; P = .019). 30 In supplementary analyses that included spells for firms that had not yet designated a CEO, we also found that companies experienced significantly lower turnover before appointing their first CEO (relative to the omitted category, first CEO), even controlling for organizational age (results available on request). We suspect that appointing a CEO after a firm has functioned for some time without one destabilizes organizations for two reasons: (1) it signals a move to a more business-like and hierarchical approach, which often conflicts with the original vision of the founders; and (2) designating one of the founders (or an outsider) as CEO after a period of collective control often causes the remaining founders to feel disenfranchised and to depart, sometimes taking other employees with them.
998

Labor Pains
This is because firms with a second or subsequent CEO are significantly more likely to have experienced a model change, resulting in higher turn- over; net of that tendency, however, such firms actually display somewhat lower turnover. In other words, if we compare two firms that both altered their original blueprint dramatically, the estimates of model 2 of table 4 imply that a firm still being run by its first CEO will have slightly higher turnover than one in which the initial CEO has been replaced. We spec- ulate that this result reflects the nature of implicit contracts. Founders generally establish the implicit contracts with employees that are embed- ded in the organizational blueprint; hence, it might be more contentious for a founder-CEO to alter that blueprint and to remain at the helm, as a continuing reminder to employees of how the enterprise has strayed from its initial model, than it is for a newcomer CEO.31
Turnover increases with the length of time since a firm first received venture capital. Venture capitalists (VCs) often help young organizations formalize and fill key managerial and technical roles (Baron et al. 1999b), especially as their relationship with the firm develops over time, because: (1) they often maintain an initial hands-off approach; (2) if the enterprise is proceeding on a path towards going public, VCs want to ensure that the firm possesses the management capability and organizational routines to handle this transition; and (3) if the firm is doing poorly, VCs will frequently insist on changes in management and/or organizational routines (using their board positions to bring this about). The effect of venture capital in model 2 of table 4 might capture turnover that is induced when VCs facilitate bureaucratization of firms and the replacement of early employees.32 Turnover appears to decrease somewhat the longer a firm has been public. This result is consistent with qualitative observations from our interviews about disruptive effects that accompany the initial public offering (IPO). Respondents noted that going public can disrupt organizations in a variety of ways-for instance, requiring new sorts of skills (e.g., financial reporting, public and investor relations) not previously represented among employees, which might require both adding new
31 Consistent with that conjecture, adding an interaction term between the cumulative number of CEOs and the number of dimensions that changed in the blueprint to model 2 of table 4 produces a negative effect that approaches statistical significance (b = -0.169; z = -1.634; P = .102, two-tailed), and the main effect for number of CEOs is no longer significant. Thus, turnover associated with changing the model is greatest for companies still being led by their first CEO at the beginning of a spell. 32 Consistent with that interpretation, note that the effect of venture capital on turnover becomes insignificant after controlling for the CEO's organizational blueprint (model 3), which VCs presumably are likely to help shift toward bureaucracy. In addition, supplementary analyses reveal that firms in which the CEO championed the bureau- cratic model were significantly more likely to have venture capital and to have had it longer than all other firms.
999
American Journal of Sociology
kinds of employees and replacing some individuals as well. Moreover, respondents emphasized that going public often represents a financial and
symbolic milestone, which, once surpassed, can leave a motivational void. One founder-CEO of a company engaged in biotechnology instrumen- tation told our research team:
We worried about the IPO a lot because from the earliest days that was a clear corporate focal point. Get to the IPO point, get the company public. It's the big payoff for people who have stock. Every person in our company is a stockholder. We grant them options when they join. Everyone worked very hard for six years to get to that point. Our concern was, after the IPO and after the lockups expire (so that) people have the ability to sell stock, we were concerned what the motivation levels in the company would look like (and) what we could do to influence that motivation level. One thing we are working very diligently on right now is identifying what the next corporate milestone will be. 25%-30% growth isn't the kind of corporate objective or singularity of purpose that gets people riled up. We are looking for something a little more specific, like that $100 million benchmark. We're in the process of making a final decision of what that overall, superordinate goal is going to be. (ID #23)
The negative relationship between duration as a public company and turnover might also reflect vesting of stock options. Among the spells involving public companies, the typical duration as a public company was only about two years (with more than 85% of spells involving com- panies that had been public less than four years). The tendency for turn- over to decline with duration as a public company might reflect the in- creasing sway that stock options have as employees approach the vesting date when those options can be exercised (often three to five years after the initial public offering).33
As predicted, organizational age has a strong positive effect on employee turnover, consistent with the notion that younger technology companies are perceived as offering greater technological challenges and larger pros-
33 In "spline" specifications that restrict the effect of duration to companies that were already public, the effect is still strongly negative (b = -0.567), though only marginally significant (P = .068). We also experimented with numerous other specifications, in- cluding dummy variables denoting whether these events occurred in a given (or im- mediately prior) spell and specifications incorporating a time-invariant effect of having venture capital or being publicly traded. In some of these models, we found significant effects of having received venture capital or gone public in the prior spell, which worked in the opposite direction from the effect of duration-that is, turnover declined in the spell following VC funding, but increased subsequently; and turnover increased in the spell after companies went public, but subsequently declined the longer firms had been publicly traded. However, these lagged effects do not persist if employment change in the preceding spell is controlled, suggesting that the lagged effects on turnover of receiving VC financing or going public simply reflect the short-term impact of those events on employment growth and decline.
1000
Labor Pains
pects for financial gain through stock option grants. In some specifications, organizational growth increased turnover, but the magnitude and signif- icance of this effect varies depending on the particular specification and set of observations involved. Turnover tends to be lower in research and manufacturing companies (as contrasted with computer hardware and software, medical devices and biotechnology, semiconductors, and tele- communications and networking). Finally, in supplementary analyses, we controlled for occupational and gender composition at the end of the first year of operations for the subset of companies that provided this infor- mation. Those controls do not appreciably alter the effects associated with founders' employment blueprints or changing the blueprint (results avail- able on request). Hence, our findings do not appear to be artifacts of gross differences in occupational composition or gender mix.
Overall, the effects of model change persist even after we control for many other factors that could be expected to influence turnover rates, including organizational size and growth, age, industry, occupational and gender composition, and the duration of venture capital financing and public status.
WHO IS LEAVING: DISENCHANTED OLD GUARD OR MISMATCHED NEW GUARD?
If altering organizational blueprints changes the skills, values, working relationships, and routines that have developed within an enterprise, then turnover associated with changing blueprints should be concentrated dis- proportionately among more senior employees. Our data do not permit a direct test of this prediction. However, companies completing our HR survey did provide a tenure distribution for the firm (the fraction of the labor force with tenure of six months or less, seven to twelve months, etc.) at the time of the interview (1994 or 1995). To examine this issue, we conducted exploratory analyses, predicting the percentage of employ- ees in 1994-95 having six months or less tenure in the firm. These analyses were limited to the last spell for which we had information within each firm (1994 or 1995). We included as predictors the same covariates as in model 2 of table 4, as well as contemporaneous and lagged measures of turnover. For firms interviewed in 1995, there is some potential ambiguity regarding the time frame to which firms' responses regarding turnover rates and tenure distributions pertain. We handled this ambiguity by performing the analyses in various ways.34 The key results of interest are
34 The 1995 survey form asked for the firm's current tenure distribution but inadver- tently asked for turnover data pertaining to the first half of 1994 (as we had requested for firms interviewed in mid-1994). Some companies interviewed in 1995 provided, on
1001
American Journal of Sociology
stable across specifications and subsamples analyzed and are unaffected by weighting, so we report (in table 7) only one set of those analyses, which are unweighted.
Table 7 reveals that change in the employment blueprint has a strong and significant positive effect on the fraction of a firm's workforce having tenure of six months or less. In other words, the more a firm had changed its organizational blueprint by 1994-95, the larger the fraction of recently hired employees on its payroll, even controlling for recent turnover ex- perience.35 Because we have controlled for turnover in the analysis, the effect of model change cannot be attributed simply to the higher levels of turnover experienced by firms that changed their employment blue- print. Rather, a more plausible explanation for this effect holds that firms experienced turnover disproportionately from their old guard when em- ployment blueprints changed, consistent with hypothesis 2.
This interpretation is buttressed by parallel analyses in table 7, model 2, that focus on the size of the most senior tenure cohort in the firm (five or more years). Companies that changed their employment blueprint most have a significantly smaller proportion of old-guard employees. Effects of other variables in the analysis seem quite plausible-for instance, the
their own initiative, turnover data for all of 1994 and the first half of 1995. In one set of analyses, we excluded firms that were interviewed in 1995 but that did not provide turnover data pertaining to the same time period as the tenure distribution. In other analyses, we constructed a new lagged turnover measure for year t - 1, equal to (a) 1993 turnover for firms interviewed in 1994; (b) turnover in 1994 for firms interviewed in 1995 that also provided turnover data for 1995; and (c) turnover in the first half of 1994 for firms interviewed in 1995 that did not furnish any more recent turnover data. In another variant, we restricted the analysis to firms interviewed in 1994. These analyses produced results comparable to those reported in table 7, which handles the ambiguity by: (a) including a dummy variable for whether or not a given firm provided contemporaneous turnover data for the same time period as the tenure distribution; (b) controlling for 1994 vs. 1995 interview year; and (c) permitting the effect of lagged turnover to vary between firms that did versus did not furnish contemporaneous turnover data. 35 Turnover in the prior year generally has a negative effect on the size of the "new guard," presumably because firms experiencing high turnover in the previous year hired replacements, who had already accumulated more than six months' seniority within the firm. However, model 1 in table 7 reveals an exception: among firms in- terviewed in 1995 that did not provide contemporaneous turnover data for 1995, lagged turnover exhibits a positive relationship with the fraction of employees hired in the last six months. One possible explanation for this result is that these firms (all studied in 1995) were (justifiably) confused by the different time frames to which the turnover and tenure questions pertained, and they unwittingly reported their tenure distribution for 1994 and/or their recent (1995) turnover experience instead of consistently providing information pertaining to 1994 or 1995 (i.e., it is because they had a relatively low tenure workforce in 1994 that they display higher turnover in 1995). This would account for the appearance of a significant positive relationship between reported turnover and the size of the recently hired contingent.
1002
Labor Pains
fraction of senior employees is larger in older companies, in those that were larger in their first year of operations, and in those founded along commitment lines.36 Recognizing that not all firms in the sample had been in existence for five years, we also replicated these analyses on the subset of companies that were five years old or more as of the start of the spell, and the results (available on request) were comparable to those reported in table 7.
We cannot make strong inferences on this issue, given the considerable limitations of the data available to us. However, these exploratory results seem consistent with the view that adopting a new organizational model increases turnover principally by dislocating the old guard.
TURNOVER AND ORGANIZATIONAL PERFORMANCE
We have argued that the tendency for changes in organizational blueprints to increase turnover is interesting for numerous reasons, irrespective of the relationship between turnover and firm performance. Nonetheless, we wish to test the prediction, derived from ecological perspectives, that the disruptions occasioned by turnover destabilize organizations and ad- versely affect performance. We report a preliminary analysis of the re- lationship between turnover and one compelling indicator of performance: revenue growth. Bear in mind that many young technology companies are incurring significant set-up costs that might dampen profitability, such as conducting basic research, developing distribution channels, building infrastructure, and so on. Hence, the ability to accelerate the flow of revenues is a reasonable indicator of early success in young technology companies, one over which the labor force has some control and one that is tracked closely by external constituencies and stakeholders. In addition, the data we analyze on revenue growth were provided by the companies to independent sources-annual reports to the SEC (for public companies) and annual editions of the Technology Resource Guide to Greater Silicon Valley (a commercial database distributed by CorpTech)-rather than directly to us, reducing the chance of any bias.
We model performance by relating revenues (in $100,000s) in year T + 2 to: (a) revenues in year T; (b) average turnover in years T - 1 and T; and (c) other controls (described below). We calculated each firm's average turnover rate over the last two spells for which it provided data (for most firms, 1993 and the first half of 1994; for a few firms, 1994 and
36 Not surprisingly, with age, size, and growth controlled, the effect of recent turnover on the relative size of the most senior tenure cohort is modest.
1003
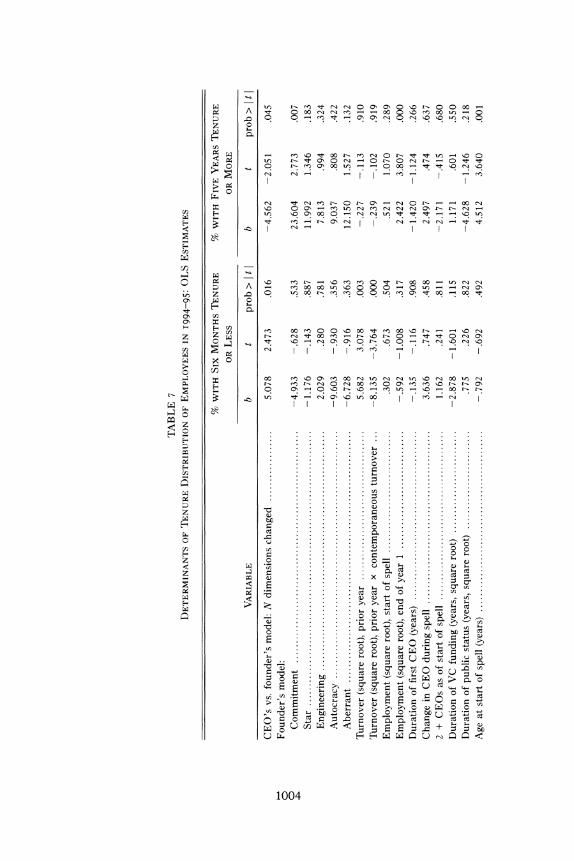
TABLE 7 DETERMINANTS OF TENURE DISTRIBUTION OF EMPLOYEES IN I994-95: OLS ESTIMATES
% WITH SIX MONTHS TENURE % WITH FIVE YEARS TENURE
OR LESS OR MORE
VARIABLE b t prob > It
CEO's vs. founder's model: N dimensions changed .................. 5.078 2.473 .016 Founder's model:
Commitment ........................................................... -4.933 -.628 .533 Star ............................................................-1.1. 76 -.143 .887 Engineering ...................................................... 2.029 .280 .781 A utocracy .............................................................. -9.603 - .930 .356 A berrant ................................................................ -6.728 - .916 .363
Turnover (square root), prior year ...................................... 5.682 3.078 .003 Turnover (square root), prior year x contemporaneous turnover ... -8.135 -3.764 .000 Employment (square root), start of spell ............................... .302 .673 .504 Employment (square root), end of year 1 .............................. -.592 -1.008 .317 Duration of first CEO (years) ........................................... -.135 -.116 .908 Change in CEO during spell ............................................ 3.636 .747 .458 2 + CEOs as of start of spell ........................................... 1.162 .241 .811 Duration of VC funding (years, square root) .......................... -2.878 -1.601 .115 Duration of public status (years, square root) ......................... .775 .226 .822 Age at start of spell (years) .............................................. - .792 - .692 .492
b t prob > I t
-4.562 -2.051 .045
23.604 2.773 .007 11.992 1.346 .183 7.813 .994 .324 9.037 .808 .422
12.150 1.527 .132 -.227 -.113 .910 -.239 -.102 .919
.521 1.070 .289 2.422 3.807 .000
-1.420 -1.124 .266 2.497 .474 .637
-2.171 -.415 .680 1.171 .601 .550
-4.628 -1.246 .218 4.512 3.640 .001
Industry: M anufacturing ......................................................... -4.552 -.642 .523 -12.532 -1.633 .108
Research ............................................................... -3.511 -.351 .727 3.431 .316 .753
Firm-provided contemporaneous turnover data ....................... 9.432 1.154 .253 -5.098 -.576 .567
Interview year (1995 vs. 1994) .......................................... -11.484 -1.382 .172 8.574 .952 .345
Constant ....................... ................................... . 22,922.940 1.383 .172 -17,123.540 -.954 .344
R2 ......................... ................................................. .494 .621
prob > F .......................... ...............................001 .000
0 o o
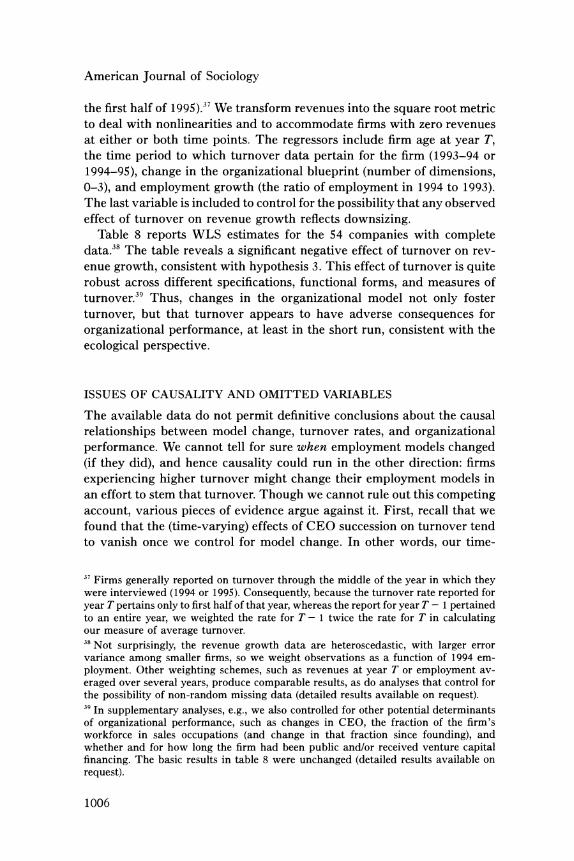
American Journal of Sociology
the first half of 1995).37 We transform revenues into the square root metric to deal with nonlinearities and to accommodate firms with zero revenues at either or both time points. The regressors include firm age at year T, the time period to which turnover data pertain for the firm (1993-94 or
1994-95), change in the organizational blueprint (number of dimensions, 0-3), and employment growth (the ratio of employment in 1994 to 1993). The last variable is included to control for the possibility that any observed effect of turnover on revenue growth reflects downsizing.
Table 8 reports WLS estimates for the 54 companies with complete data.38 The table reveals a significant negative effect of turnover on rev- enue growth, consistent with hypothesis 3. This effect of turnover is quite robust across different specifications, functional forms, and measures of turnover.39 Thus, changes in the organizational model not only foster
turnover, but that turnover appears to have adverse consequences for
organizational performance, at least in the short run, consistent with the
ecological perspective.
ISSUES OF CAUSALITY AND OMITTED VARIABLES
The available data do not permit definitive conclusions about the causal
relationships between model change, turnover rates, and organizational performance. We cannot tell for sure when employment models changed (if they did), and hence causality could run in the other direction: firms
experiencing higher turnover might change their employment models in an effort to stem that turnover. Though we cannot rule out this competing account, various pieces of evidence argue against it. First, recall that we found that the (time-varying) effects of CEO succession on turnover tend to vanish once we control for model change. In other words, our time-
37 Firms generally reported on turnover through the middle of the year in which they were interviewed (1994 or 1995). Consequently, because the turnover rate reported for year T pertains only to first half of that year, whereas the report for year T - 1 pertained to an entire year, we weighted the rate for T- 1 twice the rate for T in calculating our measure of average turnover. 38 Not surprisingly, the revenue growth data are heteroscedastic, with larger error variance among smaller firms, so we weight observations as a function of 1994 em- ployment. Other weighting schemes, such as revenues at year T or employment av- eraged over several years, produce comparable results, as do analyses that control for the possibility of non-random missing data (detailed results available on request). 39 In supplementary analyses, e.g., we also controlled for other potential determinants of organizational performance, such as changes in CEO, the fraction of the firm's workforce in sales occupations (and change in that fraction since founding), and whether and for how long the firm had been public and/or received venture capital financing. The basic results in table 8 were unchanged (detailed results available on request).
1006
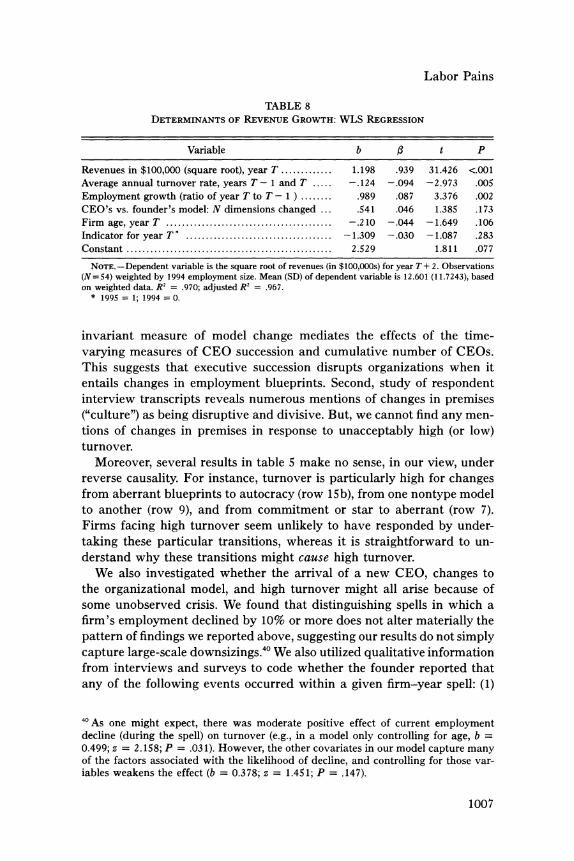
Labor Pains
TABLE 8 DETERMINANTS OF REVENUE GROWTH: WLS REGRESSION
Variable b ,3 t P
Revenues in $100,000 (square root), year T ............. 1.198 .939 31.426 <.001 Average annual turnover rate, years T- 1 and T ..... -.124 -.094 -2.973 .005 Employment growth (ratio of year T to T - 1 ) ........ .989 .087 3.376 .002 CEO's vs. founder's model: N dimensions changed ... .541 .046 1.385 .173 Firm age, year T ......................................... -.210 -.044 -1.649 .106 Indicator for year T* ..................................... -1.309 -.030 -1.087 .283 Constant ............................................... 2.529 1.811 .077
NOTE. -Dependent variable is the square root of revenues (in $100,000s) for year T + 2. Observations (N=54) weighted by 1994 employment size. Mean (SD) of dependent variable is 12.601 (11.7243), based on weighted data. R2 = .970; adjusted R2 = .967.
* 1995 = 1; 1994 = 0.
invariant measure of model change mediates the effects of the time- varying measures of CEO succession and cumulative number of CEOs. This suggests that executive succession disrupts organizations when it entails changes in employment blueprints. Second, study of respondent interview transcripts reveals numerous mentions of changes in premises ("culture") as being disruptive and divisive. But, we cannot find any men- tions of changes in premises in response to unacceptably high (or low) turnover.
Moreover, several results in table 5 make no sense, in our view, under reverse causality. For instance, turnover is particularly high for changes from aberrant blueprints to autocracy (row 15b), from one nontype model to another (row 9), and from commitment or star to aberrant (row 7). Firms facing high turnover seem unlikely to have responded by under- taking these particular transitions, whereas it is straightforward to un- derstand why these transitions might cause high turnover.
We also investigated whether the arrival of a new CEO, changes to the organizational model, and high turnover might all arise because of some unobserved crisis. We found that distinguishing spells in which a firm's employment declined by 10% or more does not alter materially the pattern of findings we reported above, suggesting our results do not simply capture large-scale downsizings.40 We also utilized qualitative information from interviews and surveys to code whether the founder reported that any of the following events occurred within a given firm-year spell: (1)
40 As one might expect, there was moderate positive effect of current employment decline (during the spell) on turnover (e.g., in a model only controlling for age, b = 0.499; z = 2.158; P = .031). However, the other covariates in our model capture many of the factors associated with the likelihood of decline, and controlling for those var- iables weakens the effect (b = 0.378; z = 1.451; P = .147).
1007
American Journal of Sociology
major downsizings or office closings; (2) general financial or legal turmoil, such as large losses, cash flow problems, market collapse, and law suits; (3) major executive changes; and (4) other executive changes (e.g., de- parture of a chief technical officer). All four dislocating events have pos- itive effects on turnover. Nonetheless, the effect of changing the organi- zational blueprint remains positive and highly significant even when we control for these milestone events. Nor were the results appreciably changed when we included controls for evidence of a change in business strategy within the firm. These supplementary results offer some reas- surance that our analyses do not overlook some major factor that produced the observed associations between changes in employment blueprints, turnover, and organizational performance.
CONCLUSION
Organizational theorists, particularly ecologists, have emphasized the dis- ruptive effects of fundamental organizational change. Such change is thought to destabilize organizations primarily by altering the premises, values, and routines that organizational members have come to internalize (for a programmatic statement, see Hannan and Freeman [1984]). Ac- cordingly, we have tried to get closer to the mechanisms at the heart of theories of organizational inertia, by (1) operationalizing the premises (employment models) on which founders built their new organizations, (2) measuring changes over time in those premises, (3) relating those changes to employee turnover, and (4) exploring the effect of turnover on organizational performance. If altering organizational premises dislocates, then this should be clearly manifested in turnover, especially among the most senior employees within an organization. Turnover seems an espe- cially appropriate indicator of the disruptive effects of organizational change within the setting we examined-high-technology companies in Silicon Valley-because retaining the key human assets in young tech- nology firms is often viewed by senior management, investors, and other informed parties as a crucial requirement for organizational survival and success.
We found considerable evidence that changing organizational blue- prints fuels employee turnover, which is concentrated disproportionately among old-guard employees. Turnover, in turn, adversely affects the ability of young firms to grow their revenues (at least in the short run), a crucial dimension of performance for emerging technology companies. On bal- ance, our results support the claim by neoinstitutionalists and organiza- tional ecologists (following Stinchcombe 1965) that cultural blueprints are
1008
Labor Pains
superimposed by founders on nascent organizations, as well as ecologists' claim that altering such blueprints is disruptive and destabilizing.
A broad conclusion of this analysis, and of others using the SPEC data, is that origins matter. Future research should devote more attention to conceptualizing and measuring how cultural blueprints are selected and imprinted on organizations during their infancy; how they are sustained, modified, or discarded over time. Such studies would not only sharpen organizational theory but also shed light on some important real-world issues, such as the conditions under which firms find it relatively easy or difficult to merge or to transplant a particular organizational model into a new country or line of business. Moreover, additional work along these lines is needed to gauge whether our two main findings-that changes in employment blueprints fuel turnover in Silicon Valley high-tech start-ups, and that turnover in turn adversely affects organizational perform- ance-generalize to other organization-building activities, other kinds of enterprises, other environments, and other stages of organizational development.
However, pursuing this research agenda will require some adjustments to conventional research methodology. It obviously requires collecting observations that pertain to multiple points in time, beginning at the origins of the enterprise. It also requires analyzing the resulting panel data in non-standard ways. As we noted above, the current standard in analyzing panel data on organizations is a fixed-effects approach. How- ever, each organization's initial conditions are constant over its history. Thus, origins are swept out of the picture in a fixed-effects analysis. What seems needed is to employ analytic methods, such as those used in this article, that allow flexible specification of models in which both fixed and age-varying characteristics affect levels and changes in outcomes of in- terest. Further development and refinement of such approaches should be high on the agenda for organizational analysis.
Our detailed analyses of firms' transitions suggest that the disruptive effects of changing organizational blueprints depend significantly on firms' origin and destination states. Abandoning a coherent model proved to be particularly destabilizing, especially if the founder embraced the com- mitment or star model, but not if the firm migrated away from bureauc- racy or autocracy. Similarly, firms experienced markedly different turn- over rates in transitioning to particular destination states, such as bureaucracy, as a function of their initial blueprint. The engineering model, in contrast, appeared to be relatively more flexible and adaptable (i.e., easier to dismantle and easier to migrate to) than various other mod- els. Perhaps this offers some insight into its widespread prevalence in Silicon Valley. Not only does the engineering model seem to be a relatively hospitable origin and destination state, but retaining that model over time
1009
American Journal of Sociology
might also expose firms to less severe forms of misalignment than, say, retaining the commitment or star or autocratic model. Put differently, the engineering model might have less upside but also less downside risk, compared to more fragile and distinctive models, such as the commitment or star blueprint, which entail greater potential returns and risks. Organ- izational ecologists might profitably examine how different blueprints or models fare competitively under different environmental circumstances.
Scholars and practitioners alike extol the virtues of creating and sus- taining a coherent and consistent system of practices concerning employ- ment relations. Yet our results suggest that complementarity, consistency, and salience are not unqualified assets for an organizational model. Those very same attributes might help explain, for instance, the high turnover that firms experienced when moving to bureaucracy or autocracy: if Sil- icon Valley "techies" tend to dislike bureaucracy and autocracy, they dis- like them most in their purest, most consistent, and most salient incar- nations. We still know remarkably little about the parameters and
consequences of consistency: what determines the degree to which a sys- tem of beliefs or HR practices gets perceived as consistent, and how/when organizations specifically benefit from such consistency (for a notable ex- ception, see Ichniowski, Shaw, and Prennushi [1997]).
Moreover, achieving and sustaining consistency in employment systems raises complicated dynamic trade-offs. Some transition paths from foun- der's to CEO's blueprint seem to be particularly disruptive for organi- zations, underscoring the point that organizational design should attend to more than just getting the model "right." It should also balance the benefits of getting the right model against the costs associated with tran- sitioning to that model. As an organization and its environment change, the merits of a given model are likely to change as well. However, the economic, social, and psychological costs associated with dismantling the previous blueprint and implementing a new one might outweigh the con- tent advantages offered by the new blueprint. Hence, in some ecologies and for some strategies, adhering faithfully to a second-best (or even third- best) model might be superior to rapid oscillation among shorter-lived, first-best models. This issue of balancing stability versus change-and weighing the benefits of altering organizational arrangements against the adjustment costs involved in making those changes-has received little attention from organizational analysts and those interested in employment systems and human resource practices. The strong complementarities among elements of a firm's employment system, coupled with employees' strong emotional attachments to personnel practices, might make these trade-offs particularly complex in the domain of human resource man- agement. Future research should examine these trade-offs and how they
1010
Labor Pains
vary across types of organizations, environments, and employment practices.
REFERENCES
Barnett, William P., and Glenn R. Carroll. 1995. "Modeling Internal Organizational Change." Annual Review of Sociology 21:217-36.
Baron, James N., M. Diane Burton, and Michael T. Hannan. 1996. "The Road Taken: The Origins and Evolution of Employment Systems in Emerging High-Technology Companies." Industrial and Corporate Change 5:239-76.
.1999. "Engineering Bureaucracy: The Genesis of Formal Policies, Positions, and Structures in High Technology Firms." Journal of Law, Economics, and Organization 15:1-41.
Baron, James N., Michael T. Hannan, and M. Diane Burton. 1999a. "Building the Iron Cage: Determinants of Managerial Intensity in the Early Years of Organizations." American Sociological Review 64:527-47.
. 1999b. "Determinants of Managerial Intensity in the Early Years of Organizations." Research Paper no. 1550. Stanford University, Graduate School of Business.
Baron, James N., and David M. Kreps. 1999. Strategic Human Resources: Frameworks for General Managers. New York: Wiley.
Burton, M. Diane. 1995. The Evolution of Employment Systems in High Technology Firms. Ph.D. dissertation. Stanford University, Department of Sociology.
. 1999. "Employment Models in Entrepreneurial Companies." Manuscript. Harvard University, Harvard Business School.
. 2001. "The Company They Keep: Founders' Models for Organizing High- Technology Firms." In The Entrepreneurship Dynamic, edited by Claudia Bird Schoonhoven and Elaine Romanelli. Stanford, Calif.: Stanford University Press, in press.
Carroll, Glenn R., and Michael T. Hannan. 2000. The Demography of Corporations and Industries. Princeton, N.J.: Princeton University Press.
Carroll, Glenn R., and J. Richard Harrison. 1998. "Organizational Demography and Culture: Insights from a Formal Model and Simulation." Administrative Science Quarterly 43:637-67.
Edwards, Richard C. 1979. Contested Terrain: The Transformation of the Workplace in the Twentieth Century. New York: Basic Books.
Fligstein, Neil. 1987. "The Intraorganizational Power Struggle: The Rise of Finance Presidents in Large Corporations." American Sociological Review 52:44-58.
. 1990. The Transformation of Corporate Control. Cambridge, Mass.: Harvard University Press.
Fligstein, Neil, and Haldor Byrkjeflot. 1996. "The Logic of Employment Systems." Pp. 11-35 in Social Differentiation and Social Inequality, edited by James N. Baron, David B. Grusky, and Donald J. Treiman. Boulder, Colo.: Westview Press.
Friedman, Stewart D., and Kathleen Saul. 1991. "A Leader's Wake: Organization Member Reactions to CEO Succession." Journal of Management 17:617-42.
Greenhouse, Steven. 1999. "Angered by H.M.O.'s lTeatment, More Doctors Are Joining Unions." New York Times (February 4): Al, A25.
Guillen, Mauro F. 1994. Models of Management: Work, Authority, and Organization in a Comparative Perspective. Chicago: University of Chicago Press.
Hannan, Michael T. 1998. "Rethinking Age Dependence in Organizational Mortality: Logical Formalizations." American Journal of Sociology 104:85-123.
Hannan, Michael T., M. Diane Burton, and James N. Baron. 1996. "Inertia and Change
1011
American Journal of Sociology
in the Early Years: Employment Relations in Young, High-Technology Firms." Industrial and Corporate Change 5:503-36.
Hannan, Michael T., and John Freeman. 1984. "Structural Inertia and Organizational Change." American Sociological Review 49:149-64.
Huber, Peter J. 1967. "The Behavior of Maximum Likelihood Estimates under Non- Standard Conditions." Pp. 221-33 in Proceedings of the Fifth Berkeley Symposium in Mathematical Statistics, and Probability, edited by Lucien M. Le Cam and Jerzy Neyman. Berkeley and Los Angeles: University of California Press.
Ichniowski, Casey, Kathryn Shaw, and Giovanna Prennushi. 1997. "The Effects of Human Resource Management Practices on Productivity: A Study of Steel Finishing Lines." American Economic Review 87:291-313.
Kesner, Idalene F., and Dan R. Dalton. 1994. "Top Management Turnover and CEO Succession : An Investigation of the Effects of Turnover on Performance." Journal of Management Studies 3:701-13.
Liang, Kung-Yee, and Scott L. Zeger. 1986. "Longitudinal Analysis Using Generalized Linear Models." Biometrika 73:13-22.
Milgrom, Paul, and John Roberts. 1992. Economics, Organization, and Management. Englewood Cliffs, N.J.: Prentice-Hall.
1995. "Complementarities and Fit: Strategy, Structure, and Organizational Change in Manufacturing." Journal of Accounting and Economics 19:179-208.
Mobley, William H. 1982. Employee Turnover: Causes, Consequences, and Control. Reading, Mass.: Addison-Wesley.
Pfeffer, Jeffrey. 1983. "Organizational Demography." Pp. 299-357 in Research in Organizational Behavior, vol. 5. Edited by L. L. Cummings and Barry M. Staw. Greenwich, Conn.: JAI Press.
Price, James L. 1977. The Study of Turnover. Ames: Iowa State University Press. Saxenian, AnnaLee. 1994. Regional Advantage: Culture and Competition in Silicon
Valley and Route 128. Cambridge, Mass.: Harvard University Press. Shenhav, Yehouda. 1995. "From Chaos to Systems: The Engineering Foundations of
Organization Theory, 1879-1932." Administrative Science Quarterly 40:557-85. StataCorp. 1999. Stata Statistical Software: Release 6.0. College Station, Tex.: Stata
Corporation. Staw, Barry M. 1980. "The Consequences of Turnover." Journal of Occupational
Behavior 1:253-73. Stinchcombe, Arthur L. 1965. "Social Structure and Organizations." Pp. 142-93 in
Handbook of Organizations, edited by James G. March. Chicago: Rand McNally. Virany, Beverly, Michael L. Tushman, and Elaine Romanelli. 1992. "Executive
Succession and Organization Outcomes in Turbulent Environments: An Organization Learning Approach." Organization Science 3:72-91.
White, Halbert. 1982. "Maximum Likelihood Estimation of Misspecified Models." Econometrica 50:1-25.
Zeger, Scott L., and Kung-Yee Liang. 1986. "Longitudinal Data Analysis for Discrete and Continuous Outcomes." Biometrics 42:121-30.
1012