Embed Size (px)
Citation preview

Biochemistry 30 Spring 2009
Laboratory Experiments
Book B

13
Biochemistry 30 Spring, 2008
Experiment #I, Part III - Tripeptide and Protein Modeling
Secondary Structure of PeptidesTertiary Structure of Dogfish Lactate Dehydrogenase
INTRODUCTION
The function of a biological molecule is intimately linked to its structure. Therefore, one goal of biochemistry has been to develop an understanding of thethree-dimensional structure of proteins. Over the past three decades, the combinedpowers of x-ray crystallography, multinuclear multidimensional NMR, computationalchemistry, and an impressive array of physical techniques have resulted in detailedmodels for the structure of many proteins. Structures have been determined for over50,000 proteins, primarily by x-ray crystallography or NMR, with the vast majority ofthese having been determined in the last decade. This work is time consuming andtedious, and x-ray structures of crystallized protein do not always reveal all of thestructures which can be adopted by a protein in solution. Given the recent, rapidadvances in DNA-sequencing techniques and hence the enormous number of knowngene sequences (cf., for example, the human genome project), the ability to predict aprotein's tertiary structure directly from its amino-acid sequence would be amonumental advance.
Today, you will use the molecular modeling program HyperChem to build areplica of the tripeptide that you sequenced last week. The tripeptide will beconstructed with standard bond lengths and angles, but you will then vary the dihedralsphi () and psi (). By calculating the energies of 36 different conformations, you willobtain the data needed to construct a small Ramachandran plot. You will thenconstruct a polypeptide by repeating the basic unit of your tripeptide six times. Byselecting the appropriate dihedrals, this octadecamer will be constrained into an -helical as well as a -strand conformation. You will obtain a picture of youroctadecamer in each of these configurations, reporting molecular dimensions, dihedralangles, and energies.
Finally, using the program RasMol, you will view one subunit of the tetramericprotein lactate dehydrogenase (an enzyme you will purify from chickens later in thesemester) and will study various aspects of its tertiary structure.
The write-up for this part of the experiment goes directly in your labnotebook and will comprise answers to all of the questions posed throughoutthis handout.

14
About HyperChem
HyperChem is a computer program that displays and manipulates images of three-dimensional molecular models. From these images you can precisely measure bondlengths, bond angles, and interatomic distances. (Although these data may sometimesalso be measured on actual models--for example, of the ball and stick variety--thevalues obtained are only approximate.) HyperChem can also performs complexcalculations which are so lengthy as to be impossible without a computer. In order touse the program, you must know the following: what the program can do; what thebasis for its calculations is; and how to make the computer do what you want. Thisintroduction contains only enough information to enable you to do the exercises whichfollow and to learn something from them. More information is contained in theHyperChem manuals.
There are two different approaches to calculating the energy of a molecule. Thefirst approach uses pure quantum mechanics, and is termed the ab initio calculationmethod. The equations associated with this method--originating with the SchrodingerEquation--are complex and time-consuming to solve, and we shall consider this methodno further. The second approach focuses on reproducing experimental data andemploys many mathematical approximations. These approximations are of two types:semi-empirical quantum mechanical and force field. Semi-empirical quantummechanical calculations use quantum equations, but tailor them to reproduce chemicaldata. Both ab initio and semi-empirical quantum mechanical calculations are bettersuited for obtaining molecular orbitals, which is not our interest here. Instead, you willuse the force field approach, which has been developed to answer the types ofquestions you will be addressing today.
Atomic parameters for four different force fields are in the program's memory. Threeof these (BIO+, OPAL, and AMBER) were designed for use on large biologicalmolecules such as proteins and DNA. The fourth, which you will use for theseexercises, is MM+, a force field designed by N.L. Allinger et al. to reproduceexperimental physical data for smaller molecules, such as your tripeptide.
A force field energy calculation relies on a set of equations which approximate thepotential energy of various intramolecular interactions. The potential energy equationscontain variable force constants. The value of the force constants in each calculationdepends upon the elements involved in the calculation and their bondingarrangements. Not only does the program recognize that the force constants for bondsto carbon and to oxygen differ, but it also assigns different parameters to differentbonding arrangements of the same atom. Thus, the atomic force constants differ for anoxygen atom in for example, formaldehyde (H2C=O), ethanol (CH3CH2OH), an water(H2O). Each force field has its own equations and set of atomic parameters.
15
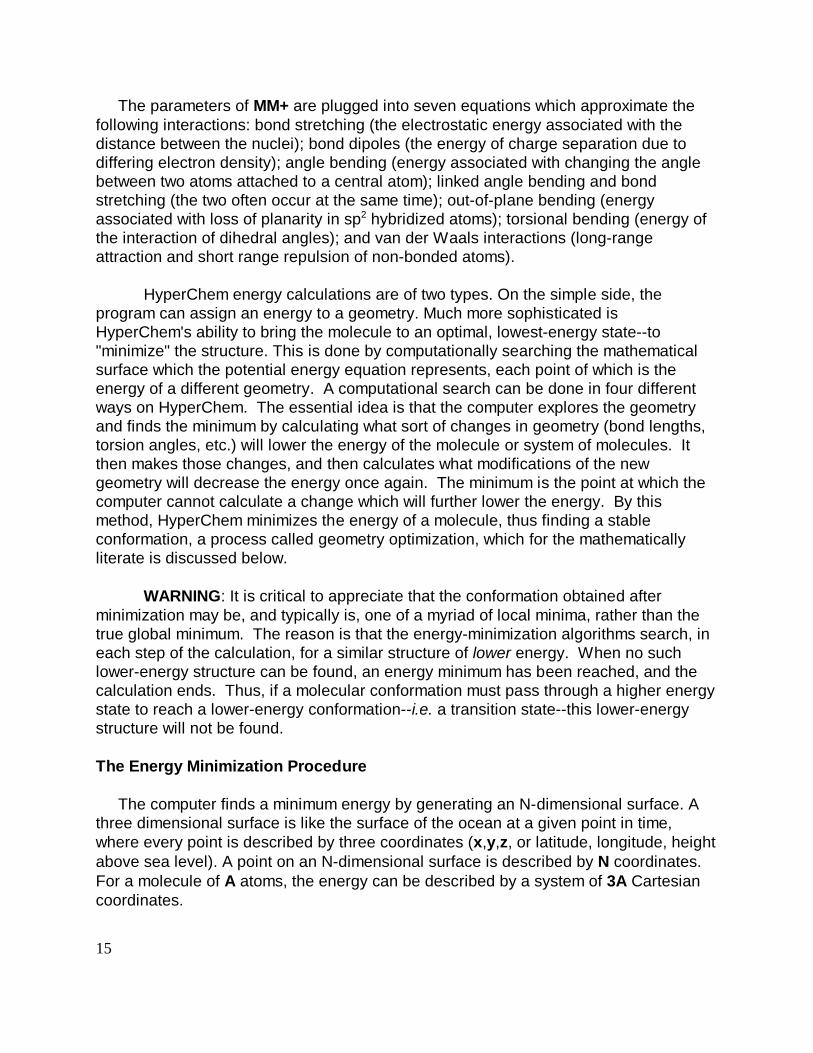
The parameters of MM+ are plugged into seven equations which approximate thefollowing interactions: bond stretching (the electrostatic energy associated with thedistance between the nuclei); bond dipoles (the energy of charge separation due todiffering electron density); angle bending (energy associated with changing the anglebetween two atoms attached to a central atom); linked angle bending and bondstretching (the two often occur at the same time); out-of-plane bending (energyassociated with loss of planarity in sp2 hybridized atoms); torsional bending (energy ofthe interaction of dihedral angles); and van der Waals interactions (long-rangeattraction and short range repulsion of non-bonded atoms).
HyperChem energy calculations are of two types. On the simple side, theprogram can assign an energy to a geometry. Much more sophisticated isHyperChem's ability to bring the molecule to an optimal, lowest-energy state--to"minimize" the structure. This is done by computationally searching the mathematicalsurface which the potential energy equation represents, each point of which is theenergy of a different geometry. A computational search can be done in four differentways on HyperChem. The essential idea is that the computer explores the geometryand finds the minimum by calculating what sort of changes in geometry (bond lengths,torsion angles, etc.) will lower the energy of the molecule or system of molecules. Itthen makes those changes, and then calculates what modifications of the newgeometry will decrease the energy once again. The minimum is the point at which thecomputer cannot calculate a change which will further lower the energy. By thismethod, HyperChem minimizes the energy of a molecule, thus finding a stableconformation, a process called geometry optimization, which for the mathematicallyliterate is discussed below.
WARNING: It is critical to appreciate that the conformation obtained afterminimization may be, and typically is, one of a myriad of local minima, rather than thetrue global minimum. The reason is that the energy-minimization algorithms search, ineach step of the calculation, for a similar structure of lower energy. When no suchlower-energy structure can be found, an energy minimum has been reached, and thecalculation ends. Thus, if a molecular conformation must pass through a higher energystate to reach a lower-energy conformation--i.e. a transition state--this lower-energystructure will not be found.
The Energy Minimization Procedure
The computer finds a minimum energy by generating an N-dimensional surface. Athree dimensional surface is like the surface of the ocean at a given point in time,where every point is described by three coordinates (x,y,z, or latitude, longitude, heightabove sea level). A point on an N-dimensional surface is described by N coordinates.For a molecule of A atoms, the energy can be described by a system of 3A Cartesiancoordinates.

16
The direction of greatest change is what the computer uses to narrow in on theminimum of the surface. This comes from a mathematical entity called the gradient. Ona two dimensional surface (for instance, a parabola: y = x2 + 2), the gradient is simplythe derivative of the equation for the curve (dy/dx = 2x). With three dimensions ormore, partial derivatives are taken and these can become mathematically very ugly. Soyou have the computer to do it for you.
There are four search methods available on HyperChem, which are, in order ofincreasing sophistication: Steepest Descent, Fletcher-Reeves, Polak-Ribiere, andBlock-Diagonal Newton-Raphson. Today, we will use the Steepest Descentalgorithm, which gives good results relatively quickly.
THE TOOLS
NOTE--in the following instructions, if neither right nor left click is specified, use leftclick.
The Building Tool - This vital tool has several functions. Left click placesatoms in the work space. Left drag places bonds in the work space. Right clickerases whatever is under the cursor. Double clicking on the building tool icon in
the tool bar at the left of the screen brings up the element palette, from which youchoose the element which will be placed on the screen, as described above. NOTE--if you switch your element choice on the palette and then click on an atomalready on screen, it will change to the new type.
The Select Tool - Anything you left click on will become highlighted and be thesubject of any subsequent action (geometry optimization, for instance). To selectmore than one item, left click on each of your choices in succession. Left click on
an empty part of the work space selects everything in the work space.
If one atom is selected, its type is displayed on the line at the bottom of the screen. Ifone bond is selected, the bond length is displayed. Selection of two non-connectedatoms gives the distance between them. Selection of three connected atoms gives therelevant bond angle, while selection of four connected atoms gives the torsion angle.
Right clicking removes from selection whatever is underneath the cursor. Right clickingon the empty work space deselects the entire selection.
17
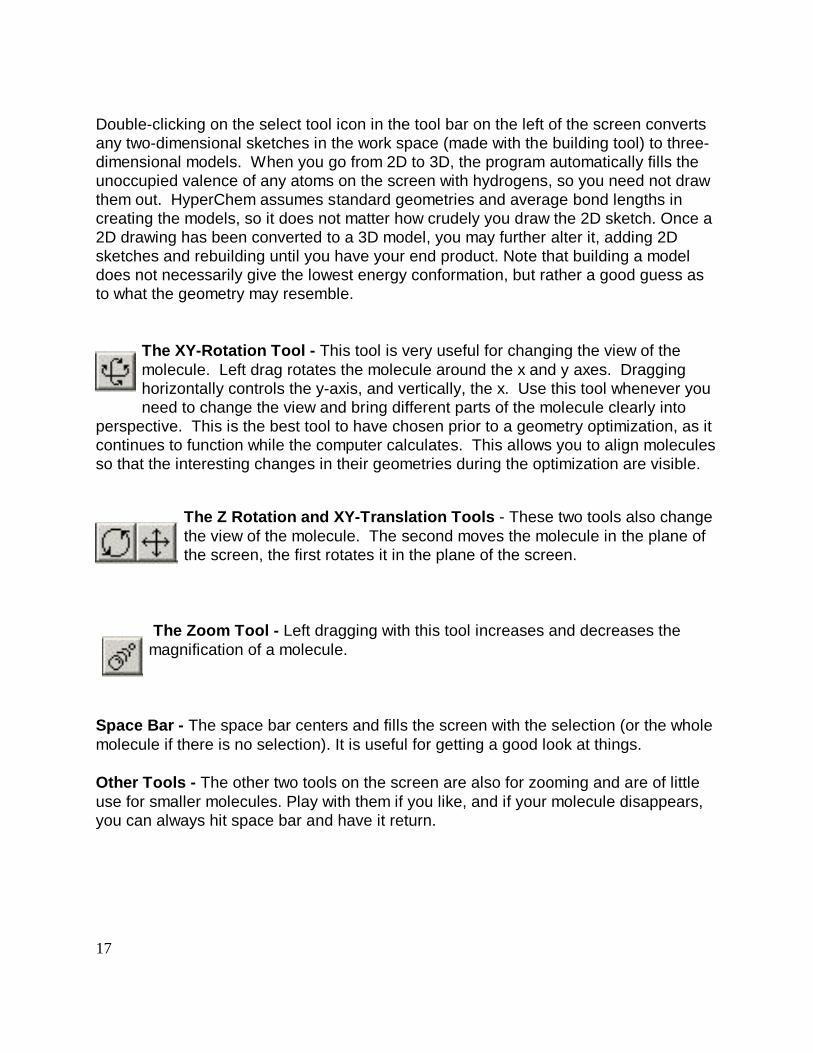
Double-clicking on the select tool icon in the tool bar on the left of the screen convertsany two-dimensional sketches in the work space (made with the building tool) to three-dimensional models. When you go from 2D to 3D, the program automatically fills theunoccupied valence of any atoms on the screen with hydrogens, so you need not drawthem out. HyperChem assumes standard geometries and average bond lengths increating the models, so it does not matter how crudely you draw the 2D sketch. Once a2D drawing has been converted to a 3D model, you may further alter it, adding 2Dsketches and rebuilding until you have your end product. Note that building a modeldoes not necessarily give the lowest energy conformation, but rather a good guess asto what the geometry may resemble.
The XY-Rotation Tool - This tool is very useful for changing the view of themolecule. Left drag rotates the molecule around the x and y axes. Dragginghorizontally controls the y-axis, and vertically, the x. Use this tool whenever youneed to change the view and bring different parts of the molecule clearly into
perspective. This is the best tool to have chosen prior to a geometry optimization, as itcontinues to function while the computer calculates. This allows you to align moleculesso that the interesting changes in their geometries during the optimization are visible.
The Z Rotation and XY-Translation Tools - These two tools also changethe view of the molecule. The second moves the molecule in the plane ofthe screen, the first rotates it in the plane of the screen.
The Zoom Tool - Left dragging with this tool increases and decreases the magnification of a molecule.
Space Bar - The space bar centers and fills the screen with the selection (or the wholemolecule if there is no selection). It is useful for getting a good look at things.
Other Tools - The other two tools on the screen are also for zooming and are of littleuse for smaller molecules. Play with them if you like, and if your molecule disappears,you can always hit space bar and have it return.
18
BEFORE YOU START
HyperChem is a very flexible program, and can be customized to the user's taste andrequirements. You must check to make sure that the format you are using is the sameas the format of the instructions. Choose Preferences... under the File menu. Set theWindow to Violet. Set the Bond to By Element. Set the Selection to Green. Clickon OK. Open the Build menu, and make sure that there are no checks by any of theoptions. Under the Select menu there should be checks by Atoms and MultipleSelections only. Make sure the Display menu has a check by Show Hydrogens,Show Multiple Bonds, and Show Hydrogen Bonds. Choose Element Color... fromthe Display menu. When the dialog box opens, choose Hydrogen as White, Carbonas Black, Nitrogen as Blue, and Oxygen as Red. Click on OK. Finally, chooseMolecular Mechanics... from the Setup menu. When the dialog box opens, chooseMM+ as the force field. Click OK, and now you are ready to begin the experiment.
PART I: CONSTRUCTION OF YOUR TRIPEPTIDE
Note: If not specified, use the left mouse button for all clicking! After recordingeach value in your notebook, DESELECT ALL ATOMS before moving on to thenext step. Note further: all HyperChem energies are reported in kcal/mol; also,the minus sign in front of negative energies is very small... don’t miss it!
--Open the Databases menu and select Amino Acids. A conversation window with thethree letter names of the 20 amino acids will appear on the screen. Notice that youhave a choice of secondary structure (Alpha helix, Beta sheet, or Other). SelectAlpha helix for starters. Click on the names of the amino acids from N- to C-terminusfollowing the amino acid sequence of the tripeptide you sequenced last week (or yourbest recreation of that sequence). Close the conversation window by clicking twice onthe top left corner. You will then be able to see the tripeptide model on the screen infront of you rendered in colored sticks. Notice that the tripeptide does not contain acarboxylate group at the C-terminus or an ammonium group at the N-terminus. To addthese groups, open the Databases Menu and select: Make zwitterions. Close theMenu and view the Tripeptide in all its glory. Use the XY-Rotation Tool and the ZoomTool to get a clearer picture of the model. Note the two peptide bonds and the sixatoms in the peptide plane. See what the side groups look like, and how they arepositioned relative to the peptide bond. --You should also change the rendering of the model by clicking on the Display Menuand choosing Rendering. You will have a choice of sticks, discs, spheres, dots, dotsand sticks. Try all of them and see what you will get. --Measure the phi and psi angles. Find the -carbon of the second amino acid of the
19
tripeptide. To measure phi, use the selection tool to highlight the following four atoms: the peptide carbonyl carbon of the amino acid number one, the adjacent peptidenitrogen, the -carbon of amino acid number two, and the peptide carbonyl carbon ofamino acid number two. On the bottom of the working space you will see the value ofthis torsion angle, which is just the phi angle. To measure psi, use the selection tool tohighlight the following four atoms: the peptide nitrogen from the second amino acid,the -carbon and peptide carbonyl carbon of the second amino acid, and the peptidenitrogen derived from the third amino acid. Record these values of phi and psi in yournotebook. Remember, your tripeptide is in the alpha-helix conformation: verify that thephi and psi angles you have measured are correct. (That is, phi = -58o and psi = -47o.)
--Now repeat the above exercise, this time building your tripeptide in the beta-strandconformation. Select New under File Menu., and do not "Save current changes:(untitled)." Your previously constructed tripeptide will disappear. Open the Databaseswindow and select Amino Acid. Select Beta sheet, build your tripeptide, etc., etc. Note, as you will explicitly see in Part III, the structure in front of you is NOT the pleated-strand--it is the completely extended strand, which does not form stable sheets withany polypeptide sequence save polyglycine.
PART II: CONSTRUCTION OF A RAMACHANDRAN PLOT
--Now, using the computational power of HyperChem, you will construct a lowresolution Ramachandran plot. Team up with a neighboring group: following theprocedure below, one group should work with glycine, the other with alanine.
--Select New under File Menu, and do not save the current file. Open the Databaseswindow and select Amino Acids. When the window opens for choosing secondarystructure, choose Other for conformation, and set the phi and psi angles each to 180degrees (note: they may already be set to these values). Build the peptide Ace GlyNme or Ace Ala Nme. (Ace is N-acetyl and Nme is N-methyl carboxamide--thesegroups provide the flanking peptide bonds for the gly or ala -carbon, as well asneighboring -carbon equivalents.) Determine the energy for this conformation bypulling down the Compute Menu and selecting Single Point. (You need not concernyourself with the "Gradient," a measure of the conformational distance between thecurrent geometry and the potential energy minimum.) Now measure the energy of thirtyfive additional conformations (yes, 35!) by varying phi and psi in 60 degree increments(remember, a dihedral of -180o is the same as +180o), rebuilding your peptide (Ace GlyNme or Ace Ala Nme), and determining the Single Point energy for the newconformation. To expedite matters, note that you can simply leave the Amino Acidswindow open the entire time, and click on New under the File menu (do NOT savecurrent changes!) to begin building each new conformation. Once you get the hang ofthis, the entire process should take approximately 15 minutes. Finally, determine theenergy of your derivative with the phi and psi angles for each of the conformations

20
below:
-strand in antiparallel -sheet -139o +135o
-strand in parallel -sheet -119o +113o
right-handed -helix -58o -47o
--When you are finished determining the energies of all of these conformations, choosethe highest-energy one and view it in the spheres mode. Can you see the unfavorablevan der Waals contacts?? Sketch this high-energy conformation in your notebook.
--On a piece of graph paper, construct a Ramachandran plot of your data. Note thatthe two -strands and the -helix are obviously allowed conformations--hence, thecorresponding energies will give you a range of allowed values with which to interpretthe energies of the other 36 conformations. Plot psi on the y-axis, phi on the x with -180o,-180o in the lower left corner, +180o,+180o in the upper right. From a neighboringgroup, obtain a copy of the Ramachandran plot for the other amino acid: glycine if youdid alanine or vice versa. Are the plots as expected? (That is, do they look like thosein your handout or in Stryer?) Discuss. Finally, on your Ramachandran plot forglycine, indicate the position and energy for a left-handed -helix--hint: you needn't useHyperChem to calculate these values!
PART III: PROBING THE SECONDARY STRUCTURE OF AN OCTADECAMER
You will construct a 18 amino acid polymer from six repeats of your tripeptide, in boththe -helix and beta strand conformations. --Alpha Helix: Select New under File Menu., and do not "Save current changes:(untitled)." Your previously constructed molecule will disappear. Open the Databaseswindow and select Amino Acids. Select alpha helix, begin with Ace, then six repeatsof your tripeptide, culminating with Nme. (Again, Ace is N-acetyl and Nme is N-methylcarboxamide; these groups provide the flanking peptide bonds for the terminal -carbons.) Under display menu select Recompute H bonds. They should appear aswhite dashed bonds up and down the helix. Verify that there are 11 main-chain atomsbetween H-bonding partners--13 atoms counting the carbonyl oxygen and aminohydrogen participating in the H-bond. Measure the distance from the amino-terminus tothe carboxy-terminus by choosing the Select Tool and clicking on the N-terminalnitrogen atom and the C-terminal capping carboxamide nitrogen atom. (This latternitrogen atom is chosen, rather than the C-terminal carbonyl carbon, so that thedistanced spanned includes 18 amino acids and 18 peptide bonds.) The distance isdisplayed on the bottom of the working space. Note the distance in your notebook. What is the distance spanned per amino acid? Rotate the image of your helix to viewdown the helical axis and note the position of the side chains. Notice how the N-
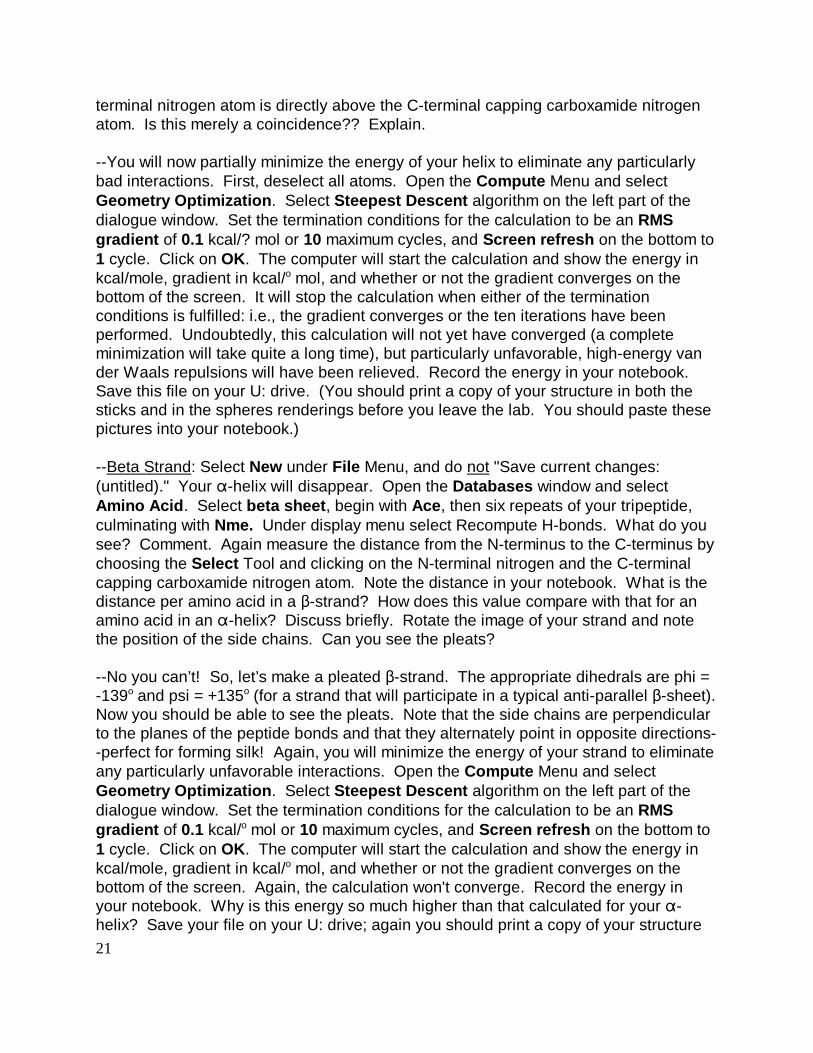
21
terminal nitrogen atom is directly above the C-terminal capping carboxamide nitrogenatom. Is this merely a coincidence?? Explain. --You will now partially minimize the energy of your helix to eliminate any particularlybad interactions. First, deselect all atoms. Open the Compute Menu and selectGeometry Optimization. Select Steepest Descent algorithm on the left part of thedialogue window. Set the termination conditions for the calculation to be an RMSgradient of 0.1 kcal/? mol or 10 maximum cycles, and Screen refresh on the bottom to1 cycle. Click on OK. The computer will start the calculation and show the energy inkcal/mole, gradient in kcal/o mol, and whether or not the gradient converges on thebottom of the screen. It will stop the calculation when either of the terminationconditions is fulfilled: i.e., the gradient converges or the ten iterations have beenperformed. Undoubtedly, this calculation will not yet have converged (a completeminimization will take quite a long time), but particularly unfavorable, high-energy vander Waals repulsions will have been relieved. Record the energy in your notebook. Save this file on your U: drive. (You should print a copy of your structure in both thesticks and in the spheres renderings before you leave the lab. You should paste thesepictures into your notebook.)
--Beta Strand: Select New under File Menu, and do not "Save current changes:(untitled)." Your -helix will disappear. Open the Databases window and selectAmino Acid. Select beta sheet, begin with Ace, then six repeats of your tripeptide,culminating with Nme. Under display menu select Recompute H-bonds. What do yousee? Comment. Again measure the distance from the N-terminus to the C-terminus bychoosing the Select Tool and clicking on the N-terminal nitrogen and the C-terminalcapping carboxamide nitrogen atom. Note the distance in your notebook. What is thedistance per amino acid in a -strand? How does this value compare with that for anamino acid in an -helix? Discuss briefly. Rotate the image of your strand and notethe position of the side chains. Can you see the pleats?
--No you can’t! So, let’s make a pleated -strand. The appropriate dihedrals are phi =-139o and psi = +135o (for a strand that will participate in a typical anti-parallel -sheet). Now you should be able to see the pleats. Note that the side chains are perpendicularto the planes of the peptide bonds and that they alternately point in opposite directions--perfect for forming silk! Again, you will minimize the energy of your strand to eliminateany particularly unfavorable interactions. Open the Compute Menu and selectGeometry Optimization. Select Steepest Descent algorithm on the left part of thedialogue window. Set the termination conditions for the calculation to be an RMSgradient of 0.1 kcal/o mol or 10 maximum cycles, and Screen refresh on the bottom to1 cycle. Click on OK. The computer will start the calculation and show the energy inkcal/mole, gradient in kcal/o mol, and whether or not the gradient converges on thebottom of the screen. Again, the calculation won't converge. Record the energy inyour notebook. Why is this energy so much higher than that calculated for your -helix? Save your file on your U: drive; again you should print a copy of your structure

22
in both the sticks and in the spheres renderings before you leave the lab.
PART IV: DOGFISH LACTATE DEHYDROGENASE
In this section, you will look at aspects of the structure of a protein, namely the enzymelactate dehydrogenase (LDH). This enzyme catalyzes the reaction:
--Exit from HyperChem. To look at this protein, we are going to use a program whichreads pdb files containing coordinates of the atoms from a model for the structuredetermined by X-ray crystallographic analysis. The program translates thesecoordinates into a visual image of the location of the atoms which can be easilymanipulated. There are several such programs available for free on the internet,including DeepView (seen in class) developed by the Swiss Protein Database group,Cn3D developed by the NCBI, and Protein Explorer developed by Eric Martz at UMassusing the visualization engine known as RasMol. Of these, Protein Explorer is theeasiest to use, and, for many purposes, gives the most useful images. It is a steadilyevolving program, and changes without warning – if you discover that some detail inthe instructions provided here does not seem to correspond to the screen that you see,congratulate yourself on your modernity, and carry on.

23
To open Protein Explorer, open the Firefox web browser. A recent modification claimsto work in any browser, so pick your poison according to your preferences; instructionshere were written while using Mozilla. In the URL window, typewww.proteinexplorer.org and hit enter. Notice that you end up somewhere else,namely at a Umass webset, looking at a webpage styled the "FrontDoor" to ProteinExplorer. There are a world of treasures accessible from this web page, virtually noneof which will be investigated here – that's why you have spare time. To gain realfluency with the program, you should try out the Tutorial, or even the QuickTour. Linksto both can be found in the right hand column just below the yellow banner. For thislaboratory, however, we will jump right into it, by calling up a structure file by name. We will start with the structur of a single subunit of dogfish lactate dehydrogenase,stored in the protein databases as the file 6ldh.pdb. To open and view this protein,enter "6ldh" (no quotes) in the box provided) in the center column just below the yellowbanner) and click the "Go" box. The visualization program will load, fetch the pdb filefrom a (different) web server, and calculate a visualization.
When it's done, the program will present you with three windows, two stacked on theleft side of the screen, and one on the right containing the visualized structure. Thisstructure will appear spinning in the field of view, and obscured by red balls which areactually the oxygen atoms of water molecules present (and resolved) in the crystal. Notice the lower window on the left side of the screen – a few basic characteristics ofthe structure are noted there. Most of the work we will do will be done using the upperwindow on the left. In particular, you will see two button in this window, labeled "Togglespinning" and "Hide/Show water". Click these, and observe the result in the image. Notice that when you click them, a sequence of commands appears in the lowerwindow on the left. These are RasMol commands, and there is a line provided to allowyou to enter such commands yourself. Place the mouse on any empty space in theright window, click, and drag. You will see the molecule move in response to yourmouse movements. The movement makes it easier to see how the molecule isdistributed in three dimensions, and allows you to look on all sides of the structure.
SECONDARY STRUCTURE
Let's examine the structure in more detail. Find the link to "QuickViews" in theupper left hand window, and click on it. This will divide the upper left hand window intotwo windows. The top contains tools, the middle contains information and options. Inthe upper window, find the buttons for spin and water, and turn off both if you haven'talready. Now look at the structure in the right hand window. This "worm" is the path ofthe protein backbone. Pull down the "Color" menu by clicking on the little blue box onits right, and select N>C rainbow. Identify the N-terminus.
Now let's investigate a few aspects of the secondary structure in this protein. Pulldown the "Color" menu again and select "Structure". Pull down the "Display" menu andselect "Cartoon". Just admire this image for a moment and chat approvingly with your
24
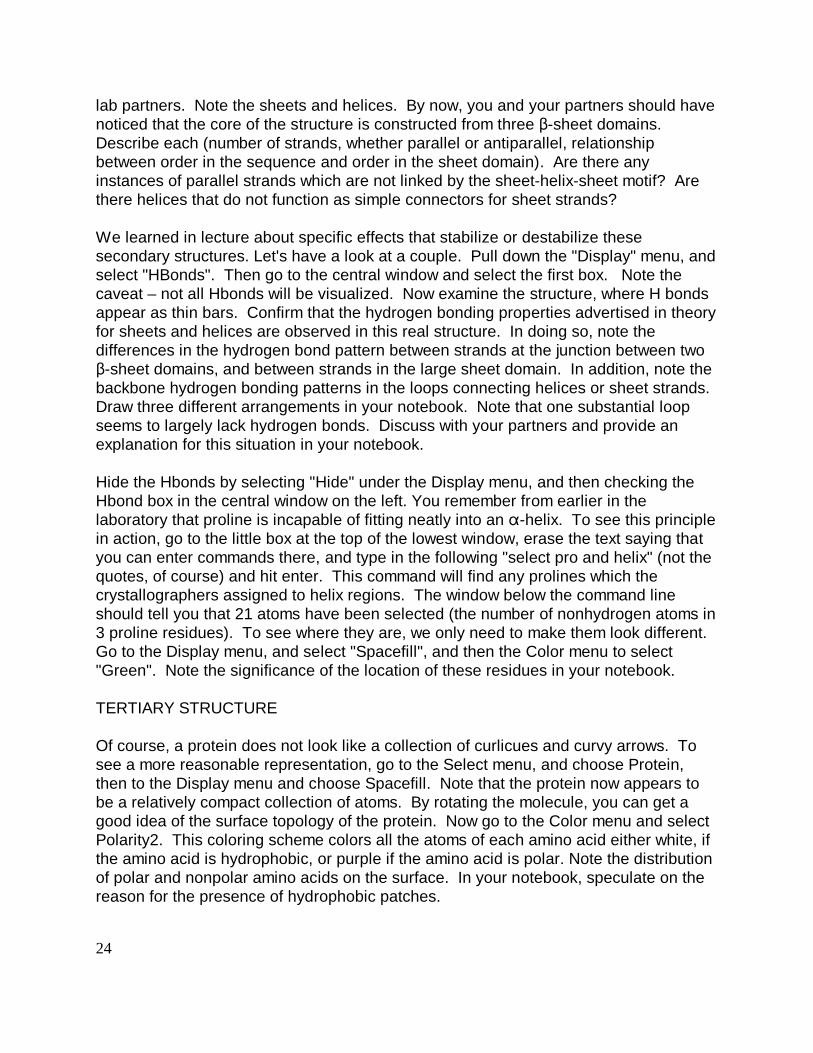
lab partners. Note the sheets and helices. By now, you and your partners should havenoticed that the core of the structure is constructed from three -sheet domains.Describe each (number of strands, whether parallel or antiparallel, relationshipbetween order in the sequence and order in the sheet domain). Are there anyinstances of parallel strands which are not linked by the sheet-helix-sheet motif? Arethere helices that do not function as simple connectors for sheet strands?
We learned in lecture about specific effects that stabilize or destabilize thesesecondary structures. Let's have a look at a couple. Pull down the "Display" menu, andselect "HBonds". Then go to the central window and select the first box. Note thecaveat – not all Hbonds will be visualized. Now examine the structure, where H bondsappear as thin bars. Confirm that the hydrogen bonding properties advertised in theoryfor sheets and helices are observed in this real structure. In doing so, note thedifferences in the hydrogen bond pattern between strands at the junction between two-sheet domains, and between strands in the large sheet domain. In addition, note thebackbone hydrogen bonding patterns in the loops connecting helices or sheet strands. Draw three different arrangements in your notebook. Note that one substantial loopseems to largely lack hydrogen bonds. Discuss with your partners and provide anexplanation for this situation in your notebook.
Hide the Hbonds by selecting "Hide" under the Display menu, and then checking theHbond box in the central window on the left. You remember from earlier in thelaboratory that proline is incapable of fitting neatly into an -helix. To see this principlein action, go to the little box at the top of the lowest window, erase the text saying thatyou can enter commands there, and type in the following "select pro and helix" (not thequotes, of course) and hit enter. This command will find any prolines which thecrystallographers assigned to helix regions. The window below the command lineshould tell you that 21 atoms have been selected (the number of nonhydrogen atoms in3 proline residues). To see where they are, we only need to make them look different. Go to the Display menu, and select "Spacefill", and then the Color menu to select"Green". Note the significance of the location of these residues in your notebook.
TERTIARY STRUCTURE
Of course, a protein does not look like a collection of curlicues and curvy arrows. Tosee a more reasonable representation, go to the Select menu, and choose Protein,then to the Display menu and choose Spacefill. Note that the protein now appears tobe a relatively compact collection of atoms. By rotating the molecule, you can get agood idea of the surface topology of the protein. Now go to the Color menu and selectPolarity2. This coloring scheme colors all the atoms of each amino acid either white, ifthe amino acid is hydrophobic, or purple if the amino acid is polar. Note the distributionof polar and nonpolar amino acids on the surface. In your notebook, speculate on thereason for the presence of hydrophobic patches.

25
In this view, the protein interior is invisible. To see into the interior, find the "Slab"button in the QuickViews window at the top of the left side of the screen. Click on thisbutton, and observe the effect on the image of the molecule. Essentially the moleculehas been sliced in half vertically, and you are looking at the cut surface, i.e., the proteininterior. You can move the plane of slicing forward and back by holding down theControl (Ctrl) key while dragging the mouse up and down in the viewing window. Bydoing this, you can have a look at all parts of the protein interior. Note the distributionof hydrophilic and hydrophobic amino acids in the cell interior, as well as the degree ofclose-packing which you find there.
EVERYBODY HAS ONE
If you check, you'll find that the window containing the Front Door to Protein Explorer isstill open. Go to that window and load a new structure by entering the code "1LLD" inthe little window in the center column. This file contains the structure of an LDHmolecule isolated from a bacterium. While we and dogfish are rather close cousins, it'sbeen a long time (2.5-3 billion years or so) since there was an organism which couldhave counted both us and any bacterium among its descendants. What could we haveinherited in common from that old geezer? To investigate one possibility, examine theorganization of secondary structure in this bacterial LDH molecule (display as cartoon,colored by structure). To do that, you'll need to look at only one of the two subunits. You can do that by choosing "Chain A" from the Select Menu, followed by "Only" fromthe Display menu. If you follow this immediately by clicking on the "Center" button, andthen hit Cancel, this subunit will be centered in the viewing window for yourconvenience. By switching between windows. compare this structure with thestructure of the dogfish LDH. Comment on the similarities and differences in yournotebook.

26
27
RESTRICTION NUCLEASE ANALYSIS OF VIRAL DNA
The analysis of large macromolecules, whether proteins or nucleic acids, isconsiderably facilitated by techniques for subdividing the molecules into sizes whichare more tractable for analysis. To be useful, the smaller fragments of the moleculesmust be specific, i.e., they must be produced in the same way from every molecule oftheir large precursors, and their relationship to the larger molecules from which theyare produced must be known. As we have seen, some proteases provide a basis forsuch techniques for protein analysis. For nucleic acids, the corresponding agents arethe restriction nucleases. These enzymes recognize and cleave DNA at specific, shortsequences. Because they are sequence specific, digestion of large DNA moleculesgives rise to fragments with defined sizes. Restriction nucleases have revolutionizedmolecular biology, not only because they permit defined subdivision of large DNAmolecules, but also because the sites at which cleavage occurs are used as “mileposts”- location markers in a polymer which is otherwise structurally featureless. Thelocations of functional positions (genes, operators, recombination sites, etc.) can thenbe defined with respect to such mileposts.
A first step in the characterization of a large DNA molecule is thus thedevelopment of a “restriction map” of the DNA, a linear diagram of the DNA markedwith the locations of sites cleaved by various restriction enzymes. An example of sucha map is shown below for the DNA from the bacteriophage . Generation of the datawhich give rise to such a map is straightforward: restriction enzymes are commerciallyavailable, and the restriction reaction itself and size analysis of its products aretechnically trivial. Analysis of these products, on the other hand, is a logical challenge.
The DNA fragments produced in these reactions are analyzed by sizefractionation on agarose gels. Agarose is a thermotropic medium: dilute solutions (ca1%) are liquids at temperatures above about 40°C, but become relatively solid at lowertemperatures (just like Jello, although the interactions are somewhat different). Onceseparated, the DNA fragments can be visualized (at sub-microgram levels) by soakingthe gels in ethidium bromide. This planar, polycyclic molecule binds to DNA byintercalation between the DNA base pairs; when it is intercalated, the dye fluoresces abright orange upon excitation with UV light.
In this experiment, we will attempt to generate a restriction map for the DNAmolecule which is the entire genome of bacteriophage . We will use the restrictionsites for the restriction enzyme EcoR1 (from Escherichia coli) as our reference point foranalysis of the maps for BamH1 (from Bacillus amyloliquifaciens H), Hind III (fromHemophilus influenza D), and Xho I (from Xanthomonas holicola).
28
PROCEDURES:
Restriction of DNA
The reaction mixtures for restriction of the DNA should each be made up on icein the following order:
32.5l H2O5 l 10x concentrated incubation (not electrophoresis) buffer2.5l DNA (0.2 g/l)5 l enzyme #15 l enzyme #2, if there are two, or H2O
Be careful to make each addition to the bottom, rather than on the walls, of the tube. Change tips to avoid cross-contaminating reagents! Mix the contents by gently“flicking” the tube with your finger. If droplets are left on the wall, a brief centrifugationwill drive them to the bottom of the tube. When all of the samples are ready, andsecurely labelled, transfer them to the 37° bath and incubate for 60 minutes. At the endof this time, stop the reactions by the addition of 5 l of “stop” solution (150 mM EDTA;50% glycerol; 0.1% bromphenol blue). Finally, unless directed otherwise, heat thestopped reactions for 5 minutes at 65°C and quick-cool (plunge the tubes into icewater).
Pouring the Gel
Mix 180 ml of H2O, 20 mls of 10x concentrated electrophoresis buffer (500 mMTris-HCl, pH 7.8; 60 mM sodium acetate; 10 mM EDTA) and 1.6 g of agarose. Dissolvethe agarose by bringing the solution just to the boiling point, swirling, reheating,swirling, etc., until the solution is completely clarified. Remove from heat and allow thesuspension to cool.
While the agarose solution is prepared, the electrophoresis tray should beprepared as well. To this end, tape across the open ends of the “gel trays”, folding thecorners neatly so that the seal is watertight. Seal the seams by dripping a bead ofagarose from your hot agarose solution along the tray/tape seams, using a Pasteurpipette. Place the sealed tray on a flat surface, position the well former so that it isabout 1 inch from one end of the tray and raised 1 mm above the glass surface. Pourthe moderately cool agarose into the tray and allow it to set.
Prepare 1 liter of electrophoresis buffer (900 ml of water plus 100 ml of the 10xconcentrated electrophoresis buffer, well mixed) and pour some of this buffer into thegel apparatus. Remove the support from the wellformer, leaving the wellformer itselfsticking into the gel. Remove the tape from the ends of the gel tray, put the gel trayinto the electrophoresis tank, and add more buffer until the gel is submerged to a depth

29
of 2-3 mm. Finally, gently tease out the wellformer.
Electrophoresis
When all of the digested DNA samples are ready for electrophoresis, preparesome blank samples by mixing 90 l H2O and 10 l of “stop” solution. Practice loading30 l of this solution into the wells at the edges of the gel. then load your various DNAsamples into the remaining wells, avoiding the outermost wells. Note carefully theorder in which your samples are loaded, and choose your wells to give an asymmetricpattern of loaded wells (so that you can recognize which sample is which, even if thegel is upside down). Cover the apparatus, connect the leads so that the DNA willmigrate through the gel towards the anode (positive) side, and turn on the power,setting the voltage to 30 V. The gels will be run overnight, and the TA will remove themin the morning and stain them by soaking in a solution of 0.5 g/ml ethidium bromide. Once stained, the gels will be photographed.
Data Analysis
On the day following the laboratory, photos of the gels will be posted on thecourse website. Using the Eco R1 fragments as molecular weight markers, assignsizes to all of the various visible fragments. Using the double digestion data, and anypartial digestion fragments which you can identify, each group should draw a map ofthe genome, indicating the location of as many sites as can be tentatively assigned. The logic used in making the site assignments should be laid out in your notebook asclearly (and briefly) as you can manage. The lab grade for this exercise will beassigned primarily on the basis of the clarity and brevity of this last item, not on theaccuracy of the map.
Incubation Buffer
The ideal incubation buffer is different for different restriction enzymes,principally in the amount of salt present. Our digestions will all be performed in:“1” x incubation buffer:
50 mM Tris-HCl pH 8.0100 mM NaCl10 mM MgCl2

30
Digestions
Groups should prepare samples of DNA digested as follows:
1. Eco R12. BamH1 or Hind III, depending on assignment3. Xho I4. Eco R1, no 65° treatment5. BamH1 (or Hind III), no 65° treatment6. Xho I, no 65° treatment7. Eco R1 (once more, for luck)8. Eco R1 and BamH1 (or Hind III)9. Eco R1 and Xho I10. Xho I and BamH1 (or Hind III)11. Undigested DNA (no enzyme)

31
A bit of Log scale graph paper for sketching a Log (Mol Wt) vs distance plot:

32

33
TRANSPORT LAB
Introduction
The hydrophobic character of the plasma membrane endows it with its essentialphysiological property, impermeability to the common water soluble, lipid-insolublemolecules. While this is an asset in the retention of the cellular machinery andmetabolic intermediates, it offers an obstacle to entry of essential nutrients. In order toovercome this difficulty, cells have evolved special transport mechanisms involvingspecific protein molecules which recognize and translocate small molecules across thehydrophobic barrier of the plasma membrane. The simplest of these mechanismsinvolves a type of protein which facilitates the movement of a specific molecule acrossthe otherwise impermeable membrane and allows the equilibration of concentrations onthe two sides. No metabolic energy is required for this process; net movement is drivenby the energy stored in the concentration gradient across the membrane. this processhas been called facilitated diffusion or carrier mediated transport. The best studiedexample is the glucose transport system of the human erythrocyte. Glucose entry intomost animal cells (with the exception of the renal tubule and intestine) occurs via thissame mechanism. Examples of facilitated diffusion of carbohydrates have beendescribed in yeast and E. coli. glucose uptake by facilitated diffusion is seen in yeastduring anaerobic alcoholic fermentation. Efficient flow of glucose into this cell ismaintained by the rapid hydrolysis of polysaccharides by externally located enzymesleading to a high local concentration of glucose near the plasma membrane. The greatadvantage of facilitated diffusion to the cell's economy is that no metabolic energy isrequired for the operation of the carrier. The primary disadvantage of such amechanism over active transport is the inability of facilitated diffusion to scavengenutrients at low concentrations from the environment. Thus, survival by cellspossessing this primitive transport mechanism depends on relatively highconcentrations of nutrient in the external medium.
One may speculate that many organisms have found such facilitated diffusionsystems either entirely unsuitable or inefficient when required to extract substances intrace amounts in the external environment. Under these conditions a definite selectiveadvantage was conferred upon those organisms which evolved transport systemscapable of efficiently scavenging low concentrations of nutrients in the medium. E. coli,for example, found low concentrations of lactose in their natural environment of thelower gut of mammals. Scavenging this metabolizable sugar presumably gave theseorganisms a significant selective advantage over their neighbors. While anexpenditure of metabolic energy is required for active transport, it must have beenoutweighed by the advantages accrued from the ability to utilize this additional nutrient.

34
Bacterial Coupled Transport
In 1963 Mitchell(1) proposed that microorganisms couple the movement ofprotons down their electrochemical gradient with the uphill membrane transport ofvarious substrates (substrate-proton symport). According to the chemiosmotichypothesis, cells extrude protons either as a result of oxidative electron transport(aerobically) or as a result of the activity of a membrane-bound ATPase(anaerobically). Such proton extrusion results in both a membrane potential (insidenegative) and a pH gradient (inside alkaline). The energy stored in thiselectrochemical gradient of hydrogen ions is converted into active transport of thesubstrate by coupling of the flows of the two substances. According to Mitchell'snomenclature, the electrochemical force or protonmotive force (p) is equal to the sumof the electrical potential across the membrane () and the potential due to the pHgradient (expressed in electrical units). At 25° and with pH equal to the outside pHminus the inside pH, the relationship would take the following form:
pmv = mv -59mvpH
A still-current model for the transport processes in bacteria like E. coli, S. lactis,and S. faecalis is diagrammed below.(2-4)
35
In bacteria that can function aerobically, oxidation is thought to drive a pumpwhich pushes H+ to the outside of the cell. Thus, metabolic energy is used to establisha pH-gradient and most likely a membrane potential () as well. Glucose, forexample, can ultimately provide the energy to run the proton pump during oxidation. Inturn, the protonmotive “force” (p) generated as a result of oxidation can be used forthe phosphorylation of ADP, or can be used to drive the transport of metabolites intothe cell against concentration gradients. (Notice the similarity to the oxidativephosphorylation process in the mitochondrion.)
Under anaerobic conditions glycolytic degradation of glucose forms ATP whichcan drive the membrane-bound ATPase in the reverse direction to produce a pHgradient and a (ATP hydrolysis makes the inside of the cells alkaline and negativein potential relative to the medium). This membrane energy or protonmotive energycan be used for the active transport of metabolites into the cell.
References **Abstracted from the following papers:T. H. Wilson, E. R. Kashet and M. Kusch. (1972). The Molecular Basis of Biological
Transport. Miami Winter Symp. 3 (eds. J. F. Woesner and F. Huijing),Academic Press.
E. R. Kashket and T. H. Wilson. (1973). Proc. Natl. Acad. Sci. 70:2866.
1. Mitchell, P. (1963). Molecule, Group and Electron Translocation Through NaturalMembranes. Biochem. Soc. Symp. 22:142-168.
2. Maloney, P. C., E. R. Kashket and T. H. Hastings. (1974). A Protonmotive ForceDrives ATP Synthesis in Bacteria. Proc. Natl. Acad. Sci. 71:3896.
3. Kaback, H. R. (1986). Active Transport in E. coli: Passage to Permease. Ann.Rev. Biophys. Biophys. Chem 15:279-319.
4. Harold, F. M. (1986). The Vital Force: A Study of Bioenergetics. W. H. Freeman. Esp. Ch. 5.

36
Experimental
In this experiment you will study the energy-dependent uptake (active transport)of radioactive methyl thiogalactoside (14C-TMG), a nonmetabolizable substrate. Sinceyou will be attempting to produce accumulation of TMG against a concentrationgradient, it is clear that an energy source is needed to drive the uptake. Yet theanaerobe, S. lactis 7962 cannot undertake oxidative phosphorylation. And the sampleof cells that we prepare for you will have been washed free of all metabolizablesubstrates by several centrifugations in either distilled water or tris buffer. Thus theonly way you can establish the protonmotive force necessary to drive uptake of TMG isby (1) changing the pH of the medium containing the cells, (2) artificially inducing amembrane potential (e.g., a K+-diffusion potential), or (3) adding a metabolizablesubstrate such as glucose, arginine, or galactose, which provide energy for anaerobicmetabolism leading to the synthesis of ATP and the pH gradient and the membranepotential that result from ATP hydrolysis.
You will measure the active transport of 14C-TMG by S. lactis cells driven byenergy sources (1), (2), and (3). Therefore, in one experiment you will artificiallygenerate a pH gradient across the cell membrane by lowering the pH of the mediumcontaining the cells. In another experiment, you will artificially induce a membranepotential by using the K+-selective ionophore, valinomycin. Glucose will provide theenergy source in the third experiment.
The second experiment is based on the following considerations. Cells thatwere grown in a high potassium concentration medium can be considered to be K+-richinside (even after washing, since the cell membrane is relatively impermeable to K+). Ifthe cells are suspended in a K+-free medium (sodium phosphate buffer) there is a largeK+gradient across the membrane, but the K+ diffusion potential is still zero because noK+ can move across the membrane. If valinomycin is added to the medium, a diffusionpotential is immediately established that has a magnitude given approximately by theNernst potential.
VM=59mV log (K+in / K+
out)
Since K+out~0 in your experiment, you will be generating the maximum VM possible when
you add valinomycin.
Preparation, Filtration, and Timing
Have 10 filters ready for each experiment and a place to put each of them afterthe sample has been taken. Before taking a sample, place a filter on the suctionapparatus, fasten the chimney, and pass 5 ml of the appropriate buffer through the filterunder suction. Keep the vacuum on until the sample has been taken and washed. When applying the cell sample to the filter, put it dead-center on the filter and thenrapidly wash with 5 ml buffer. Cut the vacuum, remove the filter, and set up for anothersample. The wet filters containing the cell samples should be placed at a labeled and

37
PROTECTED location to dry for at least half an hour (a gust of wind as a student walksby will scatter and mix the dried filters). After drying the filters, place each in aseparate scintillation counting vial which has been appropriately labeled with 1/4-inchletters just below the threads for the lid. (Remember scintillations of light must be ableto get out of the counting vial to reach the photomultiplier tube during the countingprocess.) the label on the scintillation vial should include your lab day, group symbol,experiment number, and sample number.
A short time is required for the TMG concentration to come to equilibrium oncethe cells have been added to the TMG-containing buffer. If t = 0 is defined as the timeat which you add the valinomycin, glucose, or acid to begin the uptake reaction, i.e., toenergize the cells, then you should take samples at approximately -5, -3, and -1 minutein order to determine the equilibrium TMG distribution before cell energization. Afterenergization, the first 3 samples should be taken as rapidly as possible. The last 4samples can then be stretched out so that the last one is taken at about 10 minutesafter energization. Before you begin each experiment I suggest making a table that hasthe sample number, anticipated time of sampling, and blanks for the actual time ofsampling.
In a day or two we will have counted your samples. The results will be posted inthe course web site. In addition we will post the concentration of the stock cellsuspension (mg dry cell weight per ml stock suspension). From this value you maycalculate the total internal cell volume in your “uptake-reaction” mixture, since it hasbeen determined that the internal volume of S. lactis is 1.83 l cell water per mg dry cellweight. We will also provide you with the specific activity of the 14C-TMG and with thecounts per minute of the TMG-containing buffer solution to which you added cells tobegin an uptake experiment.
pH Experiment
You will be provided with a “pH” buffer tube. this tube contains 14C-TMG and 0.1M KCl in 1 ml of dilute (5 mM) KPO4 buffer at pH 7.5. Allow this tube to come to roomtemperature, add 0.2 ml of the stock cell suspension and begin taking samples. Washthese samples with the dilute pH 7.5 buffer (labeled “Dilute pH-wash”). Energize thecells at t = 0 by adding 0.2 ml of the 0.5 M KPO4 acidic (pH 4.7) buffer. The addition ofthis acidic buffer should bring the cell incubation medium pH down to about 5.5. Washcell samples taken after energization with the pH 4.5 buffer (labeled “Acid pH wash”).
Valinomycin Experiment
You will be given a “VAL” buffer tube. This tube contains 14C-TMG in 1 ml 0.1 MNaPO4 buffer at pH 7.5. Allow this tube to come to room temperature, add 0.2 ml of thestock cell suspension, and begin taking samples. Wash the samples with NaPO4 pH7.5 buffer (labeled “Val Wash”). Have the lab instructor add a few l of valinomycinsolution when you want to energize the cells (make sure the instructor is nearby andhas VAL before you begin the experiment). The same wash buffer can be used afterenergization.

38
Glucose Experiment
This experiment will be run exactly as the VAL experiment, except that you willenergize with 40 uL of 1 M glucose rather than with valinomycin.
Write-Up
1. Plot counts/min vs. time for the three experiments. On the right handvertical axis plot [TMG]in/[TMG]out.
2. Discuss whether your results support the Mitchell Theory for the activeuptake of nutrients by bacterial cells.
3. Speculate about why some of your curves for 14C-TMG uptake rapidlydecrease after several minutes.
4. Why isn't the membrane potential VM = when K+-containing cells aresuspended in K+-free medium in the presence of valinomycin?

39
MITOCHONDRIA: OXIDATION AND PHOSPHORYLATION
Introduction
In this experiment we will measure mitochondrial electron transport and themechanism and efficiency of its coupling to the synthesis of ATP. Mitochondrialelectron transport will be measured by measuring the consumption of O2 using theClark polarographic electrode (whose operation is described in the Appendix).
The tools for analyzing the system will be various substrates and inhibitors; themethod for application of these tools will be measurement of their effect on the rate ofADT-dependent oxygen consumption. You are not provided with specific protocols forthese experiments. Rather, you are in the position of those scientists who firstdeveloped the schemes for oxidative phosphorylation that we have studied anddiscussed outside the laboratory. To illuminate your path, you should consult the textand lecture notes for basic information about the mechanism of electron transport andoxidative phosphorylation.
Biochemicals
The solutions of substrates and inhibitors which will be provided in thelaboratory are detailed in TABLE I Reagents. Many of these are expensive and shouldnot be wasted. The amounts to be added can be calculated from the suggesteddilutions from stock and a measurement of the volume of your incubation chamber.
All acids have been adjusted to pH 7.2 with NaOH.
These solutions may be added to the reaction chambers with Pipetmenmicropipets. When making these additions, exercise care to minimize the introductionof bubbles.
ADP (50 l) should be addeded accurately. Interpretation of your experimentswill require knowing how much ADP has been added. Every effort will be made toprovide an ADP solution whose A260 (1 cm) is 0.502 when diluted 1000-fold. The MerckIndex gives 260 for ADP as 15.4 x 10³ liters/mole cm. If the actual value for the A260 isdifferent, you will be informed at the beginning of the laboratory.
Mitochondrial Preparations
Rat-liver mitochondria will be prepared by the instructors before you arrive, bythe following procedure. The liver is homogenized in a medium containing 0.25 Msucrose, 0.003 M EDTA, and 0.005 M Tris-Cl, pH 7.4. A teflon-pestle Potter-Elvenhjemhomogenizer (clearance, about 0.006 inches) operating at about 300 RPM is used andcare is taken to keep the tube immersed in an ice bath during homogenization. Afterremoval of nuclei and unbroken cells by centrifugation at 600 g for 10 minutes, themitochondria are pelleted at 10,000 g for 15 minutes. In order to remove endogenoussubstrates, the mitochondria are washed twice with 0.25 M sucrose, 0.005 M Tris Cl,pH 7.4 by centrifugation at 10,000 g for 15 minutes. After the final wash, the
40
mitochondrial preparation is suspended in the sucrose-Tris solution to give about25 mg protein/ml and stored on ice. Addition of about 0.3 ml of this suspension toincubation medium in the reaction chamber should result in a satisfactory rate of O2consumption. If not, the amount of mitochondrial suspension added should be adjustedto give a rate (in the presence of substrate alone) which will result in the exhaustion ofthe O2 in the chamber in no more than 5 minutes.
The incubation medium contains:Sucrose 0.10 MKCl 0.020 MPotassium Phosphate 0.003 M pH 7.5Tris-Cl 0.005 M
The function of the sucrose in all of the above solutions is to maintain isotonicitywithout increasing ionic strength; Tris-Cl is a buffer, and phosphate a requirement foroxidative phosphorylation. The EDTA in the homogenization medium serves to removeCa++, which can act as an uncoupling agent. It is of the utmost importance that themitochondria be kept cold until they are used; deterioration and uncoupling can result ifthey are warmed.
Experimental: Oxygen Uptake
An example of a typical experiment is attached, to give you an idea ofhow the data from your experiments might look. Consider this diagramcarefully, so that you understand what each of the parts measures, andhow each of the parts might vary given the presence of differentsubstrates and/or inhibitors. Your expectations in this regard are thehypotheses which your experiments should test.
Note that the graph contains a critical number: the concentration of O2which is present at the beginning of the experiment. This numberincorporates a conversion factor between voltage (what your recorderactually measures) and O2 concentration. This factor is only valid if thebuffer is O2-saturated at the beginning of the experiment (before additionof mitochondria). To be sure that this conversion factor applies, it isessential that your buffer be well aerated, and temperature equilibrated(at room temperature) before beginning the experiment. Conversion ofthis concentration to moles of oxygen requires, in turn, that you know (andrecord) the total volume in the reaction chamber.
Other hints:
Once mitochondria have been added to the chamber, carry out theexperiment without delay.After making an addition, it is necessary to observe the recorder tracinguntil the full effects of the addition have been displayed, after whichfurther additions should be made quickly. For example, after addition ofsubstrate, allow the reaction to proceed far enough to establish a straight

41
line on the recorder before making the next addition. After adding ADP,observe the stimulation of O2 uptake (if any); when the rate returns to asteady state at or near its pre-ADP slope, a further addition may be madeif desired.
Be sure to wash the chamber and electrode thoroughly after using aninhibitor.The first run with any new mitochondrial preparation should include a testfor stimulation by ADP and note should be made of the respiratory controlratio (see below). A preparation which is not stimulated by ADP to give acontrol ratio of at least 3 is damaged and uncoupled and useless for manyof the experiments described below.
Suggested Experiments
You should devise and carry out any experiments desired. Some suggestions:
1. Determine P:O ratios for several substrates and thereby deduce therelative contribution to phosphorylation within the electron transport chain. NOTE: It is very difficult to determine P:O ratios for ascorbate-TMPD, asthe latter can act as an uncoupling agent. Addition of Mg++ (5-10 mM) hasbeen reported to prevent this action.
2. Using inhibitors, establish the order of entry of various substrates into theelectron transport chain. Where does the endogenous substrate enter?
3. Investigate whether the different uncouplers such as dinitrophenol,valinomycin, Ca++, or the electron shunt TMPD, all operate in the sameway.
References
Packer, L. (1967). Experiments in Cell Physiology, Academic Press, NY. Seeexperiments 14, 15, and 19.
Estabrook, R. W. and M. E. Pullman (eds.). (1967). Methods in Enzymology,Vol. X, academic Press, NY. See articles 6 and 8.

42
TABLE I: Reagents
StockConcentration
Suggested FinalConcentration forTrial
Item M Solvent M
Sodium Succinate 1 H2O 5x10⁻³
Sodium -Ketoglutarate
1 H2O 5x10⁻³
Sodium -Hydroxybutyrate
1 H2O 5x10⁻³
Na ADP 0.03 H2O 3x10⁻⁴
2,4-Dinitrophenol 0.01 EtOH 10-4*
Na Azide 1 H2O 10-2*
Na Malonate 1 H2O 2x10⁻²*
Oligomycin 1x10⁻³M EtOH 2x10⁻⁶*, (or 5xmore)
Na Ascorbate 1 H2O 5x10⁻³
Rotenone 1x10⁻⁴ EtOH 10-6*
Antimycin 1x10⁻³ EtOH 10-6-10-5*
TMPD 0.05 H2O 1x10⁻⁴, (or less)
MgCl2 1 H2O 5 to 10x10-3*
CaCl2 1 H2O 5 to 10x10-3*
Valinomycin 1x10⁻⁴M EtOH 1x10⁻⁶*
* concentrations should be increased if necessary

43

44
APPENDIX
THE CLARK OXYGEN ELECTRODE
The oxygen electrode (illustrated below) consists of a platinum cathode and asilver anode immersed in a KCl solution. this assembly is separated from the solutionto be tested by a thin teflon membrane which is freely permeable to O2 but not to water,salts, and most other solutes. A potential of 0.6-0.8 volts is maintained across theelectrode. In the presence of O2, the following reactions take place:
Anode: 2Ag + 2Cl- -> 2AgCl + 2e-
Cathode: 2H+ + 1/2 O2 + 2e- -> H2O
Because these reactions depend on the availability of oxygen, the current which flowsthrough the electrode is stoichiometrically proportional to the O2 concentration. Thiscurrent may be carried through a standard resistance and the voltage across theresistance recorded with a strip-chart recorder, or the current may be passed into anoperational amplifier current to voltage converter. With either circuit the output voltage(recorder deflection) is proportional to O2 concentration at the electrode membrane.