Embed Size (px)
Citation preview
LABORATORY METHODS FOR ASSIGNING AGES TO
ANADROMOUS SALMONID SCALE SAMPLES
Prepared by:
Kristin K. Wright, Ageing Laboratory Coordinator Kala Hernandez, Fisheries Technician Clifford Hohman, Fisheries Technician Leslie Reinhardt, Fisheries Technician William Schrader, Fisheries Technician
Timothy Copeland, Senior Fishery Research Biologist
IDFG Report Number 14-xx March 2014
PROCESS AND METHODS FOR ASSIGNING AGES TO
ANADROMOUS SALMONIDS FROM SCALE SAMPLES
By
Kristin K. Wright Kala Hernandez Clifford Hohman Leslie Reinhardt William Schrader
Timothy Copeland
Idaho Department of Fish and Game 600 South Walnut Street
P.O. Box 25 Boise, ID 83707
To
U.S. Department of Energy Bonneville Power Administration
Division of Fish and Wildlife P.O. Box 3621
Portland, OR 97283-3621
Project Numbers 1990-055-00, 1991-073-00 Contract Number xxxxx
IDFG Report Number 14-xx March 2014
i
TABLE OF CONTENTS Page
ABBREVIATIONS AND ACRONYMS ......................................................................................... 3
ABSTRACT ................................................................................................................................. 4
INTRODUCTION ........................................................................................................................ 5
METHODS .................................................................................................................................. 6
Sample Collection .................................................................................................................... 6 Data Entry and Quality Control ................................................................................................. 8 Sample Preparation ................................................................................................................. 9
Mounting ............................................................................................................................... 9 Imaging ............................................................................................................................... 10
Age Determination ................................................................................................................. 11 Scale Patterns..................................................................................................................... 11 Assigning Ages ................................................................................................................... 12 Age Accuracy and Precision ............................................................................................... 13
ACKNOWLEDGEMENTS ......................................................................................................... 17
LITERATURE CITED ................................................................................................................ 18
ii
LIST OF TABLES Page
Table 1. BioSample ID’s assigned to species, life stage and location of sample
collections. ........................................................................................................... 8
LIST OF FIGURES
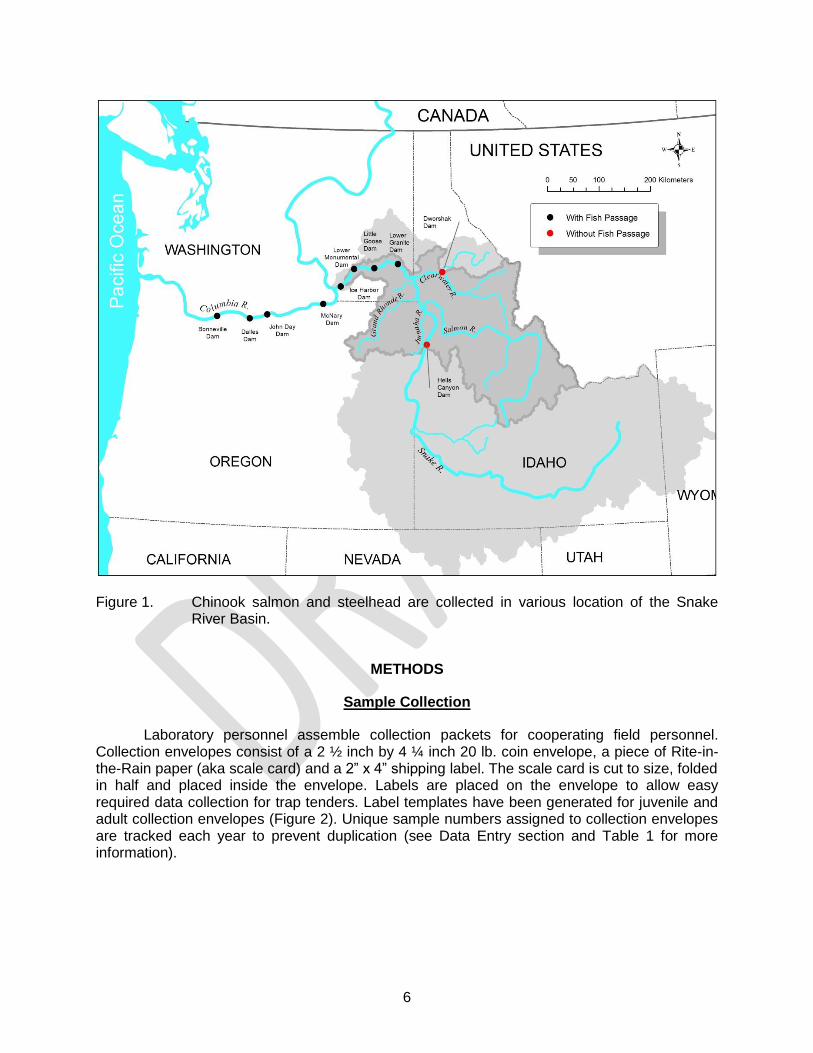
Figure 1. Chinook salmon and steelhead are collected in various location of the
Snake River Basin. .............................................................................................. 6
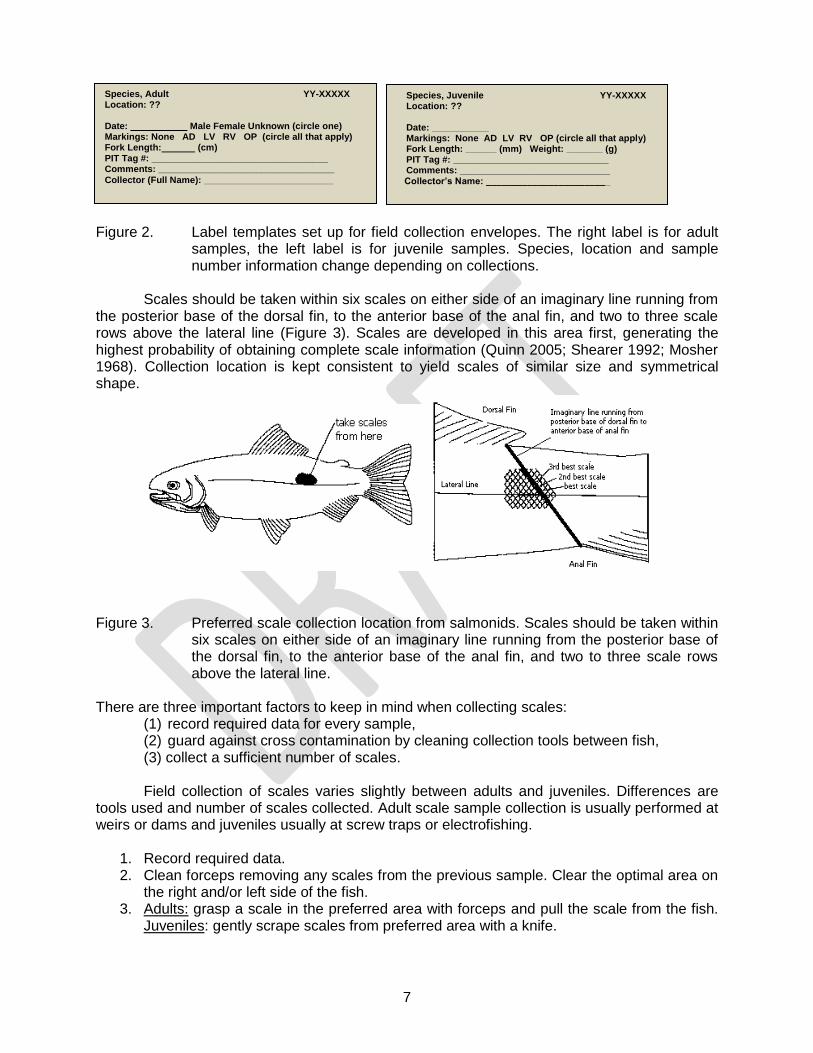
Figure 2. Label templates set up for field collection envelopes. The right label is for adult samples, the left label is for juvenile samples. Species, location and sample number information change depending on collections. ............................ 7
Figure 3. Preferred scale collection location from salmonids. Scales should be taken within six scales on either side of an imaginary line running from the posterior base of the dorsal fin, to the anterior base of the anal fin, and two to three scale rows above the lateral line. ...................................................... 7
Figure 4. Aligning of cleaned adult scales with posterior fields aligned in the same direction. ............................................................................................................ 10
Figure 5. Place empty slide on top of the slide with scales. The frosted ends should be on opposite sides so the sample number is visible on either side. Secure slides together with tape over the frosted ends. ..................................... 10
Figure 6. Chinook schematic to determine total age, egg to spawn. Chinook in schematic is aged as a 1.1, total age is 3. .......................................................... 14
Figure 7. Steelhead schematic to determine total age, egg to spawning. Steelhead in schematic is aged as a 2.1, total age is 4. ...................................................... 15

3
ABBREVIATIONS AND ACRONYMS
BPA Bonneville Power Administration
IDFG Idaho Department of Fish and Game
ISEMP Integrated Status and Effectiveness Monitoring Program
INPMEP Idaho Natural Production Monitoring and Evaluation Project
ISMES Idaho Steelhead Monitoring and Evaluation Studies
ISS Idaho Supplementation Studies
LGD Lower Granite Dam
PIT Passive Integrated Transponder
PTAGIS PIT Tag Information System
VSP Viable Salmonid Population
4
ABSTRACT
The purpose of the Anadromous Scale Ageing Laboratory in conjunction with the Idaho Steelhead Monitoring and Evaluation Studies (ISMES) and the Idaho Natural Production Research Monitoring and Evaluation Project (INPMEP) is to provide information for monitoring the status and guide restoration of Idaho’s wild Chinook salmon and steelhead populations. Scale samples from adult and juvenile Chinook salmon and steelhead are collected at numerous weirs and screw traps across Idaho, and at Lower Granite Dam. After field sample collection, scale ageing laboratory personnel perform data entry and quality control, sample preparation (mounting and imaging), and age determination. Laboratory protocols have stabilized over the last several years, this report is intended to document current protocols.
Authors: Kristin K. Wright Ageing Laboratory Coordinator Kala Hernandez Fisheries Technician Clifford Hohman Fisheries Technician Leslie Reinhardt Fisheries Technician William Schrader Fisheries Technician Timothy Copeland Senior Fishery Research Biologist

5
INTRODUCTION
Anadromous salmonids have complex life histories that include variable amounts of time in freshwater and saltwater environments (Elliott 1994; Quinn 2005). Scales have been used as a tool to interpret life history strategies in salmon populations for at least a century (e.g., Gilbert 1912). The benefit of using scales for age determination is that scales can easily be removed and collection does not require killing or severely harming the fish. However, the use of scales does have some issues including regeneration, scale resorption and false annuli (Quist et al. 2013). Regeneration is by far the main characteristic that prevents total age estimation with scales.
Populations of steelhead trout and Chinook salmon, hereafter Chinook, in the Snake River basin (Figure 1) declined substantially in the late 1960’s and early 1970’s following the construction of hydroelectric dams in the Columbia and Snake Rivers (Raymond 1988). Chinook and steelhead were classified as threatened under the Endangered Species Act in 1992 and 1997, respectively. Large-scale hatchery programs were established to mitigate for the impacts of hydroelectric dam construction and operation. The Idaho Department of Fish and Game (IDFG) anadromous fish program’s long-range goal, consistent with basin wide mitigation and recovery programs, is to preserve Idaho’s salmon and steelhead runs and recover them to provide benefit to all users (IDFG 2012).
The purpose of the IDFG Anadromous Scale Ageing Laboratory in conjunction with the
Idaho Steelhead Monitoring and Evaluation Studies (ISMES) and the Idaho Natural Production Research Monitoring and Evaluation Project (INPMEP) is to provide information for monitoring the status of Idaho’s wild Chinook and steelhead populations and guide their restoration. Management to achieve these goals requires an understanding of how salmonid populations function (McElhany et al. 2000) as well as regular status assessments. Age data are used to assign juveniles and returning adults to specific brood years, for cohort analysis, and to estimate productivity and survival rates (Copeland et al. 2007; Copeland et al. 2011, 2012; Kennedy et al. 2011, 2012; Schrader et al. 2011, 2012).
The IDFG Anadromous Scale Ageing Laboratory was formed in 2006 when a need for
ageing anadromous salmonids was growing. In 2007, funding was acquired to staff an 8-month technician to improve stability and assist in aging the increasing number of samples. Coordination with other laboratories occurred during this time to organize and set up laboratory protocols. In 2008, the laboratory grew to two 8-month technicians, who quickly became two year round technicians. Another expansion came in 2009 with the addition of new basin wide projects and funding was available to hire on more personnel. This expansion included hiring a laboratory coordinator and two more technicians (one full time, one 8-month). Since 2009 laboratory personnel has remained stable.
Since the laboratory was formed in 2006 methods have improved in response to new
resources and knowledge. It is important to follow a protocol and use consistency in scale collection and processing. This report is intended to document and make available the materials and methods used in our laboratory. This is an abridged version of our in-house laboratory manual which is highly detailed. We have organized this report into the four major scale processing phases: sample collection, data entry and quality control, sample preparation (mounting and imaging), and age determination.
6
Figure 1. Chinook salmon and steelhead are collected in various location of the Snake
River Basin.
METHODS
Sample Collection
Laboratory personnel assemble collection packets for cooperating field personnel. Collection envelopes consist of a 2 ½ inch by 4 ¼ inch 20 lb. coin envelope, a piece of Rite-in-the-Rain paper (aka scale card) and a 2” x 4” shipping label. The scale card is cut to size, folded in half and placed inside the envelope. Labels are placed on the envelope to allow easy required data collection for trap tenders. Label templates have been generated for juvenile and adult collection envelopes (Figure 2). Unique sample numbers assigned to collection envelopes are tracked each year to prevent duplication (see Data Entry section and Table 1 for more information).
7
Figure 2. Label templates set up for field collection envelopes. The right label is for adult
samples, the left label is for juvenile samples. Species, location and sample number information change depending on collections.
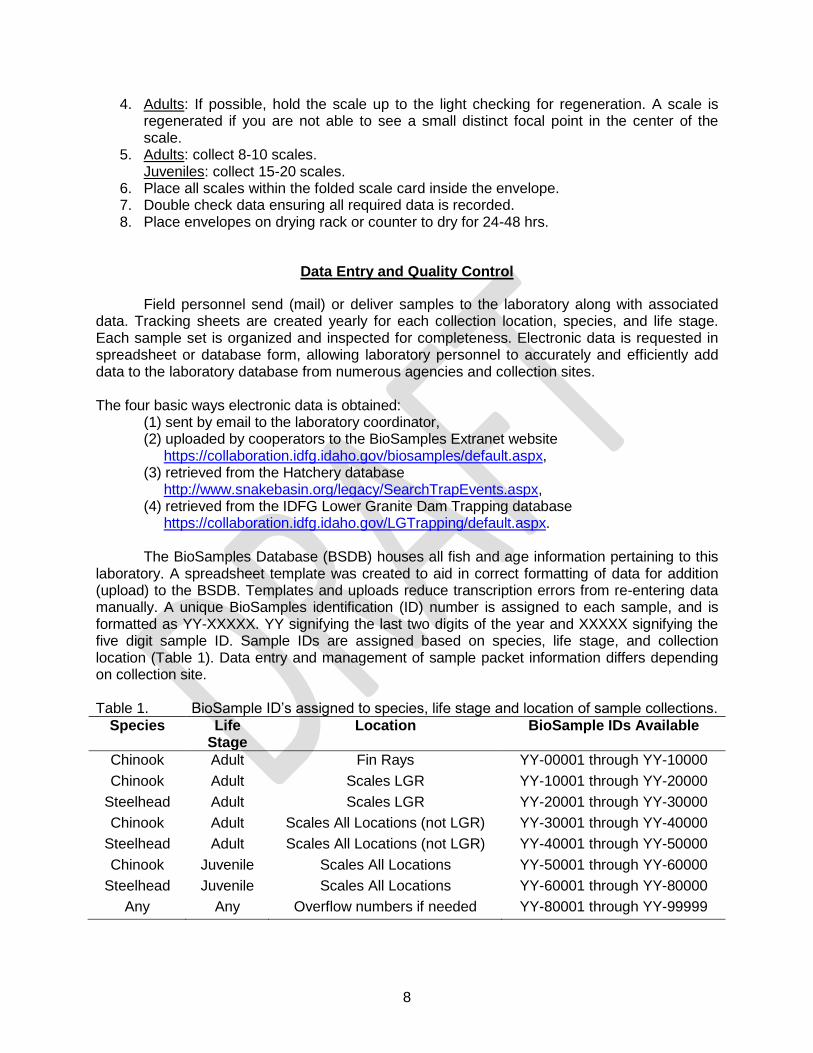
Scales should be taken within six scales on either side of an imaginary line running from
the posterior base of the dorsal fin, to the anterior base of the anal fin, and two to three scale rows above the lateral line (Figure 3). Scales are developed in this area first, generating the highest probability of obtaining complete scale information (Quinn 2005; Shearer 1992; Mosher 1968). Collection location is kept consistent to yield scales of similar size and symmetrical shape.
Figure 3. Preferred scale collection location from salmonids. Scales should be taken within
six scales on either side of an imaginary line running from the posterior base of the dorsal fin, to the anterior base of the anal fin, and two to three scale rows above the lateral line.
There are three important factors to keep in mind when collecting scales:
(1) record required data for every sample, (2) guard against cross contamination by cleaning collection tools between fish, (3) collect a sufficient number of scales.
Field collection of scales varies slightly between adults and juveniles. Differences are tools used and number of scales collected. Adult scale sample collection is usually performed at weirs or dams and juveniles usually at screw traps or electrofishing.
1. Record required data. 2. Clean forceps removing any scales from the previous sample. Clear the optimal area on
the right and/or left side of the fish. 3. Adults: grasp a scale in the preferred area with forceps and pull the scale from the fish.
Juveniles: gently scrape scales from preferred area with a knife.
Species, Adult YY-XXXXX Location: ?? Date: Male Female Unknown (circle one) Markings: None AD LV RV OP (circle all that apply) Fork Length: (cm) PIT Tag #: __________________________________ Comments: __________________________________
Collector (Full Name): _________________________
Species, Juvenile YY-XXXXX Location: ?? Date: ___________ Markings: None AD LV RV OP (circle all that apply) Fork Length: ______ (mm) Weight: _______ (g) PIT Tag #: ______________________________ Comments: _____________________________
Collector’s Name: ________________________
8
4. Adults: If possible, hold the scale up to the light checking for regeneration. A scale is regenerated if you are not able to see a small distinct focal point in the center of the scale.
5. Adults: collect 8-10 scales. Juveniles: collect 15-20 scales.
6. Place all scales within the folded scale card inside the envelope. 7. Double check data ensuring all required data is recorded. 8. Place envelopes on drying rack or counter to dry for 24-48 hrs.
Data Entry and Quality Control
Field personnel send (mail) or deliver samples to the laboratory along with associated data. Tracking sheets are created yearly for each collection location, species, and life stage. Each sample set is organized and inspected for completeness. Electronic data is requested in spreadsheet or database form, allowing laboratory personnel to accurately and efficiently add data to the laboratory database from numerous agencies and collection sites. The four basic ways electronic data is obtained:
(1) sent by email to the laboratory coordinator, (2) uploaded by cooperators to the BioSamples Extranet website https://collaboration.idfg.idaho.gov/biosamples/default.aspx, (3) retrieved from the Hatchery database http://www.snakebasin.org/legacy/SearchTrapEvents.aspx, (4) retrieved from the IDFG Lower Granite Dam Trapping database https://collaboration.idfg.idaho.gov/LGTrapping/default.aspx. The BioSamples Database (BSDB) houses all fish and age information pertaining to this
laboratory. A spreadsheet template was created to aid in correct formatting of data for addition (upload) to the BSDB. Templates and uploads reduce transcription errors from re-entering data manually. A unique BioSamples identification (ID) number is assigned to each sample, and is formatted as YY-XXXXX. YY signifying the last two digits of the year and XXXXX signifying the five digit sample ID. Sample IDs are assigned based on species, life stage, and collection location (Table 1). Data entry and management of sample packet information differs depending on collection site. Table 1. BioSample ID’s assigned to species, life stage and location of sample collections.
Species Life Stage
Location BioSample IDs Available
Chinook Adult Fin Rays YY-00001 through YY-10000
Chinook Adult Scales LGR YY-10001 through YY-20000
Steelhead Adult Scales LGR YY-20001 through YY-30000
Chinook Adult Scales All Locations (not LGR) YY-30001 through YY-40000
Steelhead Adult Scales All Locations (not LGR) YY-40001 through YY-50000
Chinook Juvenile Scales All Locations YY-50001 through YY-60000
Steelhead Juvenile Scales All Locations YY-60001 through YY-80000
Any Any Overflow numbers if needed YY-80001 through YY-99999

9
Sample packet data is quality checked and corrected by comparing packet information to electronic data. Quality control is essential in data management to ensure accuracy and reduce subsequent time resolving errors in the future, and it reduces or eliminates uncertainty for data users (biologists and managers). Data such as collection date, length, marks, and tags are checked overall for major discrepancies and checked randomly for minor discrepancies. Major discrepancies include incorrect year, incorrect length units, missing marks or tags, and missing data for samples in hand. Minor discrepancies are generally transcription errors.
Sample information is ready for upload after formatting and quality control are complete.
Uploads are posted on the BioSamples Extranet website, where the database coordinator retrieves the document and uploads (appends) data to the BSDB. Archived data can be retrieved by laboratory personnel, cooperators, biologists and managers that are granted access.
Sample Preparation
Scale sample preparation prior to age determination consists of sorting and selecting, mounting and imaging. Sorting and selecting is done to identify adult scales that are best suited for ageing. Mounting of adults and juveniles is performed by securing them between two glass microscope slides. Care must be taken to prevent sample contamination and to keep slides free from finger prints and smudging. Imaging is done digitally using a computer and microscope with a digital camera. This section explains our mounting and imaging processes.
Mounting
Samples are mounted between glass microscope slides to allow easy handling, imaging, and archiving of scale samples. Mounting is a several step process and varies between adults and juveniles. Adults require extra processing time through sorting and cleaning.
Adult mounting requires the following:
1. Label the frosted-ends of two microscope slides with the sample number. 2. Remove the scale card from the envelope. 3. Remove scales from card using forceps placing them on a stereo microscope stage. 4. Sort scales. Select six non-regenerated and least resorbed scales to mount. 5. Place un-used scales securely back in envelope (fold scale card) 6. Clean dried mucus and skin off scales. Using water, rub them between your fingers. Pat
dry with paper towel. 7. Aligning posterior field down, place cleaned scales on slide (Figure 4). 8. Secure slides together with a piece of tape wrapped around the ends of the long edges
(Figure 5). 9. Place mounted sample in envelope.

10
Figure 4. Aligning of cleaned adult scales with posterior fields aligned in the same
direction. Juvenile mounting requires the following:
1. Label the frosted-ends of two microscope slides with the sample number. 2. Remove the scale card from the envelope. 3. Remove scales from card using a scalpel. 4. Place at least 15-20 scales directly on one microscope slide. 5. Place un-used scales securely back in envelope (fold scale card) 6. Separate scales from each other so they are in a single layer and don’t overlap. 7. Secure slides together with a piece of tape wrapped around the ends of the long edges
(Figure 5). 8. Place mounted sample in envelope.
Figure 5. Place empty slide on top of the slide with scales. The frosted ends should be on
opposite sides so the sample number is visible on either side. Secure slides together with tape over the frosted ends.
Imaging
Digital images are archived for easy access, allowing viewing of images by multiple readers simultaneously, and to facilitate quantitative analysis. Imaging and ageing is done separately to maximize efficiency in each activity. Scales are imaged on a computer monitor using a Leica DM4000B compound microscope and a Leica DC500 digital camera. The imaging software currently in use is Image Pro Express. Laboratory personnel examine scales on each slide and select the best to image. Criteria used are cleanliness, non-regeneration, and least damaged (eroded). Generally three scales are imaged from each sample. Adult freshwater regions and juveniles are imaged using a 40x objective, while whole adult scales are imaged using a 12.5x objective. Overall, six images are taken for adults (three whole scale images and three close up freshwater images). Images are saved as JPEG. Naming convention includes BioSample ID followed by a, b, c (scale 1, 2, 3; e.g. 13-10001a). Freshwater images are distinguished with an “fw” ending (e.g. 13-10001a_fw).

11
Age Determination
Scale Patterns
Age determination is a practice of pattern recognition and has an element of subjectivity (Campana 2001), although we attempt to make it as objective as possible. As a fish grows so do their scales, forming concentric rings called circuli around the focus of the scale. Growth is prominent in the anterior portion of salmonid scales, as circuli abruptly end with the posterior region. Circuli are widely spaced during periods of fast growth, and narrowly spaced when growth slows (Quinn 2005). An annulus, one year of life, is identified as a dark band of narrowly spaced circuli. Annuli also exhibit cutting over, abrupt ending of circuli, which is a result of fast growth. Age is estimated by counting annuli that appear on scales.
Juvenile salmonids in the northern hemisphere are given an arbitrary birthdate of
January 1st (Quist et al. 2012, Bagenal and Tesch 1978). Thus, if a fall/winter annulus is seen on the scale margin before January 1st it is not counted. On the contrary, if an annulus is not seen on the scale margin after January 1st, and there is substantial growth past the last visible annulus (aka plus growth), this growth is considered evidence that an annulus will result in spring. Seasonal variability and diverse stream conditions cause wide variations in growth increments throughout Idaho. Familiarizing yourself with common patterns is an advantage and is encouraged. In general, Idaho juvenile Chinook and steelhead range from age zero to two, and zero to six, respectively.
Adult salmon scales are more complex than juvenile scales because they exhibit two
distinct regions, a freshwater/river region and a saltwater/marine region (Quinn 2005, Shearer 1992). There is a transition period of intermediate growth between freshwater and saltwater regions. This transition is a combination of freshwater plus growth and ocean entrance. Freshwater plus growth can exhibit faster growth put on in downstream tributaries. Ocean entrance can occur following spring plus growth or following a winter annulus. Saltwater growth results in wider circuli spacing, but their annuli are similar to those in freshwater, exhibiting narrow spacing and cutting over.
Adult Chinook freshwater ages range from zero to two and saltwater ages range from
zero to four. Most Chinook smolt as yearlings (one year olds), those exhibiting zero and two freshwater annuli are rare. Majority of Chinook return as one, two and three saltwater fish. Chinook that exhibit rapid saltwater growth after entering the ocean but lack a saltwater annulus are known as minijacks (Johnson et al. 2012). Minijacks make long-distance migrations to the ocean, or estuary, then return to spawn after only a few months. Chinook that exhibit four saltwater annuli are rare.
Adult steelhead ages range from one to six freshwater and one to three saltwater.
Freshwater variability results from diverse stream conditions and seasonal variability. One and two saltwater age classes are dominant. Steelhead can also exhibit iteroparity (repeat spawning), which results in a scar mark on their scales. These scars, known as a spawn checks, exhibit surface erosion and generally have an uneven shape resulting from erosion on the scale margin. Spawn checks are caused by resorption of circuli that occurs during their return to freshwater for spawning (Davis and Light 1985). After resorption occurs and the fish returns to saltwater, scale growth resumes, forming a spawn check (White and Medcof 1968).
There are several factors that present potential issues when reading scales.
Regeneration occurs when a scale is lost and a replacement grows rapidly. Replacement scales
12
will lack age and growth information prior to scale loss, thus can cause age underestimation. Formation of the first annulus, or lack thereof, can cause ages to be underestimated (Lentsch and Griffith 1987). Scale resorption on the scale margin can cause annuli to be obscured or lost (Hernandez et al. 2013), causing underestimated age. Identification of freshwater annuli, freshwater plus growth, and ocean entrance in adults can be difficult due to differing transition zones, leading to either overestimation or underestimation of age. False annuli (check) identification can be an issue in all life stages and species. Checks are thinner than annuli and many times do not follow consistently from one lateral axis to the other. Checks can result in overestimation of age. The occurrence of hatchery fish can cause confusion in freshwater age determination. Hatchery fish can exhibit numerous checks in their freshwater region, causing ages to be overestimated.
Assigning Ages
Readers independently view scale images on a computer monitor and assign ages using electronic worksheets. Worksheets contain pertinent information including location, sample ID, and collection date (not length). Each sample is assigned to two readers. Readers assign freshwater and saltwater ages in separate columns, allowing identification of smolt age and saltwater age. If ageing juveniles, freshwater age is determined and a zero is entered for saltwater. Samples can be discarded if an age cannot be determined. If a freshwater age has been discarded, readers can still assign a saltwater age. Readers also assign a confidence rank to their age and make comments pertaining to their age interpretation.
Confidence rankings are as follows:
Rank 1 – High: Highly confident in assigned age, and highly confident in your ability to
reproduce age. Rank 2 – Moderate: Moderately confident in assigned age, and good chance of
repeating age. Sample may have a quality issue that decreases your confidence, such as faint annuli or split annuli.
Rank 3 – Low: Not confident in assigned age, fairly high level of uncertainty in ability to
reproduce age. Sample may have a quality issue that highly decreases your confidence such as heavy checks or unclear/diffuse annuli. If a sample is assigned a rank of 3 that sample will automatically be re-examined by readers in the referee session.
Rank 4 – Unreadable – Unable to provide an age due to condition issue or consensus
was not attained. Clarify with a comment.
Once initial ages are assigned, ages from each reader are compared and discrepancies between readers are resolved (see Accuracy and Precision). Reader ages, ranks, comments, and the agreed upon final age are entered into BioSamples DB.
We use the European system to designate final ages; two numerals separated by a decimal. The first numeral (left of decimal) is the freshwater age; the second numeral (right of decimal) is the saltwater age. For example, a Chinook that is aged as a 1 freshwater and 3 saltwater, final age is 1.3. To designate minijacks from juvenile samples, the abbreviation MJ is used for saltwater age instead of zero (0) (e.g. 1.MJ). For repeat spawning steelhead, an ‘S’ designates a winter spent in freshwater while on a spawning run. The ‘S’ is positioned on the
13
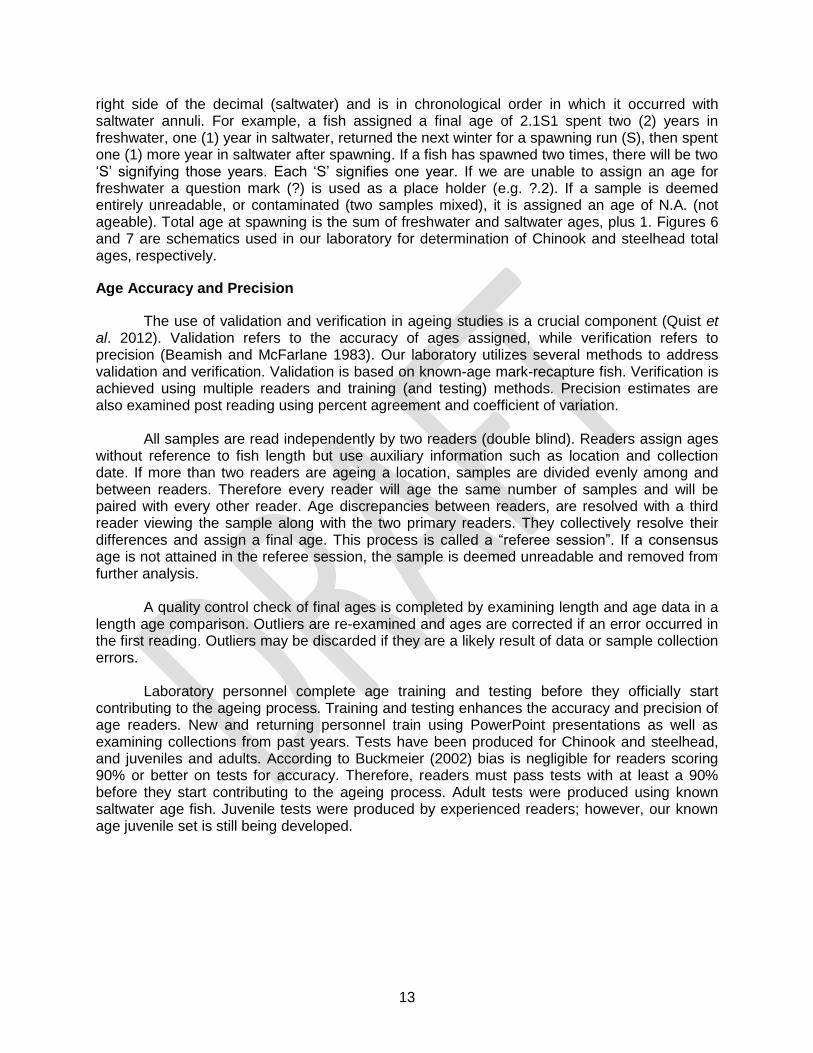
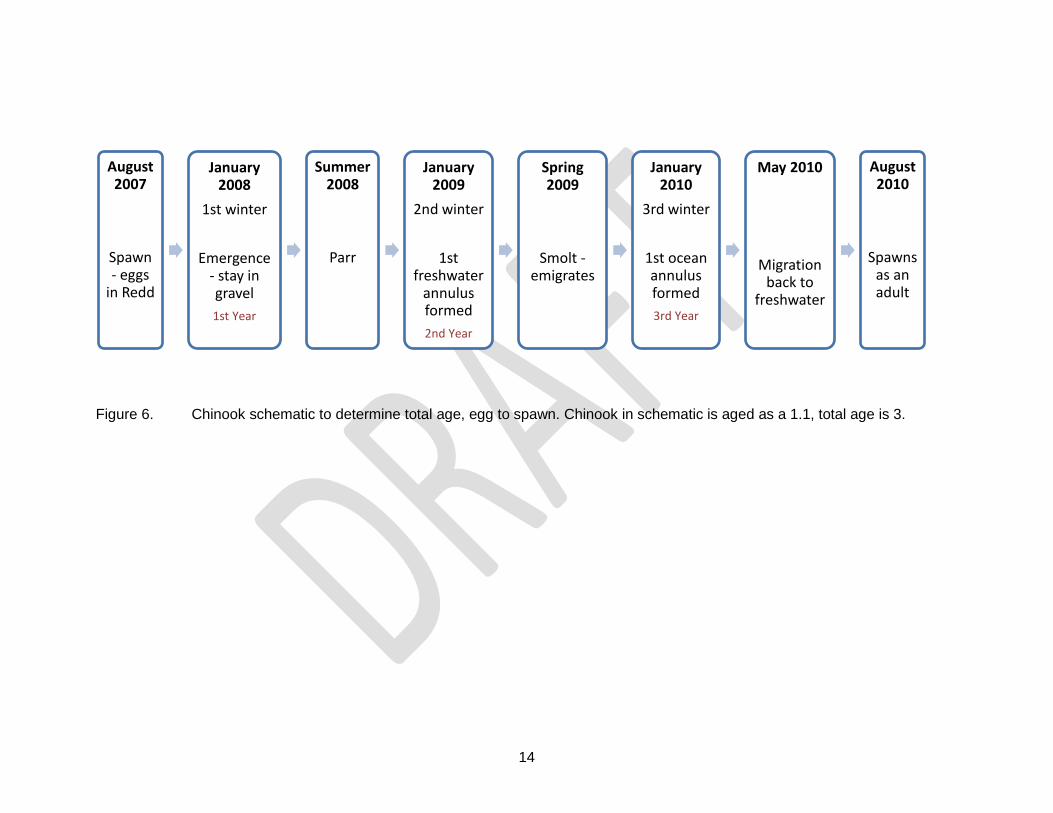
right side of the decimal (saltwater) and is in chronological order in which it occurred with saltwater annuli. For example, a fish assigned a final age of 2.1S1 spent two (2) years in freshwater, one (1) year in saltwater, returned the next winter for a spawning run (S), then spent one (1) more year in saltwater after spawning. If a fish has spawned two times, there will be two ‘S’ signifying those years. Each ‘S’ signifies one year. If we are unable to assign an age for freshwater a question mark (?) is used as a place holder (e.g. ?.2). If a sample is deemed entirely unreadable, or contaminated (two samples mixed), it is assigned an age of N.A. (not ageable). Total age at spawning is the sum of freshwater and saltwater ages, plus 1. Figures 6 and 7 are schematics used in our laboratory for determination of Chinook and steelhead total ages, respectively.
Age Accuracy and Precision
The use of validation and verification in ageing studies is a crucial component (Quist et al. 2012). Validation refers to the accuracy of ages assigned, while verification refers to precision (Beamish and McFarlane 1983). Our laboratory utilizes several methods to address validation and verification. Validation is based on known-age mark-recapture fish. Verification is achieved using multiple readers and training (and testing) methods. Precision estimates are also examined post reading using percent agreement and coefficient of variation.
All samples are read independently by two readers (double blind). Readers assign ages
without reference to fish length but use auxiliary information such as location and collection date. If more than two readers are ageing a location, samples are divided evenly among and between readers. Therefore every reader will age the same number of samples and will be paired with every other reader. Age discrepancies between readers, are resolved with a third reader viewing the sample along with the two primary readers. They collectively resolve their differences and assign a final age. This process is called a “referee session”. If a consensus age is not attained in the referee session, the sample is deemed unreadable and removed from further analysis.
A quality control check of final ages is completed by examining length and age data in a
length age comparison. Outliers are re-examined and ages are corrected if an error occurred in the first reading. Outliers may be discarded if they are a likely result of data or sample collection errors.
Laboratory personnel complete age training and testing before they officially start
contributing to the ageing process. Training and testing enhances the accuracy and precision of age readers. New and returning personnel train using PowerPoint presentations as well as examining collections from past years. Tests have been produced for Chinook and steelhead, and juveniles and adults. According to Buckmeier (2002) bias is negligible for readers scoring 90% or better on tests for accuracy. Therefore, readers must pass tests with at least a 90% before they start contributing to the ageing process. Adult tests were produced using known saltwater age fish. Juvenile tests were produced by experienced readers; however, our known age juvenile set is still being developed.
14
Figure 6. Chinook schematic to determine total age, egg to spawn. Chinook in schematic is aged as a 1.1, total age is 3.
August 2007
Spawn - eggs
in Redd
January 2008
1st winter
Emergence - stay in gravel
1st Year
Summer 2008
Parr
January 2009
2nd winter
1st freshwater
annulus formed
2nd Year
Spring 2009
Smolt - emigrates
January 2010
3rd winter
1st ocean annulus formed
3rd Year
May 2010
Migration back to
freshwater
August 2010
Spawns as an adult
15
Figure 7. Steelhead schematic to determine total age, egg to spawning. Steelhead in schematic is aged as a 2.1, total age is 4.
May 2006
Spawn - eggs in Redd
July 2006
Emergence
January 2007
1st winter
1st freshwater
annulus
1st Year
Summer 2007
Parr
January 2008
2nd winter
2nd freshwater
annulus
2nd Year
May 2008
Smolt - emigrates
January 2009
3rd winter
1st ocean
annulus formed
3rd Year
August 2009
Migration back to
freshwater January
2010
4th winter
Spends winter in
freshwater
No annulus formed
4th Year
May 2010
Spawns as an adult
16
An unbiased age is the preferred goal for any age validation study (Campana 2001). Currently we have age validation for adult saltwater ages and spawn checks. We are currently working on freshwater age validation. Saltwater validation is achieved using a mark-recapture validation with PIT tagged fish. PIT tag information is available on the PTAGIS Information System website http://www.ptagis.org/. To obtain a known saltwater age, there must be evidence of outmigration (juvenile detections at dams) and return migration (adult ladder detections at dams). Repeat spawners must have adult detections in multiple years (skip spawner) or several months later (consecutive spawner). Our current goal for validation is 100 known age fish per collection year, minimum of 30. Known age fish are aged blindly with other samples to determine yearly accuracy.
Readers familiarize themselves with current patterns by examining known-age samples
collected that year. This process is part of our training each year to give laboratory personnel the opportunity to discuss new prevalent markings and changing patterns. Readers complete these examinations and discussions before age determination begins.
Parentage Based Tagging (PBT), a genetic method that can be used to assign hatchery
fish back to their parents (Steele et al. 2013), and in turn back to brood year, is in its early stages of use. This method of total age validation may prove useful in aiding identification of hatchery fish via scale patterns. Because hatchery fish exhibit considerably different freshwater growth patterns than wild fish, we don’t believe this method will contribute much too freshwater age validation
Precision metrics summarized post hoc are coefficient of variation, average percent error
and percent agreement. Coefficient of variation is thought to be more rigorous and more flexible than average percent error (Chang 1982, Campana 1995) thus it is used and reported more regularly. Percent agreement is not relied upon as a strong estimation of precision but does provide us with some useful information when comparing readers in the laboratory to one another.

17
ACKNOWLEDGEMENTS
Many fisheries professionals have contributed to the startup and development of this laboratory and our protocols. Idaho Department of Fish and Game staff included: Alan Byrne, Melanie Dohner, June Johnson, Lisa Kautzi, Stephanie Kraft, Rebecca Schoon, Bill Schrader, and Jody White. PSMFC staff included: Rachel Neuenhoff.

18
LITERATURE CITED
Bagenal, T. B. and F. W. Tesch. 1978. Age and Growth. Pages 101-136 in .T. B. Bagenal, editor. Methods for assessment of fish production in freshwater, 3rd edition. Blackwell scientific Publications, Oxford, England.
Beamish, R. J. and G. A. McFarlane. 1983. The forgotten requirement for age validation in
fisheries biology. Transactions of the American Fisheries Society 112:735-743. Buckmeier, D. L. 2002. Assessment of reader accuracy and recommendations to reduce
subjectivity in age estimation. Fisheries 27:10-14. Campana, S. E. 2001. Accuracy, precision and quality control in age determination, including a review of the use and abuse of age validation methods. Journal of Fish Biology 59: 197- 242. Copeland, T., M. W. Hyatt, and J. Johnson. 2007. Comparison of methods used to age
spring/summer Chinook salmon in Idaho: validation and simulated effects on estimated age composition. North American Journal of Fisheries Management 27:1393-1401.
Copeland T., R. V. Roberts, and K. A. Apperson. 2011. Idaho steelhead monitoring and
evaluation studies. Idaho Department of Fish and Game Report 11-09. Annual report 2010, BPA Project 1990-055-00. https://collaboration.idfg.idaho.gov/FisheriesTechnicalReports/Forms/AllItems.aspx.
Copeland T., R. V. Roberts, and K. A. Apperson. 2012. Idaho steelhead monitoring and
evaluation studies. Idaho Department of Fish and Game Report 12-04. Annual report 2011, BPA Project 1990-055-00. https://collaboration.idfg.idaho.gov/FisheriesTechnicalReports/Forms/AllItems.aspx.
Davis, N. D. and J. T. Light. 1985. Steelhead age determination techniques. Document
submitting to annual meeting of the INPFC, Tokyo, Japan, November 1985. University of Washington, Fisheries Research Institute, FRI-UW-8506, Seattle.
Elliott, J. M. 1994. Quantitative ecology and the brown trout. Oxford University Press, New York. Gilbert, C. H. 1912. Age at maturity of the Pacific Coast salmon of the genus Oncorhynchus.
U.S. Bureau of Fisheries Bulletin 32:1-22. Hernandez, K., T. Copeland, and K. Wright. 2013. Scale resorption in migrating and spawning
steelhead trout of the Snake River basin. Manuscript in preparation. IDFG (Idaho Department of Fish and Game). 2007. Fisheries management plan 2007-2012.
IDFG, Boise. https://collaboration.idfg.idaho.gov/FisheriesTechnicalReports/Forms/AllItems.aspx.
Johnson, J., T. Johnson, and T. Copeland. 2012. Defining life histories of precocious male parr,
minijack, and jack Chinook salmon using scale patterns. Transactions of the American Fisheries Society 141:1545-1556.
19
Lentsch, L. D. and J. S. Griffith. 1987. Lack of first-year annuli on scales: Frequency of occurrence and predictability in trout of the western United States. In R. C. Summerfelt and G. E. Hall, editors. The age and growth of fish. Iowa State University Press. Ames, Iowa.
Mosher, K. H. 1968. Photographic atlas of sockeye salmon scales. Fishery Bulletin, 67(2), 243-
281. Raymond, H. L. 1988. Effects of hydroelectric development and fisheries enhancement on
spring and summer Chinook salmon and steelhead in the Columba River basin. North American Journal of Fisheries Management 8:1-24.
Kennedy, P., T. Copeland, J. Johnson, K. A. Apperson, J. Flinders, and R. Hand. 2011. Idaho
natural production monitoring and evaluation. Idaho Department of Fish and Game Report 11-23. Annual report 2009 and 2010, BPA Project 1991-073-00. https://collaboration.idfg.idaho.gov/FisheriesTechnicalReports/Forms/AllItems.aspx.
Kennedy, P., T. Copeland, J. Johnson, K. A. Apperson, J. Flinders, R. Hand, and M. Corsi.
2012. Idaho natural production monitoring and evaluation. Idaho Department of Fish and Game Report 12-18. Annual report 2011, BPA Project 1991-073-00. https://collaboration.idfg.idaho.gov/FisheriesTechnicalReports/Forms/AllItems.aspx.
McElhany, P., M. H. Ruckelshaus, M. J. Ford, T. C. Wainwright, and E. P. Bjorkstedt. 2000.
Viable salmonids populations and the recovery of evolutionarily significant units. National Oceanic and Atmospheric Administration Technical Memorandum NMFS-NWFSC-42.
Quinn, T. P. 2005. The behavior and ecology of Pacific salmon and trout. University of
Washington Press, Seattle, Wash. Quist, M. C., M. A. Pegg, and D. R. DeVries. 2012. Age and Growth. Pages 677-731 in A. V.
Zale, D. L. Parrish, and T. M. Sutton, editors. Fisheries Techniques, 3rd edition. American Fisheries Society, Bethesda, Maryland.
Schrader, W. C., T. Copeland, M. W. Ackerman, K. Ellsworth, and M. R. Campbell. 2011. Wild
adult steelhead and Chinook salmon abundance and composition at Lower Granite Dam, spawn year 2009. Idaho Department of Fish and Game Report 11-24. Annual report 2009, BPA Projects 1990-055-00, 1991-073-00, 2010-026-00. https://collaboration.idfg.idaho.gov/FisheriesTechnicalReports/Forms/AllItems.aspx.
Schrader, W. C., T. Copeland, P. Kennedy, M. W. Ackerman, K. K. Wright, and M. R. Campbell.
2012. Wild adult steelhead and Chinook salmon abundance and composition at Lower Granite Dam, spawn year 2010. Idaho Department of Fish and Game Report 12-16. Annual report 2010, BPA Projects 1990-055-00, 1991-073-00, 2010-026-00. https://collaboration.idfg.idaho.gov/FisheriesTechnicalReports/Forms/AllItems.aspx.
Shearer, W. M. (1992). Atlantic salmon scale reading guidelines. ICES cooperative research
report, 188.

20
Steele, C., J. McCane, M. Ackerman, N. Vu, M. Campbell, M. Hess, and S. Narum. 2013. Parentage based tagging of Snake River hatchery steelhead and Chinook salmon. Idaho Department of Fish and Game Report 13-23. Annual report 2013, BPA Project 2010-031-00.
https://collaboration.idfg.idaho.gov/FisheriesTechnicalReports/Forms/AllItems.aspx. White, H. C. and J. C. Medcof. 1968. Atlantic salmon scales as records of spawning history.
Journal of the Fisheries Research Board Canada 25(11):2439-2441.

21
Prepared by: Approved by: IDAHO DEPARTMENT OF FISH AND GAME Kristin K. Wright Peter F. Hassemer Ageing Laboratory Coordinator Anadromous Fisheries Manager Kala Hernandez Edward B. Schriever, Chief Fishery Technician Bureau of Fisheries Clifford Hohman Fishery Technician Leslie Reinhardt Fishery Technician William Schrader Fishery Technician Timothy Copeland Senior Fishery Research Biologist