Embed Size (px)
Citation preview

Labour Costsand the Future of
North America’s Auto Industry
Jim StanfordEconomist, CAW-Canada
CAR Management Briefing SeminarGrand Traverse MI, August 2011

Automotive Labour Costs:A Canadian Twist
• CAW founded in 1985.
• Membership up 50% since then.
• Egalitarian philosophical approach, but withcommitment to a viable, productive industry.
• Record of innovation in labour relations:
– CAMI, 3-shift, M80, Magna FFA, WCM
• Canadian productivity advantage ≈ 10%.
• More activist policy context.
– Auto Pact, higher PITs, health care ($5/hr)
• Different currency (volatile).
The Loonie Then and Now
$0.60
$0.70
$0.80
$0.90
$1.00
$1.10
2000 2001 2002 2003 2004 2005 2006 2007 2008 2009 2010 2011
$C
($U
.S.)
PPP Value
May 2009
25% above PPP
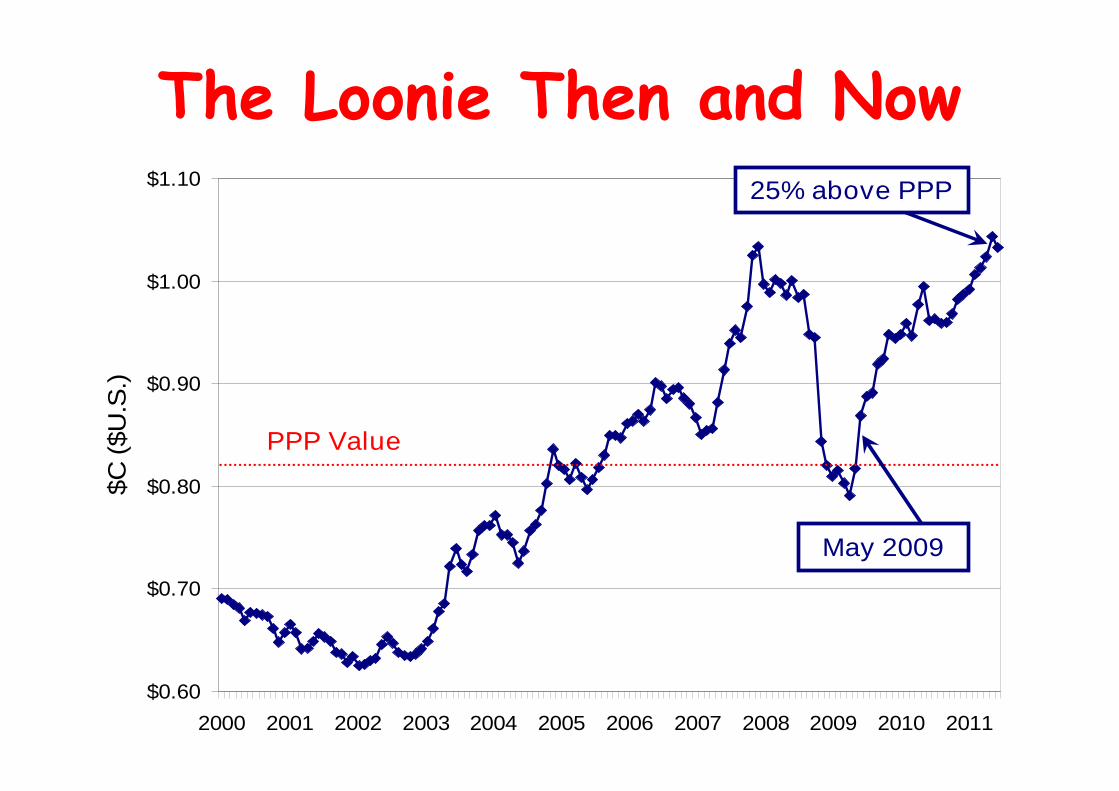
122%122100All Consumer
Prices (OECD)
113%$8.99$7.99Paperback Novel
(Danielle Steele)
115%$4.27$3.71Big Mac
128%$4.75$3.70Gasoline (US gal)
118%$28,875$24,495Impala LS MSRP
170%(Ont/Mich: 330%)
$338,700(Ont.: $352,500)
$198,900(Mich.: $106,800)Detached House
Canadaas %U.S.
CanadaU.S.
The 2009 Restructuring:North of the Border
• Canadian/Ontario governments contributedproportionately to the binational rescue.
– Proportional to Canadian share of output.
• GM and Chrysler avoided CCAA (“Chapter 11”).
• “Target” for labour costs: $57 (Cdn.).
• Formation of Canadian Health Care Trusts.
• Canadian “footprint” commitments.
• Canadian production & employment shares grew.
• CAW contracts expire Sept. 2012.
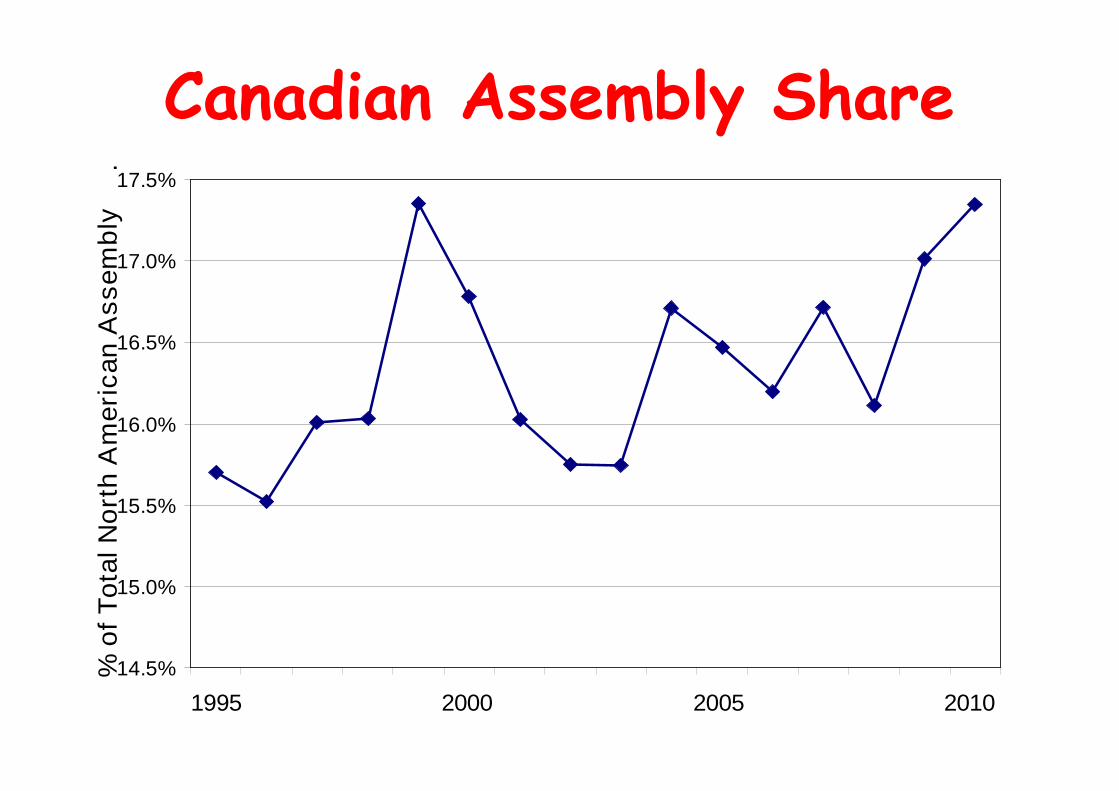
Canadian Assembly Share
14.5%
15.0%
15.5%
16.0%
16.5%
17.0%
17.5%
1995 2000 2005 2010
%o
fT
ota
lN
ort
hA
meri
can
Assem
bly
.
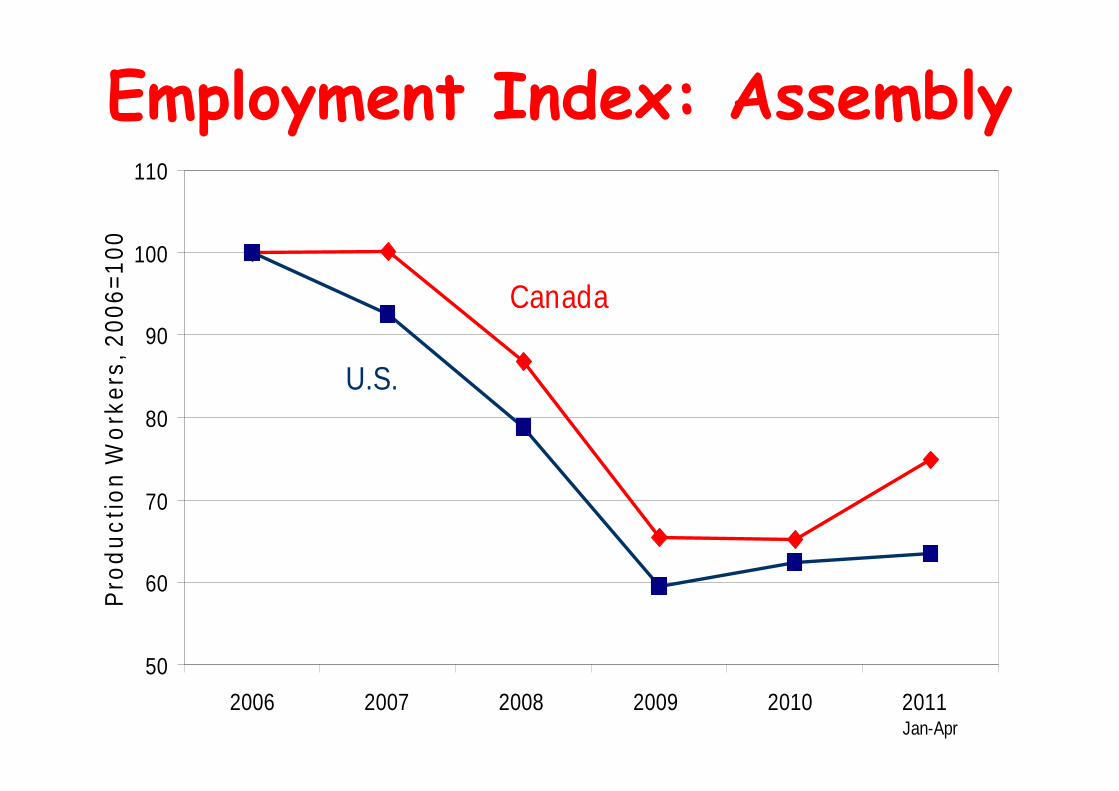
Employment Index: Assembly
50
60
70
80
90
100
110
2006 2007 2008 2009 2010 2011
Pro
du
cti
on
Wo
rke
rs,
20
06
=1
00
Jan-Apr
Canada
U.S.
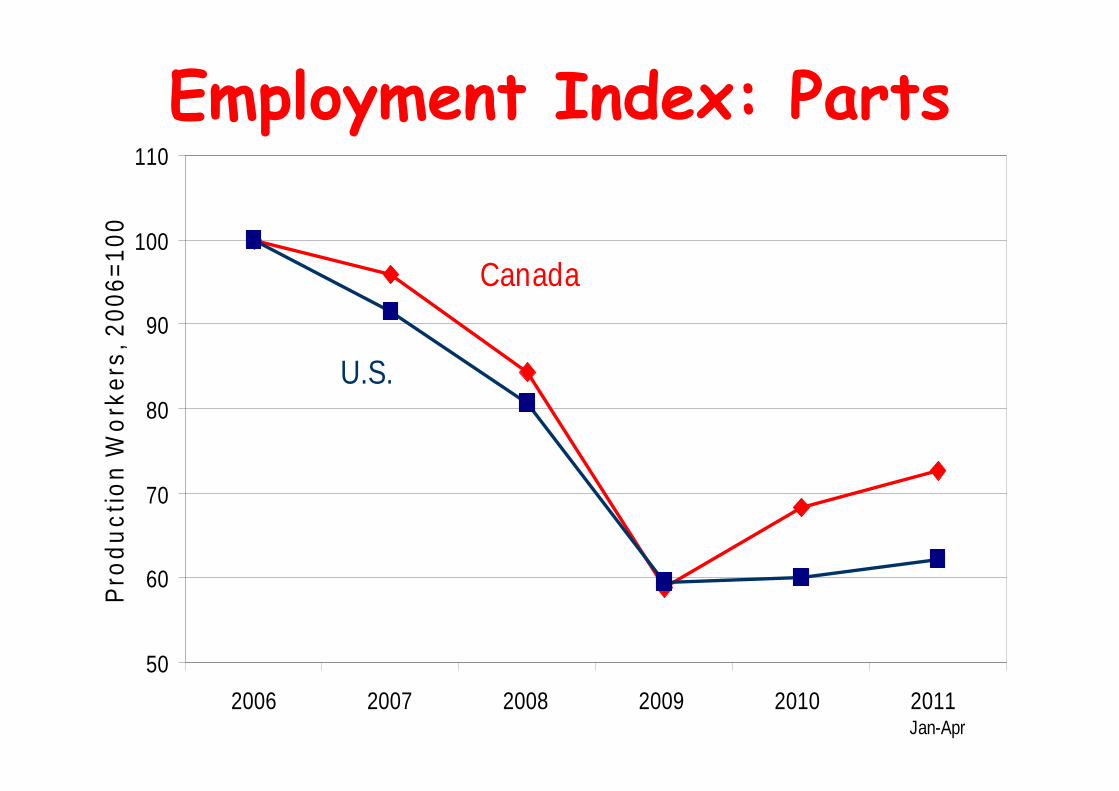
Employment Index: Parts
50
60
70
80
90
100
110
2006 2007 2008 2009 2010 2011
Pro
du
cti
on
Wo
rke
rs,
20
06
=1
00
Jan-Apr
Canada
U.S.
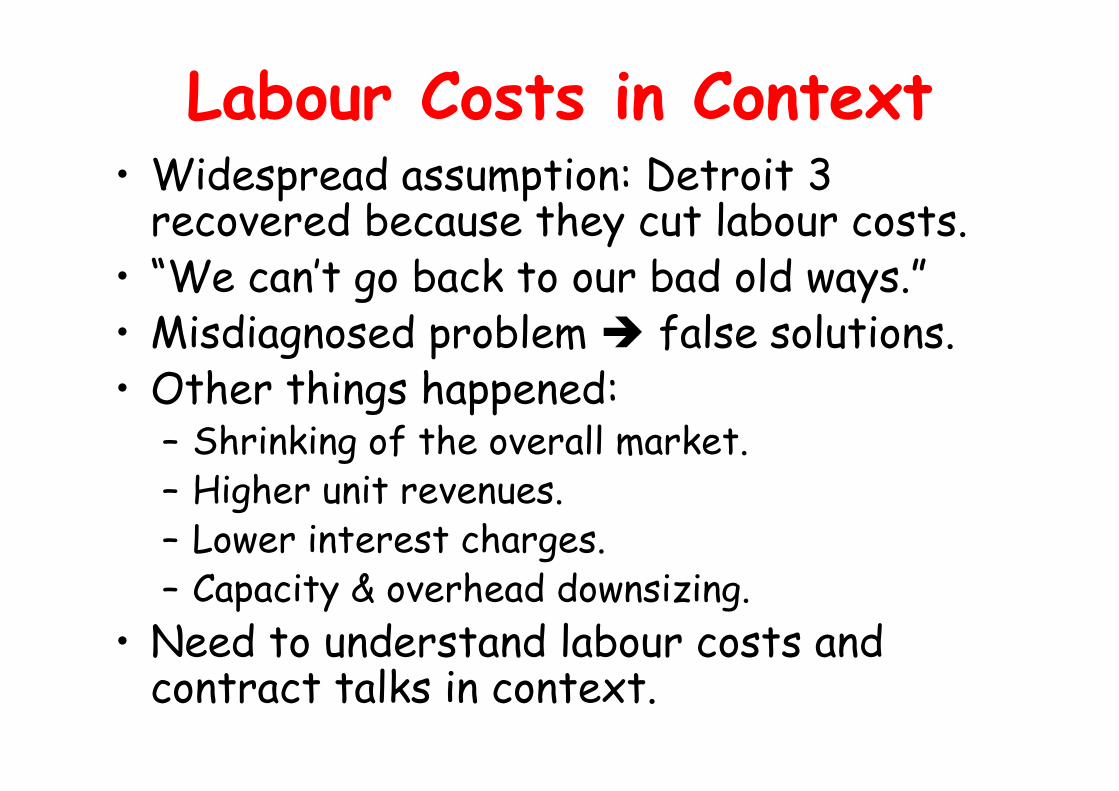
Labour Costs in Context• Widespread assumption: Detroit 3
recovered because they cut labour costs.
• “We can’t go back to our bad old ways.”
• Misdiagnosed problem false solutions.
• Other things happened:– Shrinking of the overall market.
– Higher unit revenues.
– Lower interest charges.
– Capacity & overhead downsizing.
• Need to understand labour costs andcontract talks in context.
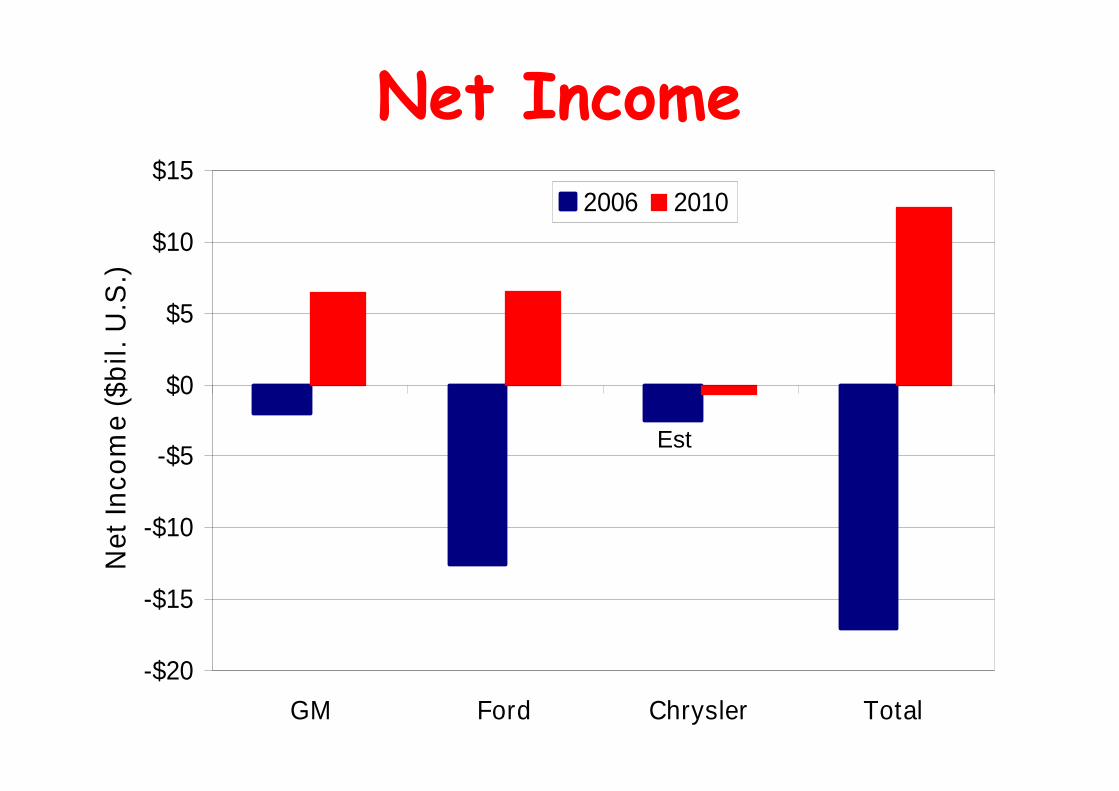
Net Income
-$20
-$15
-$10
-$5
$0
$5
$10
$15
GM Ford Chrysler Total
Ne
tIn
co
me
($b
il.
U.S
.)
2006 2010
Est

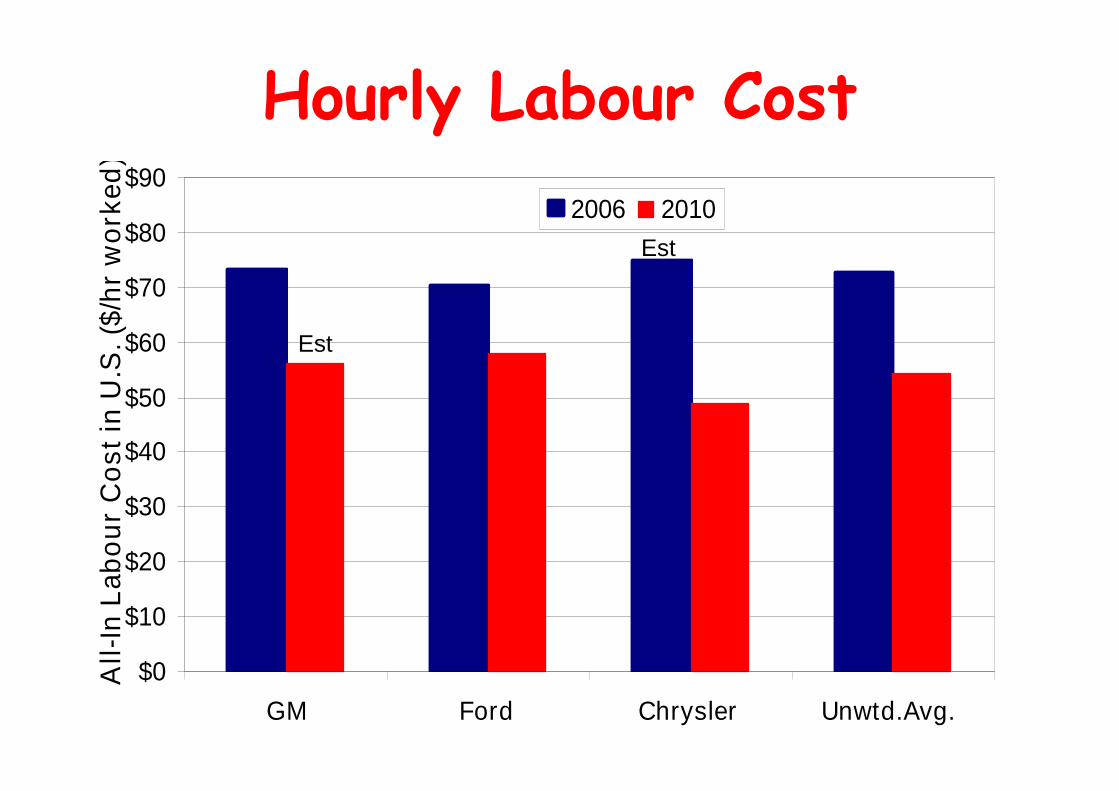
All-In Hourly Labour Costs:Use With Caution
• Subject to major methodological issues.
• Fluctuations in hours worked cause largechanges in hourly value of fixed costs.
• Inclusion of statutory costs, income securitycharges, and other elements creates a wedgebetween cost and “compensation.”
• Legacy cost categories very volatile:
– Assumptions, experience, amortization.
• See CAW publication for more discussion:
– “How Much do Autoworkers Really Make?” April 2009
Hourly Labour Cost
$0
$10
$20
$30
$40
$50
$60
$70
$80
$90
GM Ford Chrysler Unwtd.Avg.
All
-In
La
bo
ur
Co
st
inU
.S.
($/h
rw
ork
ed
)
2006 2010
Est
Est

Total Employment (N.A.)
0
50
100
150
200
250
300
350
400
GM Ford Chrysler Total
N.A
.E
mp
loy
ee
s(a
nn
.av
g.)
2006 2010
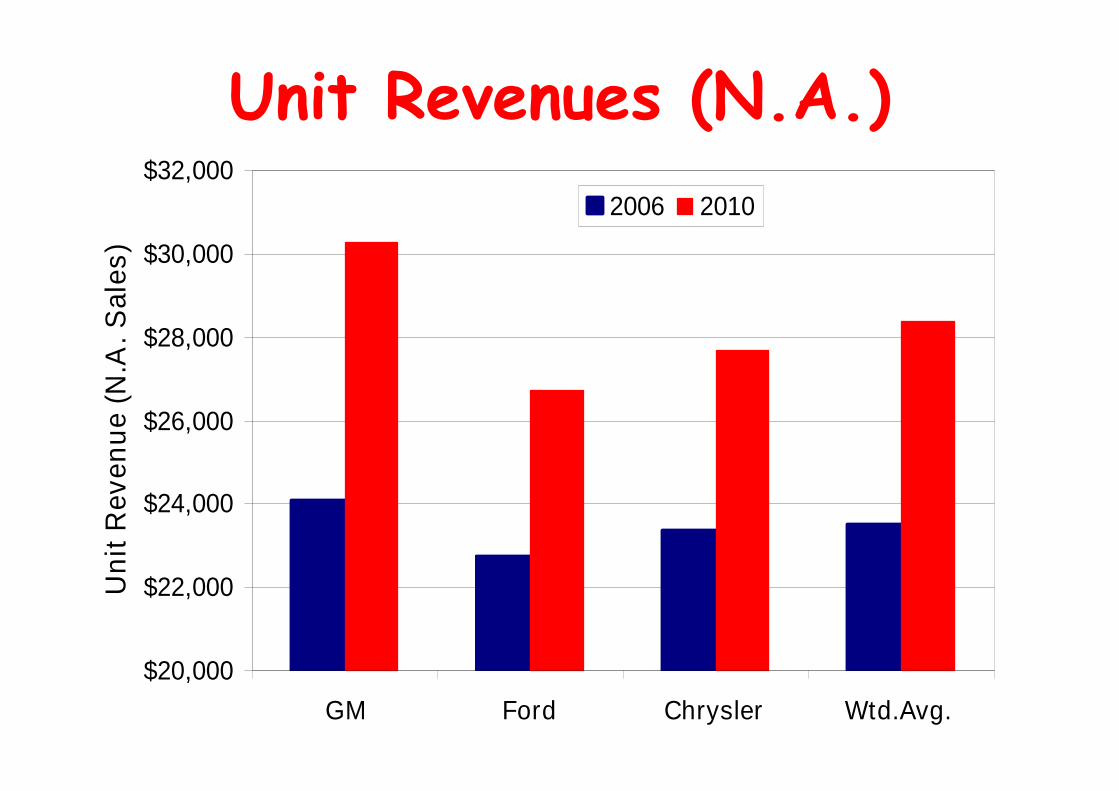
Unit Revenues (N.A.)
$20,000
$22,000
$24,000
$26,000
$28,000
$30,000
$32,000
GM Ford Chrysler Wtd.Avg.
Un
itR
ev
en
ue
(N.A
.S
ale
s)
2006 2010
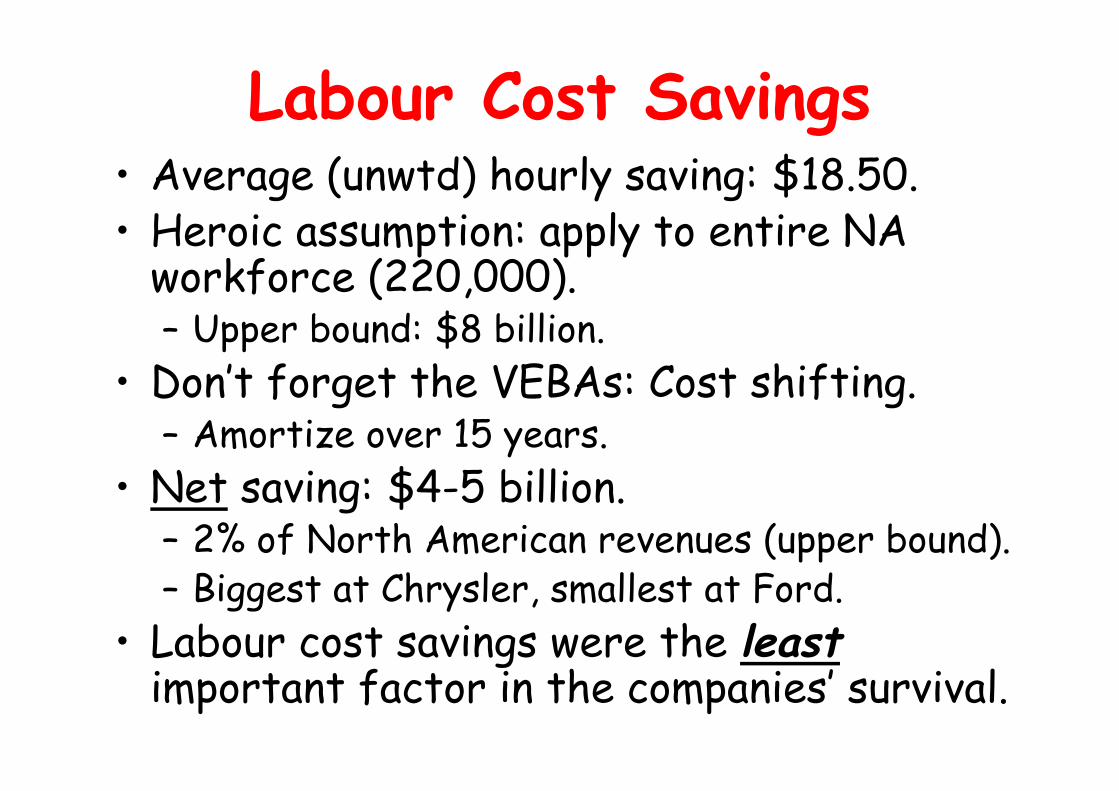
Labour Cost Savings• Average (unwtd) hourly saving: $18.50.
• Heroic assumption: apply to entire NAworkforce (220,000).– Upper bound: $8 billion.
• Don’t forget the VEBAs: Cost shifting.– Amortize over 15 years.
• Net saving: $4-5 billion.– 2% of North American revenues (upper bound).
– Biggest at Chrysler, smallest at Ford.
• Labour cost savings were the leastimportant factor in the companies’ survival.
Financial Analysis• Compare income statements from 2006 and
2010.
• Combined improvement in net income:almost $30 billion.
• Identify some major sources of savingdirectly (unit revenues, interest, G&A).
• Hourly labour cost and employmentdownsizing estimated on basis of hourlycost data.
• Chrysler data incomplete.
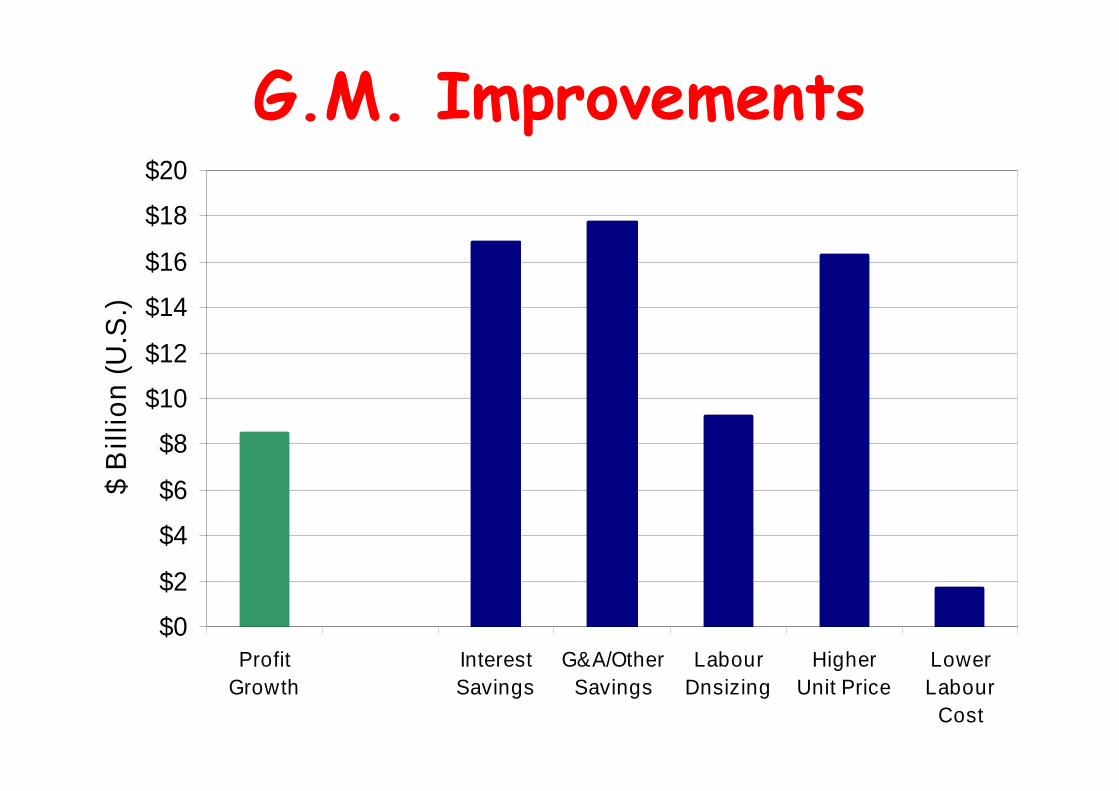
G.M. Improvements
$0
$2
$4
$6
$8
$10
$12
$14
$16
$18
$20
Profit
Growth
Interest
Savings
G&A/Other
Savings
Labour
Dnsizing
Higher
Unit Price
Lower
Labour
Cost
$B
illi
on
(U.S
.)
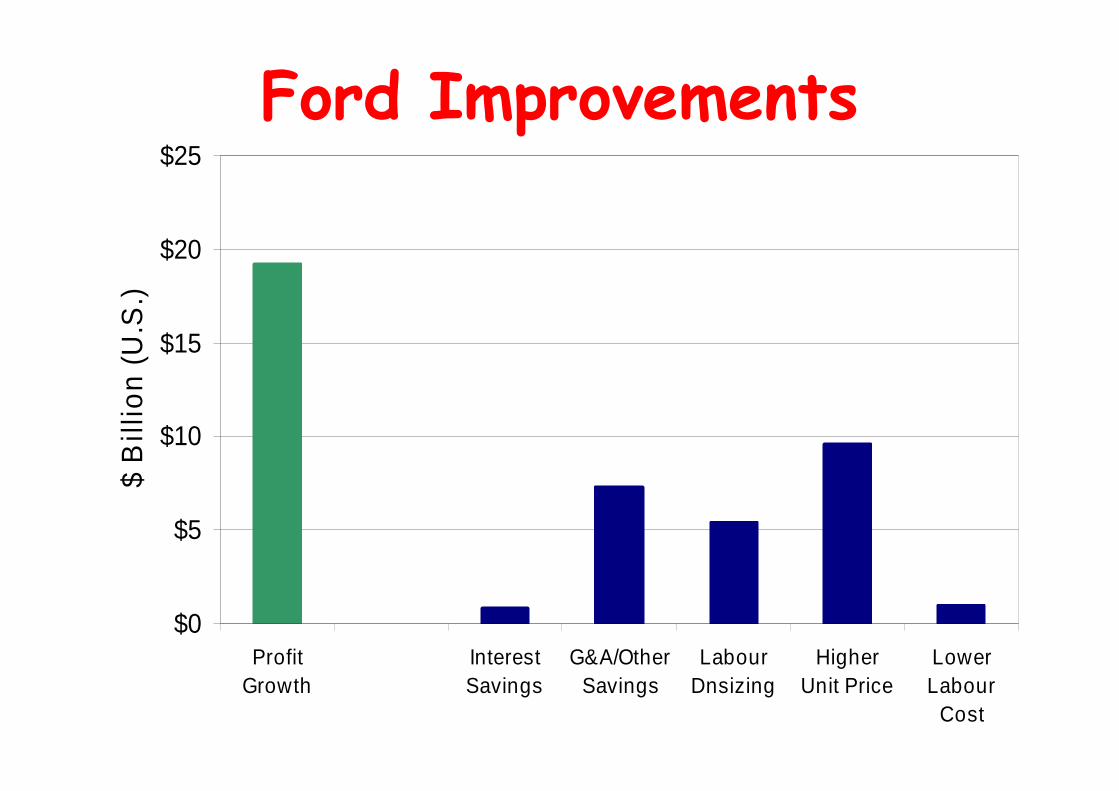
Ford Improvements
$0
$5
$10
$15
$20
$25
Profit
Growth
Interest
Savings
G&A/Other
Savings
Labour
Dnsizing
Higher
Unit Price
Lower
Labour
Cost
$B
illi
on
(U.S
.)

Chrysler Improvements
$0
$1
$2
$3
$4
$5
$6
$7
Profit
Growth
Interest
Savings
G&A/Other
Savings
Labour
Dnsizing
Higher
Unit Price
Lower
Labour
Cost
$B
illi
on
(U.S
.)
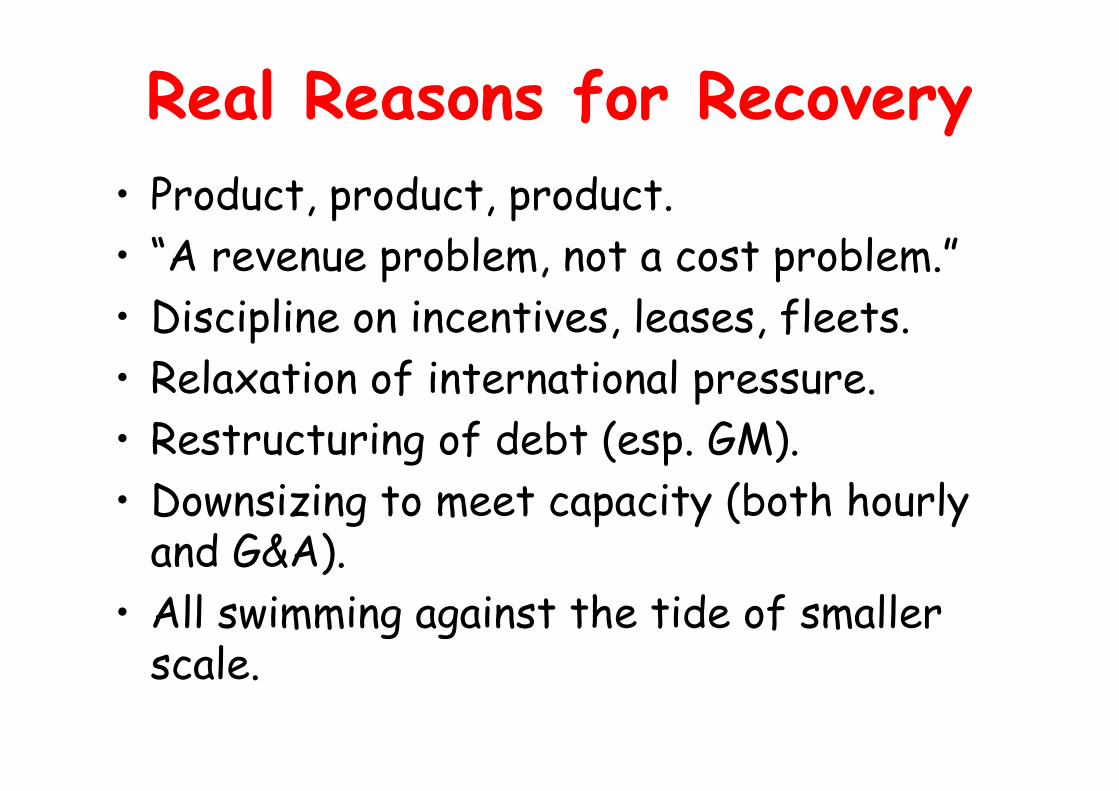
Real Reasons for Recovery
• Product, product, product.
• “A revenue problem, not a cost problem.”
• Discipline on incentives, leases, fleets.
• Relaxation of international pressure.
• Restructuring of debt (esp. GM).
• Downsizing to meet capacity (both hourlyand G&A).
• All swimming against the tide of smallerscale.
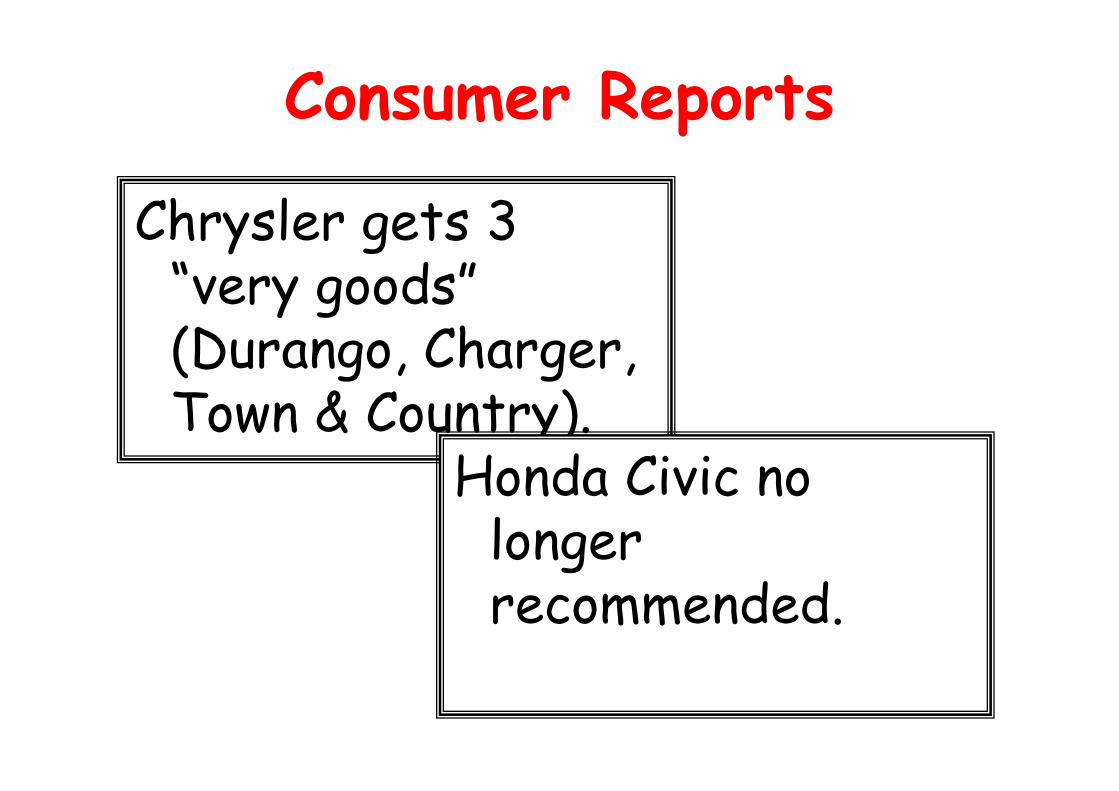
Consumer Reports
Chrysler gets 3“very goods”(Durango, Charger,Town & Country).
Honda Civic nolongerrecommended.
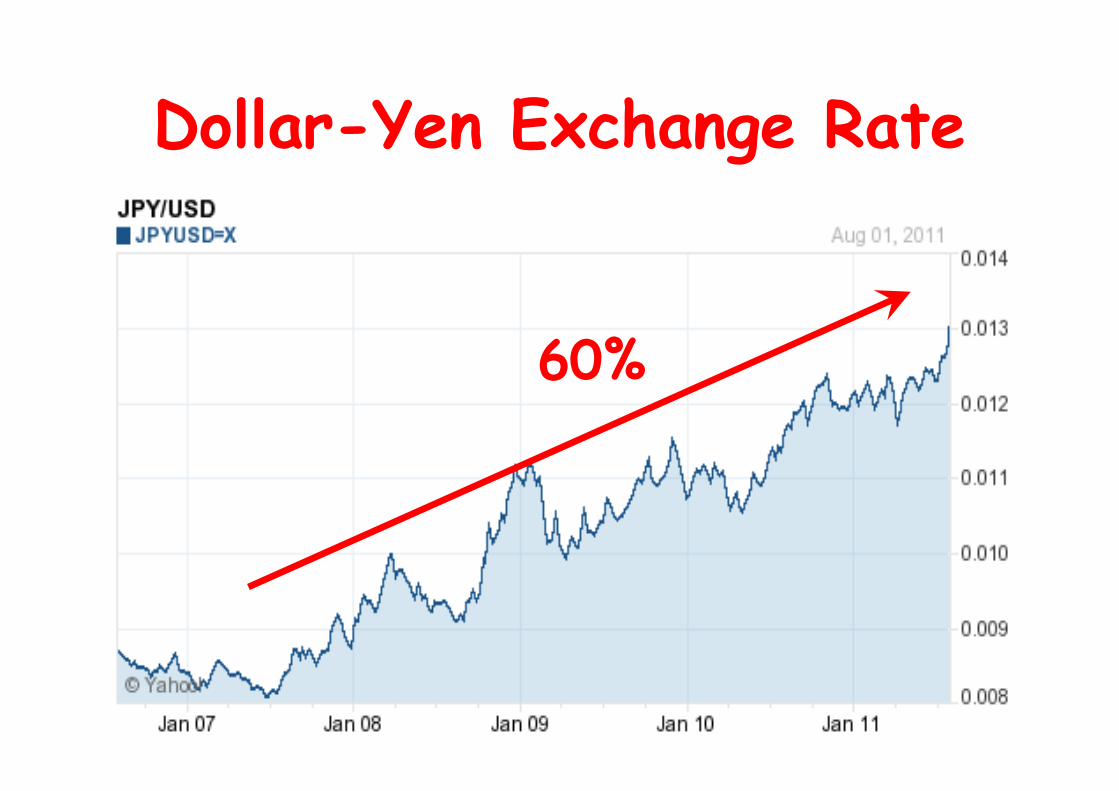
Dollar-Yen Exchange Rate
60%
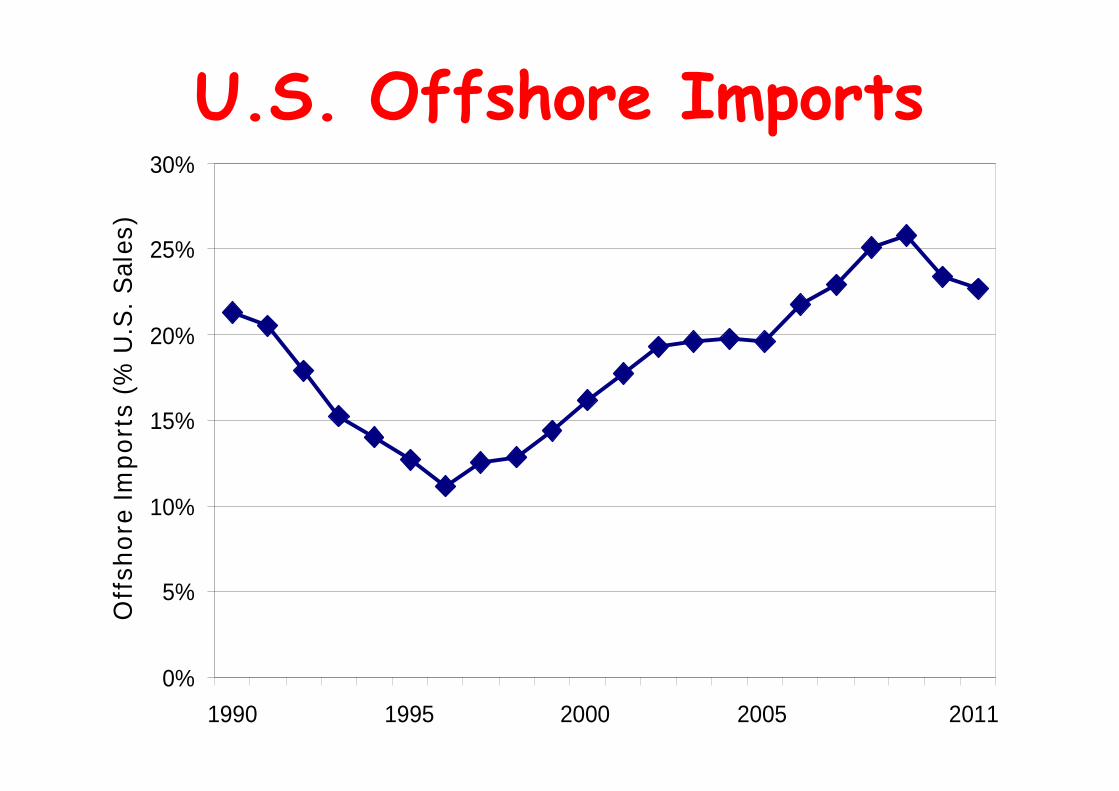
U.S. Offshore Imports
0%
5%
10%
15%
20%
25%
30%
1990 1995 2000 2005 2011
Off
sh
ore
Imp
ort
s(%
U.S
.S
ale
s)
Conclusion
• “7% of the cost, 99% of the attention.”
• Conclusion that labour cost cuts explain Detroit 3recovery is wrong, misleads strategy by bothcompanies & government.
• Equalizing labour costs to (certain) U.S.transplants does not make Detroit 3 competitive.– Certain U.S. transplants are not the key competition.
– Labour costs are not the key indicator.
• Other actions (by both business and policy) areneeded to keep the recovery going.
• Undue focus on labour costs will end indisappointment.