Embed Size (px)
Citation preview
Lafayette Drive (Comanche Road to Delamar Avenue) Speed Study
FINAL REPORT
March 2015
LAFAYETTE DRIVE SPEED STUDY (COMANCHE ROAD TO DELAMAR AVENUE) FINAL REPORT CITY OF ALBUQUERQUE – DEPARTMENT OF MUNICIPAL DEVELOPMENT
SOUDER, MILLER & ASSOCIATES, INC. PAGE I
TABLE OF CONTENTS
DESCRIPTION PAGE NO.
I. INTRODUCTION 1 II. PROJECT PURPOSE 1 III. PROJECT DESCRIPTION 1 IV. BACKGROUND OF SPEED LIMITS 2 – 6
IV.A SETTING SPEED LIMITS 2 – 4 IV.B STUDY AREA 4 – 6 IV.B.1 – SEGEMENT 1: LAFAYETTE DRIVE – 500’ NORTH OF COMANCHE ROAD 5 IV.B.2 – SEGMENT 2: LAFAYETTER DRIVE – 500’ SOUTH OF DELAMAR AVENUE 6 IV.B.3 – SEGMENT 3: BEELHAVEN AVENUE BETWEEN LUTHY DRIVE AND INDIAN SCHOOL ROAD 6 – 7
V. CRASH DATA 7 VI. SPOT SPEED STUDY RESULTS 7 VII. U.S. LIMITS SPEED LIMIT PROGRAM 8 VIII. CONCLUSION 8
LAFAYETTE DRIVE SPEED STUDY (COMANCHE ROAD TO DELAMAR AVENUE) FINAL REPORT CITY OF ALBUQUERQUE – DEPARTMENT OF MUNICIPAL DEVELOPMENT
SOUDER, MILLER & ASSOCIATES, INC. PAGE II
FIGURES
DESCRIPTION PAGE NO.
Figure III.A.1 – Project Vicinity Map 1
Figure IV.B.1 – Lafayette Drive (500” north of Comanche Road) 5
Figure IV.B.2 – Lafayette Drive (500’ south of Delamar Avenue) 6
LAFAYETTE DRIVE SPEED STUDY (COMANCHE ROAD TO DELAMAR AVENUE) FINAL REPORT CITY OF ALBUQUERQUE – DEPARTMENT OF MUNICIPAL DEVELOPMENT
SOUDER, MILLER & ASSOCIATES, INC. PAGE III
TABLES
DESCRIPTION PAGE NO.
Table IV.B.1 – AADT Count Data Results 4
Table IV.B.2 – South Count Location Speed Study Results 5
Table IV.B.3 – North Count Location Speed Study Results 6
Table VI.1 – Bellehaven Avenue Speed Study Results 7
LAFAYETTE DRIVE SPEED STUDY (COMANCHE ROAD TO DELAMAR AVENUE) FINAL REPORT CITY OF ALBUQUERQUE – DEPARTMENT OF MUNICIPAL DEVELOPMENT
SOUDER, MILLER & ASSOCIATES, INC. PAGE IV
APPENDICIES
Appendix A – Traffic Data
Appendix B – Speed Study Data
Appendix C – U.S. Limits Output Files
LAFAYETTE DRIVE SPEED STUDY (COMANHCE ROAD TO DELMAR AVENUE) FINAL REPORT CITY OF ALBUQUERQUE – DEPARTMENT OF MUNICIPAL DEVELOPMENT
SOUDER, MILLER & ASSOCIATES PAGE 1
I. INTRODUCTION The City of Albuquerque – Department of Municipal Development (Engineering Division and Traffic Engineering Division) was requested to conduct a speed study along Lafayette Drive in northeast Albuquerque. II. PROJECT PURPOSE A speed study on Lafayette Drive was conducted between Comanche Road and Delmar Avenue to determine the following:
• Evaluate the 85th percentile speed along Lafayette Drive • Determine from the speed study if there is a speeding along Lafayette Drive • If speed humps are warranted based on the City’s Neighborhood Traffic Management Program
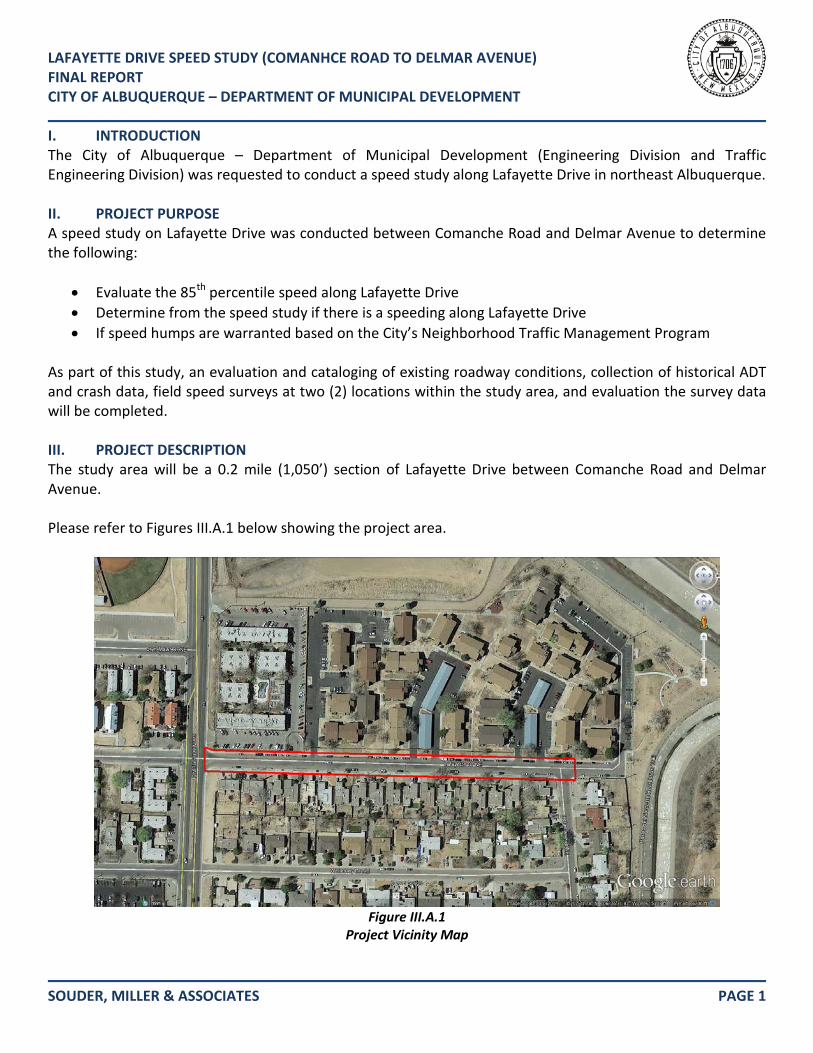
As part of this study, an evaluation and cataloging of existing roadway conditions, collection of historical ADT and crash data, field speed surveys at two (2) locations within the study area, and evaluation the survey data will be completed. III. PROJECT DESCRIPTION The study area will be a 0.2 mile (1,050’) section of Lafayette Drive between Comanche Road and Delmar Avenue. Please refer to Figures III.A.1 below showing the project area.
Figure III.A.1
Project Vicinity Map
LAFAYETTE DRIVE SPEED STUDY (COMANHCE ROAD TO DELMAR AVENUE) FINAL REPORT CITY OF ALBUQUERQUE – DEPARTMENT OF MUNICIPAL DEVELOPMENT
SOUDER, MILLER & ASSOCIATES PAGE 2
IV. BACKGROUND OF SPEED LIMITS Speed limits are established on roadways of virtually all classifications, from interstate freeways to low-volume local streets. The primary purpose of speed limits is to give motorists clear instruction as to what is a reasonable speed for them to drive at while traveling on a given roadway. Among regulatory signage, speed limit signs arguably contain the most critical information that motorists need to be informed of while driving (next to stop signs, which are considered the highest impact regulatory sign). Drivers unfamiliar with a roadway often do not realize what characteristics the roadway has, and properly established speed limit signs give them the information they need to drive the roadway safely. The NMDOT has guidelines for analyzing and establishing posted speed limits; the following text is based on one such example: Realistic posted speed limits are of public importance for many reasons:
• They invite public compliance by conforming to the behavior or the driving majority • They give clear reminders of safe and reasonable speeds to non-conforming violators • They offer the most effective tool for law enforcement of safe driving • They will minimize public antagonism toward law enforcement that results from unreasonable
regulations Improperly, or artificially low, posted speed limits can cause problems for state and local agencies for several reasons:
• They do not encourage voluntary compliance, since they do not reflect the behavior of the majority • They make the behavior of the majority unlawful • They maximize public antagonism toward law enforcement, since the perception is that the police are
enforcing a “speed trap” • They create a bad image for a community in the eyes of visitors/tourists
IV.A SETTING SPEED LIMITS In accordance with Section 66-7-303 of the New Mexico Criminal and Traffic Law Manual, the speed limit on state highways shall be set by the Cabinet Secretary of the Department of Transportation, based on an engineering survey and traffic investigation that includes the following parameters:
• Spot speed studies (typically consisting of 100 vehicles) • Roadway geometry/number of lanes • Roadside environment and characteristics • Building setbacks (if within a commercial business district) • Driveway and intersection spacing/density • Historical crash data for the roadway study area
LAFAYETTE DRIVE SPEED STUDY (COMANHCE ROAD TO DELMAR AVENUE) FINAL REPORT CITY OF ALBUQUERQUE – DEPARTMENT OF MUNICIPAL DEVELOPMENT
SOUDER, MILLER & ASSOCIATES PAGE 3
Many speed limits are established using the theory of the 85th percentile. Out of the (typically) 100 vehicles surveyed, beginning with the fastest vehicle speed recorded the 15th vehicle from that speed is determined to show where the 85th percentile speed is. This is assuming that most drivers (85%) drive within reasonable limits. The posted speed limit can then be established and is usually the 5-mph increment just below the 85th percentile speed. For example, if the 85th percentile speed has been determined by an engineering survey to be 47 mph, the posted speed would be 45 mph. This method of posting speed limits allows for a reasonable posted speed limit that can be enforced by local agencies, without creating a speed trap. For surveys with a different amount than 100 vehicles, the 85th percentile speed is determined by the following formula: 100/15 = # of vehicles surveyed/X (where x is the vehicle at the 85th percentile). For example, a 50 vehicle survey would result in: 100/15 = 50/X X = 7.5, or the 8th vehicle in the survey Other methods are frequently used to further analyze the posting of speed limits – these are the mode, median and geometric mean:
• The mode is the most frequently clocked vehicle speed in a given survey – for example, in a 100 vehicle survey where 12 vehicles were clocked traveling 55 mph and no other speed was observed as frequently, the mode is 55 mph.
• The median is the numerical midpoint of a given survey – in a survey of 100 vehicles, the speeds of the 50th
and 51st vehicles are added and divided by 2 to obtain the median speed. If the 50th vehicle of such a survey was traveling 56 mph and the 51st vehicle was also traveling 56 mph, the resulting median speed would be (56+56)/2 = 112/2 = 56 mph.
• The geometric mean is described as follows: “an average of a set of numbers that is calculated by
multiplying all the numbers (“n”), and taking the nth root of the total.” Formula for Geometric Mean: Geometric Mean = ((X1)(X2)(X3)........(XN))1/N
where X = Individual Score (speed) N = Sample size (Number of scores) Geometric Mean Example: To find the Geometric Mean of speeds 51, 52, 55, 58, and 60 mph. Step 1: N = 5, the total number of values. Find 1/N. 1/N = 0.2 Step 2: Determine Geometric Mean using the formula. ((51)(52)(55)(58)(60))0.2 = (507,592,800)0.2
Geometric Mean = 55.09 mph
LAFAYETTE DRIVE SPEED STUDY (COMANHCE ROAD TO DELMAR AVENUE) FINAL REPORT CITY OF ALBUQUERQUE – DEPARTMENT OF MUNICIPAL DEVELOPMENT
SOUDER, MILLER & ASSOCIATES PAGE 4
In most cases, the geometric mean of a speed study will be of similar value of the median, often within 1 to 2 mph on either side of the median. In the above example, the median speed would be the third vehicle surveyed (55 mph), and the geometric mean is 55.09 mph. IV.B STUDY AREA The study area is along Lafayette Drive between beginning at Comanche Road and ending at Delmar Avenue. The existing speed limit along Lafayette Drive is 25 mph. Traffic counts and speed data was collected at two (2) locations along Lafayette Drive. Traffic/speed count locations were collected at the following locations:
• South Count Station: Lafayette Drive 500’ north of Comanche Road • North Count Station: Lafayette Drive 500’ south of Delamar Avenue
The AADT for the three locations listed above are listed below:
Lane 1 (NB) Lane 3 (SB) AADT South Count Location 490 523 1013 North Count Location 396 435 831 AADT 443 479 922
Table IV.B.1 AADT Count Data Results
Lafayette Drive study area ranges from 831 to 1013 vehicles per day with an average AADT of 922 vehicles. The speed survey segments are described in more detail below, beginning with the southernmost portion of the corridor at Comanche Road. Each study segment will have descriptions of roadside environment, driveway and intersection density and photographs illustrating the study segment. From the south terminus of the study area, each survey segment is described as follows: Traffic count data is located in Appendix A.
LAFAYETTE DRIVE SPEED STUDY (COMANHCE ROAD TO DELMAR AVENUE) FINAL REPORT CITY OF ALBUQUERQUE – DEPARTMENT OF MUNICIPAL DEVELOPMENT
SOUDER, MILLER & ASSOCIATES PAGE 5
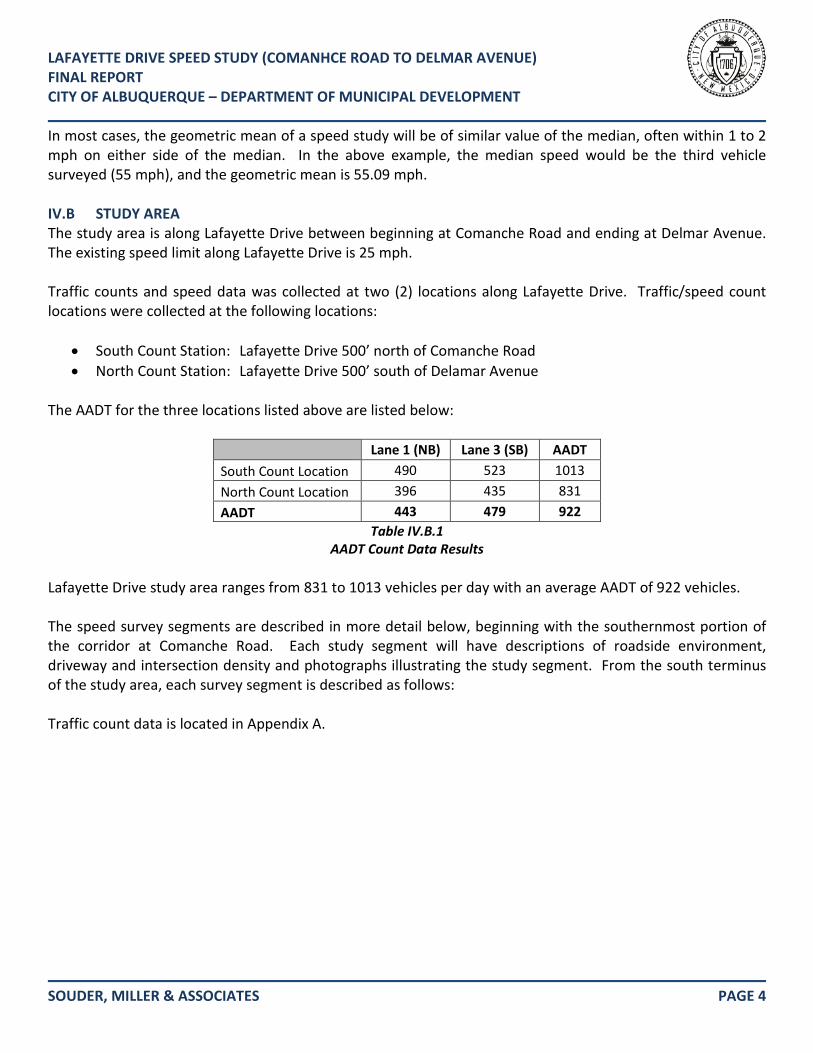
IV.B.1 – SEGMENT 1: LAFAYETTE DRIVE - 500’ NORTH OF COMANCHE ROAD This segment of the study area is ROW width of 57’ (+/-). A breakdown of the ROW is listed below:
• 40’ asphalt pavement • 2.5’ curb and gutter • 4’ landscape buffer (EAST SIDE ONLY) • 4’ sidewalk
Sidewalk, curb and sidewalk exist on both sides of Lafayette Drive. Below is a photo showing the cross-section listed above.
Figure IV.B.1
Lafayette Drive north of Comanche Road There are ten (10) driveways within this segment of the study area. Eight (8) driveways provide access to residential homes (east side). There are two (2) driveways on the west side that provides access to apartment complexes. Results of the speed study for Segment 1 is listed below:
Lane 1 (NB) Lane 3 (SB) Comb Total South Count Location
Average 19.6 19 19.3 50th Percentile 21.9 21.4 21.6 67th Percentile 24.5 23.8 24.2 85th Percentile 28.5 27.7 28.1
Table IV.B.2 South Count Location Speed Study Results
LAFAYETTE DRIVE SPEED STUDY (COMANHCE ROAD TO DELMAR AVENUE) FINAL REPORT CITY OF ALBUQUERQUE – DEPARTMENT OF MUNICIPAL DEVELOPMENT
SOUDER, MILLER & ASSOCIATES PAGE 6
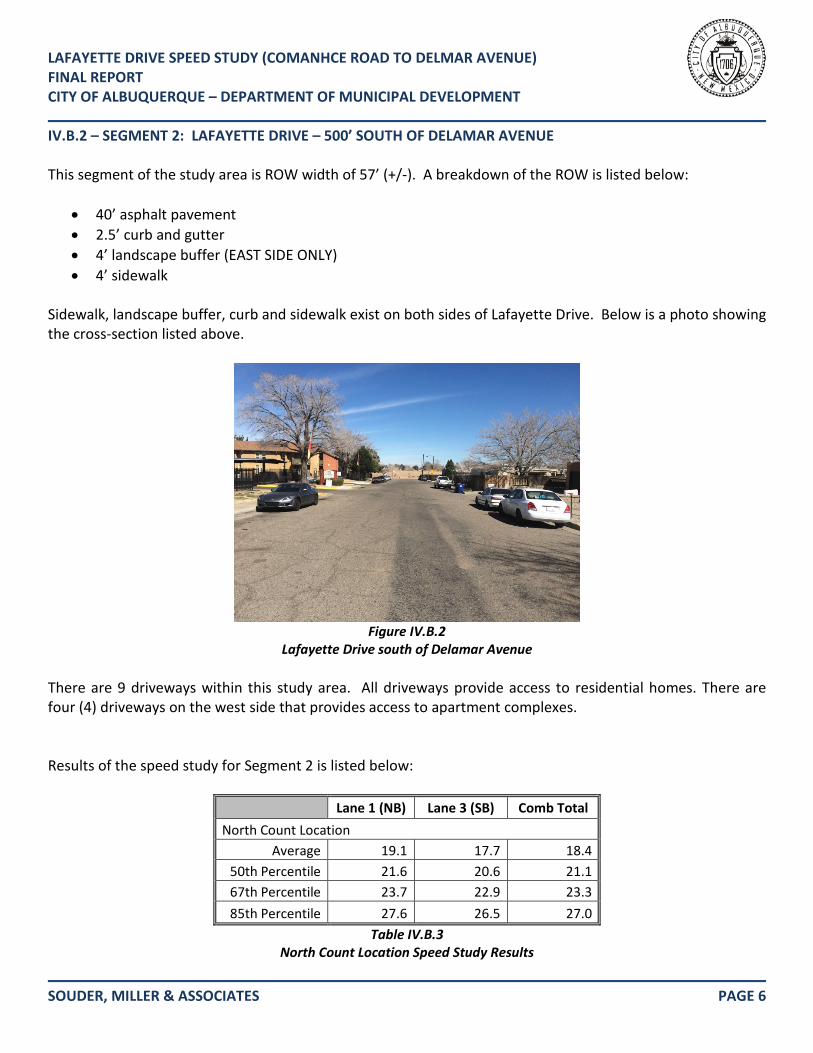
IV.B.2 – SEGMENT 2: LAFAYETTE DRIVE – 500’ SOUTH OF DELAMAR AVENUE This segment of the study area is ROW width of 57’ (+/-). A breakdown of the ROW is listed below:
• 40’ asphalt pavement • 2.5’ curb and gutter • 4’ landscape buffer (EAST SIDE ONLY) • 4’ sidewalk
Sidewalk, landscape buffer, curb and sidewalk exist on both sides of Lafayette Drive. Below is a photo showing the cross-section listed above.
Figure IV.B.2
Lafayette Drive south of Delamar Avenue There are 9 driveways within this study area. All driveways provide access to residential homes. There are four (4) driveways on the west side that provides access to apartment complexes. Results of the speed study for Segment 2 is listed below:
Lane 1 (NB) Lane 3 (SB) Comb Total North Count Location
Average 19.1 17.7 18.4 50th Percentile 21.6 20.6 21.1 67th Percentile 23.7 22.9 23.3 85th Percentile 27.6 26.5 27.0
Table IV.B.3 North Count Location Speed Study Results
LAFAYETTE DRIVE SPEED STUDY (COMANHCE ROAD TO DELMAR AVENUE) FINAL REPORT CITY OF ALBUQUERQUE – DEPARTMENT OF MUNICIPAL DEVELOPMENT
SOUDER, MILLER & ASSOCIATES PAGE 7
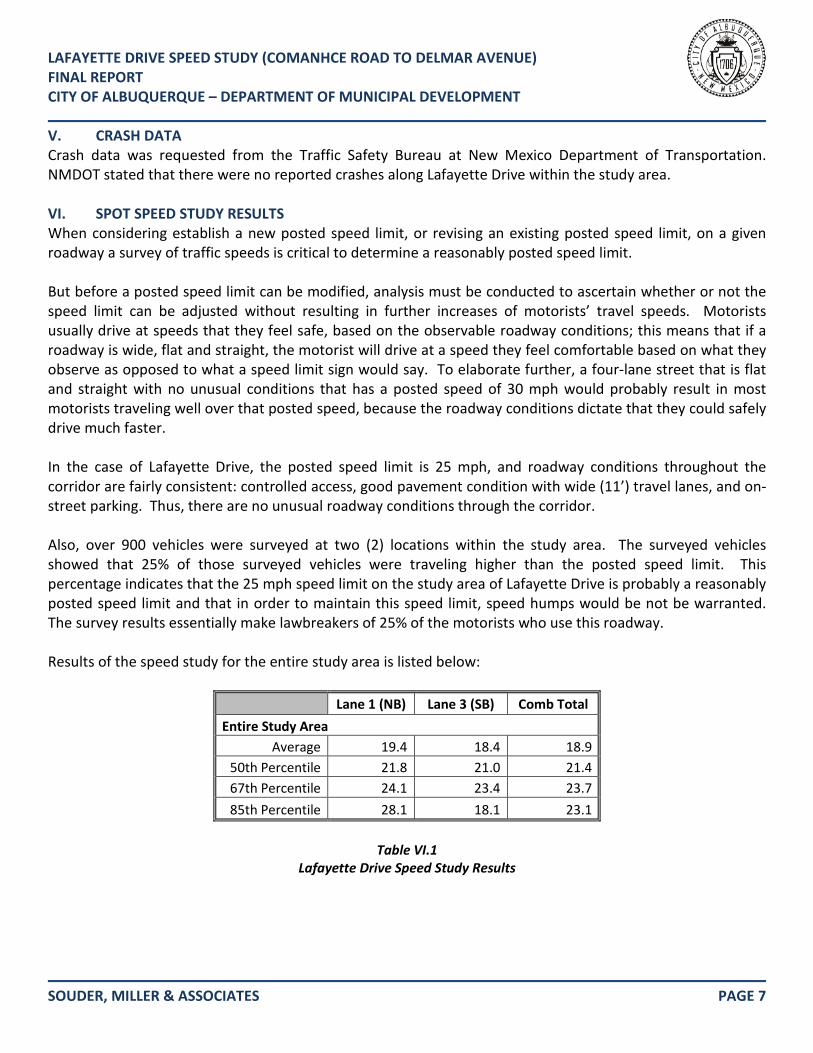
V. CRASH DATA Crash data was requested from the Traffic Safety Bureau at New Mexico Department of Transportation. NMDOT stated that there were no reported crashes along Lafayette Drive within the study area. VI. SPOT SPEED STUDY RESULTS When considering establish a new posted speed limit, or revising an existing posted speed limit, on a given roadway a survey of traffic speeds is critical to determine a reasonably posted speed limit. But before a posted speed limit can be modified, analysis must be conducted to ascertain whether or not the speed limit can be adjusted without resulting in further increases of motorists’ travel speeds. Motorists usually drive at speeds that they feel safe, based on the observable roadway conditions; this means that if a roadway is wide, flat and straight, the motorist will drive at a speed they feel comfortable based on what they observe as opposed to what a speed limit sign would say. To elaborate further, a four-lane street that is flat and straight with no unusual conditions that has a posted speed of 30 mph would probably result in most motorists traveling well over that posted speed, because the roadway conditions dictate that they could safely drive much faster. In the case of Lafayette Drive, the posted speed limit is 25 mph, and roadway conditions throughout the corridor are fairly consistent: controlled access, good pavement condition with wide (11’) travel lanes, and on-street parking. Thus, there are no unusual roadway conditions through the corridor. Also, over 900 vehicles were surveyed at two (2) locations within the study area. The surveyed vehicles showed that 25% of those surveyed vehicles were traveling higher than the posted speed limit. This percentage indicates that the 25 mph speed limit on the study area of Lafayette Drive is probably a reasonably posted speed limit and that in order to maintain this speed limit, speed humps would be not be warranted. The survey results essentially make lawbreakers of 25% of the motorists who use this roadway. Results of the speed study for the entire study area is listed below:
Lane 1 (NB) Lane 3 (SB) Comb Total Entire Study Area
Average 19.4 18.4 18.9 50th Percentile 21.8 21.0 21.4 67th Percentile 24.1 23.4 23.7 85th Percentile 28.1 18.1 23.1
Table VI.1
Lafayette Drive Speed Study Results
LAFAYETTE DRIVE SPEED STUDY (COMANHCE ROAD TO DELMAR AVENUE) FINAL REPORT CITY OF ALBUQUERQUE – DEPARTMENT OF MUNICIPAL DEVELOPMENT
SOUDER, MILLER & ASSOCIATES PAGE 8
VII. U.S. LIMITS SPEED LIMIT PROGRAM U.S. Limits is an FHWA sponsored program used to analyze speed limits. This program calculates a recommended speed limit based on the criteria given, which is listed on the website as follows:
• density of surrounding development (e.g. high density, low density or rural); • frequency of roadside access (e.g. number of residential driveways, commercial, industrial, shopping,
and special activity properties, and the number and type of intersecting roads); • road function (e.g. traffic movement vs. access to abutting properties); • road characteristics (e.g. paved width, divided or undivided, lane width and number of lanes, sight
restrictions); • road conditions and important high speed road characteristics (e.g. interchange spacing, AADT,
shoulders); • existing vehicle operating speeds; • adjoining speed limits; and • any special conditions that may exist on the road section (e.g. adverse alignment, pedestrian and
roadside activities, high crash rates, etc). This analysis was used for Lafayette Drive. Based on the data entered for the above-listed categories, the program concluded that a 25 mph posted speed limit was warranted for the corridor. The output sheet is shown in Appendix C – U.S. Limits Output. This site can be accessed at http://www.uslimits.com VIII. CONCLUSION After evaluating the traffic and speed study data collected through the project area, it apparent that none of criteria outlined in the City’s Neighborhood Traffic Management Plan has been met to warrant speed humps.
APPENDIX A TRAFFIC DATA
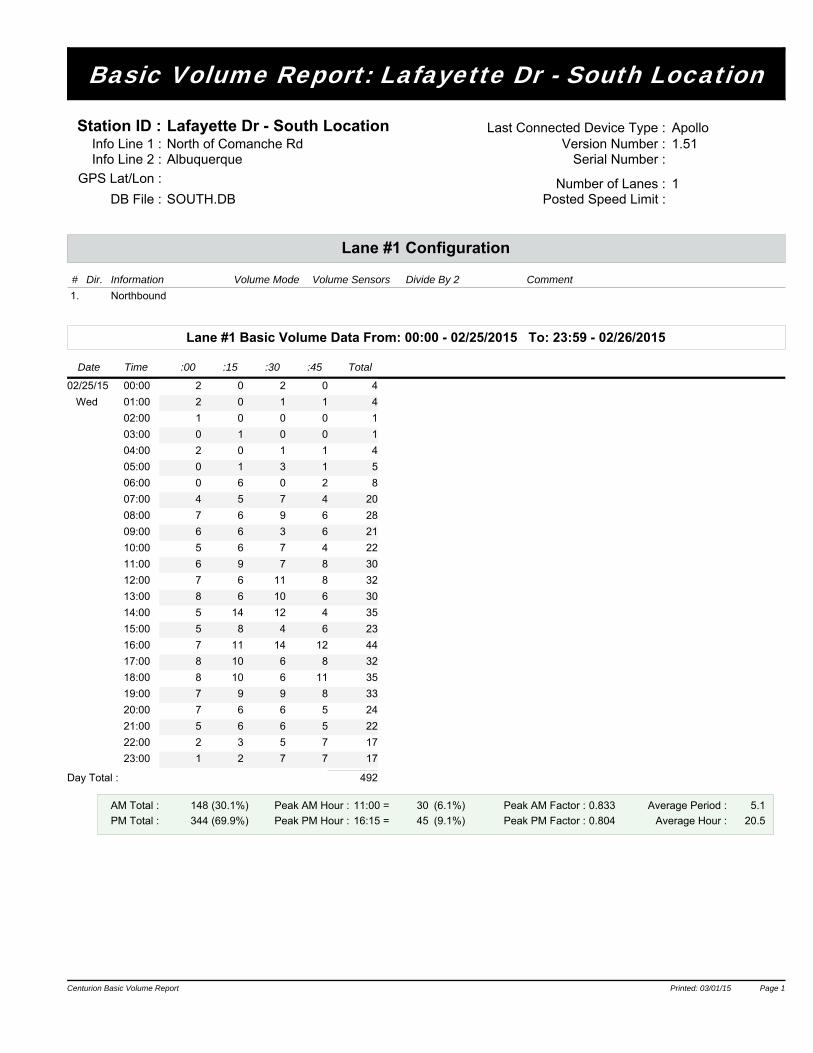
Basic Volume Report: Lafayette Dr - South Location
Station ID : Lafayette Dr - South LocationInfo Line 1 : North of Comanche RdInfo Line 2 : Albuquerque
DB File : SOUTH.DBNumber of Lanes : 1
Posted Speed Limit :
1.51ApolloLast Connected Device Type :
Version Number :Serial Number :
Lane #1 Configuration
# Dir. Information Volume Mode Volume Sensors Divide By 2 Comment
1. Northbound
GPS Lat/Lon :
Lane #1 Basic Volume Data From: 00:00 - 02/25/2015 To: 23:59 - 02/26/2015
Date Time :00 :15 :30 :45 Total
02/25/15 00:00 2 0 2 0 4
Wed 01:00 2 0 1 1 4
02:00 1 0 0 0 1
03:00 0 1 0 0 1
04:00 2 0 1 1 4
05:00 0 1 3 1 5
06:00 0 6 0 2 8
07:00 4 5 7 4 20
08:00 7 6 9 6 28
09:00 6 6 3 6 21
10:00 5 6 7 4 22
11:00 6 9 7 8 30
12:00 7 6 11 8 32
13:00 8 6 10 6 30
14:00 5 14 12 4 35
15:00 5 8 4 6 23
16:00 7 11 14 12 44
17:00 8 10 6 8 32
18:00 8 10 6 11 35
19:00 7 9 9 8 33
20:00 7 6 6 5 24
21:00 5 6 6 5 22
22:00 2 3 5 7 17
23:00 1 2 7 7 17
Day Total : 492
AM Total :
PM Total :
Peak AM Hour :
Peak PM Hour :
Average Period :
Average Hour :
Peak AM Factor :
Peak PM Factor :
148 (30.1%)
344 (69.9%)
0.833
0.804
5.1
20.5
11:00 =
16:15 =
30 (6.1%)
45 (9.1%)
Centurion Basic Volume Report Printed: 03/01/15 Page 1Centurion Basic Volume Report Printed: 03/01/15 Page 1
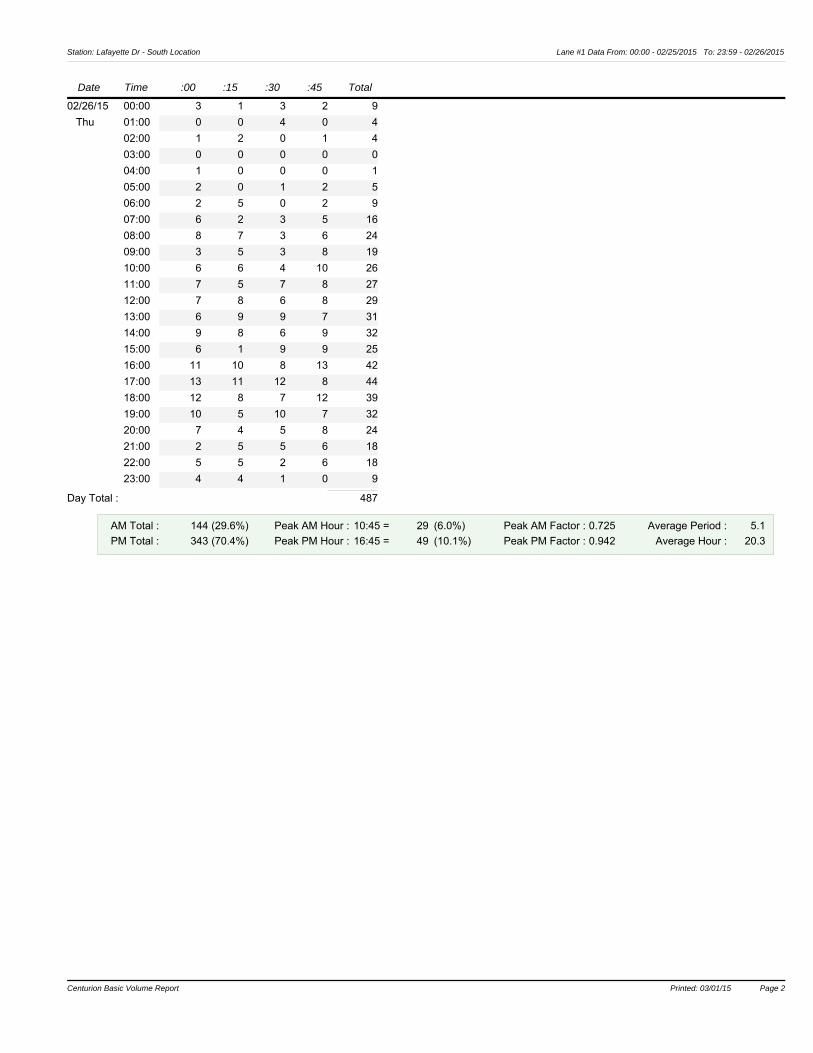
Station: Lafayette Dr - South Location Lane #1 Data From: 00:00 - 02/25/2015 To: 23:59 - 02/26/2015
Date Time :00 :15 :30 :45 Total
02/26/15 00:00 3 1 3 2 9
Thu 01:00 0 0 4 0 4
02:00 1 2 0 1 4
03:00 0 0 0 0 0
04:00 1 0 0 0 1
05:00 2 0 1 2 5
06:00 2 5 0 2 9
07:00 6 2 3 5 16
08:00 8 7 3 6 24
09:00 3 5 3 8 19
10:00 6 6 4 10 26
11:00 7 5 7 8 27
12:00 7 8 6 8 29
13:00 6 9 9 7 31
14:00 9 8 6 9 32
15:00 6 1 9 9 25
16:00 11 10 8 13 42
17:00 13 11 12 8 44
18:00 12 8 7 12 39
19:00 10 5 10 7 32
20:00 7 4 5 8 24
21:00 2 5 5 6 18
22:00 5 5 2 6 18
23:00 4 4 1 0 9
Day Total : 487
AM Total :
PM Total :
Peak AM Hour :
Peak PM Hour :
Average Period :
Average Hour :
Peak AM Factor :
Peak PM Factor :
144 (29.6%)
343 (70.4%)
0.725
0.942
5.1
20.3
10:45 =
16:45 =
29 (6.0%)
49 (10.1%)
Centurion Basic Volume Report Printed: 03/01/15 Page 2
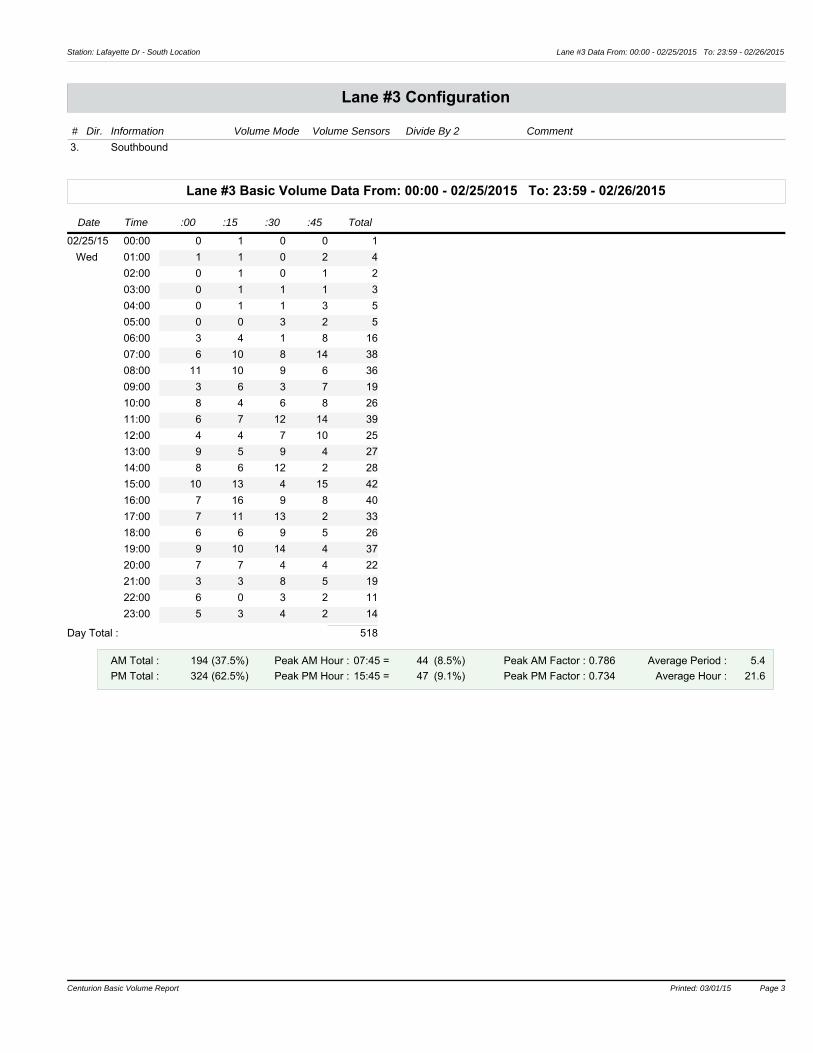
Station: Lafayette Dr - South Location Lane #3 Data From: 00:00 - 02/25/2015 To: 23:59 - 02/26/2015
Lane #3 Configuration
Lane #3 Basic Volume Data From: 00:00 - 02/25/2015 To: 23:59 - 02/26/2015
# Dir. Information Volume Mode Volume Sensors Divide By 2 Comment
3. Southbound
Date Time :00 :15 :30 :45 Total
02/25/15 00:00 0 1 0 0 1
Wed 01:00 1 1 0 2 4
02:00 0 1 0 1 2
03:00 0 1 1 1 3
04:00 0 1 1 3 5
05:00 0 0 3 2 5
06:00 3 4 1 8 16
07:00 6 10 8 14 38
08:00 11 10 9 6 36
09:00 3 6 3 7 19
10:00 8 4 6 8 26
11:00 6 7 12 14 39
12:00 4 4 7 10 25
13:00 9 5 9 4 27
14:00 8 6 12 2 28
15:00 10 13 4 15 42
16:00 7 16 9 8 40
17:00 7 11 13 2 33
18:00 6 6 9 5 26
19:00 9 10 14 4 37
20:00 7 7 4 4 22
21:00 3 3 8 5 19
22:00 6 0 3 2 11
23:00 5 3 4 2 14
Day Total : 518
AM Total :
PM Total :
Peak AM Hour :
Peak PM Hour :
Average Period :
Average Hour :
Peak AM Factor :
Peak PM Factor :
194 (37.5%)
324 (62.5%)
0.786
0.734
5.4
21.6
07:45 =
15:45 =
44 (8.5%)
47 (9.1%)
Centurion Basic Volume Report Printed: 03/01/15 Page 3Centurion Basic Volume Report Printed: 03/01/15 Page 3
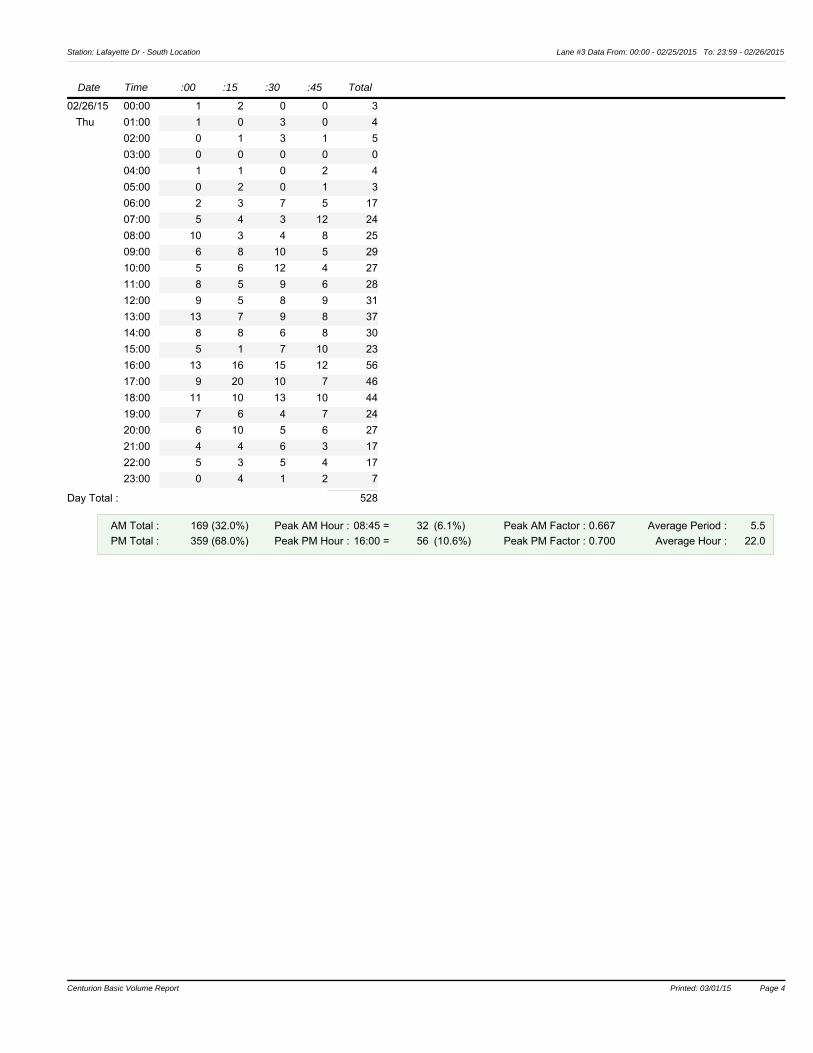
Station: Lafayette Dr - South Location Lane #3 Data From: 00:00 - 02/25/2015 To: 23:59 - 02/26/2015
Date Time :00 :15 :30 :45 Total
02/26/15 00:00 1 2 0 0 3
Thu 01:00 1 0 3 0 4
02:00 0 1 3 1 5
03:00 0 0 0 0 0
04:00 1 1 0 2 4
05:00 0 2 0 1 3
06:00 2 3 7 5 17
07:00 5 4 3 12 24
08:00 10 3 4 8 25
09:00 6 8 10 5 29
10:00 5 6 12 4 27
11:00 8 5 9 6 28
12:00 9 5 8 9 31
13:00 13 7 9 8 37
14:00 8 8 6 8 30
15:00 5 1 7 10 23
16:00 13 16 15 12 56
17:00 9 20 10 7 46
18:00 11 10 13 10 44
19:00 7 6 4 7 24
20:00 6 10 5 6 27
21:00 4 4 6 3 17
22:00 5 3 5 4 17
23:00 0 4 1 2 7
Day Total : 528
AM Total :
PM Total :
Peak AM Hour :
Peak PM Hour :
Average Period :
Average Hour :
Peak AM Factor :
Peak PM Factor :
169 (32.0%)
359 (68.0%)
0.667
0.700
5.5
22.0
08:45 =
16:00 =
32 (6.1%)
56 (10.6%)
Centurion Basic Volume Report Printed: 03/01/15 Page 4Centurion Basic Volume Report Printed: 03/01/15 Page 4

Centurion Basic Volume Report Printed: 03/01/15 Page 5
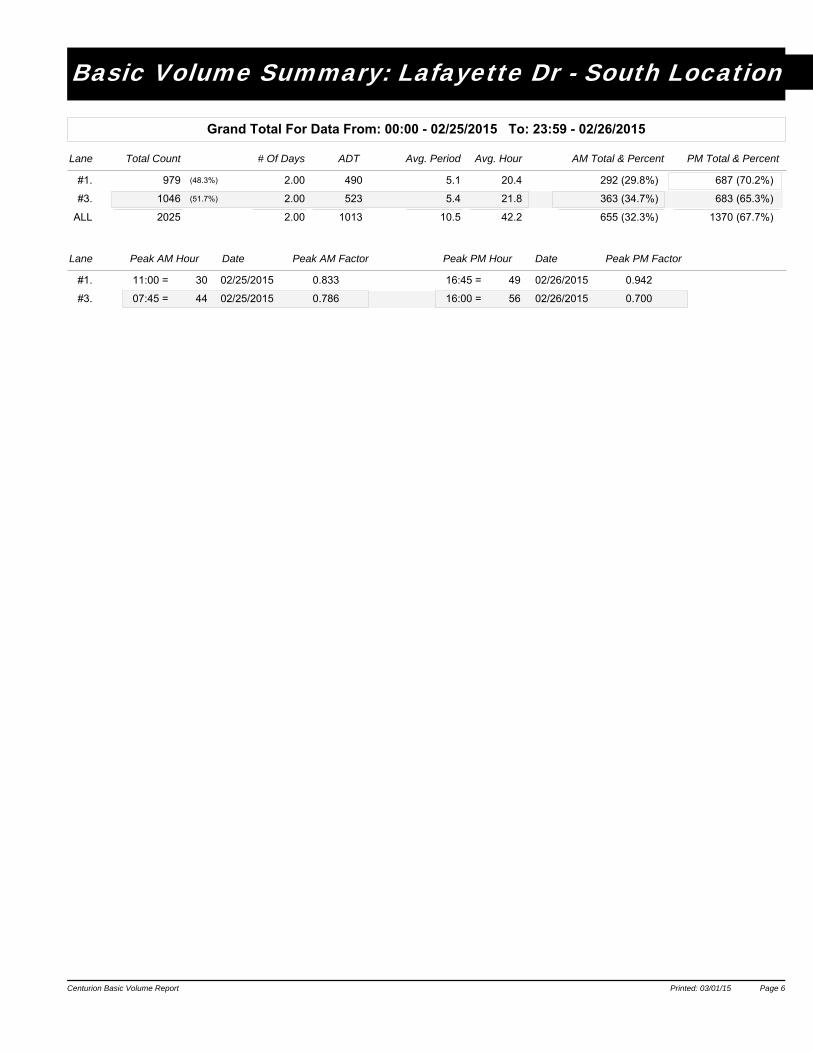
Basic Volume Summary: Lafayette Dr - South Location
Grand Total For Data From: 00:00 - 02/25/2015 To: 23:59 - 02/26/2015
Total Count # Of Days ADT Avg. Period PM Total & PercentAvg. Hour AM Total & PercentLane
#1. 979 2.00 490 5.1 20.4 292 687(48.3%) (70.2%)(29.8%)
#3. 1046 2.00 523 5.4 21.8 363 683(51.7%) (65.3%)(34.7%)
ALL 2025 2.00 1013 10.5 42.2 655 1370 (67.7%)(32.3%)
Lane Peak AM Hour Peak AM Factor Peak PM Hour Peak PM FactorDate Date
#1. 11:00 = 30 0.833 16:45 = 49 0.94202/25/2015 02/26/2015
#3. 07:45 = 44 0.786 16:00 = 56 0.70002/25/2015 02/26/2015
Centurion Basic Volume Report Printed: 03/01/15 Page 6

Basic Volume Report: Lafayette Dr - North Location
Station ID : Lafayette Dr - North LocationInfo Line 1 : North of Comanche RdInfo Line 2 : Albuquerque
DB File : NORTH.DBNumber of Lanes : 1
Posted Speed Limit :
144041.51ApolloLast Connected Device Type :
Version Number :Serial Number :
Lane #1 Configuration
# Dir. Information Volume Mode Volume Sensors Divide By 2 Comment
1. Northbound
GPS Lat/Lon :
Lane #1 Basic Volume Data From: 00:00 - 02/25/2015 To: 23:59 - 02/26/2015
Date Time :00 :15 :30 :45 Total
02/25/15 00:00 1 0 2 0 3
Wed 01:00 0 0 0 1 1
02:00 0 0 0 0 0
03:00 0 1 0 0 1
04:00 1 0 1 1 3
05:00 0 0 2 1 3
06:00 0 3 1 2 6
07:00 4 6 7 6 23
08:00 4 7 7 3 21
09:00 4 4 2 8 18
10:00 5 6 3 3 17
11:00 5 7 5 9 26
12:00 8 1 10 6 25
13:00 7 7 9 7 30
14:00 4 9 10 6 29
15:00 7 9 3 9 28
16:00 4 11 7 9 31
17:00 5 9 4 6 24
18:00 6 8 6 7 27
19:00 5 5 6 9 25
20:00 7 2 4 5 18
21:00 5 5 4 7 21
22:00 1 1 4 3 9
23:00 2 0 5 4 11
Day Total : 400
AM Total :
PM Total :
Peak AM Hour :
Peak PM Hour :
Average Period :
Average Hour :
Peak AM Factor :
Peak PM Factor :
122 (30.5%)
278 (69.5%)
0.722
0.727
4.2
16.7
11:00 =
14:15 =
26 (6.5%)
32 (8.0%)
Centurion Basic Volume Report Printed: 03/01/15 Page 1Centurion Basic Volume Report Printed: 03/01/15 Page 1
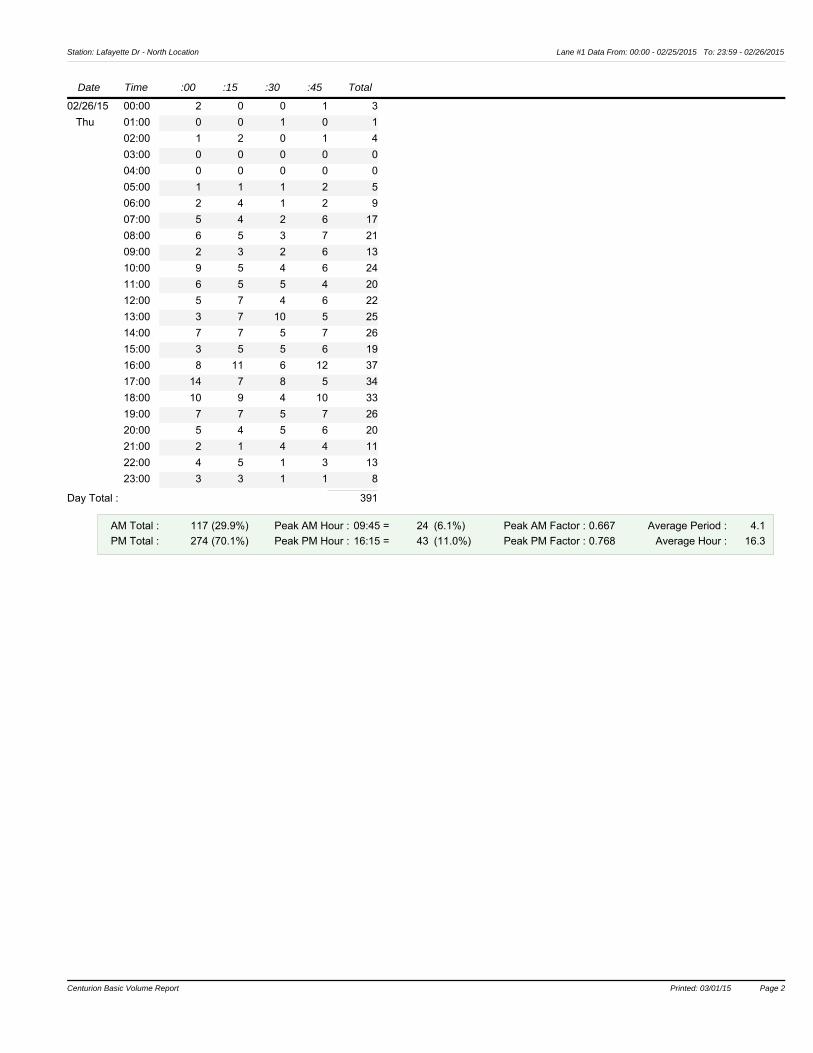
Station: Lafayette Dr - North Location Lane #1 Data From: 00:00 - 02/25/2015 To: 23:59 - 02/26/2015
Date Time :00 :15 :30 :45 Total
02/26/15 00:00 2 0 0 1 3
Thu 01:00 0 0 1 0 1
02:00 1 2 0 1 4
03:00 0 0 0 0 0
04:00 0 0 0 0 0
05:00 1 1 1 2 5
06:00 2 4 1 2 9
07:00 5 4 2 6 17
08:00 6 5 3 7 21
09:00 2 3 2 6 13
10:00 9 5 4 6 24
11:00 6 5 5 4 20
12:00 5 7 4 6 22
13:00 3 7 10 5 25
14:00 7 7 5 7 26
15:00 3 5 5 6 19
16:00 8 11 6 12 37
17:00 14 7 8 5 34
18:00 10 9 4 10 33
19:00 7 7 5 7 26
20:00 5 4 5 6 20
21:00 2 1 4 4 11
22:00 4 5 1 3 13
23:00 3 3 1 1 8
Day Total : 391
AM Total :
PM Total :
Peak AM Hour :
Peak PM Hour :
Average Period :
Average Hour :
Peak AM Factor :
Peak PM Factor :
117 (29.9%)
274 (70.1%)
0.667
0.768
4.1
16.3
09:45 =
16:15 =
24 (6.1%)
43 (11.0%)
Centurion Basic Volume Report Printed: 03/01/15 Page 2
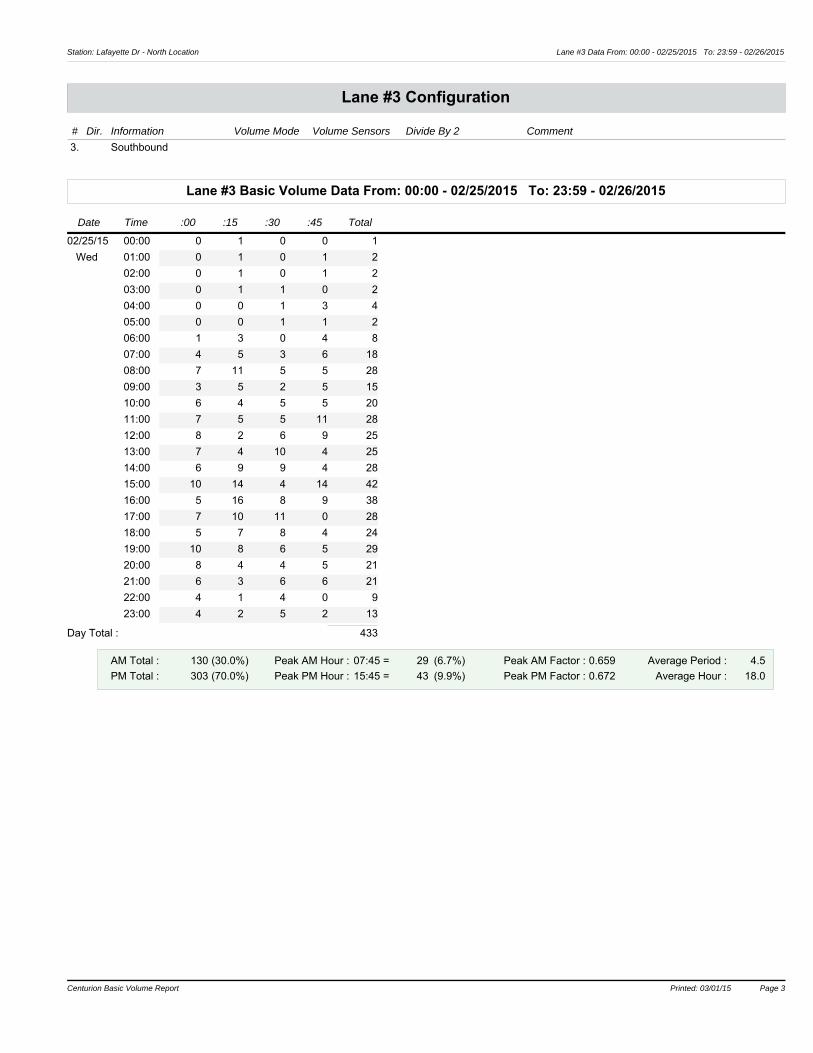
Station: Lafayette Dr - North Location Lane #3 Data From: 00:00 - 02/25/2015 To: 23:59 - 02/26/2015
Lane #3 Configuration
Lane #3 Basic Volume Data From: 00:00 - 02/25/2015 To: 23:59 - 02/26/2015
# Dir. Information Volume Mode Volume Sensors Divide By 2 Comment
3. Southbound
Date Time :00 :15 :30 :45 Total
02/25/15 00:00 0 1 0 0 1
Wed 01:00 0 1 0 1 2
02:00 0 1 0 1 2
03:00 0 1 1 0 2
04:00 0 0 1 3 4
05:00 0 0 1 1 2
06:00 1 3 0 4 8
07:00 4 5 3 6 18
08:00 7 11 5 5 28
09:00 3 5 2 5 15
10:00 6 4 5 5 20
11:00 7 5 5 11 28
12:00 8 2 6 9 25
13:00 7 4 10 4 25
14:00 6 9 9 4 28
15:00 10 14 4 14 42
16:00 5 16 8 9 38
17:00 7 10 11 0 28
18:00 5 7 8 4 24
19:00 10 8 6 5 29
20:00 8 4 4 5 21
21:00 6 3 6 6 21
22:00 4 1 4 0 9
23:00 4 2 5 2 13
Day Total : 433
AM Total :
PM Total :
Peak AM Hour :
Peak PM Hour :
Average Period :
Average Hour :
Peak AM Factor :
Peak PM Factor :
130 (30.0%)
303 (70.0%)
0.659
0.672
4.5
18.0
07:45 =
15:45 =
29 (6.7%)
43 (9.9%)
Centurion Basic Volume Report Printed: 03/01/15 Page 3Centurion Basic Volume Report Printed: 03/01/15 Page 3
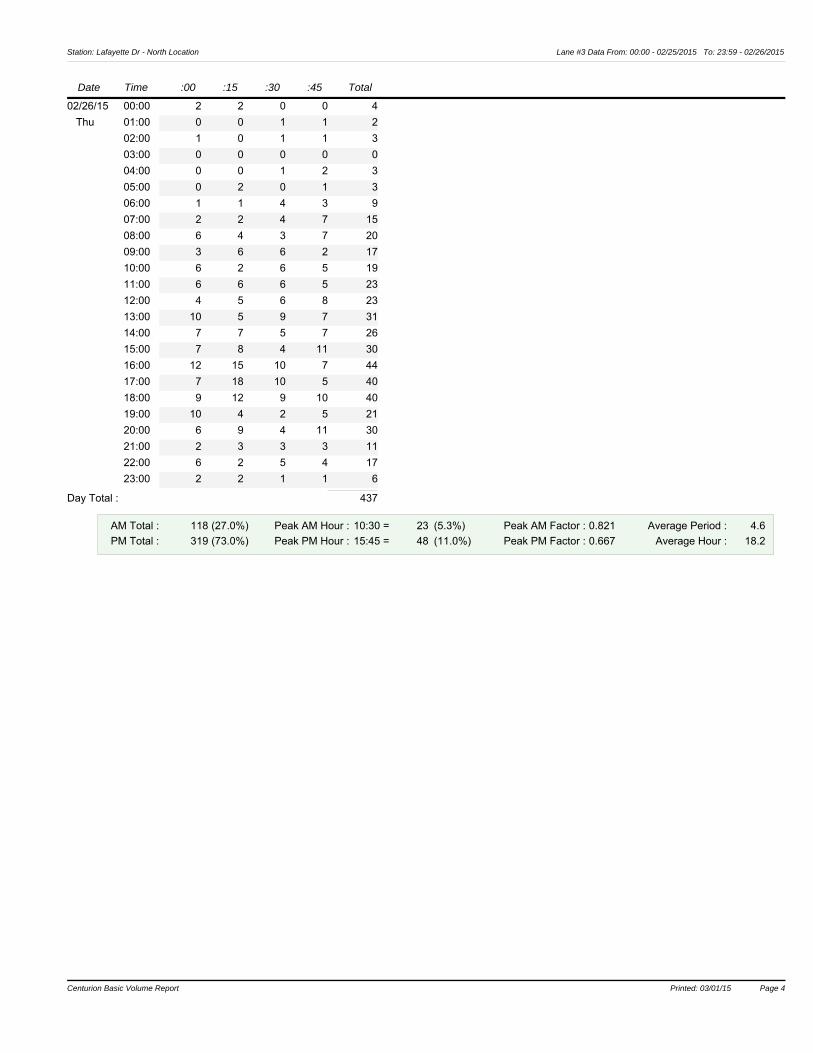
Station: Lafayette Dr - North Location Lane #3 Data From: 00:00 - 02/25/2015 To: 23:59 - 02/26/2015
Date Time :00 :15 :30 :45 Total
02/26/15 00:00 2 2 0 0 4
Thu 01:00 0 0 1 1 2
02:00 1 0 1 1 3
03:00 0 0 0 0 0
04:00 0 0 1 2 3
05:00 0 2 0 1 3
06:00 1 1 4 3 9
07:00 2 2 4 7 15
08:00 6 4 3 7 20
09:00 3 6 6 2 17
10:00 6 2 6 5 19
11:00 6 6 6 5 23
12:00 4 5 6 8 23
13:00 10 5 9 7 31
14:00 7 7 5 7 26
15:00 7 8 4 11 30
16:00 12 15 10 7 44
17:00 7 18 10 5 40
18:00 9 12 9 10 40
19:00 10 4 2 5 21
20:00 6 9 4 11 30
21:00 2 3 3 3 11
22:00 6 2 5 4 17
23:00 2 2 1 1 6
Day Total : 437
AM Total :
PM Total :
Peak AM Hour :
Peak PM Hour :
Average Period :
Average Hour :
Peak AM Factor :
Peak PM Factor :
118 (27.0%)
319 (73.0%)
0.821
0.667
4.6
18.2
10:30 =
15:45 =
23 (5.3%)
48 (11.0%)
Centurion Basic Volume Report Printed: 03/01/15 Page 4Centurion Basic Volume Report Printed: 03/01/15 Page 4

Centurion Basic Volume Report Printed: 03/01/15 Page 5

Basic Volume Summary: Lafayette Dr - North Location
Grand Total For Data From: 00:00 - 02/25/2015 To: 23:59 - 02/26/2015
Total Count # Of Days ADT Avg. Period PM Total & PercentAvg. Hour AM Total & PercentLane
#1. 791 2.00 396 4.1 16.5 239 552(47.6%) (69.8%)(30.2%)
#3. 870 2.00 435 4.5 18.1 248 622(52.4%) (71.5%)(28.5%)
ALL 1661 2.00 831 8.6 34.6 487 1174 (70.7%)(29.3%)
Lane Peak AM Hour Peak AM Factor Peak PM Hour Peak PM FactorDate Date
#1. 11:00 = 26 0.722 16:15 = 43 0.76802/25/2015 02/26/2015
#3. 07:45 = 29 0.659 15:45 = 48 0.66702/25/2015 02/26/2015
Centurion Basic Volume Report Printed: 03/01/15 Page 6
APPENDIX B SPEED DATA
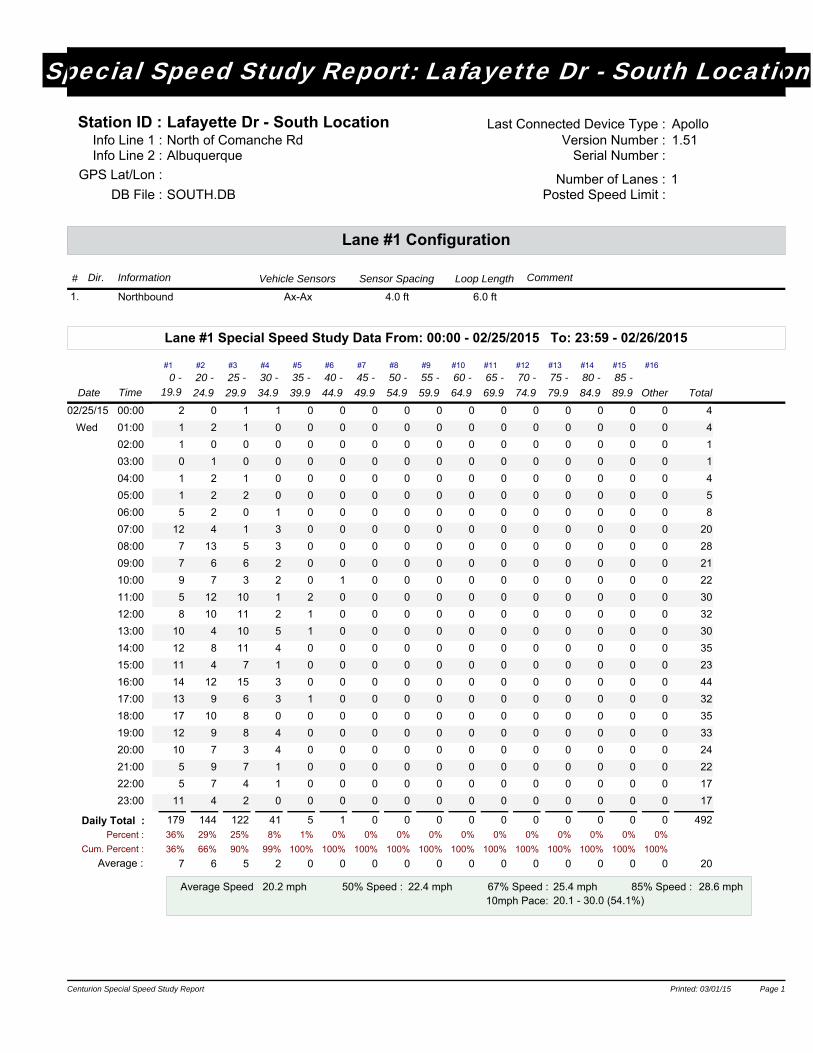
Special Speed Study Report: Lafayette Dr - South Location
Station ID : Lafayette Dr - South LocationInfo Line 1 : North of Comanche RdInfo Line 2 : Albuquerque
DB File : SOUTH.DBNumber of Lanes : 1
Posted Speed Limit :
1.51ApolloLast Connected Device Type :
Version Number :Serial Number :
GPS Lat/Lon :
Lane #1 Configuration
# Dir. Vehicle SensorsInformation Sensor Spacing Loop Length Comment
1. Northbound Ax-Ax 4.0 ft 6.0 ft
Lane #1 Special Speed Study Data From: 00:00 - 02/25/2015 To: 23:59 - 02/26/2015
Date Time
#1 #2 #3 #5#4 #7#6 #8 #9 #10 #11 #12 #13 #16#15#14
Total
0 - 19.9
20 -
24.9
25 -
29.9
30 -
34.9
35 -
39.9
40 -
44.9
45 -
49.9
50 - 55 - 60 - 65 - 70 - 75 -
54.9 59.9 64.9 69.9 74.9 79.9 Other89.9
85 -
84.9
80 -
02/25/15 00:00 2 0 1 1 0 0 0 0 0 0 0 0 0 0 0 0 4
Wed 01:00 1 2 1 0 0 0 0 0 0 0 0 0 0 0 0 0 4
02:00 1 0 0 0 0 0 0 0 0 0 0 0 0 0 0 0 1
03:00 0 1 0 0 0 0 0 0 0 0 0 0 0 0 0 0 1
04:00 1 2 1 0 0 0 0 0 0 0 0 0 0 0 0 0 4
05:00 1 2 2 0 0 0 0 0 0 0 0 0 0 0 0 0 5
06:00 5 2 0 1 0 0 0 0 0 0 0 0 0 0 0 0 8
07:00 12 4 1 3 0 0 0 0 0 0 0 0 0 0 0 0 20
08:00 7 13 5 3 0 0 0 0 0 0 0 0 0 0 0 0 28
09:00 7 6 6 2 0 0 0 0 0 0 0 0 0 0 0 0 21
10:00 9 7 3 2 0 1 0 0 0 0 0 0 0 0 0 0 22
11:00 5 12 10 1 2 0 0 0 0 0 0 0 0 0 0 0 30
12:00 8 10 11 2 1 0 0 0 0 0 0 0 0 0 0 0 32
13:00 10 4 10 5 1 0 0 0 0 0 0 0 0 0 0 0 30
14:00 12 8 11 4 0 0 0 0 0 0 0 0 0 0 0 0 35
15:00 11 4 7 1 0 0 0 0 0 0 0 0 0 0 0 0 23
16:00 14 12 15 3 0 0 0 0 0 0 0 0 0 0 0 0 44
17:00 13 9 6 3 1 0 0 0 0 0 0 0 0 0 0 0 32
18:00 17 10 8 0 0 0 0 0 0 0 0 0 0 0 0 0 35
19:00 12 9 8 4 0 0 0 0 0 0 0 0 0 0 0 0 33
20:00 10 7 3 4 0 0 0 0 0 0 0 0 0 0 0 0 24
21:00 5 9 7 1 0 0 0 0 0 0 0 0 0 0 0 0 22
22:00 5 7 4 1 0 0 0 0 0 0 0 0 0 0 0 0 17
23:00 11 4 2 0 0 0 0 0 0 0 0 0 0 0 0 0 17
Daily Total : 5 1 0 0 0 0 0 0 0 0 0 0 492179 144 122 4136% 29% 25% 8% 1% 0% 0% 0% 0% 0% 0% 0% 0% 0% 0% 0% Percent :
Cum. Percent :
Average :36% 66% 90% 99% 100% 100% 100% 100% 100% 100% 100% 100% 100% 100% 100% 100%
7 6 5 2 0 0 0 0 0 0 0 0 0 0 0 0 20
Average Speed 50% Speed : 67% Speed : 85% Speed : 20.2 mph 22.4 mph 25.4 mph 28.6 mph10mph Pace: 20.1 - 30.0 (54.1%)
Centurion Special Speed Study Report Printed: 03/01/15 Page 1Centurion Special Speed Study Report Printed: 03/01/15 Page 1
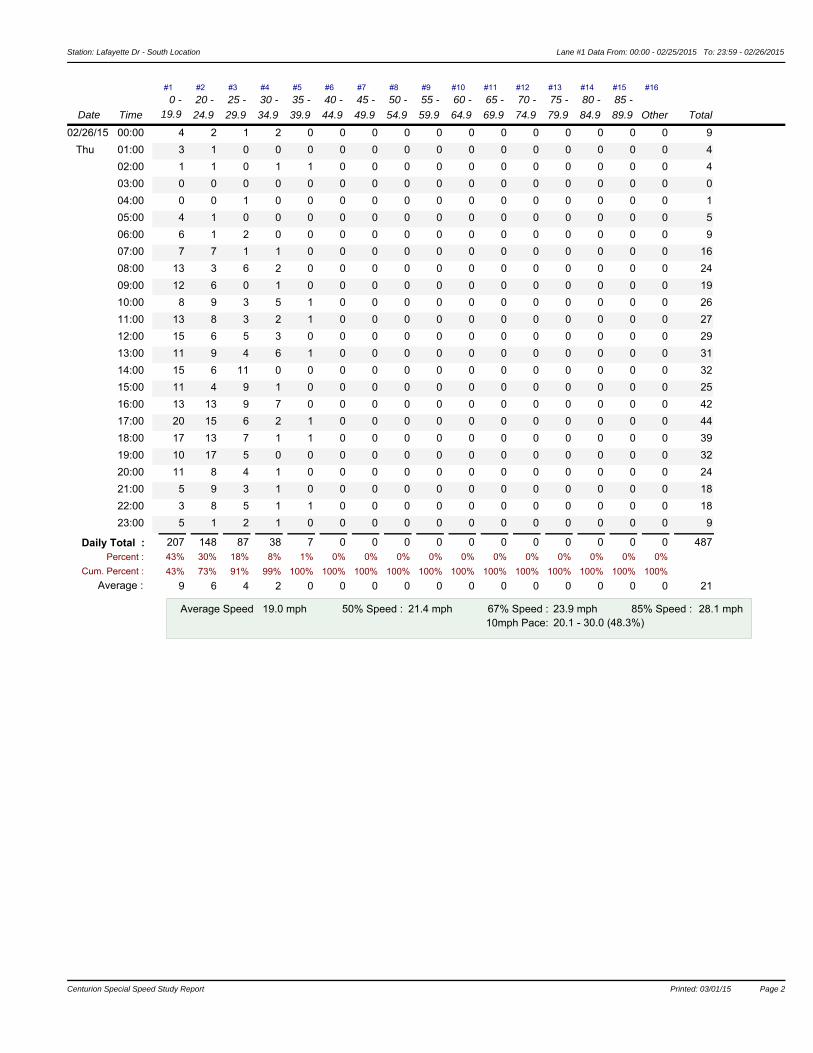
Station: Lafayette Dr - South Location Lane #1 Data From: 00:00 - 02/25/2015 To: 23:59 - 02/26/2015
Date Time
#1 #2 #3 #5#4 #7#6 #8 #9 #10 #11 #12 #13 #16#15#14
Total
0 - 19.9
20 -
24.9
25 -
29.9
30 -
34.9
35 -
39.9
40 -
44.9
45 -
49.9
50 - 55 - 60 - 65 - 70 - 75 -
54.9 59.9 64.9 69.9 74.9 79.9 Other89.9
85 -
84.9
80 -
02/26/15 00:00 4 2 1 2 0 0 0 0 0 0 0 0 0 0 0 0 9
Thu 01:00 3 1 0 0 0 0 0 0 0 0 0 0 0 0 0 0 4
02:00 1 1 0 1 1 0 0 0 0 0 0 0 0 0 0 0 4
03:00 0 0 0 0 0 0 0 0 0 0 0 0 0 0 0 0 0
04:00 0 0 1 0 0 0 0 0 0 0 0 0 0 0 0 0 1
05:00 4 1 0 0 0 0 0 0 0 0 0 0 0 0 0 0 5
06:00 6 1 2 0 0 0 0 0 0 0 0 0 0 0 0 0 9
07:00 7 7 1 1 0 0 0 0 0 0 0 0 0 0 0 0 16
08:00 13 3 6 2 0 0 0 0 0 0 0 0 0 0 0 0 24
09:00 12 6 0 1 0 0 0 0 0 0 0 0 0 0 0 0 19
10:00 8 9 3 5 1 0 0 0 0 0 0 0 0 0 0 0 26
11:00 13 8 3 2 1 0 0 0 0 0 0 0 0 0 0 0 27
12:00 15 6 5 3 0 0 0 0 0 0 0 0 0 0 0 0 29
13:00 11 9 4 6 1 0 0 0 0 0 0 0 0 0 0 0 31
14:00 15 6 11 0 0 0 0 0 0 0 0 0 0 0 0 0 32
15:00 11 4 9 1 0 0 0 0 0 0 0 0 0 0 0 0 25
16:00 13 13 9 7 0 0 0 0 0 0 0 0 0 0 0 0 42
17:00 20 15 6 2 1 0 0 0 0 0 0 0 0 0 0 0 44
18:00 17 13 7 1 1 0 0 0 0 0 0 0 0 0 0 0 39
19:00 10 17 5 0 0 0 0 0 0 0 0 0 0 0 0 0 32
20:00 11 8 4 1 0 0 0 0 0 0 0 0 0 0 0 0 24
21:00 5 9 3 1 0 0 0 0 0 0 0 0 0 0 0 0 18
22:00 3 8 5 1 1 0 0 0 0 0 0 0 0 0 0 0 18
23:00 5 1 2 1 0 0 0 0 0 0 0 0 0 0 0 0 9
Daily Total : 7 0 0 0 0 0 0 0 0 0 0 0 487207 148 87 3843% 30% 18% 8% 1% 0% 0% 0% 0% 0% 0% 0% 0% 0% 0% 0% Percent :
Cum. Percent :
Average :43% 73% 91% 99% 100% 100% 100% 100% 100% 100% 100% 100% 100% 100% 100% 100%
9 6 4 2 0 0 0 0 0 0 0 0 0 0 0 0 21
Average Speed 50% Speed : 67% Speed : 85% Speed : 19.0 mph 21.4 mph 23.9 mph 28.1 mph10mph Pace: 20.1 - 30.0 (48.3%)
Centurion Special Speed Study Report Printed: 03/01/15 Page 2Centurion Special Speed Study Report Printed: 03/01/15 Page 2
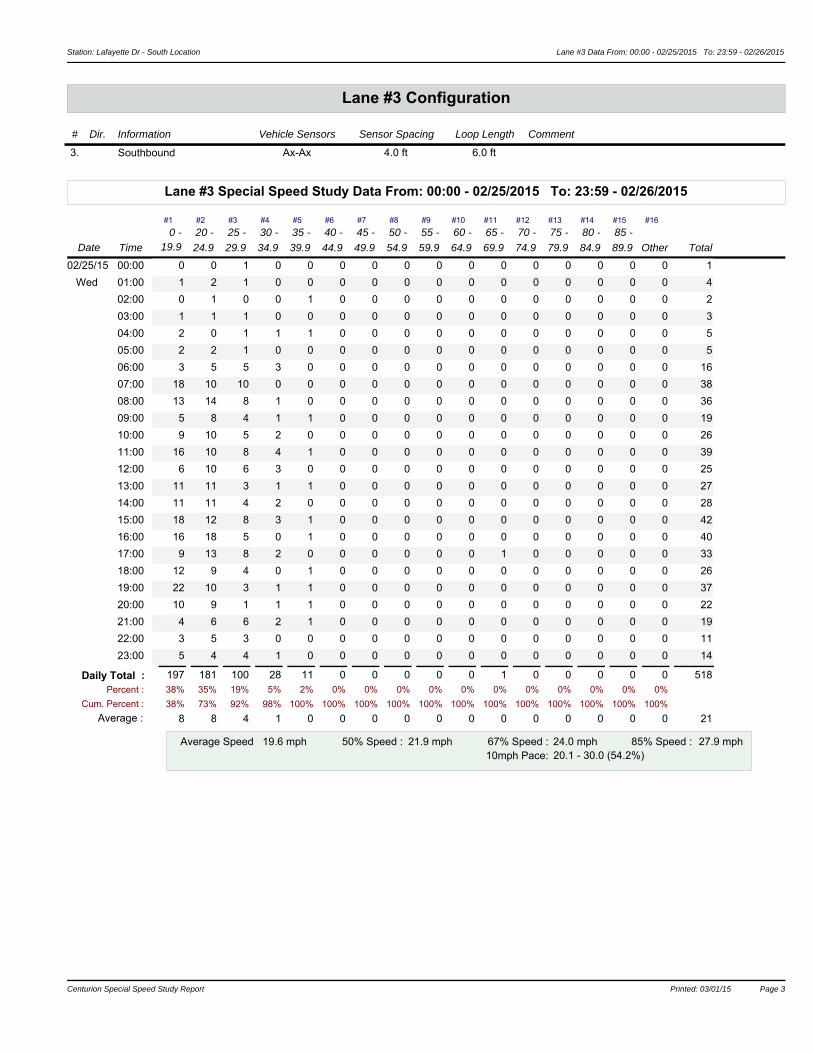
Station: Lafayette Dr - South Location Lane #3 Data From: 00:00 - 02/25/2015 To: 23:59 - 02/26/2015
Lane #3 Configuration
# Dir. Information Vehicle Sensors Sensor Spacing Loop Length Comment
3. Southbound Ax-Ax 4.0 ft 6.0 ft
Lane #3 Special Speed Study Data From: 00:00 - 02/25/2015 To: 23:59 - 02/26/2015
Date Time
#1 #2 #3 #5#4 #7#6 #8 #9 #10 #11 #12 #13 #16#15#14
Total
0 - 19.9
20 -
24.9
25 -
29.9
30 -
34.9
35 -
39.9
40 -
44.9
45 -
49.9
50 - 55 - 60 - 65 - 70 - 75 -
54.9 59.9 64.9 69.9 74.9 79.9 Other89.9
85 -
84.9
80 -
02/25/15 00:00 0 0 1 0 0 0 0 0 0 0 0 0 0 0 0 0 1
Wed 01:00 1 2 1 0 0 0 0 0 0 0 0 0 0 0 0 0 4
02:00 0 1 0 0 1 0 0 0 0 0 0 0 0 0 0 0 2
03:00 1 1 1 0 0 0 0 0 0 0 0 0 0 0 0 0 3
04:00 2 0 1 1 1 0 0 0 0 0 0 0 0 0 0 0 5
05:00 2 2 1 0 0 0 0 0 0 0 0 0 0 0 0 0 5
06:00 3 5 5 3 0 0 0 0 0 0 0 0 0 0 0 0 16
07:00 18 10 10 0 0 0 0 0 0 0 0 0 0 0 0 0 38
08:00 13 14 8 1 0 0 0 0 0 0 0 0 0 0 0 0 36
09:00 5 8 4 1 1 0 0 0 0 0 0 0 0 0 0 0 19
10:00 9 10 5 2 0 0 0 0 0 0 0 0 0 0 0 0 26
11:00 16 10 8 4 1 0 0 0 0 0 0 0 0 0 0 0 39
12:00 6 10 6 3 0 0 0 0 0 0 0 0 0 0 0 0 25
13:00 11 11 3 1 1 0 0 0 0 0 0 0 0 0 0 0 27
14:00 11 11 4 2 0 0 0 0 0 0 0 0 0 0 0 0 28
15:00 18 12 8 3 1 0 0 0 0 0 0 0 0 0 0 0 42
16:00 16 18 5 0 1 0 0 0 0 0 0 0 0 0 0 0 40
17:00 9 13 8 2 0 0 0 0 0 0 1 0 0 0 0 0 33
18:00 12 9 4 0 1 0 0 0 0 0 0 0 0 0 0 0 26
19:00 22 10 3 1 1 0 0 0 0 0 0 0 0 0 0 0 37
20:00 10 9 1 1 1 0 0 0 0 0 0 0 0 0 0 0 22
21:00 4 6 6 2 1 0 0 0 0 0 0 0 0 0 0 0 19
22:00 3 5 3 0 0 0 0 0 0 0 0 0 0 0 0 0 11
23:00 5 4 4 1 0 0 0 0 0 0 0 0 0 0 0 0 14
Daily Total : 11 0 0 0 0 0 1 0 0 0 0 0 518197 181 100 2838% 35% 19% 5% 2% 0% 0% 0% 0% 0% 0% 0% 0% 0% 0% 0% Percent :
Cum. Percent :
Average :38% 73% 92% 98% 100% 100% 100% 100% 100% 100% 100% 100% 100% 100% 100% 100%
8 8 4 1 0 0 0 0 0 0 0 0 0 0 0 0 21
Average Speed 50% Speed : 67% Speed : 85% Speed : 19.6 mph 21.9 mph 24.0 mph 27.9 mph10mph Pace: 20.1 - 30.0 (54.2%)
Centurion Special Speed Study Report Printed: 03/01/15 Page 3Centurion Special Speed Study Report Printed: 03/01/15 Page 3
Station: Lafayette Dr - South Location Lane #3 Data From: 00:00 - 02/25/2015 To: 23:59 - 02/26/2015
Date Time
#1 #2 #3 #5#4 #7#6 #8 #9 #10 #11 #12 #13 #16#15#14
Total
0 - 19.9
20 -
24.9
25 -
29.9
30 -
34.9
35 -
39.9
40 -
44.9
45 -
49.9
50 - 55 - 60 - 65 - 70 - 75 -
54.9 59.9 64.9 69.9 74.9 79.9 Other89.9
85 -
84.9
80 -
02/26/15 00:00 0 0 2 1 0 0 0 0 0 0 0 0 0 0 0 0 3
Thu 01:00 3 1 0 0 0 0 0 0 0 0 0 0 0 0 0 0 4
02:00 1 1 3 0 0 0 0 0 0 0 0 0 0 0 0 0 5
03:00 0 0 0 0 0 0 0 0 0 0 0 0 0 0 0 0 0
04:00 1 0 3 0 0 0 0 0 0 0 0 0 0 0 0 0 4
05:00 0 3 0 0 0 0 0 0 0 0 0 0 0 0 0 0 3
06:00 6 4 5 2 0 0 0 0 0 0 0 0 0 0 0 0 17
07:00 6 10 8 0 0 0 0 0 0 0 0 0 0 0 0 0 24
08:00 8 5 9 3 0 0 0 0 0 0 0 0 0 0 0 0 25
09:00 14 8 4 3 0 0 0 0 0 0 0 0 0 0 0 0 29
10:00 10 9 7 1 0 0 0 0 0 0 0 0 0 0 0 0 27
11:00 17 6 4 1 0 0 0 0 0 0 0 0 0 0 0 0 28
12:00 16 9 4 1 1 0 0 0 0 0 0 0 0 0 0 0 31
13:00 13 16 5 2 0 0 1 0 0 0 0 0 0 0 0 0 37
14:00 19 5 5 1 0 0 0 0 0 0 0 0 0 0 0 0 30
15:00 11 6 4 1 1 0 0 0 0 0 0 0 0 0 0 0 23
16:00 23 21 12 0 0 0 0 0 0 0 0 0 0 0 0 0 56
17:00 22 16 6 2 0 0 0 0 0 0 0 0 0 0 0 0 46
18:00 17 18 8 1 0 0 0 0 0 0 0 0 0 0 0 0 44
19:00 15 5 1 3 0 0 0 0 0 0 0 0 0 0 0 0 24
20:00 18 6 3 0 0 0 0 0 0 0 0 0 0 0 0 0 27
21:00 7 7 2 1 0 0 0 0 0 0 0 0 0 0 0 0 17
22:00 7 6 3 1 0 0 0 0 0 0 0 0 0 0 0 0 17
23:00 4 1 2 0 0 0 0 0 0 0 0 0 0 0 0 0 7
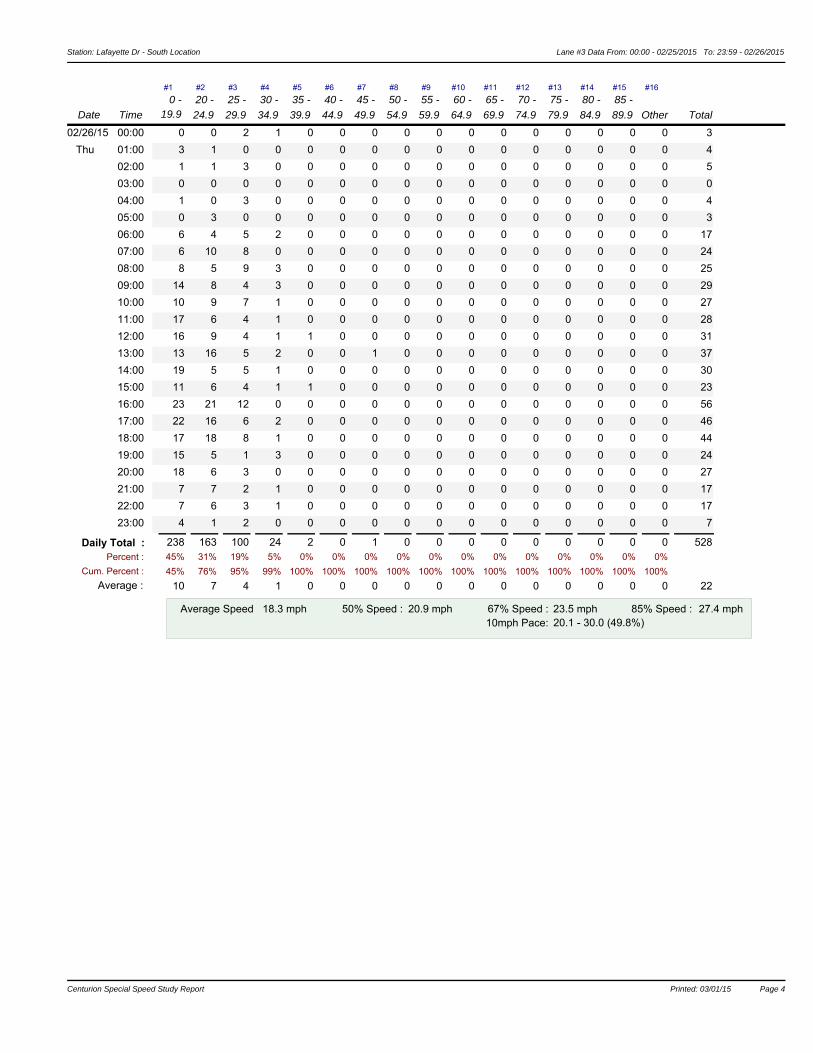
Daily Total : 2 0 1 0 0 0 0 0 0 0 0 0 528238 163 100 2445% 31% 19% 5% 0% 0% 0% 0% 0% 0% 0% 0% 0% 0% 0% 0% Percent :
Cum. Percent :
Average :45% 76% 95% 99% 100% 100% 100% 100% 100% 100% 100% 100% 100% 100% 100% 100%
10 7 4 1 0 0 0 0 0 0 0 0 0 0 0 0 22
Average Speed 50% Speed : 67% Speed : 85% Speed : 18.3 mph 20.9 mph 23.5 mph 27.4 mph10mph Pace: 20.1 - 30.0 (49.8%)
Centurion Special Speed Study Report Printed: 03/01/15 Page 4Centurion Special Speed Study Report Printed: 03/01/15 Page 4

Station: Lafayette Dr - South Location Lane #3 Data From: 00:00 - 02/25/2015 To: 23:59 - 02/26/2015
Date Time
#1 #2 #3 #5#4 #7#6 #8 #9 #10 #11 #12 #13 #16#15#14
Total
0 - 19.9
20 -
24.9
25 -
29.9
30 -
34.9
35 -
39.9
40 -
44.9
45 -
49.9
50 - 55 - 60 - 65 - 70 - 75 -
54.9 59.9 64.9 69.9 74.9 79.9 Other89.9
85 -
84.9
80 -
Centurion Special Speed Study Report Printed: 03/01/15 Page 5
Station: Lafayette Dr - South Location Data From: 00:00 - 02/25/2015 To: 23:59 - 02/26/2015
Special Speed Study Summary: Lafayette Dr - South Location
Description 19.9 0 -
#1 #2
20 -
24.9 29.9
25 - #3
30 -
34.9
#4 #5
35 -
39.9 44.9
40 - #6
49.9
45 - #7 #8
50 -
54.9 59.9
55 - #9 #10
60 -
64.9 69.9
65 - #11 #12
70 -
74.9 79.9
75 - #13 #14
80 -
84.9 89.9
85 - #15 #16
Other Total
Grand Total #1: 386 292 209 79 12 1 0 0 0 0 0 0 0 0 0 97939% 30% 21% 8% 1% 0% 0% 0% 0% 0% 0% 0% 0% 0% 0% 0% Percent :
Cum. Percent :
Average :
0
39% 69% 91% 99% 100% 100% 100% 100% 100% 100% 100% 100% 100% 100% 100% 100%
8 6 4 2 0 0 0 0 0 0 0 0 0 0 0 0 20
Average Speed 19.6 mph 50% Speed : 21.9 mph 67% Speed :10mph Pace: 20.1 - 30.0 (51.3%)
24.5 mph 85% Speed : 28.5 mphADT = 489
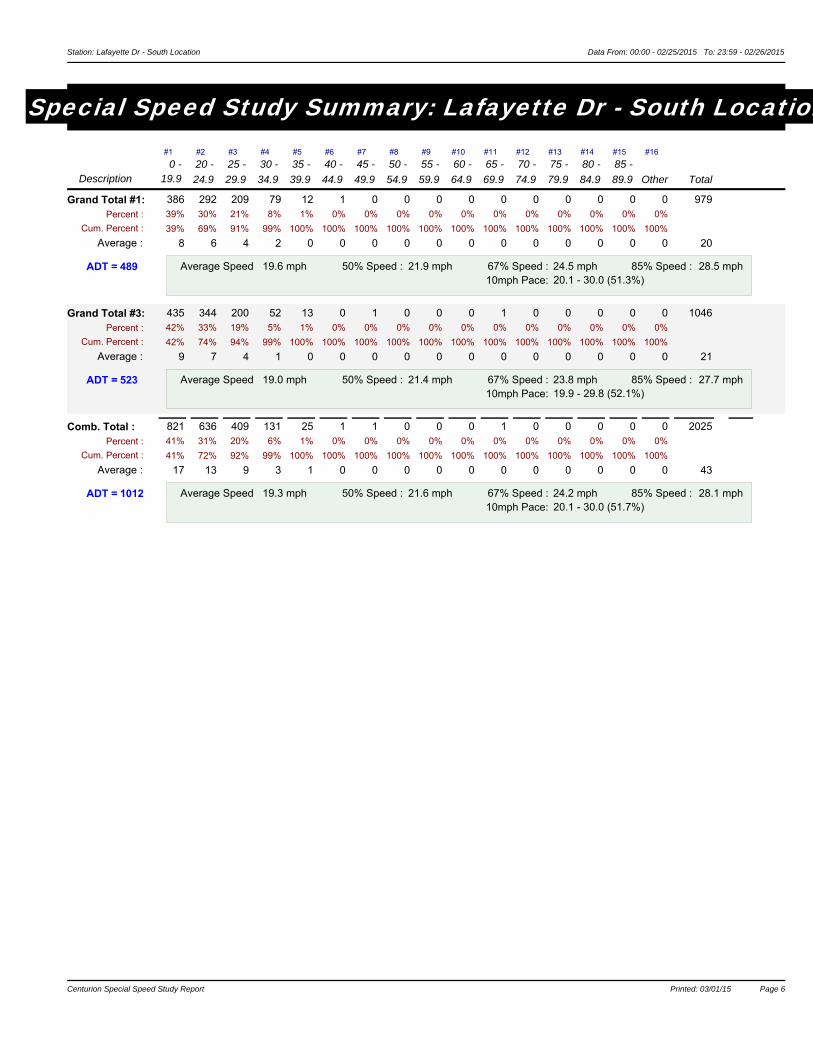
Grand Total #3: 435 344 200 52 13 0 1 0 0 0 1 0 0 0 0 104642% 33% 19% 5% 1% 0% 0% 0% 0% 0% 0% 0% 0% 0% 0% 0% Percent :
Cum. Percent :
Average :
0
42% 74% 94% 99% 100% 100% 100% 100% 100% 100% 100% 100% 100% 100% 100% 100%
9 7 4 1 0 0 0 0 0 0 0 0 0 0 0 0 21
Average Speed 19.0 mph 50% Speed : 21.4 mph 67% Speed :10mph Pace: 19.9 - 29.8 (52.1%)
23.8 mph 85% Speed : 27.7 mphADT = 523
Comb. Total : 821 636 409 131 25 1 1 0 0 0 1 0 0 0 0 202541% 31% 20% 6% 1% 0% 0% 0% 0% 0% 0% 0% 0% 0% 0% 0% Percent :
Cum. Percent :
Average :
0
41% 72% 92% 99% 100% 100% 100% 100% 100% 100% 100% 100% 100% 100% 100% 100%
17 13 9 3 1 0 0 0 0 0 0 0 0 0 0 0 43
Average Speed 19.3 mph 50% Speed : 21.6 mph 67% Speed :10mph Pace: 20.1 - 30.0 (51.7%)
24.2 mph 85% Speed : 28.1 mphADT = 1012
Centurion Special Speed Study Report Printed: 03/01/15 Page 6
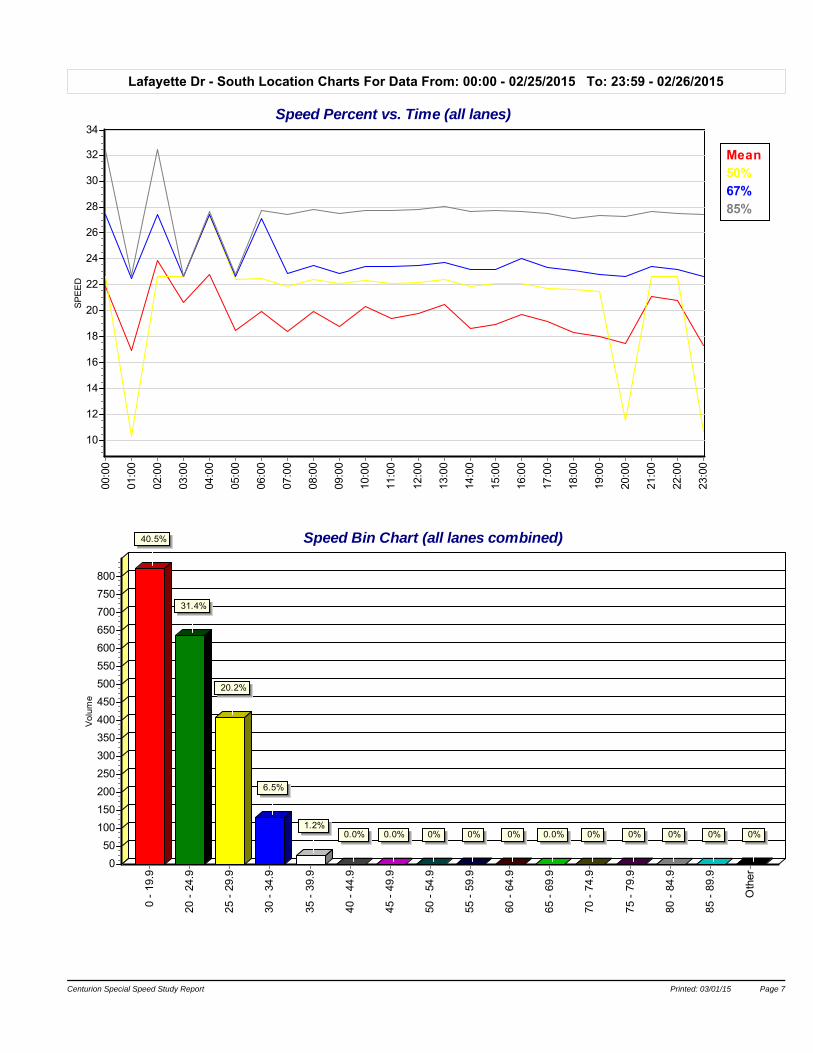
Lafayette Dr - South Location Charts For Data From: 00:00 - 02/25/2015 To: 23:59 - 02/26/2015
Mean50%67%85%
Speed Percent vs. Time (all lanes)00
:00
01:0
0
02:0
0
03:0
0
04:0
0
05:0
0
06:0
0
07:0
0
08:0
0
09:0
0
10:0
0
11:0
0
12:0
0
13:0
0
14:0
0
15:0
0
16:0
0
17:0
0
18:0
0
19:0
0
20:0
0
21:0
0
22:0
0
23:0
0
SP
EE
D
34
32
30
28
26
24
22
20
18
16
14
12
10
Speed Bin Chart (all lanes combined)
0 -
19.9
20 -
24.
9
25 -
29.
9
30 -
34.
9
35 -
39.
9
40 -
44.
9
45 -
49.
9
50 -
54.
9
55 -
59.
9
60 -
64.
9
65 -
69.
9
70 -
74.
9
75 -
79.
9
80 -
84.
9
85 -
89.
9
Oth
er
Vol
ume
800
750
700
650
600
550
500
450
400
350
300
250
200
150
100
50
0
40.5%
31.4%
20.2%
6.5%
1.2%0.0% 0.0% 0% 0% 0% 0.0% 0% 0% 0% 0% 0%
Centurion Special Speed Study Report Printed: 03/01/15 Page 7
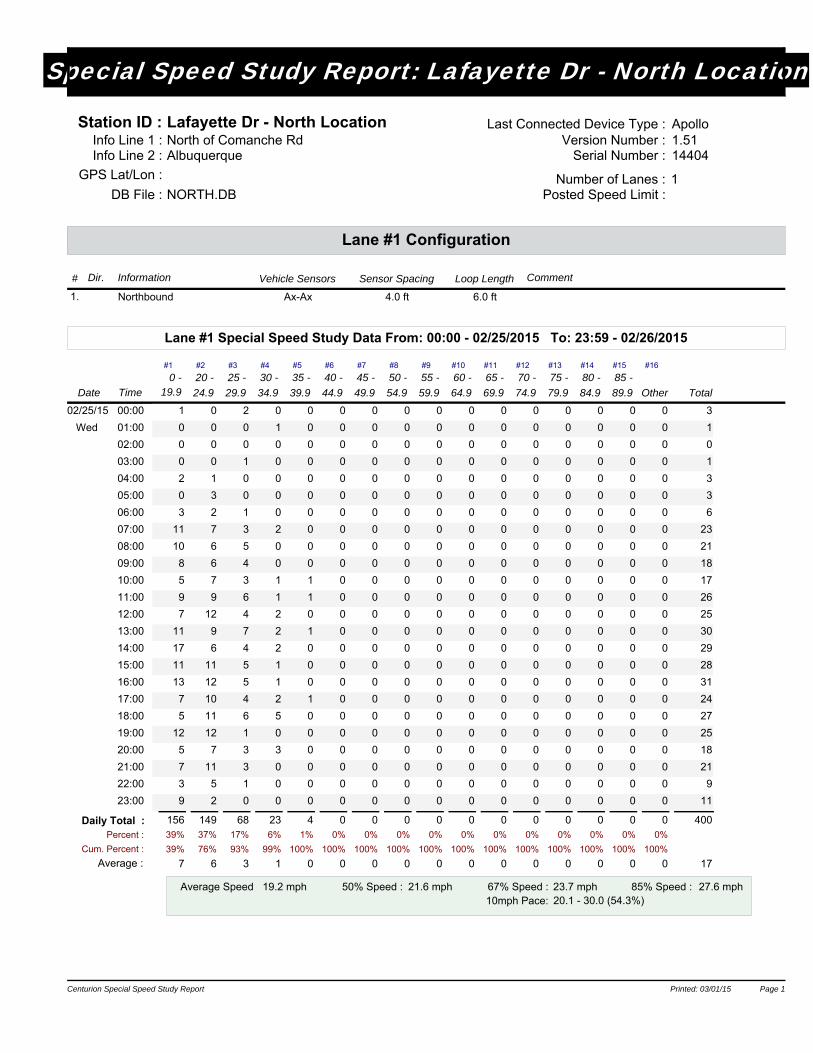
Special Speed Study Report: Lafayette Dr - North Location
Station ID : Lafayette Dr - North LocationInfo Line 1 : North of Comanche RdInfo Line 2 : Albuquerque
DB File : NORTH.DBNumber of Lanes : 1
Posted Speed Limit :
144041.51ApolloLast Connected Device Type :
Version Number :Serial Number :
GPS Lat/Lon :
Lane #1 Configuration
# Dir. Vehicle SensorsInformation Sensor Spacing Loop Length Comment
1. Northbound Ax-Ax 4.0 ft 6.0 ft
Lane #1 Special Speed Study Data From: 00:00 - 02/25/2015 To: 23:59 - 02/26/2015
Date Time
#1 #2 #3 #5#4 #7#6 #8 #9 #10 #11 #12 #13 #16#15#14
Total
0 - 19.9
20 -
24.9
25 -
29.9
30 -
34.9
35 -
39.9
40 -
44.9
45 -
49.9
50 - 55 - 60 - 65 - 70 - 75 -
54.9 59.9 64.9 69.9 74.9 79.9 Other89.9
85 -
84.9
80 -
02/25/15 00:00 1 0 2 0 0 0 0 0 0 0 0 0 0 0 0 0 3
Wed 01:00 0 0 0 1 0 0 0 0 0 0 0 0 0 0 0 0 1
02:00 0 0 0 0 0 0 0 0 0 0 0 0 0 0 0 0 0
03:00 0 0 1 0 0 0 0 0 0 0 0 0 0 0 0 0 1
04:00 2 1 0 0 0 0 0 0 0 0 0 0 0 0 0 0 3
05:00 0 3 0 0 0 0 0 0 0 0 0 0 0 0 0 0 3
06:00 3 2 1 0 0 0 0 0 0 0 0 0 0 0 0 0 6
07:00 11 7 3 2 0 0 0 0 0 0 0 0 0 0 0 0 23
08:00 10 6 5 0 0 0 0 0 0 0 0 0 0 0 0 0 21
09:00 8 6 4 0 0 0 0 0 0 0 0 0 0 0 0 0 18
10:00 5 7 3 1 1 0 0 0 0 0 0 0 0 0 0 0 17
11:00 9 9 6 1 1 0 0 0 0 0 0 0 0 0 0 0 26
12:00 7 12 4 2 0 0 0 0 0 0 0 0 0 0 0 0 25
13:00 11 9 7 2 1 0 0 0 0 0 0 0 0 0 0 0 30
14:00 17 6 4 2 0 0 0 0 0 0 0 0 0 0 0 0 29
15:00 11 11 5 1 0 0 0 0 0 0 0 0 0 0 0 0 28
16:00 13 12 5 1 0 0 0 0 0 0 0 0 0 0 0 0 31
17:00 7 10 4 2 1 0 0 0 0 0 0 0 0 0 0 0 24
18:00 5 11 6 5 0 0 0 0 0 0 0 0 0 0 0 0 27
19:00 12 12 1 0 0 0 0 0 0 0 0 0 0 0 0 0 25
20:00 5 7 3 3 0 0 0 0 0 0 0 0 0 0 0 0 18
21:00 7 11 3 0 0 0 0 0 0 0 0 0 0 0 0 0 21
22:00 3 5 1 0 0 0 0 0 0 0 0 0 0 0 0 0 9
23:00 9 2 0 0 0 0 0 0 0 0 0 0 0 0 0 0 11
Daily Total : 4 0 0 0 0 0 0 0 0 0 0 0 400156 149 68 2339% 37% 17% 6% 1% 0% 0% 0% 0% 0% 0% 0% 0% 0% 0% 0% Percent :
Cum. Percent :
Average :39% 76% 93% 99% 100% 100% 100% 100% 100% 100% 100% 100% 100% 100% 100% 100%
7 6 3 1 0 0 0 0 0 0 0 0 0 0 0 0 17
Average Speed 50% Speed : 67% Speed : 85% Speed : 19.2 mph 21.6 mph 23.7 mph 27.6 mph10mph Pace: 20.1 - 30.0 (54.3%)
Centurion Special Speed Study Report Printed: 03/01/15 Page 1Centurion Special Speed Study Report Printed: 03/01/15 Page 1

Station: Lafayette Dr - North Location Lane #1 Data From: 00:00 - 02/25/2015 To: 23:59 - 02/26/2015
Date Time
#1 #2 #3 #5#4 #7#6 #8 #9 #10 #11 #12 #13 #16#15#14
Total
0 - 19.9
20 -
24.9
25 -
29.9
30 -
34.9
35 -
39.9
40 -
44.9
45 -
49.9
50 - 55 - 60 - 65 - 70 - 75 -
54.9 59.9 64.9 69.9 74.9 79.9 Other89.9
85 -
84.9
80 -
02/26/15 00:00 1 2 0 0 0 0 0 0 0 0 0 0 0 0 0 0 3
Thu 01:00 0 0 1 0 0 0 0 0 0 0 0 0 0 0 0 0 1
02:00 3 0 0 1 0 0 0 0 0 0 0 0 0 0 0 0 4
03:00 0 0 0 0 0 0 0 0 0 0 0 0 0 0 0 0 0
04:00 0 0 0 0 0 0 0 0 0 0 0 0 0 0 0 0 0
05:00 3 1 1 0 0 0 0 0 0 0 0 0 0 0 0 0 5
06:00 4 3 2 0 0 0 0 0 0 0 0 0 0 0 0 0 9
07:00 6 4 6 0 1 0 0 0 0 0 0 0 0 0 0 0 17
08:00 8 9 2 2 0 0 0 0 0 0 0 0 0 0 0 0 21
09:00 8 2 3 0 0 0 0 0 0 0 0 0 0 0 0 0 13
10:00 8 8 5 3 0 0 0 0 0 0 0 0 0 0 0 0 24
11:00 7 4 5 3 1 0 0 0 0 0 0 0 0 0 0 0 20
12:00 8 11 2 1 0 0 0 0 0 0 0 0 0 0 0 0 22
13:00 9 9 4 2 1 0 0 0 0 0 0 0 0 0 0 0 25
14:00 17 4 5 0 0 0 0 0 0 0 0 0 0 0 0 0 26
15:00 6 7 3 3 0 0 0 0 0 0 0 0 0 0 0 0 19
16:00 17 13 4 2 1 0 0 0 0 0 0 0 0 0 0 0 37
17:00 16 11 7 0 0 0 0 0 0 0 0 0 0 0 0 0 34
18:00 10 14 8 1 0 0 0 0 0 0 0 0 0 0 0 0 33
19:00 8 15 2 1 0 0 0 0 0 0 0 0 0 0 0 0 26
20:00 5 9 6 0 0 0 0 0 0 0 0 0 0 0 0 0 20
21:00 3 5 3 0 0 0 0 0 0 0 0 0 0 0 0 0 11
22:00 6 3 3 1 0 0 0 0 0 0 0 0 0 0 0 0 13
23:00 4 4 0 0 0 0 0 0 0 0 0 0 0 0 0 0 8
Daily Total : 4 0 0 0 0 0 0 0 0 0 0 0 391157 138 72 2040% 35% 18% 5% 1% 0% 0% 0% 0% 0% 0% 0% 0% 0% 0% 0% Percent :
Cum. Percent :
Average :40% 75% 94% 99% 100% 100% 100% 100% 100% 100% 100% 100% 100% 100% 100% 100%
7 6 3 1 0 0 0 0 0 0 0 0 0 0 0 0 17
Average Speed 50% Speed : 67% Speed : 85% Speed : 19.0 mph 21.6 mph 23.6 mph 27.6 mph10mph Pace: 20.1 - 30.0 (53.7%)
Centurion Special Speed Study Report Printed: 03/01/15 Page 2Centurion Special Speed Study Report Printed: 03/01/15 Page 2
Station: Lafayette Dr - North Location Lane #3 Data From: 00:00 - 02/25/2015 To: 23:59 - 02/26/2015
Lane #3 Configuration
# Dir. Information Vehicle Sensors Sensor Spacing Loop Length Comment
3. Southbound Ax-Ax 4.0 ft 6.0 ft
Lane #3 Special Speed Study Data From: 00:00 - 02/25/2015 To: 23:59 - 02/26/2015
Date Time
#1 #2 #3 #5#4 #7#6 #8 #9 #10 #11 #12 #13 #16#15#14
Total
0 - 19.9
20 -
24.9
25 -
29.9
30 -
34.9
35 -
39.9
40 -
44.9
45 -
49.9
50 - 55 - 60 - 65 - 70 - 75 -
54.9 59.9 64.9 69.9 74.9 79.9 Other89.9
85 -
84.9
80 -
02/25/15 00:00 0 1 0 0 0 0 0 0 0 0 0 0 0 0 0 0 1
Wed 01:00 1 0 0 1 0 0 0 0 0 0 0 0 0 0 0 0 2
02:00 1 0 0 0 1 0 0 0 0 0 0 0 0 0 0 0 2
03:00 0 1 1 0 0 0 0 0 0 0 0 0 0 0 0 0 2
04:00 2 2 0 0 0 0 0 0 0 0 0 0 0 0 0 0 4
05:00 0 2 0 0 0 0 0 0 0 0 0 0 0 0 0 0 2
06:00 5 1 1 0 0 0 0 0 0 0 0 0 0 0 0 1 8
07:00 11 6 0 1 0 0 0 0 0 0 0 0 0 0 0 0 18
08:00 17 5 4 2 0 0 0 0 0 0 0 0 0 0 0 0 28
09:00 5 9 1 0 0 0 0 0 0 0 0 0 0 0 0 0 15
10:00 8 7 5 0 0 0 0 0 0 0 0 0 0 0 0 0 20
11:00 13 8 5 2 0 0 0 0 0 0 0 0 0 0 0 0 28
12:00 11 9 4 1 0 0 0 0 0 0 0 0 0 0 0 0 25
13:00 10 11 3 0 1 0 0 0 0 0 0 0 0 0 0 0 25
14:00 13 12 2 1 0 0 0 0 0 0 0 0 0 0 0 0 28
15:00 17 18 4 3 0 0 0 0 0 0 0 0 0 0 0 0 42
16:00 21 12 4 1 0 0 0 0 0 0 0 0 0 0 0 0 38
17:00 12 9 6 1 0 0 0 0 0 0 0 0 0 0 0 0 28
18:00 6 12 5 1 0 0 0 0 0 0 0 0 0 0 0 0 24
19:00 17 8 3 1 0 0 0 0 0 0 0 0 0 0 0 0 29
20:00 14 3 4 0 0 0 0 0 0 0 0 0 0 0 0 0 21
21:00 10 8 1 1 1 0 0 0 0 0 0 0 0 0 0 0 21
22:00 3 4 1 1 0 0 0 0 0 0 0 0 0 0 0 0 9
23:00 7 6 0 0 0 0 0 0 0 0 0 0 0 0 0 0 13
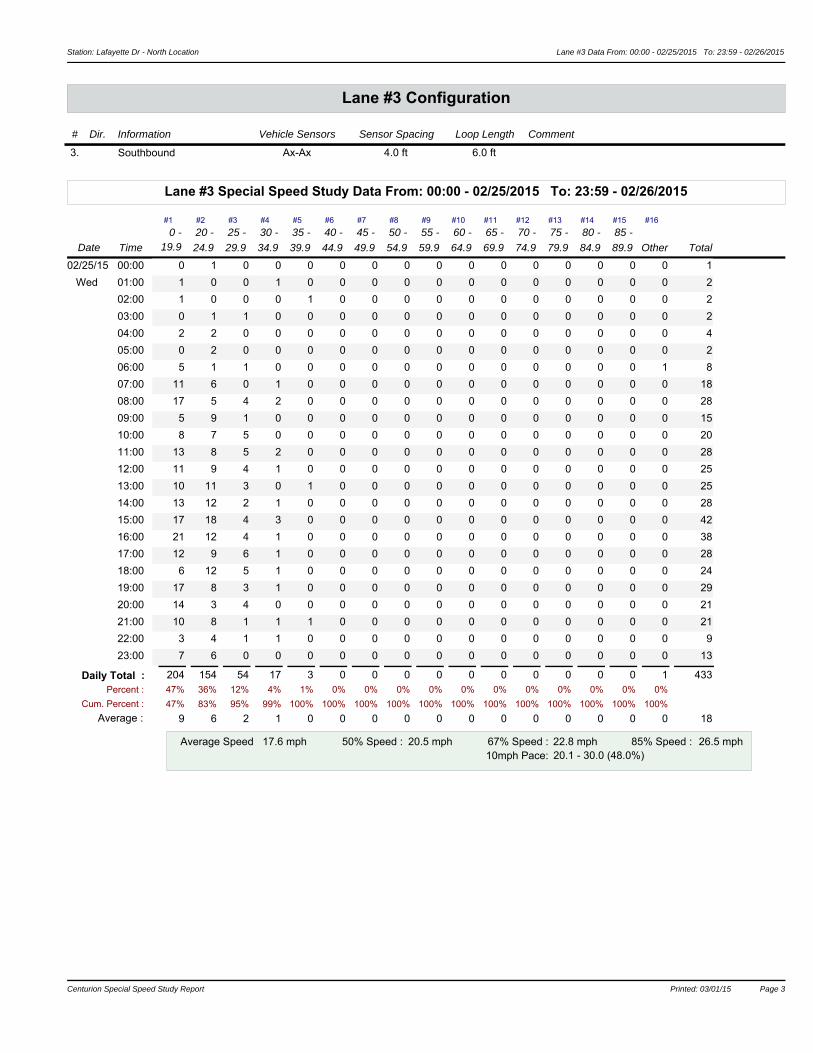
Daily Total : 3 0 0 0 0 0 0 0 0 0 0 1 433204 154 54 1747% 36% 12% 4% 1% 0% 0% 0% 0% 0% 0% 0% 0% 0% 0% 0% Percent :
Cum. Percent :
Average :47% 83% 95% 99% 100% 100% 100% 100% 100% 100% 100% 100% 100% 100% 100% 100%
9 6 2 1 0 0 0 0 0 0 0 0 0 0 0 0 18
Average Speed 50% Speed : 67% Speed : 85% Speed : 17.6 mph 20.5 mph 22.8 mph 26.5 mph10mph Pace: 20.1 - 30.0 (48.0%)
Centurion Special Speed Study Report Printed: 03/01/15 Page 3Centurion Special Speed Study Report Printed: 03/01/15 Page 3
Station: Lafayette Dr - North Location Lane #3 Data From: 00:00 - 02/25/2015 To: 23:59 - 02/26/2015
Date Time
#1 #2 #3 #5#4 #7#6 #8 #9 #10 #11 #12 #13 #16#15#14
Total
0 - 19.9
20 -
24.9
25 -
29.9
30 -
34.9
35 -
39.9
40 -
44.9
45 -
49.9
50 - 55 - 60 - 65 - 70 - 75 -
54.9 59.9 64.9 69.9 74.9 79.9 Other89.9
85 -
84.9
80 -
02/26/15 00:00 0 2 2 0 0 0 0 0 0 0 0 0 0 0 0 0 4
Thu 01:00 1 1 0 0 0 0 0 0 0 0 0 0 0 0 0 0 2
02:00 2 1 0 0 0 0 0 0 0 0 0 0 0 0 0 0 3
03:00 0 0 0 0 0 0 0 0 0 0 0 0 0 0 0 0 0
04:00 3 0 0 0 0 0 0 0 0 0 0 0 0 0 0 0 3
05:00 2 0 1 0 0 0 0 0 0 0 0 0 0 0 0 0 3
06:00 4 4 1 0 0 0 0 0 0 0 0 0 0 0 0 0 9
07:00 10 3 2 0 0 0 0 0 0 0 0 0 0 0 0 0 15
08:00 9 7 3 0 1 0 0 0 0 0 0 0 0 0 0 0 20
09:00 7 5 1 4 0 0 0 0 0 0 0 0 0 0 0 0 17
10:00 7 6 3 3 0 0 0 0 0 0 0 0 0 0 0 0 19
11:00 10 7 5 1 0 0 0 0 0 0 0 0 0 0 0 0 23
12:00 16 3 1 0 3 0 0 0 0 0 0 0 0 0 0 0 23
13:00 16 11 3 0 0 1 0 0 0 0 0 0 0 0 0 0 31
14:00 11 10 4 1 0 0 0 0 0 0 0 0 0 0 0 0 26
15:00 13 8 8 1 0 0 0 0 0 0 0 0 0 0 0 0 30
16:00 20 14 10 0 0 0 0 0 0 0 0 0 0 0 0 0 44
17:00 20 15 4 1 0 0 0 0 0 0 0 0 0 0 0 0 40
18:00 15 20 4 1 0 0 0 0 0 0 0 0 0 0 0 0 40
19:00 9 7 5 0 0 0 0 0 0 0 0 0 0 0 0 0 21
20:00 14 13 2 1 0 0 0 0 0 0 0 0 0 0 0 0 30
21:00 4 4 3 0 0 0 0 0 0 0 0 0 0 0 0 0 11
22:00 10 4 3 0 0 0 0 0 0 0 0 0 0 0 0 0 17
23:00 3 2 1 0 0 0 0 0 0 0 0 0 0 0 0 0 6
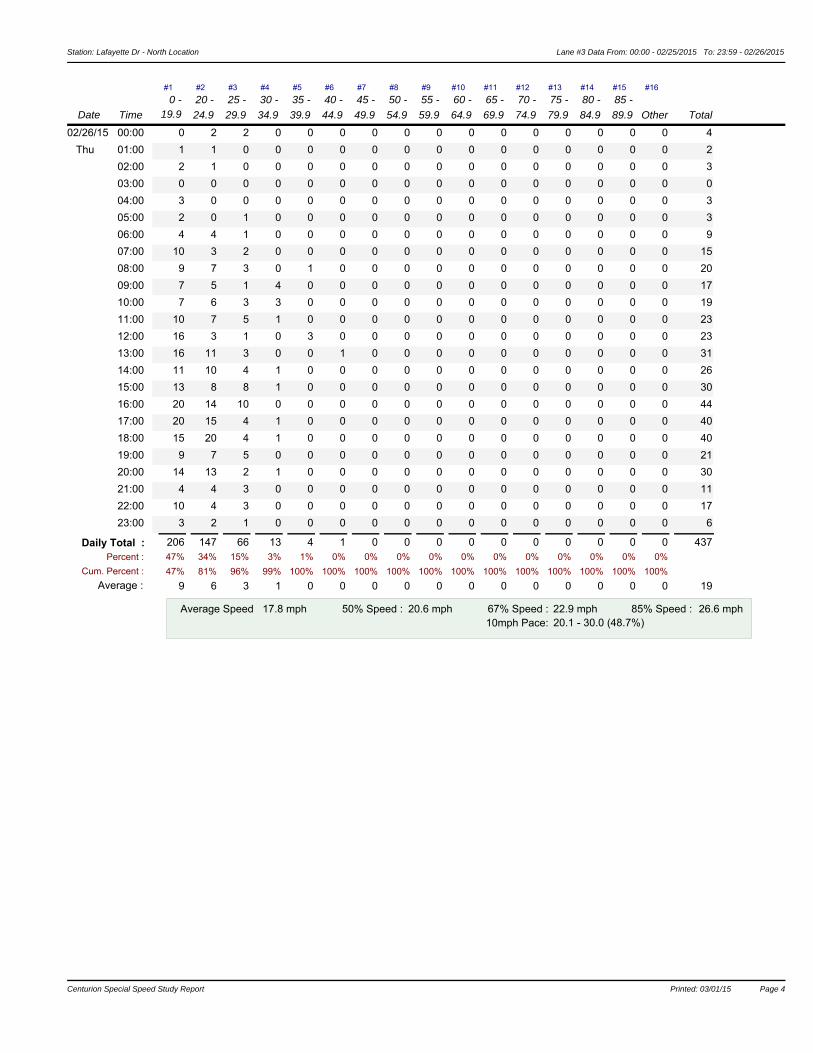
Daily Total : 4 1 0 0 0 0 0 0 0 0 0 0 437206 147 66 1347% 34% 15% 3% 1% 0% 0% 0% 0% 0% 0% 0% 0% 0% 0% 0% Percent :
Cum. Percent :
Average :47% 81% 96% 99% 100% 100% 100% 100% 100% 100% 100% 100% 100% 100% 100% 100%
9 6 3 1 0 0 0 0 0 0 0 0 0 0 0 0 19
Average Speed 50% Speed : 67% Speed : 85% Speed : 17.8 mph 20.6 mph 22.9 mph 26.6 mph10mph Pace: 20.1 - 30.0 (48.7%)
Centurion Special Speed Study Report Printed: 03/01/15 Page 4Centurion Special Speed Study Report Printed: 03/01/15 Page 4
Station: Lafayette Dr - North Location Lane #3 Data From: 00:00 - 02/25/2015 To: 23:59 - 02/26/2015
Date Time
#1 #2 #3 #5#4 #7#6 #8 #9 #10 #11 #12 #13 #16#15#14
Total
0 - 19.9
20 -
24.9
25 -
29.9
30 -
34.9
35 -
39.9
40 -
44.9
45 -
49.9
50 - 55 - 60 - 65 - 70 - 75 -
54.9 59.9 64.9 69.9 74.9 79.9 Other89.9
85 -
84.9
80 -
Centurion Special Speed Study Report Printed: 03/01/15 Page 5
Station: Lafayette Dr - North Location Data From: 00:00 - 02/25/2015 To: 23:59 - 02/26/2015
Special Speed Study Summary: Lafayette Dr - North Location
Description 19.9 0 -
#1 #2
20 -
24.9 29.9
25 - #3
30 -
34.9
#4 #5
35 -
39.9 44.9
40 - #6
49.9
45 - #7 #8
50 -
54.9 59.9
55 - #9 #10
60 -
64.9 69.9
65 - #11 #12
70 -
74.9 79.9
75 - #13 #14
80 -
84.9 89.9
85 - #15 #16
Other Total
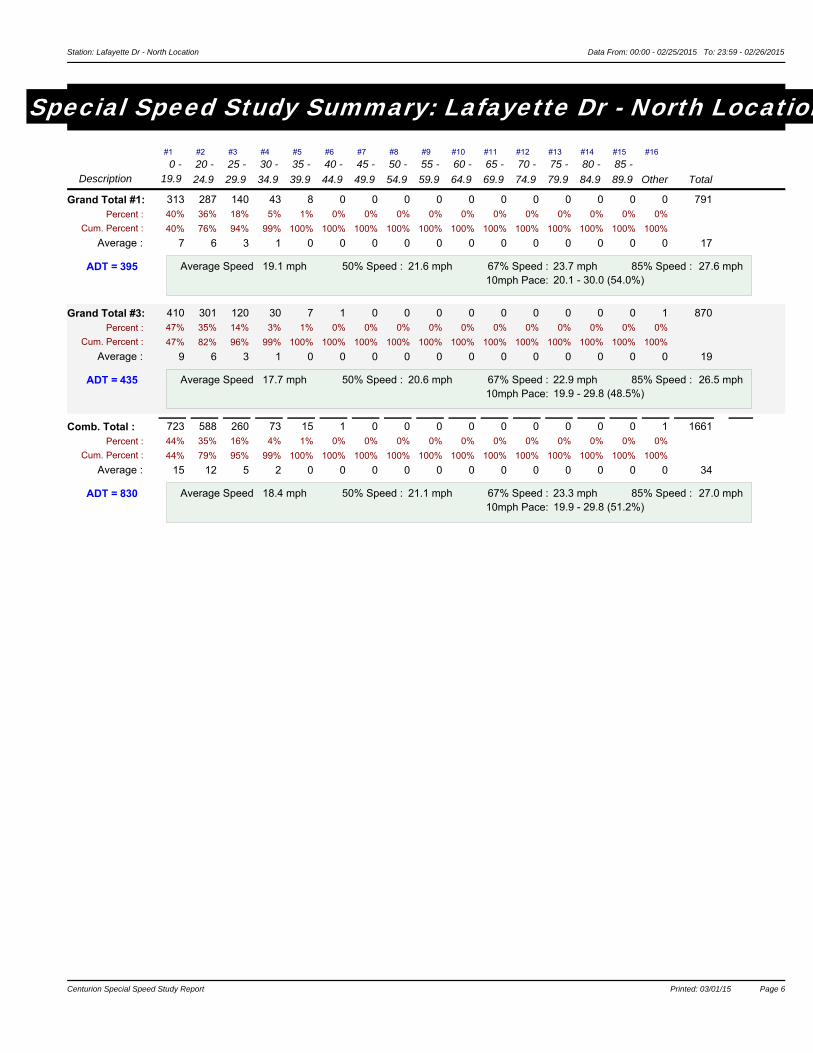
Grand Total #1: 313 287 140 43 8 0 0 0 0 0 0 0 0 0 0 79140% 36% 18% 5% 1% 0% 0% 0% 0% 0% 0% 0% 0% 0% 0% 0% Percent :
Cum. Percent :
Average :
0
40% 76% 94% 99% 100% 100% 100% 100% 100% 100% 100% 100% 100% 100% 100% 100%
7 6 3 1 0 0 0 0 0 0 0 0 0 0 0 0 17
Average Speed 19.1 mph 50% Speed : 21.6 mph 67% Speed :10mph Pace: 20.1 - 30.0 (54.0%)
23.7 mph 85% Speed : 27.6 mphADT = 395
Grand Total #3: 410 301 120 30 7 1 0 0 0 0 0 0 0 0 1 87047% 35% 14% 3% 1% 0% 0% 0% 0% 0% 0% 0% 0% 0% 0% 0% Percent :
Cum. Percent :
Average :
0
47% 82% 96% 99% 100% 100% 100% 100% 100% 100% 100% 100% 100% 100% 100% 100%
9 6 3 1 0 0 0 0 0 0 0 0 0 0 0 0 19
Average Speed 17.7 mph 50% Speed : 20.6 mph 67% Speed :10mph Pace: 19.9 - 29.8 (48.5%)
22.9 mph 85% Speed : 26.5 mphADT = 435
Comb. Total : 723 588 260 73 15 1 0 0 0 0 0 0 0 0 1 166144% 35% 16% 4% 1% 0% 0% 0% 0% 0% 0% 0% 0% 0% 0% 0% Percent :
Cum. Percent :
Average :
0
44% 79% 95% 99% 100% 100% 100% 100% 100% 100% 100% 100% 100% 100% 100% 100%
15 12 5 2 0 0 0 0 0 0 0 0 0 0 0 0 34
Average Speed 18.4 mph 50% Speed : 21.1 mph 67% Speed :10mph Pace: 19.9 - 29.8 (51.2%)
23.3 mph 85% Speed : 27.0 mphADT = 830
Centurion Special Speed Study Report Printed: 03/01/15 Page 6
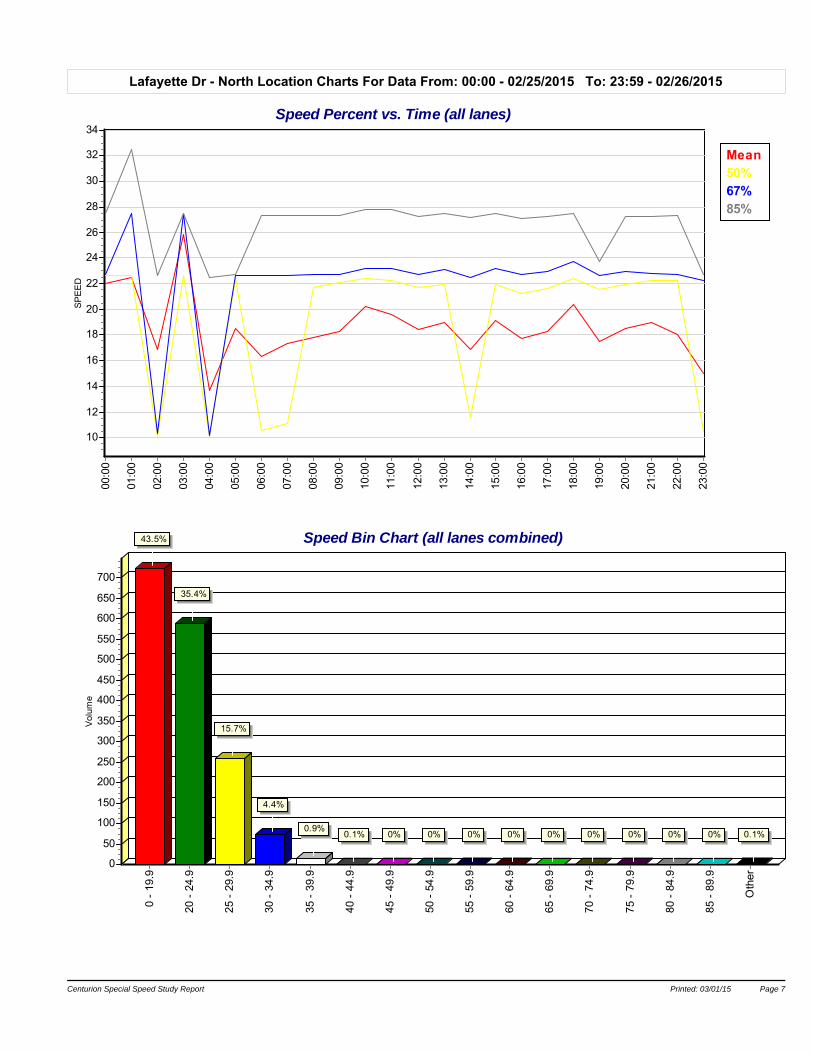
Lafayette Dr - North Location Charts For Data From: 00:00 - 02/25/2015 To: 23:59 - 02/26/2015
Mean50%67%85%
Speed Percent vs. Time (all lanes)00
:00
01:0
0
02:0
0
03:0
0
04:0
0
05:0
0
06:0
0
07:0
0
08:0
0
09:0
0
10:0
0
11:0
0
12:0
0
13:0
0
14:0
0
15:0
0
16:0
0
17:0
0
18:0
0
19:0
0
20:0
0
21:0
0
22:0
0
23:0
0
SP
EE
D
34
32
30
28
26
24
22
20
18
16
14
12
10
Speed Bin Chart (all lanes combined)
0 -
19.9
20 -
24.
9
25 -
29.
9
30 -
34.
9
35 -
39.
9
40 -
44.
9
45 -
49.
9
50 -
54.
9
55 -
59.
9
60 -
64.
9
65 -
69.
9
70 -
74.
9
75 -
79.
9
80 -
84.
9
85 -
89.
9
Oth
er
Vol
ume
700
650
600
550
500
450
400
350
300
250
200
150
100
50
0
43.5%
35.4%
15.7%
4.4%
0.9%0.1% 0% 0% 0% 0% 0% 0% 0% 0% 0% 0.1%
Centurion Special Speed Study Report Printed: 03/01/15 Page 7
APPENDIX C U.S. LIMITS OUTPUT DATA
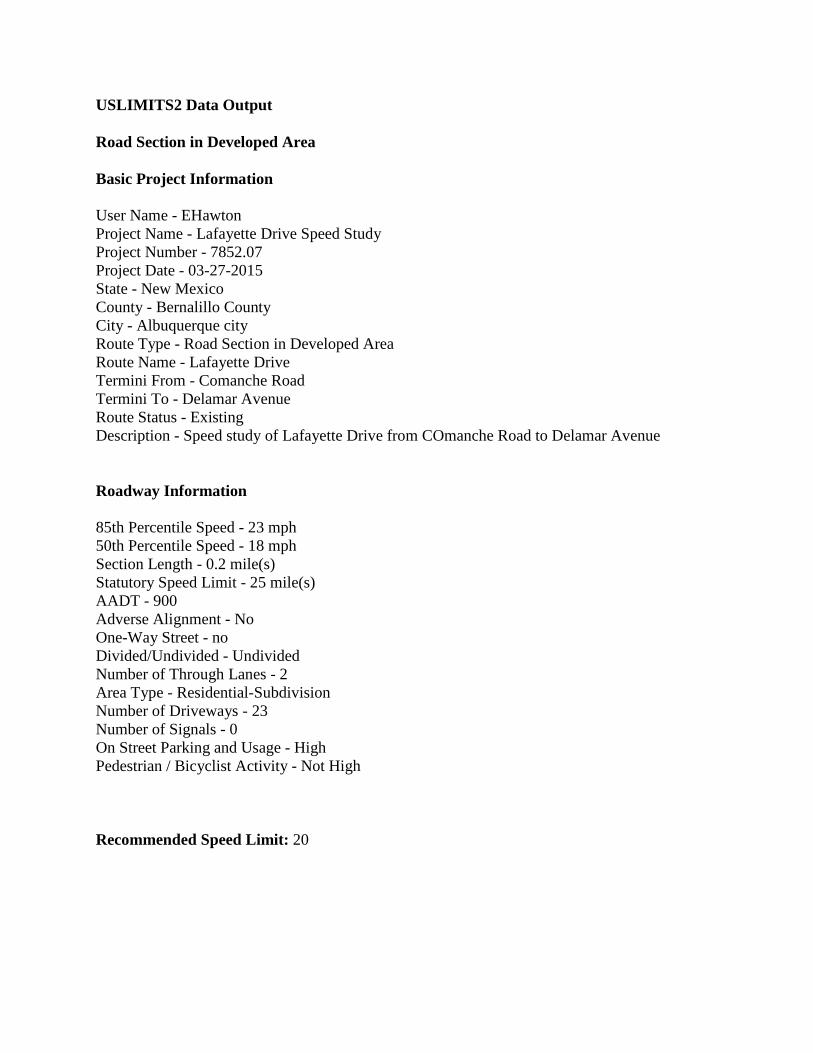
USLIMITS2 Data Output
Road Section in Developed Area
Basic Project Information User Name - EHawton Project Name - Lafayette Drive Speed Study Project Number - 7852.07 Project Date - 03-27-2015 State - New Mexico County - Bernalillo County City - Albuquerque city Route Type - Road Section in Developed Area Route Name - Lafayette Drive Termini From - Comanche Road Termini To - Delamar Avenue Route Status - Existing Description - Speed study of Lafayette Drive from COmanche Road to Delamar Avenue Roadway Information 85th Percentile Speed - 23 mph 50th Percentile Speed - 18 mph Section Length - 0.2 mile(s) Statutory Speed Limit - 25 mile(s) AADT - 900 Adverse Alignment - No One-Way Street - no Divided/Undivided - Undivided Number of Through Lanes - 2 Area Type - Residential-Subdivision Number of Driveways - 23 Number of Signals - 0 On Street Parking and Usage - High Pedestrian / Bicyclist Activity - Not High
Recommended Speed Limit: 20

Note: Crash data were not entered for this project. A comprehensive crash study is a critical component of any traffic engineering study. We suggest that you repeat this process when crash data become available.