Embed Size (px)
Citation preview

Lake Evaporation in Illinois
by WYNDHAM J. ROBERTS and JOHN B. STALL
REPORT OF INVESTIGATION 57
STATE OF ILLINOIS
DEPARTMENT OF REGISTRATION AND EDUCATION
ILLINOIS STATE WATER SURVEY
URBANA
1967

REPORT OF INVESTIGATION 57
Lake Evaporation in Illinois
by WYNDHAM J. ROBERTS and JOHN B. STALL
Printed by authority of the State of Illinois—Ch. 127, IRS, Par. 58.29

STATE OF ILLINOIS
HON. OTTO KERNER, Governor
DEPARTMENT OF REGISTRATION AND EDUCATION
JOHN C. WATSON, Director
BOARD OF NATURAL RESOURCES AND CONSERVATION
JOHN C. WATSON, Chairman
ROGER ADAMS, Ph.D., D.Sc., LL.D., Chemistry
ROBERT H. ANDERSON, B.S., Engineering
THOMAS PARK, Ph.D., Biology
CHARLES E. OLMSTED, Ph.D., Botany
LAURENCE L. SLOSS, Ph.D., Geology
WILLIAM L. EVERITT, E.E., Ph.D.,University of Illino is
DELYTE W. MORRIS, Ph.D.,President, Southern Illinois University
STATE WATER SURVEY DIVISION
WILLIAM C. ACKERMANN, Chief
URBANA
I967

PAGE
Summary ...................................................................................................................
Introduction ..................................................................................................................
Background .................................................................................................................
Plan of report ...........................................................................................................
Acknowledgments .............................................................................................................
Evaporation .........................................................................................................................
Evaporation processes ......................................................................................................
Methods of determining evaporation ..................................................................................
Understanding pan evaporation ...........................................................................................
Understanding lake evaporation ............................................................................................
Computation by digital computer ........................................................................................
Data and analyses for Illinois .......................................................................................................
Observed pan data available...............................................................................................
Climatic data available...........................................................................................................
Adjustment of data ...............................................................................................................
Results of Illinois study ................................................................................................................
Magnitude and variability of lake evaporation..................................................................
Application to net reservoir yield .........................................................................................
References ...........................................................................................................................
Appendix
1
2
2
2
3
3
5
6
6
8
1
8
8
8
1 2
1 4
1 4
1 9
2 4
2 5
Tables of monthly lake evaporation at 10 stations. . . . . . . . . . . . . . . . .. . . . . . . . . . . . . . . . . . . . . . . . . . . 25–34
Tables of maximum net evaporation from a lake surface . . . . . . . . . . . . . . . . . . . . . . . . . . . . . . . . . . . . . . . . 35–44
...........................................................................................................................
C O N T E N T S

Lake Evaporation in Illinoisby Wyndham J. Roberts and John B. Stall
S U M M A R Y
This report furnishes information regarding the magnitude and variability of evaporationlosses from lakes in I l l inois , processed in a readily usable and meaningful format. Thisknowledge is greatly needed to allow efficient development and use of surface water resources.Of the annual rainfall in Illinois, 44 percent is returned directly to the atmosphere by evapora-tion from both land and water surfaces. Annual lake evaporation varies from 30 to 38 inches.
The physical processes of evaporation are described to aid in understanding the complexitiesof determining lake evaporation. As liquid water is heated, thermal agitation weakens hydrogenbonds holding water molecules together so that some molecules escape to the air. The rate atwhich evaporation occurs depends primarily on the water and air temperatures and the amountof moisture already in the air.
The water budget, mass transfer, and energy budget procedures for determining lake evap-oration are the three principal methods available. In selecting the method to use in computinglake evaporation in Illinois, the authors made a thorough study of the 1950-1951 Lake Hefnerproject and the ensuing methodology published by the U. S. Weather Bureau. Use was thenmade of these Weather Bureau computational procedures which allow pan and lake evaporationto be computed from the four climatic elements of air and dew point temperature, solar radia-tion, and wind movement.
Data on observed pan evaporation for 17 stations in and near Illinois were compiled for theMay–October season for a 16-year period, from which monthly and annual maps were drawn.Records of needed climatic data for seven stations were ferreted out for a selected 52-yearperiod and shorter records for three stations were compiled, from which computations were madeby electronic computer of monthly pan and lake evaporation.
The computation procedures were checked prior to their extensive use by comparing com-puted and observed pan evaporation at the six stations where concurrent data were available.Computed values were equal to or higher than observed values. Thus, where adjustments wereindicated, computations of both lake and pan evaporation were adjusted downward by amountsof 5 to 15 percent. For three stations, less than the full adjustment was used, since consideredjudgment suggested that the observed values were too low and the computed values more nearlycorrect.
Tables showing the monthly lake evaporation in inches at 10 stations in and near Illinois arethe primary results of this report and furnish adequate time and place sampling of lake evap-oration in Illinois. Maps of monthly and average annual evaporation also are presented, andthe variability is indicated by duration curves. Additional tables show the maximum net lakeevaporation (total lake evaporation minus expected rainfall) for the 10 stations for periods upto 60 months and recurrence intervals from 2 to 50 years. Applications of these data for com-puting actual evaporative loss and net yield of a reservoir are illustrated.
The results in this report are believed to be a rational evaluation of the general magnitudesand variability of lake evaporation in Illinois. Evaporation from a specific lake can vary fromthe general picture because of exposure, shape, depth, and other factors. However, the resultsgiven are believed to be generally valid, useful, and applicable to a wide range of Illinoisconditions.
I N T R O D U C T I O N
The increasing efficiency of modern water use requiresprogressively greater accuracy in accounting for waterlosses. In the field of municipal and industrial watersupply, knowledge of evaporative losses from impound-ments is vital to efficient water systems operation. Atthe turn of the century, some Illinois reservoirs weredesigned and built using evaporation and accompanyinghydrologic data gathered primarily in the eastern UnitedStates. These data deficiencies in Illinois have been
largely overcome. It is the purpose of this report tosummarize all evaporation data collected in Illinois andto show how such data increase the reliability of reser-voir design and operation.
The Illinois State Water Survey operated standardevaporation pans for about 16 years at three locationsin Illinois—Rockford, Urbana, and Carbondale. In at-tempting to utilize these pan observations to make ra-tional evaluations of lake evaporation, four principal
1
limitations were noted: 1) the observations were madeon pans, and many technical questions are unansweredregarding proper pan-to-lake coefficients; 2) the observa-tions covered only the warm season, May to October;3) the 16-year period of observations seemed to fall farshort of an adequate sampling of the time variability ofevaporation ; and 4) the three stations seemed to be aninadequate place-sampling of evaporation throughoutthe state.
This study was carried out to overcome these limita-tions as much as possible, and to furnish processed re-sults on lake evaporation magnitudes and variability ina readily usable and meaningful format. A method forobtaining evaporation directly from climatological datawas used to expand the length of evaporation records.
Background
The instrument used by the Illinois Water Survey formeasuring evaporation is the U. S. Weather Bureauclass A pan. This is a circular pan 4 feet in diameterand 10 inches deep, supported on a grill of 2- by 4-inchlumber to allow free circulation of air around it. Thetop edge of the pan is 14 inches above the ground andapproximately 2 inches above the water surface. Abronze stilling basin permits measuring pan water levelswith a hook gage. A nonrecording 8-inch raingage isinstalled adjacent to the pan. A totalizing anemometeris mounted on the pan base, with the plane of the cups6 inches above the rim of the pan. Total wind movementin statute miles for 24-hour periods is recorded at timesof observation, generally 7 a.m. There are approximately390 such stations in the 50 states.
The first Illinois station was installed by the WeatherBureau at Springfield in 1941. The Water Survey in-stalled similar stations at Urbana and Carbondale in1947 and near Rockford in 1950, which were operatedduring each growing season until the fall of 1962 whendata gathering was discontinued. Illinois evaporationdata were summarized graphically for the 6-year periodfrom 1947 through 1952 by Roberts (1953). A morerecent summary (Illinois State Water Survey, 1960)adjusts the values by coefficients to represent lakeevaporation.
Daily records of pan evaporation observations atWeather Bureau installations are published for eachstate in monthly issues of Climatological Data, a n dmonthly totals are printed in the annual summaries.While more than 4000 station-years of record have beenaccumulated at class A pan evaporation stations in theUnited States, the validity of ‘pan coefficients’ has beenopen to question.
A pioneering and comprehensive research project cen-tered on techniques for determining evaporation wascarried out at Lake Hefner, Oklahoma, in 1950–1951 by
a group of five cooperating federal agencies. Growingout of that project were the U. S. Weather Bureau nomo-graph for computing evaporation (Kohler et al., 1959)and a subsequent formula for mathematical solution ofthe nomograph adapted for computer use (Lamoreux,1962), which have opened a new avenue of evaporationresearch based on climatological records. These proce-dures allow pan and lake evaporation to be computedfrom four items of climatic data—air temperature, dewpoint temperature, wind movement, and solar radiation.Since long-term climate records are widely available,these techniques permit extended and refined evapora-tion information.
In planning this evaporation research in Illinois, theauthors studied in detail the results of the Lake Hefnerproject, the ensuing methodology, and its verification.The thorough testing and highly satisfactory results in-dicated the desirability of using the Weather Bureaucomputational procedures for the Illinois study.
Plan of Report
The material in this report is presented in three mainsections. First, the physical processes of evaporation andprincipal methods for computing lake evaporation aredescribed. Also, procedures and formulas used in thestudy are presented and briefly discussed. Second, avail-able data for Illinois on both evaporation and climatefactors are delineated, and data analyses and adjust-ments during the computations are described.
In the final section, the resulting information on themagnitude and variability of lake evaporation in Illinoisis presented, and its application in determining net res-ervoir yield is shown. Tables of data for 10 stations onmonthly lake evaporation computed for 52 years andmaximum net evaporation from a lake surface for vari-ous durations and recurrence intervals are provided inthe appendix.
Acknowledgments
The general leadership and direction of this projecthas been carried out jointly by the two authors. Wynd-ham J. Roberts directed the Illinois State Water Sur-vey’s evaporation research program, which includedsupervising the installation and operation of class Apans at Carbondale, Rockford, and Urbana during 16years. John B. Stall searched out the necessary olderrecords of climatic data and supervised the use of thosedata to compute evaporation.
This study was conducted by the authors under thegeneral supervision of H. F. Smith, Head of the Hy-drology Section, and William C. Ackermann, Chief,Illinois State Water Survey. Many other Water Survey
2

personnel contributed. Robert Sinclair, Statistical Assis-tant, wrote the principal computer program used tocompute evaporation and several smaller programs usedin averaging, adjusting, and sorting the output data.Dr. Ramamand Prasad, Engineering Assistant, aidedimmeasurably in the data handling and wrote computerprograms for various comparisons, adjustments, andranking of data. Dr. Walter F. Claussen, PrincipalChemist, contributed important comments to the sectionon evaporation processes. Stanley A. Changnon, Jr.,Climatologist, contributed greatly to this project byfurnishing climatic data from stations at Chicago, Mo-line, Peoria, and Urbana, many of which were takendirectly from IBM punch cards compiled under his con-tinuing program of climatological data collection forIllinois. Marvin C. Clevenger, Machine Supervisor,aided in processing these data cards and in punching theinput data on cards. Douglas M. A. Jones, AssociateMeteorologist, consulted with the authors regarding someof the general results. James Gibb, Assistant Hydrolo-gist, checked details on the manuscript; Mrs. J. LoreenaIvens, Technical Editor, edited the final report; and
John Brother , Jr . , Chief Draf tsman, prepared theillustrations.
Extensive cooperation was extended to the authors bymany U. S. Weather Bureau scientists. The aid of TorJ. Nordenson, Don R. Baker, and Wallace W. Lamoreux,of the Hydrologic Services Division, Washington, D. C.,is gratefully acknowledged. Personnel from variousWeather Bureau offices compiled and furnished manydata for this study: G. N. Brancato, St. Louis data;Escal Bennett, Indianapolis data; Lawrence Schaal, In-diana State Climatologist, solar radiation data summaryfor Indianapolis; S. W. Rampy, Evansville data; andMorton H. Bailey, Tennessee State Climatologist, evapo-ration data for Tennessee. William L. Denmark, IllinoisState Climatologist, aided in locating some of the neededolder records in Illinois.
Climatic data, particularly solar radiation observa-tions at the Argonne National Laboratory, Lemont, Illi-nois, were obtained through the courtesy of Dr. HarryMoses and Dr. James Carson.
All of the computations of evaporation were carriedout at the University of Illinois computer facilities onthe IBM 7094 system.
E V A P O R A T I O N
The waters of the world are found in five forms; thesalt water of the oceans, the frozen water of the icefields, the water in the ground, the water in lakes andrivers, and atmospheric vapor. Slightly more than 97 per-cent of all water is in the oceans; 0.6 percent is buried asground water; and the ice masses hold 2.15 percent. Theremaining fraction of a percent is either vapor in theatmosphere or water in lakes and rivers (Leopold, 1966).This water forms the hydrologic cycle, and it is estimatedthat on the order of 95,000 cubic miles per year is pre-cipitated and evaporated.
In Illinois, it is estimated that during an average day2000 billion gallons of moisture flows over the state.Only about 5 percent, or 100 billion gallons per day,precipitates on the ground. About 44 billion gallons ofthis precipitation is evaporated directly to the atmo-sphere from land and water. Land evaporation cannotbe measured accurately, but it can be estimated whenrainfall and streamflow are known.
Precipitation in Illinois varies annually from 46 inchesin the extreme south to 32 inches on the northern border,as shown in figure 1. Direct runoff accounts for aboutone-third of this precipitation in southern Illinois andabout one-fourth in northern Illinois. Thus the annualwater loss directly to the atmosphere is equivalent to acolumn of water varying from 24 to 30 inches in height.
Evaporation Processes
Evaporation transforms water in its liquid or solidstate into a water vapor which mixes with the atmo-sphere. It includes the sublimation of snow and ice inwhich the water molecules in a solid state pass directlyto a vapor. It is considered separate from evapotrans-piration, which is the exhaling of water vapor from thesurface of green tissues in plants and the evaporationof moisture from soil.
Evaporation of water from a lake surface utilizesenergy furnished by the sun which heats the water. Therate at which evaporation occurs is controlled primarilyby the temperature of the water, the temperature of theair, and the degree to which the air is saturated withmoisture. Knowledge of evaporative processes is impor-tant in understanding how water losses to evaporationfrom a lake or reservoir are determined.
The water molecule is composed of one oxygen atomwith an atomic weight of 16, and two hydrogen atomseach having an atomic weight of 1. The molecularweight of the water molecule H2O is thus 18. This watermolecule can be roughly considered to have a radius of1 angstrom (Davis and Day, 1961, p. 85), which is onehundred millionth of a centimeter. Within each atom,the electrons revolve around the nuclei at extremely
3

Figure I. Average annual precipitation in inches
rapid rates and in a random fashion, darting in and out,over and around, rather than following a fixed orbit.Because of their tremendous speed of movement, theseorbiting electrons effectively ‘occupy’ a globular space.
Within the molecule the motions of the oxygen andhydrogen atoms are vibrations and rotations whichstretch and bend the primary covalent bonds betweenthese atoms. Between water molecules, translational androtational motions stretch and bend the weaker hydrogenbonds between the molecules; it is this type of motionthat is important as a causative factor in the evaporativeprocess.
As the fluid water is heated, the molecules are increas-ingly energized and agitated, which results in increasingdistances between the liquid molecules and decreasingstrengths of forces between them. This causes some ofthe water molecules to ‘escape’ the liquid surface and beabsorbed in the air, which is the evaporation process.Higher temperatures permit more rapid rates of escape.
During this continuous flight of molecules from thewater surface into the air, molecules of water vapor are
returning to the surface at a rate depending on the con-centration of the vapor (Daniels, 1954, p. 169). Whenequilibrium is established, the rate of escape of mole-cules is equal to the rate of concentration of vapor, andthe vapor is said to be saturated.
The pressure exerted by water vapor that is in equi-librium with liquid water is called vapor pressure. Theamount of water vapor contained in the air is measuredas vapor pressure in inches of mercury. This is the sameunit of measure used to signify atmospheric pressureitself, which at sea-level elevation is about 29 to 30inches of mercury. At an air temperature of 70 F, ifthe air were completely saturated with waper vapor, thevapor pressure would be 0.732 inch of mercury.
The equilibrium rate of molecular escape and conden-sation is dependent on temperature. At a given temper-ature there is a specific saturation vapor pressure whichrepresents this equilibrium. At this temperature andvapor pressure the air is completely loaded with watervapor molecules and can absorb no more, and the rela-tive humidity is said to be 100 percent.
If the air at a particular temperature is not com-pletely saturated with water molecules, then its vaporpressure is less than the saturation vapor pressure, andit has a relative humidity of less than 100 percent. Rela-tive humidity is the weight of the water vapor in the airexpressed as a percent of the total amount of watervapor which it could hold if it were saturated. If airat a given temperature is holding less water vapor thanit could at saturation, then this air could be cooled to alower temperature, called the dew point temperature, atwhich saturation would be reached and condensationwould begin.
The evaporation process is illustrated schematically infigure 2. Liquid water at 78 F is represented in thelower portion of this illustration. Here the water mole-cules have an average spacing of about 3 angstroms, andare held together by strong hydrogen bonds which areunusually strong at the surface and cause surface ten-sion. As previously explained, thermal agitation of themolecules provides the energy by which some moleculesescape. Air at 78 F and 67 percent relative humidity isillustrated in the upper portion of figure 2. Here theaverage distance between water molecules is 131 ang-stroms, the molecules have virtually no attraction towardeach other, and the vapor in the air is invisible. If theair at 78 F were to become saturated, this average dis-stance would be lowered to 109 angstroms, and still nosignificant attraction would occur.
Figure 2 also illustrates the enormous expansion thattakes place as water changes from the liquid to the vaporstate. The average spacing between water molecules in-creases about 44-fold as water changes from the liquidto the vapor state. The volume occupied by 1 gram ofwater vapor varies with temperature. For example,liquid water regardless of temperature weighs about
4

Figure 2. The evaporation process
1 gram per milliliter, but 1 gram of saturated watervapor at 78 F occupies about 42,300 milliliters. Thischange in state from liquid to vapor represents an ex-pansion of about 42,000 times in volume.
Methods for Determining Evaporation
Historically, the magnitude and variability of evapo-ration from a lake surface have been measured and com-puted in three primary ways: the water budget method,the mass transfer method, and the energy budget method.
In selecting the method to use in computing lakeevaporation in Illinois, results of the comprehensiveLake Hefner evaporation research project in 1950–1951were studied (U.S. Geological Survey, 1954). LakeHefner, in Oklahoma, is a water-supply reservoir withan area of 2587 acres. It was carefully chosen for theirproject because the physical setting allowed a preciseaccounting of the water budget. Elaborate instrumenta-tion, operated for 16 months, allowed evaporation to becomputed by the mass transfer and energy budgetmethods. These results were checked against the actualevaporation determined by the water budget. Extensivemeasurements of evaporation were also made by evapo-ration pan installations, on both the lake and the shore.
Water Budget Method. Lake evaporation as deter-mined by this method is the sum of the inflow minus out-flow, minus change in storage. That is, E = I – O – ∆S ,
in which E is evaporation, I is inflow, O is outflow, and ∆S is change in reservoir contents.
A schematic diagram is shown in figure 3. Generallythe use of this method is impractical because measure-ment errors greatly affect the residual which is theevaporation.
Mass Transfer Method. The mass transfer theory con-siders air flowing with constant velocity past a fixedsolid boundary. Evaporation is a boundary-layer phe-nomenon resulting from tangential stresses which retardthe air flow and build up the thickness of the boundarylayer into a vapor blanket of the form illustrated infigure 4.
Attempts to formulate evaporation equations based onmodels of the mass transfer method have proven un-satisfactory. The Lake Hefner studies developed theempirical equation E = 0.06 u ( eo – e a ), in which E i sdaily evaporation in inches, u is the average wind ve-locity in miles per hour, eo is the vapor pressure of satu-rated air at the temperature of the water surface ininches of mercury, and ea is the vapor pressure of the airin inches of mercury.
This equation, developed from water-budget data, em-bodies the principle of mass transfer theory. It is nowbelieved possible, despite gaps in knowledge of masstransfer theory, to compute daily evaporation from awater surface with reasonable accuracy with this equa-tion, but it is not generally as useful as the energy bud-get method.
Energy Budget Method. The principal elements inthe energy budget of a lake that affect evaporation areshown in figure 5. The law of conservation of energy
Figure 3. Water budget method for determining lake evaporation
Figure 4. Mass transfer method for determining evaporation
5

Figure 5. Elements of the energy budget method fordetermining evaporation
indicates that the total energy reaching the lake mustbe equal to the total energy leaving the lake plus theincrease in internal energy of the lake.
In the formula in figure 5 (U.S. Geological Survey,1954), Qe is the energy available for evaporation, Qs isthe solar radiation energy, Q r is the reflected solar radia-tion, Qb is the net long-wave radiation, Qh is the energytransferred from the lake back to the atmosphere, Qθ i sthe increase in energy stored in the lake, and Qv is theenergy transferred into or from the lake bed.
Considerable information is known about many of theindividual energy elements in this budget; this knowl-edge stems from the basic laws of physics and the physi-cal properties of water and air. Some of the energyelements and physical properties can be measured accu-rately. At the Lake Hefner study, the extensive instru-mentation recorded successfully a wealth of data onthese physical factors, as well as other climatic data.
Understanding Pan Evaporation
The energy budget as shown in figure 5 can be appliedto evaporation from a pan, as illustrated in figure 6.The pan budget contains the same elements as the lakebudget in figure 5 except that heat is lost through theside and bottom of the pan.
One major approach in their evaluation of results dur-ing the Lake Hefner study was to apply the energybudget to data from a Weather Bureau class A evapora-tion pan (U.S. Geological Survey, 1954, p. 71–119). Byusing the abundance of physical measurements madethere, a conceptual model was formulated to representand accommodate all of the energy elements in the
Figure 6. Energy budget method applied to class A pan
budget. Having formulated this conceptual model torepresent the workings of the great complex of factorsinvolved, the researchers undertook to ‘calibrate’ themodel. The model could then be given the internal co-efficients necessary to enable it to reproduce, in this case,the actual values of pan evaporation measured from aninput of climatic data.
This calibration of the model was carried out by agraphical-coaxial fitting technique described by Linsleyet al. (1949). The results agreed closely with the LakeHefner class A pan data. In a comprehensive follow-upstudy, the same model and approach were used toreproduce pan evaporation at eight stations locatedthroughout the country. Again the model provided ex-cellent results, and the internal coefficients furnished bythis nationwide calibration of the model varied onlyslightly and reasonably from the Lake Hefner results.Further and more extensive nationwide testing of thismodel developed and refined the relationships involved(Kohler et al., 1955; Harbeck et al., 1958). These havenow come into general use in the form of a four-quadrant diagram (Kohler et al., 1959) which is similarto that shown in figure 7 for lake evaporation.
Understanding Lake Evaporation
In attempting to derive an expression from the energybudget which would compute lake evaporation ade-quately, the Lake Hefner group used an approach iden-tical to that used for pan evaporation. This generalapproach is clearly indicated by the similarity of figures
6

Figure 7. Lake evaporation nomograph
5 and 6. The energy budgets for the pan and for thelake contain all the same elements, and the principaldifferences are identified readily: 1) the lake, a muchlarger and deeper body of water, has far greater capacityfor storing the internal heat energy Qθ ; and 2) greatquantities of heat Qv are transferred through the sidesand bottom of the pan, as illustrated in figure 6.
While considering these differences, researchers atLake Hefner used the same basic conceptual model de-rived for pan evaporation to represent lake evaporation.The physical differences between the lake and pan wereaccounted for in the model by altering slightly its in-ternal coefficients. This conceptual model for lakeevaporation was ‘calibrated’ by use of the Lake Hefnerclimatic data and the actual measured lake evaporation.This worked very effectively. Again the climatic datawere fitted empirically by the graphical-coaxial tech-nique (Linsley et al., 1949) to provide the necessary
internal coefficients so that the model would reproducethe observed lake evaporation.
This provided a four-quadrant diagram (figure 7) bywhich lake evaporation can be compared from four cli-matic elements: air temperature, dew point temperature,wind movement, and solar radiation. The graph in fig-ure 7 is structurally identical to that published by theWeather Bureau researchers who developed it (Kohleret al., 1959). Although this nomograph was developedfor use with daily values, it is also usable with monthlyaverage values and gives reasonably reliable results withannual average values.
How the four-quadrant diagram may be used to com-pute a value of monthly lake evaporation is illustratedin figure 7. The climatic data for the example are:average daily air temperature for the month, 81 F;average solar radiation, 600 langleys per day; dew point,55 F; and average daily wind movement, 120 miles. At
7

the upper left quadrant of figure 7, a horizontal linepases from the 81-F mark to the first intersection at the600-langley curve, and projects toward the right to theintersection of the 55-F dew point curve. At this stopa vertical line runs downward to the curve of the 120-mile wind movement, from where a horizontal line pro-jects toward the left to intersect a vertical line from thefirst intersection. The average daily lake evaporation,0.27 inch, is read at this point.
Computation by Digital Computer
The procedures just described for determining panand lake evaporation from observed climatic data werethe result of several years of combined effort. They wereused extensively by the Weather Bureau to compile anationwide picture of evaporation, based on observeddata from 297 pans and climatic data at 255 first-orderweather stations for the 10-year period 1946–1955(Kohler et al., 1959). The results contributed greatlyto general knowledge of evaporation in the United States.
These computational procedures also were adapted foruse on a digital computer by Lamoreux (1962), so thatlarge quantities of historical records can be practicablyprocessed. The complete computations for pan and lakeevaporation can be accomplished by his equations whichfollow.
For pan evaporation, the expression is:
E p = {exp [(Ta – 212) (0.1024–0.01066 ln R)] – 0.0001+ 0.025 (es – ea )0.88 (0.37+0.0041 Up )}× {0.025 + (Ta +398.36) -2 4.7988×10 10
e x p [ – 7 4 8 2 . 6 / ( Ta +398.36)]} -1 (1)
For lake evaporation, the expression is:
E L = {exp [(Ta –212) (0.1024–0.01066 ln R )] – 0.0001+ 0.0105 (es– ea) 0.88 (0.37+0.0041 Up )}x (0.015 + ( Ta +398.36) - 2 6.8554×10¹⁰
exp [–7482.6/( Ta +398.36)]}- 1 (2)
The terms in these expressions are:
Ep = pan evaporation, inchesEL = lake evaporation, inchesTa = air temperature, degrees Fahrenheitea = vapor pressure, inches of mercury at tempera-
ture Ta
es = vapor pressure, inches of mercury at tempera-ture Td
Td = dew point temperature, degrees FahrenheitR = solar radiation, langleys per day
Up = wind movement, miles per day
Equations 1 and 2 were used for this Illinois study ofevaporation. Thorough review of the development, test-ing, and use of these Weather Bureau procedures indi-cated their value for extending and refining evaporationdata in the state.
DATA AND ANALYSES FOR ILLINOIS
Observed Pan Data Available
At the beginning of this study, all records of panevaporation in and near Illinois were searched out andcompiled, primarily from U. S. Weather Bureau Cli-matological Data. Twenty-six records of varying lengthwere located, 20 in adjoining states and 6 in Illinois.Three of the Illinois records were from the pans oper-ated by the Water Survey at Rockford, Urbana, andCarbondale; two were from Weather Bureau stationsat Springfield and Dixon Springs; and one was from aprivately operated stat ion at Ficklin. Class A panobservations starting with August 1962 were also avail-able at Hennepin and Carlyle, but the records were tooshort for use in this study.
The solid dots on figure 8 mark the stations havingobserved pan records, and the histogram in figure 9shows the periods of records.
To use these data efficiently, a standard period of rec-ord was selected, which was the 16 years 1947 through1962. For this period, 17 stations had complete or almostcomplete records for the May through October season.These data are tabulated in table 1 and were used to
form the map of pan evaporation in Illinois, figure 10.This map represents the basic pattern of summer-seasonevaporation for the state.
Individual monthly maps also were drawn to showthe variation in evaporation during the season, andthese were used later in the study as an aid in prepar-ing the monthly and seasonal maps of computed lakeevaporation.
Climatic Data Available
Since the computation of evaporation by equations 1and 2 required four elements of climatic data (air tem-perature, dew point, solar radiation, and wind move-ment), a search was made for records of observations ofthese elements in and near Illinois. The open circles onfigure 8 mark the 30 stations where part or all of theseelements had been observed for some period.
The searching of old records to find concurrent obser-vations of all four data elements became one of the mosttime-consuming phases of the study. After considerablecorrespondence and cooperation from Weather Bureau
8

Figure 8. Location of data stations in and near Illinois
officials, the historical picture was fitted together for the data from the many historical observations. For this30 stations. However, initial experience in searching reason, these compilations were limited to seven stationsthese data, computing the desired monthly means, and with long-term records, and three other stations havingdetermining the observers’ practices in early years re- differing records were also used for the computationsvealed the practical burdens of compiling the needed of evaporation.
9
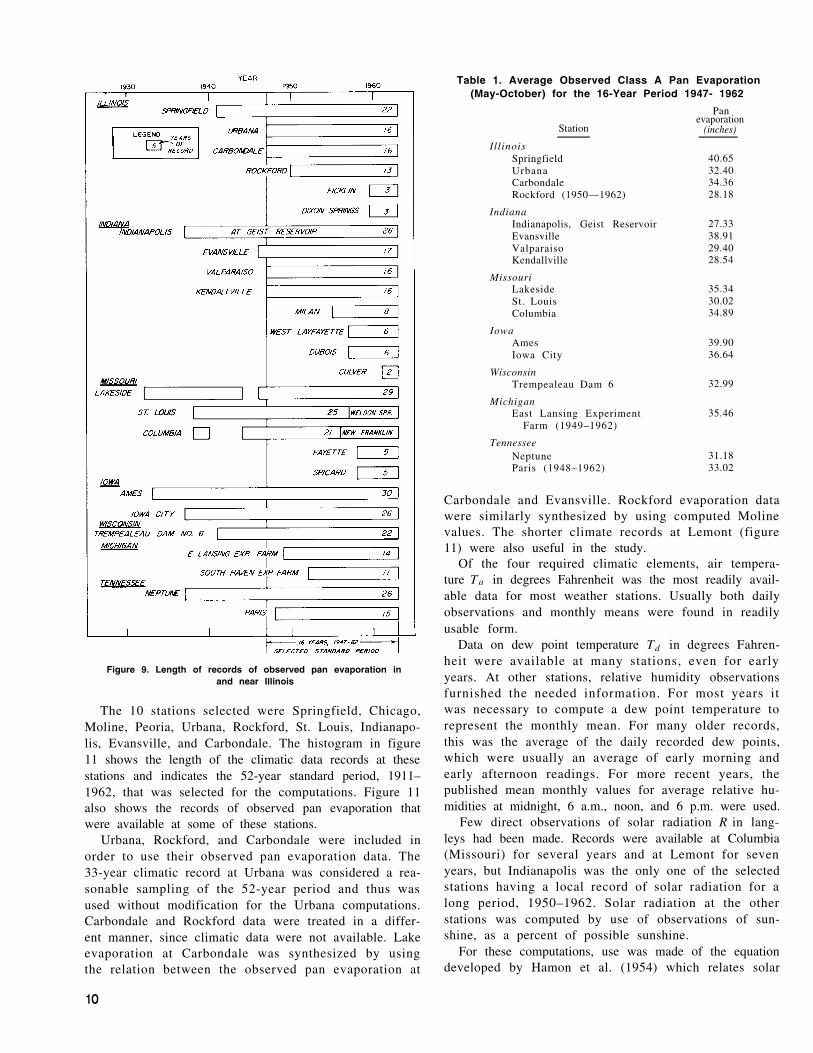
Figure 9. Length of records of observed pan evaporation inand near Illinois
The 10 stations selected were Springfield, Chicago,Moline, Peoria, Urbana, Rockford, St. Louis, Indianapo-lis, Evansville, and Carbondale. The histogram in figure11 shows the length of the climatic data records at thesestations and indicates the 52-year standard period, 1911–1962, that was selected for the computations. Figure 11also shows the records of observed pan evaporation thatwere available at some of these stations.
Urbana, Rockford, and Carbondale were included inorder to use their observed pan evaporation data. The33-year climatic record at Urbana was considered a rea-sonable sampling of the 52-year period and thus wasused without modification for the Urbana computations.Carbondale and Rockford data were treated in a differ-ent manner, since climatic data were not available. Lakeevaporation at Carbondale was synthesized by usingthe relation between the observed pan evaporation at
1O
Table 1. Average Observed Class A Pan Evaporation(May-October) for the 16-Year Period 1947- 1962
Panevaporation
Station (inches)
IllinoisSpringfield 40.65Urbana 32.40Carbondale 34.36Rockford (1950—1962) 28.18
IndianaIndianapolis, Geist ReservoirEvansvilleValparaisoKendallville
MissouriLakesideSt. LouisColumbia
IowaAmesIowa City
WisconsinTrempealeau Dam 6
MichiganEast Lansing Experiment
Farm (1949–1962)
TennesseeNeptuneParis (1948–1962)
27.3338.9129.4028.54
35.3430.0234.89
39.9036.64
32.99
35.46
31.1833.02
Carbondale and Evansville. Rockford evaporation datawere similarly synthesized by using computed Molinevalues. The shorter climate records at Lemont (figure11) were also useful in the study.
Of the four required climatic elements, air tempera-ture Ta in degrees Fahrenheit was the most readily avail-able data for most weather stations. Usually both dailyobservations and monthly means were found in readilyusable form.
Data on dew point temperature Td in degrees Fahren-heit were available at many stations, even for earlyyears. At other stations, relative humidity observationsfurnished the needed information. For most years itwas necessary to compute a dew point temperature torepresent the monthly mean. For many older records,this was the average of the daily recorded dew points,which were usually an average of early morning andearly afternoon readings. For more recent years, thepublished mean monthly values for average relative hu-midities at midnight, 6 a.m., noon, and 6 p.m. were used.
Few direct observations of solar radiation R in lang-leys had been made. Records were available at Columbia(Missouri) for several years and at Lemont for sevenyears, but Indianapolis was the only one of the selectedstations having a local record of solar radiation for along period, 1950–1962. Solar radiation at the otherstations was computed by use of observations of sun-shine, as a percent of possible sunshine.
For these computations, use was made of the equationdeveloped by Hamon et al. (1954) which relates solar

Figure 10. Pan evaporation in inches for May-October for 16 years
radiation to latitude, time of year, and percent of pos-sible sunshine. This equation had been used also byKohler et al. (1955) and Nordenson (1962) in develop-ing the methodology for computing evaporation. Toconvert sunshine data to solar radiation, monthly con-version curves, developed directly from the graph givenby Hamon, were drawn for each degree of latitude. Anexample is shown in figure 12 for 40º north latitude,approximately the latitude (see figure 8) of Springfieldand Urbana. Each curve represents the relation forabout the 15th day of the month.
The conversion procedure for computing solar radia-tion was checked by using the observations of solarradiation at Lemont for the seven years, 1951–1952 and1955–1959, and the values for nearby Chicago that werecomputed with data for percent sunshine and conversioncurves for 42° north latitude. The results are shown infigure 13. The plotted points, which are the monthlymean values for the seven years, cluster nicely aboutthe 45-degree line of equality, indicating that this con-version procedure seems to work very well.
Data on wind movement U in miles per hour were
available at nearly all of the weather stations for mostyears. However, the station anemometers were usually50 to 100 feet above the ground surface, whereas windmovement at 2 feet above the ground surface was desiredfor computing evaporation by equations 1 or 2.
Thus, observed wind movement was adjusted to panheight, 2 feet, by use of the power law as describedby Nordenson (1962). The basic equation used wasU1 /U2 = (Z 1 /Z 2 )
0.30 in which U1 is the wind movementat pan height, U 2 the wind movement at the weatheranemometer, Z 1 the height of the pan anemometer (2feet), and Z2 the height of the weather station anemom-eter.
It was possible to check this procedure by use of datafrom those stations where wind movement had beenmeasured at both a weather station and a nearby class Aevaporation pan. At Springfield, for example, observa-tions of wind movement for April–October at the classA evaporation pan and at the weather station anemometer(height of 49 feet) were available for a 13-year period,1950–1962. Wind data from the anemometer at 49 feetwere adjusted to produce a computed wind movementat the pan, and this computed result was checked withthe observed wind data at the pan. As the results in
Figure 11. Length of climatic data records and observed pan datafor selected stations
11
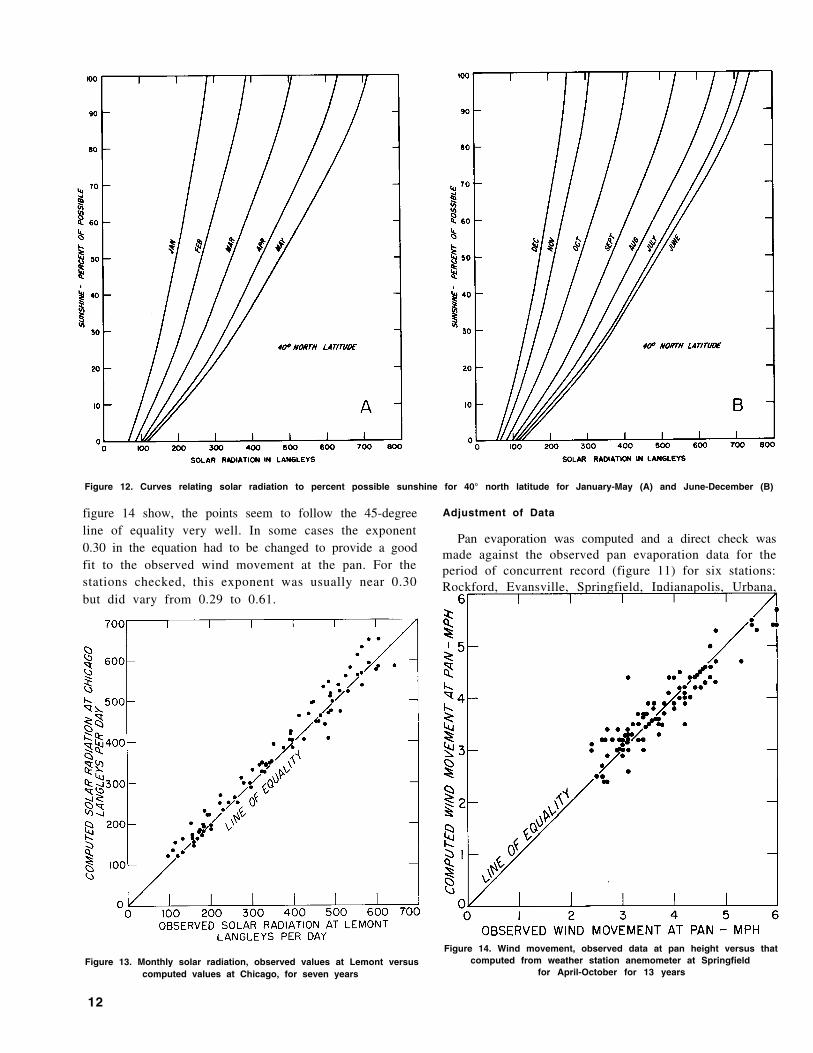
Figure 12. Curves relating solar radiation to percent possible sunshine for 40° north latitude for January-May (A) and June-December (B)
figure 14 show, the points seem to follow the 45-degreeline of equality very well. In some cases the exponent0.30 in the equation had to be changed to provide a goodfit to the observed wind movement at the pan. For thestations checked, this exponent was usually near 0.30but did vary from 0.29 to 0.61.
Figure 13. Monthly solar radiation, observed values at Lemont versuscomputed values at Chicago, for seven years
12
Adjustment of Data
Pan evaporation was computed and a direct check wasmade against the observed pan evaporation data for theperiod of concurrent record (figure 11) for six stations:Rockford, Evansville, Springfield, Indianapolis, Urbana,
Figure 14. Wind movement, observed data at pan height versus thatcomputed from weather station anemometer at Springfield
for April-October for 13 years

Figure 15. Observed and computed monthly pan evaporation atSpringfield for 22-year period, April-October
and St. Louis. The differences were adjusted on thebasis of overall considerations of the accuracy and varia-bility of both the pan observations and the observationsof climatic data.
At Rockford the two sets of data were equal, but atthe other five stations the evaporation computed by useof climatic data was greater than that observed in theclass A pan. The Springfield example in figure 15, forthe 22-year period 1941–1962, indicates that the com-puted values were 8 percent greater than the observedvalues at that station.
For the first adjustment, the five computed valueswere considered to be too high and were adjusted down-ward to coincide with the observed values. Figure 16shows the magnitudes of these differences and the down-ward adjustments required on the computed evaporationto make it equal to the observed evaporation. The ad-justments required were: Rockford, none; Evansville,6 percent; Springfield, 8 percent; Indianapolis, 12 per-cent; Urbana, 15 percent; and St. Louis, 29 percent.
After these adjustments had been made, the evapora-tion for the 52-year period 1911–1962 for the May–October season was drawn as a map and compared withthe pan evaporation map in figure 10. On the basis of
Figure 16. Adjustments required on computed evaporationto match observed evaporation
the differences shown and the judgment of the authors,it was decided that the computed values were more re-liable than the three high adjustments would indicateand that the observed values in these cases might be toolow. Revised adjustments selected for these three sta-tions were: Indianapolis, 9 percent; Urbana, 10 per-cent; and St. Louis, 15 percent.
Adjustments of computed pan evaporation for theother three stations, which lacked observed pan data fora direct check, were then selected on the basis of the firstsix and the relative geographic locations of the towns.These adjustments were: Moline, none; Chicago, none;and Peoria, 5 percent. All adjustments selected for useare shown in figure 16, and were made prior to thefurther processing and mapping of data.
13
RESULTS OF ILLINOIS STUDY
Magnitude and Variability of Lake Evaporation
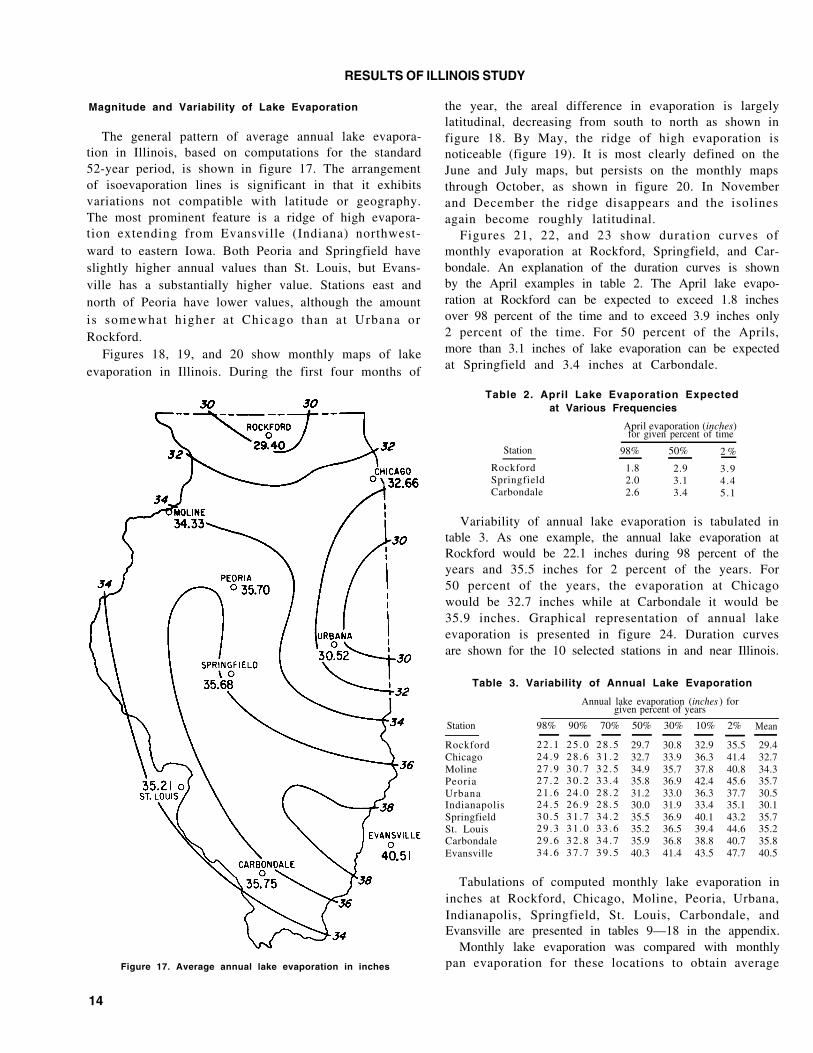
The general pattern of average annual lake evapora-tion in Illinois, based on computations for the standard52-year period, is shown in figure 17. The arrangementof isoevaporation lines is significant in that it exhibitsvariations not compatible with latitude or geography.The most prominent feature is a ridge of high evapora-tion extending from Evansville (Indiana) northwest-ward to eastern Iowa. Both Peoria and Springfield haveslightly higher annual values than St. Louis, but Evans-ville has a substantially higher value. Stations east andnorth of Peoria have lower values, although the amountis somewhat higher at Chicago than at Urbana orRockford.
Figures 18, 19, and 20 show monthly maps of lakeevaporation in Illinois. During the first four months of
Figure 17. Average annual lake evaporation in inches
14
the year, the areal difference in evaporation is largelylatitudinal, decreasing from south to north as shown infigure 18. By May, the ridge of high evaporation isnoticeable (figure 19). It is most clearly defined on theJune and July maps, but persists on the monthly mapsthrough October, as shown in figure 20. In Novemberand December the ridge disappears and the isolinesagain become roughly latitudinal.
Figures 21, 22, and 23 show duration curves ofmonthly evaporation at Rockford, Springfield, and Car-bondale. An explanation of the duration curves is shownby the April examples in table 2. The April lake evapo-ration at Rockford can be expected to exceed 1.8 inchesover 98 percent of the time and to exceed 3.9 inches only2 percent of the time. For 50 percent of the Aprils,more than 3.1 inches of lake evaporation can be expectedat Springfield and 3.4 inches at Carbondale.
Table 2. April Lake Evaporation Expectedat Various Frequencies
April evaporation (inches)for given percent of time
Station
RockfordSpringfieldCarbondale
98% 50% 2 %
1.8 2.9 3.92.0 3.1 4.42.6 3.4 5.1
Variability of annual lake evaporation is tabulated intable 3. As one example, the annual lake evaporation atRockford would be 22.1 inches during 98 percent of theyears and 35.5 inches for 2 percent of the years. For50 percent of the years, the evaporation at Chicagowould be 32.7 inches while at Carbondale it would be35.9 inches. Graphical representation of annual lakeevaporation is presented in figure 24. Duration curvesare shown for the 10 selected stations in and near Illinois.
Table 3. Variability of Annual Lake Evaporation
Station
RockfordChicagoMolinePeoriaUrbanaIndianapolisSpringfieldSt. LouisCarbondaleEvansville
Annual lake evaporation (inches ) forgiven percent of years
98% 90% 70% 50% 30% 10% 2% Mean
22 .1 25 .0 28 .5 29.7 30.8 32.9 35.5 29.424 .9 28 .6 31 .2 32.7 33.9 36.3 41.4 32.727 .9 30 .7 32 .5 34.9 35.7 37.8 40.8 34.327 .2 30 .2 33 .4 35.8 36.9 42.4 45.6 35.721 .6 24 .0 28 .2 31.2 33.0 36.3 37.7 30.524 .5 26 .9 28 .5 30.0 31.9 33.4 35.1 30.130 .5 31 .7 34 .2 35.5 36.9 40.1 43.2 35.729 .3 31 .0 33 .6 35.2 36.5 39.4 44.6 35.229 .6 32 .8 34 .7 35.9 36.8 38.8 40.7 35.834 .6 37 .7 39 .5 40.3 41.4 43.5 47.7 40.5
Tabulations of computed monthly lake evaporation ininches at Rockford, Chicago, Moline, Peoria, Urbana,Indianapolis, Springfield, St. Louis, Carbondale, andEvansville are presented in tables 9—18 in the appendix.
Monthly lake evaporation was compared with monthlypan evaporation for these locations to obtain average
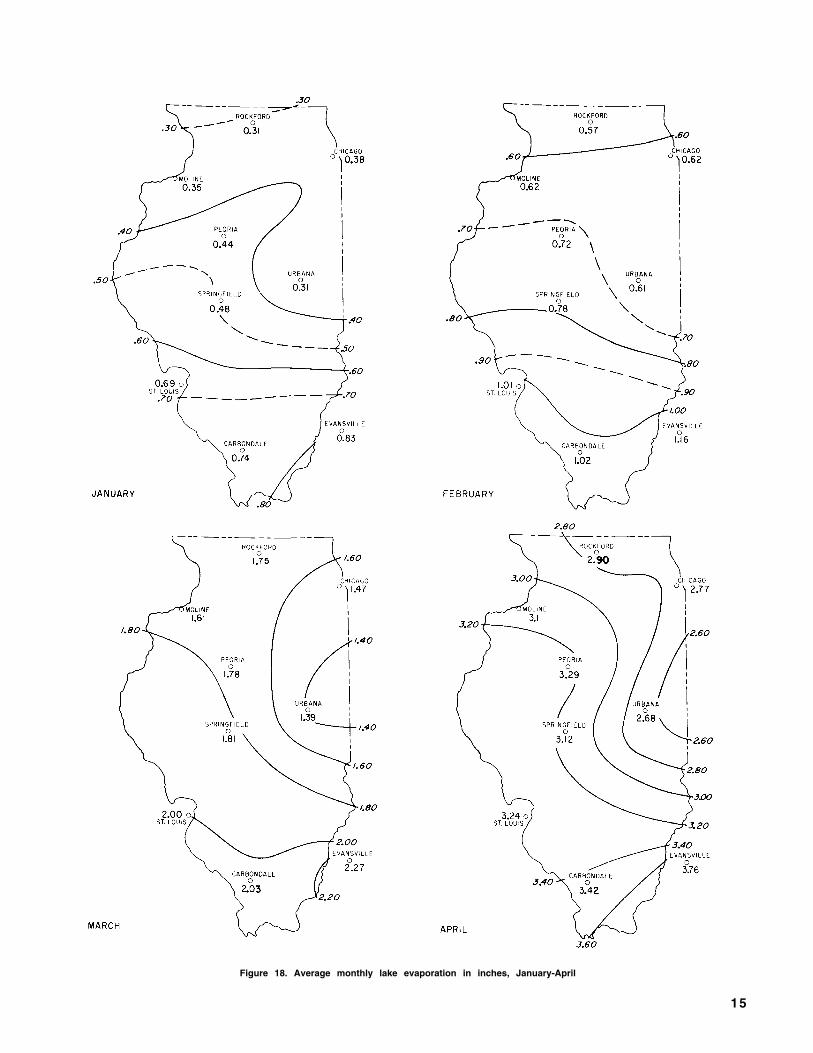
Figure 18. Average monthly lake evaporation in inches, January-April
15

Figure 19. Average monthly lake evaporation in inches, May-August
16

Figure 20. Average monthly lake evaporation in inches, September-December
17

Figure 21. Duration curves of monthly evaporation at Rockford
18
Figure 22. Duration curves of monthly evaporation at Springfield

Figure 23. Duration curves of monthly evaporation at Carbondale
monthly pan-to-lake coefficients. In this study, pan-to-lake coefficients have not been used as an important pro-cedure; however, for the information of the reader, theindicated monthly and annual pan-to-lake coefficientsare given in table 4.
The data presented in this report are intended to showthe general lake evaporation situation in Illinois. It isrecognized that evaporation from a specific lake can varyfrom the general picture because of exposure, shape,depth, and other factors. Generally, the data are ap-plicable to a wide range of Illinois water bodies. The
Table 4. Average Monthly and Annual Pan-to-LakeCoefficients
An-Jan Feb Mar Apr May Jun Jul Aug Sep Oct Nov Dec nual
Rockford.56 .68 .83 .80 .81 .79 .79 .77 .74 .72 .62 .54 .77
Chicago.61 .75 .80 .81 .81 .79 .78 .76 .73 .68 .61 .56 .77
Moline.64 .75 .78 .77 .77 .76 .75 .75 .72 .70 .62 .56 .74
Peoria.63 .72 .74 .74 .75 .75 .73 .72 .70 .65 .61 .58 .73
Urbana.66 .78 .82 .81 .81 .81 .79 .79 .76 .71 .67 .60 .78
Indianapolis.62 .72 .79 .81 .81 .80 .78 .78 .76 .71 .63 .58 .77
Springfield.63 .73 .74 .75 .75 .74 .73 .73 .70 .66 .62 .60 .72
St. Louis.62 .70 .74 .76 .77 .75 .74 .73 .70 .67 .62 .59 .72
Carbondale.61 .68 .73 .74 .77 .76 .75 .74 .72 .67 .63 .59 .73
Evansville.62 .69 .73 .75 .77 .75 .75 .74 .72 .68 .62 .61 .73
Average of all 10 stations.62 .72 .77 .77 .78 .77 .76 .75 .73 .69 .63 .58 .75
monthly maps of lake evaporation together with the dura-tion curves of evaporation could be useful in formulatingand managing water conservation programs.
Application to Net Reservoir Yield
Analytical methods available for determining the prob-able yield of a proposed impoundment invariably furnishinformation on the gross yield. The traditional Ripplmass curve analysis furnishes this type of information.Similar information is given by a new method describedby Stall (1964), whose technique furnishes an array ofresults showing gross yield from the proposed reservoirfor various recurrence intervals and the critical draw-down period in each case.
Evaporation loss is of major importance in the opera-tion of a surface water impounding reservoir. The pur-pose of this section is to show a means by which theevaporative loss can be evaluated so that the gross yieldof a reservoir can be reduced to the net yield. Separateconsideration must be given to seepage losses (Harr,1962).
The net evaporation loss from a lake was determinedby Stall (1964) as being the difference between a’maxi-mum expected gross lake evaporation minus the minimumexpected precipitation on the lake surface for variousrecurrence intervals and for critical periods havingvarious durations. This approach assumed maximumevaporation and minimum precipitation would occur
19

Figure 24. Duration curves of annual lake evaporation for 10 stations
simultaneously. More recent studies of lake evaporationand rainfall suggest that maximum evaporation andminimum rainfall for the same recurrence intervals sel-dom occur during the same calendar months, and oftenare 6 months out of phase.
The method described here results in slightly lowerevaporation losses than reported by Stall (1964). Themethod is illustrated with Springfield data.
The monthly lake evaporation data computed forSpringfield (appendix table 15) furnished a continuousrecord of lake evaporation in inches for 52 years, ex-tending from January 1911 through December 1962.The monthly precipitation in inches for the same 52-yearperiod is shown in table 5, as published in U. S. WeatherBureau Climatological Data. For every month of the52-year period for which lake evaporation and precipi-
20
tation were available, the precipitation was subtractedfrom the evaporation to obtain the net evaporation.Table 6 shows the values of net lake evaporation com-puted for Springfield.
This computation was made on the assumption thatthe lake evaporation in inches in a particular month isthe positive amount as shown in table 15, while theactual inches of rainfall from table 5, which would falldirectly on the lake surface during the same month,would ‘counteract’ evaporation in the amount of therainfall. In this sense, the precipitation can be con-sidered as negative evaporation. In table 6, no net evapo-ration is shown for many months; this means that theprecipitation for these months was greater than the lakeevaporation, so resulting net lake evaporation was zero.
A continuous monthly record of net lake evaporation

Table 5. Monthly Precipitation at Springfield in Inches, 1911 - 1962
for the 52-year period at Springfield is thus providedby table 6. In order that these data may furnish themost meaningful information, a partial series of maxi-mum net evaporation magnitudes was developed for anumber of durations varying from 1 month to 60 months.For each of the maximum evaporation events in thepartial series, a recurrence interval was assigned by theequation R = n/m , in which R is the recurrence intervalin years, n the period of record in years, and m the rankof the event. This development of the series and assign-ment of recurrence intervals followed methodology forlow flows in Illinois developed by Stall (1964).
This process furnished a number of maximum netevaporation magnitudes for various lengths of time basedupon the basic data. The magnitudes of the net evapora-tion for various durations were associated with the re-currence intervals provided by the equation. These datawere interpolated to provide values for the more con-venient recurrence intervals shown in appendix table 25for Springfield.
Maximum net evaporation data were obtained by themethod just described for the 10 selected locations in andnear Illinois and are given in tables 19-28 in the ap-pendix. These data are in a form most helpful for
21
Year
1911191219131914191519161917191819191920
1921192219231924192519261927192819291930193119321933193419351936193719381939194019411942194319441945194619471948194919501951195219531954195519561957195819591960
19611962
Jan
2.341.083.552.132.11
4.771.691.880.090.79
1.681.831.061.230.421.641.751.022.583.800.272.162.851.332.101.774.951.532.891.21
2.671.591.010.381.061.221.930.565.675.221.771.651.300.852.320.571.591.231.831.31
0.353.04
Feb Mar Apr
1.73 1.86 4.401.56 4.21 5.391.35 5.55 3.552.53 1.01 2.992.28 0.80 2.041.00 1.89 1.430.47 5.17 3.771.71 0.63 5.192.15 2.26 1.260.58 6.34 5.42
0.71 5.09 4.750.86 6.81 5.200.79 5.23 1.721.96 2.79 2.181.65 2.94 2.592.43 3.57 5.051.03 6.59 5.452.42 1.14 2.880.65 2.96 3.562.76 1.17 1.551.57 2.79 1.880.98 1.59 1.491.19 6.50 2.570.90 3.50 1.211.57 2.90 3.391.74 3.61 2.201.67 0.69 3.642.12 4.45 3.323.21 4.56 5.370.80 2.80 3.68
0.58 1.34 5.374.82 1.82 2.340.72 2.37 3.442.76 3.72 8.521.32 4.77 4.621.80 2.58 2.540.36 2.54 5.181.53 4.86 1.292.65 2.01 1.952.25 1.71 2.81
4.43 3.86 5.092.20 2.81 5.191.34 5.08 1.851.15 1.54 3.592.76 1.43 3.371.73 0.63 3.221.76 2.00 8.860.51 1.08 3.072.04 2.91 2.232.15 4.09 4.43
1.79 3.47 3.951.48 3.54 1.31
May
1.184.400.961.119.864.213.935.163.876.89
1.174.643.463.831.104.547.014.616.321.65
4.872.788.690.327.911.882.427.341.623.373.033.43
10.604.264.205.595.112.522.521.752.493.081.331.955.113.564.612.953.154.074.223.16
Jun Jul Aug Sep Oct Nov Dec
3.44 4.87 3.37 10.68 2.00 3.10 1.863.13 4.47 2.87 1.42 3.49 1.48 0.311.84 1.66 2.88 3.41 3.61 4.49 0.771.69 1.39 3.32 1.82 2.08 0.49 2.203.22 5.72 6.21 3.31 0.73 1.60 2.913.14 0.31 4.34 3.35 1.97 2.26 1.22
10.77 3.86 2.35 1.61 0.81 0.25 0.753.81 3.00 3.46 4.71 2.79 2.29 2.455.46 1.25 1.85 2.74 5.63 3.10 0.303.89 0.92 4.60 3.08 1.49 0.79 2.995.41 1.67 5.18 4.33 1.61 3.25 2.711.19 2.56 0.55 1.00 1.95 2.53 1.592.74 1.31 5.35 5.66 4.53 1.44 3.405.47 1.71 3.10 2.02 3.02 1.74 4.723.74 3.51 4.42 4.45 2.23 2.33 1.325.01 2.40 4.39 15.16 4.87 4.52 0.903.50 3.17 3.37 7.46 2.16 4.96 2.685.06 3.09 0.73 3.35 3.72 1.79 1.943.41 4.66 2.08 1.65 3.33 1.17 1.312.40 1.33 2.68 2.71 1.44 2.51 0.323.94 2.78 3.58 3.15 3.51 5.07 2.806.39 2.30 5.42 1.13 3.70 1.32 2.793.29 0.42 2.34 5.05 2.38 0.28 0.914.55 6.11 3.62 5.24 1.64 5.38 1.885.69 5.43 1.23 3.22 2.13 4.59 1.061.14 1.36 1.61 6.06 2.54 2.30 2.714.72 6.70 0.94 2.16 2.81 1.62 2.314.23 2.83 2.49 1.98 3.36 1.48 1.853.90 1.07 5.75 0.14 1.99 1.46 1.091.53 1.31 2.47 0.38 1.14 2.46 1.732.25 2.23 2.05 6.97 13.39 3.37 1.475.44 7.06 0.91 4.45 3.07 5.82 2.612.78 3.03 0.10 2.45 2.76 1.28 1.820.58 0.81 4.11 3.84 1.22 1.37 1.717.34 1.00 3.36 8.38 1.95 3.18 2.225.27 4.15 3.17 3.06 3.65 5.33 1.556.86 1.26 1.85 5.03 2.64 1.03 2.697.65 4.42 2.03 0.90 1.27 1.93 1.903.10 3.43 4.21 2.21 4.60 0.43 4.744.25 5.63 2.81 1.35 0.97 2.48 0.788.80 1.66 1.96 2.76 2.89 2.25 1.554.20 4.01 0.94 0.62 1.14 2.75 1.803.30 3.88 0.65 1.92 1.18 0.78 1.373.95 2.25 4.54 0.91 3.25 0.82 1.872.50 4.01 3.06 2.60 6.15 0.69 0.153.09 6.88 5.20 0.81 0.45 2.44 2.635.65 4.60 3.07 1.31 2.85 2.25 3.428.14 6.85 0.67 1.73 0.64 3.26 0.430.23 3.64 5.39 6.47 5.41 1.25 1.338.87 3.73 2.55 1.64 2.55 2.13 1.402.43 6.38 3.07 6.35 2.10 2.60 1.283.62 3.82 1.11 1.42 5.68 1.91 0.53

(Lake evaporation minus precipitation)
JunYear Jan Feb Mar Apr May Jul Aug
1911 .32 5.01 2.97 1.55 1.37
1912 . 6 9 2.27 1.07 1.76
1913 3.75 4.85 5.14 2.99
1914 .38 4.58 4.61 5.40 1.76
1915 .54 2.41 1.93
1916 1.18 . 1 8 2.06 6.89 .73
1917 .28 . 0 7 2.70 2.34
1918 2.27 . 2 3 2.10 3.25 1.65
1919 .72 1.67 . 6 5 6.06 3.73 1.55
1920 .22 2.44 5.74
1921 .09 4.33 .78 5.24
1922 .20 . 3 1 5.68 3.58 5.03
1923 1.53 1.32 3.12 5.36
1924 1.38 3.60 2.07
1925 1.40 4.01 2.30 2.40 .74
1926 . 7 0 .45 4.06 .17
1927 1.63 3.10 .95
1928 .82 .02 . 9 9 3.26 4.55
1929 1.44 1.26 2.93
1930 .85 2.02 3.49 3.44 5.79 3.14
1931 .40 1.66 2.19 4.10 1.38
1932 .06 1.71 3.00 4.43 .13
1933 .37 4.55 6.97 3.09
1934 2.88 6.51 2.89 .99 1.10
1935 1.45 4.56
1936 .84 4.07 5.52 6.72 5.101937 1.16 2.40 .71 4.63
1938 .25 1.40 3.86 3.13
1939 4.11 1.04 4.59
1940 . 3 6 4.04 5.75 2.16
1941 .07 .41 2.81 3.23 4.44 3.261942 1.58 . 4 1 4.181943 .52 1.99 2.94 5.391944 .21 5.51 6.25 1.061945 5.19 2.20
1946 .53 1.33 .72 2.16 .60
1947 .46 5.55 4.841948 2.63 2.47 .89 3.461949 1.35 3.10 3.04 2.59 .881950 3.06 1.23 .95
1951 2.30 4.20 3.041952 1.09 2.56 2.46 4.261953 1.34 3.13 4.61 2.93 5.521954 .32 .52 .39 3.23 2.52 5.14 .381955 .76 .86 2.92 2.59 3.38
1956 1.94 .28 2.34 3.37
1957 .06 1.67 2.751958 .57 .35 .49 2.55 4.971959 1.31 1.57 6.31 2.49
1960 2.02 2.78
1961 .54 . 5 5 3.14 1.72
1962 2.32 2.78 2.25 1.45 4.19
Oct
1.97
.77
.10
Table 6. Net Lake Evaporation at Springfield in Inches, 1911-1962
further use in determining the net yield of a reservoir,as will be illustrated by an example.
To illustrate the computation of net reservoir yield,calculations are shown for a theoretically proposed reser-voir on Hamilton Creek near Mt. Sterling, in centralIllinois. This reservoir is described physically in table 7as reported by Dawes and Terstriep (1966). Since Mt.Sterling is only 60 miles west of Springfield, it is rea-sonable to assume that the Springfield evaporation dataapply. The evaporation computations are carried outfor a recurrence interval of 40 years (see figure 25).
Sep
2.02
1.42
.091.99
.89
3.29
1.09
.1 61.541.02
.9 12.90
.76
2.122.195.114.27
1.12
1.26
2.641.211.45.40
3.903.153.842.063.792.382.08
Nov
. 9 8
Dec
.56
.85
.95
.97
.67
.0 1
.41
.50 .18
1.031.41
.06
.251.012.01
.09
1.48.49
.85
1.901.13
2.102.08
2.98
2.34
.95
.24
.58 .59
.28
2.60
.242.08 .23
The first three columns in table 7 show gross yield re-sults obtained from a low-flow analysis by the Stall(1964) method. For a 40-year recurrence interval, thegross draft rate which this reservoir will yield is 1.8million gallons per day (mgd) and the critical draw-down period is 16 months or 486 days. The fourthcolumn in table 7 shows the net evaporation loss fromthe proposed reservoir in inches, which are values readdirectly from appendix table 25. For the 40-year re-currence interval, the 16-month net evaporation loss willbe 31 inches or 2.58 feet.
22

Figure 25. Computations of evaporative loss and net draft rate forproposed reservoir on Hamilton Creek
The reservoir would be full at the beginning of acritical drawdown period, in this case 16 months, andempty at the end of it; however, during this period thelake level would fluctuate, and the surface area exposedto evaporation would vary from 333 acres to zero.Hudson and Roberts (1955) recommend that the effec-tive evaporative surface for the critical drawdown periodbe 65 percent of the lake surface area when full, andthis relation was used here.
The net yield or net draft rate for the 40-year recur-rence interval is computed as shown in table 8. Similarcalculations using the appropriate recurrence intervalsresult in the corresponding gnet draft rates shown in
Table 7. Analysis of Evaporation Loss for ProposedReservoir on Hamilton Creek near Mt. Sterling
Physical DataReservoir capacity = 2.03 equivalent inches on drainage area
= 1700 acre-feet= 600 million gallons
Reservoir surface area = 333 acresDrainage area = 15.7 square miles
(Located about 60 miles west of Springfield so thatthe Springfield evaporation data are assumed to apply)
Data available from grossyield analysis
Drouth Grossrecur- draftrence rate
interval (mgd)
Durationof criticaldrawdown
period(months)
loss,from
table 25(inches)
ration
Netevapo-
Netdraftrate
(mgd)
(mean) 5.6 — — —2 4.5 7 9 4.35 3.4 9 1 3 3.2
10 2.5 12 1 5 2.320 2.0 18 2 7 1.730 1.9 16 2 7 1.640 1.8 16 3 1 1.5
Table 8. Computation of Net Reservoir Yieldfor Proposed Reservoir on Hamilton Creek near Mt. Sterling
(All computations apply to the16-month critical drawdown period shown in figure 25)
The total gross draft is1.83 mgd × 486 days = 889 million gallons ( m g)
T h e i n f l o w t o t h e r e s e r v o i r i s t o t a l g r o s s d r a f t m i n u s t o t a lreservoir capacity, or
889 mg — 600 mg = 289 m gThe effective evaporative surface area of the lake is
333 acres × 0.65 = 216 acresThe evaporative loss is
2.58 feet × 216 acres = 557 acre-feet, or 181 m gThe net usable reservoir capacity is the total reservoir capacityminus the evaporative loss, or
600 mg — 181 mg = 419 m gThe total net draft which the reservoir can furnish is the netusable reservoir capacity plus the inflow, or
419 mg + 289 m g = 708 m gThe net draft rate, or the net yield, which the reservoir can furnishis the total net draft divided by total days in the critical period, or
708 m g ÷ 486 days = 1.5 m g d
table 7. In each case the net draft rates are less thanthe gross draft rates in column 2 of the table. The differ-ences are considered to be a rational evaluation of theprobable evaporative loss.
Figure 26 shows a graph of gross reservoir yield versusthe net reservoir yield for the proposed reservoir onHamilton Creek near Mt. Sterling.
Thus, both the annual evaporation data and the maxi-mum net evaporation data for certain recurrences anddurations are directly applicable to reservoir design.Although these data have been presented for selectedlocations, their distribution is such as to represent ade-quately any area in the state.
Figure 26. Reservoir gross yield versus net yield forproposed reservoir on Hamilton Creek
23

REFERENCES
Daniels, Farrington. 1954. Outlines of physical chem-istry. Ninth printing, John Wiley and Sons, NewYork.
Davis, Kenneth S., and John Arthur Day. 1961. Waterthe mirror of science. Anchor Books, Doubledayand Co., Garden City, N. Y.
Dawes, Julius H., and Michael L. Terstriep. 1966. Po-tential surface water reservoirs of north-central Illi-nois. Illinois State Water Survey Report of In-vestigation 56.
Hamon, R. W., L. L. Weiss, and W. T. Wilson. 1954.Insolation as an empirical function of daily sunshineduration. Monthly Weather Review v. 82(6).
Harbeck, G. E., Jr., M. A. Kohler, G. E. Koberg, andothers . 1958. Water loss invest igat ions: LakeMead studies. U. S. Geological Survey ProfessionalPaper 298.
Harr, Milton E. 1962. Ground water and seepage.McGraw-Hill Book Co., New York.
Hudson, H. E., Jr., and W. J. Roberts. 1955. 1952–55Illinois drought with special reference to impound-ing reservoir design. Illinois State Water SurveyBulletin 43.
Illinois State Water Survey. 1960. Lake evaporationin Illinois. Technical Letter 5.
Kohler, M. A., T. J. Nordenson, and D. R. Baker. 1959.Evaporation maps for the United States. U. S.
Weather Bureau Technical Paper 37. (The fourseparate Pan and Lake Evaporation Maps are avail-able for 10 cents from the Superintendent of Docu-ments, Washington, D. C.)
Kohler, M. A., T. J. Nordenson, and W. E. Fox. 1955.Evaporation from pans and lakes. U. S. WeatherBureau Research Paper 38.
Lamoreux, Wallace M. 1962. Modern evaporation for-mulae adapted to computer use. Monthly WeatherReview, January.
Leopold, Luna B. 1966. The water resource. Inter-national Science and Technology No. 55: 24–34.
Linsley, R. K., M. A. Kohler, and J. L. H. Paulhus.1949. Applied hydrology. McGraw-Hill Book Co.,New York.
N o r d e n s o n , T o r J . 1 9 6 2 . E v a p o r a t i o n r a t e s . I nEvaporation from the 17 Western States, by J. Stu-art Meyers. U. S. Geological Survey ProfessionalPaper 272-D.
Roberts, W. J. 1953. Evaporation records in Illinois.Illinois State Water Survey Circular 43.
Stall, John B. 1964. Low flows of Illinois streams forimpounding reservoir design. Illinois State WaterSurvey Bulletin 51.
U. S. Geological Survey. 1954. Water loss investiga-tions: Lake Hefner studies, technical report. Pro-fessional Paper 269.
24

APPENDIX
Table 9. Monthly Lake Evaporation in Inches at Rockford
YEAR JAN FEB MAR APR MAY JUN JUL AUG SEP OCT NOV DEC TOTAL
1911 .08 .53 2.33 2.65 4.96 5.24 5.63 3.99 2.18 .89 .35 .21 29.041912 .03 .21 .84 2.07 4.14 4.54 4.96 3.52 2.66 2.60 .99 .46 27.021913 .21 .47 1.31 3.22 3.64 4.90 5.81 3.90 2.82 1.44 .64 .13 28.491914 .21 .27 1.39 2.88 4.62 4.48 5.50 4.72 2.85 1.57 1.14 .05 29.68
1915 .07 .36 1.26 3.77 3.26 3.88 3.82 3.36 2.42 2.08 .78 .08 25.141916 .24 .42 1.56 2.98 3.75 4.17 6.26 4.72 3.05 2.32 .93 .35 30.751917 .26 .41 1.91 2.46 3.51 3.53 5.14 4.37 2.85 1.63 .84 .14 27.051918 .13 .59 2.71 2.72 4.28 4.20 4.83 4.22 2.64 1.99 .75 .28 29.341919 .36 .54 1.75 2.41 3.26 4.31 5.97 4.14 3.22 1.69 .82 .04 28.51
1920 .18 .46 2.02 2.08 3.99 5.06 5.15 4.33 3.26 2.35 .61 .25 29.741921 .48 .59 1.78 3.17 4.39 4.74 5.72 3.44 3.16 2.49 .51 .38 30.851922 .54 .79 1.45 2.53 3.69 5.02 4.67 4.39 3.35 2.74 .78 .44 30.391923 .25 .49 1.47 2.94 3.73 4.47 5.14 3.54 2.53 2.11 .90 .44 28.011924 .17 .29 .61 2.78 3.19 3.10 4.27 3.82 2.75 2.77 .96 .22 24.93
1925 .20 .46 1.73 2.82 3.99 4.36 4.77 4.42 2.66 .84 .73 .11 27.091926 .29 .49 1.08 2.77 4.31 4.31 4.32 3.33 1.81 1.11 .42 .18 24.421927 .16 .72 1.25 1.69 2.31 3.50 4.76 3.80 3.06 2.22 .63 .25 24.351928 .36 .58 2.16 2.86 4.82 3.52 4.80 4.20 3.11 2.11 .78 .36 29.661929 .07 .26 1.96 3.10 3.69 5.01 4.98 4.41 3.05 2.15 .82 .25 29.75
1930 .14 .84 2.66 3.44 4.20 4.59 5.60 4.14 3.70 2.00 1.28 .31 32.901931 .48 .95 1.55 3.17 3.64 5.27 6.26 4.70 3.36 2.14 .96 .42 32.901932 .45 .86 2.92 1.27 4.63 4.57 5.62 3.71 3.44 1.81 .89 .41 30.581933 .70 .82 1.56 2.86 3.33 6.34 5.56 4.26 3.53 2.22 1.09 .33 32.601934 .48 .78 1.86 3.54 6.33 6.32 5.55 4.16 2.45 2.74 1.04 .14 35.39
1935 .26 .48 1.83 2.80 3.01 3.62 5.74 4.77 3.11 2.28 .51 .21 28.621936 .17 .28 2.32 3.06 5.10 5.29 7.35 5.49 2.94 2.03 .95 .53 35.511937 .24 .56 1.68 2.38 4.01 4.66 5.88 4.69 3.68 1.86 1.10 .16 30.901938 .18 .56 2.63 3.36 3.57 4.52 5.17 4.41 3.05 2.84 1.34 .46 32.091939 .32 .73 2.35 2.86 5.00 4.55 5.14 3.89 4.00 2.70 1.27 .77 33.58
1940 .17 .44 1.46 3.00 3.74 5.02 6.08 3.43 3.55 2.66 .78 .21 30.541941 .20 .47 1.76 2.97 4.89 4.16 5.14 4.39 3.36 1.71 .86 .38 30.291942 .27 .41 1.72 3.76 3.55 3.87 4.98 3.92 2.80 2.48 .89 .06 28.711943 .10 .63 1.68 3.18 3.12 3.65 5.17 3.60 2.81 2.38 .77 .51 27.601944 .53 .48 1.07 2.36 3.55 4.27 5.14 4.31 2.74 2.51 .63 .18 27.77
1945 .18 .48 2.86 3.22 3.32 3.69 5.14 4.33 2.66 2.25 .87 .19 29.191946 .39 .82 2.11 3.65 3.47 4.64 5.31 3.90 3.35 2.48 1.03 .58 31.731947 .45 .53 1.49 2.34 3.44 3.49 5.18 5.30 3.63 2.59 .68 .33 29.451948 .38 .56 1.69 3.64 3.60 4.01 4.81 4.53 3.20 2.23 .74 .46 29.851949 .25 .65 1.78 3.23 4.17 4.54 5.03 4.00 2.66 2.30 1.27 .58 30.46
1950 .53 .56 1.41 2.38 4.03 4.58 4.31 3.42 2.60 2.71 .87 .34 27.741951 .32 .46 1.37 2.55 3.59 2.84 3.16 2.43 2.30 1.87 .73 .44 22.061952 .48 .65 1.32 3.24 2.90 3.39 3.61 2.09 1.90 2.66 1.34 .30 23.681953 .31 .74 1.54 2.74 3.56 4.81 4.45 3.30 3.17 2.55 1.20 .50 28.871954 .49 .94 1.64 3.22 3.60 4.62 3.78 2.52 2.26 1.61 .85 .39 25.90
1955 .40 .57 2.01 3.37 4.30 2.90 4.87 4.31 2.90 2.23 .99 .52 29.371956 .46 .55 2.09 3.22 4.21 2.16 3.90 2.99 2.46 2.79 .99 .31 26.131957 .37 .69 2.06 2.62 4.27 4.52 5.72 4.54 2.86 1.94 .82 .65 31.061958 .31 .54 1.70 3.00 7.09 4.08 4.23 4.64 3.07 2.20 1.33 .48 32.671959 .41 .67 1.88 3.12 5.35 5.07 5.44 4.11 2.86 1.54 .78 .46 31.69
1960 .46 .54 .81 3.14 3.96 4.70 4.94 4.09 3.08 2.27 1.23 .60 29.821961 .50 .69 1.97 2.83 4.92 5.63 5.72 4.44 3.28 2.26 .91 .37 33.521962 .49 .63 1.42 3.26 4.34 4.66 4.46 5.12 3.27 2.01 1.00 .69 31.35
AVERAGE .31 .57 1.75 2.90 4.03 4.37 5.09 4.05 2.95 2.15 .89 .34 29.40
25

Table 10. Monthly Lake Evaporation in Inches at Chicago
YEAR JAN FEB MAR APR MAY JUN JUL AUG SEP OCT NOV DEC TOTAL
.22 .48 1.57 2.24 5.68 6.06 6.33 4.96 2.48 1.18 .46 .35 32.01
.12 .38 .99 2.92 4.48 5.62 4.91 3.52 3.09 1.96 .96 .52 29.47
.33 .67 1.36 3.13 4.04 6.18 5.95 4.50 2.80 1.29 .69 .37 31.31
.29 .51 1.34 2.42 5.08 5.53 6.15 4.89 3.60 1.74 1.14 .21 32.90
.20 .50 1.25 3.78 2.60 4.13 3.81 3.13 2.48 1.91 .89 .24 24.9
.37 .54 1.14 2.32 3.85 4.50 7.35 6.04 3.30 2.02 1.01 32.8
.41 1.57 2.22 3.73 4.21 5.40 4.68 3.10 1.06 .79 .24 27.92
.19 .54 2.18 2.10 4.74 5.41 5.57 4.63 2.52 1.60 .87 .38 30.73
.54 .59 1.55 1.95 3.84 5.38 7.03 5.87 3.49 1.54 .78 .13 32.69
.17 .46 1.77 2.03 4.72 5.75 6.04 4.74 3.70 2.32 .87 .33 32.701921 .56 .50 1.36 3.24 4.87 5.44 7.50 4.93 3.50 1.92 .47 .28 34.571922 .49 .67 1.28 2.51 4.49 6.26 5.96 5.20 3.54 2.25 .61 .38 33.641923 .40 .48 1.24 2.67 4.24 5.67 6.02 4.16 2.61 1.49 .72 .48 30.181924 .41 .45 .71 2.66 3.92 4.78 5.88 4.11 2.68 2.59 .97 .26 29.42
1925 .30 .63 1.93 3.09 4.44 5.75 5.51 5.16 2.87 .92 .72 .30 31.621926 .33 .39 .94 2.47 4.83 5.37 5.66 3.97 1.81 1.40 .53 .29 27.991927 .26 .86 1.44 2.38 2.93 5.11 5.71 3.91 3.18 2.07 .60 .34 28.791928 .42 .60 1.61 2.44 4.77 3.86 5.12 4.57 3.44 1.79 .64 .30 29.561929 .21 .42 1.61 2.55 3.65 4.17 5.56 4.47 3.06 1.59 .73 .11 28.73
1930 .22 .77 1.55 2.85 4.62 5.63 6.40 4.73 3.10 1.66 .88 .31 33.321931 .44 .76 .85 3.19 3.71 5.27 6.43 5.47 3.43 1.96 .90 .45 32.861932 .29 .82 1.09 2.99 4.26 5.08 6.17 4.89 3.40 1.27 .65 .32 31.231933 .61 .81 1.08 2.06 2.95 6.69 6.70 5.37 3.14 1.97 .72 .34 32.441934 .53 .59 1.30 2.87 6.59 5.88 6.24 5.29 2.31 2.23 .85 .18 34.86
1935 .33 .36 1.65 2.18 2.99 4.15 5.90 4.72 3.58 1.95 .47 .23 28.511936 .19 .36 1.83 2.35 5.49 5.28 7.05 5.18 3.05 1.13 .86 .50 33.871937 .26 .65 1.27 2.03 4.50 4.79 6.57 5.55 3.66 1.59 .99 .19 32.051938 .26 .43 1.89 3.08 3.75 4.97 5.46 5.43 2.78 2.63 1.25 .37 32.301939 .25 .65 1.80 2.39 3.57 5.22 6.06 5.41 4.18 2.32 1.01 .59 33.45
1940 .18 .39 .96 2.49 2.87 5.04 6.47 3.48 3.52 2.11 .76 .23 28.501941 .22 .51 1.12 2.80 5.13 4.78 6.17 5.29 3.71 1.60 .81 .32 32.461942 .43 .41 1.27 4.00 3.83 3.64 5.67 4.31 2.63 1.88 .69 .04 28.801943 .24 .89 1.57 3.31 3.44 6.14 6.26 4.91 3.19 2.24 .76 .58 33.531944 .49 .57 .91 2.25 4.08 5.82 7.00 5.30 3.48 2.34 .66 .18 33.08
1945 .11 .52 2.40 2.96 3.36 4.36 5.88 5.13 2.58 2.22 .73 .19 30.441946 .31 .57 1.83 3.80 3.70 5.02 6.70 5.38 4.10 2.45 .93 .47 35.261947 .40 .46 1.24 1.91 3.32 4.58 6.33 6.13 3.65 2.48 .60 .26 31.361948 .38 .77 1.43 3.30 4.29 4.85 6.29 5.91 4.00 2.22 .92 .62 34.981949 .57 .68 1.81 3.77 5.16 6.18 5.66 5.45 3.56 2.53 1.09 .60 37.06
1950 .63 .68 1.31 1.97 5.67 6.35 6.49 5.28 3.18 2.71 .91 .33 35.511951 .48 .60 1.59 2.17 4.99 4.68 5.67 4.05 3.43 2.09 .85 .49 31.091952 .52 .90 1.45 3.48 3.30 5.95 6.44 4.72 3.98 2.67 1.40 .46 35.271953 .45 1.00 1.52 2.24 4.51 6.83 6.65 6.28 4.82 3.06 1.49 .78 39.631954 .62 1.26 1.77 2.96 4.73 6.42 6.48 4.63 4.43 1.91 1.11 .58 36.90
1955 .67 .75 2.18 4.21 5.53 5.76 7.41 6.48 4.48 2.36 .95 .58 41.361956 .62 .76 1.65 2.90 4.55 6.89 5.49 5.11 4.20 3.09 1.03 .42 36.711957 .40 .84 1.83 2.43 3.81 5.85 6.57 5.18 3.40 1.78 .97 .76 33.821958 .54 .72 1.51 3.50 6.44 4.66 4.92 5.67 3.58 2.92 1.23 .47 36.161959 .42 .71 1.75 2.95 4.82 6.09 5.72 4.99 3.76 1.78 .94 .65 34.58
1960 .50 .59 1.25 3.90 4.29 4.74 5.62 4.43 3.26 2.24 1.19 .67 32.681961 .59 .73 1.56 2.27 4.78 6.85 6.25 5.57 3.72 2.38 .98 .44 36.121962 .30 .42 1.23 3.52 6.24 6.26 5.88 5.32 3.31 2.03 .95 .52 35.98
AVERAGE .38 .62 1.47 2.77 4.35 5.39 6.09 4.97 3.35 2.02 .86 .38 32.66
26
1920
1911 19121913 1914
19151916 191719181919
.51
20.36

Table 11. Monthly Lake Evaporation in Inches at Moline
YEAR JAN FEB MAR APR MAY JUN JUL AUG SEP OCT NOV DEC TOTAL
1911 .08 .63 2.28 2.86 6.27 6.64 7.08 5.22 2.38 .98 .38 .26 35.061912 .01 .26 .95 2.55 5.20 5.96 6.47 4.69 2.98 2.64 1.09 .57 33.371913 .29 .61 1.49 3.80 4.80 6.45 7.58 4.99 3.25 1.50 .71 .18 35.651914 .24 .38 1.45 3.18 5.95 5.82 7.15 6.00 3.47 1.71 1.21 .03 36.59
1915 .08 .45 1.43 4.64 3.85 5.24 4.99 4.40 2.79 2.09 .79 .07 30.821916 .27 .54 1.54 3.26 4.75 5.51 7.92 5.81 3.46 2.24 1.00 .38 36.681917 .32 .48 1.74 2.44 4.16 4.28 6.62 5.41 3.11 1.45 .83 .11 30.951918 .14 .72 2.59 2.78 5.49 5.43 6.21 5.27 2.76 1.78 .80 .30 34.271919 .47 .60 1.66 2.35 3.66 5.46 7.62 5.17 3.72 1.64 .85 .02 33.22
1920 .22 .51 1.92 1.99 4.81 6.62 6.85 5.43 3.81 2.24 .63 .27 35.301921 .55 .65 1.67 3.52 5.54 6.12 7.50 4.73 3.72 2.44 .51 .41 37.361922 .65 .89 1.33 2.44 4.38 6.56 5.77 5.46 4.03 2.74 .81 .46 35.521923 .27 .56 1.45 3.05 4.37 5.65 6.42 4.25 2.53 2.04 .91 .49 31.991924 .19 .37 .59 2.97 3.45 3.68 5.34 4.92 3.00 2.94 .99 .21 28.65
1925 .22 .50 1.83 3.02 5.07 5.43 6.04 5.64 2.77 .84 .77 .09 32.221926 .31 .53 1.08 3.04 5.12 5.39 5.07 3.94 1.83 1.03 .40 .17 27.911927 .18 .80 1.21 1.79 2.39 4.96 5.85 4.72 3.55 2.16 .59 .26 28.461928 .44 .67 2.09 3.16 6.00 4.33 6.33 5.52 3.69 2.00 .80 .41 35.441929 .07 .36 1.93 3.55 4.75 6.16 6.37 5.67 3.51 2.00 .84 .27 35.48
1930 .17 .87 2.34 3.86 4.96 5.76 7.03 4.74 4.35 1.82 1.29 .33 37.521931 .55 .98 1.37 3.46 4.35 6.65 7.74 5.64 3.89 1.95 .93 .45 37.961932 .45 .86 1.19 2.96 5.54 5.66 7.18 4.51 4.15 1.61 .90 .46 35.471933 .75 .91 1.35 2.86 3.59 7.87 6.98 5.05 3.98 2.04 1.06 .32 36.761934 .53 .83 1.74 4.04 7.56 7.76 6.73 5.10 2.52 2.80 1.05 .12 40.78
1935 .29 .50 1.68 2.63 3.08 4.37 7.29 5.89 3.48 2.05 .50 .19 31.951936 .18 .30 2.07 3.32 6.13 6.50 8.68 6.76 3.22 1.92 .97 .59 40.641937 .26 .61 1.58 2.22 4.93 5.94 7.36 5.70 4.32 1.63 1.14 .16 35.851938 .21 .56 2.32 3.72 4.19 5.72 6.53 5.38 3.31 2.92 1.33 .48 36.671939 .35 .76 2.27 2.94 6.10 5.72 6.46 4.71 4.75 2.59 1.23 .81 38.69
1940 .18 .46 1.26 3.13 4.27 6.13 7.51 3.93 4.24 2.55 .80 .22 34.681941 .21 .57 1.77 3.25 6.18 5.11 6.53 5.11 3.88 1.61 .88 .38 35.481942 .33 .43 1.40 4.31 4.07 4.71 6.30 4.87 2.89 2.31 .86 .05 32.531943 .11 .78 1.64 3.48 3.39 4.44 6.65 4.29 2.84 2.17 .76 .56 31.111944 .61 .54 .99 2.27 4.11 5.24 6.47 5.43 2.75 2.47 .56 .16 31.60
1945 .19 .52 2.69 3.42 3.66 4.44 6.67 5.34 2.76 2.07 .85 .20 32.811946 .45 .87 1.95 4.28 4.04 5.83 6.94 4.90 4.15 2.31 .98 .62 37.321947 .52 .53 1.34 2.20 4.01 4.24 6.81 6.73 4.18 2.48 .63 .35 34.021948 .43 .59 1.67 4.14 4.42 4.83 6.12 5.75 3.85 2.12 .71 .51 35.141949 .26 .68 1.58 3.76 5.05 5.82 6.63 5.32 2.95 2.19 1.21 .62 36.07
1950 .54 .60 1.20 2.27 4.80 5.78 5.58 3.92 2.62 2.57 .84 .34 31.061951 .34 .47 1.26 2.39 4.92 3.56 5.40 4.27 3.03 1.75 .76 .45 28.601952 .49 .66 1.23 3.54 4.04 6.53 6.53 4.67 3.87 2.42 1.31 .30 35.591953 .30 .76 1.37 2.09 4.16 6.10 6.51 5.75 4.32 2.58 1.22 .52 35.681954 .52 .94 1.52 2.91 4.11 5.89 6.06 4.14 3.47 1.57 .84 .40 32.37
1955 .43 .63 1.87 3.99 5.01 4.44 7.40 6.32 4.46 2.06 1.03 .58 38.221956 .51 .61 1.90 3.40 4.97 6.47 5.67 5.30 4.01 2.91 .95 .30 37.001957 .39 .71 1.88 2.44 3.58 4.93 5.70 4.49 3.03 1.86 .79 .69 30.491958 .34 .66 1.52 3.18 5.46 4.64 4.87 5.37 3.43 2.78 1.30 .52 34.071959 .45 .72 1.72 3.29 4.50 5.87 5.97 5.25 3.44 1.41 .79 .46 33.87
1960 .53 .53 .85 3.30 3.32 4.25 6.40 4.95 3.56 1.94 1.22 .69 31.541961 .57 .71 1.68 2.42 4.93 6.54 5.77 5.25 3.46 2.15 .91 .39 34.781962 .54 .59 1.35 3.63 5.07 6.11 4.59 5.19 3.37 1.83 .96 .73 33.96
AVERAGE .35 .62 1.61 3.11 4.66 5.57 6.50 5.14 3.44 2.07 .89 .36 34.33
27

Table 12. Monthly Lake Evaporation in Inches at Peoria
YEAR JAN FEB MAR APR MAY JUN JUL AUG SEP OCT NOV DEC TOTAL
1911 .14 .60 2.07 2.34 6.30 6.50 6.99 5.07 2.55 1.13 .55 .23 34.411912 .23 .34 .91 3.40 4.90 5.62 5.59 3.99 2.64 1.75 1.06 .61 31.041913 .16 .44 1.11 3.02 3.97 5.85 6.58 4.85 2.63 1.05 .73 .17 30.561914 .06 .32 1.23 3.18 5.74 5.92 6.53 4.75 2.74 1.58 1.20 .04 33.29
1915 .04 .49 1.22 4.23 3.55 4.45 4.23 3.16 2.63 2.09 .99 .15 27.231916 .07 .31 1.37 3.00 3.57 5.14 7.48 5.42 2.88 1.86 .99 .35 32.441917 .54 .71 2.32 2.68 4.35 5.45 6.74 5.36 3.39 1.35 .85 .23 33.971918 .11 .72 2.85 2.53 5.39 5.79 5.96 4.85 2.75 1.90 .84 .42 34.111919 .49 .53 1.73 2.51 3.63 5.77 7.35 5.58 3.91 1.66 .90 .06 34.12
1920 .20 .65 2.17 2.04 4.45 5.85 6.30 4.65 3.69 2.36 .68 .33 33.371921 .50 .65 1.97 3.48 5.44 5.71 7.15 4.59 3.33 2.34 .43 .24 35.831922 .35 .84 1.18 2.82 4.63 6.51 6.41 5.62 4.10 2.40 .67 .38 35.911923 .40 .44 1.41 2.82 4.41 5.40 6.84 4.72 2.20 1.89 .84 .44 31.811924 .28 .39 .58 3.45 3.46 4.44 5.61 4.68 2.84 2.78 1.06 .18 29.75
1925 .30 1.11 2.35 4.16 5.38 6.00 6.28 5.36 3.17 .91 .85 .30 36.181926 .34 .60 1.15 2.77 5.72 5.89 6.47 4.39 2.05 1.56 .58 .23 31.751927 .30 .99 1.82 2.54 3.48 5.63 6.16 5.00 3.33 2.32 .70 .32 32.591928 .44 .78 2.27 3.56 6.02 4.62 6.45 5.42 3.47 1.98 .73 .38 36.121929 .17 .49 2.24 3.04 4.04 5.54 5.85 4.48 3.16 1.82 .78 .12 31.73
1930 .17 1.06 2.27 4.08 5.06 6.21 7.39 5.56 4.24 2.06 .90 .36 39.361931 .58 .81 1.18 3.59 4.11 6.20 6.87 5.38 3.98 2.12 1.09 .48 36.391932 .46 1.08 1.38 3.30 5.65 5.96 6.63 5.07 3.93 1.99 .99 .47 36.911933 .91 .94 1.53 3.03 3.42 7.56 7.32 5.19 3.80 2.10 1.29 .45 37.541934 .57 .87 1.64 3.97 6.96 7.14 6.75 5.01 2.50 2.79 1.14 .16 39.50
1935 .36 .49 1.57 2.45 2.55 4.25 6.73 5.29 3.55 2.00 .53 .23 30.001936 .24 .42 2.27 3.37 5.96 6.63 8.35 6.59 3.31 1.87 1.07 .57 40.651937 .23 .68 1.50 2.30 5.20 5.55 7.01 5.94 4.27 1.96 1.06 .09 35.791938 .36 .51 2.18 3.86 3.71 5.28 6.14 5.55 3.53 3.09 1.30 .44 35.951939 .35 .58 2.15 2.63 6.15 5.50 5.80 5.03 4.80 2.69 1.06 .67 37.41
1940 .16 .44 1.54 3.04 3.74 5.96 7.02 4.01 4.13 2.76 .94 .24 33.981941 .25 .69 1.59 3.10 5.87 5.40 6.69 5.54 3.43 1.42 .93 .44 35.351942 .43 .38 1.45 3.95 4.37 4.44 5.90 5.18 2.89 1.95 .66 .06 31.661943 .13 .88 1.47 2.99 2.92 4.61 5.97 4.10 3.25 2.32 .87 .52 30.031944 .73 .61 1.07 2.12 4.23 6.31 6.48 4.30 3.40 2.55 .50 .18 32.48
1945 .16 .43 2.27 3.05 3.13 3.30 5.59 5.24 2.76 2.38 .88 .28 29.471946 .53 .99 2.27 3.86 3.27 5.15 6.40 3.87 4.33 2.66 1.05 .59 34.971947 .58 .84 1.74 2.61 4.17 4.19 6.86 6.57 4.28 2.57 .65 .38 35.441948 .48 .71 1.53 4.19 4.98 5.22 5.44 5.76 4.05 2.41 .88 .74 36.391949 .69 .79 2.51 4.25 5.98 6.05 6.37 6.19 4.04 2.75 1.94 1.01 42.57
1950 .81 .85 1.75 3.13 5.89 6.72 6.59 4.76 3.25 3.28 1.21 .60 38.841951 .70 .76 1.76 3.10 6.13 4.41 6.06 4.94 3.60 2.48 1.14 .76 35.841952 .76 1.01 1.78 4.16 4.76 7.17 6.79 5.17 4.67 3.40 2.03 .69 42.391953 .53 1.33 2.02 3.35 7.49 7.31 5.10 6.60 5.42 3.55 1.81 1.02 45.591954 .84 1.18 2.16 4.30 5.29 6.90 7.39 4.95 4.88 2.51 1.33 .65 42.38
1955 .66 .93 2.39 4.86 5.69 5.88 7.77 7.22 4.70 2.90 1.49 .93 45.421956 .80 .64 2.83 4.01 6.10 6.83 5.60 6.06 5.02 3.97 1.50 .61 44.031957 .50 1.02 2.31 2.78 4.48 5.86 6.73 5.85 3.99 2.53 1.31 1.01 38.431958 .70 .98 1.79 3.76 6.28 5.18 4.55 5.44 3.89 3.52 1.65 .70 38.441959 .83 .95 2.22 3.71 5.09 6.52 6.85 5.43 4.35 1.92 1.06 .79 39.72
1960 .73 .73 1.19 3.88 3.51 4.77 6.19 5.40 3.73 2.53 1.50 .80 34.961961 .90 .91 1.93 3.00 4.90 6.30 5.68 5.20 3.60 2.27 1.15 .44 36.281962 .60 .61 1.23 3.86 5.21 6.02 5.09 5.81 3.69 2.08 1.26 .64 36.10
AVERAGE .44 .72 1.78 3.29 4.82 5.71 6.41 5.19 3.59 2.27 1.03 .45 35.70
28

Table 13. Monthly Lake Evaporation in Inches at Urbana
YEAR JAN FEB MAR APR MAY JUN JUL AUG SEP OCT NOV DEC TOTAL
1930 .12 .59 1.71 3.28 4.45 5.13 4.94 4.10 3.15 1.37 .64 .14 29.621931 .17 .44 .85 2.96 3.10 3.72 5.56 5.21 3.47 1.69 .87 .17 28.211932 .34 .71 .99 3.17 4.69 5.27 5.98 4.57 3.15 1.66 .31 .10 30.941933 .47 .74 1.16 2.43 3.06 6.78 6.45 4.85 3.55 1.95 .95 .15 32.54
1934 .37 .23 1.42 3.12 5.88 6.58 6.24 4.79 1.88 2.39 .89 .08 33.871935 .38 .41 1.35 1.79 2.05 3.73 5.38 4.79 3.32 1.62 .19 .56 25.571936 .13 .24 1.52 2.16 4.50 6.27 6.98 5.57 3.01 1.64 .89 .20 33.111937 .13 .60 1.01 1.74 3.85 4.33 4.65 4.59 3.81 1.59 .66 .09 27.051938 .19 .32 1.63 3.18 3.44 4.81 5.05 4.28 3.34 2.71 .87 .15 29.97
1939 .20 .60 1.62 2.23 5.23 4.50 5.03 4.61 4.32 2.24 .92 .30 31.801940 .09 .31 1.23 2.16 3.30 5.56 6.46 4.52 3.75 2.54 .68 .24 30.841941 .15 .25 .95 2.92 4.08 4.44 5.18 5.43 2.95 1.11 .60 .15 28.211942 .25 .16 1.16 3.16 2.80 2.52 3.99 3.37 1.92 1.58 .53 .18 21.621943 .13 .95 1.46 2.54 1.97 3.81 5.13 3.57 2.21 1.93 .65 .27 24.62
1944 .53 .38 .82 1.89 2.61 5.36 6.04 4.25 2.43 2.20 .85 .05 27.411945 .09 .35 1.60 2.43 3.91 2.32 5.14 4.58 1.79 2.00 .67 .15 25.031946 .21 .48 1.31 1.86 2.55 3.21 5.33 3.06 3.12 1.62 .78 .47 24.001947 .30 .60 1.25 1.95 4.10 3.93 5.86 5.59 3.53 1.98 .35 .15 29.591948 .14 .46 .93 3.18 4.82 5.16 5.19 5.45 3.45 2.02 .71 .69 32.20
1949 .45 .98 1.99 3.27 4.93 5.52 5.61 4.90 3.26 1.96 1.17 .53 34.571950 .41 .45 1.08 1.90 4.15 4.76 5.01 3.62 2.34 2.32 .95 .12 27.111951 .34 .39 1.18 1.30 3.96 3.44 4.91 3.95 2.17 1.39 .35 .34 23.721952 .42 .90 1.43 2.91 3.25 5.85 5.72 4.28 3.94 2.59 1.15 .25 32.691953 .30 1.06 1.40 2.71 3.81 6.17 5.90 5.54 4.64 2.83 1.21 .68 36.25
1954 .57 1.21 1.75 3.55 4.74 5.76 6.54 4.35 4.47 1.82 1.25 .77 36.781955 .16 1.01 1.78 4.25 4.45 4.54 5.80 5.72 4.05 2.05 .79 .55 35.151956 .67 .82 2.32 3.02 5.54 6.43 5.19 4.98 4.19 3.05 1.12 .38 37.711957 .31 .74 1.76 2.15 4.18 4.75 6.00 5.52 3.47 2.15 1.05 .63 32.711958 .48 .94 1.21 3.20 5.05 4.53 4.33 5.55 3.55 2.90 1.33 .53 33.60
1959 .50 .76 1.91 3.07 4.38 5.97 5.92 5.02 3.89 1.69 .85 .51 34.471960 .48 .61 1.02 3.25 3.26 4.14 5.65 4.95 3.92 2.22 1.18 .52 31.201961 .66 .72 1.56 2.35 4.31 5.12 5.11 5.04 3.79 1.93 .88 .49 31.961962 .11 .67 1.49 3.41 5.52 5.69 5.14 4.89 3.24 1.74 .73 .33 32.96
AVERAGE .31 .61 1.39 2.68 4.00 4.85 5.50 4.71 3.31 2.01 .82 .33 30.52
29

Table 14. Monthly Lake Evaporation in Inches at Indianapolis
YEAR JAN FEB MAR APR MAY JUN JUL AUG SEP OCT NOV DEC TOTAL
.37 .63 1.67 2.43 5.72 6.10 6.18 4.77 3.13 2.15 .67 .46 34.28
.30 .57 1.07 2.91 4.69 4.98 4.04 3.64 3.66 2.01 1.04 .63 29.54
.39 .65 1.52 2.79 4.31 5.87 5.71 4.90 2.63 1.61 .82 .41 31.61
.39 .49 1.30 2.39 5.17 5.24 5.81 4.29 3.30 1.52 1.17 .17 31.24
1915 .36 .78 1.28 3.62 3.50 4.95 4.80 2.80 2.91 2.12 1.05 .30 28.471916 .44 .51 1.41 2.34 4.01 4.06 6.55 4.93 3.51 2.09 1.21 .41 31.471917 .46 .52 1.55 2.20 3.48 5.05 5.54 4.21 3.32 1.25 .85 .28 28.711918 .21 .75 2.20 2.21 5.24 5.54 5.50 4.50 2.61 3.14 .78 .39 33.071919 .64 .61 1.76 2.53 3.22 5.40 6.52 4.83 3.67 1.63 .74 .30 31.85
1920 .25 .50 1.80 1.83 4.23 5.28 5.45 4.01 3.36 2.52 .73 .34 30.301921 .50 .60 1.61 2.95 5.09 5.31 6.58 4.36 2.63 1.93 .65 .39 32.601922 .47 .68 1.23 2.66 4.43 5.08 5.81 5.36 4.15 2.32 .90 .42 33.511923 .44 .24 1.54 2.75 3.89 5.23 5.58 4.21 2.63 1.83 .86 .48 29.681924 .38 .49 .74 2.96 3.38 4.60 5.47 4.66 2.61 2.66 .94 .29 29.18
1925 .45 .85 1.97 3.32 4.65 5.50 5.50 4.88 3.46 .85 .76 .36 32.551926 .40 .58 .97 2.19 4.93 4.70 5.43 3.82 2.24 1.54 .64 .28 27.721927 .32 .80 1.51 2.22 3.22 4.67 5.52 3.95 3.81 2.44 .76 .43 29.651928 .46 .61 1.48 2.68 4.55 3.13 5.56 5.05 3.65 2.06 .77 .51 30.511929 .43 .58 1.94 3.13 3.75 5.61 5.72 4.93 3.14 1.70 .73 .33 31.99
1930 .26 1.06 1.64 3.16 4.66 5.47 6.44 4.30 3.22 1.98 .83 .37 33.391931 .52 .86 .87 3.17 3.68 5.19 6.54 4.50 3.48 1.76 .89 .48 31.941932 .55 .90 1.06 2.79 4.73 5.55 6.06 4.86 3.22 1.70 .68 .40 32.501933 .68 .83 1.26 2.56 3.60 6.93 5.94 4.89 3.17 1.83 .72 .44 32.851934 .51 .54 1.49 3.17 5.56 5.95 5.98 3.94 2.55 2.44 .97 .31 33.41
1935 .53 .58 1.71 2.16 2.94 4.15 5.29 4.03 3.56 1.72 .50 .24 27.411936 .29 .39 1.96 2.42 5.39 6.06 6.57 5.85 3.18 1.71 .78 .51 35.111937 .29 .59 1.40 2.20 4.23 4.69 5.81 5.21 3.43 1.49 .74 .21 30.291938 .39 .53 1.67 3.26 3.85 5.06 5.57 4.98 3.28 2.45 .98 .39 32.411939 .38 .68 1.84 2.71 5.32 4.93 5.36 4.91 4.07 2.15 .74 .39 33.48
1940 .12 .38 1.08 1.99 3.03 5.17 6.24 4.65 3.50 2.35 .53 .22 29.261941 .26 .43 1.35 3.26 4.97 4.72 6.02 5.09 3.60 1.41 .78 .33 32.221942 .43 .41 1.06 3.33 3.49 4.24 5.37 3.95 2.82 1.76 .71 .13 27.701943 .26 .81 1.41 2.35 3.05 5.29 5.34 4.48 2.48 1.76 .71 .49 28.431944 .59 .61 1.27 2.40 4.29 5.83 6.24 4.75 3.12 2.06 .56 .18 31.90
1945 .27 .60 2.15 2.58 3.33 3.90 5.45 4.75 2.59 1.81 .70 .20 28.331946 .43 .72 1.95 3.04 3.69 5.21 6.04 4.15 3.42 2.24 .87 .55 32.311947 .42 .54 1.28 2.43 3.90 4.33 5.19 5.26 3.39 2.37 .61 .44 30.161948 .28 .61 1.28 2.59 4.02 5.29 5.04 5.00 2.97 1.49 .69 .45 29.71
1949 .36 .72 1.36 2.63 4.49 4.90 4.84 4.16 2.95 1.97 .93 .68 29.991950 .43 .36 1.15 2.01 3.99 4.56 4.87 3.95 2.37 1.95 .55 .28 26.471951 .37 .22 1.12 1.96 4.80 3.69 4.43 3.86 2.35 1.66 .50 .28 25.241952 .30 .60 1.14 2.30 3.19 5.19 5.34 3.94 3.28 1.88 .77 .29 28.221953 .30 .82 1.23 1.73 3.44 5.31 5.30 4.50 3.53 2.09 .96 .55 29.761954 .40 .88 1.36 2.87 3.64 5.17 5.90 3.73 3.13 1.21 .58 .30 29.17
1955 .35 .57 1.57 2.68 3.81 3.66 4.67 4.51 3.09 1.60 .70 .44 27.651956 .40 .56 1.67 2.15 4.09 4.85 4.10 4.10 3.25 2.13 .83 .39 28.521957 .25 .52 1.39 1.90 3.75 4.45 5.18 5.48 2.49 1.58 .78 .51 28.281958 .39 .72 .72 2.26 3.70 3.55 3.48 4.12 2.46 2.06 .77 .38 24.611959 .39 .64 1.33 2.44 3.37 4.92 4.96 4.00 3.07 1.44 .65 .34 27.55
1960 .48 .46 1.19 2.82 2.79 4.00 4.58 3.93 2.69 1.57 .81 .35 25.671961 .45 .62 1.08 1.71 3.42 4.28 4.01 3.47 3.02 1.62 .52 .27 24.471962 .30 .47 .96 2.66 4.20 4.95 4.39 3.98 2.56 2.60 1.55 .96 29.58
AVERAGE .39 .61 1.41 2.57 4.07 4.96 5.46 4.45 3.11 1.91 .79 .38 30.11
30
1911191219131914

Table 15. Monthly Lake Evaporation in Inches at Springfield
YEAR JAN FEB MAR APR MAY JUN JUL AUG SEP OCT NOV DEC TOTAL
.33 .78 2.18 2.51 6.19 6.41 6.42 4.74 2.23 1.49 .68 .32 34.28
.23 .52 1.01 3.30 5.09 5.40 5.54 4.63 3.44 2.37 1.32 .87 33.72
.32 .56 1.53 3.21 4.71 6.69 6.80 5.87 3.31 1.53 .88 .27 35.68
.40 .43 1039 2.70 5.69 6.30 6.79 5.08 3.24 1.84 1.47 .09 35.42
.16 .69 1.34 4.45 3.97 5.15 5.09 3.54 3.06 2.70 1.33 .34 31.82
.36 .50 1.62 2.61 4.39 5.20 7.20 5.07 3.44 1.94 1.24 .48 34.05
.62 .75 2.39 2.95 4.00 5.48 6.56 4.69 3.60 1.66 1.02 .36 34.08
.25 .86 2.90 2.08 5.39 5.91 6.25 5.11 3.06 1.91 .99 .44 35.15
.81 .77 1.86 2.93 3.63 6.11 7.31 5.58 4.29 1.66 .95 .24 36.14
.35 .80 2.28 2.30 4.60 6.33 6.66 4.49 3.97 2.44 .89 .38 35.49
.60 .80 2.25 3.34 5.50 6.19 6.91 4.44 3.23 2.58 .69 .38 36.911922 .63 1.06 1.48 3.00 4.95 6.87 6.14 5.58 4.29 2.62 .92 .49 38.031923 .52 .53 1.66 3.25 4.78 5.86 6.67 4.90 2.37 2.01 .95 .43 33.981924 .32 .53 .86 3.56 3.42 4.42 5.31 5.17 3.11 3.03 1.08 .24 31.05
1925 .42 .80 2.41 3.99 5.11 6.04 5.91 5.16 3.47 1.02 .89 .31 35.531926 .33 .61 1.19 2.65 5.24 5.46 6.46 4.56 2.22 1.64 .69 .35 31.401927 .34 1.02 1.67 2.56 3.53 5.13 6.27 4.32 3.18 2.57 .81 .29 31.691928 .43 .58 1.96 2.90 5.60 4.47 6.35 5.28 3.51 2.06 .61 .52 34.271929 .27 .48 2.16 3.26 3.94 4.85 5.92 5.01 3.19 1.85 .61 .17 31.71
1930 .20 1.05 2.02 3.57 5.14 5.84 7.12 5.82 3.73 1.94 1.19 .50 38.121931 .67 .94 1.28 3.54 3.95 6.13 6.88 4.96 4.06 2.20 1.19 .50 36.301932 .45 1.04 1.47 3.20 5.73 6.25 6.73 5.55 4.03 2.14 .86 .49 37.991933 .81 1.06 1.60 2.94 3.64 7.84 7.39 5.43 4.11 2.28 1.31 .44 38.851934 .56 .83 1.67 4.09 6.83 7.44 7.10 4.72 2.46 3.05 1.28 .19 40.22
1935 .44 .56 1.65 2.44 2.86 4.81 6.88 5.79 3.98 2.19 .46 .18 32.241936 .11 .31 2.04 3.04 5.95 6.66 8.08 6.71 3.35 2.06 1.25 .64 40.201937 .34 .81 1.85 2.45 4.82 5.43 6.66 5.57 4.28 2.09 1.11 .19 35.601938 .41 .63 2.21 3.57 4.28 5.63 6.69 5.62 4.17 3.61 1.57 .62 39.011939 .49 .63 2.51 2.64 5.73 4.94 5.66 5.14 5.25 3.00 1.04 .68 37.71
1940 .61 .32 1.31 2.36 3.73 5.57 7.06 4.63 4.65 3.15 .95 .37 34.711941 .22 .65 1.75 2.94 5.84 5.48 6.67 5.31 3.62 1.51 1.03 .55 35.571942 .57 .36 1.77 3.92 3.84 4.10 5.69 5.09 3.14 2.33 .85 .12 31.781943 .27 1.24 1.90 3.00 2.95 4.77 5.97 5.49 3.57 2.43 1.09 .35 33.031944 .59 .81 1.26 2.20 4.17 6.09 7.06 5.17 3.44 2.70 .51 .18 34.18
1945 .20 .55 2.28 2.80 3.34 3.42 6.19 5.56 2.59 2.44 .84 .25 30.461946 .60 1.04 3.11 3.87 3.33 5.99 6.31 3.77 4.32 2.74 .96 .63 36.671947 .50 .82 1.51 2.24 4.70 4.69 6.81 6.69 4.37 2.61 .55 .33 35.821948 .48 .63 1.41 3.92 4.99 5.29 5.31 5.49 3.54 2.12 .69 .67 34.541949 .81 .88 1.95 3.30 5.62 6.14 6.02 5.09 3.42 2.05 1.56 .83 37.67
1950 .67 .69 1.57 2.55 4.81 5.48 5.35 3.76 2.80 2.87 1.12 .58 32.251951 .61 .77 1.44 2.45 4.79 4.34 5.86 5.00 3.16 2.11 1.00 .63 32.161952 .66 .97 1.67 3.30 4.17 6.76 6.47 5.20 4.52 3.24 1.73 .62 39.311953 .45 1.26 1.82 3.19 4.46 7.91 6.81 6.17 5.07 3.26 1.73 1.06 43.191954 .82 1.47 2.06 3.98 5.18 6.47 7.39 4.92 4.75 2.34 1.06 .56 41.00
1955 .48 .94 2.19 4.23 5.00 5.42 6.60 6.44 4.66 2.38 1.27 .74 40.351956 .54 .76 2.57 3.50 5.90 6.46 5.31 5.06 4.60 3.43 1.38 .44 39.951957 .43 .96 2.06 2.42 4.60 5.07 6.27 5.82 3.69 2.30 1.22 .96 35.801958 .77 1.08 1.43 3.56 5.50 4.99 4.65 5.64 3.81 2.98 1.55 .71 36.67
1959 .58 .84 2.21 3.54 4.72 6.54 6.13 5.07 4.07 1.68 1.19 .66 37.231960 .65 .71 1.06 3.82 3.65 4.43 5.75 5.33 4.24 2.53 1.59 .77 34.531961 .89 .86 1.98 2.64 4.77 5.57 5.54 4.79 3.81 2.34 1.14 .72 35.051962 .56 .76 1.54 3.63 5.94 5.87 5.27 5.30 3.50 2.25 1.17 .76 36.55
AVERAGE .48 .78 1.81 3.12 4.71 5.69 6.35 5.18 3.67 2.33 1.07 .48 35.68
31
19151916191719181919
1920
1911191219131914
1921

Table 16. Monthly Lake Evaporation in Inches at St. Louis
YEAR JAN FEB MAR APR MAY JUN JUL AUG SEP OCT NOV DEC TOTAL
1911 .63 1.03 2.43 2.83 6.19 5.95 6.23 4.50 3.14 1.57 .91 .54 35.951912 .41 .59 1.23 3.26 5.50 4.85 5.61 4.74 3.55 2.44 1.50 1.02 34.701913 .62 .88 1.81 3.40 4.64 5.98 5.76 5.87 3.33 1.89 1.28 .62 36.081914 .91 .77 1.91 2.88 5.79 6.75 5.95 4.46 3.02 1.70 1.54 .31 35.99
1915 .55 .94 1.37 4.57 4.10 4.56 5.09 3.50 3.57 2.99 1.67 .60 33.511916 .65 .88 2.08 2.72 4.99 4.97 6.93 4.99 3.59 2.33 1.63 .73 36.491917 .87 .84 2.28 3.09 4.49 5.95 6.11 5.13 3.44 1.85 1.19 .42 35.661918 .34 1.06 2.95 2.28 5.09 4.97 5.61 5.12 3.04 2.21 1.14 .85 34.661919 1.10 1.15 2.30 3.22 2.86 5.17 6.72 5.38 4.09 1.57 1.20 .49 35.25
1920 .61 .83 2.43 2.43 3.76 5.53 6.11 4.37 3.67 2.82 1.11 .79 34.461921 .96 1.26 2.58 3.57 5.36 5.70 6.72 4.70 2.87 2.80 1.06 .75 38.331922 .68 1.06 1.60 3.33 5.13 5.52 5.40 5.12 4.20 2.60 1.30 .74 36.681923 .88 .83 2.04 3.59 4.14 5.23 5.62 4.30 2.46 1.95 1.25 .83 33.121924 .59 .98 1.19 3.40 3.04 3.48 4.56 5.12 2.66 2.74 1.37 .55 29.68
1925 .70 1.10 2.70 3.94 4.70 5.44 5.67 5.31 3.24 .98 1.07 .61 35.461926 .73 1.04 1.46 3.03 5.41 5.04 5.95 4.69 2.52 1.77 .87 .49 33.001927 .54 1.12 1.70 2.23 3.42 4.41 5.57 3.72 3.73 2.70 .97 .61 30.721928 .83 .98 1.90 2.63 4.88 3.73 5.55 4.23 3.59 2.33 1.01 .78 32.441929 .51 .67 2.06 2.98 3.34 4.73 4.75 4.65 2.95 1.97 .90 .63 30.14
1930 .43 1.32 2.52 4.03 4.76 5.65 7.08 4.85 3.24 2.16 1.31 .69 38.041931 .85 1.12 1.50 3.57 4.17 6.13 5.86 4.72 4.02 2.15 1.29 .74 36.121932 .77 1.34 1.79 3.70 5.62 5.23 6.25 4.82 3.41 2.30 1.03 .63 36.891933 1.10 1.13 1.80 2.70 3.56 6.97 5.86 4.80 3.70 2.15 1.24 .76 35.771934 .82 .98 1.68 3.52 6.16 6.20 6.63 4.25 2.19 2.79 1.39 .50 37.11
1935 .66 .89 1.83 2.37 2.42 4.06 5.66 4.66 3.76 1.77 .73 .48 29.291936 .43 .61 2.81 3.05 5.64 6.57 7.58 6.43 3.00 1.88 1.37 .76 40.131937 .40 .92 1.63 2.97 4.64 4.67 5.61 5.10 3.51 2.10 1.27 .39 33.211938 .72 .88 2.24 3.54 3.89 4.39 5.71 5.43 3.76 3.17 1.43 .67 35.831939 .72 .78 2.28 2.69 4.87 4.22 5.04 4.65 4.71 2.84 .95 .66 34.41
1940 .22 .50 1.70 2.67 4.41 5.16 6.58 4.42 3.90 2.83 1.03 .56 33.981941 .54 .59 1.90 3.51 5.76 5.16 6.23 5.23 3.40 1.57 .72 .66 35.271942 .90 .75 2.04 4.08 4.81 4.40 6.38 5.25 3.77 2.52 1.23 .52 36.651943 .72 1.63 1.67 3.10 2.91 5.02 6.10 5.15 3.14 2.24 1.22 .62 33.521944 .71 1.07 1.60 2.56 4.60 6.48 6.39 4.86 3.40 2.84 .87 .42 35.80
1945 .47 .88 2.43 2.96 3.44 3.50 6.09 4.85 2.52 2.01 1.14 .43 30.721946 .63 1.22 2.33 3.50 3.40 5.95 6.13 3.48 3.83 2.57 1.12 .73 34.891947 .65 .77 1.43 2.55 4.50 4.07 5.86 5.92 3.73 2.68 .71 .71 33.581948 .50 .79 1.69 3.95 3.85 5.08 5.44 5.39 3.71 2.31 1.22 .81 34.741949 .44 .98 1.63 3.34 5.27 4.61 3.45 4.66 3.17 1.89 1.68 .94 32.06
1950 .81 .98 2.05 2.93 4.12 5.15 5.54 3.66 2.52 2.63 .84 .52 31.751951 .83 .86 1.75 3.03 6.06 4.71 5.24 4.73 3.20 2.19 1.10 .68 34.381952 .91 1.14 2.17 3.29 4.88 6.77 6.50 4.25 4.17 3.11 1.57 .73 39.491953 .68 1.50 2.39 3.45 5.45 7.23 6.94 5.92 4.84 3.07 1.87 1.20 44.541954 .87 1.75 2.35 4.38 4.49 6.39 7.37 4.52 4.28 2.13 1.22 .83 40.58
1955 .87 1.18 2.48 3.82 4.37 4.47 5.67 5.38 4.42 2.42 1.43 .97 37.481956 .77 .90 2.68 3.63 5.05 5.96 5.21 5.82 4.73 3.25 1.48 .70 40.181957 .54 1.03 1.77 2.61 4.12 4.23 5.85 5.11 3.18 2.33 1.17 1.13 33.071958 .82 1.40 1.50 3.43 5.23 4.66 3.75 4.14 2.23 2.57 1.59 .66 31.981959 .64 1.35 2.96 4.10 5.19 5.63 5.51 4.87 3.80 1.97 1.21 .70 37.93
1960 .74 .92 1.37 4.15 4.21 5.46 5.91 5.42 4.07 2.14 1.57 1.06 37.021961 .94 1.03 2.19 3.28 4.30 5.27 5.63 5.06 4.33 2.86 1.37 .91 37.171962 .84 1.30 1.72 2.69 5.54 4.93 5.43 5.41 2.71 2.11 1.32 .89 34.89
AVERAGE .69 1.01 2.00 3.24 4.59 5.24 5.85 4.87 3.48 2.32 1.22 .69 35.21
32

Table 17. Monthly Lake Evaporation in Inches at Carbondale
YEAR JAN FEB MAR APR MAY JUN JUL AUG SEP OCT NOV DEC TOTAL
1911 .69 1.10 2.33 2.90 5.84 5.87 5.83 4.65 3.43 1.83 .93 .67 36.071912 .50 .67 1.26 3.16 5.16 5.24 5.54 4.94 3.99 2.51 1.52 .98 35.471913 .79 .97 2.07 3.29 5.71 6.05 6.05 5.88 3.08 1.75 1.18 .57 37.391914 .82 .61 1.47 2.92 5.67 6.07 6.29 5.14 3.59 2.12 1.69 .41 36.80
1915 .54 1.20 1.40 4.26 3.93 4.48 5.52 3.70 3.75 2.49 1.68 .64 33.591916 .73 .85 2.04 3.12 5.10 4.75 5.90 4.73 4.02 2.72 1.72 .80 36.481917 .69 1.01 2.42 3.59 4.68 5.64 5.59 5.15 4.08 2.18 1.25 .44 36.721918 .36 .98 2.93 2.77 5.71 5.69 5.51 5.51 2.95 2.21 1.44 .88 36.941919 .93 1.09 2.30 3.34 3.48 5.15 6.19 5.39 4.77 1.92 1.19 .53 36.28
1920 .96 .83 2.40 2.77 4.47 5.45 5.51 4.50 3.72 2.93 1.27 .86 35.671921 .94 .99 3.04 4.00 5.36 5.55 6.27 4.97 3.46 2.69 1.30 .91 39.481922 .74 1.07 1.94 3.59 5.13 5.44 5.57 5.48 4.58 2.88 1.50 .80 38.721923 .91 .92 2.17 3.38 4.15 5.06 5.84 4.19 3.37 2.55 1.36 .87 34.771924 .71 .99 1.42 3.81 3.77 5.03 5.51 5.49 3.71 3.38 1.45 .67 35.94
1925 .83 1.35 2.76 4.40 5.03 5.96 5.85 5.82 4.12 1.20 1.19 .74 39.251926 .71 1.07 1.79 3.20 6.04 5.92 6.11 4.30 3.95 1.92 1.00 .49 36.501927 .58 1.19 1.93 3.02 3.76 4.57 5.66 4.30 3.90 2.74 1.23 .77 33.651928 .82 .90 1.80 3.06 5.18 3.91 5.88 4.80 3.98 2.37 1.13 .87 34.701929 .68 .74 2.48 3.42 3.77 5.23 5.35 5.16 3.02 2.12 .89 .56 33.42
1930 .52 1.33 2.28 3.87 4.87 5.81 6.25 5.51 3.28 2.16 1.22 .64 37.741931 .79 1.17 1.38 3.03 3.82 4.28 5.98 4.23 4.05 2.49 1.37 .60 33.191932 .93 1.40 1.69 3.40 5.33 5.52 5.95 4.64 3.28 2.10 1.06 .68 35.981933 1.04 1.16 1.82 3.15 4.03 6.29 5.88 4.90 4.00 2.45 1.43 .87 37.021934 .93 .93 1.82 3.58 5.81 5.74 5.73 5.00 2.88 2.85 1.63 .74 37.64
1935 .87 1.12 2.20 2.60 3.40 3.94 5.63 4.69 4.42 2.39 .94 .57 32.771936 .61 .76 2.80 3.18 6.07 6.37 6.38 6.12 4.13 2.20 1.29 .82 40.731937 .53 1.07 1.91 3.06 5.07 5.49 5.71 5.37 3.93 2.18 1.27 .53 36.121938 .81 1.15 2.26 3.91 4.97 4.94 5.19 5.15 3.92 3.24 1.76 .83 38.131939 1.01 .95 2.53 2.96 5.32 5.10 5.96 5.20 5.11 3.12 1.24 .89 39.39
1940 .34 .66 1.81 2.92 4.40 5.26 5.87 5.11 3.84 2.68 1.10 .65 34.641941 .69 1.01 2.10 3.72 5.54 5.52 5.50 5.40 4.51 1.92 1.08 1.42 38.411942 .70 .83 2.12 3.64 4.40 4.93 5.73 4.63 3.59 2.23 1.28 .43 34.511943 .68 1.37 1.28 3.44 4.44 5.40 5.75 5.58 2.91 2.27 1.28 .58 34.981944 .67 1.09 1.93 3.16 4.74 5.90 5.90 5.37 3.51 2.59 1.12 .48 36.46
1945 .51 .72 2.28 3.19 3.57 4.33 5.34 4.82 2.75 2.00 .99 .51 31.011946 .64 1.20 .92 2.61 3.47 2.78 5.97 5.20 3.49 3.02 2.20 1.10 32.601947 .83 .70 1.65 3.77 5.27 4.83 5.64 4.28 3.86 2.49 .74 .67 34.731948 .49 .67 1.95 5.19 4.66 5.56 5.29 4.43 3.56 1.90 1.08 .73 35.511949 .66 .93 2.12 3.34 5.31 5.74 4.98 5.35 3.42 2.32 1.58 .92 36.67
1950 1.90 .95 2.64 2.97 4.77 5.24 5.57 4.31 2.62 1.90 1.10 .55 34.521951 .68 .72 1.54 2.57 5.09 4.08 4.28 3.68 3.01 2.19 1.03 .75 29.621952 .66 1.07 2.15 3.37 4.13 5.81 5.09 4.54 3.68 2.82 1.48 .77 35.571953 .72 1.44 2.26 2.58 4.15 6.33 5.86 5.62 4.90 2.12 1.68 .91 38.971954 .71 1.75 2.34 4.48 3.95 5.48 5.90 5.51 3.93 2.16 1.08 .69 37.98
1955 .69 .99 2.12 3.69 3.80 3.66 5.10 5.21 4.07 2.35 1.28 .67 33.631956 .67 1.02 2.45 3.76 4.98 4.36 4.94 4.45 4.03 2.50 1.40 .74 35.301957 .63 1.07 1.92 3.17 4.35 4.21 4.87 4.84 3.12 2.26 1.17 .98 32.591958 .80 .98 1.43 3.17 4.40 4.86 4.90 4.23 3.24 2.24 1.88 .67 32.801959 .82 1.13 2.66 4.45 4.91 4.97 5.19 4.51 4.09 2.19 1.13 .70 36.75
1960 .71 .86 1.35 4.37 4.66 5.24 4.71 4.84 3.59 2.23 1.26 .76 34.581961 .77 1.04 2.11 3.34 4.50 5.43 5.49 4.59 3.69 2.35 .98 .56 34.851962 .49 1.02 1.71 3.77 6.11 5.02 5.81 5.61 2.67 2.31 .89 .53 35.84
AVERAGE .74 1.02 2.03 3.42 4.74 5.18 5.62 4.94 3.70 2.36 1.29 .72 35.75
33

Table 18. Monthly Lake Evaporation in Inches at EvansvilleYEAR JAN FEB MAR APR MAY JUN JUL AUG SEP OCT NOV DEC TOTAL
1911 .81 1.29 2.67 3.39 6.81 6.75 6.83 5.17 3.92 2.07 .99 .74 41.44
1912 .60 .80 1.49 3.68 5.82 5.92 6.55 5.85 4.68 3.00 1.71 1.16 41.261913 .93 1.28 2.39 3.83 6.58 7.07 7.25 6.20 3.32 1.91 1.26 .65 42.67
1914 .90 .75 1.65 3.32 6.43 7.13 7.75 5.69 4.12 2.55 1.95 .46 42.70
1915 .66 1.31 1.68 4.95 4.41 5.24 6.54 4.34 4.31 2.96 1.89 .75 39.041916 .85 1.10 2.38 3.59 5.52 5.32 7.07 5.37 4.49 3.04 1.93 .94 41.60
1917 .83 1.18 2.70 4.05 5.25 6.42 6.35 5.67 4.57 2.46 1.38 .54 41.401918 .44 1.15 3.17 3.14 6.38 6.38 6.17 5.98 3.25 2.37 1.59 .96 40.98
1919 1.08 1.25 2.64 3.79 3.85 5.67 7.57 5.93 5.02 2.12 1.37 .64 40.93
1920 1.04 .93 2.57 3.02 4.83 6.07 6.11 5.03 4.12 3.20 1.40 .94 39.261921 1.03 1.10 3.26 4.51 5.86 5.95 7.68 5.56 3.74 3.05 1.39 1.00 44.13
1922 .85 1.17 1.98 3.91 5.54 5.92 6.26 6.10 4.99 3.16 1.72 .88 42.481923 .96 1.04 2.44 3.80 4.41 5.54 6.74 5.63 3.68 2.80 1.50 .94 39.38
1924 .84 1.10 1.57 4.25 4.17 5.56 6.32 6.21 4.15 3.75 1.56 .75 40.23
1925 .95 1.54 3.08 4.80 5.58 6.74 6.74 6.75 4.30 1.34 1.35 .87 44.04
1926 .84 1.17 1.99 3.67 6.90 6.74 7.42 4.96 4.62 2.21 1.07 .53 42.121927 .70 1.37 2.22 3.42 4.1 7 5.21 6.52 4.88 4.26 3.17 1.26 .90 38.08
1928 .96 1.04 2.01 3.39 5.71 4.47 7.18 5.40 4.50 2.62 1.20 1.03 39.511929 .77 .91 2.83 3.92 4.32 5.88 5.88 5.92 3.51 2.35 1.00 .62 37.91
1930 .62 1.49 2.69 4.33 5.19 6.53 7.40 5.91 3.46 2.48 1.35 .72 42.17
1931 .93 1.35 1.49 3.56 4.25 6.74 6.96 4.66 4.45 2.76 1.48 .65 39.281932 1.01 1.57 2.02 3.73 5.92 6.07 6.84 4.99 3.53 2.42 1.17 .75 40.02
1933 1.19 1.35 1.94 3.55 4.32 7.53 6.72 5.31 4.26 2.71 1.53 .92 41.331934 1.02 1.11 1.98 3.85 6.48 6.35 6.46 4.87 3.19 3.25 1.75 .81 41.12
1935 1.01 1.27 2.27 2.81 3.60 4.25 6.30 5.01 4.70 2.58 .96 .66 35.42
1936 .73 .94 3.14 3.70 7.13 7.68 7.83 7.20 4.43 2.46 1.51 .93 47.66
1937 .55 1.18 2.08 3.33 5.63 5.99 6.50 5.85 4.28 2.39 1.36 .56 39.701938 .94 1.23 2.31 4.39 5.40 5.36 5.76 5.76 4.31 3.64 1.90 .93 41.93
1939 1.08 1.08 2.80 3.28 5.77 5.61 6.37 5.84 5.44 3.39 1.34 1.03 43.03
1940 .42 .73 1.91 3.16 4.76 5.62 6.82 5.40 4.45 3.11 1.22 .69 38.291941 .78 1.18 2.42 4.31 6.25 6.25 6.37 6.11 4.83 2.09 1.25 2.41 44.25
1942 .86 .97 2.32 4.18 4.96 5.66 6.88 5.39 4.06 2.42 1.36 .46 39.521943 .75 1.62 1.73 3.94 4.89 6.25 6.90 6.37 3.44 2.56 1.45 .67 40.57
1944 .66 1.22 2.09 3.48 5.49 6.81 6.84 6.00 4.07 2.99 1.17 .54 41.36
1945 .59 .82 2.50 3.63 4.15 4.92 6.31 5.65 3.17 2.35 .90 .57 35.561946 .74 1.36 2.76 3.84 3.26 6.34 5.92 4.14 3.55 2.53 1.23 .94 36.61
1947 .77 1.10 2.01 3.35 5.31 5.31 6.35 6.27 4.37 2.96 .83 .81 39.441948 .56 .81 2.14 4.02 5.19 6.32 6.06 5.89 4.00 2.28 1.21 .79 39.27
1949 .67 1.08 2.15 3.11 5.72 5.13 6.08 4.87 3.64 2.23 1.81 1.03 37.52
1950 1.83 1.09 2.36 3.54 6.41 6.02 6.03 4.81 3.22 3.02 1.18 .64 40.15
1951 .76 .81 1.71 3.37 6.06 4.90 6.26 5.73 3.89 2.53 1.10 .79 37.911952 .71 1.18 2.34 3.39 4.85 7.14 6.71 5.62 4.39 3.19 1.55 .81 41.88
1953 .75 1.61 2.51 3.51 5.12 7.64 7.37 6.57 5.08 3.18 1.86 1.03 46.231954 .80 1.80 2.57 4.23 4.71 6.88 7.25 5.28 4.54 2.18 1.23 .74 42.21
1955 .75 1.06 2.31 4.07 4.79 4.86 6.37 6.46 4.46 2.34 1.39 .77 39.63
1956 .75 1.11 2.68 3.75 5.55 5.94 5.77 5.24 4.32 3.00 1.53 .76 40.401957 .69 1.14 1.99 3.43 4.25 4.20 5.54 5.70 3.05 2.26 1.30 1.08 34.63
1958 .90 1.18 1.57 3.49 5.47 5.81 6.04 5.97 3.90 2.89 1.65 .79 39.661959 .93 1.25 2.99 4.16 5.24 6.38 6.24 5.42 4.47 2.30 1.22 .74 41.34
1960 .78 .92 1.71 4.84 4.63 5.89 6.23 5.75 4.42 2.42 1.46 .87 39.92
1961 .95 1.15 2.08 3.60 4.98 6.21 6.22 5.42 4.58 2.67 1.09 .61 39.56
1962 .58 1.16 1.85 4.22 6.66 5.82 6.58 5.83 3.12 2.37 1.03 .63 39.90
AVERAGE .83 1.16 2.27 3.76 5.29 6.01 6.60 5.61 4.13 2.66 1.38 .82 40.51
34

Table 19. Maximum Net Evaporation from a Lake Surface at Rockford, in Inches
Recurrence Interval in YearsDurationinMonths
2 3 4 5 6 8 10 15 20 25 30 40 50
1 3.30 3.89 4.04 4.41 4.69 4.75 4.96 5.71 5.80 5.83 6.00 6.35 6.642 4.6 5.6 6.0 6.5 6.9 7.3 7.6 8.0 8.3 8.5 8.7 9.1 9.43 5.0 6.2 7.1 7.5 8.1 8.7 9.3 9.5 10.3 11.4 11.8 12.0 12.24 6.7 6.6 8.0 8.2 8.7 9.2 9.9 12.1 12.9 13.4 13.5 13.6 13.65 5.6 6.8 7.8 8.7 9.8 10.1 11.9 13.6 14.2 15.0 15.2 15.3 15.4
6 4.4 6.4 7.8 9.0 9.9 11.5 12.1 13.0 14.0 14.4 14.8 15.5 16.17 3 6 8 9 10 12 12 12 13 14 15 16 168 3 5 8 9 9 11 12 13 13 13 14 15 169 2 5 7 8 8 9 10 12 13 13 13 15 16
10 1 4 6 6 7 9 10 12 12 13 13 15 16
11 0 3 5 5 7 8 9 11 12 12 13 15 1712 1 4 6 7 8 9 10 11 11 12 15 1914 2 5 6 7 8 11 13 14 15 16 19 2216 0 2 5 7 10 12 14 15 16 18 20 2218 1 5 7 11 11 13 14 14 14 16 18
20 0 5 7 10 11 11 12 12 13 15 1722 2 5 7 8 9 10 11 12 15 1724 0 4 5 5 7 9 12 13 14 1526 0 4 7 10 12 14 15 16 1828 1 5 9 12 13 13 15 18 21
30 0 4 9 13 14 15 17 19 2132 3 7 11 13 14 15 18 2034 0 3 11 12 14 15 17 1936 0 9 11 12 12 13 1338 12 13 13 13 14 15
40 12 14 14 15 16 1742 14 14 15 15 16 1644 13 15 15 16 16 1746 11 14 14 15 16 1748 8 12 14 15 16 16
50 9 12 15 18 19 2052 7 11 16 18 20 2254 5 9 14 17 20 2356 4 8 13 15 19 2258 0 6 10 12 16 20
60 7 11 13 16 19
35

Table 20. Maximum Net Evaporation from a Lake Surface at Chicago, in Inches
Recurrence Interval in YearsDuration
inMonths
2 3 4 5 6 8 10 15 20 25 30 40 50
1 4.17 4.74 5.07 5.15 5.21 5.53 5.78 6.01 6.12 6.14 6.28 6.56 6.792 6.5 7.5 8.0 8.2 8.3 9.0 9.4 9.8 10.2 10.2 10.4 10.7 11.03 8.1 9.5 10.0 10.6 11.0 11.3 11.8 13.0 13.9 14.4 14.7 15.0 15.34 9.4 10.7 11.4 12.1 12.8 13.0 13.1 13.7 14.3 15.2 15.8 16.5 17.25 9.4 11.3 12.1 12.4 13.3 14.8 15.1 15.3 15.8 16.4 17.0 17.9 18.7
6 9.7 10.8 11.6 12.1 14.8 15.6 16.0 17.0 17.5 18.0 18.2 18.6 18.97 9 10 12 13 14 15 16 17 18 18 18 19 198 8 10 11 12 13 14 15 16 17 18 18 18 199 7 9 10 11 12 14 14 15 17 18 18 18 18
10 4 8 9 10 11 12 13 15 16 17 17 18 18
11 3 7 9 10 11 12 12 15 16 16 16 16 1612 2 7 9 10 10 11 12 13 14 15 16 17 1814 0 7 11 12 13 14 14 15 16 16 18 21 2416 6 11 14 15 17 18 19 20 21 22 23 2518 5 10 14 15 16 17 20 22 23 23 24 25
20 2 10 12 12 14 15 19 20 22 23 26 2822 1 7 10 11 12 13 16 18 20 22 24 2624 0 3 9 10 12 13 15 16 17 20 22 2426 3 12 12 13 16 19 20 20 21 22 2328 6 12 14 15 17 21 21 21 21 21 22
30 5 11 14 14 15 18 19 21 22 22 2332 2 10 10 11 13 17 18 19 20 21 2234 0 7 8 9 11 16 17 18 18 19 1936 2 6 10 13 14 15 16 17 18 1838 6 8 11 13 17 20 22 22 23 24
40 0 9 13 16 17 19 22 23 25 2742 8 13 15 18 19 19 21 26 3044 4 11 12 17 17 17 20 25 2946 2 9 10 13 15 15 17 22 2748 0 8 10 14 15 16 18 22 26
50 0 12 17 20 21 22 25 2852 8 12 18 23 25 27 30 3354 8 12 18 22 24 27 31 3556 0 10 19 21 23 25 31 3658 7 18 19 20 23 28 34
60 0 16 18 18 20 26 32
36

Table 21. Maximum Net Evaporation from a Lake Surface at Moline, in Inches
Recurrence Interval in YearsDurationin
Months2 3 4 5 6 8 10 15 20 25 30 40 50
1 4.64 5.02 5.29 5.44 5.54 6.29 6.64 7.07 7.42 7.45 7.67 8.12 8.482 6.5 7.6 8.7 8.9 9.6 10.2 10.2 10.5 11.2 11.9 12.2 12.4 12.73 8.0 8.9 10.4 11.1 11.6 12.0 12.6 12.8 13.6 14.8 15.4 16.2 16.94 8.9 10.5 11.8 12.1 12.3 13.6 13.7 14.4 15.5 16.1 16.9 18.5 19.85 8.2 11.0 12.8 13.8 14.5 14.8 15.3 15.6 16.2 16.9 17.9 19.7 21.2
6 7.7 11.6 13.0 14.0 14.6 15.2 15.4 16.3 17.4 17.6 18.5 20.4 22.07 7 12 13 14 14 15 15 16 17 18 19 20 218 7 11 12 13 13 14 15 16 18 19 20 20 209 5 10 12 13 13 14 14 16 17 19 19 19 1910 4 9 11 12 13 14 14 15 15 15 16 18 19
11 4 7 9 11 12 13 14 15 16 18 18 19 1912 4 7 10 10 11 14 14 16 18 21 22 23 2314 4 5 10 12 16 19 21 23 24 25 26 27 2816 4 4 11 15 19 20 21 23 24 26 27 29 3118 4 4 10 14 18 20 22 25 25 25 27 31 34
20 4 9 9 13 17 20 21 24 24 24 26 30 3422 4 9 6 10 15 19 21 21 22 22 24 28 3124 4 9 7 9 16 17 19 22 23 23 24 27 3026 4 9 9 13 16 18 22 24 25 26 27 29 3028 0 0 0 13 18 21 26 29 30 31 32 32 33
30 11 20 22 25 28 29 30 31 33 3432 9 17 20 23 26 27 29 30 32 3434 6 16 18 20 23 26 26 27 29 3136 0 10 14 18 25 26 28 29 30 3138 12 18 22 28 29 30 31 33 34
40 8 15 23 29 32 32 33 36 3842 5 14 23 29 31 32 33 36 3944 0 13 21 27 29 31 33 36 3946 9 18 26 29 31 32 36 3848 0 20 26 31 36 37 38 38
50 19 28 31 35 37 39 4052 0 32 36 40 41 41 4154 33 36 41 42 42 4256 33 35 38 39 41 4358 31 33 37 38 40 41
60 30 34 38 39 40 40
37

Table 22. Maximum Net Evaporation from a Lake Surface at Peoria, in Inches
Recurrence Interval in YearsDurationin
Months2 3 4 5 6 8 10 15 20 25 30 40 50
1 4.90 5.31 5.52 5.79 6.14 6.26 6.36 6.45 6.70 7.05 7.11 7.12 7.122 7.6 8.7 9.1 9.2 9.5 10.1 10.4 10.8 11.2 11.7 12.1 12.7 13.23 8.6 10.2 11.3 12.0 12.3 12.7 13.4 13.9 14.2 14.3 15.0 16.3 17.44 9.2 12.5 13.0 13.6 14.1 14.6 14.9 15.1 16.1 17.7 18.8 20.3 21.65 9.4 12.6 13.9 14.9 15.7 16.3 16.4 17.1 18.8 20.6 21.5 22.6 23.4
6 8.3 13.1 14.5 15.0 15.6 17.4 17.7 18.5 19.9 21.2 22.0 23.0 23.97 8 12 14 14 15 18 18 19 21 22 22 23 238 8 12 12 13 14 17 19 21 21 21 21 21 219 6 10 12 13 14 17 19 20 20 20 20 20 20
10 4 10 11 12 13 17 18 19 19 20 20 20 20
11 2 9 11 12 13 15 17 18 18 19 19 20 2112 3 8 10 11 13 15 17 18 20 21 21 22 2214 3 8 14 16 17 19 20 23 26 27 27 27 2716 3 5 10 17 18 20 22 25 25 25 27 30 3218 3 8 10 15 18 21 22 25 26 27 29 33 37
20 0 0 10 12 18 20 21 24 26 28 31 35 4022 9 9 15 18 19 21 23 27 29 33 3724 8 10 17 17 18 20 22 24 27 31 3526 9 13 16 21 23 24 26 29 31 34 3728 5 14 17 22 22 26 28 30 32 36 40
30 3 12 17 19 20 25 28 30 33 38 4332 3 6 13 15 19 23 26 29 31 37 4234 0 0 10 14 19 22 25 27 30 35 3936 11 16 18 19 22 26 29 35 3938 8 18 21 25 28 28 31 38 44
40 9 18 23 24 26 28 31 39 4642 8 14 17 23 25 26 31 42 5344 6 11 17 23 24 24 29 41 5346 3 6 15 21 23 24 29 40 5148 0 9 11 23 26 28 32 42 51
50 0 0 26 31 35 40 48 5552 26 32 39 44 52 6054 24 30 39 45 54 6256 24 28 37 42 52 6158 21 26 34 40 50 59
60 20 26 34 40 50 59
38
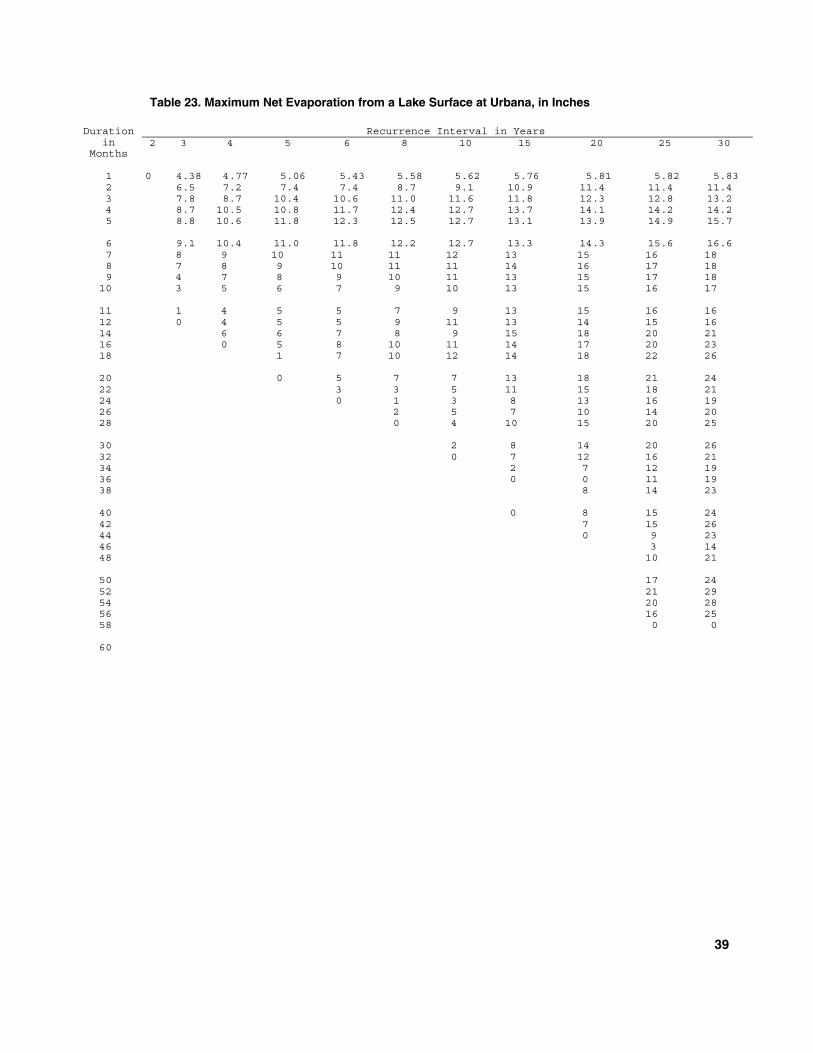
Table 23. Maximum Net Evaporation from a Lake Surface at Urbana, in Inches
Recurrence Interval in YearsDurationin
Months2 3 4 5 6 8 10 15 20 25 30
1 0 4.38 4.77 5.06 5.43 5.58 5.62 5.76 5.81 5.82 5.832 6.5 7.2 7.4 7.4 8.7 9.1 10.9 11.4 11.4 11.43 7.8 8.7 10.4 10.6 11.0 11.6 11.8 12.3 12.8 13.24 8.7 10.5 10.8 11.7 12.4 12.7 13.7 14.1 14.2 14.25 8.8 10.6 11.8 12.3 12.5 12.7 13.1 13.9 14.9 15.7
6 9.1 10.4 11.0 11.8 12.2 12.7 13.3 14.3 15.6 16.67 8 9 10 11 11 12 13 15 16 188 7 8 9 10 11 11 14 16 17 189 4 7 8 9 10 11 13 15 17 18
10 3 5 6 7 9 10 13 15 16 17
11 1 4 5 5 7 9 13 15 16 1612 0 4 5 5 9 11 13 14 15 1614 6 6 7 8 9 15 18 20 2116 0 5 8 10 11 14 17 20 2318 1 7 10 12 14 18 22 26
20 0 5 7 7 13 18 21 2422 3 3 5 11 15 18 2124 0 1 3 8 13 16 1926 2 5 7 10 14 2028 0 4 10 15 20 25
30 2 8 14 20 2632 0 7 12 16 2134 2 7 12 1936 0 0 11 1938 8 14 23
40 0 8 15 2442 7 15 2644 0 9 2346 3 1448 10 21
50 17 2452 21 2954 20 2856 16 2558 0 0
60
39
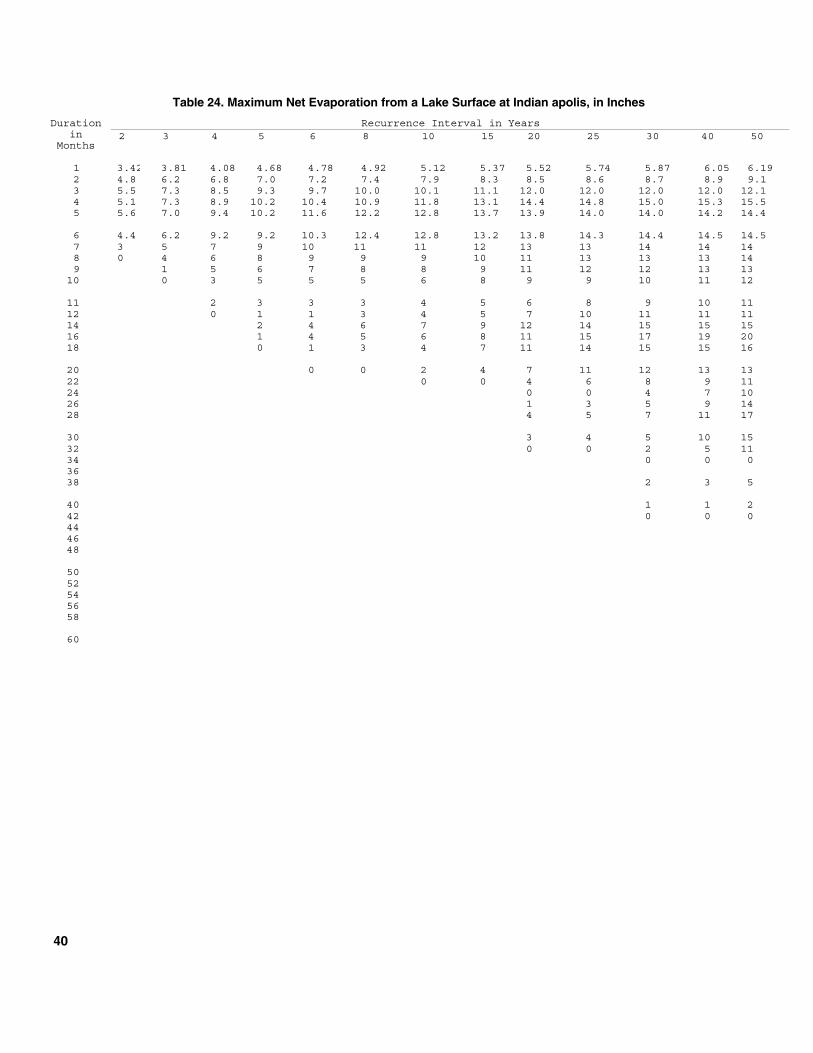
Table 24. Maximum Net Evaporation from a Lake Surface at Indian apolis, in Inches
Recurrence Interval in YearsDurationin
Months2 3 4 5 6 8 10 15 20 25 30 40 50
1 3.42 3.81 4.08 4.68 4.78 4.92 5.12 5.37 5.52 5.74 5.87 6.05 6.192 4.8 6.2 6.8 7.0 7.2 7.4 7.9 8.3 8.5 8.6 8.7 8.9 9.13 5.5 7.3 8.5 9.3 9.7 10.0 10.1 11.1 12.0 12.0 12.0 12.0 12.14 5.1 7.3 8.9 10.2 10.4 10.9 11.8 13.1 14.4 14.8 15.0 15.3 15.55 5.6 7.0 9.4 10.2 11.6 12.2 12.8 13.7 13.9 14.0 14.0 14.2 14.4
6 4.4 6.2 9.2 9.2 10.3 12.4 12.8 13.2 13.8 14.3 14.4 14.5 14.57 3 5 7 9 10 11 11 12 13 13 14 14 148 0 4 6 8 9 9 9 10 11 13 13 13 149 1 5 6 7 8 8 9 11 12 12 13 13
10 0 3 5 5 5 6 8 9 9 10 11 12
11 2 3 3 3 4 5 6 8 9 10 1112 0 1 1 3 4 5 7 10 11 11 1114 2 4 6 7 9 12 14 15 15 1516 1 4 5 6 8 11 15 17 19 2018 0 1 3 4 7 11 14 15 15 16
20 0 0 2 4 7 11 12 13 1322 0 0 4 6 8 9 1124 0 0 4 7 1026 1 3 5 9 1428 4 5 7 11 17
30 3 4 5 10 1532 0 0 2 5 1134 0 0 03638 2 3 5
40 1 1 242 0 0 0444648
5052545658
60
40
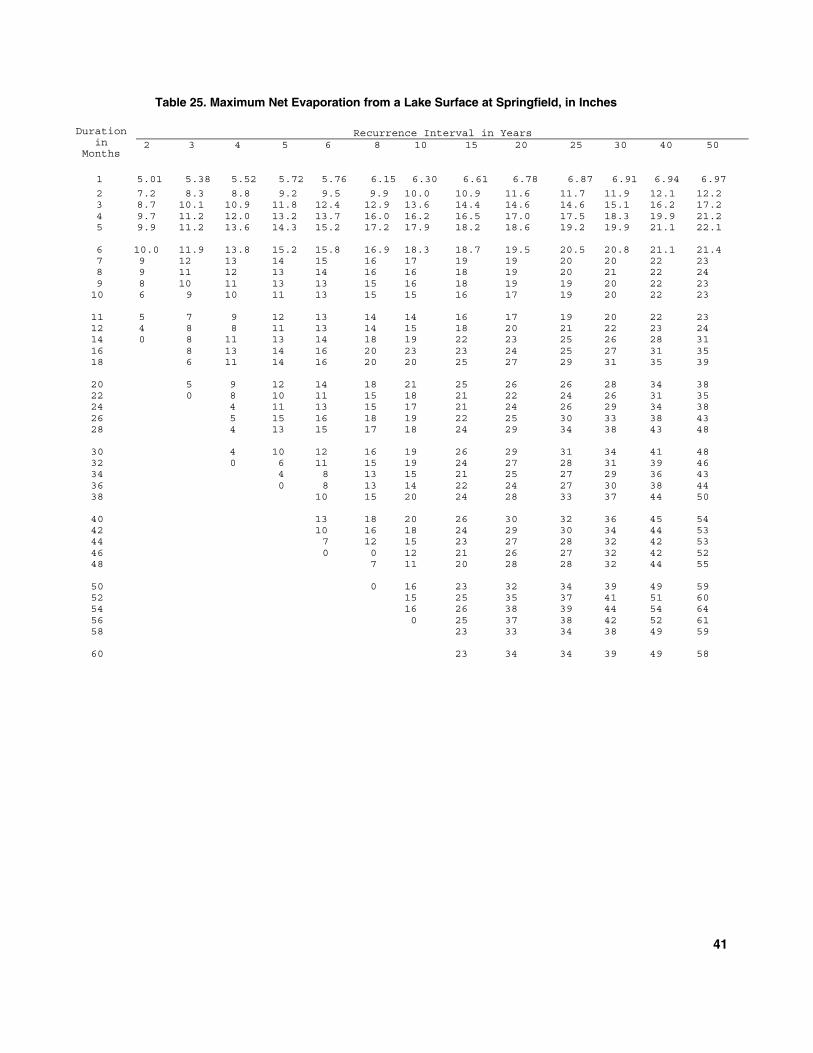
Table 25. Maximum Net Evaporation from a Lake Surface at Springfield, in Inches
Recurrence Interval in YearsDurationin
Months2 3 4 5 6 8 10 15 20 25 30 40 50
1 5.01 5.38 5.52 5.72 5.76 6.15 6.30 6.61 6.78 6.87 6.91 6.94 6.97
2 7.2 8.3 8.8 9.2 9.5 9.9 10.0 10.9 11.6 11.7 11.9 12.1 12.23 8.7 10.1 10.9 11.8 12.4 12.9 13.6 14.4 14.6 14.6 15.1 16.2 17.24 9.7 11.2 12.0 13.2 13.7 16.0 16.2 16.5 17.0 17.5 18.3 19.9 21.25 9.9 11.2 13.6 14.3 15.2 17.2 17.9 18.2 18.6 19.2 19.9 21.1 22.1
6 10.0 11.9 13.8 15.2 15.8 16.9 18.3 18.7 19.5 20.5 20.8 21.1 21.47 9 12 13 14 15 16 17 19 19 20 20 22 238 9 11 12 13 14 16 16 18 19 20 21 22 249 8 10 11 13 13 15 16 18 19 19 20 22 2310 6 9 10 11 13 15 15 16 17 19 20 22 23
11 5 7 9 12 13 14 14 16 17 19 20 22 2312 4 8 8 11 13 14 15 18 20 21 22 23 2414 0 8 11 13 14 18 19 22 23 25 26 28 3116 8 13 14 16 20 23 23 24 25 27 31 3518 6 11 14 16 20 20 25 27 29 31 35 39
20 5 9 12 14 18 21 25 26 26 28 34 3822 0 8 10 11 15 18 21 22 24 26 31 3524 4 11 13 15 17 21 24 26 29 34 3826 5 15 16 18 19 22 25 30 33 38 4328 4 13 15 17 18 24 29 34 38 43 48
30 4 10 12 16 19 26 29 31 34 41 4832 0 6 11 15 19 24 27 28 31 39 4634 4 8 13 15 21 25 27 29 36 4336 0 8 13 14 22 24 27 30 38 4438 10 15 20 24 28 33 37 44 50
40 13 18 20 26 30 32 36 45 5442 10 16 18 24 29 30 34 44 5344 7 12 15 23 27 28 32 42 5346 0 0 12 21 26 27 32 42 5248 7 11 20 28 28 32 44 55
50 0 16 23 32 34 39 49 5952 15 25 35 37 41 51 6054 16 26 38 39 44 54 6456 0 25 37 38 42 52 6158 23 33 34 38 49 59
60 23 34 34 39 49 58
41

Table 26. Maximum Net Evaporation from a Lake Surface at St. Louis, in Inches
Recurrence Interval in YearsDurationin
Months2 3 4 5 6 8 10 15 20 25 30 40 50
1 4.79 5.29 5.41 5.59 5.62 5.72 5.77 6.73 6.82 6.83 6.86 6.92 6.972 7.7 8.3 8.6 8.9 9.4 9.8 10.2 11.1 11.5 11.7 11.9 12.2 12.53 8.7 10.8 11.4 11.5 11.9 13.2 14.1 15.1 15.9 16.0 16.1 16.1 16.24 8.5 11.7 13.0 13.9 14.8 15.1 15.4 17.3 18.4 20.0 20.4 20.6 20.85 8.6 11.5 13.8 14.1 15.8 16.2 16.5 19.0 20.5 21.0 21.7 22.9 23.8
6 8.2 11.6 12.6 14.6 15.6 16.7 17.3 20.3 21.9 22.2 22.7 26.7 24.47 7 10 12 14 15 16 17 20 21 21 22 24 258 6 9 12 13 14 15 16 19 21 22 23 25 269 5 8 11 11 12 14 15 18 20 21 22 24 2610 4 7 9 11 12 13 14 17 19 21 22 25 27
11 2 5 8 9 12 13 13 16 18 21 23 26 2812 1 5 9 11 12 13 15 16 18 20 23 26 3014 1 4 8 13 15 18 19 22 23 24 27 32 3716 1 1 8 14 17 19 20 23 25 25 28 34 4018 0 0 7 15 17 19 20 22 25 28 31 36 41
20 4 10 13 17 18 21 23 25 28 35 4022 0 8 11 14 17 19 21 21 25 33 4124 9 12 14 17 18 20 24 28 36 4426 8 13 16 16 19 22 24 29 40 5128 0 10 14 18 22 26 27 32 43 54
30 5 15 18 22 25 25 30 42 5432 5 14 17 20 22 22 27 39 5234 2 12 14 17 18 19 24 36 5036 1 10 14 17 19 21 26 37 4938 0 11 15 21 25 27 31 42 52
40 11 16 20 25 26 31 43 5642 8 15 21 24 24 29 43 5744 6 14 16 19 21 26 41 5746 0 11 16 19 20 25 39 5648 9 15 18 18 24 39 57
50 0 17 24 25 30 45 6052 17 25 30 36 50 6354 18 25 32 39 59 6956 17 25 29 36 51 6758 15 22 27 34 49 65
60 13 20 24 31 46 62
42

Table 27. Maximum Net Evaporation from a Lake Surface at Carbondale, in Inches
Recurrence Interval in YearsDurationin
Months2 3 4 5 6 8 10 15 20 25 30 40 50
1 4.22 4.47 4.82 4.87 4.93 5.12 5.20 5.54 5.74 5.77 5.83 5.95 6.042 6.4 7.2 7.8 8.6 8.8 9.3 9.4 9.8 9.9 9.9 9.9 10.0 10.03 7.2 9.4 10.4 10.6 11.2 12.0 12.9 13.8 14.0 14.1 14.1 14.1 14.14 7.4 9.7 11.2 12.3 13.0 14.2 15.2 16.7 17.1 17.3 17.6 18.1 18.55 6.3 9.3 11.9 13.5 14.5 14.8 16.0 17.6 18.4 19.1 19.3 19.4 19.5
6 6.0 9.3 12.4 14.0 14.6 16.2 16.6 18.2 18.8 19.4 19.5 19.6 19.67 5 8 11 13 13 15 16 17 18 18 18 18 188 3 7 10 12 12 13 16 17 17 18 18 18 189 1 6 8 9 10 12 15 16 16 16 17 17 1710 0 3 6 7 8 10 12 13 14 15 15 15 15
11 2 4 4 7 9 10 13 14 14 14 15 1512 0 2 5 6 10 12 14 15 15 15 15 1514 4 6 7 11 12 18 19 21 21 21 2216 2 7 8 12 14 16 18 20 21 24 2618 1 5 7 10 11 16 18 18 19 22 24
20 0 1 5 6 9 14 16 17 17 19 2022 0 0 2 3 10 12 12 13 15 1724 0 0 11 12 13 15 18 2126 10 13 16 18 23 2828 1 3 9 12 18 21 26 31
30 0 2 8 12 17 20 24 2832 0 6 10 15 17 20 2234 0 5 10 13 15 1836 2 4 8 11 15 1938 0 7 10 12 16 21
40 8 13 15 18 2142 5 12 15 19 2344 0 0 14 17 1946 12 13 1548 8 10 11
50 5 9 11 13 1552 6 9 11 13 1454 6 11 12 13 1356 0 0 10 12 1358 4 5 5
60 0 2 4
43

Table 28. Maximum Net Evaporation from a Lake Surface at Evansville, in Inches
Recurrence Interval in YearsDurationin
Months2 3 4 5 6 8 10 15 20 25 30 40 50
1 5.35 5.81 5.99 6.24 6.26 6.31 6.46 6.65 6.85 7.10 7.14 7.15 7.152 8.4 9.2 9.7 10.3 10.7 11.1 11.3 11.8 12.1 12.2 12.6 13.2 13.73 10.0 11.3 12.0 12.9 13.7 14.7 15.0 17.1 17.7 18.1 18.6 19.4 20.24 11.0 12.8 13.7 14.3 15.4 17.1 18.8 20.3 21.4 21.8 22.6 24.2 25.65 12.3 14.0 15.3 15.8 17.3 19.0 19.5 22.5 22.7 22.9 24.0 26.0 27.8
6 12.3 14.0 15.3 16.8 17.8 19.7 21.2 22.5 23.4 23.8 24.8 26.8 28.57 12 14 16 17 18 19 20 22 24 24 25 26 278 11 13 16 17 17 18 18 21 24 24 25 26 279 8 12 14 16 16 16 17 20 23 24 25 25 2610 7 10 12 14 14 15 16 18 22 23 24 24 25
11 3 8 9 11 12 13 15 20 21 23 23 24 2412 1 6 8 10 11 15 17 20 22 23 23 24 2414 0 6 9 11 16 20 23 26 28 30 31 31 3216 7 12 14 19 25 28 31 32 32 32 33 3418 7 11 17 19 23 27 29 30 31 32 33 35
20 5 10 15 16 20 24 27 29 32 32 33 3322 0 7 10 13 17 20 23 25 27 28 30 3124 4 7 9 15 20 24 26 27 28 29 2926 6 8 10 18 21 29 31 32 34 36 3828 0 8 11 21 25 31 34 34 35 38 41
30 8 12 21 24 33 34 34 36 39 4232 3 7 10 21 23 28 31 33 35 39 4234 0 2 6 18 20 24 27 29 31 35 3936 0 0 17 20 23 26 27 28 31 3338 17 23 27 31 33 34 35 35
40 19 24 33 33 33 35 38 4142 21 24 31 34 36 38 40 4244 18 21 27 31 33 34 36 3846 14 17 23 27 30 34 35 3748 12 16 22 26 26 27 30 33
50 13 15 27 30 30 32 35 3952 0 0 29 33 35 37 40 4354 24 30 34 37 39 43 4756 0 0 30 34 37 42 4658 23 27 30 33 37 41
60 0 24 29 32 35 39
44


![moon.vn · 2017. 5. 12. · Câu 11 [259860]: Class with Dr. Rogers was a nightmare: the clock seemed stuck in place, the air conditioner blew inadequate cool, and a fluorescent bulb](https://img.pdfslide.net/doc/110x75/5fdd69e652e8736e9a6534b4/moonvn-2017-5-12-cu-11-259860-class-with-dr-rogers-was-a-nightmare.jpg)