Embed Size (px)
Citation preview
Lake Macquarie City Council Page 1
Lake Macquarie City Council
Financial Assessment, Sustainability and Benchmarking Report
26 November 2012
Prepared by NSW Treasury Corporation for Lake Macquarie City Council, the Division of Local
Government and the Independent Local Government Review Panel.
Lake Macquarie City Council Page 2
Disclaimer
This report has been prepared by New South Wales Treasury Corporation (TCorp) in accordance with
the appointment of TCorp by the Division of Local Government (DLG) as detailed in TCorp’s letters of
22 December 2011 and 28 May 2012. The report has been prepared to assist the DLG and the
Independent Local Government Review Panel in its consideration of the Sustainability of each local
government area in NSW.
The report has been prepared based on information provided to TCorp as set out in Section 2.2 of this
report. TCorp has relied on this information and has not verified or audited the accuracy, reliability or
currency of the information provided to it for the purpose of preparation of the report. TCorp and its
directors, officers and employees make no representation as to the accuracy, reliability or
completeness of the information contained in the report.
In addition, TCorp does not warrant or guarantee the outcomes or projections contained in this report.
The projections and outcomes contained in the report do not necessarily take into consideration the
commercial risks, various external factors or the possibility of poor performance by the Council all of
which may negatively impact the financial capability and sustainability of the Council. The TCorp report
focuses on whether the Council has reasonable capacity, based on the information provided to TCorp,
to take on additional borrowings, and Council’s future Sustainability, within prudent risk parameters and
the limits of its financial projections.
The report has been prepared for Lake Macquarie City Council, the DLG and the Local Government
Review Panel. TCorp shall not be liable to Lake Macquarie City Council or have any liability to any
third party under the law of contract, tort and the principles of restitution or unjust enrichment or
otherwise for any loss, expense or damage which may arise from or be incurred or suffered as a result
of reliance on anything contained in this report.
Lake Macquarie City Council Page 3
Index
Section 1 Executive Summary ...................................................................................................... 4
Section 2 Introduction ................................................................................................................... 6
2.1: Purpose of Report ........................................................................................................... 6
2.2: Scope and Methodology ................................................................................................. 6
2.3: Overview of the Local Government Area ........................................................................ 8
Section 3 Review of Financial Performance and Position ............................................................. 9
3.1: Revenue .......................................................................................................................... 9
3.2: Expenses ...................................................................................................................... 10
3.3: Operating Results ......................................................................................................... 11
3.4: Financial Management Indicators ................................................................................. 12
3.5: Statement of Cashflows ................................................................................................ 13
3.6: Capital Expenditure ....................................................................................................... 14
3.6(a): Infrastructure Backlog ................................................................................................... 14
3.6(b): Infrastructure Status ...................................................................................................... 15
3.6(c): Capital Program ............................................................................................................ 16
3.7: Specific Risks to Council ............................................................................................... 17
Section 4 Review of Financial Forecasts .................................................................................... 18
4.1: Operating Results ......................................................................................................... 18
4.2: Financial Management Indicators ................................................................................. 19
4.3: Capital Expenditure ....................................................................................................... 22
4.4: Financial Model Assumption Review ............................................................................. 23
4.5: Borrowing Capacity ....................................................................................................... 24
4.6: Sustainability ................................................................................................................. 24
Section 5 Benchmarking and Comparisons with Other Councils ................................................ 26
Section 6 Conclusion and Recommendations ............................................................................ 32
Appendix A Historical Financial Information Tables ................................................................... 33
Appendix B Glossary ................................................................................................................. 36
Lake Macquarie City Council Page 4
Section 1 Executive Summary
This report provides an independent assessment of Lake Macquarie City Council’s (the Council)
financial capacity, its ability to undertake additional borrowings, and its future Sustainability. The
analysis is based on a review of the historical performance, current financial position, and long term
financial forecasts. It also benchmarks the Council against its peers using key ratios.
TCorp’s approach has been to:
Review the most recent three years of Council’s consolidated financial results
Conduct a detailed review of the Council’s 10 year financial forecasts, with a particular focus
on a council’s General Fund although where a council operates a Water or Other Fund the
financial capacity of these other funds may be reviewed where considered necessary.
The Council has been managed in a satisfactory manner over the review period based on the following
observations:
Council’s underlying operating performance, measured by EBITDA, has remained consistent
across the three years
Liquidity has remained sound as indicated by an Unrestricted Current Ratio above benchmark
Council has recognised the need for additional income and has successfully applied for an
SRV for a cumulative increase of 57.5% (inclusive of the rate peg) across seven years from
2013 that will assist with their long term financial sustainability and assisting to reduce the
Infrastructure Backlog.
The Council reported $66.9m of Infrastructure Backlog in 2011 which represents 5.0% of its
infrastructure asset value of $1,351.5m. Other observations include:
The backlog has decreased from $78.2m in 2009 following the Asset Revaluations process
and the subsequent impact on the backlog value of the assets
Council spent adequately on capital expenditure as indicated by a Capital Expenditure Ratio
above benchmark in all three years
Council has not spent enough in relation to asset renewals or maintenance and this could
have led to a deterioration of the asset base over the medium to long term, impacting the
Infrastructure Backlog, however the additional revenue generated by the SRV is expected to
assist in meeting the shortfall in current maintenance
The key observations from our review of Council’s 10 year forecasts for its General Fund are:
The forecast that has been provided to TCorp and analysed was in the process of being
updated following the SRV approval and therefore certain aspects of the forecast, specifically
the capital expenditure, was not completely up to date
Council are projected to post operating deficits in all 10 years of the forecast although the
deficits are scheduled to reduce over time
Council’s forecast liquidity is adversely impacted due to the way the long term financial plan
(LTFP) was modelled to highlight the deficit position that would occur without the SRV. This
deficit was modelled as an overdraft that increases current liabilities rather than current and
Lake Macquarie City Council Page 5
non-current liabilities, so the LTFP overstates the adverse position of the Unrestricted Current
Ratio
Council has forecast that they will increase borrowings from $53.7m in 2011 to $206.2m in
2022 to fund capital investment
TCorp is not in a position to comment on whether Council has the capacity to undertake additional
borrowings until such time that the LTFP has been fully updated. We would be happy to review this
position once the completed LTFP is available.
In respect of the long term sustainability of the Council our key observations are:
It is clear that Council has made a significant commitment to their long term sustainability,
both through the participation within and recognition from external organisations, and also
through an internal service level review that has identified substantial savings and revenue
opportunities over the next five years that could be worth $10-14m p.a.
Council is aware that they would be unable to continue to provide existing levels of services
within their budget and this formed the basis for the SRV application to IPART. While only
being partially approved, this approval will assist Council to improve its sustainability over the
long term and addressing part of Council’s Infrastructure Backlog and continuation of its
current service levels
In respect of our Benchmarking analysis we have compared the Council’s key ratios with other councils
in DLG Group 5. Our key observations are:
Council’s financial flexibility as indicated by the Operating Ratio and Own Source Operating
Revenue Ratio is mixed with a strong Operating Ratio result against their peers despite
having a below average Own Source Operating Revenue Ratio due to the receipt of large
grants and contributions (both operating and capital)
Council’s ability to manage its debt commitments are on a par with its peers and is forecast to
remain above the benchmark
Council was in an acceptable liquidity position which on average is similar to the group’s
average liquidity level. Due to the limitations of the LTFP analysed this is scheduled to
decrease significantly below benchmark and the average
Council performs strongly in terms of its Capital Expenditure Ratio and level of Infrastructure
Backlog compared to the group average
Lake Macquarie City Council Page 6
Section 2 Introduction
2.1: Purpose of Report
This report provides the Council with an independent assessment of their financial capacity,
Sustainability and performance measured against a peer group of councils. It will complement their
internal due diligence, and the IP&R system of the Council and the DLG, together with the work being
undertaken by the Independent Local Government Review Panel.
The report is to be provided to the DLG and the Independent Local Government Review Panel.
The key areas focused on are:
The financial capacity of the Council to undertake additional borrowings
The long term Sustainability of the Council
The financial performance of the Council in comparison to a range of similar councils and
measured against prudent benchmarks
2.2: Scope and Methodology
TCorp’s approach was to:
Review the most recent three years of the Council’s consolidated audited accounts using
financial ratio analysis. In undertaking the ratio analysis TCorp has utilised ratio’s
substantially consistent with those used by Queensland Treasury Corporation (QTC) initially in
its review of Queensland Local Government (2008), and subsequently updated in 2011
Conduct a detailed review of the Council’s 10 year financial forecasts including a review of the
key assumptions that underpin the financial forecasts. The review of the financial forecasts
focused on the Council’s General Fund
Identify significant changes to future financial forecasts from existing financial performance
and highlight risks associated with such forecasts, including those that could impact Council’s
Sustainability
Conduct a benchmark review of a Council’s performance against its peer group
Prepare a report that provides an overview of the Council’s existing and forecast financial
position and its capacity to meet increased debt commitments and achieve long term
Sustainability
Conduct a high level review of the Council’s IP&R documents for factors which could impact
the Council’s financial capacity, performance and Sustainability
In undertaking its work, TCorp relied on:
Council’s audited financial statements (2008/09 to 2010/11)
Council’s financial forecast model
Council’s IP&R documents
Discussions with Council officers
Other publicly available information such as information published on the IPART website
Lake Macquarie City Council Page 7
Definition of Sustainability
In conducting our reviews, TCorp has relied upon the following definition of sustainability to provide
guidance:
"A local government will be financially sustainable over the long term when it is able to generate
sufficient funds to provide the levels of service and infrastructure agreed with its community."
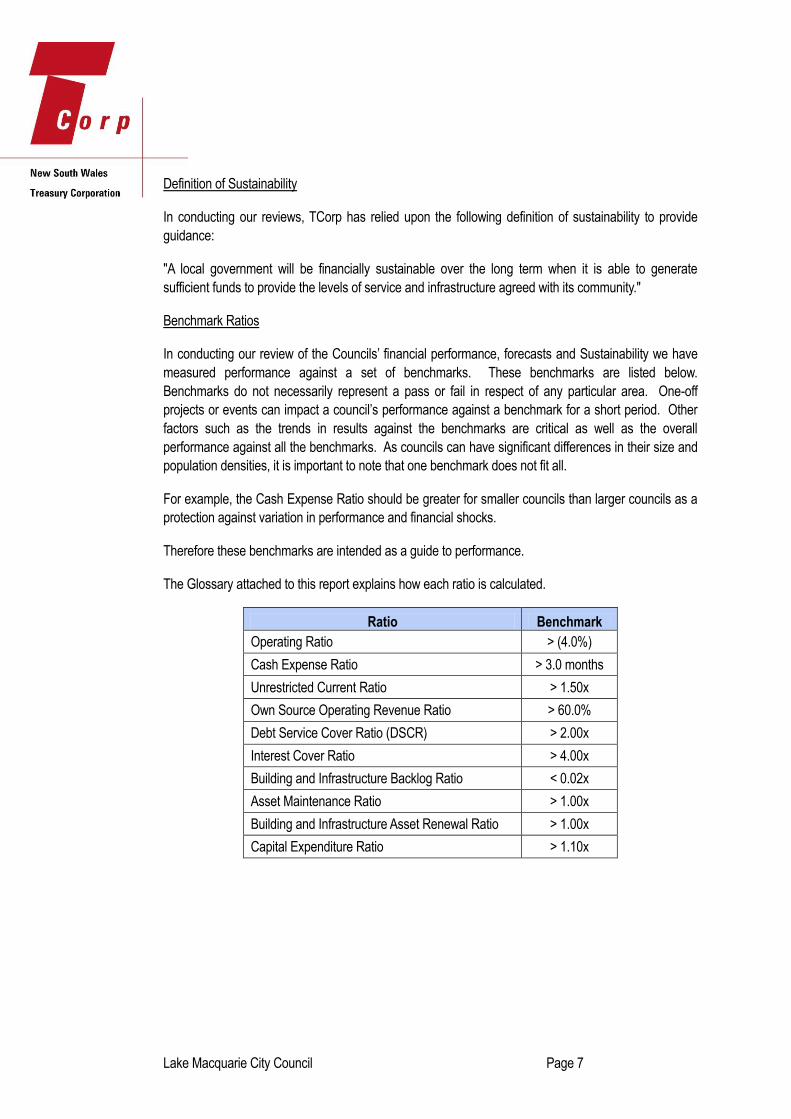
Benchmark Ratios
In conducting our review of the Councils’ financial performance, forecasts and Sustainability we have
measured performance against a set of benchmarks. These benchmarks are listed below.
Benchmarks do not necessarily represent a pass or fail in respect of any particular area. One-off
projects or events can impact a council’s performance against a benchmark for a short period. Other
factors such as the trends in results against the benchmarks are critical as well as the overall
performance against all the benchmarks. As councils can have significant differences in their size and
population densities, it is important to note that one benchmark does not fit all.
For example, the Cash Expense Ratio should be greater for smaller councils than larger councils as a
protection against variation in performance and financial shocks.
Therefore these benchmarks are intended as a guide to performance.
The Glossary attached to this report explains how each ratio is calculated.
Ratio Benchmark
Operating Ratio > (4.0%)
Cash Expense Ratio > 3.0 months
Unrestricted Current Ratio > 1.50x
Own Source Operating Revenue Ratio > 60.0%
Debt Service Cover Ratio (DSCR) > 2.00x
Interest Cover Ratio > 4.00x
Building and Infrastructure Backlog Ratio < 0.02x
Asset Maintenance Ratio > 1.00x
Building and Infrastructure Asset Renewal Ratio > 1.00x
Capital Expenditure Ratio > 1.10x
Lake Macquarie City Council Page 8
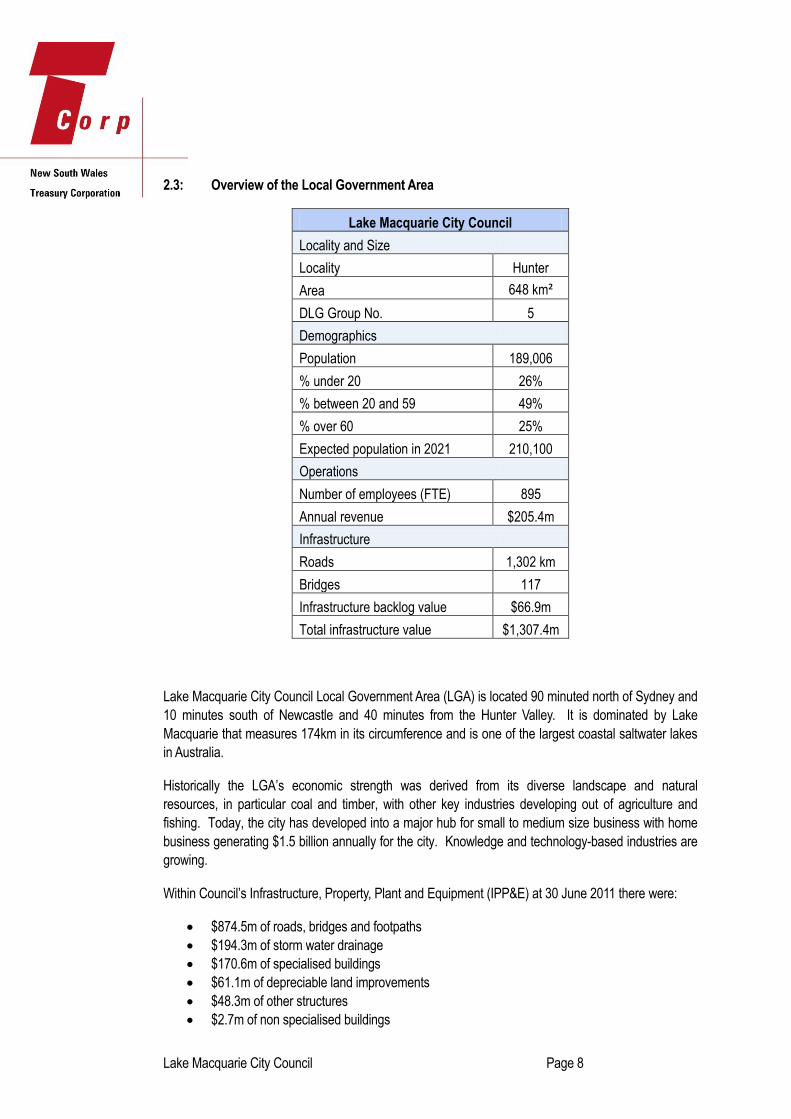
2.3: Overview of the Local Government Area
Lake Macquarie City Council
Locality and Size
Locality Hunter
Area 648 km²
DLG Group No. 5
Demographics
Population 189,006
% under 20 26%
% between 20 and 59 49%
% over 60 25%
Expected population in 2021 210,100
Operations
Number of employees (FTE) 895
Annual revenue $205.4m
Infrastructure
Roads 1,302 km
Bridges 117
Infrastructure backlog value $66.9m
Total infrastructure value $1,307.4m
Lake Macquarie City Council Local Government Area (LGA) is located 90 minuted north of Sydney and
10 minutes south of Newcastle and 40 minutes from the Hunter Valley. It is dominated by Lake
Macquarie that measures 174km in its circumference and is one of the largest coastal saltwater lakes
in Australia.
Historically the LGA’s economic strength was derived from its diverse landscape and natural
resources, in particular coal and timber, with other key industries developing out of agriculture and
fishing. Today, the city has developed into a major hub for small to medium size business with home
business generating $1.5 billion annually for the city. Knowledge and technology-based industries are
growing.
Within Council’s Infrastructure, Property, Plant and Equipment (IPP&E) at 30 June 2011 there were:
$874.5m of roads, bridges and footpaths
$194.3m of storm water drainage
$170.6m of specialised buildings
$61.1m of depreciable land improvements
$48.3m of other structures
$2.7m of non specialised buildings
Lake Macquarie City Council Page 9
Section 3 Review of Financial Performance and Position
In reviewing the financial performance of the Council, TCorp has based its review on the annual
audited accounts of the Council unless otherwise stated.
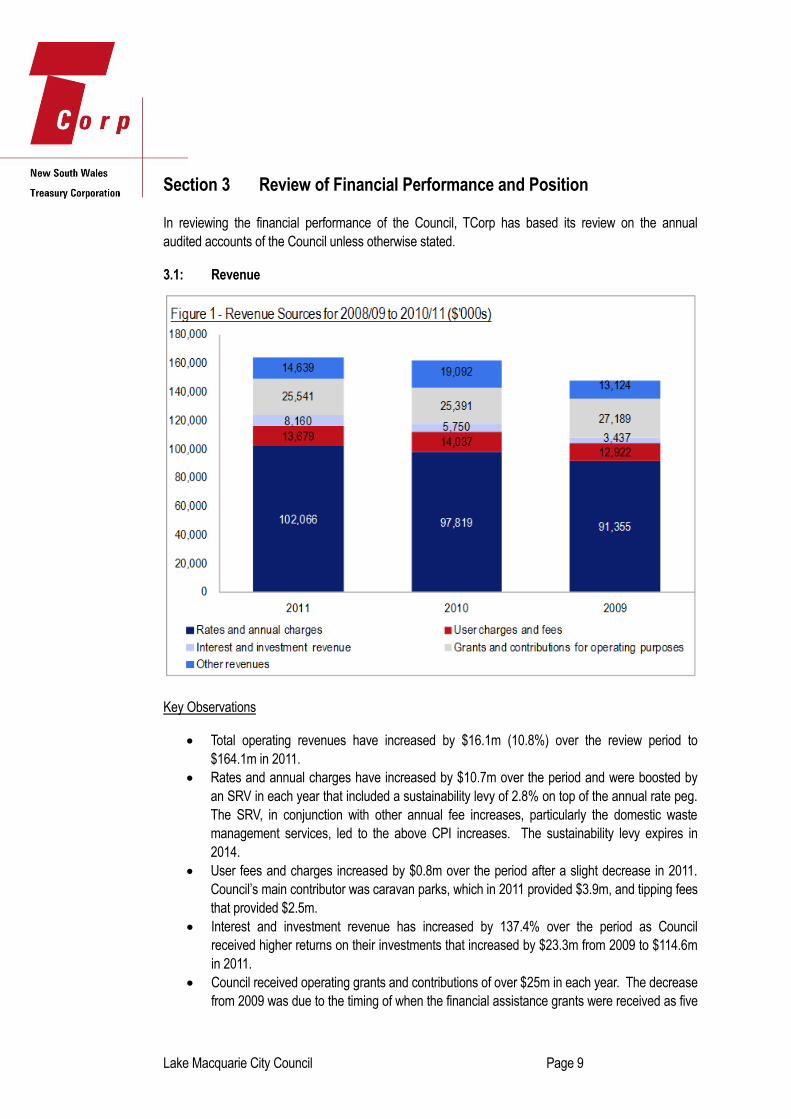
3.1: Revenue
Key Observations
Total operating revenues have increased by $16.1m (10.8%) over the review period to
$164.1m in 2011.
Rates and annual charges have increased by $10.7m over the period and were boosted by
an SRV in each year that included a sustainability levy of 2.8% on top of the annual rate peg.
The SRV, in conjunction with other annual fee increases, particularly the domestic waste
management services, led to the above CPI increases. The sustainability levy expires in
2014.
User fees and charges increased by $0.8m over the period after a slight decrease in 2011.
Council’s main contributor was caravan parks, which in 2011 provided $3.9m, and tipping fees
that provided $2.5m.
Interest and investment revenue has increased by 137.4% over the period as Council
received higher returns on their investments that increased by $23.3m from 2009 to $114.6m
in 2011.
Council received operating grants and contributions of over $25m in each year. The decrease
from 2009 was due to the timing of when the financial assistance grants were received as five
Lake Macquarie City Council Page 10
instalments were received in 2009 compared to the usual four quarterly payments in 2010
and 2011.
Other revenues were higher in 2010 due to external works under the RMS’s road
maintenance contract increasing by $5.6m to $12.5m. The major contributors in 2011 were
external works of $7.7m and property rental income of $4.3m.
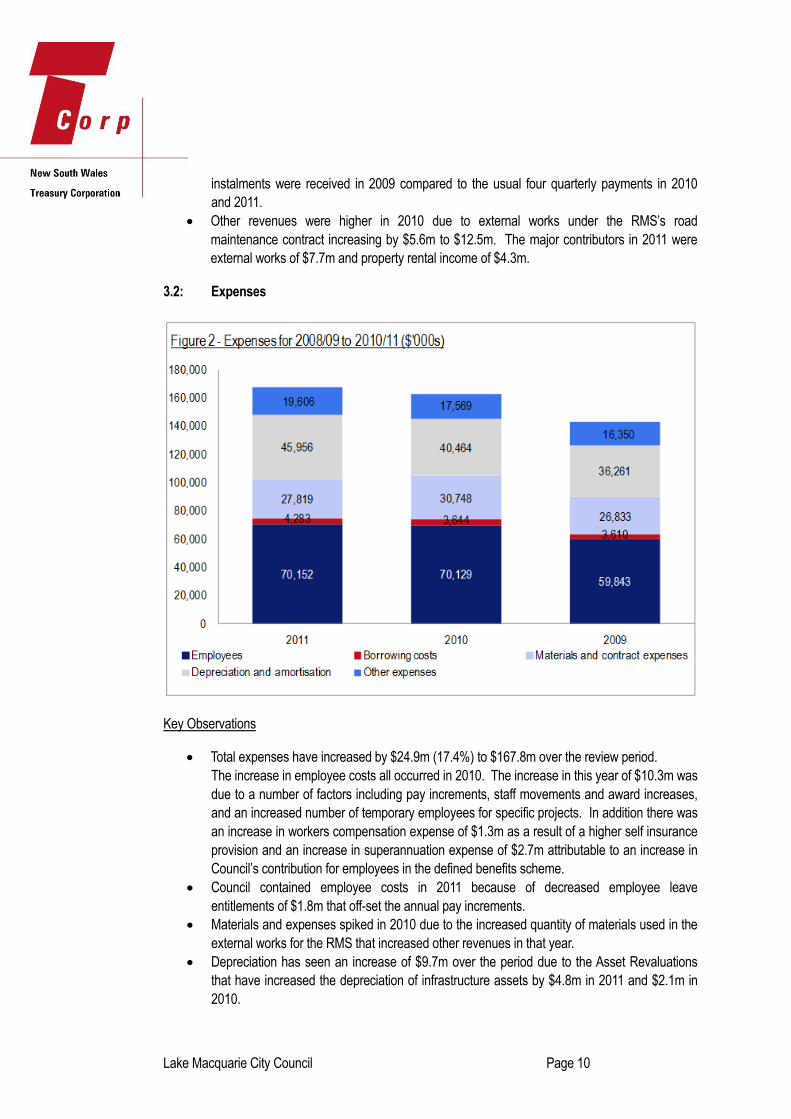
3.2: Expenses
Key Observations
Total expenses have increased by $24.9m (17.4%) to $167.8m over the review period.
The increase in employee costs all occurred in 2010. The increase in this year of $10.3m was
due to a number of factors including pay increments, staff movements and award increases,
and an increased number of temporary employees for specific projects. In addition there was
an increase in workers compensation expense of $1.3m as a result of a higher self insurance
provision and an increase in superannuation expense of $2.7m attributable to an increase in
Council’s contribution for employees in the defined benefits scheme.
Council contained employee costs in 2011 because of decreased employee leave
entitlements of $1.8m that off-set the annual pay increments.
Materials and expenses spiked in 2010 due to the increased quantity of materials used in the
external works for the RMS that increased other revenues in that year.
Depreciation has seen an increase of $9.7m over the period due to the Asset Revaluations
that have increased the depreciation of infrastructure assets by $4.8m in 2011 and $2.1m in
2010.
Lake Macquarie City Council Page 11
Other expenses have increased over the period by $3.3m, at a rate above CPI. In 2011 the
increases were mainly for items outside of Council’s control with street lighting, State fire
brigade and environmental contributions increased by a combined $1.7m.
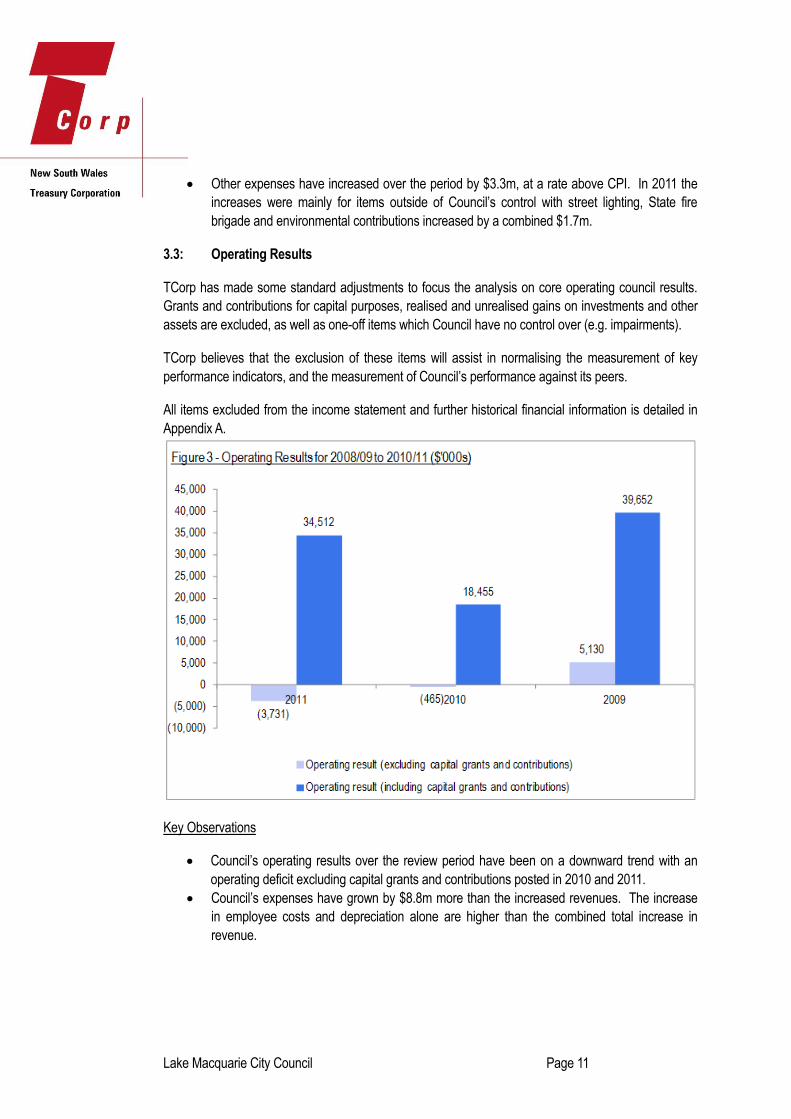
3.3: Operating Results
TCorp has made some standard adjustments to focus the analysis on core operating council results.
Grants and contributions for capital purposes, realised and unrealised gains on investments and other
assets are excluded, as well as one-off items which Council have no control over (e.g. impairments).
TCorp believes that the exclusion of these items will assist in normalising the measurement of key
performance indicators, and the measurement of Council’s performance against its peers.
All items excluded from the income statement and further historical financial information is detailed in
Appendix A.
Key Observations
Council’s operating results over the review period have been on a downward trend with an
operating deficit excluding capital grants and contributions posted in 2010 and 2011.
Council’s expenses have grown by $8.8m more than the increased revenues. The increase
in employee costs and depreciation alone are higher than the combined total increase in
revenue.
Lake Macquarie City Council Page 12
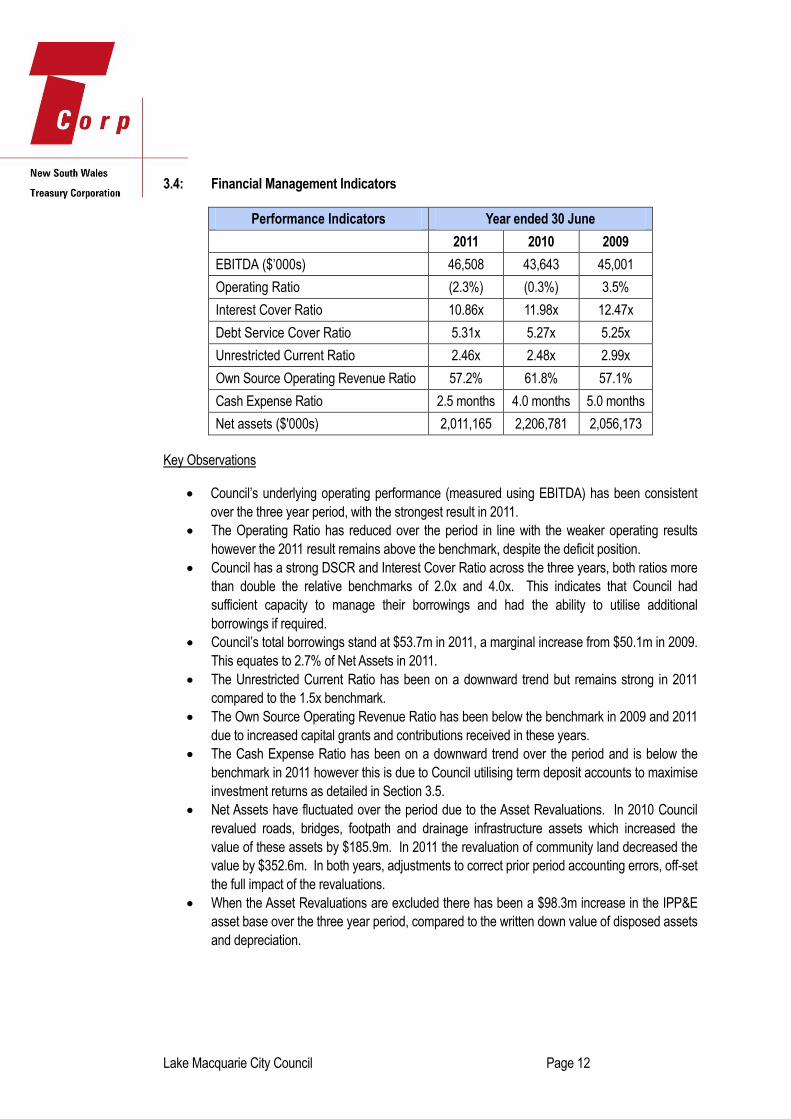
3.4: Financial Management Indicators
Performance Indicators Year ended 30 June
2011 2010 2009
EBITDA ($’000s) 46,508 43,643 45,001
Operating Ratio (2.3%) (0.3%) 3.5%
Interest Cover Ratio 10.86x 11.98x 12.47x
Debt Service Cover Ratio 5.31x 5.27x 5.25x
Unrestricted Current Ratio 2.46x 2.48x 2.99x
Own Source Operating Revenue Ratio 57.2% 61.8% 57.1%
Cash Expense Ratio 2.5 months 4.0 months 5.0 months
Net assets ($'000s) 2,011,165 2,206,781 2,056,173
Key Observations
Council’s underlying operating performance (measured using EBITDA) has been consistent
over the three year period, with the strongest result in 2011.
The Operating Ratio has reduced over the period in line with the weaker operating results
however the 2011 result remains above the benchmark, despite the deficit position.
Council has a strong DSCR and Interest Cover Ratio across the three years, both ratios more
than double the relative benchmarks of 2.0x and 4.0x. This indicates that Council had
sufficient capacity to manage their borrowings and had the ability to utilise additional
borrowings if required.
Council’s total borrowings stand at $53.7m in 2011, a marginal increase from $50.1m in 2009.
This equates to 2.7% of Net Assets in 2011.
The Unrestricted Current Ratio has been on a downward trend but remains strong in 2011
compared to the 1.5x benchmark.
The Own Source Operating Revenue Ratio has been below the benchmark in 2009 and 2011
due to increased capital grants and contributions received in these years.
The Cash Expense Ratio has been on a downward trend over the period and is below the
benchmark in 2011 however this is due to Council utilising term deposit accounts to maximise
investment returns as detailed in Section 3.5.
Net Assets have fluctuated over the period due to the Asset Revaluations. In 2010 Council
revalued roads, bridges, footpath and drainage infrastructure assets which increased the
value of these assets by $185.9m. In 2011 the revaluation of community land decreased the
value by $352.6m. In both years, adjustments to correct prior period accounting errors, off-set
the full impact of the revaluations.
When the Asset Revaluations are excluded there has been a $98.3m increase in the IPP&E
asset base over the three year period, compared to the written down value of disposed assets
and depreciation.
Lake Macquarie City Council Page 13
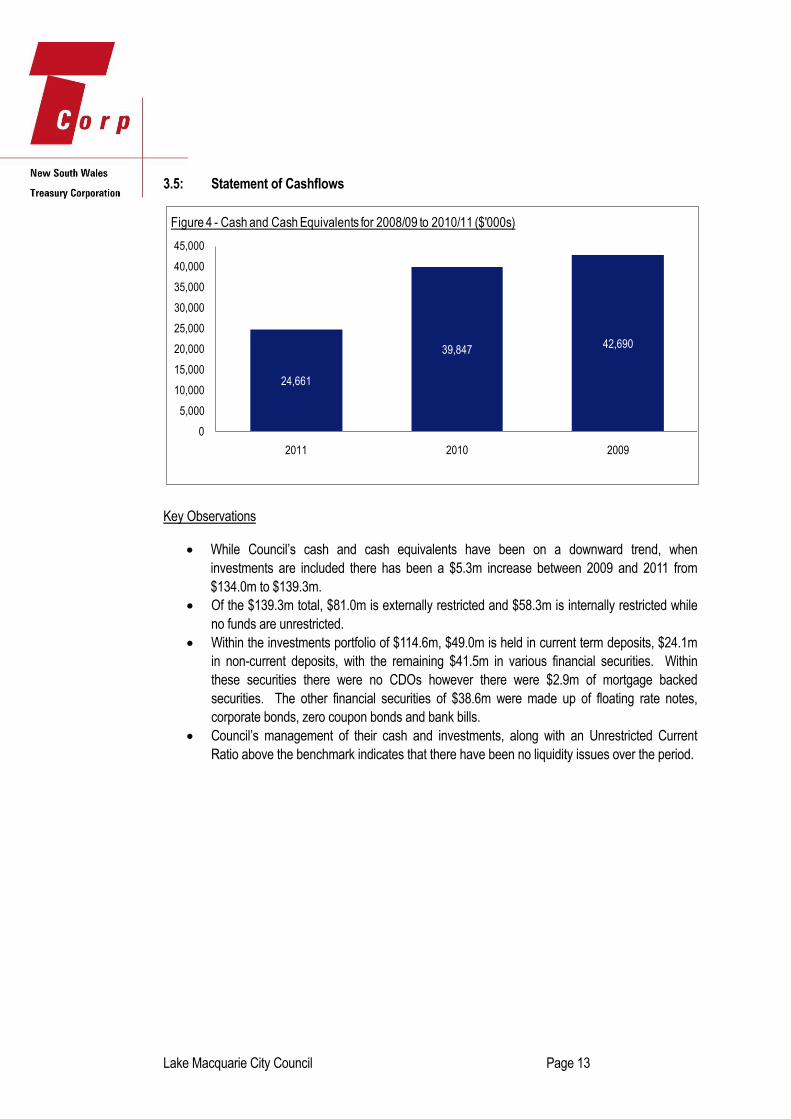
3.5: Statement of Cashflows
Key Observations
While Council’s cash and cash equivalents have been on a downward trend, when
investments are included there has been a $5.3m increase between 2009 and 2011 from
$134.0m to $139.3m.
Of the $139.3m total, $81.0m is externally restricted and $58.3m is internally restricted while
no funds are unrestricted.
Within the investments portfolio of $114.6m, $49.0m is held in current term deposits, $24.1m
in non-current deposits, with the remaining $41.5m in various financial securities. Within
these securities there were no CDOs however there were $2.9m of mortgage backed
securities. The other financial securities of $38.6m were made up of floating rate notes,
corporate bonds, zero coupon bonds and bank bills.
Council’s management of their cash and investments, along with an Unrestricted Current
Ratio above the benchmark indicates that there have been no liquidity issues over the period.
24,661
39,84742,690
0
5,000
10,000
15,000
20,000
25,000
30,000
35,000
40,000
45,000
2011 2010 2009
Figure 4 - Cash and Cash Equivalents for 2008/09 to 2010/11 ($'000s)
Lake Macquarie City Council Page 14
3.6: Capital Expenditure
The following section predominantly relies on information obtained from Special Schedules 7 and 8 that
accompany the annual financial statements. These figures are unaudited and are therefore Council’s
estimated figures.
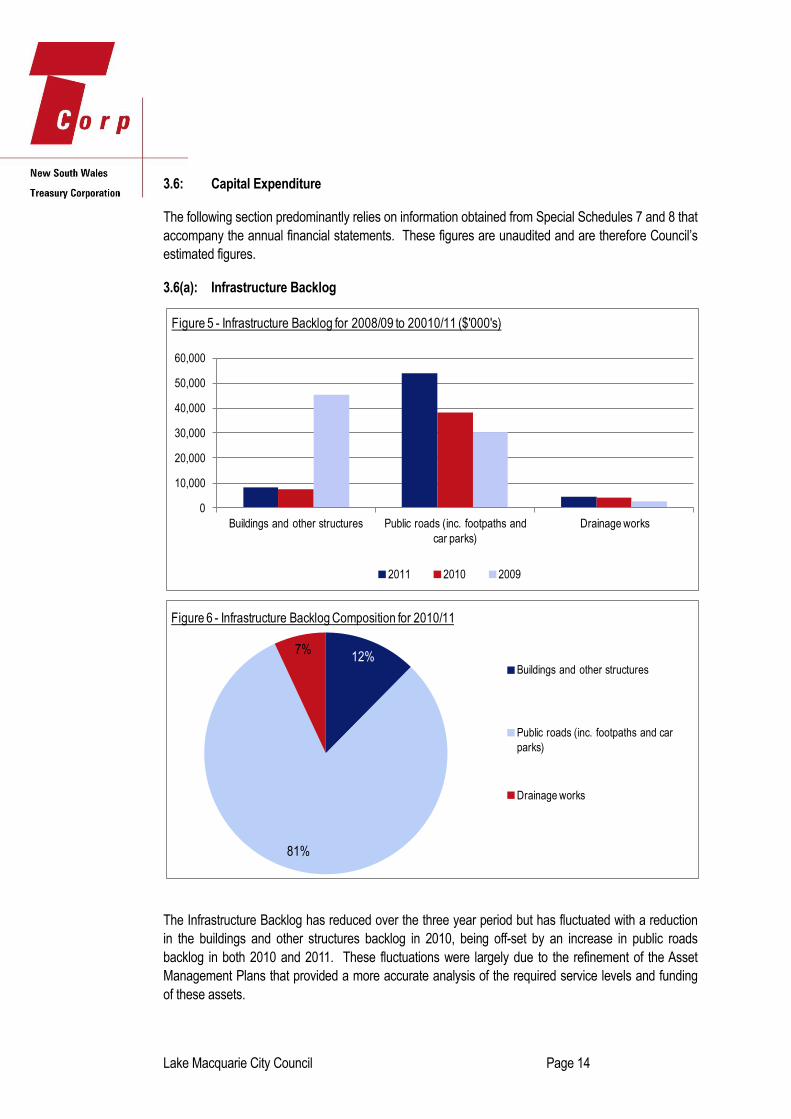
3.6(a): Infrastructure Backlog
The Infrastructure Backlog has reduced over the three year period but has fluctuated with a reduction
in the buildings and other structures backlog in 2010, being off-set by an increase in public roads
backlog in both 2010 and 2011. These fluctuations were largely due to the refinement of the Asset
Management Plans that provided a more accurate analysis of the required service levels and funding
of these assets.
0
10,000
20,000
30,000
40,000
50,000
60,000
Buildings and other structures Public roads (inc. footpaths and
car parks)
Drainage works
Figure 5 - Infrastructure Backlog for 2008/09 to 20010/11 ($'000's)
2011 2010 2009
12%
81%
7%
Figure 6 - Infrastructure Backlog Composition for 2010/11
Buildings and other structures
Public roads (inc. footpaths and car
parks)
Drainage works
Lake Macquarie City Council Page 15
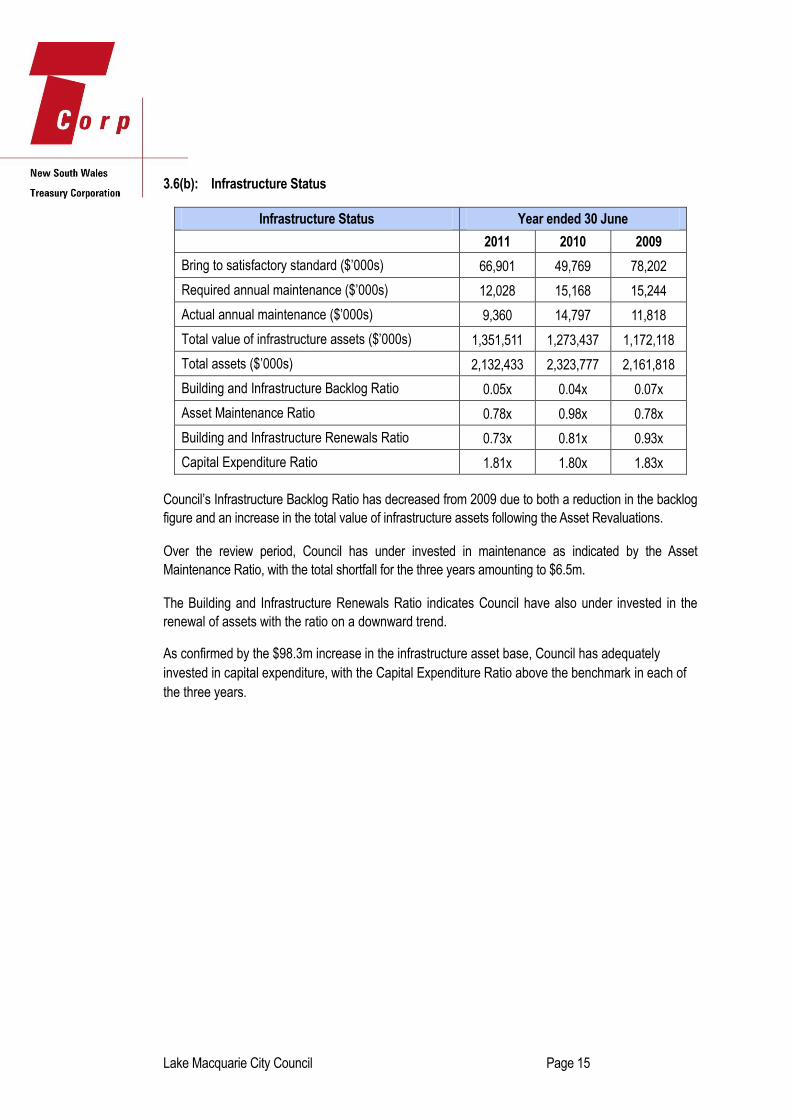
3.6(b): Infrastructure Status
Infrastructure Status Year ended 30 June
2011 2010 2009
Bring to satisfactory standard ($’000s) 66,901 49,769 78,202
Required annual maintenance ($’000s) 12,028 15,168 15,244
Actual annual maintenance ($’000s) 9,360 14,797 11,818
Total value of infrastructure assets ($’000s) 1,351,511 1,273,437 1,172,118
Total assets ($’000s) 2,132,433 2,323,777 2,161,818
Building and Infrastructure Backlog Ratio 0.05x 0.04x 0.07x
Asset Maintenance Ratio 0.78x 0.98x 0.78x
Building and Infrastructure Renewals Ratio 0.73x 0.81x 0.93x
Capital Expenditure Ratio 1.81x 1.80x 1.83x
Council’s Infrastructure Backlog Ratio has decreased from 2009 due to both a reduction in the backlog
figure and an increase in the total value of infrastructure assets following the Asset Revaluations.
Over the review period, Council has under invested in maintenance as indicated by the Asset
Maintenance Ratio, with the total shortfall for the three years amounting to $6.5m.
The Building and Infrastructure Renewals Ratio indicates Council have also under invested in the
renewal of assets with the ratio on a downward trend.
As confirmed by the $98.3m increase in the infrastructure asset base, Council has adequately
invested in capital expenditure, with the Capital Expenditure Ratio above the benchmark in each of
the three years.
Lake Macquarie City Council Page 16
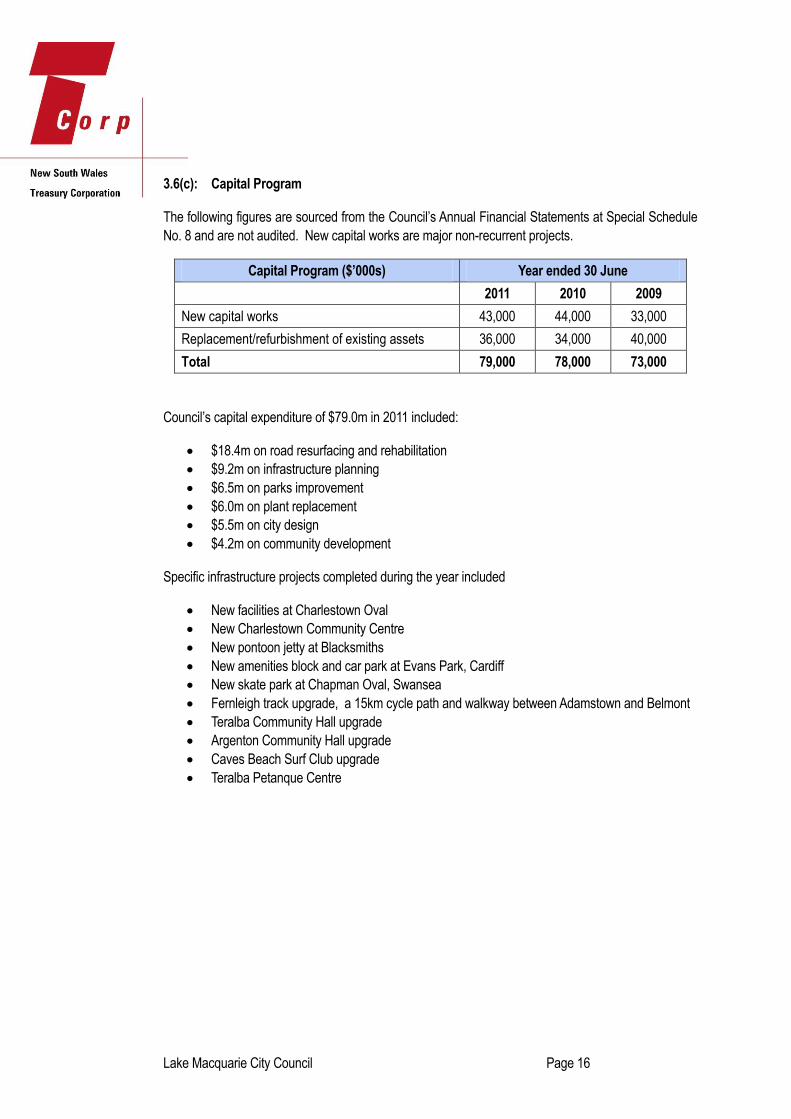
3.6(c): Capital Program
The following figures are sourced from the Council’s Annual Financial Statements at Special Schedule
No. 8 and are not audited. New capital works are major non-recurrent projects.
Capital Program ($’000s) Year ended 30 June
2011 2010 2009
New capital works 43,000 44,000 33,000
Replacement/refurbishment of existing assets 36,000 34,000 40,000
Total 79,000 78,000 73,000
Council’s capital expenditure of $79.0m in 2011 included:
$18.4m on road resurfacing and rehabilitation
$9.2m on infrastructure planning
$6.5m on parks improvement
$6.0m on plant replacement
$5.5m on city design
$4.2m on community development
Specific infrastructure projects completed during the year included
New facilities at Charlestown Oval
New Charlestown Community Centre
New pontoon jetty at Blacksmiths
New amenities block and car park at Evans Park, Cardiff
New skate park at Chapman Oval, Swansea
Fernleigh track upgrade, a 15km cycle path and walkway between Adamstown and Belmont
Teralba Community Hall upgrade
Argenton Community Hall upgrade
Caves Beach Surf Club upgrade
Teralba Petanque Centre
Lake Macquarie City Council Page 17
3.7: Specific Risks to Council
Inability to reduce Infrastructure Backlog. Council has not been able to significantly reduce
the backlog from the allocation of funding. Council has projected within its LTFP and IP&R
documents that they will have a cumulative operating deficit of $167m up to 2017. This
formed the basis of Council’s application for the seven year SRV that represented a
cumulative increase of 73.2% (inclusive of the rate peg) that was received by IPART in 2012.
This application was partially approved by IPART in June 2012 at a cumulative increase of
57.5% (inclusive of the rate peg). This partial SRV will allow Council to positively impact on
the Infrastructure Backlog and in turn their long term sustainability however they will have to
delay some capital projects that were scheduled within the original SRV application.
Expense increases above CPI. Council is classified within the extended regulated area for
the waste levy and they are charged for every tonne of waste that is sent to landfill. Council’s
current landfill site at Awaba is close to capacity and significant investment would have to be
made if this site was to be extended and brought up to current regulation standards. Council
has developed a waste strategy that has split waste into three separate bins to encourage
recycling. Other costs such as fuel and energy prices are also increasing at significant rates
that are putting additional pressure on Council’s operating result. Council completed a
service review project in 2011 that has identified savings/revenue opportunities that could be
worth $10-14m p.a. to Council.
Environmental issues / Climate change. With a significant proportion of the LGA being close
to the lake and/or the coast, the effect of rising sea levels could have a significant impact on
the community. As detailed within Section 4.6, Council has been proactive in combating this
risk and have developed an Environmental Sustainability Action Plan as well as becoming
involved in external organisations that have recognised Council’s work in this field.
Lake Macquarie City Council Page 18
Section 4 Review of Financial Forecasts
The financial forecast model shows the projected financial statements and assumptions for the next 10
years. As Council only operates one General Fund we have focussed our analysis on this General
Fund.
The forecast that has been analysed was provided to TCorp following IPART’s partial approval of
Council’s SRV application. It is to be noted that while the forecast revenue has been amended to
reflect IPARTs decision, not all expenses had been updated. Specifically the capital expenditure had
not been amended to reflect the delays/restructuring to certain projects that will result from Council not
receiving the full SRV increase above the rate peg. This task will be completed by Council in line with
a review of the LTFP and Community Strategic Plan during the 2012/13 financial year.
The LTFP provided to TCorp by Council illustrated a requirement for an increasing overdraft to highlight
the impact of consecutive operating deficits prior to the SRV approval despite cash and investments
actually growing over the forecast. This artificially negatively impacts the Unrestricted Current Ratio in
particular as current liabilities appear larger than they would actually be if cash and investments were
used to reduce the overdraft facility.
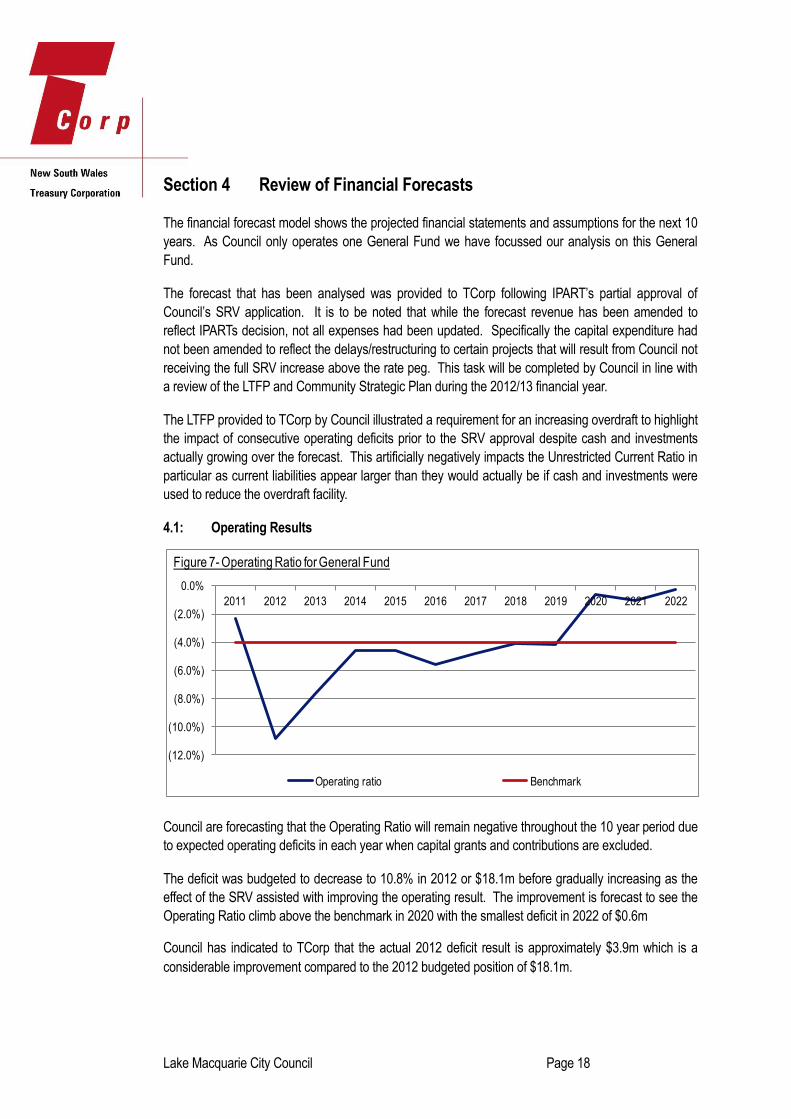
4.1: Operating Results
Council are forecasting that the Operating Ratio will remain negative throughout the 10 year period due
to expected operating deficits in each year when capital grants and contributions are excluded.
The deficit was budgeted to decrease to 10.8% in 2012 or $18.1m before gradually increasing as the
effect of the SRV assisted with improving the operating result. The improvement is forecast to see the
Operating Ratio climb above the benchmark in 2020 with the smallest deficit in 2022 of $0.6m
Council has indicated to TCorp that the actual 2012 deficit result is approximately $3.9m which is a
considerable improvement compared to the 2012 budgeted position of $18.1m.
(12.0%)
(10.0%)
(8.0%)
(6.0%)
(4.0%)
(2.0%)
0.0%
2011 2012 2013 2014 2015 2016 2017 2018 2019 2020 2021 2022
Figure 7- Operating Ratio for General Fund
Operating ratio Benchmark
Lake Macquarie City Council Page 19
4.2: Financial Management Indicators
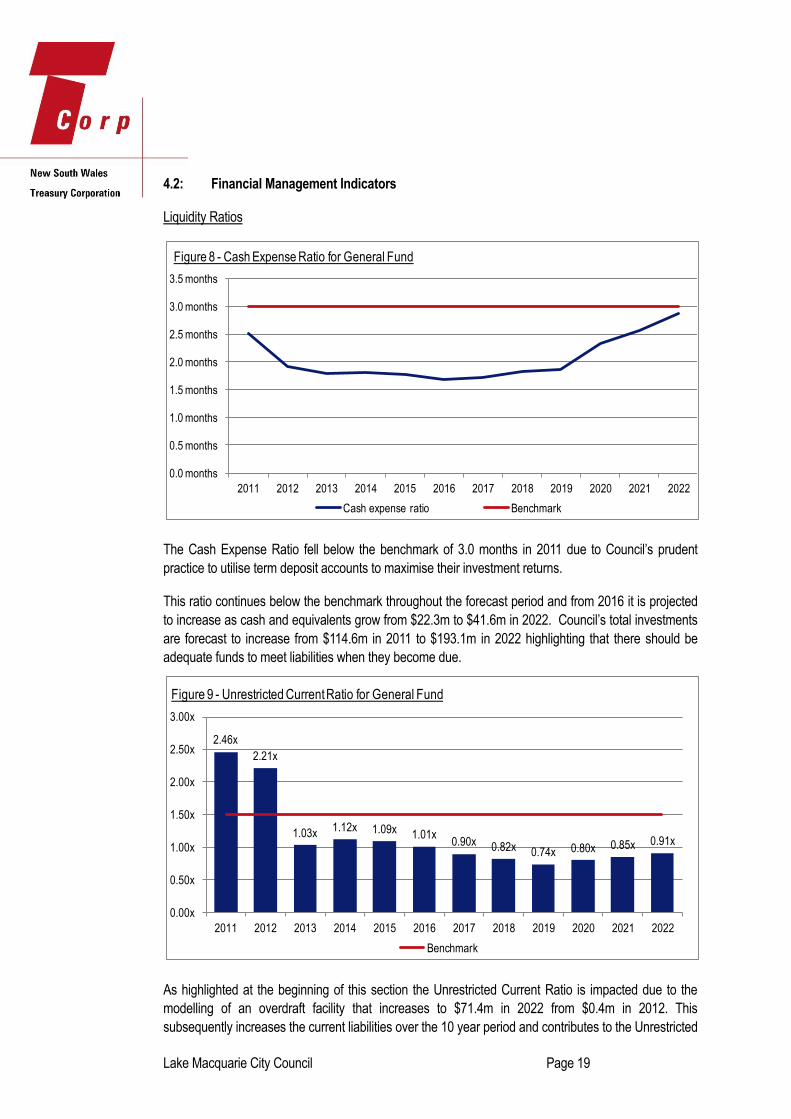
Liquidity Ratios
The Cash Expense Ratio fell below the benchmark of 3.0 months in 2011 due to Council’s prudent
practice to utilise term deposit accounts to maximise their investment returns.
This ratio continues below the benchmark throughout the forecast period and from 2016 it is projected
to increase as cash and equivalents grow from $22.3m to $41.6m in 2022. Council’s total investments
are forecast to increase from $114.6m in 2011 to $193.1m in 2022 highlighting that there should be
adequate funds to meet liabilities when they become due.
As highlighted at the beginning of this section the Unrestricted Current Ratio is impacted due to the
modelling of an overdraft facility that increases to $71.4m in 2022 from $0.4m in 2012. This
subsequently increases the current liabilities over the 10 year period and contributes to the Unrestricted
0.0 months
0.5 months
1.0 months
1.5 months
2.0 months
2.5 months
3.0 months
3.5 months
2011 2012 2013 2014 2015 2016 2017 2018 2019 2020 2021 2022
Figure 8 - Cash Expense Ratio for General Fund
Cash expense ratio Benchmark
2.46x
2.21x
1.03x1.12x 1.09x 1.01x
0.90x 0.82x 0.74x 0.80x 0.85x 0.91x
0.00x
0.50x
1.00x
1.50x
2.00x
2.50x
3.00x
2011 2012 2013 2014 2015 2016 2017 2018 2019 2020 2021 2022
Figure 9 - Unrestricted Current Ratio for General Fund
Benchmark
Lake Macquarie City Council Page 20
Current Ratio staying below the benchmark in each year with Council being technically insolvent from
2017 onwards when the ratio decreases below 1.00x. Council has indicated that this situation will not
occur as the model included the overdraft specifically to reflect the budget deficit positions prior to the
partial SRV approval.
Once the LTFP plan has been fully updated to reflect the partial SRV approval and the amendment in
the capital expenditure program then the overdraft will be removed and a more realistic Unrestricted
Current Ratio will be calculated.
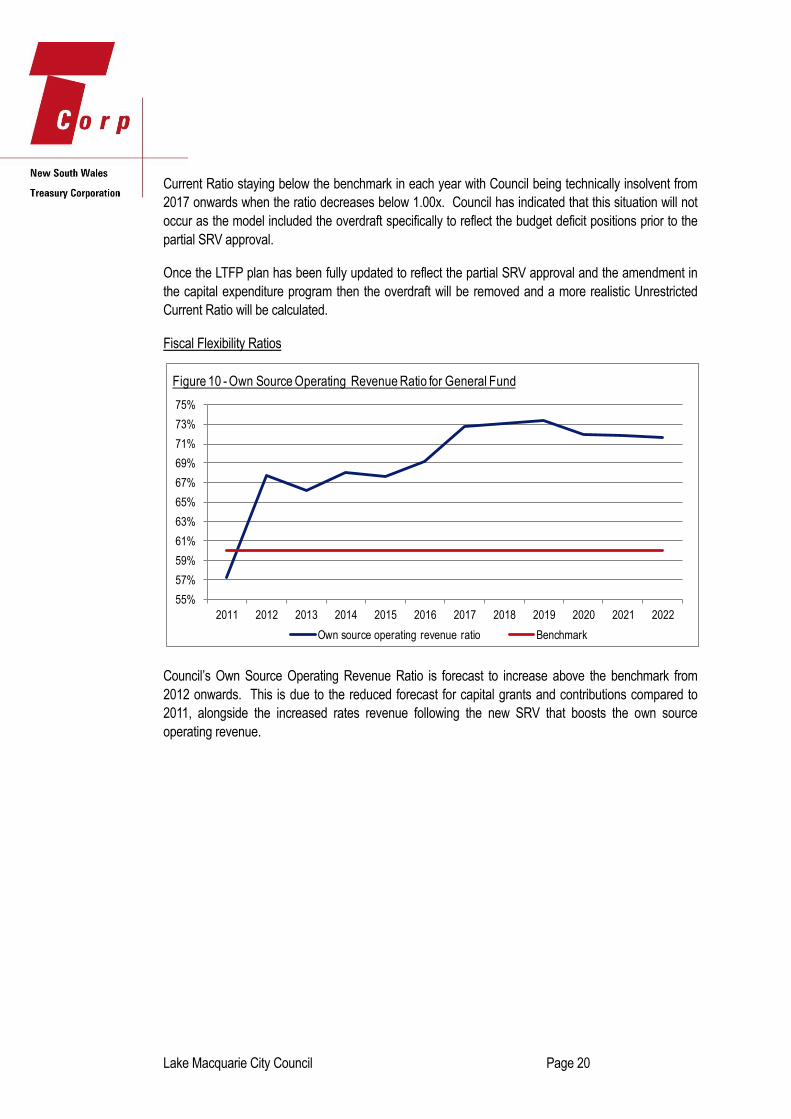
Fiscal Flexibility Ratios
Council’s Own Source Operating Revenue Ratio is forecast to increase above the benchmark from
2012 onwards. This is due to the reduced forecast for capital grants and contributions compared to
2011, alongside the increased rates revenue following the new SRV that boosts the own source
operating revenue.
55%
57%
59%
61%
63%
65%
67%
69%
71%
73%
75%
2011 2012 2013 2014 2015 2016 2017 2018 2019 2020 2021 2022
Figure 10 - Own Source Operating Revenue Ratio for General Fund
Own source operating revenue ratio Benchmark

Lake Macquarie City Council Page 21
The DSCR remains above the benchmark in all forecast years. This is with Council forecasting to
increase their borrowings from $53.7m in 2011 to $206.2m in 2022. Council has indicated that the
proposed new borrowings would be repaid over a term of 25 years to address intergenerational equity
compared to the current loan portfolio where a number of loans are only for 10 year terms.
The repayments on the new loan facilities will therefore be lower as they are set over a longer
repayment term and as the shorter term loans expire they mitigate the increased debt service costs
from the total borrowings increasing. This helps maintain the DSCR at an acceptable level over the
forecast period despite the large increase in borrowings.
In line with Council’s forecast increase in borrowings the Interest Cover Ratio decreases as the
borrowing costs increase at a faster relative rate than EBITDA over the review period. It appears that
Council do have the capacity to incorporate further borrowings as indicated by the DSCR and Interest
Cover Ratio however until the new forecast has been updated in full and the Unrestricted Current Ratio
5.31x
4.30x
4.81x 4.78x 4.82x4.41x 4.48x
4.20x3.91x 3.97x 3.87x 3.92x
0.00x
1.00x
2.00x
3.00x
4.00x
5.00x
6.00x
2011 2012 2013 2014 2015 2016 2017 2018 2019 2020 2021 2022
Figure 11 - DSCR for General Fund
Benchmark
10.86x
8.62x 8.97x
7.86x7.36x
5.87x 5.54x 5.21x4.83x 4.95x 4.90x 4.98x
0.00x
2.00x
4.00x
6.00x
8.00x
10.00x
12.00x
2011 2012 2013 2014 2015 2016 2017 2018 2019 2020 2021 2022
Figure 12 - Interest Cover Ratio for General Fund
Benchmark
Lake Macquarie City Council Page 22
is updated to reflect the amended position then we are not in a position to confirm that this is the
situation.
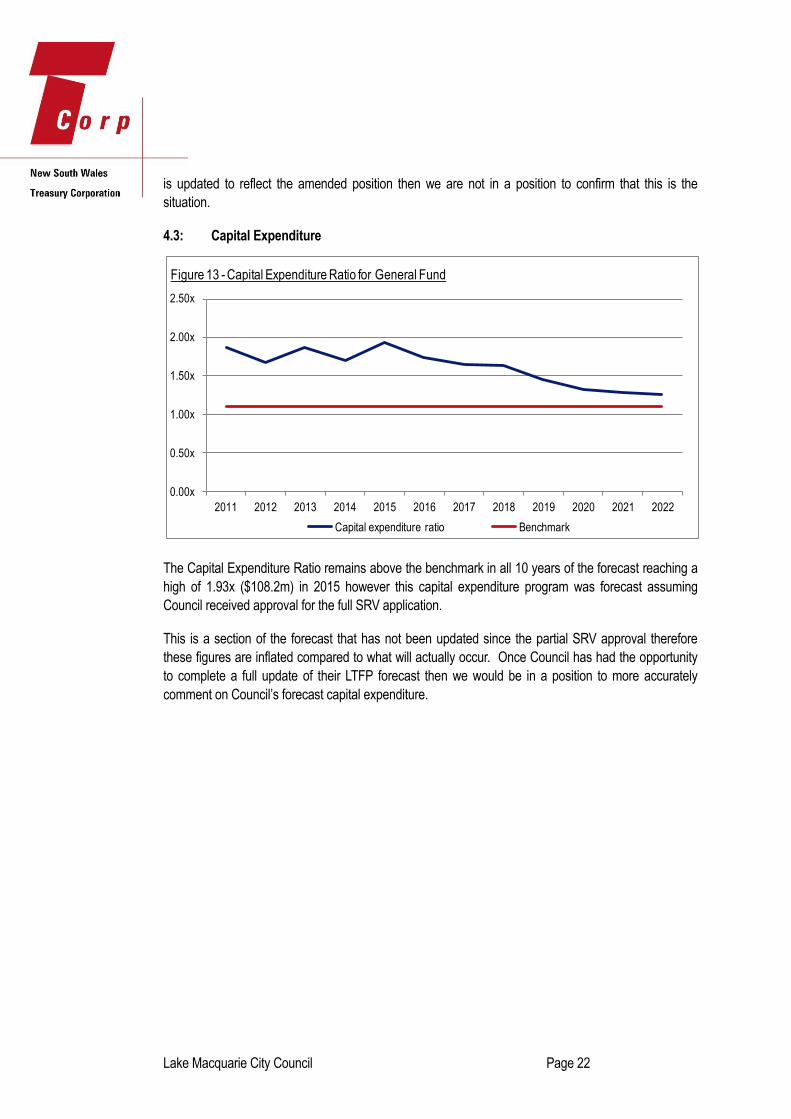
4.3: Capital Expenditure
The Capital Expenditure Ratio remains above the benchmark in all 10 years of the forecast reaching a
high of 1.93x ($108.2m) in 2015 however this capital expenditure program was forecast assuming
Council received approval for the full SRV application.
This is a section of the forecast that has not been updated since the partial SRV approval therefore
these figures are inflated compared to what will actually occur. Once Council has had the opportunity
to complete a full update of their LTFP forecast then we would be in a position to more accurately
comment on Council’s forecast capital expenditure.
0.00x
0.50x
1.00x
1.50x
2.00x
2.50x
2011 2012 2013 2014 2015 2016 2017 2018 2019 2020 2021 2022
Figure 13 - Capital Expenditure Ratio for General Fund
Capital expenditure ratio Benchmark
Lake Macquarie City Council Page 23
4.4: Financial Model Assumption Review
Councils have used their own assumptions in developing their forecasts.
In order to evaluate the validity of the Council’s forecast model, TCorp has compared the model
assumptions versus TCorp’s benchmarks for annual increases in the various revenue and expenditure
items. Any material differences from these benchmarks should be explained through the LTFP.
TCorp’s benchmarks:
Rates and annual charges: TCorp notes that rates increased by 3.4% in the year to
September 2011, and in December 2011, IPART announced that the rate peg to apply in the
2012/13 financial year will be 3.6%. Beyond 2013 TCorp has assessed a general benchmark
for rates and annual charges to increase by mid-range LGCI annual increases of 3.0%
Interest and investment revenue: annual return of 5.0%
All other revenue items: the estimated annual CPI increase of 2.5%
Employee costs: 3.5% (estimated CPI+1.0%)
All other expenses: the estimated annual CPI increase of 2.5%
Key Observations and Risks
The forecast has been completed with service levels in line with the expectations of the
community, on an ‘as is’ basis.
Council has noted that the implementation of detailed asset management plans will have a
significant impact on the ongoing review of the LTFP.
Employee costs, materials and contract expenses and other expenses are combined under
‘operating expenses’ within the forecast Income Statement.
These combined ‘operating expenses’ were forecast to increase by 11.8% or $13.9m between
2011 and 2012. In subsequent discussions with Council we have been advised that the
actual increase of the total operating expenses for 2012 was $6.7m below the budgeted
figure.
Council has forecast that there will be approximately 400 new rateable properties p.a.
providing approximately $0.25m in additional rates revenue but these properties will also
require additional capital and maintenance costs.
Taking note of the above points, and the need to make some amendments to the LTFP, as
discussed earlier, we believe that the majority of Council’s assumptions appear realistic and
where a variation above the rate of CPI is used there is a reasonable explanation for this.
Lake Macquarie City Council Page 24
4.5: Borrowing Capacity
When analysing the financial capacity of the Council we believe Council may be able to incorporate
additional loan funding in addition to its existing debt facilities. With Council’s forecast that TCorp has
analysed not being completely up to date in terms of capital expenditure and other expenses we are not
able to accurately calculate Council’s ability to manage additional borrowings over and above the existing
forecast borrowings contained in the LTFP.
4.6: Sustainability
Council has a strong focus on sustainability, both environmentally and economically.
Council developed an Environmental Sustainability Plan in 2011 to provide a framework for sustainability
planning and decision making to ensure the improved environmental sustainability for the LGA. Council
also implemented ecosystem enhancement projects to improve stormwater water quality and stabilise
and rehabilitate foreshores and wetlands.
Council were the first council to receive the Silver Partner status within the NSW Government’s
Sustainability Advantage Program that recognises both environmental and financial improvements. This
program has assisted Council to become more cost efficient while also reducing their greenhouse gas
emissions.
Council is also a Climate Change Adaptation Champion and since 2007 has actively researched and
taken action to adapt to predicted sea level rises and increased flooding that would severely impact the
LGA given the proximity of the lake and coastline for a significant number of residents. This included
being one of the first councils to adopt a sea level rise policy and action plan in 2008.
In respect of financial sustainability, in 2011 Council completed a comprehensive two year service review
project. Council estimate that the total benefit of the review to be between $10-14m p.a. The project
identified approximately $4m p.a. in savings and improvements while also establishing a commercial
vehicle, Lakemac Enterprises, which is expected to generate revenues of $1m p.a. within five years from
‘entrepreneurial activities’. These activities include Lakemac Print, a graphic design and printing
business, increased planning and building services and fleet management services.
A new five year Investment Property Strategy was also developed in 2011 to expand opportunities and
revenues of $6-9m p.a. over the five year period to 2016. Council owns over $54m worth of investment
properties and they plan to develop a more commercially focussed property department that will have a
number of specific initiatives relating to property development, investment, and land offsets and
biodiversity trading.
In considering the longer term financial sustainability of the Council we make the following comments:
Council has informed TCorp that their main focus is to reach an operating surplus as a means
of ensuring their sustainability. The 2012 deficit is expected to be $5.6m, a significant
improvement against the 2012 LTFP forecast deficit of $18.1m
Despite Council’s focus on achieving an operating surplus, the LTFP forecast projects a
continuing, albeit decreasing deficit position (excluding capital grants and contributions),
Lake Macquarie City Council Page 25
suggesting Council’s future sustainability over the long term is improving, but is still dependent
on third party capital grants
Council has forecast a significant increase in borrowings across the next 10 years to enable the
scheduled capital expenditure program to be undertaken.
Lake Macquarie City Council Page 26
Section 5 Benchmarking and Comparisons with Other Councils
As discussed in section 2 of this report, each council’s performance has been assessed against ten key
benchmark ratios. This section of the report compares the Council’s consolidated performance with its
peers in the same DLG Group. The Council is in DLG Group 5 and there are six councils in this group.
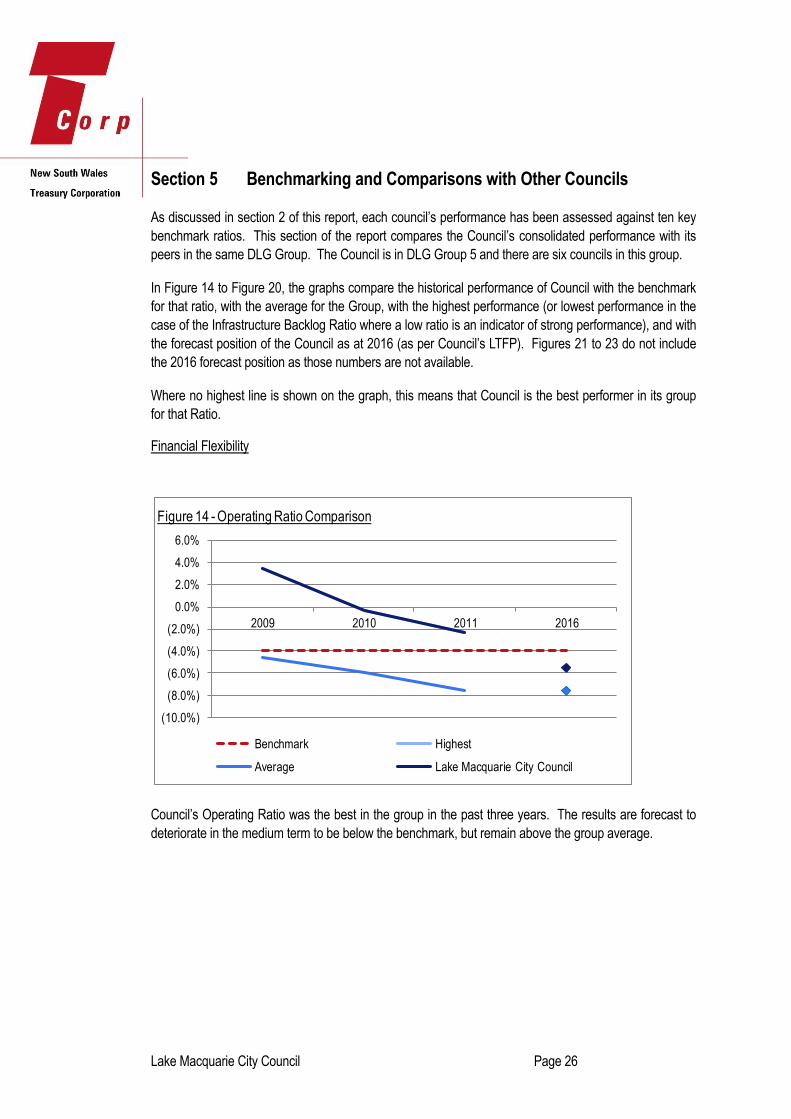
In Figure 14 to Figure 20, the graphs compare the historical performance of Council with the benchmark
for that ratio, with the average for the Group, with the highest performance (or lowest performance in the
case of the Infrastructure Backlog Ratio where a low ratio is an indicator of strong performance), and with
the forecast position of the Council as at 2016 (as per Council’s LTFP). Figures 21 to 23 do not include
the 2016 forecast position as those numbers are not available.
Where no highest line is shown on the graph, this means that Council is the best performer in its group
for that Ratio.
Financial Flexibility
Council’s Operating Ratio was the best in the group in the past three years. The results are forecast to
deteriorate in the medium term to be below the benchmark, but remain above the group average.
(10.0%)
(8.0%)
(6.0%)
(4.0%)
(2.0%)
0.0%
2.0%
4.0%
6.0%
2009 2010 2011 2016
Figure 14 - Operating Ratio Comparison
Benchmark Highest
Average Lake Macquarie City Council
Lake Macquarie City Council Page 27
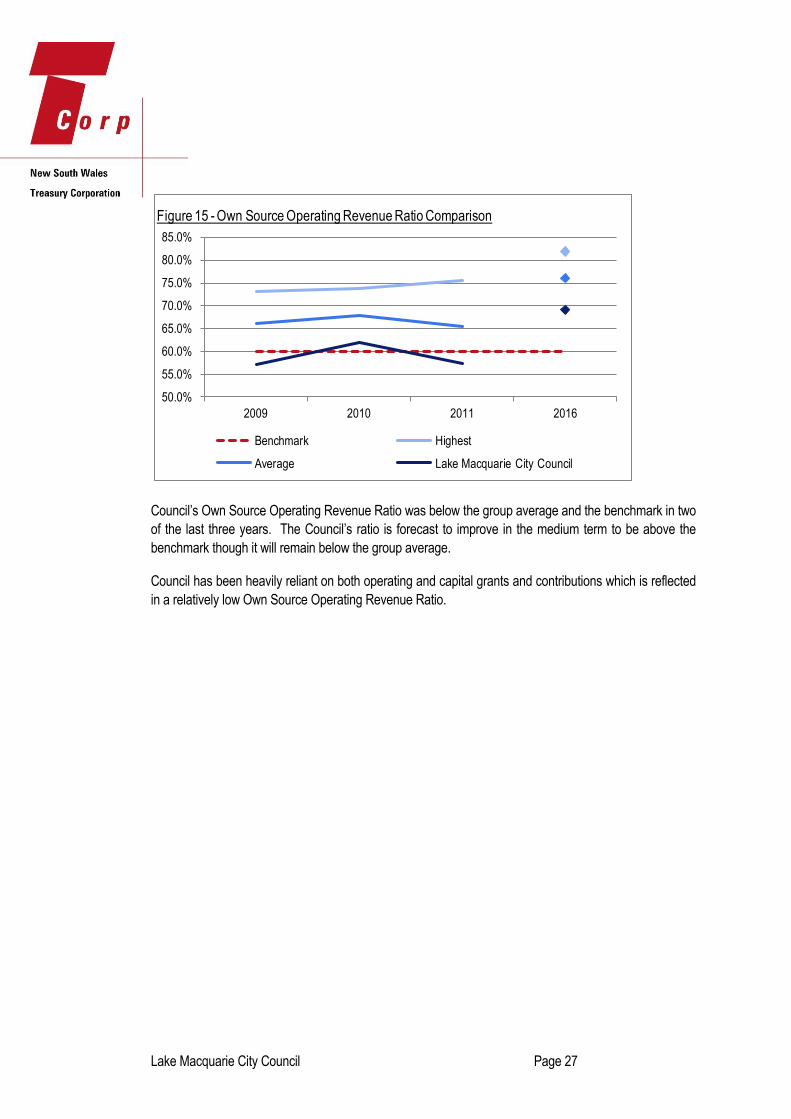
Council’s Own Source Operating Revenue Ratio was below the group average and the benchmark in two
of the last three years. The Council’s ratio is forecast to improve in the medium term to be above the
benchmark though it will remain below the group average.
Council has been heavily reliant on both operating and capital grants and contributions which is reflected
in a relatively low Own Source Operating Revenue Ratio.
50.0%
55.0%
60.0%
65.0%
70.0%
75.0%
80.0%
85.0%
2009 2010 2011 2016
Figure 15 - Own Source Operating Revenue Ratio Comparison
Benchmark Highest
Average Lake Macquarie City Council

Lake Macquarie City Council Page 28
Liquidity
On average over the past three years, the Council’s liquidity position has been acceptable but is
deteriorating and based on the existing forecast model this is expected to continue in the medium term,
although following the updating of the LTFP to be undertaken by Council this position is expected to
improve.
0.0 months
5.0 months
10.0 months
15.0 months
20.0 months
2009 2010 2011 2016
Figure 16 - Cash Expense Ratio Comparison
Benchmark Highest
Average Lake Macquarie City Council
1.00
1.50
2.00
2.50
3.00
3.50
2009 2010 2011 2016
Figure 17 - Unrestricted Current Ratio Comparison
Benchmark Highest
Average Lake Macquarie City Council
Lake Macquarie City Council Page 29
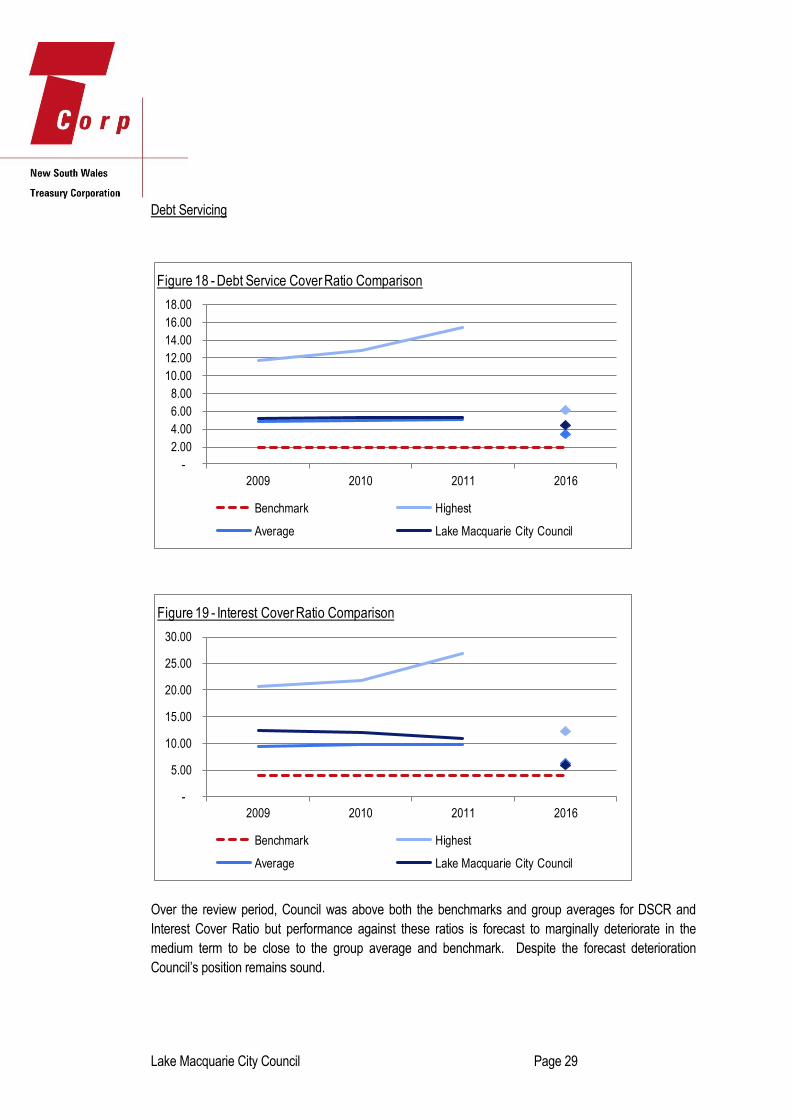
Debt Servicing
Over the review period, Council was above both the benchmarks and group averages for DSCR and
Interest Cover Ratio but performance against these ratios is forecast to marginally deteriorate in the
medium term to be close to the group average and benchmark. Despite the forecast deterioration
Council’s position remains sound.
-
2.00
4.00
6.00
8.00
10.00
12.00
14.00
16.00
18.00
2009 2010 2011 2016
Figure 18 - Debt Service Cover Ratio Comparison
Benchmark Highest
Average Lake Macquarie City Council
-
5.00
10.00
15.00
20.00
25.00
30.00
2009 2010 2011 2016
Figure 19 - Interest Cover Ratio Comparison
Benchmark Highest
Average Lake Macquarie City Council
Lake Macquarie City Council Page 30
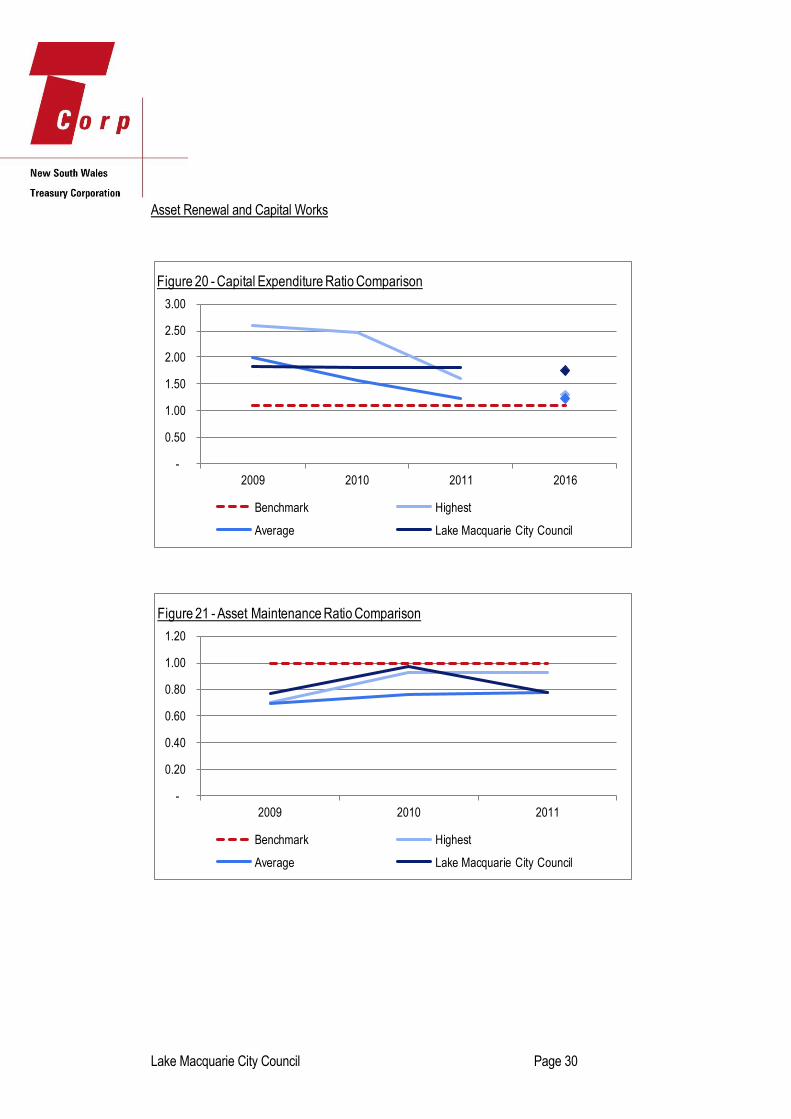
Asset Renewal and Capital Works
-
0.50
1.00
1.50
2.00
2.50
3.00
2009 2010 2011 2016
Figure 20 - Capital Expenditure Ratio Comparison
Benchmark Highest
Average Lake Macquarie City Council
-
0.20
0.40
0.60
0.80
1.00
1.20
2009 2010 2011
Figure 21 - Asset Maintenance Ratio Comparison
Benchmark Highest
Average Lake Macquarie City Council
Lake Macquarie City Council Page 31
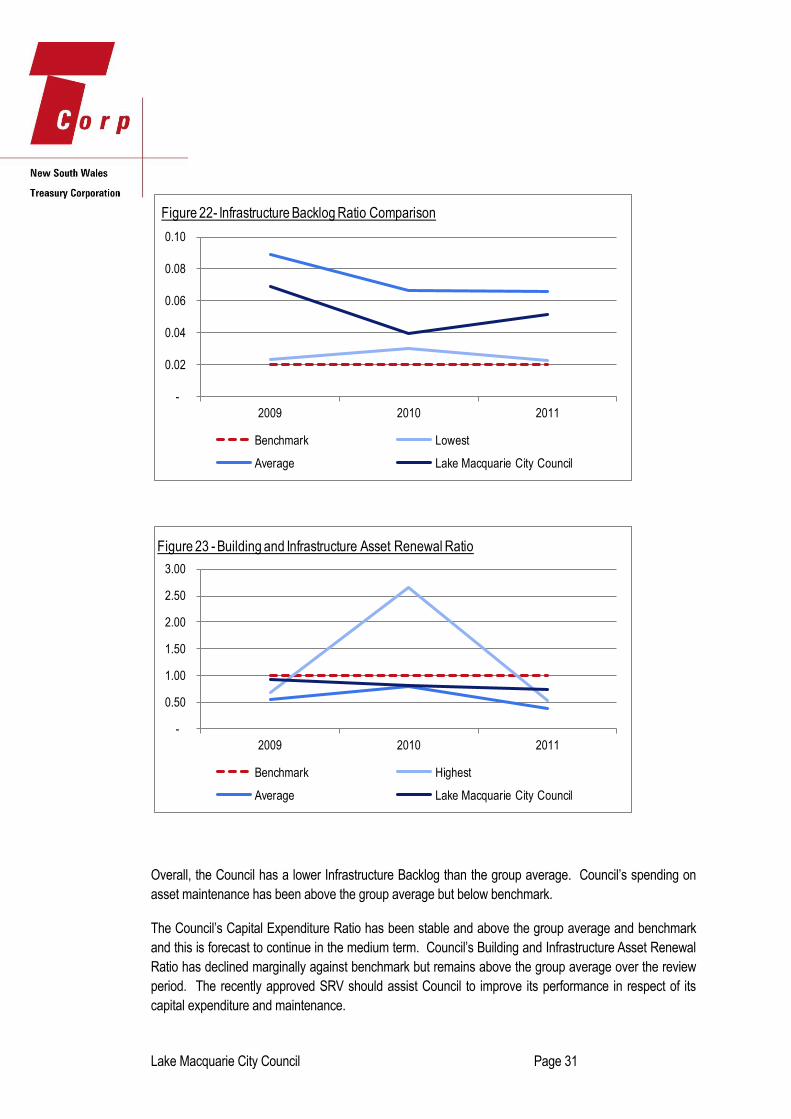
Overall, the Council has a lower Infrastructure Backlog than the group average. Council’s spending on
asset maintenance has been above the group average but below benchmark.
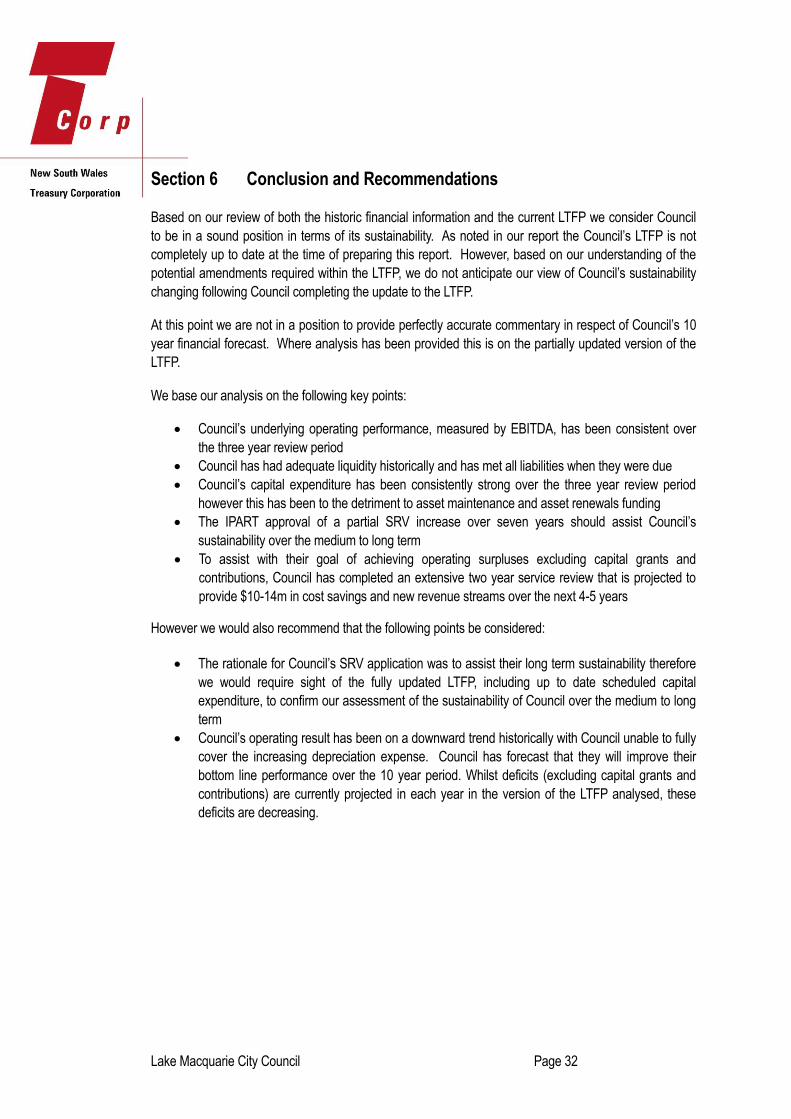
The Council’s Capital Expenditure Ratio has been stable and above the group average and benchmark
and this is forecast to continue in the medium term. Council’s Building and Infrastructure Asset Renewal
Ratio has declined marginally against benchmark but remains above the group average over the review
period. The recently approved SRV should assist Council to improve its performance in respect of its
capital expenditure and maintenance.
-
0.02
0.04
0.06
0.08
0.10
2009 2010 2011
Figure 22- Infrastructure Backlog Ratio Comparison
Benchmark Lowest
Average Lake Macquarie City Council
-
0.50
1.00
1.50
2.00
2.50
3.00
2009 2010 2011
Figure 23 - Building and Infrastructure Asset Renewal Ratio
Benchmark Highest
Average Lake Macquarie City Council
Lake Macquarie City Council Page 32
Section 6 Conclusion and Recommendations
Based on our review of both the historic financial information and the current LTFP we consider Council
to be in a sound position in terms of its sustainability. As noted in our report the Council’s LTFP is not
completely up to date at the time of preparing this report. However, based on our understanding of the
potential amendments required within the LTFP, we do not anticipate our view of Council’s sustainability
changing following Council completing the update to the LTFP.
At this point we are not in a position to provide perfectly accurate commentary in respect of Council’s 10
year financial forecast. Where analysis has been provided this is on the partially updated version of the
LTFP.
We base our analysis on the following key points:
Council’s underlying operating performance, measured by EBITDA, has been consistent over
the three year review period
Council has had adequate liquidity historically and has met all liabilities when they were due
Council’s capital expenditure has been consistently strong over the three year review period
however this has been to the detriment to asset maintenance and asset renewals funding
The IPART approval of a partial SRV increase over seven years should assist Council’s
sustainability over the medium to long term
To assist with their goal of achieving operating surpluses excluding capital grants and
contributions, Council has completed an extensive two year service review that is projected to
provide $10-14m in cost savings and new revenue streams over the next 4-5 years
However we would also recommend that the following points be considered:
The rationale for Council’s SRV application was to assist their long term sustainability therefore
we would require sight of the fully updated LTFP, including up to date scheduled capital
expenditure, to confirm our assessment of the sustainability of Council over the medium to long
term
Council’s operating result has been on a downward trend historically with Council unable to fully
cover the increasing depreciation expense. Council has forecast that they will improve their
bottom line performance over the 10 year period. Whilst deficits (excluding capital grants and
contributions) are currently projected in each year in the version of the LTFP analysed, these
deficits are decreasing.
Lake Macquarie City Council Page 33
Appendix A Historical Financial Information Tables
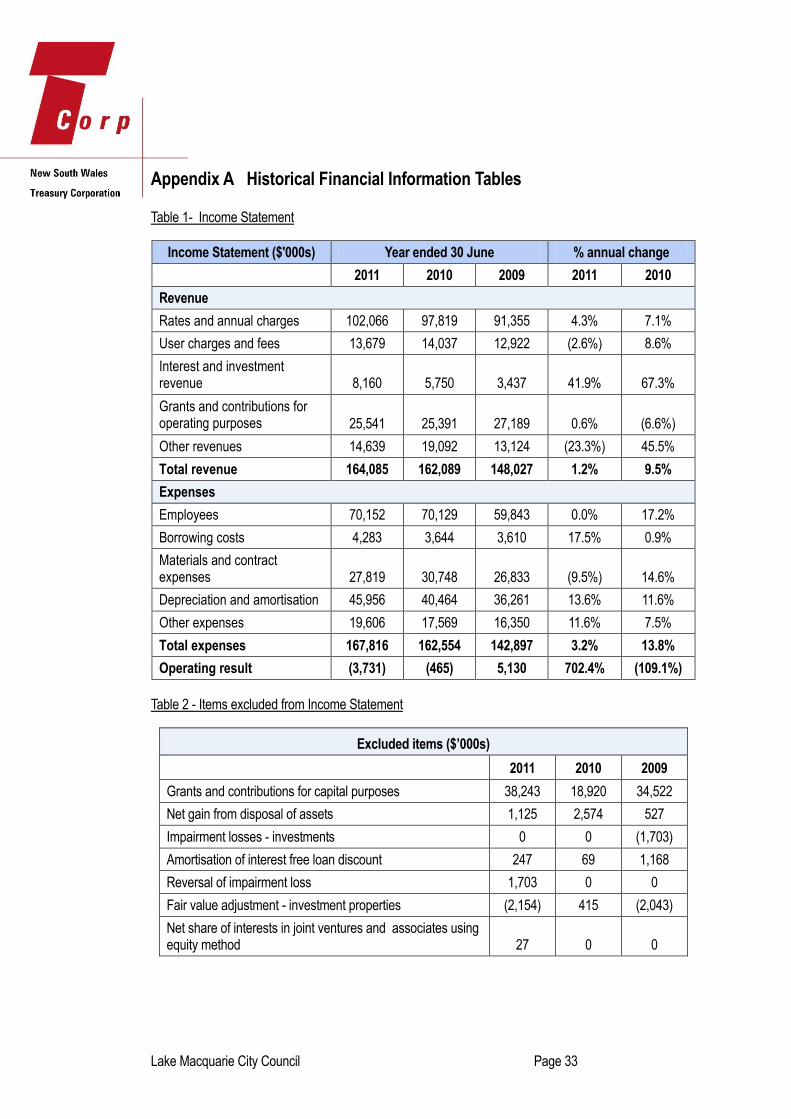
Table 1- Income Statement
Income Statement ($'000s) Year ended 30 June % annual change
2011 2010 2009 2011 2010
Revenue
Rates and annual charges 102,066 97,819 91,355 4.3% 7.1%
User charges and fees 13,679 14,037 12,922 (2.6%) 8.6%
Interest and investment revenue 8,160 5,750 3,437 41.9% 67.3%
Grants and contributions for operating purposes 25,541 25,391 27,189 0.6% (6.6%)
Other revenues 14,639 19,092 13,124 (23.3%) 45.5%
Total revenue 164,085 162,089 148,027 1.2% 9.5%
Expenses
Employees 70,152 70,129 59,843 0.0% 17.2%
Borrowing costs 4,283 3,644 3,610 17.5% 0.9%
Materials and contract expenses 27,819 30,748 26,833 (9.5%) 14.6%
Depreciation and amortisation 45,956 40,464 36,261 13.6% 11.6%
Other expenses 19,606 17,569 16,350 11.6% 7.5%
Total expenses 167,816 162,554 142,897 3.2% 13.8%
Operating result (3,731) (465) 5,130 702.4% (109.1%)
Table 2 - Items excluded from Income Statement
Excluded items ($’000s)
2011 2010 2009
Grants and contributions for capital purposes 38,243 18,920 34,522
Net gain from disposal of assets 1,125 2,574 527
Impairment losses - investments 0 0 (1,703)
Amortisation of interest free loan discount 247 69 1,168
Reversal of impairment loss 1,703 0 0
Fair value adjustment - investment properties (2,154) 415 (2,043)
Net share of interests in joint ventures and associates using equity method 27 0 0
Lake Macquarie City Council Page 34
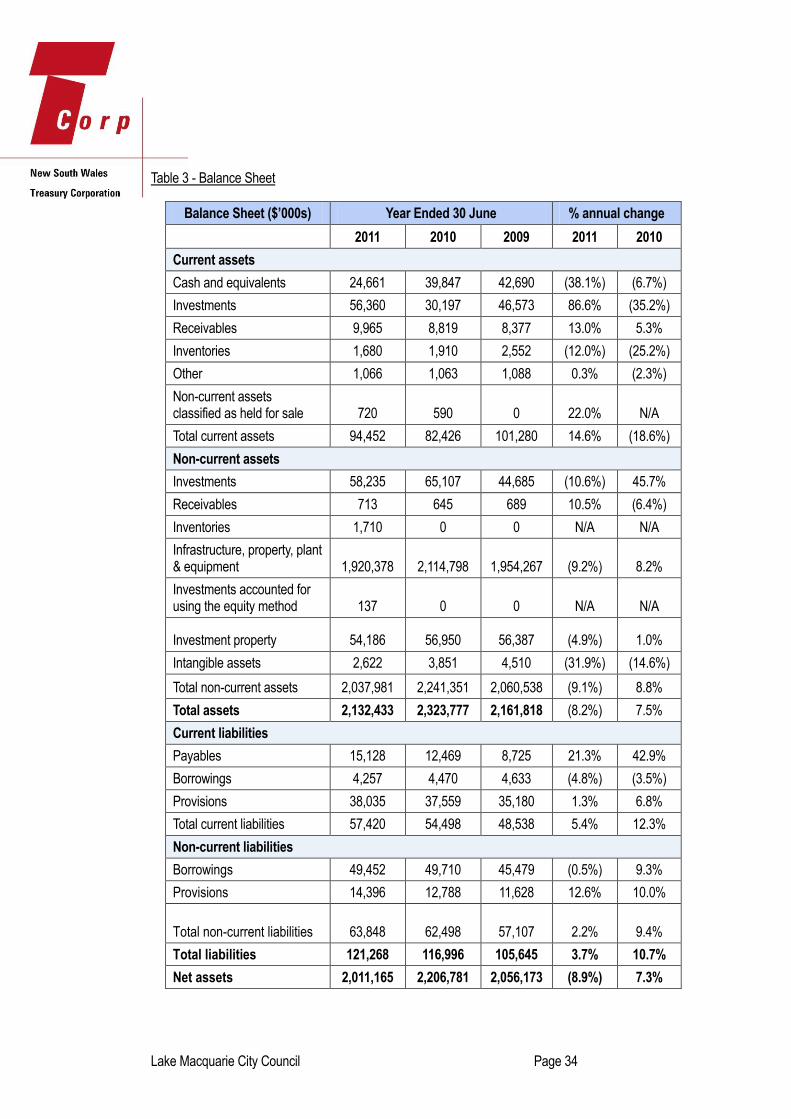
Table 3 - Balance Sheet
Balance Sheet ($’000s) Year Ended 30 June % annual change
2011 2010 2009 2011 2010
Current assets
Cash and equivalents 24,661 39,847 42,690 (38.1%) (6.7%)
Investments 56,360 30,197 46,573 86.6% (35.2%)
Receivables 9,965 8,819 8,377 13.0% 5.3%
Inventories 1,680 1,910 2,552 (12.0%) (25.2%)
Other 1,066 1,063 1,088 0.3% (2.3%)
Non-current assets classified as held for sale 720 590 0 22.0% N/A
Total current assets 94,452 82,426 101,280 14.6% (18.6%)
Non-current assets
Investments 58,235 65,107 44,685 (10.6%) 45.7%
Receivables 713 645 689 10.5% (6.4%)
Inventories 1,710 0 0 N/A N/A
Infrastructure, property, plant & equipment 1,920,378 2,114,798 1,954,267 (9.2%) 8.2%
Investments accounted for using the equity method 137 0 0 N/A N/A
Investment property 54,186 56,950 56,387 (4.9%) 1.0%
Intangible assets 2,622 3,851 4,510 (31.9%) (14.6%)
Total non-current assets 2,037,981 2,241,351 2,060,538 (9.1%) 8.8%
Total assets 2,132,433 2,323,777 2,161,818 (8.2%) 7.5%
Current liabilities
Payables 15,128 12,469 8,725 21.3% 42.9%
Borrowings 4,257 4,470 4,633 (4.8%) (3.5%)
Provisions 38,035 37,559 35,180 1.3% 6.8%
Total current liabilities 57,420 54,498 48,538 5.4% 12.3%
Non-current liabilities
Borrowings 49,452 49,710 45,479 (0.5%) 9.3%
Provisions 14,396 12,788 11,628 12.6% 10.0%
Total non-current liabilities 63,848 62,498 57,107 2.2% 9.4%
Total liabilities 121,268 116,996 105,645 3.7% 10.7%
Net assets 2,011,165 2,206,781 2,056,173 (8.9%) 7.3%
Lake Macquarie City Council Page 35
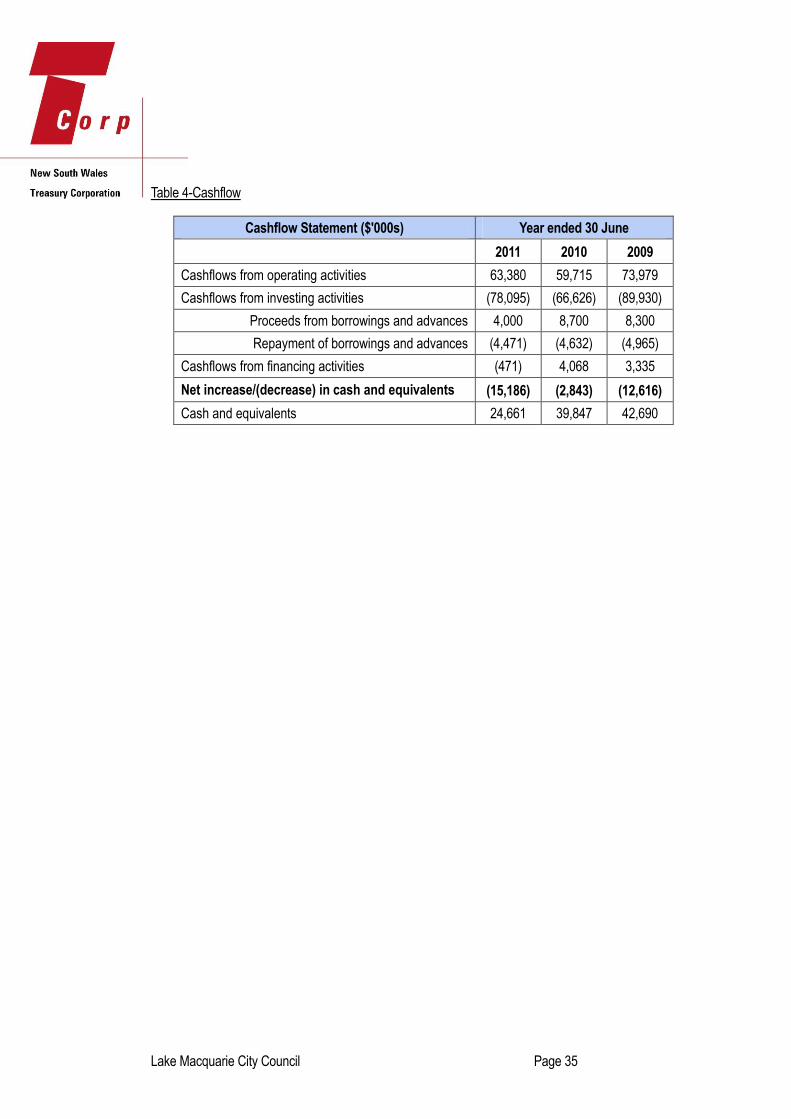
Table 4-Cashflow
Cashflow Statement ($'000s) Year ended 30 June
2011 2010 2009
Cashflows from operating activities 63,380 59,715 73,979
Cashflows from investing activities (78,095) (66,626) (89,930)
Proceeds from borrowings and advances 4,000 8,700 8,300
Repayment of borrowings and advances (4,471) (4,632) (4,965)
Cashflows from financing activities (471) 4,068 3,335
Net increase/(decrease) in cash and equivalents (15,186) (2,843) (12,616)
Cash and equivalents 24,661 39,847 42,690
Lake Macquarie City Council Page 36
Appendix B Glossary
Asset Revaluations
In assessing the financial sustainability of NSW councils, IPART found that not all councils reported
assets at fair value.1 In a circular to all councils in March 20092, DLG required all NSW councils to
revalue their infrastructure assets to recognise the fair value of these assets by the end of the 2009/10
financial year.
Collateralised Debt Obligation (CDO)
CDOs are structured financial securities that banks use to repackage individual loans into a product that
can be sold to investors on the secondary market.
In 2007 concerns were heightened in relation to the decline in the “sub-prime” mortgage market in the
USA and possible exposure of some NSW councils, holding CDOs and other structured investment
products, to losses.
In order to clarify the exposure of NSW councils to any losses, a review was conducted by the DLG with
representatives from the Department of Premier and Cabinet and NSW Treasury.
A revised Ministerial investment Order was released by the DLG on 18 August 2008 in response to the
review, suspending investments in CDOs, with transitional provisions to provide for existing investments.
Division of Local Government (DLG)
DLG is a division of the NSW Department of Premier and Cabinet and is responsible for local
government across NSW. DLG’s organisational purpose is “to strengthen the local government sector”
and its organisational outcome is “successful councils engaging and supporting their communities”.
Operating within several strategic objectives DLG has a policy, legislative, investigative and program
focus in matters ranging from local government finance, infrastructure, governance, performance,
collaboration and community engagement. DLG strives to work collaboratively with the local government
sector and is the key adviser to the NSW Government on local government matters.
Depreciation of Infrastructure Assets
Linked to the asset revaluations process stated above, IPART’s analysis of case study councils found
that this revaluation process resulted in sharp increases in the value of some council’s assets. In some
cases this has led to significantly higher depreciation charges, and will contribute to higher reported
operating deficits.
1IPART “Revenue Framework for Local Government” December 2009 p.83
2 DLG “Recognition of certain assets at fair value” March 2009
Lake Macquarie City Council Page 37
EBITDA
EBITDA is an acronym for “earnings before interest, taxes, depreciation, and amortisation”. It is often
used to measure the cash earnings that can be used to pay interest and repay principal.
Grants and Contributions for Capital Purposes
Councils receive various capital grants and contributions that are nearly always 100% specific in nature.
Due to the fact that they are specifically allocated in respect of capital expenditure they are excluded from
the operational result for a council in TCorp’s analysis of a council’s financial position.
Grants and Contributions for Operating Purposes
General purpose grants are distributed through the NSW Local Government Grants Commission. When
distributing the general component each council receives a minimum amount, which would be the
amount if 30% of all funds were allocated on a per capita basis. When distributing the other 70%, the
Grants Commission attempts to assess the extent of relative disadvantage between councils. The
approach taken considers cost disadvantage in the provision of services on the one hand and an
assessment of revenue raising capacity on the other.
Councils also receive specific operating grants for one-off specific projects that are distributed to be spent
directly on the project that the funding was allocated to.
Independent Commission Against Corruption (ICAC)
ICAC was established by the NSW Government in 1989 in response to growing community concern
about the integrity of public administration in NSW.
The jurisdiction of the ICAC extends to all NSW public sector agencies (except the NSW Police Force)
and employees, including government departments, local councils, members of Parliament, ministers,
the judiciary and the governor. The ICAC's jurisdiction also extends to those performing public official
functions.
Independent Pricing and Regulatory Tribunal (IPART)
IPART has four main functions relating to the 152 local councils in NSW. Each year, IPART determines
the rate peg, or the allowable annual increase in general income for councils. They also review and
determine council applications for increases in general income above the rate peg, known as “Special
Rate Variations”. They approve increases in council minimum rates. They also review council
development contributions plans that propose contribution levels that exceed caps set by the
Government.
Infrastructure Backlog
Infrastructure backlog is defined as the estimated cost to bring infrastructure, building, other structures
and depreciable land improvements to a satisfactory standard, measured at a particular point in time. It is
unaudited and stated within Special Schedule 7 that accompanies the council’s audited annual financial
statements.
Lake Macquarie City Council Page 38
Integrated Planning and Reporting (IP&R) Framework
As part of the NSW Government’s commitment to a strong and sustainable local government system, the
Local Government Amendment (Planning and Reporting) Act 2009 was assented on 1 October 2009.
From this legislative reform the IP&R framework was devised to replace the former Management Plan
and Social Plan with an integrated framework. It also includes a new requirement to prepare a long-term
Community Strategic Plan and Resourcing Strategy. The other essential elements of the new framework
are a Long-Term Financial Plan (LTFP), Operational Plan and Delivery Program and an Asset
Management Plan.
Local Government Cost Index (LGCI)
The LGCI is a measure of movements in the unit costs incurred by NSW councils for ordinary council
activities funded from general rate revenue. The LGCI is designed to measure how much the price of a
fixed “basket” of inputs acquired by councils in a given period compares with the price of the same set of
inputs in the base period. The LGCI is measured by IPART.
Net Assets
Net Assets is measured as total assets less total liabilities. The Asset Revaluations over the past years
have resulted in a high level of volatility in many councils’ Net Assets figure. Consequently, in the short
term the value of Net Assets is not necessarily an informative indicator of performance. In the medium to
long term however, this is a key indicator of a council’s capacity to add value to its operations. Over time,
Net Assets should increase at least in line with inflation plus an allowance for increased population and/or
improved or increased services. Declining Net Assets is a key indicator of the council’s assets not being
able to sustain ongoing operations.
Roads and Maritime Services (RMS)
The NSW State Government agency with responsibility for roads and maritime services, formerly the
Roads and Traffic Authority (RTA).
Section 64 Contribution
Development Servicing Plans (DSPs) are made under the provisions of Section 64 of the Local
Government Act 1993 and Sections 305 to 307 of the Water Management Act 2000.
DSPs outline the developer charges applicable to developments for Water, Sewer and Stormwater within
each Local Government Area.
Section 94 Contribution
Section 94 of the Environmental Planning and Assessment Act 1979 allows councils to collect
contributions from the development of land in order to help meet the additional demand for community
and open space facilities generated by that development.
It is a monetary contribution levied on developers at the development application stage to help pay for
additional community facilities and/or infrastructure such as provision of libraries; community facilities;
open space; roads; drainage; and the provision of car parking in commercial areas.
Lake Macquarie City Council Page 39
The contribution is determined based on a formula which should be contained in each council's Section
94 Contribution Plan, which also identifies the basis for levying the contributions and the works to be
undertaken with the funds raised.
Special Rate Variation (SRV)
A SRV allows councils to increase general income above the rate peg, under the provisions of the Local
Government Act 1993. There are two types of special rate variations that a council may apply for:
a single year variation (section 508(2)) or
a multi-year variation for between two to seven years (section 508A).
The applications are reviewed and approved by IPART.
Ratio Explanations
Asset Maintenance Ratio
Benchmark = Greater than 1.0x
Ratio = actual asset maintenance / required asset maintenance
This ratio compares actual versus required annual asset maintenance, as detailed in Special Schedule 7.
A ratio of above 1.0x indicates that the council is investing enough funds within the year to stop the
infrastructure backlog from growing.
Building and Infrastructure Renewals Ratio
Benchmark = Greater than 1.0x
Ratio = Asset renewals / depreciation of building and infrastructure assets
This ratio compares the proportion spent on infrastructure asset renewals and the asset’s deterioration
measured by its accounting depreciation. Asset renewal represents the replacement or refurbishment of
existing assets to an equivalent capacity or performance as opposed to the acquisition of new assets or
the refurbishment of old assets that increase capacity or performance.
Cash Expense Cover Ratio
Benchmark = Greater than 3.0 months
Ratio = current year’s cash and cash equivalents / (total expenses – depreciation – interest costs)*12
This liquidity ratio indicates the number of months a council can continue paying for its immediate
expenses without additional cash inflow.
Capital Expenditure Ratio
Benchmark = Greater than 1.1x
Lake Macquarie City Council Page 40
Ratio = annual capital expenditure / annual depreciation
This indicates the extent to which a council is forecasting to expand its asset base with capital
expenditure spent on both new assets, and replacement and renewal of existing assets.
Debt Service Cover Ratio (DSCR)
Benchmark = Greater than 2.0x
Ratio = operating results before interest and depreciation (EBITDA) / principal repayments (from the
statement of cash flows) + borrowing interest costs (from the income statement)
This ratio measures the availability of cash to service debt including interest, principal and lease
payments
Building and Infrastructure Backlog Ratio
Benchmark = Less than 0.02x
Ratio = estimated cost to bring assets to a satisfactory condition (from Special Schedule 7) / total
infrastructure assets (from Special Schedule 7)
This ratio shows what proportion the backlog is against total value of a council’s infrastructure.
Interest Cover Ratio
Benchmark = Greater than 4.0x
Ratio = EBITDA / interest expense (from the income statement)
This ratio indicates the extent to which a council can service its interest bearing debt and take on
additional borrowings. It measures the burden of the current interest expense upon a council’s operating
cash.
Operating Ratio
Benchmark = Better than negative 4%
Ratio = (operating revenue excluding capital grants and contributions – operating expenses) / operating
revenue excluding capital grants and contributions
This ratio measures a council’s ability to contain operating expenditure within operating revenue.
Own Source Operating Revenue Ratio
Benchmark = Greater than 60%
Ratio = rates, utilities and charges / total operating revenue (inclusive of capital grants and contributions)
Lake Macquarie City Council Page 41
This ratio measures the level of a council’s fiscal flexibility. It is the degree of reliance on external funding
sources such as operating grants and contributions. A council’s financial flexibility improves the higher the
level of its own source revenue.
Unrestricted Current Ratio
Benchmark = 1.5x (taken from the IPART December 2009 Revenue Framework for Local Government
report)
Ratio = Current assets less all external restrictions / current liabilities less specific purpose liabilities
Restrictions placed on various funding sources (e.g. Section 94 developer contributions, RMS
contributions) complicate the traditional current ratio because cash allocated to specific projects are
restricted and cannot be used to meet a council’s other operating and borrowing costs. The Unrestricted
Current Ratio is specific to local government and is designed to represent a council’s ability to meet debt
payments as they fall due.