Embed Size (px)
Citation preview

Image courtesy: NRRJ Staff
Lake Superior's Coastal Ecosystems: How "Pristine" Are They? byLucindaJohnson, Dan Breneman, Robert Hell
Shorelines are complex and variable habitats that attract both humans and a diverse community of plants and animals. Use of our shorelines and coastal waters for residences, commercial developm ent and recreation has increased substantially as towns and cities have cleaned up areas abandoned by heavy industries. While industrial discharges have been eliminated or reduced, diHUsed pollution from roads, storm sewers, and failed septic systems have increased.
Interested in predictin g the health of this ecosystem, the U.S. Environmental Protection Agency put our a "call for propo sals" in 1999 to develop indicators
of condition for the United State's coastal waters, including the Great Lakes. The University of Minnesota Duluth's Natural Resources Research Institute was awarded one of five $6 million grants in a highly competitive application led by Dr. Gerald Niemi and 27 investigators from across the Great Lakes Basin. The project's goal was "to develop efficient, economic, and effective indicators to monitor the condition, int egrity, and long-term sustainability of the basin," with a focus on the coast and the nearshore aquati c habitat out to around 32 feet in depth.
Much like the Consumer Confidence
Index is used to forecast the strength of the economy and body temperature is used as an indicator of our own health , we developed indicators of the status of the ecosystem by examining relationships among the plants, animal s, water quality, habitat quantity and quali ty, and human activities (such as farming, urban development, industrial discharges) that can negatively affect these ecosystems.
Teams of investigators involved in the project visited mo re than 300 sites across the U.S . side of the Great Lakes Basin; over 150 were visited by the "fish and invertebrate" team, with 38 sites in Lake Superior (Figure 1). While sam
-22
pling was finished in 2003, analysis and writing cont inues. A special issue of the Journal of Great Lakes Research will be released next year covering results from the enti re project. T his article will summarize some of the findings for Lake Superior from the fish and invertebrate team.
What was sam pled?
Anyo ne boating on the G reat Lakes can see the enormous diversity of shoreline habitats, although that diversity is d ifficult to see from land. Most fish spend at least some parr of their life occupying the shallower waters along the coast because of that diversity, and because it's
more productive than the deeper waters of Lake Superior. W e sam pled five different types of coastal ecosystem types. Fish were sam pled using a fyke net array
What we measured: Birds and frogs, wetland vegetati on, fish and invertebrates, m icroscopic algae known as diatoms, and physical characteristics of the sites were sam pled over two years from 20022003. Indicators for two unique types of contaminants--endocrine disrupting chemicals, and Uv-activated polycyclic aromatic hydro carbons (PAH's)-also were investigated at a limited number of locations across the Basin. Sampling took place on only the U.S . side of the Basin, du e to the fun ding source, which was the U.S . Environmental Protection Agen cy.
An extensive database detailing the land use, soils, roads, population density, and other "stressors" was compiled for the entire U .S. side of the Great Lakes Basin. These data are combined into a "stressor gradient". That gradient was used to
select sampling locati ons that represented the full range of environmental conditions across the basin, from the best to the worst.
Figure 1 + Wet land site
+ Emba yment site N
+ High energ y site
o Lake Superi or \~~ o Superior Seq-sheds n ~2"~''''''''~:/b'''{ +
c · .. \51l / ~ ..c1Jv~~' \ '''-, --.. "-" ' "",---.r--r';;7\ ' /""' J / (
.., v\' / \.-¥ c" {" ~~ p- .. ~ "
I ( )n """" ~ ,~ L- .~ ~:'''-.!J L~ /; \ "f 0-..: I !', ' ... ""'7 "'-.jf)
' ,JOUIUthJ. ~' ~~' ~_~ , r
• . " . , ~)r . "-1 " ........---\.. , r ! ~ " " ~~ -r:» ~)__ ,Il ~ I /' ---.... _- ~ __ J. ' J __ - - \ ' ' ",--
<r
-~J-~ ~ } 1!f! - ' ':'~:''':(~ -~\~~ '. " " f.:.__,~.f --'------.1:_ ~ , Mun iSing ~ ~
I " ... ---" ~ ! Ashland " .. , \ - - <: v - ', P1 ~'~ / J ; '''''''" l~u r,e;) .--~_~ ---1~~-!j 9 [I ( ) o.-..,~
-: 'J'j -: ' I\.._ _ i ..r-+--' ~~ --'')i} ~ I ';;/ [ \? ' ~ j , -----l , / n ..., ,,~ j .--- , . " .. V; ,If " /( t "
I ';. . - - - - I \ .. ! G ..~ I'J. I ..I ,r-; ~ J I _ J \ I~ " ~Ll d-\;'__1' ' c , [ ", ' ;1 , "" .~ " ~ ; ~ ~.i- _ ,, 0 -...... 2_
consisting of two small and two large mesh nets set in about twO [Q th ree feet of water. A total of 100 species were identi fied and released across the entire basin, 57 of which were captured from Lake Superior. Altogether, more than 100,000 fish were handled for the study. Across each site detailed habitat infor mation was collected describing depth, vegetation type and density, substrate composition, and water quality characteristics. O ther observations included the types of pollution or disturbances observed at, or adjacent to the site.
Watersheds and Habitats
We started on land, exam ining differences in land use, vegetation and human activity to determine potenti al pollutants and distu rbances that could affect the shoreline. W e found that Lake
Superior watersheds of high energy sites are smaller and contain more upland forest, bu t are similar to wetland watersheds in terms of road and population density, and numb er of pollution discharge permi ts. The wetland watersheds contain higher prop ortio ns of forested wetlands and marshland.
Exposure to wave action determines the shor eline structure and vegetat ion, The types of human activities that are found
on the shore also vary with topography and exposure. There is a high er density of residential development as well as upland forest on the shorelines at high energy sites and bays compared to the wetlands in the areas we sam pled. T he coastal wetlands on Lake Super ior are not as developed since they tend to have more marshy shorelines with shrubby or forested vegetation, deeper and finer sediments with more organic marter.
Riverine wetland plants and an imals are exposed to flowin g water, whose quality is determi ned by conditions in the watershed. Depending on the structure of the river mouth, those wetlands can also be influenced by seiche or wind tides, wh ich increase mixing of lake and river water. T he aquatic vegetation in those and the protected wetlands is very diverse. Cattails, reeds, sedges, water
lilies and other emergent or floating vegetation are com mon in the shallower waters, while many species of pondweed, water cabbage, and cco ntail inh abit the deeper waters. Open coastal wetlands, the least commo n wetland type in the Lake Superior coastal region , support erect sedges and ribbon-like floating vegetation.
T he rocky, high energy shorelines and bay sites, in cont rast, have sand to boul
-23
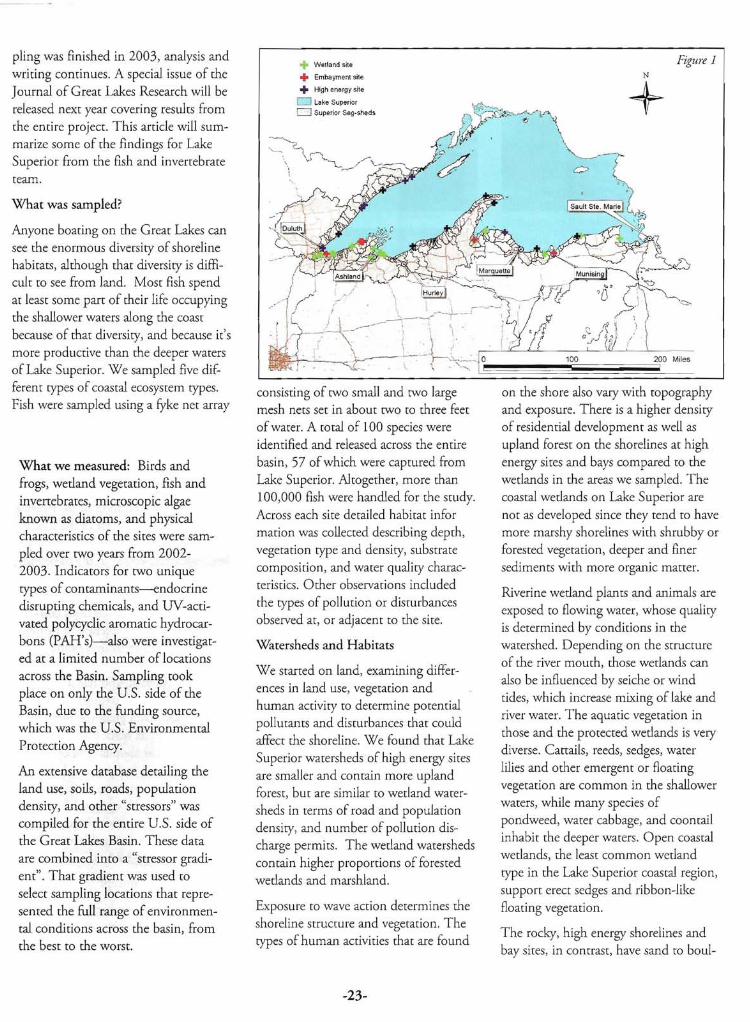
Examples ofthe shoreline ecosystem types sampled: Clockwise from upper left: Open coastal wetland located within a bay, in northern LakeMichigan- note low waterconditions; Lake Superior high energy shoreline, nearHovland, MN; Au Train River, M/; Protected wetland, Lake Superior Basin, location unknown.
rf~}::::,~,~RT~:!co~~e~~~~ • Line . sports & camping center • Downriqqers
• Rod holders . I:"'DORY~· WE • Tr ailer equrpment & service ~. SPECIALIZE • Truck toppers • Clothing . r: IN • Footwear • { . ~ CUSTOMER • Waders .E------ - • GPS/Sonar/VHF SERVICE
Servinq the area for over 50 years.
(715) 392-9838 • 1-800-569-8142. 1814 Belknap Street. Superior, WI 54880 Webstore: www.northwestoutlet.com
der bottoms with little organic matter. Unlike the lower lakes, only two of our sampled sites had artificially armored shorelines (riprap). Aquatic vegetation is rare, unless protected from intense wave activity, such as in the calmer waters of bays and behind islands, where vegetation is a reed or a plant whose narrow leaves float to the surface. Because the water does not stagnate, temperatures and water chemistry closely mirror those of the lake. Bays and open coastal wetlands share many habitat characteristics.
The Fish Community
Ten fish species were found exclusively in high energy sites, ten were exclusive to riverine wetlands, and one each were found exclusively in protected and open coastal wetlands. Riverine wetlands had the largest number of species, while bays had the largest number of non-native (exotic) species. In Table 1 we summarize characteristics of the fish community across ecosystem types. All species commonly found in the protected wetlands were also common in the riverine wetlands; similarly, most of the species encountered in the open coastal wetlands were also found in the bays. Fish community characteristics varied across the five ecosystem types we studied (Table 2). In general, wetlands contained more species tolerant of turbidity and warmer temperatures, exhibited nest-guarding behavior, were top carnivores or vegetarian, and had a majority of species that grow to large body sizes
-24
(>24 inches). Nest guarding fish (e.g., bluegills, crappie; black bullhead) were frequently most abundant in open coastal wetlands and protected wetlands, although they also occurred in riverine wetlands. The high energy shoreline habitats, in contrast, supported species that tended to have smaller body sizes and were bottom-feeders.
The "indicator concept"
Anglers know through experience that each fish species has an optimal temperature range, and characteristic habitat
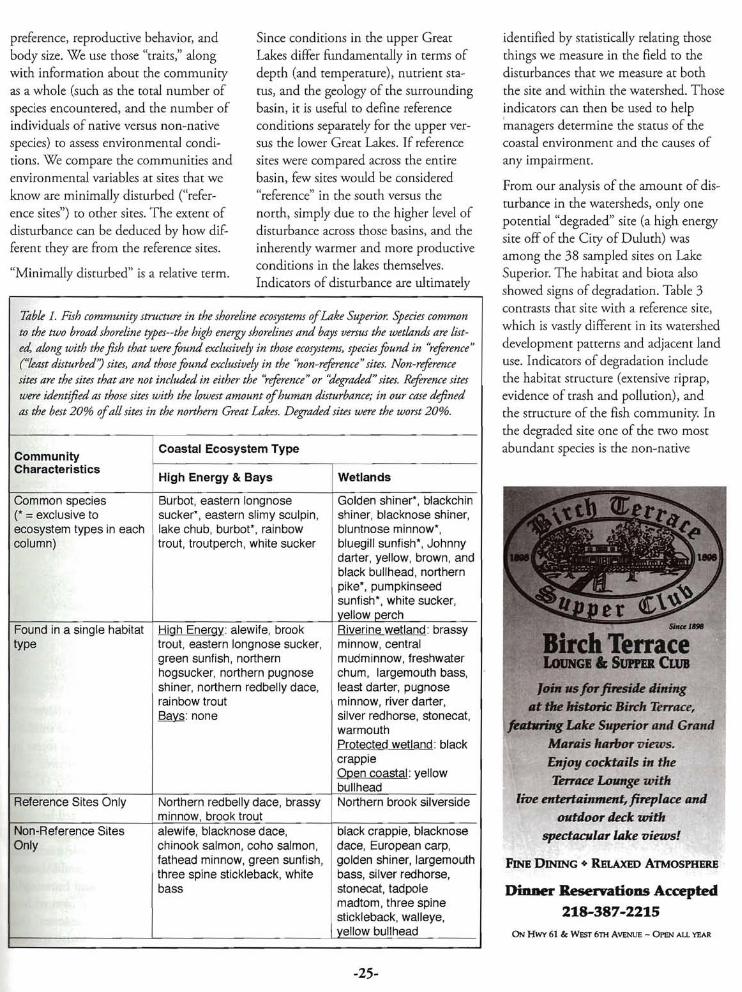
preference, reprod uctive behavior, and body size. We use those "traits," along with information about the communi ty as a whole (such as the total number of species encountered, and the number of ind ividuals of native versus non- native species) to assess environmental conditions. We compare the communities and environmental variables at sites that we know are minimally disturbed ("reference sites") to other sites. T he extent of disturbance can be dedu ced by how different they are from the reference sites.
"M inimally distu rbed" is a relative term.
Since condi tions in the uppe r Great Lakes differ fundamentally in terms of depth (and temp erature), nu trient status, and the geology of the surrounding basin, it is useful to define reference condi tions separately for the upper versus the lower Great Lakes. If reference sites were compared across the ent ire basin, few sites would be considered "reference" in the south versus the north, simply du e to the higher level of disturbance across those basins, and the inherently warmer and more productive conditions in the lakes themselves. Indicators of disturbance are ultimately
Tttble I. Fish community structurein the shoreline ecosystemsofLake Superior. Species common to the two broad shoreline types--the high energy shorelinesand bays versusthe wetlandsare listed, along with thefish that werefound exclusivelyin those ecosystems, speciesfound in "reference" (''least disturbed') sites, and thosefound exclusively in the "non-reference"sites. Non-reference sites are the sites that arenot includedin either the "reference"or "degraded"sites. Reference sites were identified as those sites with the lowest amount ofhuman disturbance; in our case defined as the best 20 % of all sites in the northern Great Lakes. Degradedsites were the worst 20%.
Community Coastal Ecosystem Type
Characteristics High Energy & Bays Wetlands
Common species Burbot, eastern longnose Golden shiner' , blackchin (. = exclusive to sucker' , eastern slimy sculpin, shiner, blacknose shiner, ecosystem types in each lake chub, burbot ' , rainbow bluntnose minnow', column) trout , troutperch, white sucker bluegill sunfish' , Johnny
darter , yellow , brown, and black bullhead , northern pike', pumpkinseed sunfish ' , white sucker, yellow perch
Found in a single habitat High Energy : alewife, brook Riverine wetland : brassy type trout , eastern longnose sucker , minnow , central
green sunfish, northern mudminnow, freshwater hogsucker, northern pugnose chum, largemouth bass, shiner, northern redbelly dace, least darter , pugnose rainbow trout minnow, river darter, Bays: none silver redhorse , stonecat ,
warmouth Protected wetland: black crappie Open coastal : yellow bullhead
Reference Sites Only Northern redbelly dace , brassy Northern brook silverside minnow, brook trout
Non-Reference Sites alewite , blacknose dace, black crappie, blacknose Only chinook salmon, coho salmon, dace, European carp,
fathead minnow, green sunfish, golden shiner, largemouth three spine stickleback, white bass, silver redhorse, bass stonecat , tadpole
madtom , three spine stickleback, walleye , yellow bullhead
identified by stat istically relating those things we measure in the field to the disturbances that we measure at both the site and within the watershed. Those indicators can then be used to help managers determine the status of the coastal environment and the causes of any impairment .
From our analysis of the amount of disturbance in the watersheds, only one potential "degraded" site (a high energy site off of the City of Duluth) was among the 38 sampled sites on Lake Superior. The hab itat and biota also showed signs of degradation . Table 3 contrasts that site with a reference site, which is vastly d ifferent in its watershed developm ent patterns and adjacent land use. Indicators of degradation include the habitat structure (extensive riprap, evidence of trash and pollut ion), and the structure of the fish community. In the degraded site one of the two most abundan t species is the no n-native
[oin us for fireside dining at the historic Birch Terrace,
fellbning Lake Superior and Grand Marais harbor v iews. Enjoy cocktails in the Terrace Lounge with
live entertainment, fireplace and outdoor deck with
spectacular lake views!
FINE DINING'" RELAXED ATMOSPHERE
Dinner Reservations Accepted 218-387-2215
ON HWY 61 & WEST 6THAVENUE - O PEN A LL YEAR
-25
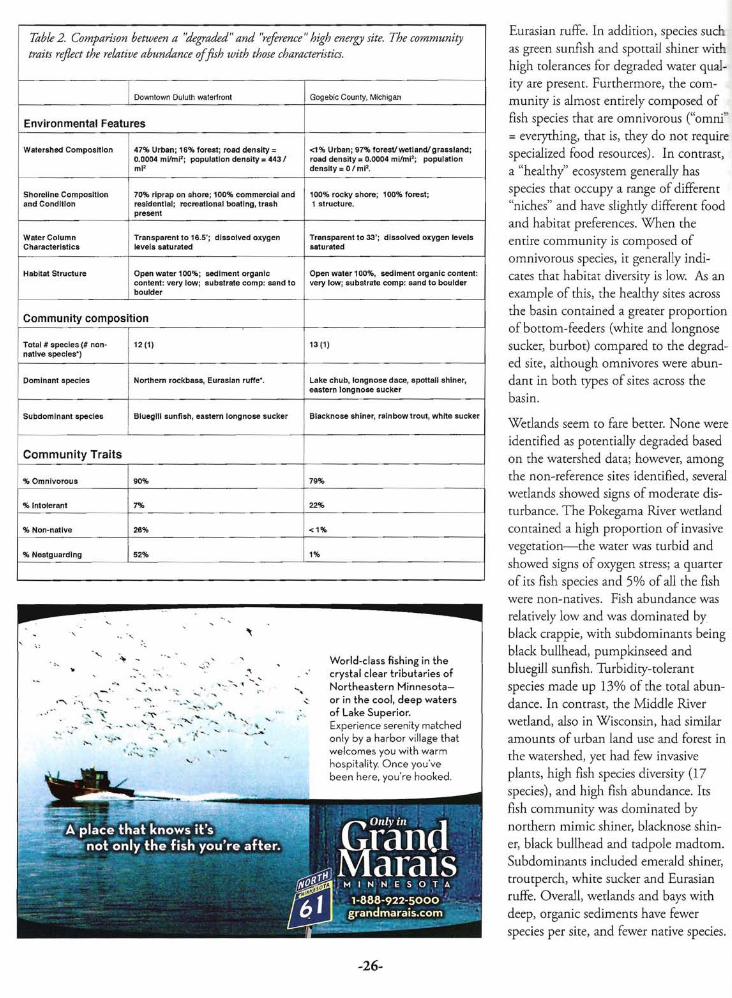
Table 2. Comparison between a "degraded"and "reference" high energy site. The community traits reflect the relative abundance offish with those characteristics.
Downtown Duluth waterfront Gogeblc County. Michigan
Environmental Features
Watershed Cornpo altlon 47% Urban; 16% forest; road density = 0.0004 mVmi'; populatfon density =443/ ml'
<1% Urban : 97% forest/wetland/grassland ; road dens ity =0.0004 mVmi' ; population density =0 / mi'.
100% rocky shore: 100% forest ; 1 structure.
Transparent to 33'; d issolved oxygen levels saturated
Open water 100 %, sediment organic content: very lOW; substrate comp: sand to boulder
Shoreline Composition and Cond ition
70% rlprap on shore ; 100% commercial and residential : recreational boating, trash present
Water Column Characteristics
Transparent to 16 .5' ; dissolved oxygen levels saturaled
Habltal Structure Open water 100%; sediment organic content: very low ; aubetrate camp: sand to boulder
Community composition
Total # species (# nonnative spec ies")
12(1) 13(1)
Lake chub, long nose dace , apottall shiner, eastern lonqnose sucker
Blackno se shiner, rainbow trout , whtte sucker
Dominant species Northern rockbass, Eurasian ruffe".
Subdomlnant species Bluegill sunfish, eastern lonqnose sucker
Community Traits
% Omnivorous 90% 79%
% Intolerant 7% 22%
% Non-native 26% <1%
1%% Nestguardlng 52%
, ...
. , ...-.... , -..•'.... ..... . , .. .. \. " ,'.
..'
"... ...... ,. .
World-class fishing in th e crystal clear tributaries of Northeastern Minnesotaor in the cool , deep waters of Lake Superior. Expe rience se renity matched on ly by a harbor village that we lcome s yo u with war m hosp itality. Once you've bee n here, you're hooke d.
Eurasian ruffe. In addition, species such
as green sunfish and spo ttail shiner with high tolerances for degraded water quality are present. Furthermore, the community is almost entirely composed of fish species that are om nivoro us ("omnt = everything, that is, they do not require specialized food resources). In contras t, a "healthy" ecosystem generally has species that occupy a range of different "niches" and have slightly different food and hab itat preferences. When the entire community is composed of omnivorous species, it generally indicates that habitat diversity is low. As an exam ple of th is, the healthy sites across the basin contained a greater proportion of bottom-feeders (white and longnose sucker, burb ot) compared to the degraded site, although omnivores were abundant in both types of sites across the basin.
Wetlands seem to fare better. None were identifi ed as potenti ally degraded based on the watershed data; however, amo ng the non-reference sites identified, several wetlands showed signs of moderate distu rbance. The Pokegama River wetland contained a high proporti on of invasive vegetation- the water was turbid and showed signs of oxygen stress; a quarter of its fish species and 5% of all the fish were non-natives. Fish abundance was relatively low and was dominated by black crappie, with subdominan rs being black bullhead, pumpkinseed and bluegill sunfish, Tur bidity-tolerant
species ma de up 13% of the total abundance. In contrast, the Middle River wetland, also in Wisconsin, had similar amo unts of urban land use and forest in the watershed, yet had few invasive plants , high fish species diversity (17 species), and high fish abundance. Its
fish comm unity was dominated by northern mimic shin er, blacknos e shiner, black bullhead and tadpole rnadrorn. Subdorninants included emerald shiner, rroutperch, whi te sucker and Eurasian ruffe. O verall, wetlands and bays with deep , organ ic sedime nts have fewer
species per site, and fewer native species.
-26

- - -- -
Table 3. Dominant/ish groups sampledfrom each habitat typevisitedon Lake Superior. Includedarereferences to thermalpreference, parentalcare and spawning habitat.
Habitat Type Dominant Groups
Thermal Preference
Parental Care Spawning Habitat
(total # species)
High Energy shoreline Minnows, Suckers, Trout Cool! Cool Warm Non-quarders (no care) Stony substrate and broadcast Perch (31)
Stony substrate, Broadcast Bays Minnows, Suckers, CoollWarm Mostly non-guarders and nests
Sticklebacks, Trout Perch, Sunfishes (32)
Sunfishes, Perches, Nests and vegetation Coastal Wetlands Catfishes (13) CoollWarm Guarders
Catfishes, Perches, Nests, vegetation and stony Riverine Wetlands Sunfishes, Minnows (48) CoollWarm Mostly guarders substrate
Catfishes, Sunfishes, Nest, stony substrate and Protected Wetlands Suckers, Perches (29) CoollWarm Mostly guarders vege1ation
Demonstrating the use ofa "transparencytube" for measuring waterclarity.
Higher proportions of non-native species were found where water was more turbid.
In general, human activity and disturanee at a site correlates with the
amount of suspended solids in the water. When suspended solids were high, water column transparen cy is low and emergent vegetation such as cattails and bur-reed dominate. These habitat
types support more non-native fish species such as Eurasian ruffe, and European carp, and species tolerant of turbidity such as northern pike, northern mimi c shiner, fathead minnow, and central mud minnow among others.
How "pristine" is Lake Superior?
Our watershed data tells us that the U.S. side of the Lake Superior Basin has less human disturbance than the other Great Lakes. How else does Lake Superior fare in terms of their coastal ecosystems? Altogether, Lake Superior had more "intolerant" species and more individuals of species that are considered intolerant than any of the other lakes combined. In particular, there are a larger number of species considered intolerant of high turbidity. The specific contrasts for the different lakes and ecosystems types are summarized in Table 4. As evidenced by the few "degraded" sites found in the basin, Lake Superior is still the healthiest of the Great Lakes. There is, however, evidence of severe degradation at specific locations, and when implemented in a monitoring program, the indicators we have identified may help to determine where and why sites are degraded so that appropriate actions can be taken to eliminate or minimize the stress and restore the site.
What's Next
Indicators are only on e of the products of the Great Lakes Environmental Indi cators project. Other products include 1) methods for quantifying "human disturbance" for watersheds, 2) determining "least impacted" and "most degraded" sites, 3) calibrating a fish Index of Biotic Integrity (IB!) to
determine the underlying cause of degradation , 4) an index of condition that uses a measure of dominance of
.... -_ " ~ -_ _ ' _ -. ._ . _ . _ - .=1r- .
1. (
1111 1.
I~ . 1
Imi ). '
III!
I 1111 ( ,)Rl 1111 1
1.' 1.1
~ . (
OrIgtnal lamps creared with Lake Superior stone II !
IB (L a ke S up e rio rA.......::= O CK LA M PS 1. (
~' oIt'!..~~ ' ''' ''' I) ''' : I ....rl i lotll ! ". V Uf <:' ,\. rn)B ' - - -" 2 18 3 87-1681
\· i~t OUf:.hc'''T.Jom;''lt so SkYJ:«f Ln.n GJ-3'nd t/.-1lolls..'1H
-27

Table 4. Comparison ofindicator across the Great Lakes and coastal ecosystems. The community traits reflect the relative abundance offish with particular characteristics. Abbreviations: < = less than; > =greaterthan; RW = riverine wetland, HE = high energy shore, CW = open coastal wetland, PW =protected wetland, B = bay.
Compared to all Great Lakes combined
Compared to other Great Lakes taken individually
Compared to similar ecosystem types in all Great Lakes combined
Compared to similar ecosystem types in other Great Lakes
Community Composition # Intolerant Species Superior> Superior »Michigan ,
Erie, Ontario RW: Superior> PW: Superior> HE: Superior>
RW: Superior » Michigan, Erie, Ontario
# Non-native Species Superior < Erie Community Traits % Intolerant Individuals Superior> Superior> Erie RW: Superior> RW: Superior> Michiqan % Tolerant Individuals HE: Superior < Huron % Turbiditv Intolerant Superior> Superior> Erie RW: Superior> % Non-native Superior < Erie RW: Superior < Erie % Nestguarding Superior < Ontario CW: Superior>
B: Superior <
invasive plants, 5) an index that uses the human disturb ance gradient, rather than a "reference condition" appro ach, and many individual measuremen ts based on diatom s, plants, invertebrate, and water quality measures. A big challenge will be to integrate the indicators developed by the different groups into a single set of measuremen ts that can provide information about the health of all parts of the coastal ecosystem-from the deeper waters to the upland.
Many of our methods and ind icators are currently being evaluated by several of the Lake-wide Area Management Plan organizations in the Great Lakes (especially Lake Erie and Lake Superior) for inclusion in their monitoring plans. Efforts are also underway to incorp orate indicators that have been developed by other investigators. A meeting will take place in Duluth in January to work out a strategy for choosing the "best" indicators for Great Lakes wetlands. For more information on the Great Lakes Environm ental Indi cators project, see http://glei .nrri. umn.edu.
AND OPERAT ED FOR FO UR GENERATIONS S T . DyluTH. MN 5 58 02 2 18 72 7 -89 01
-28
Acknowledgements: Dozens ofindividuals worked on thisproject and havebeen instrumental in its success. we wish to thank Valerie Brady andJan Ciborowski, in particular; others involved in planning, sampling and analyzingdata includeJenniferOlker; Joe Gathman, JeffHolland, Tom Hrabik, Jeff Schuldt, Carl Richards, and dozens ofstudents and techniciansthat helped collectfield data. The EPA STAR Program providedfu nding undergrant numberR828675.
Tell our advertisers
you saw their ad in the Lake Superior
ANGLER!