Embed Size (px)
Citation preview
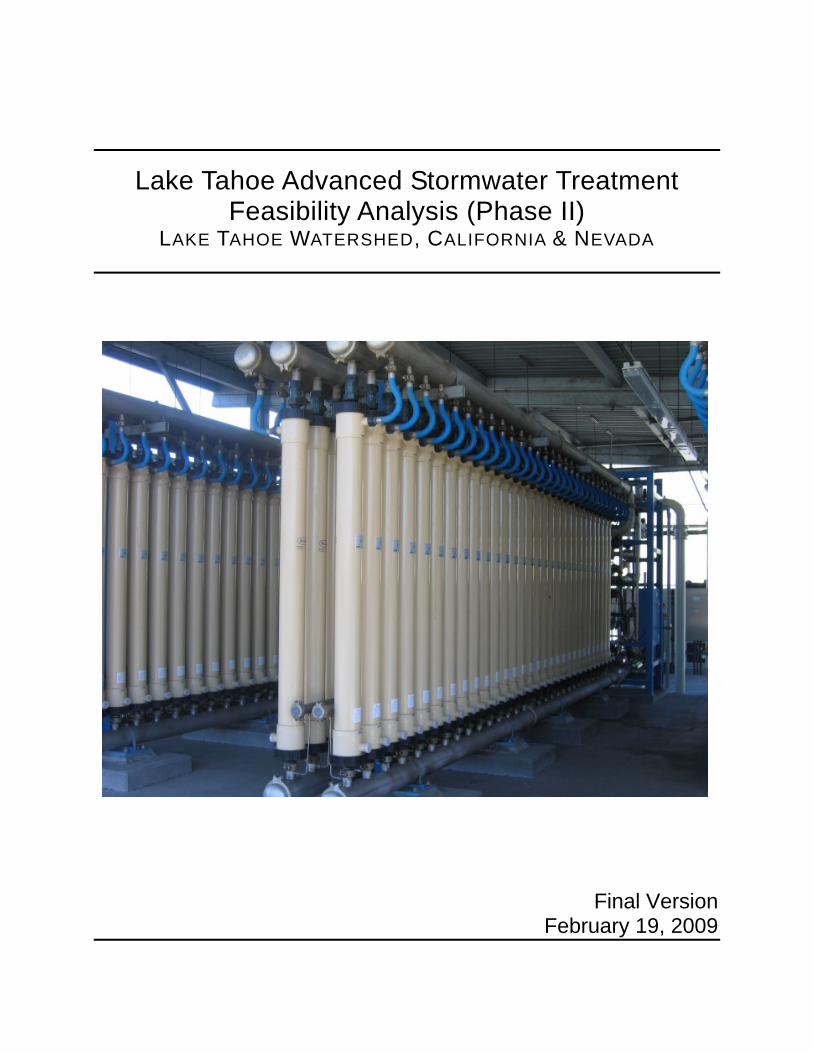
Lake Tahoe Advanced Stormwater Treatment Feasibility Analysis (Phase II)
LAKE TAHOE WATERSHED, CALIFORNIA & NEVADA
Final Version February 19, 2009

Lake Tahoe Advanced Stormwater Treatment Feasibility Analysis (Phase II) – February 19, 2009
This Advanced Stormwater Treatment Feasibility Analysis is part of a multi-stakeholder collaborative effort to minimize the deleterious effects of urban stormwater on the ecosystem and economy of the Lake Tahoe Basin. This product would not be possible without the generous participation of several Basin regulatory and project implementing entities. This specific product is authorized pursuant to Section 234 of the Water Resources Development Act of 1996 (PL 104-303) which provides for coordinated interagency efforts in the pursuit of water quality and watershed planning.
This product was prepared by:

Lake Tahoe Advanced Stormwater Treatment Feasibility Analysis (Phase II) – February 19, 2009
Table of Contents
Executive Summary ………………………………………………………………………. ES.1
Chapter 1 – Introduction ..….…………………………………………….………………. 1.4
Chapter 2 - Conceptual Treatment Train Approach ………….……………………….. 2.10
Chapter 3 – Recommended Treatment Process ………………………………….…… 3.26
Chapter 4 – Load Reduction Potential Analysis …………………………………...…… 4.42
Chapter 4 Appendix - Assumptions and Methods for SWMM5 Model Calculations … 4A.48
References ……..………………………………………………………………………….... R.54

Lake Tahoe Advanced Stormwater Treatment Feasibility Analysis (Phase II) – February 19, 2009 Page ES.1
Executive Summary
The reduction of existing fine sediment particle (FSP; < 20µm) loading to Lake Tahoe is the primary goal of the Lake Tahoe Total Daily Maximum Load (TMDL). Studies conducted to develop the TMDL have identified stormwater generated from urban surfaces as the largest controllable source of fine sediment particles. The primary pollutant control opportunities to reduce FSP loading from urban lands are source control and/or stormwater treatment. Advanced stormwater collection and treatment is believed by some stakeholders to be the most effective way to meet TMDL targets.
The first phase (Phase I) of this advanced stormwater treatment feasibility analysis, conducted for the TRPA, identified microfiltration as the technology with the greatest promise to treat FSP loads in urban stormwater. Microfiltration has a successful history of application to water and treated wastewater, but generally it has not been applied to stormwater. The lack of stormwater implementation experience led to considerable uncertainty at the conclusion of Phase I. This report (Phase II) narrows the uncertainties associated with microfiltration performance and the feasibility of its application to stormwater, using Placer County as an example.
The Phase II analysis indicates that while advanced stormwater treatment using microfiltration is a valuable option, implementation appears to be most feasible in the more densely developed urban drainages in the Lake Tahoe Basin. This is because the associated storm water collection and storage system would be much more expensive in less densely developed areas. This constraint renders it very unlikely that microfiltration would be a cost effective solution for many of the urban drainages in the Tahoe Basin, and therefore unlikely that advanced treatment alone will provide sufficient pollutant load reduction from urban lands to meet the future TMDL load reduction milestones.
Phase II had three primary objectives regarding the feasibility of stormwater microfiltration treatment in the Lake Tahoe Basin:
1. Develop a better technical understanding of key design attributes and anticipated performance for advanced stormwater treatment employing microfiltration technology.
2. Develop conceptual recommendations and steps for implementation of advanced stormwater treatment employing microfiltration technology.
3. Compare anticipated performance of microfiltration treatment in context of projected TMDL allocations in applicable urban areas.
The report relies upon published TMDL pollutant loading estimates, a literature review, and an evaluation of some existing microfiltration applications to explore the technical

Lake Tahoe Advanced Stormwater Treatment Feasibility Analysis (Phase II) – February 19, 2009 Page ES.2
constraints and potential performance of microfiltration treatment of urban stormwater in Lake Tahoe.
The 102-acre Kings Beach Commercial Core was modeled as an example site for implementation of the advanced treatment technology using Stormwater Management Model v.5 (SWMM5). A conceptual treatment facility layout was developed for the Kings Beach site. Modeled estimates of performance indicate that microfiltration treatment alone is likely capable of providing a FSP load reduction on the order of 80%. Higher load reductions are feasible with the microfiltration technology, but require much larger pre-treatment storage facilities to capture peak storm flows. The costs of much larger storage facilities likely limit practical load reductions to about 80% for microfiltration treatment alone. The combination of source control and microfiltration treatment in the Kings Beach Commercial Core was estimated to provide load reductions of 89% to 95% of the existing load.
Load reduction estimates were also made using SWMM5 based on two tiers of potential source control improvements defined in the Lake Tahoe TMDL Pollutant Load Reduction Opportunity Report (LRWQCB and NDEP 2008). Tier 2, involving advanced source controls and implementation on 100% of the land area of the catchment, produced load reduction estimates similar to the microfiltration scenarios. However, source control water quality performance and the feasibility of 100% implementation are uncertain at this time, and the project team cautions against reliance on the absolute numerical values for source control load reductions.
Model estimates for Kings Beach were then used to estimate the total load reduction that might be possible for suitable sites within Placer County’s land area tributary to Lake Tahoe. Potential areas suitable for application of microfiltration technology in Placer County were selected based on screening criteria to identify areas having a relatively high density of urban development and impervious surfaces. Three urban areas in Placer County were identified as candidate drainages for advanced treatment: Tahoe City, Kings Beach, and Lake Forest (Figure 3.7). The total drainage area for the candidate locations is 279 acres, or 4% or the total urban area in Placer County. If microfiltration alone was implemented in these candidate catchments, the resulting FSP load was projected to be reduced from an existing load of 47 MT/yr to 9 MT/yr, a reduction of 38 MT/yr or about 80% of the existing load.
Although microfiltration was found to provide very effective load reduction in the candidate catchments (80% reduction), existing loads from these catchments are estimated to constitute less than 10% of the total Placer County FSP load, based on TMDL Watershed Model estimates. Assuming that one TMDL strategy might be to treat the most densely developed areas using advanced treatment, the 38 MT/yr load reduction from implementation of microfiltration alone in the candidate catchments can be compared to the first TMDL milestone to reduce total Placer County FSP loads by 10% (or about 54

Lake Tahoe Advanced Stormwater Treatment Feasibility Analysis (Phase II) – February 19, 2009 Page ES.3
MT/yr), and to future TMDL Clarity Challenge values requiring a 32% (or about 172 MT/yr) reduction of FSP loads. This comparison indicates that advanced treatment of the most densely developed areas of Placer County, without significant additional source and treatment controls in other areas, would not meet TMDL targets.
While significant uncertainty remains in the quantified performance of hydrologic and pollutant source control options outlined in the TMDL Pollutant Reduction Opportunities Report, source control can realistically be applied to a much greater spatial urban area within Lake Tahoe than the extensive stormwater collection and conveyance system needed to capture, route, and store runoff for treatment in microfiltration plants. There is a strong need to develop a better understanding of the feasibility, performance and maintenance requirements of aggressive public and private source control alternatives to more accurately compare source control options to advanced treatment.
An advanced treatment facility employs processes that are similar to those used for potable and wastewater treatment and would be a significant shift from existing stormwater treatment activities in the Lake Tahoe Basin. Preliminary estimates suggest the design, construction and assumed maintenance of a microfiltration treatment facility will cost approximately $10,000 per urban acre treated per year. An advanced stormwater treatment facility would require frequent operation and maintenance activities by qualified personnel. The logical next step toward implementation, and to improve performance estimates and operational knowledge is the construction of a pilot-scale advanced treatment facility.

Lake Tahoe Advanced Stormwater Treatment Feasibility Analysis (Phase II) – February 2009 Page 1.5
Lake Tahoe Advanced Stormwater Treatment Feasibility Analysis (Phase II)
LAKE TAHOE WATERSHED, CALIFORNIA & NEVADA
Chapter 1 – Introduction
1.1 Project Goal and Objectives The goal of this project is to refine and strengthen the understanding of feasibility, potential configurations, and load reduction performance of advanced treatment of stormwater using microfiltration technology. Achieving the project goal will assist Lake Tahoe Basin implementation agencies to plan and prioritize future stormwater management improvements in their respective jurisdictions to meet TMDL allocations for urban stormwater. Specifically, the project will assist implementation agencies by: 1) providing information to assess if advanced treatment using microfiltration technology is an efficient strategy to meet TMDL allocations, and 2) providing general guidance regarding the most feasible locations for siting advanced stormwater treatment in the Lake Tahoe Basin. The following are specific objectives of the project:
• Develop a better technical understanding of key design attributes and anticipated performance for advanced stormwater treatment employing microfiltration technology.
• Develop conceptual recommendations and steps for implementation of a pilot test of an advanced stormwater treatment employing microfiltration technology.
• Expand the constraints analysis conducted during the previous TRPA feasibility assessment and compare anticipated performance of microfiltration treatment to TMDL allocations in applicable urban areas of the Lake Tahoe Basin.
A project coordination team (PCT) has been organized to provide input and comments on the study. The PCT includes representatives from the US Army Corps of Engineers (USACE), Placer County, Lahontan Regional Water Quality Control Board (Lahontan), Tahoe Regional Planning Agency (TRPA), and Nevada Department of Environmental Protection (NDEP).
Chapter 1 articulates the goal and objectives of the project. Additionally, this chapter summarizes a previous feasibility assessment that members of current project team conducted for TRPA. The previous feasibility assessment evaluated various candidate treatment technologies for advanced stormwater treatment and developed a preliminary load reduction estimate based primarily on hydrologic performance. The findings and areas of additional research identified in the TRPA feasibility assessment form the foundation of work for this project.

Chapter 1 ‐ Introduction
Lake Tahoe Advanced Stormwater Treatment Feasibility Analysis (Phase II) – February 19, 2009 Page 1.5
1.2 Previous Feasibility Assessment of Advanced Stormwater Treatment Members of this project team conducted a previous feasibility assessment of advanced stormwater treatment in the Lake Tahoe Basin for TRPA. Below is a brief summary of the previous study, organized into three sections: 1) preferred treatment technology – microfiltration, 2) general operational requirements for microfiltration, and 3) estimated effectiveness of microfiltration. Each section includes a summary of the work performed, along with the key findings and areas of additional research identified by the study. The interested reader is directed to the TIIMS website to download the four technical memorandums produced for the TRPA feasibility assessment: http://www.tiims.org/Basin-Topics/Water-Quality/Stormwater-Management/Pump-and-Treat-Feasibility-Study.aspx
1.2.1 Preferred Treatment Technology - Microfiltration Candidate advanced treatment technologies were evaluated in order to select and carry a preferred stormwater treatment technology to a broader Feasibility Analysis. Advanced treatment technologies evaluated included media-filtration, membrane filtration, and chemical coagulation. Available performance data were reviewed based on demonstrated removals for the primary pollutants of concern for Lake Tahoe clarity, namely fine sediment (defined as particulates <20 microns) and total and dissolved phosphorus. In addition to performance data, literature reviews were conducted to assess operation and maintenance requirements for each technology.
Based on the literature review and available performance data, the project team concluded that microfiltration was the preferred treatment technology to carry forward into the broader Feasibility Analysis.
Key findings that led to the selection of microfiltration as the preferred technology included the following:
• For the treatment technologies evaluated, microfiltration, which is a physical removal technology, appears to hold the most promise for producing consistent and predictable effluent quality even with variable and intermittent flows.
• Operational requirements for membrane filtration (microfiltration) appear lower than coagulation/flocculation systems, especially when considering the significant sensitivity of performance to dosage amount and the difficulty in identifying the correct dosage given the variable flows and loads typical of stormwater runoff.
• Although extensive particle size data was not located for any treatment technology, available TSS performance data and the small pore size of microfiltration (typically 0.3 -10 um) indicates that the treatment technology should achieve high removal rates of very fine particles (<20 um).
• Although extensive data on phosphorus removal using microfiltration was not located, microfiltration should be effective in treating a significant portion of the

Chapter 1 ‐ Introduction
Lake Tahoe Advanced Stormwater Treatment Feasibility Analysis (Phase II) – February 19, 2009 Page 1.6
particulate phosphorus load, but would not be effective at treating dissolved phosphorus loads.
Additional research needs identified for microfiltration technology include the following:
• Confirm fine sediment (< 20 um) removal performance by broadening the literature review and contacting additional recycled and water treatment plants that use microfiltration to inquire about performance of fine sediment removal.
• Broaden research into the applicability of microfiltration for stormwater. The technology is commonly used for recycled water treatment and water supply where influent solids are typically very low (e.g., turbidity less than 1-3 NTUs). In contrast solids in Tahoe stormwater runoff are typically high. Thus, it is critical to consider the pretreatment and backwash requirements needed to avoid clogging the fine microfiltration pores.
1.2.2 General Operational Requirements for Microfiltration General operational requirements for microfiltration anticipated under Lake Tahoe conditions were summarized in the TRPA feasibility assessment. This work included a general assessment of: pretreatment requirements, chemical and waste disposal requirements, operational expertise, power requirements, intervals for replacement of major components, and various miscellaneous operational requirements such as temperature, head loss, building footprints, etc.
Key findings included the following:
• The footprint of above ground structures associated with the facility might be relatively small (approximately 0.5 acres per 100 acres of catchment).
• Because the system utilizes physically based processes rather than chemical or biological processes, it should not create special chemical or waste disposal requirements (unless pretreatment requires chemical processes).
• The operational expertise of a microfiltration facility has many aspects that are comparable to activities conducted by maintenance staff involved in operating water and wastewater facilities within the Basin.
• Estimated annualized capital and operational costs are on the order of $8,000 per acre, or about $2,000/year per equivalent unit assuming the treatment technology is primarily implemented in commercial drainages with four equivalent units per acre. These costs are at least an order of magnitude higher than stormwater utility fees typically charged to commercial rate payers throughout the country. Excluding capital costs (e.g., assuming capital costs are funded through the Environmental Improvement Program (EIP)), operation and maintenance costs are estimated at $170/year per equivalent unit, which is comparable to annual stormwater utility costs paid by commercial rate payers.

Chapter 1 ‐ Introduction
Lake Tahoe Advanced Stormwater Treatment Feasibility Analysis (Phase II) – February 19, 2009 Page 1.7
Additional research needs identified include the following:
• Specific pretreatment requirements for stormwater prior to a microfiltration process were not determined. These processes could include pollutant source controls on parcels and roads in the drainage catchment, or processes at the treatment facility: settling, media filtration, chemical coagulation and flocculation, or electrical coagulation and flocculation.
• The potential for stormwater to significantly affect the life of the microfiltration membranes from fouling or clogging is not well understood.
• It is not well understood if anticipated influent qualities of Lake Tahoe Basin stormwater in urban areas (commercial and highway) would significantly hinder the microfiltration process or contribute to the need for significant pretreatment and a high frequency of backflushing. Most microfiltration units are designed to handle feed water with TSS concentrations typically less than 100 mg/L. The previous TRPA feasibility study assumed that average influent quality from commercial areas in Lake Tahoe (absent pollutant source control) would average about 250 mg/L TSS.
• The intermittent and variable nature of the influent could be a challenge to operation and the effects from starting/stopping treatment operations is not well understood.
• Lower temperatures typical of snowmelt events in Lake Tahoe will increase water viscosity, and although there is guidance on these effects on flow capacity, it is not clear to what extent low temperatures could affect overall load reduction performance.
• Additional contact with recycled and water treatment plants that use microfiltration is needed to learn more about the ease of operations, frequency of fouling, and replacement intervals for major components.
1.2.3 Estimated Effectiveness of Microfiltration Two conceptual treatment scenarios were developed to estimate effectiveness: 1) a centralized storage and treatment scenario, and 2) a distributed storage and treatment scenario. The centralized treatment scenario was modeled using the EPA’s Stormwater Management Model version 5 (SWMM5) to estimate effectiveness of collecting and pumping stormwater runoff to a microfiltration treatment system. The Kings Beach Commercial Core area was used as a real world test case for both the centralized scenario and the distributed scenario.
Key findings based on the preliminary modeling results included the following:
• The primary factor influencing the effectiveness of load reductions is the average annual volume of stormwater runoff that a facility can capture and treat. The average annual volume of runoff captured is an interdependent function of the

Chapter 1 ‐ Introduction
Lake Tahoe Advanced Stormwater Treatment Feasibility Analysis (Phase II) – February 19, 2009 Page 1.8
treatment rate of the microfiltration facility and the design storage upstream of the microfiltration facility.
• Based on the results of the SWMM5 model for the Kings Beach Commercial Core area, which applied a long-term continuous hydrologic simulation model to a hypothetical centralized treatment scenario, it did not appear cost-effective to design a system to capture more than 70% of the average annual runoff volume. Increasing the capture volume above 70% required large increases in storage for the modeled scenario. It should be noted that the estimate of capture volume is sensitive to the assumptions made for the modeling effort (e.g., treatment rate of the facility). The interested reader is directed to Technical Memorandum #4 from the previous TRPA feasibility study to review modeling assumptions: http://www.tiims.org/Basin-Topics/Water-Quality/Stormwater-Management/Pump-and-Treat-Feasibility-Study.aspx
• Based primarily on the hydrologic simulation in SWMM, results indicate that a storage and microfiltration treatment system can be feasibly sized to reduce fine sediment loads by approximately 70-80%.
Additional research needs based on the preliminary modeling results include the following:
• Additional analysis regarding optimizing performance versus costs is needed to find the best balance between treatment rates and design storage.
• The overall cost effectiveness of centralized treatment systems relative to distributed treatment systems is uncertain and is difficult to assess on a general basis because site-specific opportunities and constraints might make one approach more advantageous than the other.
• A qualitative evaluation of the feasibility of a distributed treatment system suggests potential cost savings could be achieved by siting smaller distributed storage facilities and by avoiding the need for a force main and associated pumping cost. However, operation and maintenance costs would be higher and a more thorough life cycle cost analysis would be required to provide comparative costs.

Chapter 1 ‐ Introduction
Lake Tahoe Advanced Stormwater Treatment Feasibility Analysis (Phase II) – February 19, 2009 Page 1.9
THIS PAGE INTENTIONALLY LEFT BLANK

Lake Tahoe Advanced Stormwater Treatment Feasibility Evaluation (Phase II) – December 2008 Page 2.1
Chapter 2 – Conceptual Treatment Train Approach 2 Chapter 2 – Conceptual Treatment Train Approach This chapter evaluates a few applications of microfiltration and identifies: 1) some of the technical constraints encountered, 2) typical treatment train concepts employed, and 3) observed performance. Considerations for using microfiltration to treat Tahoe stormwater are then discussed followed by an assessment of different conceptual treatment trains. The chapter concludes with a brief discussion of the overall feasibility of the treatment process to remove fine particulates.
2.1 Evaluation of Microfiltration Applications outside the Tahoe Basin A thorough literature review did not identify any documented case studies of large-scale stormwater treatment applications of microfiltration. The Santa Monica Urban Runoff Recycling Facility (SMURRF) is the only known case of direct treatment of urban runoff (albeit dry weather runoff) that was identified.
Membrane technology has been used for decades in drinking water treatment facilities and most recently to address EPA’s Long Term 2 Enhanced Surface Water Treatment Rule governing the required treatment of Cryptosporidium (USEPA, 2005). Microbial surrogates for Cryptosporidium range in size from 0.5 – 4 µm, which drives the need for advanced treatment with membrane technology. Various classes of membranes have been developed to treat different particle sizes. Microfiltration units are generally considered to have a pore size range of 0.1-0.2 µm; ultrafiltration (UF) pore sizes generally range from 0.01-0.05 µm. Nanofiltration (NF) and reverse osmosis (RO) can treat down to the molecular scale and are often used for treating dissolved contaminants (USEPA, 2005).
Microfiltration membranes are hollow fibers (outside diameters range from 0.5-2 mm) where flow can be directed from the outside of the fiber to the interior of the fiber (“outside-in” applications), or from the inside of the fiber to the outside (“inside-out” configuration). Photo 2.1 shows a rack of microfiltration tubes at the East Bayshore Recycled Water Project operated by the East Bay Municipal Utility District. Photo 2 shows a cutaway of a tube filled with 6000 hollow fibers (membranes). One of the advantages of microfiltration technology relative to UF and NF is that the pressure required to force water through the membranes is about 50 pounds per square inch differential (50
Photo 2.1. Rack of Microfiltration Columns

Chapter 2 – Conceptual Treatment Train Approach
Lake Tahoe Advanced Stormwater Treatment Feasibility Analysis (Phase II) – February 19, 2009 Page 2.11
psid). Relative to finer pore size membranes, microfiltration requires much less energy to operate (http://www.pall.com).
Given the relatively small pore sizes of membranes, clogging of the microfiltration unit is a major concern. Therefore influent requires pretreatment and the membranes must be backwashed. In water reclamation and water supply, the influent solids concentration to the
microfiltration units is typically low and pretreatment may not be needed or is minimal. For stormwater, the solids in runoff can be quite high and will require pretreatment (see discussion of Tahoe stormwater considerations below).
More recently, with the increased emphasis on water reclamation and reuse, membrane technology is increasingly being used for the treatment of secondary effluent from waste water treatment plants for reuse (Reardon et al., 2005). Because of the need to treat a
variety of contaminants (including dissolved substances like total dissolved solids [TDS]), applications often involve the dual use of microfiltration followed by treatment with very fine membranes (e.g., reverse osmosis, nano-filtration, or ultra-filtration) and ultimately disinfection.
2.1.1 Current Applications The following describes selected microfiltration applications outside the Tahoe Basin, with emphasis on those aspects of the application that could provide insight into the feasibility of the technology to treat stormwater in the Lake Tahoe Basin.
Santa Monica Urban Runoff Recycling Facility (SMURRF) The Santa Monica Urban Runoff Recycling Facility (SMURRF) treats dry weather runoff from two watersheds totaling 5,100 acres. The capacity of the facility is about 0.5 million gallons per day (MGD) and the sequence of unit processes consists of screens, dissolved air flotation, microfiltration, and ultra-violet radiation. The pore size of the unit is 0.4 µm. Routine backwashing with process water is conducted approximately every 30 minutes and there is a semi-annual backflushing with citric acid followed by hypochlorite solution. The sequence of low pH followed by high pH flushing is common as a backflushing scheme to remove inorganic and organic foulants.
Monitoring data of the influent and effluent for the facility as a whole was made available for the period from July 2002 to October 2007. Over this period approximately 70 influent and effluent samples were analyzed for turbidity. The results indicate that the influent averaged about 20 NTUs (standard deviation ~ 30 NTUs) and the effluent tended to below detection
Photo 2.2. Cutout of Column Showing

Chapter 2 – Conceptual Treatment Train Approach
Lake Tahoe Advanced Stormwater Treatment Feasibility Analysis (Phase II) – February 19, 2009 Page 2.12
limits (typically 1 NTU). During this period, approximately 23 samples (obtained on different dates than the turbidity samples) were analyzed for TSS. The influent TSS was approximately 30 mg/l (standard deviation ~ 30 mg/l) and the effluent was always less than detection limits (typically 5 mg/L).
Orange County Groundwater Replenishment System The Orange County Groundwater Replenishment System is designed to ultimately treat 100 MGD of waste water and inject that water into local aquifers that provide about 70% of the water supply for 2.6 million people in Orange County. The advanced wastewater treatment scheme consists of fine screens, immersed hollow fiber microfiltration, RO, and UV irradiation before being conveyed in a 13 mile pipeline to the Anaheim Forebay Recharge Facility. The microfiltration system consists of 26 individual cells (Siemens/Memcor model CMF-S), each having a capacity of 3.5 MGD. The microfiltration membranes have a pore size rating of 0.2 µm, are made of polypropylene material and are not oxidant tolerant. Influent TSS ranged from between 5-10 mg/L and effluent concentrations are typically non-detect or less than 1 mg/L. Pretreatment consists of 2 mm screening and post treatment provides for a 3 mg/L chloramine residual. The Orange County Water District estimates a realistic membrane life of 5 to 7 years. A backwash with reverse flush water and low pressure aeration occurs every 22 minutes for a total backwash cycle duration of 3 minutes. So-called “maintenance backwashing” that uses an oxidant like chlorine is not applied in this system.
East Bay Municipal Utility District East Bayshore Recycled Water Project The East Bay Municipal Utility District installed a recycled water system that utilizes microfiltration to treat secondary effluent for reuse under Title 22 unrestricted reuse requirements. Construction of the facility was completed in June 2007 and consists of 5 racks of 60 microfiltration modules each. The current operating flow rate is 800 gpm, but the total capacity of the system is 2,000 gpm. Each tube contains 6,000 tiny hollow fibers that have a 0.1 µm pore size. The unit is an “outside-in” system where pressure on the outside of the hollow fibers causes water to pass through the 0.1 µm pores on the fiber walls and into the center of the fibers, which contains the filtrate. The membranes are Polyvinyledene Fluoride (PVDF) and are oxidant tolerant. Influent turbidity is typically 4-10 NTUs with occasional exceedence to 40 NTUs, corresponding to periods when the treatment plant experiences an “upset”. Filtrate turbidity is typically 0.01 to 0.02 NTUs. Pretreatment consists of two 300 µm wire screens. Three backwash modes are used to maintain the microfiltration units: (1) routine physical backwashing conducted every 30-40 minutes using filtrate and air scour for approximately 1.5 minutes, (2) daily chemically-enhanced backwash with a hypochlorite solution for about 40 minutes, and (3) monthly or quarterly backwash with a caustic followed by an acid soak for an 8 hour period. The backwash system is designed to ensure that the particulates and microbial growths are removed from the surface of the hollow fibers. The microfiltration units have a 5 year warranty and are

Chapter 2 – Conceptual Treatment Train Approach
Lake Tahoe Advanced Stormwater Treatment Feasibility Analysis (Phase II) – February 19, 2009 Page 2.13
expected to have a life of about 7 years. When membranes are not in use, they must be kept wet, and if not in use for an extended period, are kept soaked in a chlorine solution.
Vancouver, B.C. Pilot Plant Study (Farahbakhsh and Smith, 2002) The Lake Tahoe TMDL is considering setting a load allocation based on particle numbers of fine sediment. The Vancouver British Columbia Pilot Plant Study measured influent and effluent particle counts. The pilot study evaluated a treatment system that included chemical coagulation and powdered activated carbon (PAC) as alternative pretreatment methods, followed by microfiltration and RO. Turbidity was reduced from a mean influent level of 0.55 NTUs to generally <0.05 NTUs. Influent particle size was in the range of 2-15 µm, and associated particle count was 430 to 3,500/ml. Effluent particle count was measured after the RO process and was less than 2/ml. Chemical coagulation was shown to be quite effective as a pretreatment strategy, whereas the addition of PAC generally increased fouling of the filters and the need for more frequent backwashing.
2.1.2 Technological Constraints The major constraint in using microfiltration technology to remove suspended particulate matter is membrane fouling. Membrane fouling, or clogging, is a common problem for waters high in fine sediment and natural organic matter (NOM). Membranes may become clogged due to filling of micropores (internal fouling) and subsequent cake layer buildup (external fouling) (Reardon et al., 2005). Fouling can be considered reversible or irreversible depending on the ability of backwashing and chemical cleaning operations to restore the filter flux rate. Irreversible fouling requires complete replacement of filter cartridges.
While microfilters are typically believed to behave like miniature sieves where fouling is initiated by physical exclusion of particles larger than pore openings, Huang et al. (2008) found that particle-membrane adhesion plays a significant role in membrane fouling. This finding suggests that fouling is both a physical and chemical mechanism and the charge of particulates being removed can greatly influence the reduction of treatment flux rates. Some researchers have investigated the use of charged membranes to counteract electrostatic adhesive forces.
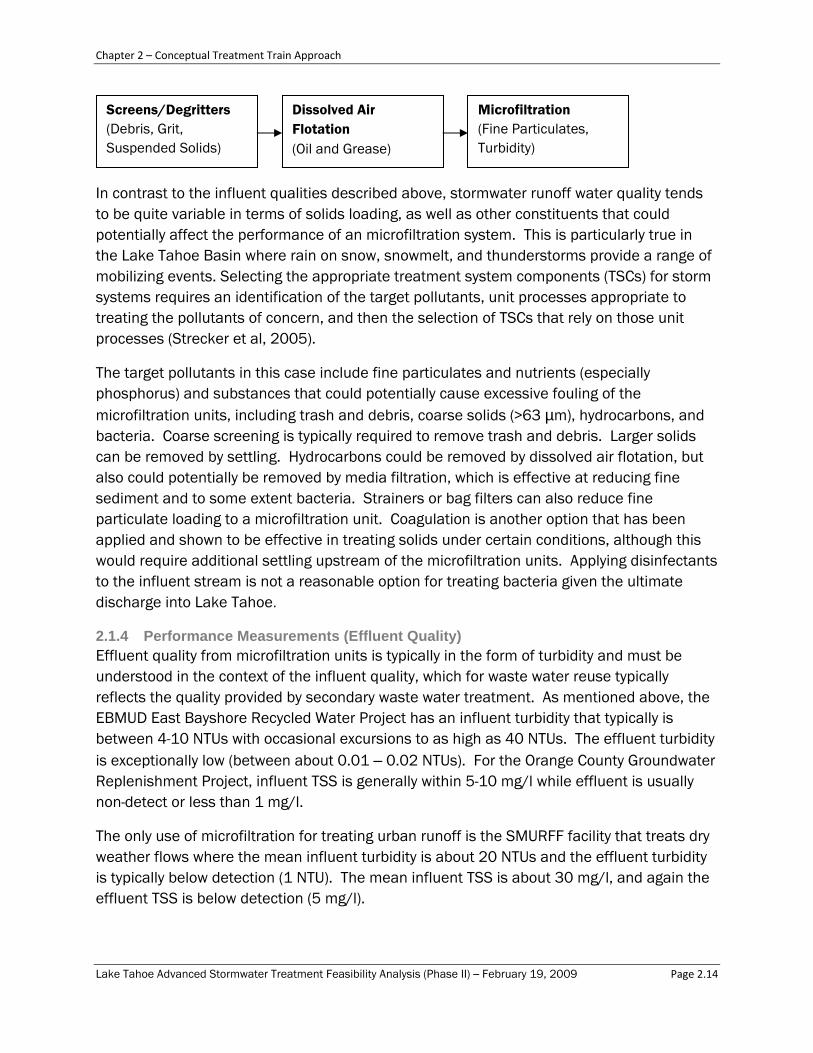
2.1.3 Treatment Train Concepts Employed Water reclamation microfiltration plants receive influent water from secondary or tertiary wastewater treatment plants, so influent water quality to the microfiltration plant is typically low in solids and minimal additional pretreatment is required. Similarly, raw water supply is typically, although not always, quite low in TSS. Dry weather flows in storm drain systems are typically low in solids, and the following treatment train approach for dry weather flows is employed at SMURFF. Coarse solids, trash and debris are removed in a screening unit, followed by dissolved air floatation designed to remove hydrocarbons (a potential fouling agent), and then finally microfiltration for removal of fine particulates.
Chapter 2 – Conceptual Treatment Train Approach
Lake Tahoe Advanced Stormwater Treatment Feasibility Analysis (Phase II) – February 19, 2009 Page 2.14
In contrast to the influent qualities described above, stormwater runoff water quality tends to be quite variable in terms of solids loading, as well as other constituents that could potentially affect the performance of an microfiltration system. This is particularly true in the Lake Tahoe Basin where rain on snow, snowmelt, and thunderstorms provide a range of mobilizing events. Selecting the appropriate treatment system components (TSCs) for storm systems requires an identification of the target pollutants, unit processes appropriate to treating the pollutants of concern, and then the selection of TSCs that rely on those unit processes (Strecker et al, 2005).
The target pollutants in this case include fine particulates and nutrients (especially phosphorus) and substances that could potentially cause excessive fouling of the microfiltration units, including trash and debris, coarse solids (>63 µm), hydrocarbons, and bacteria. Coarse screening is typically required to remove trash and debris. Larger solids can be removed by settling. Hydrocarbons could be removed by dissolved air flotation, but also could potentially be removed by media filtration, which is effective at reducing fine sediment and to some extent bacteria. Strainers or bag filters can also reduce fine particulate loading to a microfiltration unit. Coagulation is another option that has been applied and shown to be effective in treating solids under certain conditions, although this would require additional settling upstream of the microfiltration units. Applying disinfectants to the influent stream is not a reasonable option for treating bacteria given the ultimate discharge into Lake Tahoe.
2.1.4 Performance Measurements (Effluent Quality) Effluent quality from microfiltration units is typically in the form of turbidity and must be understood in the context of the influent quality, which for waste water reuse typically reflects the quality provided by secondary waste water treatment. As mentioned above, the EBMUD East Bayshore Recycled Water Project has an influent turbidity that typically is between 4-10 NTUs with occasional excursions to as high as 40 NTUs. The effluent turbidity is exceptionally low (between about 0.01 – 0.02 NTUs). For the Orange County Groundwater Replenishment Project, influent TSS is generally within 5-10 mg/l while effluent is usually non-detect or less than 1 mg/l.
The only use of microfiltration for treating urban runoff is the SMURFF facility that treats dry weather flows where the mean influent turbidity is about 20 NTUs and the effluent turbidity is typically below detection (1 NTU). The mean influent TSS is about 30 mg/l, and again the effluent TSS is below detection (5 mg/l).
Screens/Degritters (Debris, Grit, Suspended Solids)
Dissolved Air Flotation (Oil and Grease)
Microfiltration (Fine Particulates, Turbidity)

Chapter 2 – Conceptual Treatment Train Approach
Lake Tahoe Advanced Stormwater Treatment Feasibility Analysis (Phase II) – February 19, 2009 Page 2.15
2.2 Considerations for Microfiltration of Stormwater in Tahoe The following describes considerations for applying microfiltration technology to stormwater runoff in the Lake Tahoe Basin.
2.2.1 Variable Flow Rates: Storage, Equalization, and Bypass For any filtration technology, some level of stormwater storage is required to smooth out (equalize) variable inflows in order to provide a constant flow rate to the filtration system. As discussed in Section 2.1, microfiltration is a proven treatment technology increasingly applied in the fields of potable and recycled water treatment. In these fields, the volumetric flow rate of the influent water is relatively constant, or at least the variations in volumetric flow rates are predictable. Because the influent flow rate is predictable, the design of a treatment system (specifically detention storage vs. treatment flow rates) is relatively straightforward to optimize and all influent water is typically treated by the system.
Conversely, filtration technology applied in the field of stormwater treatment is more difficult to optimize because the volumetric flow rate of influent water (stormwater runoff) is episodic and can be highly variable during events. While it is conceivable that a system could be designed to capture and treat the entire range of runoff from a drainage catchment, it is more economical to optimize a stormwater system to capture a certain percentage of the annual runoff volume and allow the peaks of larger events to bypass the facility. Systems can be designed to bypass a facility when either the detention storage is at capacity or to selectively bypass the peak or falling limb of the hydrograph. The intent of a selective bypass is to optimize capture of the presumed poorest quality stormwater runoff. Bypassing the peak of a hydrograph is typically done to avoid quickly exhausting available storage. Bypassing the falling limb of the hydrograph is typically done presuming that urban drainage catchments have a limited supply of pollutants, with the majority of the pollutant load washed off during the rising limb of the hydrograph. Additional Lake Tahoe water quality research would be needed to determine if a selective bypass approach would optimize load reductions.
In the previous TRPA feasibility assessment, which used the Kings Beach Commercial Core as a real-world example, the study assumed a design treatment rate of 0.8 cfs and found that the optimal balance between storage and treatment corresponded to a treatment of approximately 70% of the average annual runoff volume. However, the same detention storage and treatment rate used in the Kings Beach example will not achieve the same percent capture throughout Tahoe Basin because of varying precipitation patterns, as well as varying opportunities and constraints that will be site specific. The design engineer of any advanced treatment system in the Tahoe Basin will need to complete a site-specific analysis to determine the costs of detention storage versus the costs of treatment flow rates to optimize the performance of the system or to achieve a set capture ratio.

Chapter 2 – Conceptual Treatment Train Approach
Lake Tahoe Advanced Stormwater Treatment Feasibility Analysis (Phase II) – February 19, 2009 Page 2.16
2.2.2 Episodic Flows: Treatment System Operation In regard to the episodic nature of stormwater runoff in the Tahoe Basin, the following discussion uses precipitation data as a surrogate to infer stormwater runoff patterns and the implications on operations. An analysis of precipitation data using the SnoTel gage located at Tahoe City revealed the following points, based on available hourly precipitation data for water years 1989 through 2006:
• There were 25 separate periods without precipitation lasting at least one month.
• There were 89 separate periods without precipitation lasting at least two weeks.
• The longest span of consecutive days without precipitation in any given year averaged 90 days.
While total annual precipitation varies greatly depending on location in the Tahoe Basin, the overall trend of extended dry periods as discussed above is consistent throughout the Tahoe Basin. The implication of these dry periods is that an advanced treatment system would be subject to intermittent operation, or at least the system could not be operated continuously for treatment of stormwater. However, microfiltration units cannot merely be shut down during dry weather periods because the fibers must always be kept wet. One option is to retain water in the modules and create a static bath, or to recycle process water.
A second option that would yield water quality benefits would be to treat near-shore lake water during periods absent stormwater runoff. While drawing water from Lake Tahoe for treatment through the microfiltration system would present a different set of challenges, it might be a feasible option for larger centralized systems and could result in more stabilized performance with greater annual load reductions. Specifically, this idea might be feasible for treatment systems sited near the shoreline in areas of the lake identified with relatively high turbidity. For example, the south shore between the mouth of the Upper Truckee River and Bijou Creek (Taylor, 2002 and Taylor et al., 2004).
2.2.3 Influent Quality and Pollutant Source Controls Table 2.1 provides estimated influent quality to a microfiltration system based on the land use distribution estimated for the Kings Beach Commercial Core for TSS. Estimated influent quality for each land use included in Table 2.1 is based on mean Event Mean Concentrations provided by the Lake Tahoe TMDL Pollutant Reductions Opportunities Report (LRWQCB, 2007b) for three scenarios: 1) no pollutant source control, 2) TMDL Tier 1 implementation of pollutant source controls, and 3) TMDL Tier 2 implementation of pollutant source controls. The calculation of average influent quality shown in Table 2.1 is a simple area weighting of the land uses present in the example drainage catchment.

Chapter 2 – Conceptual Treatment Train Approach
Lake Tahoe Advanced Stormwater Treatment Feasibility Analysis (Phase II) – February 19, 2009 Page 2.17
Table 2.1. Estimated TSS Influent Quality under Varying Pollutant Source Control Scenarios
Land Use
Average % Commercial
Core Catchment
Mean EMCs - TSS (mg/L)
No Source Control
TMDL Tier 1 Source Control
TMDL Tier 2 Source Control
Commercial 24% 296 204 112
Multi-Family Residential 17% 150 56 56
Vegetated - Erosion Potential 2 19% 38 38 38
Single Family Residential 16% 56 38 38
Secondary Roads 15% 150 100 50
Primary Roads 9% 952 538 124 Average Influent Quality
(Commercial Core Catchment): 221 135 68
As shown in Table 2.1, a range of TSS influent quality can be anticipated dependent upon the level of pollutant source control implementation. Most microfiltration units are designed to handle source water with TSS concentrations typically less than 10 mg/L, which indicates the need for pretreatment irrespective of source control efforts.
There are two important caveats regarding water quality estimates based on tiers of pollutant source control implementation:
• Estimates of pollutant source control effectiveness are based on best available data for the Tahoe Basin and for locations outside the Tahoe Basin. However, the data is limited and actual effectiveness of pollutant source controls is generally not well understood.
• The Tier 2 Source Control approach assumes significant operation and maintenance activities. The level of effort and resources necessary to accomplish the assumed activities in Tier 2 requires significantly more resources relative to that currently expended on operation and maintenance activities in the Tahoe Basin. Additionally, the water quality improvement related to increased operations and maintenance activities has a high degree of uncertainty because sufficient data is lacking.
As indicated in Table 2.1, TSS in runoff varies by land use. More recent work being conducted as part of the development of the Pollutant Load Reduction Model (2NDNATURE, unpublished) has analyzed available runoff water quality from the Basin and has shown that “catchment condition” is also an important factor that affects runoff quality. Catchment condition takes into account a variety of factors such as slope, soils, and pollutant source controls (e.g., road and road shoulder condition, abrasive application rates, and effectiveness of sweeping and road shoulder protection and stabilization). Figure 2.1 shows the distribution in runoff TSS in the form of “box and whisker plots” for poor, moderate, and good catchment conditions. It also shows there is a seasonal effect on TSS, which reflects different runoff mobilizing events with thunderstorms prevailing in the summer and

Chapter 2 – Conceptual Treatment Train Approach
Lake Tahoe Advanced Stormwater Treatment Feasibility Analysis (Phase II) – February 19, 2009 Page 2.18
snowmelt predominant in the winter and spring. TSS is clearly highest and more variable during summer thunderstorms, especially in poor catchment conditions.
Figure 2.1. Effects of Catchment Condition and Season on Runoff TSS
In contrast to TSS data, the preferred indicator of performance for microfiltration applications in water supply and waste water reclamation is turbidity, expressed in nephelometric turbidity units (NTUs) that ultimately measure the optical clarity of water. On the other hand, most data collected on runoff loads and BMP performance in the Lake Tahoe Basin are based on TSS. Thus, a correlation between TSS and turbidity is needed. Figure 2.2 shows that runoff turbidity correlates with TSS if the data are stratified by event type; however, no single correlation exists. Figure 2.2 also illustrates that elevated levels of turbidity are common, especially for events like thunderstorms. Finally, Figure 2.2 shows the relatively low TSS and turbidity associated with dry weather flows. (Correlations between TSS and turbidity for BMP performance was not investigated as part of this study.)

Chapter 2 – Conceptual Treatment Train Approach
Lake Tahoe Advanced Stormwater Treatment Feasibility Analysis (Phase II) – February 19, 2009 Page 2.19
y = 0.7458x + 9.184R² = 0.9405
020406080
100120140160180200
0 50 100 150 200 250
Turb
idity
(N
TU)
TSS (mg/L)
TSS-Turbidity Relationship During Snowmelt Event
y = 0.4578x + 17.39R² = 0.9599
050
100150200250300350400450
0 200 400 600 800 1,000
Turb
idity
(N
TU)
TSS (mg/L)
TSS-Turbidity Relationship During Rain Event
y = 1.2118x - 21.252R² = 0.8664
0
50
100
150
200
250
300
0 50 100 150 200
Turb
idity
(N
TU)
TSS (mg/L)
TSS-Turbidity Relationship During Rain on Snow Event
0
5
10
15
20
25
0 5 10 15 20 25
Turb
idity
(N
TU)
TSS (mg/L)
TSS-Turbidity Relationship During Rain/Snow Mix Event
y = 0.551x + 8.2883R² = 0.9656
0
200
400
600
800
1,000
1,200
1,400
0 500 1,000 1,500 2,000
Turb
idity
(N
TU)
TSS (mg/L)
TSS-Turbidity Relationship During Thunderstorm Event
y = 1.1043x - 1.4978R² = 0.8559
0
10
20
30
40
50
60
70
0 10 20 30 40 50
Turb
idity
(N
TU)
TSS (mg/L)
TSS-Turbidity Relationship During Baseflow
Figure 2.2. Turbidity TSS Correlations for Different Types of Runoff Mobilization Events and for Baseflow (Note: different scales on individual plots)
2.2.4 Tahoe Basin Climate and Physiographic Considerations The following are notable considerations to implementing advanced treatment systems in the Tahoe Basin because of climate and physiographic considerations:
• As discussed in Section 2.2.2 the majority of stormwater runoff is generated in the winter months. Design and operation of a treatment system needs to consider implications that cold weather conditions may have on the system’s performance. For example, most stormwater runoff in the Tahoe Basin is snowmelt, or is mixed

Chapter 2 – Conceptual Treatment Train Approach
Lake Tahoe Advanced Stormwater Treatment Feasibility Analysis (Phase II) – February 19, 2009 Page 2.20
with snowmelt, which lowers the temperature of runoff and therefore increases the viscosity. As researched in the TRPA feasibility assessment: assuming an average stormwater temperature similar to temperatures of Lake Tahoe Basin streams during snowmelt (6° C), the achievable flow rate through a membrane filter is 60% of the design flow rate for a membrane filter rated at 20° C.
• Orographic effects are significant in the Tahoe Basin. Figure 2.3 was developed based on data downloaded from the Parameter-elevation Regressions on Independent Slopes Model (PRISM) developed at Oregon State University (PRISM, 2008, www.prism.oregonstate.edu) Figure 2.3 illustrates the average annual precipitation in the Basin, which ranges from a minimum of 18 inches on the east shore to a maximum of 72 inches on the west shore. Consequently, designing a treatment system to capture a specific annual runoff volume will vary based upon location in the Basin. For example, the previous feasibility assessment estimated that a 70% capture of runoff could be achieved in the Kings Beach areas with a treatment flow rate of 0.8 cfs. As shown in Figure 2.3, the Kings Beach area has the lowest average annual precipitation in Placer County. Consequently, capture of 70% of the average annual runoff in other locations in Placer County will likely require detention storage greater than that assumed in the Kings Beach example for a treatment flow rate of 0.8 cfs.
• The location and size of detention storage will be based on site-specific opportunities within individual drainage catchments and localized topography. In some cases, routing all stormwater runoff from a catchment to detention storage by gravity flow will not be possible. Additionally, pumping stormwater to feasible locations for detention storage may span significant elevation changes or large distances and will increase the spatial extent of infrastructure and the size of pumps (i.e., increased cost).
2.2.5 Potential Post Treatment As discussed in the previous TRPA feasibility assessment, microfiltration should be effective in treating a significant portion of particulate loads for nitrogen and phosphorus. However,
Figure 2.3. Average Annual Precipitation in Tahoe Basin

Chapter 2 – Conceptual Treatment Train Approach
Lake Tahoe Advanced Stormwater Treatment Feasibility Analysis (Phase II) – February 19, 2009 Page 2.21
significant reductions in dissolved nitrogen and phosphorus are not expected with microfiltration treatment. These pollutants of concern would need post treatment (e.g., discharge wetlands) if reductions in dissolved nutrient loads are deemed necessary.
The dissolved fractions of nitrogen and phosphorus could be significantly reduced if a system was designed such that treated discharge was either gravity fed or pumped to a constructed wetland or wet pond. Based on the International BMP Database performance data (nhc and Geosyntec, 2006), the median effluent concentrations of dissolved nitrogen and phosphorus from wetland/wet pond systems is 0.10 mg/L and 0.04 mg/L, respectively. Because the microfiltration system would yield a relatively constant discharge, it could serve as the baseflow for a constructed wetland assuming issues associated with periods absent stormwater runoff could be addressed.
A second option for post treatment would be to employ additional advanced treatment after the microfiltration process within the footprint of the facility. Pilot applications growing cultured periphyton have recently been conducted in the Tahoe Basin using stormwater runoff to feed algal beds with relatively small footprints. Preliminary results from a pilot study estimate annual P removal of 10g/m2/yr with nitrate influent concentrations of 10 to 81µg/l consistently reduced to 3µg/l or less (Patterson et al., 2007).
2.3 Conceptual Treatment Train The following describes treatment train concepts associated with the use of microfiltration for stormwater treatment based on literature information and considerations specific to Lake Tahoe conditions. The discussion is divided amongst flow management, water quality pretreatment, and treatment.
2.3.1 Storage, Equalization, Bypass All filtration technology is flow limited, and this especially applies to microfiltration technology where water is forced under pressure to flow through micro-pores in the membrane. This factor, in combination with the highly variable runoff (Section 2.2.2) requires that some type of flow equalization will be necessary upstream of the microfiltration units. Moreover, modeling conducted as part of the previous TRPA study indicates that the most cost-effective balance between required storage (cost) and percent of runoff treated (benefit) for the parameters investigated occurred when the microfiltration system was sized to treat approximately 70% of the mean annual runoff. Under this condition approximately 30% of the runoff would bypass the microfiltration facility and be discharged directly into Lake Tahoe. The analysis conducted for the TRPA study was for a selected design treatment rate and a centralized facility that included multiple storage and pumping facilities. Different conditions and locations could lead to a different conclusion regarding the cost-effective balance between required storage (cost) and percent of mean annual runoff treated (benefit).

Chapter 2 – Conceptual Treatment Train Approach
Lake Tahoe Advanced Stormwater Treatment Feasibility Analysis (Phase II) – February 19, 2009 Page 2.22
Storage options can be above or underground. Along the more congested lake fringe, storage would likely be underground. Such facilities could be co-located with parks, or parking lots (with appropriate structural design for anticipated vehicular loads).
2.3.2 Pretreatment Pretreatment in the context of water supply and waste water reclamation usually refers to treatment units located immediately upstream of the microfiltration unit. But in case of industrial dischargers, pretreatment programs can be located within the service area. The analogy extends to stormwater treatment as well, where pretreatment may include hydrologic or pollutant source controls located within the watershed or catchment that contributes flow to the treatment system. The efficacy of pollutant source controls in improving the quality of runoff that might ultimately enter a microfiltration treatment system is difficult to quantify with a high degree of confidence. However, it appears based on the literature reviews and analysis of Tahoe stormwater data conducted for this report that pretreatment beyond pollutant source controls would be needed to operate a microfiltration facility.
Microfiltration is by definition a micro-pore filtration system that can clog depending on influent solids and other chemical contaminants (e.g., oil and grease). Large particulate matter can damage or plug the membrane fibers in microfiltration units and it is recommended that prefiltration or other treatment be incorporated into the treatment process. For water supply and waste water reclamation situations, the US EPA Membrane Filtration Guidance Manual (2005) recommends that the micron rating of the selected prefiltration range between 100 µm and 3,000 µm, depending on the influent water quality, to minimize clogging associated with large particulate matter. Given the variability in runoff quality and the periodic elevated concentrations of TSS and turbidity in Lake Tahoe stormwater, this standard does not seem applicable to Lake Tahoe conditions.
In contrast to secondary treated effluent, the turbidity and TSS in runoff from Lake Tahoe can vary widely depending on the mobilizing event (Figure 2.2). One strategy to address this range of influent solids concentrations is to develop a treatment train that sequentially reduces the size of the particles as one progresses along the treatment train.
A second element in the strategy could include filter media, screening, and coagulation/ flocculation, as discussed below.
Sand Filters Sand filters could be used to reduce sediment concentrations and associated turbidity prior to microfiltration. A summary of sand filter field performance provided by Urbonas (1999) indicates sand filters can generally reduce TSS concentrations to below 40 mg/L with an average effluent concentration of 16 mg/L. Barrett (2003) estimated an average effluent TSS concentration of approximately 8 mg/L from five Austin sand filters installed in maintenance stations and park and ride parking lots owned by the California Department of
Chapter 2 – Conceptual Treatment Train Approach
Lake Tahoe Advanced Stormwater Treatment Feasibility Analysis (Phase II) – February 19, 2009 Page 2.23
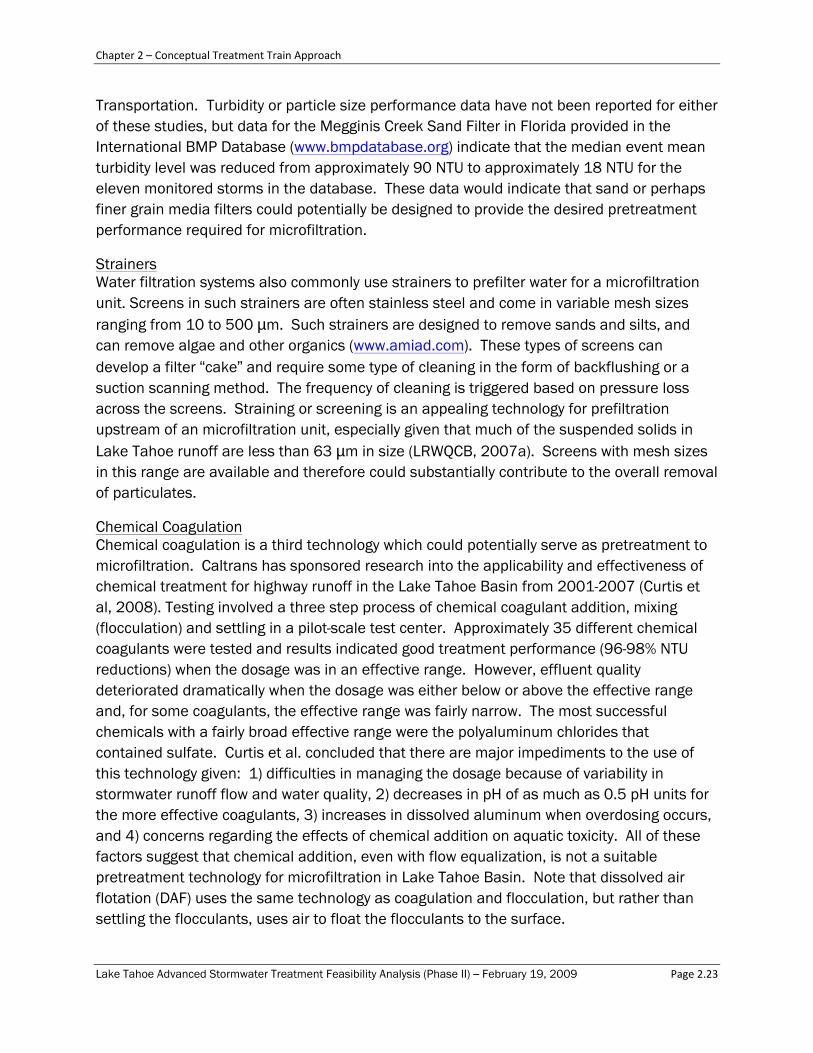
Transportation. Turbidity or particle size performance data have not been reported for either of these studies, but data for the Megginis Creek Sand Filter in Florida provided in the International BMP Database (www.bmpdatabase.org) indicate that the median event mean turbidity level was reduced from approximately 90 NTU to approximately 18 NTU for the eleven monitored storms in the database. These data would indicate that sand or perhaps finer grain media filters could potentially be designed to provide the desired pretreatment performance required for microfiltration.
Strainers Water filtration systems also commonly use strainers to prefilter water for a microfiltration unit. Screens in such strainers are often stainless steel and come in variable mesh sizes ranging from 10 to 500 µm. Such strainers are designed to remove sands and silts, and can remove algae and other organics (www.amiad.com). These types of screens can develop a filter “cake” and require some type of cleaning in the form of backflushing or a suction scanning method. The frequency of cleaning is triggered based on pressure loss across the screens. Straining or screening is an appealing technology for prefiltration upstream of an microfiltration unit, especially given that much of the suspended solids in Lake Tahoe runoff are less than 63 µm in size (LRWQCB, 2007a). Screens with mesh sizes in this range are available and therefore could substantially contribute to the overall removal of particulates.
Chemical Coagulation Chemical coagulation is a third technology which could potentially serve as pretreatment to microfiltration. Caltrans has sponsored research into the applicability and effectiveness of chemical treatment for highway runoff in the Lake Tahoe Basin from 2001-2007 (Curtis et al, 2008). Testing involved a three step process of chemical coagulant addition, mixing (flocculation) and settling in a pilot-scale test center. Approximately 35 different chemical coagulants were tested and results indicated good treatment performance (96-98% NTU reductions) when the dosage was in an effective range. However, effluent quality deteriorated dramatically when the dosage was either below or above the effective range and, for some coagulants, the effective range was fairly narrow. The most successful chemicals with a fairly broad effective range were the polyaluminum chlorides that contained sulfate. Curtis et al. concluded that there are major impediments to the use of this technology given: 1) difficulties in managing the dosage because of variability in stormwater runoff flow and water quality, 2) decreases in pH of as much as 0.5 pH units for the more effective coagulants, 3) increases in dissolved aluminum when overdosing occurs, and 4) concerns regarding the effects of chemical addition on aquatic toxicity. All of these factors suggest that chemical addition, even with flow equalization, is not a suitable pretreatment technology for microfiltration in Lake Tahoe Basin. Note that dissolved air flotation (DAF) uses the same technology as coagulation and flocculation, but rather than settling the flocculants, uses air to float the flocculants to the surface.

Chapter 2 – Conceptual Treatment Train Approach
Lake Tahoe Advanced Stormwater Treatment Feasibility Analysis (Phase II) – February 19, 2009 Page 2.24
2.3.3 Treatment (Microfiltration) Microfiltration systems clearly provide excellent water quality and are commonly used in drinking water and waste water reclamation where the influent is already typically low in TSS and turbidity. Microfiltration units that treat dry weather runoff, which also tends to be low in TSS and turbidity, has proven effective at the SMURFF facility in Santa Monica. The challenge is the applicability of the microfiltration technology to wet weather stormwater runoff. The information available would suggest that with adequate flow equalization and pretreatment, as discussed above, an microfiltration system could reliably provide effluent low in fine particulates. The question is the reliability and robustness expected for such a system given the variability in stormwater runoff volumes and quality. Clearly such a system will require active management and oversight, along with a degree of automated monitoring and process control, that is more reflective of a waste water or drinking water facility than the mostly passive treatment systems currently employed for stormwater control. The questions become: 1) what are the backwashing requirements required to maintain performance, 2) are backwashing requirements practical in terms of resource requirements, and 3) what will be the membrane life under these conditions?
2.4 Feasibility Assessment – Treatment Process Microfiltration is an accepted and proven treatment method for water supply and waste water reclamation. The literature reviewed indicates that microfiltration systems can provide a very high quality effluent having very low turbidity (typically < 1 NTU). These results however reflect extremely well controlled influent flows and water quality typical of secondary treatment or recycled treatment facilities. Moreover, sophisticated operation and maintenance is required in the form of backwashing to minimize clogging and loss of function. Membrane replacement for these applications is likely to be required in 5 to 7 years. Backwashing requirements are further explored in Chapter 3 to assess potential water quality (introduction of chemicals) and potential water quantity (consumptive use) issues.
With proper design, including provision for flow equalization and pretreatment, microfiltration systems should be able to provide effluent quality for stormwater similar to that for traditional applications. Backwashing may require oxidants (e.g., chlorine) to address biofouling, which would require discharge of backwash water to a sanitary sewer. The remaining issues include: 1) adequacy of the proposed pretreatment given the variability and sometimes substantial levels of TSS and turbidity in Lake Tahoe stormwater runoff, 2) backwashing requirements for successful operation of the microfiltration system, and 3) the life of the membranes under operating conditions that are much more extreme that those commonly encountered in waste water and water supply.
Ultimately, a pilot test will be required to address these issues to evaluate the proof of concept of microfiltration treatment for stormwater runoff. Key design variables for the pilot would include the microfiltration pore size and treatment rate, storage requirement for flow

Chapter 2 – Conceptual Treatment Train Approach
Lake Tahoe Advanced Stormwater Treatment Feasibility Analysis (Phase II) – February 19, 2009 Page 2.25
equalization, and grain-size specifications for a media filter or screen sizes for a strainer(s). Selection of the design variables would need to be in the context of pilot application and would take into account watershed size and land use, extent of imperviousness, precipitation amount and type, topography and land availability, and seasonal and annual runoff flow and quality. Other key decisions would be the scale of the pilot test and the need for alternative configurations for testing.
Based on the above considerations, the following is an initial conceptual treatment train for consideration in the pilot testing. The basic configuration calls for a series of unit processes that sequentially reduce particle size in the process water and reduce fouling agent concentrations, especially prior to reaching the microfiltration unit. Chapter 3 develops a treatment facility process based on the conceptual treatment train shown below.

Lake Tahoe Advanced Stormwater Treatment Feasibility Evaluation (Phase II) – December 2008 Page 2.1
Chapter 3 – Recommended Treatment Process 3 Chapter 2 – Conceptual 2 – Conceptual Treatment Train Approach This chapter expands upon the treatment train concept proposed in Chapter 2 by developing a conceptual treatment facility layout that illustrates the major treatment processes and connections between processes. Implementation considerations for operating and managing an advanced treatment facility are then evaluated and potential locations for siting a facility in Placer County are explored. Finally, a pilot scale facility is proposed as the necessary next step to further assess the viability of advanced treatment facilities for reducing pollutants of concern in Lake Tahoe stormwater.
3.1 Conceptual Treatment Facility Layout Figure 3.1 displays the conceptual treatment facility, illustrating the major treatment processes identified in Chapter 2. The treatment facility layout is developed at a conceptual level and a number of significant design and implementation details are beyond the scope of this study. These include, but are not limited to the: specific equipment types and capacity; plumbing, power (including standby emergency power), and control systems; maintenance access design; buildings and storage facilities to house equipment and supplies; peak flow bypass locations and design; potential storage and reuse of effluent; and other features.
General sizing parameters for the conceptual treatment facility were taken from assumptions developed during the previous TRPA feasibility assessment for the centralized treatment scenario, which estimated that the footprint of the facility might be relatively small (approximately 0.5 acres per 100 acres of drainage catchment). A three-dimensional model of the conceptual treatment facility can be downloaded at: (http://cfd.nhc-sac.com/privftp.php) [username: “Tahoe”, password: “bluelake”, directory: “Advanced SW Treatment”]
3.1.1 General Layout As shown in Figure 3.1, a treatment system with duplicate parallel flow streams is proposed to allow for continued operation of the facility when equipment needs to be taken out of service for maintenance or repair. Total footprint of the facility shown in Figure 3.1 is roughly 22,000 square feet. The most significant space requirement for the facility is stormwater detention, which requires a footprint of roughly 10,000 square feet. As shown, detention is sized to store roughly 72,000 cubic feet (1.65 acre-feet) of stormwater using sub-surface storage (Figure 3.1, Profile View). Sub-surface detention may allow for a secondary use such as parking, which would reduce the total footprint dedicated to treatment facility operations to roughly 12,000 square feet.

Chapter 3 – Recommended Treatment Process
Lake Tahoe Advanced Stormwater Treatment Feasibility Analysis (Phase II) – February 19, 2009 Page 3.27
Plan View
Coarse Screens
Detention
and Sedimentation
DewateringFacility
Microfiltration
Filters
Profile View
Oblique View
Figure 3.1. Conceptual Treatment Facility Layout

Chapter 3 – Recommended Treatment Process
Lake Tahoe Advanced Stormwater Treatment Feasibility Analysis (Phase II) – February 19, 2009 Page 3.28
Unit processes proposed for the treatment facility progressively remove the mass of particles in the influent stormwater thereby reducing the TSS concentration introduced to the microfiltration units. There are four unit processes employed to remove sediment and debris from the influent stormwater: coarse screens, detention and sedimentation, fine sediment filters, and microfiltration. The following sections describe key attributes of each unit process in the order of the treatment train. A fifth unit process (dewatering) is also described. The following terms are used frequently in the discussion below and are defined here: Coarse sediment – particles greater than 63 microns in diameter Fine sediment – particles less than 63 microns in diameter Fine sediment particles (FSP) – particles less than 20 microns in diameter 3.1.2 Coarse Screens Influent stormwater to the treatment facility would first be routed through coarse screens (trash racks) to remove large debris that may otherwise clog or damage pumps in subsequent treatment processes. Typical openings for coarse screens range from 2-6 inches and average flow velocities through the screens should be sufficient to keep sediment suspended, typically on the order of 1.5 ft/sec (Tchobanoglous, 1985). Debris collected on the coarse screen can be cleaned either manually or mechanically. 3.1.3 Detention and Sedimentation Influent stormwater would pass through the coarse screens into a flow separator that would divide stormwater runoff into two separate cells for detention and sedimentation (Figure 3.1, Plan View). Detention serves two primary functions: 1) peak flow attenuation to minimize high flow bypass and provide storage of stormwater for subsequent treatment at manageable flow rates; and 2) removal of coarse particles via settling. The long and narrow orientation of the detention cells will reduce turbulence and decrease the velocity of water traveling through the detention cells, thereby enhancing particle settling. The dimensions of each cell shown in Figure 3.1 are: 20 feet wide, 200 feet long, and 8-10 feet deep. Settled solids in each cell would be removed by a mechanical removal system such as traveling scrapers (flights), typically used in wastewater treatment (Tchobanoglous, 1985). The mechanical removal system would scrape settled material into hoppers for subsequent pumping to the dewatering facility using industrial submersible pumps designed specifically for solids applications. The quantity of material transported from detention storage to the dewatering facility would be a function of influent load of coarse sediment. Assuming each detention cell would perform about as well as an average dry detention basin within the Lake Tahoe Basin, effluent quality from detention storage would typically be below 50 mg/L TSS (LRWQCB, 2007b, 2NDATURE 2006). While data on achievable effluent quality of Lake Tahoe Basin dry detention basins for fine sediment particles is

Chapter 3 – Recommended Treatment Process
Lake Tahoe Advanced Stormwater Treatment Feasibility Analysis (Phase II) – February 19, 2009 Page 3.29
limited, for the purposes of this analysis it is assumed that the suspended particle load in the effluent from the detention basins would be predominantly comprised of fine sediment. Water from each detention cell would be pumped from the end of each cell (opposite the influent stormwater side) and routed to fine sediment filters. Ideally water would be pumped at the surface of the water column in the detention cell to minimize the mass of coarse sediment routed to filtration processes.
3.1.4 Fine Sediment Filters Pumped water from each detention cell would be routed to automatic self cleaning filters. Note that Figure 3.1 displays a generic filter screen. An example of an automatic self cleaning filter referenced in this section is shown in Figure 3.2.
Fine sediment filters would target the removal of any coarse sediment passing through the detention and sedimentation process, and fine sediment. A number of filter sizes are available down to 10 microns, however; a recommended filter size is not indentified in this study. A pilot plant test is recommended to identify an appropriate filter size (see Section 3.4).
Fine sediment filters are recommended as pretreatment to the microfiltration units to reduce the loading rate, or membrane flux, that the microfiltration units are required to filter. The Orange County Water District has found that the primary cause of membrane fouling on their microfiltration units is the loading rate. By decreasing the loading rate, the Orange County Water District has been able to control fouling issues without the need to chemical backwash the microfiltration units (personal communication with Mehul Patel, Orange County Water District). Automatic self cleaning filters have a number of advantages as pretreatment to microfiltration relative to other options such media filtration. Advantages include:
1) Self Cleaning – As material accumulates on the filter the outlet pressure drops. Once a preset pressure differential is reached a backwash cycle is automatically initiated. This process is advantageous for stormwater applications because the backwash cycle depends on the influent quality of the water and is not dependent on a preset interval.
2) Durability – the filters are made of carbon steel or stainless steel. 3) Interchangeable Filter Sizes – the size of the filter can be adjusted to optimize
performance.
Figure 3.2. Example Filter – City of Watsonville WWTP

Chapter 3 – Recommended Treatment Process
Lake Tahoe Advanced Stormwater Treatment Feasibility Analysis (Phase II) – February 19, 2009 Page 3.30
4) Limited Maintenance Needs - manufacturer literature recommends that the filters receive an acid bath on a quarterly or semi-annual interval.
As shown in Figure 3.1 (Plan View, green pipes), a backwash cycle would flush material accumulated on the filters and route the backwash to the dewatering facility. Water passing through the filters would be routed to microfiltration units. Performance data for fine sediment particles was not located. Assuming the filters were 20 microns and the influent composition to the filters was roughly 60% particles less than 20 microns in size, then the microfiltration units would receive an influent of roughly 30 mg/L of fine sediment particles.
3.1.5 Microfiltration Operation of the microfiltration units is documented in Chapter 2 and in the previous TRPA feasibility assessment and is not repeated in detail in this section. Microfiltration units would target the removal of fine sediment particles. The key concepts for the microfiltration units include:
• The microfiltration units would remove particles down to 0.5 micron in size. Microfiltration performance data is typically reported in TSS or turbidity - data on fine sediment particles was not found for this study. The best available data reports typical effluent quality as less than 1 mg/L TSS or between 0.1 and 0.2 NTUs (personal communication John Hake, East Bay Municipal Utility District).
• Backwash cycles using forced air and filtrate water would likely occur every 20-30 minutes with backwash routed to the dewatering facility.
• Oxidant intolerant microfiltration membranes, which cannot receive a chemical backwash, may be feasible for use based on successful operation of oxidant intolerant membranes at the Orange County Groundwater Replenishment System, which treats wastewater (personal communication, Mehul Patel, Orange County Water District). Using membranes that do not need chemical backwashing may be advantageous because it could eliminate the need to discharge backwash from the treatment facility to sanitary sewer.
3.1.6 Dewatering Facility Solids removal from the facility will be required and a dewatering facility is proposed to minimize the quantity of water transported with the solids. A generic building is shown in Figure 3.1 to represent the dewatering process. Figure 3.3 shows a conceptual process for dewatering that is similar to the dewatering process used by Longley Lane Water Treatment Plant, which is a microfiltration plant operated by Washoe County Department of Water Resources (Washoe County website, 2008).

Chapter 3 – Recommended Treatment Process
Lake Tahoe Advanced Stormwater Treatment Feasibility Analysis (Phase II) – February 19, 2009 Page 3.31
CLARIFIER HOLDING TANK FILTER PRESS
To Disposal
Backwash
DecantReturned toDetention
Solids fromDetention
DecantReturned toDetention
Figure 3.3. Conceptual Dewatering Facility
As shown in Figure 3.3, water from the backwash cycles would pass through a clarifier to settle suspended solids. Decant from the clarifier would be returned to detention storage to be cycled back through the treatment process. Settled solids would be transferred to a holding tank that also receives settled solids extracted from detention storage. A filter press would then be used to dewater solids from the holding tank. Solids in the filter press would be pressed into a cake and collected for subsequent transfer from the facility for landfill disposal. Decant from the filter press would be returned to detention storage.
3.2 Implementation Considerations The following section explores implementation considerations for advanced treatment that were not addressed as part of the TRPA feasibility assessment. The interested reader is directed to Technical Memorandum #4 of the TRPA feasibility assessment to review feasibility criteria addressed through the previous study: http://www.tiims.org/Basin-Topics/Water-Quality/Stormwater-Management/Pump-and-Treat-Feasibility-Study.aspx
1. Will backwash need to go to sanitary sewer?
The conceptual facility layout in Figure 3.1 shows a connection to sanitary sewer from the microfiltration units. A sanitary sewer connection would be needed if chemical backwash of the microfiltration units is necessary to control fouling issues. Presently, the need for chemical backwashing of the microfiltration units is uncertain because no examples of microfiltration of stormwater have been identified by the project team. As a comparison, treatment of wastewater at the Orange County Groundwater Replenishment System includes a microfiltration process without chemical backwash. The Orange County Water District has found that fouling of the membranes is primarily a function of the backwash frequency and loading rate to the filters (Mehul Patel, Orange County Water District, personal communication). The Orange County operations suggest that chemical backwashing may not be needed to filter stormwater and thus a connection to sanitary sewer may not be needed. A pilot plant test is recommended to resolve this issue (see Section 3.4).

Chapter 3 – Recommended Treatment Process
Lake Tahoe Advanced Stormwater Treatment Feasibility Analysis (Phase II) – February 19, 2009 Page 3.32
2. What is the volume of water that would be lost to waste streams as part of the advanced treatment process?
Assuming that backwash to sanitary sewer is not necessary (see response to question above), the only water that would be lost through the treatment process is water retained in solids after processing through the dewatering facility. To estimate the amount of water disposed of with solids, the following assumptions were made:
• Solids processed by the dewatering facility would be predominantly inorganic with physical properties similar to soil.
• The filter press would produce solids with a consistency similar to saturated soil with a saturated unit weight of 135 lbs/ft3. The dry density of soil is assumed to be 100 lbs/ft3. So, for every 100 lbs of solids removed from the facility, 35 lbs of water would be removed.
• The Phase 1 feasibility assessment estimated that on an average annual basis the facility would capture 24 tons, or 48,000 lbs of sediment.
Based on the assumptions above, the facility would dispose of 17,000 lbs of water (2,000 gallons) on an average annual basis. This estimate is less than 0.1% of the average annual volume of water estimated to be treated by the facility.
3. Can pollutant source controls reduce pretreatment requirements?
The pretreatment proposed for the conceptual facility (coarse screens, sedimentation, and filters) would likely be required regardless of the level of pollutant source controls applied to the drainage catchments tributary to the treatment facility. This conclusion is supported using TMDL estimates of pollutant source control effectiveness. As shown in Table 2.1 (Chapter 2), implementation of TMDL Tier 2 pollutant source controls in the Kings Beach Commercial Core drainage is estimated to result in an average runoff concentration of 68 mg/L of TSS. While the TMDL estimates of pollutant source control effectiveness contain a large amount of uncertainty, the average runoff quality estimated is substantially higher than typical influent qualities to microfiltration units researched as part of this study, which ranged between 5-30 mg/L TSS.
While pollutant source controls may not decrease the number of processes necessary for pretreatment prior to microfiltration, pollutant source controls will likely improve the operation of an advanced treatment facility by reducing spikes in poor runoff quality that may upset the treatment process. As shown in Figure 2.1 (Chapter 2), there is a positive correlation between reduced spikes in extremely poor quality runoff events with improved catchment condition, where catchment condition is assumed to be improved through implementation of pollutant source controls.

Chapter 3 – Recommended Treatment Process
Lake Tahoe Advanced Stormwater Treatment Feasibility Analysis (Phase II) – February 19, 2009 Page 3.33
Additionally, pollutant source controls would likely reduce maintenance frequencies and extend the life of components associated with the various treatment processes (e.g., microfiltration membranes).
4. What is the current ability of Lake Tahoe Basin jurisdictions to operate an advanced treatment facility?
Placer County’s ability to operate an advanced treatment facility in the Lake Tahoe Basin was explored to respond to this question (personal communication, Peter Kraatz, Placer County, December 2, 2008). Placer County is similar to most Lake Tahoe Basin jurisdictions that will be regulated by the Lake Tahoe TMDL in that: 1) only a portion of their jurisdictional boundaries are within the Lake Tahoe Basin; and 2) the majority of their population and resources are located outside the Tahoe Basin.
Currently, Placer County maintenance in the Tahoe Basin is limited to basic public works activities associated with road maintenance. Placer County does have experience and expertise in the fields of wastewater treatment, as the Environmental Engineering division of the County manages multiple wastewater treatment plants. However, this expertise is concentrated outside of the Tahoe Basin. Placer County is set up institutionally to transfer resources, but it would require a shift in County organization to bring treatment plant operator expertise to the Lake Tahoe Basin.
A secondary option for jurisdictions regulated under the Lake Tahoe TMDL would be to team with local public utility districts (PUDs) to manage and operate advanced treatment facilities for stormwater. The local PUDs are typically in charge of water distribution, wastewater collection, and wastewater treatment in the Tahoe Basin. Staff from the PUDs would have experience and expertise similar to that required to operate an advanced treatment facility for stormwater.
5. What is the annualized capital and O&M cost of an advanced treatment facility?
The TRPA feasibility assessment includes an annualized capital and O&M cost estimate, including a breakdown of cost by line item. The previous cost estimate assumed frequent maintenance activities for an advanced, but still relatively passive treatment process. However, based on additional analysis conducted for this study that highlights the need for multiple processes in the treatment train, it is clear that the proposed treatment facility will require active management and a degree of automated process control that is more typical of a small waste water or drinking water treatment facility. Consequently, the operational cost estimate for an advanced treatment facility has been revised assuming the annual operating cost of the SMURFF facility is a better approximate estimate (SMURFF, 2007). Table 3.1 below is a summary of the revised cost estimate.

Chapter 3 – Recommended Treatment Process
Lake Tahoe Advanced Stormwater Treatment Feasibility Analysis (Phase II) – February 19, 2009 Page 3.34
Table 3.1. Estimated Annualized Cost for a Centralized Treatment Facility
Description Previous Cost
Estimate New Cost Estimate
Notes
Centralized Treatment Facility Capital Costs
$15,550,000 $15,550,000
Cost estimate not revised from previous to new because siting
variables (e.g., presence of groundwater) will make capital cost highly variable dependent
upon location.
Operational Costs for 20-Year Period
$1,329,000 $5,000,000 New cost estimate is based on SMURFF estimate of $250,000
per year for operations.
Total for 20-Year Period $16,879,000 $20,550,000 20-year estimate not adjusted for inflation. Assumes 2008 dollars.
Total per Acre of Urbanized Drainage for 20-Year Period
$164,000 $200,000 Assumed facility serves a 103
acre drainage (Kings Beach Commercial Core)
Average Annual Cost per Acre of Urbanized Drainage $8,200 $10,000
3.3 Siting of Advanced Treatment Facilities in the Lake Tahoe Basin The conceptual treatment facility proposed in Section 3.1 is an active treatment process, meaning that daily operations and maintenance activities would be necessary by qualified personnel to ensure the facility operates to performance standards. The conceptual facility employs treatment processes that are similar to processes used for potable and wastewater treatment and would be a significant shift in stormwater treatment activities in the Lake Tahoe Basin. Current stormwater treatment activities in the Lake Tahoe Basin rely on passive treatment processes, and minimal routine maintenance is necessary to ensure a BMP operates to a performance standard. In the fields of potable water and wastewater treatment, centralization of treatment facilities is a common approach to reduce operating costs by concentrating resources to centrally manage the active treatment processes employed. A major assumption from this work is that the transfer of potable and wastewater treatment technologies to stormwater treatment would be most practical to implement as centralized stormwater treatment facilities serving relatively densely developed urban areas. Additional reasons for assuming centralized treatment is the most efficient strategy include:
• Increased costs associated with collection systems and potential force mains. The Phase 1 feasibility assessment identified a diminishing cost/benefit ratio for stormwater collection systems from less densely developed urban areas such as typical densities for Tahoe Basin single family land uses.

Chapter 3 – Recommended Treatment Process
Lake Tahoe Advanced Stormwater Treatment Feasibility Analysis (Phase II) – February 19, 2009 Page 3.35
• Correlation between density of development and pollutant loading. Water quality monitoring data for the TMDL (LRWQCB, 2007a.) identified primary roads, commercial areas, secondary roads, and multi-family residential land uses as the most significant sources for pollutants of concern on a unit area basis. As urban density increases the highest polluting land uses tend to dominate the drainage catchment. Therefore, applying advanced treatment to the densest urban drainages targets the highest loads on a unit area basis.
3.3.1 Centralized Treatment Facility Siting Based upon the above rationale, a GIS approach was developed to predict feasible locations for siting centralized advanced treatment facilities in the Placer County portion of the Lake Tahoe Basin. The following steps outline the approach.
Step 1 - Define Candidate Urban Drainages TMDL Subwatersheds defined to have concentrated impervious coverage in the TMDL Pollutant Reduction Opportunities Report (LRWQCB, 2007b) were intersected with TRPA Plan Area Statements. The assumption behind this intersection is that Plan Area Statements represent the boundary of urban areas in the Tahoe Basin. Therefore, the intersection produced candidate urban drainages with relatively dense development.
Step 2 – Tabulate Impervious Coverage in Candidate Urban Drainages The impervious cover layer developed by DRI (Minor and Cablk 2004) was used to tabulate impervious coverage for each urban drainage created in Step 1. The percentage of impervious coverage relative to the total urban area was calculated. Step 3 – Set Threshold by Ranking Impervious Coverage Percentage Urban drainages were ranked based on the percentage of impervious coverage calculated in Step 2. Thresholds were assigned to predict the feasibility of siting advanced treatment in urban drainages by segregating the ranked drainages into quartiles as follows:
o Candidate for advanced treatment – third quartile of the data set, or the group of urban drainages with the greatest percentage of impervious coverage. Urban drainages in the third quartile range from 47% to 31% impervious coverage.
o Potential candidate for advanced treatment - between the third and second quartile, or the group of urban drainages with the second greatest percentage of impervious coverage. Urban drainages between the third and second quartile range from 31% to 27% impervious coverage.
o Not a candidate for advanced treatment – below the second quartile, or less than 27% impervious coverage.

Chapter 3 – Recommended Treatment Process
Lake Tahoe Advanced Stormwater Treatment Feasibility Analysis (Phase II) – February 19, 2009 Page 3.36
Based on the GIS analysis, Figure 3.4 identifies three candidate locations (red) for advanced treatment in the Placer County portion of the Lake Tahoe Basin: Tahoe City, Kings Beach and Lake Forest. Figure 3.4 also identifies three potential candidate locations (yellow) for advanced treatment: Carnelian Bay, Homewood, and a portion of Tahoma. However, the potential candidate locations are relatively small urban drainages (all less than 20 impervious acres) where advanced treatment may not be cost effective to implement.
Figure 3.4. Potential Locations in Placer County for Siting Advanced Treatment
3.4 Recommended Implementation Process The research and analysis conducted for this report has identified advanced treatment using microfiltration as a potential option for achieving significant pollutant load reductions of fine

Chapter 3 – Recommended Treatment Process
Lake Tahoe Advanced Stormwater Treatment Feasibility Analysis (Phase II) – February 19, 2009 Page 3.37
sediment particles in stormwater runoff in the Lake Tahoe Basin. However, the advanced treatment technologies proposed represent a fundamental shift in stormwater treatment technology, and therefore a number of challenges need further study and real world testing. A pilot scale treatment facility is recommended as the next step to assess the ultimate feasibility of advanced stormwater treatment in Lake Tahoe. The conceptual facility layout can be used as a guide to design a pilot scale facility. The following sections describe key aspects of implementing a pilot scale facility.
3.4.1 Siting of a Pilot Scale Facility in Kings Beach Commercial Core Placer County, a member of the project coordination team (PCT) for this study, has indicated a willingness to explore implementation of a pilot scale advanced treatment facility in the Kings Beach Commercial Core. Presently, the Kings Beach Water Quality Improvement Project is at a 25% design level. The overall strategy for the water quality improvement project is to separate residential runoff from the Commercial Core runoff and treat the poorer quality Commercial Core runoff using media filtration (or an alternative passive treatment technology targeting fine sediment particles).
Siting of a pilot scale advanced treatment facility in the Kings Beach Commercial Core would replace one of the media filtration units currently considered in the 25% design with a microfiltration facility and would not alter improvements proposed in the tributary area. Based on discussions with Placer County (personal communication, Peter Kraatz, December 2, 2008), three locations where media filters are proposed as part of the water quality improvement project were identified as candidate locations for siting a pilot facility: 1) Secline Street and Brockway Vista Avenue; 2) North Tahoe Conference Center (NTCC) parking lot; and, 3) Coon Street and Highway 28. Table 3.2 below compares each location for siting a pilot facility.
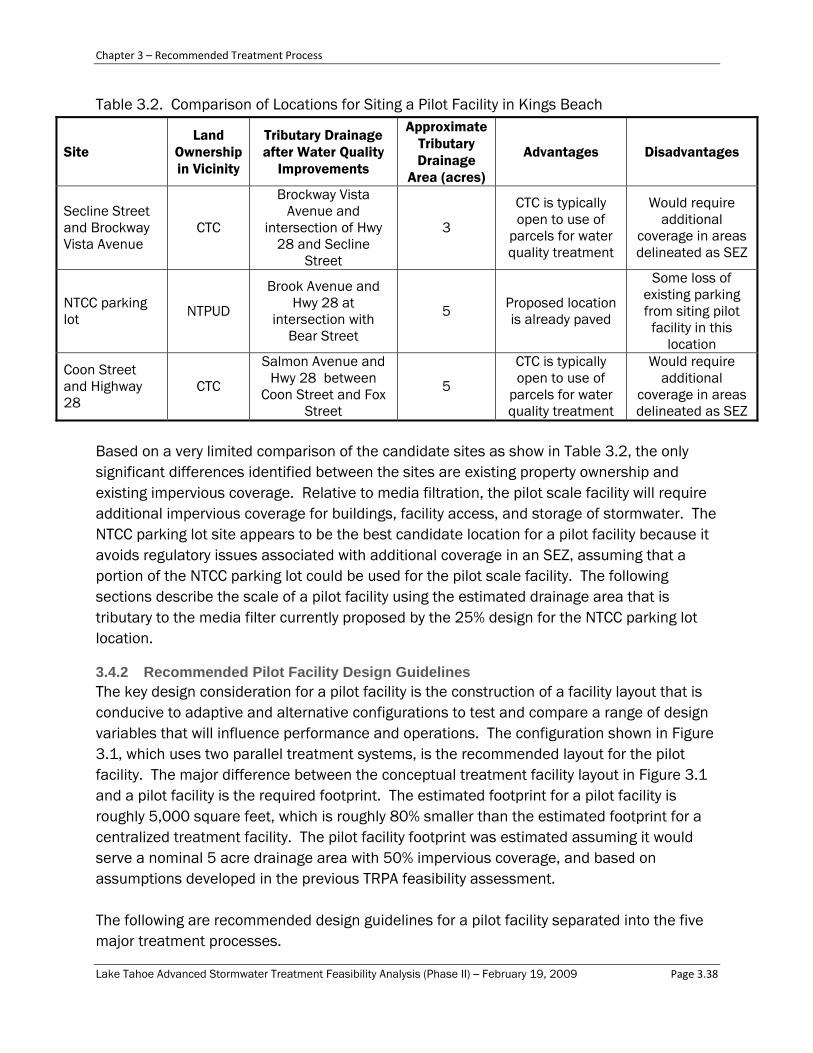
Chapter 3 – Recommended Treatment Process
Lake Tahoe Advanced Stormwater Treatment Feasibility Analysis (Phase II) – February 19, 2009 Page 3.38
Table 3.2. Comparison of Locations for Siting a Pilot Facility in Kings Beach
Site Land
Ownership in Vicinity
Tributary Drainage after Water Quality
Improvements
Approximate Tributary Drainage
Area (acres)
Advantages Disadvantages
Secline Street and Brockway Vista Avenue
CTC
Brockway Vista Avenue and
intersection of Hwy 28 and Secline
Street
3
CTC is typically open to use of
parcels for water quality treatment
Would require additional
coverage in areas delineated as SEZ
NTCC parking lot NTPUD
Brook Avenue and Hwy 28 at
intersection with Bear Street
5 Proposed location is already paved
Some loss of existing parking from siting pilot
facility in this location
Coon Street and Highway 28
CTC
Salmon Avenue and Hwy 28 between
Coon Street and Fox Street
5
CTC is typically open to use of
parcels for water quality treatment
Would require additional
coverage in areas delineated as SEZ
Based on a very limited comparison of the candidate sites as show in Table 3.2, the only significant differences identified between the sites are existing property ownership and existing impervious coverage. Relative to media filtration, the pilot scale facility will require additional impervious coverage for buildings, facility access, and storage of stormwater. The NTCC parking lot site appears to be the best candidate location for a pilot facility because it avoids regulatory issues associated with additional coverage in an SEZ, assuming that a portion of the NTCC parking lot could be used for the pilot scale facility. The following sections describe the scale of a pilot facility using the estimated drainage area that is tributary to the media filter currently proposed by the 25% design for the NTCC parking lot location.
3.4.2 Recommended Pilot Facility Design Guidelines The key design consideration for a pilot facility is the construction of a facility layout that is conducive to adaptive and alternative configurations to test and compare a range of design variables that will influence performance and operations. The configuration shown in Figure 3.1, which uses two parallel treatment systems, is the recommended layout for the pilot facility. The major difference between the conceptual treatment facility layout in Figure 3.1 and a pilot facility is the required footprint. The estimated footprint for a pilot facility is roughly 5,000 square feet, which is roughly 80% smaller than the estimated footprint for a centralized treatment facility. The pilot facility footprint was estimated assuming it would serve a nominal 5 acre drainage area with 50% impervious coverage, and based on assumptions developed in the previous TRPA feasibility assessment. The following are recommended design guidelines for a pilot facility separated into the five major treatment processes.

Chapter 3 – Recommended Treatment Process
Lake Tahoe Advanced Stormwater Treatment Feasibility Analysis (Phase II) – February 19, 2009 Page 3.39
Coarse Screening
• Test a proprietary device such as a CDS unit for trash and debris removal.
• Test alternative bypass strategies after coarse screening (e.g., peak bypasses, falling limb of the hydrograph bypass, etc.).
Detention Storage
• Detention of roughly 8,000 cubic feet, with the addition of the treatment flow rate, equates to storage of a 20-year 1-hour storm for 2.5 acres of impervious area.
• Assuming a detention of 8,000 cubic feet and a nominal depth of 5 feet for storage, two detention cells would be needed with dimensions of 10 feet wide by 80 feet long.
• Test the use of coagulation and flocculation in the detention storage to minimize fine sediment particles reaching the filtration process.
Fine Sediment Filters
• Test automatic self cleaning filters in parallel using varying filter sizes between ranging from 10 to 100 microns.
Microfiltration
• Test oxidant tolerant and non-oxidant tolerant brands of microfiltration units in parallel to compare differences in the magnitude of fouling issues between the membranes for filtering stormwater.
• Both microfiltration units should treat the same flow rate of 0.1 cfs.
• The oxidant tolerant microfiltration unit will need a connection to sanitary sewer. Dewatering Facility
• Test the use of coagulation and flocculation upstream of the proposed filter press to minimize fine sediment particles returned to the treatment process.
3.4.3 Research Questions a Pilot Scale Facility Should Address The following lists research questions a pilot scale facility should attempt to answer. Questions are organized into four sections: 1) Design Variables; 2) Operations and Maintenance Considerations; 3) Pollutant Load Performance, and 4) Cost.
1. Design Variables a. What is the most efficient filter size for automatic self-cleaning filters between
the detention storage and microfiltration processes (e.g., 10-micron, 20-micron, 50-micron, etc.)?
b. Would baffles placed in the detention storage increase suspended sediment capture while avoiding major hindrances to maintenance?

Chapter 3 – Recommended Treatment Process
Lake Tahoe Advanced Stormwater Treatment Feasibility Analysis (Phase II) – February 19, 2009 Page 3.40
c. Are there differences in fouling issues between types of microfilters for filtering stormwater? Specifically, are there performance differences between microfilters using 1) polypropylene material, which are not oxidant tolerant, and 2) Polyvinyledene Fluoride (PVDF) material, which is oxidant tolerant?
d. Can pumping from detention storage be optimized to minimize the amount of coarse sediment routed to the fine sediment filters to reduce the number of backwash cycles and maximize treatment rates?
e. What is the best configuration for bypassing storm flows exceeding the design capacity of the facility?
2. Operations and Maintenance Considerations a. How does variable influent quality impact the entire treatment process?
i. Do labor and maintenance requirements significantly increase with poor influent quality?
ii. Can variable influent quality be sufficiently controlled through the detention and sedimentation process to avoid adverse impacts to the filtration processes (e.g., excessive filter clogging or backwashing)?
b. What is the labor requirement for the facility on a monthly and annual basis? c. What are the key variables influencing maintenance frequency? d. Do labor requirements significantly increase during storm events relative to
other periods of operation? e. What is the replacement interval for the microfiltration units? f. What is the backwash interval for non oxidant tolerant membranes? g. What is the backwash interval for oxidant tolerant membranes? How often do
oxidant tolerant membranes need chemical backwashing? h. What is the typical volume of material that must be hauled from the facility
and disposed? i. What is the ratio of volume of water treated relative to the volume of water
routed to the dewatering facility and recycled through system?
3. Pollutant Load Performance a. What is the effluent quality produced from the facility for fine sediment
particles and other pollutants of concern? b. Does influent quality affect performance in regards to both effluent quality
and treatment rates? c. What is the estimated load reduction achieved by the facility for fine sediment
particles and other pollutants of concern? d. What is the volume of water that is disposed as backwash waste or is mixed
with solids that are disposed?
Chapter 3 – Recommended Treatment Process
Lake Tahoe Advanced Stormwater Treatment Feasibility Analysis (Phase II) – February 19, 2009 Page 3.41
4. Cost a. What is the annualized cost of the facility (labor, power, equipment, etc.)? b. What is the unit cost of treatment in terms of the volume of stormwater runoff
treated and the pollutant load reduction achieved? c. Does it appear cost effective to implement distributed advanced treatment
facilities? Note that the spatial scale of the pilot plant would be similar to the concept of the distributed treatment scenario described in the TRPA feasibility assessment.
d. How will annualized cost increase from a pilot plant implementation to a centralized treatment facility? Does it appear viable to implement centralized advanced treatment facilities?
Lake Tahoe Advanced Stormwater Treatment Feasibility Evaluation (Phase II) – December 2008 Page 2.1
Chapter 4 – Load Reduction Potential Analysis 2 Purpose This analysis addresses the potential effectiveness of proposed microfiltration techniques to meet the draft Lake Tahoe TMDL allocations for Placer County. The project team relied strictly on existing information from the Lake Tahoe TMDL analysis and associated reports to estimate the average annual fine sediment particle (FSP) loads from hypothetical water quality improvement scenarios implemented in Placer County. The project team generated a list of specific questions to further consider and compare the estimated water quality improvements of microfiltration relative to pollutant source control efforts (Treatment Tiers) with respect to the TMDL implementation. Each section below includes the question, the general methods and assumptions used to make the calculations, and a discussion of the calculation results relative to the question.
Question 1. What are the expected fine sediment particle (TSS <20 µm) mass load reductions for the 102 acre urban catchment (Kings Beach Commercial Core) for different water quality improvement scenarios? The following scenarios were tested to examine the relative FSP load reductions achieved with various implementation levels of source and treatment controls:
1. Catchment in baseline condition (2004) 2. Catchment with Tier 2 (2a) and Tier 1 (2b) source control practices. 3. Catchment in baseline condition with microfiltration treatment at catchment
outlet. 4. a. Catchment with 100% implementation of Tier 1 pollutant source controls,
no hydrologic source controls (HSC), and implementation of microfiltration at catchement outlet. b. Catchment with 100% implementation of Tier 2 pollutant source controls, no HSC implementation, and microfiltration treatment at catchment outlet.
Average annual fine sediment particle loads and runoff volumes for the Kings Beach Commercial Core were estimated by updating the Advanced Stormwater Treatment Phase 1 modeling effort using the EPA’s Storm Water Management Model version 5 (SWMM5). The details of the SWMM5 data and assumptions are presented as an appendix to Chapter 4. Each scenario was modeled to provide an estimated annual load from the 102 acre Kings Beach Commercial Core catchment (Table 4.1). The event mean concentrations (EMCs) for land uses assumed to have Tier 1 and Tier 2 pollutant source controls (PSCs) applied were taken from the Lake Tahoe TMDL Pollutant Load Reduction Opportunity Report (LRWQCB and NDEP 2008). For Tier 1, the assumptions include application of source controls to only a portion of the catchment. This reflects current practice, which generally prioritizes improvements according to the significance of pollutant sources and is strongly influenced
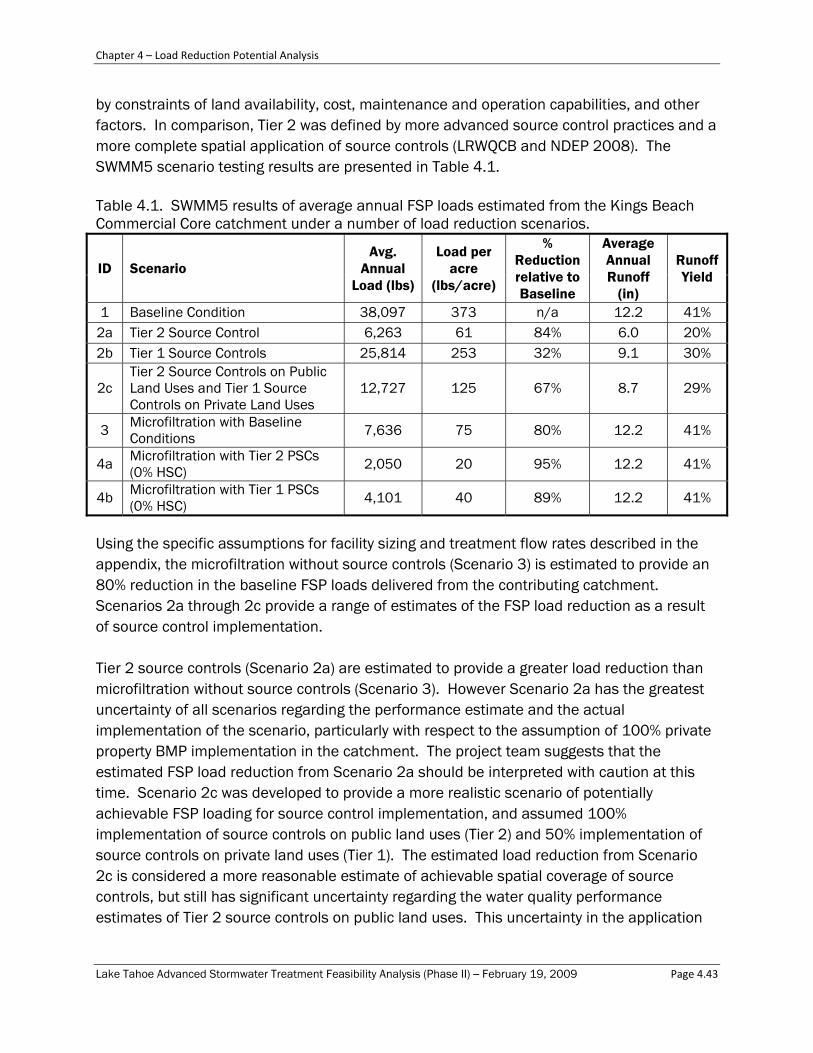
Chapter 4 – Load Reduction Potential Analysis
Lake Tahoe Advanced Stormwater Treatment Feasibility Analysis (Phase II) – February 19, 2009 Page 4.43
by constraints of land availability, cost, maintenance and operation capabilities, and other factors. In comparison, Tier 2 was defined by more advanced source control practices and a more complete spatial application of source controls (LRWQCB and NDEP 2008). The SWMM5 scenario testing results are presented in Table 4.1. Table 4.1. SWMM5 results of average annual FSP loads estimated from the Kings Beach Commercial Core catchment under a number of load reduction scenarios.
ID Scenario Avg.
Annual Load (lbs)
Load per acre
(lbs/acre)
% Reduction relative to Baseline
Average Annual Runoff
(in)
Runoff Yield
1 Baseline Condition 38,097 373 n/a 12.2 41% 2a Tier 2 Source Control 6,263 61 84% 6.0 20% 2b Tier 1 Source Controls 25,814 253 32% 9.1 30%
2c Tier 2 Source Controls on Public Land Uses and Tier 1 Source Controls on Private Land Uses
12,727 125 67% 8.7 29%
3 Microfiltration with Baseline Conditions 7,636 75 80% 12.2 41%
4a Microfiltration with Tier 2 PSCs (0% HSC)
2,050 20 95% 12.2 41%
4b Microfiltration with Tier 1 PSCs (0% HSC)
4,101 40 89% 12.2 41%
Using the specific assumptions for facility sizing and treatment flow rates described in the appendix, the microfiltration without source controls (Scenario 3) is estimated to provide an 80% reduction in the baseline FSP loads delivered from the contributing catchment. Scenarios 2a through 2c provide a range of estimates of the FSP load reduction as a result of source control implementation. Tier 2 source controls (Scenario 2a) are estimated to provide a greater load reduction than microfiltration without source controls (Scenario 3). However Scenario 2a has the greatest uncertainty of all scenarios regarding the performance estimate and the actual implementation of the scenario, particularly with respect to the assumption of 100% private property BMP implementation in the catchment. The project team suggests that the estimated FSP load reduction from Scenario 2a should be interpreted with caution at this time. Scenario 2c was developed to provide a more realistic scenario of potentially achievable FSP loading for source control implementation, and assumed 100% implementation of source controls on public land uses (Tier 2) and 50% implementation of source controls on private land uses (Tier 1). The estimated load reduction from Scenario 2c is considered a more reasonable estimate of achievable spatial coverage of source controls, but still has significant uncertainty regarding the water quality performance estimates of Tier 2 source controls on public land uses. This uncertainty in the application
Chapter 4 – Load Reduction Potential Analysis
Lake Tahoe Advanced Stormwater Treatment Feasibility Analysis (Phase II) – February 19, 2009 Page 4.44
of source control also includes significant unknowns regarding variable levels of ongoing maintenance to maintain source control effectiveness. As expected, the coupling of pollutant source control within the catchment with microfiltration at the outlet will increase the FSP load reductions for the subject urban areas (Scenarios 4a and 4b, Table 4.1). In addition, the improvement in the influent water quality to the microfiltration plant will increase the advanced treatment performance and likely reduce plant maintenance frequencies and associated costs. As Table 4.1 indicates, the performance of source control is strongly influenced by the anticipated stormwater volume reductions as a result of significant hydrologic source controls and associated infiltration. This preliminary comparative analysis between source control and microfiltration suggest that both the hydrologic source control and pollutant source control estimates must perform at the levels the Tier 1 and Tier 2 estimates suggest. However, there is a greater confidence that microfiltration can provide the FSP load reduction estimates per unit area that can be treated. Thus, there is much higher confidence in the performance capability of microfiltration relative to the load reduction estimates generated using the Tier 1 and Tier 2 values and assumptions when compared on a per unit area basis as presented in Table 4.1. Question 2. Given existing information, what urban catchments in Placer County can feasibly be treated by microfiltration and what is the expected load reduction for the jurisdiction if these urban catchments were serviced by microfiltration? As presented in Chapter 3, simple assumptions were used to provide a preliminary estimate of the likely candidate urban catchments that may be feasible locations to site centralized advanced treatment facilities in Placer County (see Figure 3.7). The preliminary feasibility analysis identified 3 distinct urban catchments within Placer County (Kings Beach, Tahoe City and Lake Forest), due to the high amount of impervious area within these 3 densely developed urban catchments. The remaining Placer County urban area is not deemed feasible given the preliminary evaluation criteria outlined in Chapter 3. Additional catchments may be deemed appropriate in the future once implementation issues identified in Chapter 3 are resolved with pilot testing of advanced treatment under local conditions. A land use breakdown for the three candidate catchments for advanced treatment and for the entire urban area in Placer County is provided in Table 4.2. The 2006 TRPA Threshold Evaluation identifies the urban boundary of the Tahoe Basin as all areas with Residential, Tourist, and Commercial/Public Service Plan Area Statements (PAS). A GIS analysis was conducted and defined the urban area of Placer County as Plan Area Statements classified as Residential, Tourist, and Commercial/Public Service.

Chapter 4 – Load Reduction Potential Analysis
Lake Tahoe Advanced Stormwater Treatment Feasibility Analysis (Phase II) – February 19, 2009 Page 4.45
Table 4.2. Land use breakdown for the three urban catchment candidate locations.
Land Use Kings Beach
Tahoe City Lake Forest
SUM
Candidate Locations
SUM Placer County
Urban AreasImpervious Area
(acres) 49 39 45 133 1,408
Pervious area (acres) 53 55 38
146 5,074
Total (acres) 102 94 83 279 6,482
Impervious Area (%) 48.0% 41.8% 54.0% 47.7% 21.7% Pervious Area (%) 52.0% 58.2% 46.0% 52.3% 78.3%
SFR (%) 16.1% 3.8% 11.6% 10.6% 38.7% MFR (%) 16.7% 11.1% 33.3% 19.7% 11.8% CICU (%) 24.7% 35.7% 24.8% 28.5% 7.4% Veg. (%) 19.0% 28.0% 18.8% 22.0% 31.8%
Primary Road (%) 8.2% 6.1% 0.2% 5.1% 1.7% Secondary Road (%) 15.0% 14.8% 11.3% 13.8% 8.7%
The preliminary estimate of the total area that can be feasibly treated by microfiltration is 279 acres, or 4.3% of the 6,482 urban acres in Placer County (Table 4.2). The FSP loading for each pollutant control scenario in each of the candidate catchments were estimated by extrapolating the unit area estimate for Kings Beach load reductions from the SWMM5 model runs (373 lbs/acre). This extrapolation assumes the same volumetric capture ratio, baseline condition loading (lbs/acre), and treatment potential estimated for each of the Kings Beach scenario simulations (Table 4.1). Table 4.3 includes the fine sediment particle loading estimated from each candidate catchment as well as cumulative load under each scenario. The analysis suggests that the implementation of microfiltration at the outlet of these three candidate urban areas would also reduce average annual FSP loads by 80% relative to baseline conditions resulting in an estimated total FSP load from the candidate catchments of 9 MT/yr. If the Tier 2 PSCs are implemented as a catchment pre-treatment strategy for the microfiltration the estimated load reduction approaches 95%. These anticipated % load reductions relative to baseline conditions are identical to the estimates provided in Table 4.1 for these scenarios, because performance estimates are scaled on a per area basis based on the scenario results calculated for the Kings Beach Commercial Core (Table 4.1).

Chapter 4 – Load Reduction Potential Analysis
Lake Tahoe Advanced Stormwater Treatment Feasibility Analysis (Phase II) – February 19, 2009 Page 4.46
Table 4.3 Comparison of the estimated average annual FSP Loading for each, as well as the cumulative, candidate advanced treatment catchments in Placer County (see Figure 3.7).
ID Scenario Kings Beach (lbs/yr)
Tahoe City
(lbs/yr)
Lake Forest (lbs/yr)
Sum of candidate
catchments (lbs/yr)
Sum of candidate
catchments (MT/yr)
% reduction
from Baseline
1 Baseline Condition 38,097 35,201 30,744 104,041 47
2a Tier 2 Source Control (100% PSC & 100% HSC) 6,263 5,787 5,054 17,104 8 84%
2b Tier 1 Source Controls 25,814 23,852 20,832 70,499 32 32%
2c Tier 2 Source Control (100% Public 50% Private) 12,727 11,760 10,271 34,757 16 67%
3 Microfiltration with Baseline Conditions 7,636 7,056 6,163 20,855 9 80%
4a Microfiltration with Tier 2 PSCs (0% HSC) 2,050 1,894 1,654 5,597 3 95%
4b Microfiltration with Tier 1 PSCs (0% HSC) 4,101 3,790 3,310 11,201 5 89%
Question 3. Can water quality improvements in the Kings Beach Commercial Core treat more than a proportionate share of Placer County’s allocated load for fine sediment particle reductions on a unit area basis? How close can microfiltration alone get toward the total Placer County TMDL load reduction requirements assuming implementation in all candidate urban catchments? Questions 3 requires a comparison of the estimates of the FSP loads and associated load reductions from microfiltration in feasible locations to the anticipated TMDL FSP load allocations for Placer County. Preliminary estimates suggest that microfiltration treatment of the 279 acres of dense urban areas in Placer county can result in a total FSP load reduction of the Baseline load of 47 MT by 38 MT with a resultant load of 9 MT (Tables 4.2 and 4.3). This analysis supports the assumption that microfiltration, where feasible, is likely to provide consistent and reliable fine sediment particle load reductions. The limitation however, is the practicality of siting microfiltration facilities to cost effectively treat a large portion of runoff from urban areas. Preliminary estimates suggest that only 4% of the total Placer County urban area may be practical for advanced stormwater treatment in the Lake Tahoe basin. The draft TMDL pollutant allocations for Placer County were provided by LRWQCB (R. Larson) and summarized in Table 4.4. These allocations are not final and are subject to change. The draft TMDL baseline condition FSP loads for Placer County are 5.69 x 10¹⁹ particles/yr or approximately 542 MT/yr1. These baseline condition loads were generated by the Lake Tahoe TMDL Watershed Model. According to the SWMM5 FSP loading estimates, the 279 acres of the densest urban areas within Placer County contribute an estimated 47 MT/yr to
1 FSP allocations provided by Lahontan in particles/yr. The jurisdictions will be regulated by particles per year by the RWQCB. For the purposes of this analysis, allocations were converted to metric tons per year of fine sediment (MT/yr) using “particle converter.xls” created and provided by UC Davis. See Chapter 4 Appendix for details of the conversion.

Chapter 4 – Load Reduction Potential Analysis
Lake Tahoe Advanced Stormwater Treatment Feasibility Analysis (Phase II) – February 19, 2009 Page 4.47
the baseline condition loads (Table 4.3). Using the SWMM5 baseline condition estimates of FSP loading, the densely developed urban areas in Placer County (i.e. candidate catchments) have an estimated FSP loading of 0.17 MT/acre/yr. The TMDL Watershed Model estimates that urban land in Placer County (6,482 acres) has a baseline FSP load of 542 MT/yr, or an average annual FSP load of 0.08 MT/acre/yr (Table 4.4). Although these two unit area FSP loading estimates are derived from different models, the underlying assumptions are similar and the results are consistent with the reasoning that FSP loading per acre is higher for the more densely developed urban lands. If microfiltration alone was implemented in the candidate catchments, the resulting FSP load from Placer County is estimated to be reduced by 38 MT/yr to 504 MT/yr. This level of load reduction would fall short of the first TMDL milestone of a 10% FSP load reduction for all urban jurisdictions (Table 4.4). The potential load reduction by microfiltration alone falls well short of the future Clarity Challenge; 32% reduction of FSP loads. Based on the preliminary analysis, the existing loads from these catchments do not appear to constitute a large enough fraction of the total Placer County FSP load (<10%) to meet TMDL goals. The preliminary FSP load reduction estimates strongly suggest that advanced treatment using micro-filtration is just one of many necessary pollutant load reduction tools to be considered in meeting Lake Tahoe TMDL goals. Table 4.4. Draft TMDL fine sediment particle allocations (Lahontan RWQCB, January 2009) for Placer County, CA.
TMDL Metric TMDL Allocation Microfiltration
Micro Filtration w/Source Controls
Baseline Load Particle load1 (MT/yr) 542 542 542
First Milestone
Allowable particle load
(MT/yr) 488 542-38=504 542-45=497
% reduction from baseline 10% 7% 8%
Clarity Challenge
Allowable particle load
(MT/yr) 369 504 497
% reduction from baseline 32% 7% 8%

Lake Tahoe Advanced Stormwater Treatment Feasibility Evaluation (Phase II) – December 2008 Page 2.1
Chapter 4 – Appendix Assumptions and Methods for SWMM5 Model Calculations Conceptual Treatment Train Approach Task
Calculate the expected fine sediment particle (FSP; TSS <20 µm) mass (lbs) loads for the 102 acre study area (Kings Beach Commercial Core) under different hypothetical scenarios. FSP catchment loads are estimated for Baseline Conditions as assumed during 2004 and three levels of pollutant load reduction strategies: 1) Source control implementation as defined by the TMDL Pollutant Reduction Opportunities Report for Tier 1 and Tier 2 (LRWQCB and NDEP 2008); 2) Microfiltration treatment with the contributing catchment in Baseline Conditions; and, 3) combined microfiltration treatment with the application of TMDL Tier 1 and Tier 2 pollutant source controls. The results of the pollutant load estimates are presented and discussed in Chapter 4. The results of the FSP pollutant loading from Kings Beach urban area are combined with additional available data and extrapolated to provide loading estimates for other candidate catchments in Placer County for microfiltration treatment under the selected scenarios (Chapter 4).
General Assumptions and Methods
1. Fine sediment particle loads were calculated for the 102 acre Kings Beach Commercial Core by updating the Advanced Stormwater Treatment Phase 1 SWMM modeling effort – see Technical Memorandum #4 for a list of assumptions and methods from that effort, available for download at http://www.tiims.org/Basin-Topics/Water-Quality/Stormwater-Management/Pump-and-Treat-Feasibility-Study.aspx For example:
a. Physiographic characteristics of the Kings Beach Commercial Core were tabulated in Phase 1 (slope of catchments, land uses, impervious area, etc.).
b. The catchments delineated for the Phase 1 SWMM5 model were used to model all scenarios for this effort. Actual drainage configurations differ from the modeled catchments for the Baseline and Tier 2 Source Control Scenarios. However, this should not affect the total load estimates because the Baseline Condition Scenario does not include BMPs and the Tier 2 Source Control Scenario only includes distributed BMPs that are not affected in the model by catchment size or configuration (i.e. pollutant source controls and hydrologic source controls).
2. The SWMM5 models developed are consistent with the approaches proposed and used in the ongoing Pollutant Load Reduction Model (PLRM) development.
3. The time period for simulations was Water Year 1989 through Water Year 2006. Meteorological data input was hourly for precipitation and temperature.

Chapter 4 Appendix – Assumptions and Methods for SWMM5 Model Calculations
Lake Tahoe Advanced Stormwater Treatment Feasibility Analysis (Phase II) – February 19, 2009 Page 4A.49
4. Meteorological data (precipitation and temperature) was extrapolated from Tahoe City SnoTel data to Kings Beach using PLRM algorithms.
a. Total precipitation depth over the 18 year simulation was 543 inches. b. Average annual precipitation depth was 30.1 inches.
5. TMDL data from the Lake Tahoe TMDL Technical Report (LRWQCB and NDEP 2007) and the Lake Tahoe TMDL Pollutant Reduction Opportunities Report (LRWQCB 2008) was used to estimate typical concentrations of fine sediment particles generated from each land use modeled under the varying scenarios: 1) Baseline Condition; 2) TMDL Source Control Implementation under Tier 1 and Tier 2; 3) Microfiltration with Baseline Conditions; and microfiltration with pollutant source control implementation under Tier 1 and Tier 2. Table A.1 displays the concentrations used for each scenario and land use.
a. The percent fine sediment particles by land use were taken from Table 4-24 of the TMDL Technical Report. Land uses with a fine sediment particle relationship to TSS included: Primary Roads, Secondary Roads, SFR, MFR, and CICU.
b. Baseline concentrations of TSS (used to produce a concentration of fine sediment particles) are from the TMDL Technical Report. Tier 1 and Tier 2 concentrations of TSS are from the TMDL Pollutant Reduction Opportunities Report.

Chapter 4 Appendix – Assumptions and Methods for SWMM5 Model Calculations
Lake Tahoe Advanced Stormwater Treatment Feasibility Analysis (Phase II) – February 19, 2009 Page 4A.50
Table A.1. Concentrations of Fine Sediment Particles Used by Land Use and Scenario
Land use Category TSS (mg/L) Fine sediment
particles (% TSS) Fine Sed Particles
(mg/L) Baseline Condition
Single Family Residential
56 36% 20
Multi-Family Residential 150 58% 87 CICU 296 63% 187
Vegetated_EP3 101 20% 20 Roads_Primary 952 63% 601
Roads_Secondary 150 63% 95 Tier 1 Pollutant Source Controls
Single Family Residential
38 36% 14
Multi-Family Residential 56.4 58% 33 CICU 204 63% 129
Vegetated_EP2 38 20% 8 Roads_Primary 538 63% 339
Roads_Secondary 100 63% 63 Tier 2 Pollutant Source Controls
Single Family Residential 38 36% 14
Multi-Family Residential 56.4 58% 33 CICU 112 63% 71
Vegetated_EP1 14 20% 3 Roads_Primary 124 63% 78
Roads_Secondary 50 63% 32 Scenario 1: Baseline Conditions (2004)
1. The “Source Area Map” for the Kings Beach Watershed Improvement Project (Entrix, 1/30/2006) identified a negligible amount of private property BMP implementation in the Commercial Core area. Therefore, no private property BMP implementation is assumed in the Baseline Condition.
2. The “Source Area Map” also identified minimal storm water treatment BMPs in the Commercial Core area. Therefore, no storm water treatment BMPs are assumed in the Baseline Condition.
3. Fine sediment particles concentrations are for the Baseline Condition (Table A.1). Scenario 2a: Tier 2 TMDL Source Control Implementation
1. Scenario 2a was modeled using TMDL Tier 2 assumptions from the Pollutant Reduction Opportunities Report (LRWQB and NDEP, 2008):
a. Tier 2 assumes 100% parcel (i.e. private property) BMP implementation for both pollutant source controls and hydrologic source controls
i. Fine sediment particles concentrations are for Tier 2 (Table A.1).

Chapter 4 Appendix – Assumptions and Methods for SWMM5 Model Calculations
Lake Tahoe Advanced Stormwater Treatment Feasibility Analysis (Phase II) – February 19, 2009 Page 4A.51
ii. Hydrologic source controls assumptions are taken for HSC-3, described in Chapter 3 of the Pollutant Reduction Opportunities report and include:
1. Detention 1-inch of runoff from impervious surfaces 2. Infiltration in BMPs average a hydraulic conductivity of 0.3
inches/hour over the length of the simulation. b. Tier 2 assumes 100% public (i.e. roads) BMP implementation of pollutant
source controls c. Tier 2 assumes for moderately slope catchments with concentrated
impervious coverage (e.g., Kings Beach Commercial Core, that 20% of the roads would receive hydrologic source controls. Specific modeling assumptions are taken for HSC-1, described in Chapter 3 of the Pollutant Reduction Opportunities report and include:
i. Routing = 0.1 acre of pervious land receives and infiltrates runoff from 1 acre of impervious area
ii. Hydraulic Conductivity = 0.3 inch/hr
Scenario 2b: Tier 1 TMDL Source Control Implementation 1. Scenario 2b was modeled using TMDL Tier1 assumptions from the Pollutant
Reduction Opportunities Report (LRWQB and NDEP, 2008): a. Tier 1 assumes 50% parcel (i.e. private property) BMP implementation for
both pollutant source controls and hydrologic source controls i. Fine sediment particles concentrations are for Tier 2 (Table A.1). ii. Hydrologic source controls assumptions are taken for HSC-3, described
in Chapter 3 of the Pollutant Reduction Opportunities report and include:
1. Detention 1-inch of runoff from impervious surfaces 2. Infiltration in BMPs average a hydraulic conductivity of 0.3
inches/hour over the length of the simulation. b. Tier 1 assumes 50% public (i.e. roads) BMP implementation of pollutant
source controls c. Tier 2 assumes for moderately slope catchments with concentrated
impervious coverage (e.g., Kings Beach Commercial Core, that 10% of the roads would receive hydrologic source controls. Specific modeling assumptions are taken for HSC-1, described in Chapter 3 of the Pollutant Reduction Opportunities report and include:
i. Routing = 0.1 acre of pervious land receives and infiltrates runoff from 1 acre of impervious area
ii. Hydraulic Conductivity = 0.3 inch/hr

Chapter 4 Appendix – Assumptions and Methods for SWMM5 Model Calculations
Lake Tahoe Advanced Stormwater Treatment Feasibility Analysis (Phase II) – February 19, 2009 Page 4A.52
Scenario 2c: Tier 2 Source Controls on Public Land Uses and Tier 1 Source Controls on Private Land Uses
1. Scenario 2c is a blend of Scenarios 2a and 2b. 2. Tier 2 source controls are applied to public land uses (i.e. urban roads). 3. Tier 1 source controls area applied to private land uses (i.e. single family residential,
multi-family residential, and CICU). Tier 1 assumes 50% private property BMP implementation.
Scenario 3: Microfiltration with Baseline Conditions
1. Assumptions and methods used to generate runoff and loading from simulated catchments is identical to Scenario 1.
2. Assumptions for detention storage, pumping, and treatment flow rates were taken from the Phase 1 modeling effort. For example:
a. Centralized detention storage of 80,000 cubic feet b. Microfiltration treatment flow rate of 0.8 cfs c. Average achievable effluent quality of 5 mg/L assumed for fine sediment
particles from microfiltration treatment. Scenario 4a: Microfiltration with Tier 2 TMDL Pollutant Source Controls
1. Assumptions and methods used for Pollutant Source Controls are identical to Scenario 2a.
2. No Hydrologic Source Control implementation is assumed. All runoff is routed to the microfiltration treatment facility.
3. Assumptions for detention storage, pumping, and treatment flow rates are identical to Scenario 3a
4. Average achievable effluent quality of 1 mg/L assumed for fine sediment particles from microfiltration treatment. Relative to Scenario 3a, this scenario assumes lower inflowing TSS and fine sediment concentration to the microfiltration facility as a result of either TMDL Tier 2 pollutant source controls. As documented in previous chapters of this report, better incoming water quality allows for more efficient operation of microfiltration units, which produces better effluent quality.
Scenario 4b: Microfiltration with Tier 1 TMDL Pollutant Source Controls
1. Assumptions and methods used for Pollutant Source Controls are identical to Scenarios 2b.
2. No Hydrologic Source Control implementation is assumed. All runoff is routed to the microfiltration treatment facility.
3. Assumptions for detention storage, pumping, and treatment flow rates are identical to Scenario 3a.
5. Average achievable effluent quality of 1 mg/L assumed for fine sediment particles from microfiltration treatment. Relative to Scenario 3a, this scenario assumes lower

Chapter 4 Appendix – Assumptions and Methods for SWMM5 Model Calculations
Lake Tahoe Advanced Stormwater Treatment Feasibility Analysis (Phase II) – February 19, 2009 Page 4A.53
inflowing TSS and fine sediment concentration to the microfiltration facility as a result of either TMDL Tier 1 pollutant source controls. As documented in previous chapters of this report, better incoming water quality allows for more efficient operation of microfiltration units, which produces better effluent quality.
TMDL Placer County allocation estimates – method of FSP unit conversion The draft TMDL fine sediment particle allocations were provided by the Lahontan RWQCB (January 2009) for Placer County, CA. FSP allocations were provided by Lahontan in particles/yr. For the purposes of this analysis, allocations were converted to metric tons per year of fine sediment (<20µm) using “particle converter.xls” created and provided by UC Davis. The converter estimates the Baseline Condition Load from Placer County of 5.69 x 10¹⁹ of fine sediment particles to equate to 760 MT/yr. The “particle converter.xls” converts MT of sediment <63µm to # of particles, and documents an assumed 28.7% contribution of the sediment mass to be from the 22µm to 63µm range for urban lands. In order to provide more consistency on the conversion of particles to mass <20µm, the mass output from the converter was reduced by 28.7%, providing a baseline load from Placer County CA of 542 MT/yr. The mass estimates for each milestone are estimated from the target % load reduction from baseline as provided by Lahontan in the Draft TMDL allocation tables. Uncertainty in Performance Estimates of Modeled Scenarios A number of uncertainties exist in the assumptions used to develop quantitative estimates of load reduction performance for each modeled scenario. Examples of uncertainties include, but not limited to:
• Performance estimates of Tier 2 pollutant source control performance for runoff quality.
• Implementation constraints associated with 100% private property BMP implementation (assumed in Scenario 2a).
• Implementation constraints associated with constructing and operating advanced storm water treatment facilities at performance estimates.
Similar to how uncertainty is addressed in the TMDL PRO Report (Lahontan and NDEP, 2008), Table A.2 provides a rating of confidence for each scenario expressed as a value between 1 and 5, where lower numbers indicate less confidence. Ratings of 1 and 2 are considered too low to be suitable for management decisions, and future values are likely to change significantly. Ratings of 3, 4, and 5 are sufficiently high that management decisions are possible, and future values are not expected to change significantly. A brief discussion regarding the rationale for the confidence rankings for each scenario is also provided in the table.

Chapter 4 Appendix – Assumptions and Methods for SWMM5 Model Calculations
Lake Tahoe Advanced Stormwater Treatment Feasibility Analysis (Phase II) – February 19, 2009 Page 4A.54
Table A.2. Relative Confidence Rating of Each Scenario
ID Scenario Confidence Ranking
Rationale
1 Baseline Condition 4 Assumptions based on previous TMDL assumptions and monitoring data.
2a Tier 2 Source Control (100% PSC & 100% HSC)
2 Performance estimates to Tier 2 pollutant source controls
and 100% private property BMP implementation are questionable.
2b Tier 1 Source Controls 3 Performance estimates to Tier 1 are considered
achievable.
2c Tier 2 Source Control (100% Public 50% Private)
3 Relative to Scenario 2a, this scenario is viewed as a more
realistic implementation scenario.
3 Microfiltration with Baseline Conditions
4 Project team has relatively high confidence in the ability of microfiltration to significantly reduce FSP concentrations
for storm water reaching the facility.
4a Microfiltration with Tier 2 PSCs (0% HSC) 3
Performance estimate is likely high, but would not be lower than estimate of Scenario 3, so range of uncertainty
is relatively narrow.
4b Microfiltration with Tier 1 PSCs (0% HSC)
4 Performance estimates to Tier 1 are considered
achievable.

Lake Tahoe Advanced Stormwater Treatment Feasibility Evaluation (Phase II) – December 2008
THIS PAGE INTENTIONALLY LEFT BLANK

References
Lake Tahoe Advanced Stormwater Treatment Feasibility Analysis (Phase II) – February 19, 2009 Page R.55
References
2NDNATURE. 2006. Lake Tahoe BMP Monitoring Evaluation Process, Synthesis of existing research. Prepared for U.S. Forest Service, Lake Tahoe Basin Management Unit, South Lake Tahoe, CA.
Barrett, M.E. (2003) "Performance, cost, and maintenance requirements of Austin sand filters." J. of Water Resources Planning and Management, 129(3): 234-242.
Curtis, Jeff, J. Johnston, D. Patel, and M. Keisler. (2008) Presentation titled “Stormwater Treatment with Aluminum-Based Coagulants: Promises and Problems, California Stormwater Quality Association (CASQA) 2008 Annual Conference, September 22-24, Oakland, CA.
Fan, L., T. Nguyen, F.A. Roddick, and J.L. Harris. (2008) “Low-pressure membrane filtration of secondary effluent in water reuse: Pretreatment for fouling reduction.” J. of Membrane Science, 320: 135-142.
Farahbakhsh, K. and D.W. Smith. (2002) “Performance comparison and pretreatment evaluation of three water treatment membrane pilot plants treating low turbidity water.” J. of Environ. Eng. Sci., 1: 113-122.
Huang, H., R. Spinette, and C.R. O’Melia. (2008) “Direct-flow microfiltration of aquasols. Impacts of particle stabilities and size.” J. of Membrane Science, 314: 90-100.
Lahontan Regional Water Quality Control Board (LRWQCB) and Nevada Department of Environmental Protection (NDEP). DRAFT Lake Tahoe Total Maximum Daily Load Technical Report California and Nevada. September 2007. Document available for download at: http://www.waterboards.ca.gov/rwqcb6/water_issues/programs/tmdl/lake_tahoe/docs/presentations/laketahoe_tmdl_techrpt.pdf
Lahontan Regional Water Quality Control Board (LRWQCB) and Nevada Department of Environmental Protection (NDEP). Lake Tahoe TMDL Pollutant Load Reductions Opportunity Report. March 2008 v.2.0. Document available for download at: http://www.waterboards.ca.gov/rwqcb6/water_issues/programs/tmdl/lake_tahoe/docs/presentations/pro_report_v2.pdf Lake Tahoe TMDL Monitoring Data, Water Years 2003 and 2004. Transmitted by Desert Research Institute. June 2008.
Lake Tahoe TMDL Monitoring Data, Water Years 2003 and 2004. Transmitted by Desert Research Institute. June 2008.
LRWQCB. (2007a) Lake Tahoe TMDL Technical Report. Lahontan Regional Water Quality Control Board. South Lake Tahoe, CA.

References
Lake Tahoe Advanced Stormwater Treatment Feasibility Analysis (Phase II) – February 19, 2009 Page R.56
LRWQCB. (2007a) Lake Tahoe TMDL Technical Report. Lahontan Regional Water Quality Control Board. South Lake Tahoe, CA.
LRWQCB. (2007b) Lake Tahoe TMDL Pollutant Reduction Opportunity Report. Lahontan Regional Water Quality Control Board. South Lake Tahoe, CA.
LRWQCB. (2007b) Lake Tahoe TMDL Pollutant Reduction Opportunity Report. Lahontan Regional Water Quality Control Board. South Lake Tahoe, CA.
Metcalf and Eddy. (1972). Wastewater Engineering – Collection, Treatment, and Disposal. McGraw-Hill Book Company.
Minor, T. and M. Cablk. 2004. Estimation of Hard Impervious Cover in the Lake Tahoe Basin Using Remote Sensing and Geographic Information Systems. Desert Research Institute: Reno, NV.
nhc and Geosyntec Consultants. (2006) Methodology to Estimate Pollutant Load Reductions. Final Report. Prepared for US Army Corps of Engineers and Lahontan Regional Water Quality Control Board. South Lake Tahoe, CA.
Patterson, S., A. Heyvaert, and C. Strasenburgh. (2007) Cultured periphyton in a subalpine environment: Results of a Tahoe Basin pilot system for water quality improvement. ESA/SER Joint Meeting. PS 71-211. August, 2007.
PRISM. (2008) Parameter-elevation Regression on Independent Slopes (PRISM) website. www.prism.oregonstate.edu, Accessed February 2008.
Reardon, R.D., S.V. Paranjape, X.J. Fossereau, F.A. DiGiano, M.D. Aitken, J.H. Kim, S.Y. Chang, and R. Cramer. (2005) “Membrane Treatment of Secondary Effluent for Subsequent Use.” Final Report to the Water Environment Research Foundation, WERF 01-CTS-6.
SMURFF. (2007) Santa Monica Urban Runoff Recycling Facility. PowerPoint presentation by Jamie Malpede (City of Santa Monica) to the Lake Tahoe Interagency Monitoring Program in September 2007. Presentation available for download at: http://www.tahoescience.org/current_science_activities/LTIMP/LTIMP.aspx
Strecker, Eric, W. Huber, J. Heaney, D. Bodine, J. Sansalone, M. Quigley, M. Leisenring, D.
Pankani, and A. Thayumanavan. (2005) Critical Assessment of Stormwater Treatment and Control Selection Issues, Water Environment Research Federation Report 02-SW-1.
Taylor, K., R. Susfalk, M. Shanafield, and G.Schladow. (2004) Near-shore Clarity of Lake Tahoe: Status and Causes of Reduction. Desert Research Institute and the University of California, Davis. Lake Tahoe, CA

References
Lake Tahoe Advanced Stormwater Treatment Feasibility Analysis (Phase II) – February 19, 2009 Page R.57
Taylor, Kendrick. (2002) Investigation of Near Shore Turbidity at Lake Tahoe. Desert Research Institute. Prepared for the Lahontan RWQCB and The Nevada Department of State Lands. South Lake Tahoe, CA.
Tchobanoglous, G., Schroeder, E. (1985) Water Quality – Characteristics, Modeling, and Modification. Addison Wesley Longman Publishing Company, Inc.
UC Davis. 2007. “particle converter.xls” Spreadsheet excel tool to convert mass of particles <63um by source category group into # of particles. Urban Uplands/Groundwater Source Category Group (UGSCG). Lake Tahoe TMDL Phase 2 UGSCG. August 2007. Urbonas, B.R. (1999) "Design of a sand filter for stormwater quality enhancement." Water Environment Research. 71(1): 102-103.
US EPA. (2005) Membrane Filtration Guidance Manual, US EPA Office of Water, EPA 8125-R-06-009.
Washoe County Department of Water Resources. 12 December 2008. Longley Lane Water Treatment Plant. https://www.washoecounty.us/repository/images/10/longley_lane_small.jpg