Embed Size (px)
Citation preview
AAnnaalleellee UUnniivveerrssiittăăţţiiii ddiinn OOrraaddeeaa,, SSeerriiaa GGeeooggrraaffiiee Year XXXXVVIIII, no. 11//22001177 (June), pp. 988--110077 ISSN 11222211--11227733, E-ISSN 22006655--33440099 Article no. 227711111100--772244
http://istgeorelint.uoradea.ro/Reviste/Anale/anale.htm
LLAANNDD UUSSEE DDYYNNAAMMIICCSS AANNDD SSUURRFFAACCEE WWAATTEERR QQUUAALLIITTYY IINN AA TTYYPPIICCAALL UURRBBAANN CCEENNTTRREE OOFF SSOOUUTTHH--WWEESSTTEERRNN,, NNIIGGEERRIIAA
OOlluuttooyyiinn AAddeeoollaa FFAASSHHAAEE Department of Geography, University of Ibadan,
Ibadan, Nigeria, e-mail: [email protected]
RRiittaa AAYYOOMMAANNOORR
Department of Geography, University of Ibadan, Ibadan, Nigeria, e-mail: [email protected]
OOlluuwwaaggbbeennggaa OO.. II.. OORRIIMMOOOOGGUUNNJJEE
Department of Geography, Obafemi Awolowo University, Ile-Ife, Nigeria, e-mail: [email protected]
Abstract: This study examined the differences between the qualities of surface water traversing the various land use types within Ibadan metropolis, South-Western, Nigeria. And identified the pattern of distribution and compared the concentration of some of the chemical and physical components of the surface water with a view to determining the impact of human activities on the concentration of both the physical and chemical components of water within the study area. The study integrated a topographical map of 1965 and Google Earth satellite images of 2.5 m spatial resolution coupled with intensive fieldwork. Four rivers that traversed the metropolis were purposively selected for this study from where a total of twenty samples was collected with five samples from each stream that traverse the various land use types using Global Positioning system for the transfer of coordinates to the sample points. Data collected was analyzed using descriptive statistics, analysis of variance, simple linear regression analysis and geospatial techniques coupled with laboratory analysis of samples collected. The result showed a significant relationship between residential and commercial land use and surface water quality change (0.02, 0.013; P<0.05). The study concludes that commercial and residential effluents has strong negative impact on the surface water quality change compare to industrial and agricultural land use in the study area. Key words: land use types, surface water quality, rivers, chemical, physical components,
* * * * * *
INTRODUCTION Studies have shown that global human population and urban development are increasing at
unprecedented rates, thereby creating havoc to the surface water quality (Mustapha and Getso, 2014). Researchers such as Huang et al., (2013) revealed that there is a close relationship between land use type and water quality while studies such as Yon and Chen (2002) and Bai et al., (2010) Corresponding Author
Land use Dynamics and Surface Water Quality in a Typical Urban Centre…
99
reported that changes in the land cover and land management practices have been regarded as the key influencing factors behind the alteration of the hydrological system, which lead to the change in runoff as well as the water quality. Wang et al., (1999) defined water quality as the physical, chemical and biological status of the water body. The abundance and diversity of biota in a water body is dependent on the chemical and physical characteristics. The quality of surface water can be severely altered by land use within and outside the catchment (Wang, 2001; Johnson and Richardson, 1995). The rapid urbanization, industrialization, intensive agriculture and growing demand for energy have adversely affected the physiochemical parameters of surface water (Avtar et al., 2011; Faniran et al., 1994; Herman, 2009, 2010), although the effects can vary with development. In Nigeria and many developing countries, where sanitation is known to be poor and the riparian ecosystem are rarely protected, the effects of unplanned land use are severe (Okeke et al., 1999; Ogwumike, 2002; Wallace et al., 2003). Researchers such as Faniran et al (1994) and Awadallah and Yousry (2012) reported that the quality of surface water within a region is governed by anthropogenic activities and natural processes. Therefore, the possible variability in water quality may be due to anthropogenic activities and natural variance during seasons due to various biochemical or chemical processes (Awadallah and Yousry, 2012). For instance, mining and smelting operation, disposal of treated and untreated waste effluents as well as metal chelate from different industries, including leather, petrochemical, and battery production, along with indiscriminate use of heavy metals containing fertilizers and pesticides in agricultural practices are example from long list of anthropogenic influence of surface water pollution (Sheykhi and Moore, 2012). Therefore, Klocking and Haberlandt (2002) were of the opinion that it is necessary to understand consequences of human activity on water cycle and environment at all relevant scales. According to Ojima and Galvin (1994) the impact of humans on the environment has increased over the past several years. Therefore, as the demand for water increases there is an associated escalation in effluent discharge, which has a negative impact on the water quality (Gyau-Boakye, 1999).
Physical changes in land use / land cover and population density within a river’s watershed usually have an impact on the hydrology and water quality of the river. This give credence to the findings of the Institute of Water Resources (IWR) (1997), which reported that various landuse types can potentially introduce pollutants into aquatic ecosystem and these landuse types are associated with human activities and physical characteristics that affect water quality. According to Faniranet et al., (1994) the major proportion of all water quality degradation worldwide is due to anthropogenic causes. Rogers (2000) identified four major direct impacts of land use on the hydrologic cycle which are flood and flood potential, drought, changes in river and groundwater regimes and water quality in an area. There is an increasing need to protect the quality of Nigeria’s water resources from degradation due to pollution, which interferes with the water uses at any scale. As a matter of facts, the availability of adequate water in terms of quality and quantity is essential to human existence. That is the reason why Guo et al (2009) indicated that it is necessary to take in to account both land use and the land cover pattern simultaneously in the study of the impacts of land use on the water quality.
In Nigeria, water and their resources are abundant and renewable but their continued usefulness is dependent on the responsible usage of these resilient but fragile ecosystems (Ajayi and Osibanjo, 1981). Rivers are used as site for the disposal of refuse, human sewage, and waste water from kitchens, abattoirs and industries. According to Vittori et al., (2010) water pollution can directly linked to the type of waste water produced by urban, industrial and agricultural activities that flows in to the surface water. Mombersbora et al., (1981) and Egborge (1991) reported that streams and rivers running though areas of significant human influence such as farms, cities and industrial locations are prone to pollution, especially in Nigeria where environmental protection regulations are not strictly enforced. Freshwater reservoirs are the most affected of all the water bodies. And the resultant effects of this on public health and the environment are usually great in magnitude. These include endangering of aquatic resources and other commercially important marine flora and fauna. Adesina (1986), Frontiers (1996), and

Olutoyin Adeola FASHAE, Rita AYOMANOR, Oluwagbenga O. I. ORIMOOGUNJE
100
Brown et al., (2008) revealed that the outbreaks of water-borne diseases like cholera, hepatitis, gastro-enteritis etc., are possible health effects of polluted water. Recently, epidemics of cholera have been reported from different parts of India, Nigeria and Zimbabwe and the outbreaks of typhoid fevers and dysentery were linked to unsanitary mixing of some water supplies and sewage. World Health Organization (WHO) (2003) reported that 80% of sickness and death among children in the world are caused by unsafe drinking water. Therefore, the thrust of this paper is to assess the quality of surface water traversing the various land use types in a typical urban centre in the southwestern Nigeria.
MATERIALS AND METHODS STUDY AREA The Ibadan metropolis (figure 1) is located in the southwestern Nigeria between latitude 70
201 N and 70 281 N and longitude 30 501 and 30 571 E.
Figure 1. Map of Nigeria Showing the Study Area and the sampling location

Land use Dynamics and Surface Water Quality in a Typical Urban Centre…
101
The Ibadan metropolis has a total surface of 240 km² and an average height of 200 m above sea level surrounded by secondary forest as well as savannah. The choice of Ibadan metropolis was as a result of its nature, that is, it is dissected by rivers, the largest urban centre in Africa south of the Sahara and the third most populous city in Nigeria (Areola, 1994). It has a population of about 2 555 593 people (National Population Commission, 2006) predominantly cosmopolitan in nature, comprising of Yorubas, Ibos, Hausas, Ibibios, Edos, Ijaws and a small non-African population like the Indians, Lebanese and the Syrians. The study sites where the surface water samples were collected are the Ogunpa, Ona, Kudeti and Odo-oba river systems (figure 2). The Ogunpa river system is a third order stream with a channel length of 21.5 km with 73.3 km² area draining the densely populated eastern part of the metropolis. The basin is covered mainly by ferruginous tropical soil on basement complex rock (Areola, 1978). The Ona river has a length of 55 km and area of 81 km² draining the low density western part of Ibadan. Kudeti River is a tributary of Ogunpa River and its flows through the densely populated areas of the ancient city of Ibadan while Odo-oba River flows through sparsely populated areas of Moniya in Akinyele local government area.
METHODOLOGY Both primary and secondary data were used for this study. In order to determine the effects
of land use types on surface water quality, samples sites were selected to ensure that it reflected the impacts of land use types in the immediate vicinity. Therefore, water samples are collected from river Ogunpa that traverses commercial areas; Ona River that traverses industrial areas; Odo-Oba River that traverses agricultural areas and Kudeti River that traverses residential areas. A total of twenty samples were collected, that is, five samples each from each stream that traverse the various land use types. These samples were collected during 3 weeks. The water samples collected were kept away from heat from the point of collection and transported in cooler containing ice packs to the laboratory. This was done in other to minimize room for change in volatile parameters in the course of transporting the samples to the laboratory for analysis. The geographical coordinates of the sample points were also taken into consideration using hand held GPS Garmin 76S. The samples were analysed for temperature, pH, electrical conductivity (EC), dissolved oxygen (DO), total solids, total dissolved solids (TDS), total suspended solids (TSS), chloride, nitrates and sulphate. Temperature which has extremely low stability was determined on the field with portable mercury thermometer. pH, electrical conductivity and dissolved oxygen were determined immediately on getting to the laboratory using portable meters. Standard laboratory procedures were adopted for the surface water samples analysis. All analysis was carried out at the Chemistry Department, University of Ibadan, Ibadan, Nigeria and Nigerian Institute of Science Laboratory Technology, Ibadan, Nigeria. Various statistical methods were used to analyse the data obtained in this study. The means and standard deviation were used to summarise the results of the analysis using Excel Package of Microsoft office and SPSS Package.
The effects of land use types on the surface water quality of the selected rivers in Ibadan Metropolis were determined by running a simple linear regression analysis on the mean values of parameters tested in the water samples as against the World Health Organization (WHO) standard values for water quality. Differences in the observed patterns and concentration of water quality parameters within the various land use types were determined using the Analysis of Variance (ANOVA).
RESULTS AND DISCUSSION LAND USE IMPACTS ON SURFACE WATER QUALITY Table 1 showed the descriptive analysis of land use and surface water quality parameters in
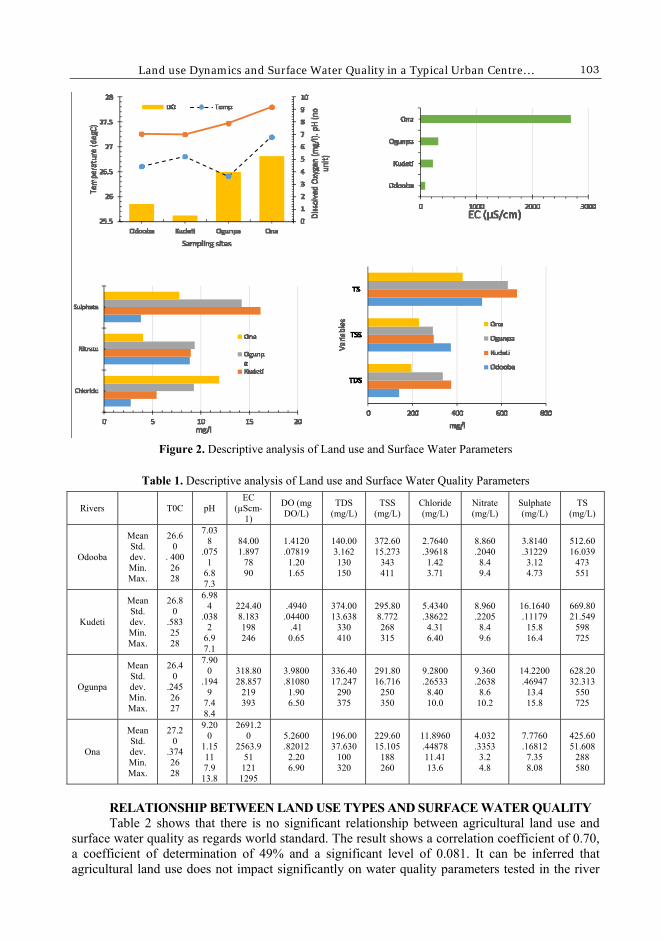
the study area and this was transformed graphical for in-depth analysis (figure 2). As showed in figure 2, the minimum and maximum temperature observed in surface water in agricultural land use was 260 C to 280 C with a mean of 26.60 C, in residential land use it was 250 C - 280 C with a

Olutoyin Adeola FASHAE, Rita AYOMANOR, Oluwagbenga O. I. ORIMOOGUNJE
102
mean value of 26.80 C, in commercial it was 260 C-270 C with a mean of 26.40 C and in industrial land use it was 260 C-280 C with a mean value of 27.20 C. The temperature values across the different land use were quite similar to those reported in similar tropical environments by researcher, such as Jajiet al., (2007). This implies that there was no pronounced impact of land use on the surface waterquality in terms of temperature in the study area. The Table also revealed the minimum and maximum pH levels for each river flowing through different land use patterns in the study area. For River Odooba flowing through agricultural land use the pH value was 6.8-7.3 with a mean of 7.0. Thiswas within the WHO standard value of 6.5 and 8.5. River Kudeti flowing through residential areas was 6.9- 7.1 pH value with a mean of 6.9 pH value within WHO standard. Ogunpa flowing through commercial land use had pH levels of 7.9- 8.4 and a mean of 7.9, while in Ona flowing through industrial areas had a pH value of 7.9-13.8 and a mean pH value of 9.3 which happens to be well above WHO standard. It can be inferred that the different landuse in the study area impacted surface water quality in varying degrees with regards to pH. In terms of dissolved oxygen (DO) as it evident from the table, Rivers Odooba and Kudeti flowing through agricultural and residential land use respectively had DO values that is below the WHO standard while River Ogunpa flowing through commercial land use had a value that is in line or tandem with WHO’s value but River Ona flowing through industrial land use impacts the least on the surface water quality with regards to dissolved oxygen. It is also evident from the table 1 that Rivers Odooba and Kudeti flowing through agricultural and residential land use had their. Total Dissolved Oxygen value (130 mg/1-150 mg/1:330 mg/1-410 mg/1) below the WHO standard while rivers Ogunpa and Ona had their TDS values (250 mg/1-350 mg/1; 100 mg/1-320 mg/1) respectively to be in line with WHO standards.
Figure 2 also revealed the range of conductivity level of each river flowing through different land use pattern. For instance, River Odoobathat flow through agricultural landusehad a conductivity level of 78-90µScm-1 and a mean 84.00µScm-1; Kudeti flowing through residential areas had conductivity levels ranging between 198-246µScm-1 and a mean of 224.4µScm-1; Ogunpa flowing through commercial land use had a conductivity levels of 219-393µScm-1 and a mean of 318µScm-1, while Ona flowing through industrial areas had 121-12947µScm-1 and a mean of 2691.20µScm-1 happens to be above WHO standard. It can be inferred from the findings that the different land use impacts in varying degrees to surface water quality in the study area. However industrial land use impacts the most on surface water quality with regards to conductivity. But agricultural land use impacts the least on surface water quality with regards to TDS. From the Table Total Suspended Solids (TSS) impacted the surface water quality the same way TDS does but industrial land use impacted the least while agricultural land use impacted the most in terms of TSS value. Also from table 1 and figure 2, River Kudeti and River Ogupa flowing through residential and commercial land use impacted the quality of surface water most with Total Solids (TS) value ranging between 598mg/1 – 725mg/1 with a mean of 669.80mg/1 and 550mg/1 – 725mg/1 with a mean of 628mg/1 levels which is above the WHO standard with respects to Total Solids. As evident from the table 1 and figure 2, the Chloride levels for the surface water quality in the study area were below the WHO standard for the various form of land use but agricultural land use impacts the least with mean Chloride value of 2.76mg/l while industrial impacts the most with mean Chloride value of 11.89mg/l on the surface water quality with regards to chloride. In case of nitrate levels in the surface water quality in the study area, the levels were below the WHO standards but above the required level for unpolluted water. From figure 2, the industrial land use impacts the least with mean value of 4.03mg/l while the commercial land use impacts the most on the surface water quality with regards to nitrate. Sulphate levels for all the forms of land use in the study area were also below the WHO standards but were still above the required levels for unpolluted water. From the figure, residential land use with mean value of 16.16mg/l of sulphate impacts the most followed by commercial land use with mean value of 14.22mg/l of sulphate while agricultural land use with mean value of 3.81mg/l of sulphate impacts the least on the surface water quality.
Land use Dynamics and Surface Water Quality in a Typical Urban Centre…
103
Figure 2. Descriptive analysis of Land use and Surface Water Parameters
Table 1. Descriptive analysis of Land use and Surface Water Quality Parameters
Rivers T0C pH EC
(µScm-1)
DO (mg DO/L)
TDS (mg/L)
TSS (mg/L)
Chloride (mg/L)
Nitrate (mg/L)
Sulphate (mg/L)
TS (mg/L)
Odooba
Mean Std. dev. Min. Max.
26.60
. 400 26 28
7.038
.0751
6.8 7.3
84.00 1.897
78 90
1.4120 .07819 1.20 1.65
140.00 3.162 130 150
372.60 15.273
343 411
2.7640 .39618 1.42 3.71
8.860 .2040 8.4 9.4
3.8140 .31229
3.12 4.73
512.60 16.039
473 551
Kudeti
Mean Std. dev. Min. Max.
26.80
.583 25 28
6.984
.0382
6.9 7.1
224.40 8.183 198 246
.4940 .04400
.41 0.65
374.00 13.638
330 410
295.80 8.772 268 315
5.4340 .38622 4.31 6.40
8.960 .2205 8.4 9.6
16.1640 .11179
15.8 16.4
669.80 21.549
598 725
Ogunpa
Mean Std. dev. Min. Max.
26.40
.245 26 27
7.900
.1949
7.4 8.4
318.80 28.857
219 393
3.9800 .81080 1.90 6.50
336.40 17.247
290 375
291.80 16.716
250 350
9.2800 .26533 8.40 10.0
9.360 .2638 8.6 10.2
14.2200 .46947
13.4 15.8
628.20 32.313
550 725
Ona
Mean Std. dev. Min. Max.
27.20
.374 26 28
9.200
1.1511 7.9 13.8
2691.20
2563.951 121 1295
5.2600 .82012 2.20 6.90
196.00 37.630
100 320
229.60 15.105
188 260
11.8960 .44878 11.41 13.6
4.032 .3353 3.2 4.8
7.7760 .16812
7.35 8.08
425.60 51.608
288 580
RELATIONSHIP BETWEEN LAND USE TYPES AND SURFACE WATER QUALITY Table 2 shows that there is no significant relationship between agricultural land use and
surface water quality as regards world standard. The result shows a correlation coefficient of 0.70, a coefficient of determination of 49% and a significant level of 0.081. It can be inferred that agricultural land use does not impact significantly on water quality parameters tested in the river

Olutoyin Adeola FASHAE, Rita AYOMANOR, Oluwagbenga O. I. ORIMOOGUNJE
104
flowing through this land use when compared with WHO standard. Although the result may not be felt significantly but studies have shown that, impacts on water quality were highest in agricultural land use (Zangi and Wang, 2011). The insignificant impact of agricultural land use on surface water quality in the study area may be as a result of some factors not taken into consideration which could account for a relationship. As observed during the study, there is little or no intensification of agricultural activities like application of fertilizer.
Table 3 shows a strong significant relationship between residential land use and surface water quality as regards WHO standard. That is,with a correlation coefficient of 0.81, coefficient of determination of 65% at a significant level of 0.028. It can be inferred that residential land use impacts significantly on the surface water quality parameters in the river traversing the land use compared to WHO standard.
Table 4 shows a significant relationship between commercial land use and surface water quality as regards WHO standard. That is, with a correlation coefficient of 0.86, coefficient of determination of 74% at a significant level of 0.013. It can be inferred that commercial land use impacts significantly on the surface water quality parameters in the river traversing the land use compared to WHO standard. This was supported by a study carried out by Adeyemo et al., (2002) that most slaughter houses which characterized commercial areas in Nigeria discharged their wastes directly into the river without prior treatment. High contamination of the surface water might also be attributed to direct defecation into the river coupled with indiscriminate dumping of domestic waste, discharge of abattoir wastes and surface water runoff.It is evident from Table 5 that there is no significant relationship between industrial land use and surface water quality as regards WHO standard. The Table shows a correlation of 0.47, a coefficient of correlation of 22% at a significant level of 0.286 which indicates a weak relationship.
Table 2. Relationship between Agricultural land use and Surface Water Quality
Model Sum of Squares df Mean of Square
F Sig R R2
Regression Residual Total
128538.660 135032.769 263571.429
1 5 6
128538.660 27006.554
4.760 .081a 698a .488
Sig 0.05
Table 3. Relationship between Residential land use and Surface Water Quality
Model Sum of Squares Df Mean of Square
F Sig R R2
Regression Residual Total
171712.353 91859.076 263571.429
1 5 6
171712.353 18371.815
9.347 .028a .807a .651
Sig 0.05
Table 4. Relationship between Commercial land use and Surface Water Quality
Model Sum of Squares
Df Mean of Square
F Sig R R2
Regression Residual Total
194290.098 69281.330 263571.429
1 5 6
194290.098 13856.266
14.022 .013a .859a .737
Sig 0.05
Table 5. Relationship between Industrial land use and Surface Water Quality
Model Sum of Squares
Df Mean of Square
F Sig R R2
Regression Residual Total
58500.082 205071.346 263571.429
1 5 6
58500.082 41014.269
1.426 .286a .471a .222
Sig 0.05

Land use Dynamics and Surface Water Quality in a Typical Urban Centre…
105
It can be inferred that industrial land use does not impact significantly on the surface water quality parameters analyzed in the river flowing through industrial land use in comparison to WHO standard in the study area. The effects of industrial land use may not be significant on surface water quality in the study area but adequate monitoring of the industrial effluent is necessary to prevent bioaccumulation effects, which may possess adverse effects. Studies have shown that effluents from municipal and industrial activities impair the environment with significant consequence on human health (Chapman, 2006; Eludoyin et al., 2004).
PATTERNS AND CONCENTRATION OF WATER QUALITY PARAMETERS
TRAVERSING VARIOUS LAND USE The observed pattern and concentration of the selected water quality parameters in the
rivers traversing the various land use types identified for the study are shown in table 6. As evident from table 6, there is no significant difference in the observed pattern of temperatures values in the various rivers that traverse the different land use. The result (f=.667, df=3/16, P>0.05) implies that variations in temperature are not accounted for by the various land use types. These were similar to Jaji’s et al., (2007) findings for similar tropical environment.
Table 6. Patterns and Concentration of Water Quality Parameters
Parameters Sum of Squares Df Mean Squares F Sig.
T0C Between Groups 1.750 3 0.583 0.667 0.585
Within Groups 14.000 16 0.875
pH Between Groups 16.075 3 5.358 3.129 0.055
Within Groups 27.402 16 1.713 Conductivity
(µScm-1) Between Groups 2.324 3 7747762.667 0.943 0.443
Within Groups 1.315 16 8218435.050
D0(mgDO/L) Between Groups 73.437 3 24.479 14.636 0
Within Groups 26.761 16 1.673 0
TDS(mg/L) Between Groups 186593.600 3 62197.867 26.059 0
Within Groups 38189.200 16 2386.825 0
TSS (mg/L) Between Groups 51428.950 3 17142.983 16.77 0
Within Groups 16356.000 16 1022.250 0
Chloride (mg/L) Between Groups 245.466 3 81.822 113.263 0
Within Groups 11.559 16 0.722 0
Nitrate (mg/L) Between Groups 95.503 3 31.834 93.550 0
Within Groups 5.445 16 0.340 0
Sulphate (mg/L) Between Groups 490.209 3 163.403 364.446 0
Within Groups 7.174 16 0.448 0 Total Solids
(mg/L) Between Groups 185068.950 3 61689.650 11.143 0
Within Groups 88582.000 16 5536.375 0
CONCLUSION The study revealed that various land use types affects surface water quality to some extent.
This confirmed and corroborates other scholars’ findings that different land use types affect surface water quality and thereby making surface water relatively unsafe for domestic purposes. The results has also provided an important scientific reference for the local land use optimization and water pollution control and guidance for the formulation of policies to coordinate the exploitation and protection of the water resource in the study area. There is no doubt that it is

Olutoyin Adeola FASHAE, Rita AYOMANOR, Oluwagbenga O. I. ORIMOOGUNJE
106
easier to plan for good water management before development takes place rather than retrofitting existing development to reduce water impacts. Therefore, balancing the needs of growth and protection of the environment requires planning and commitment, but it worth the effort because all citizens benefit when clean streams with healthy aquatic life flow in and around their communities.The study suggested that impervious areas should be reduced by incorporating open spaces into urban areas while green belts should be encourage along streams.
REFERENCES
Adesina H. O. (1986), Urban environment and epidemic disease. Proceedings of National Conference on Development
and the Environment, Nigerian Institute of Social and Economic Research, Ibadan, Nigeria, pp. 234-256. Adeyemo O. K., Ayodeji I. O., Aika-Raji C. O. (2002), The water quality and sanitary conditions in a major abattoir
(Bodija) in Ibadan, Nigeria, African Journal of Biomedical Research, 5(1-2). Ajayi S. O., Adeleye S. A. (1977), Pollution studies on Nigeria Rivers I: Preliminary report on the pollution level of the
River Ona and Ogunpa, Bull. Chem. Soc. Nig, 2, 71-82. Areola O. (1978), Soil and vegetal Resources, In Oguntoyinbo J.S, Areola O.O and Filani M (eds), A Geography of
Nigeria Development, Heinemann Educational Books, Nigeria Ltd. Ibadan. Areola O. (1994), Geographic sense and national development, The Nigerian Geographical Journal, 1, 20-35. Avtar R., Kumar P., Singh C., Mukherjee S. (2011), A comparative study on hydrogeochemistry of Ken and Betwa Rivers
of Bundelkhand using statistical approach, Water Quality, Exposure and Health, vol. 2, pp. 169–179. Awadallah A. G., Yousry M. (2012), Identifying homogeneous water quality regions in the Nile River using multivariate
statistical analysis, Water Resources Management, vol. 26, pp. 2039–2055. Bai J., Ouyang H., Xiao R. (2010), Spatial variability of soil carbon, nitrogen and phosphorus content and storage in an
alpine wetland in the Qinghai-Tibet Plateau, China, Australian Journal of soil research, 48: 8, pp. 730-736. Brown et al. (2008), Esherichia coli in household drinking water and diarrheal disease risk: evidence from Cambodia,
Water Sci. Technol. 58(4): 757-763. Chapman D. V. (Ed.), (1996), Water quality assessments: a guide to the use of biota, sediments, and water in
environmental monitoring. Chigor V. N., Umoh V. J. Okuofu C. A., Ameh J. B., Igbinosa E. O., Okoh A. I. (2011), Water quality assessment: surface
water sources for drinking and irrigation in Zaria, Nigeria are a public health hazards, Environmental Monitoring and Assessment, 1(184): 3389-3400.
Egborge A. B. M. (1991), Industrialization and heavy metal pollution in Warri River, 32nd Inaugural lecture, University of Benin, Benin City, Nigeria. 32 pp.
Eludoyin A. O. (2004), The effect of Oja-titun market on the physical quality of receiving reservior in Ile-Ife, Nigeria, Journal of environmental mgt, 72, 249-259.
Faniran J. A., Adeleke B. B., Oderinde R. A. (1994), Forcados Terminal integrated Projects: Baseline Ecological Studies commissioned by Shell Petroleum Development Company of Nigeria.
Fisher D. S., Steiner J. L., Endale D. M., Stuedemann J. A., Schomberg H. H., Franzluebbers A. J., Wilkinson S. R. (2000), The relationship of land use practices to surface water quality in the upper Oconee Watershed of Georgia, Forest Ecology and Management, 128:39-48.
Guo Q. H., Ma K. M. Zhang Y. (2009), Impact of land use pattern on lake water quality in urban region, Acta Ecologia Sinica, 29: 2, pp. 776-787
Gyau-Boakye P. (1999), Water and Sustainable Development in Ghana, International Water Resources Association (IWRA), Water International. 24 (3): 189-195.
Herman G. V. (2009), Omul şi modificările antropice din Câmpia Someşului [The man and anthropogenic changes in Somes Plain], Editura Universităţii din Oradea, 227 pag., ISBN 978-973-759-981-0, Oradea.
Herman G. V. (2010), Using Geographical Information (GIS) System for Management of Flood Risks in the Somes Plain, in Cross-Border Partnership with Special Regard to the Hungarian - Romanian - Ukrainian Tripartite Border, Book Editors Ioan Horga, Istvan Suli Zakar, Publishing House University of Debrecen Press, ISBN 978-606-10-0153-8, p. 175 -179.
Holden J., Chapman P. J., Lane S. N., Brookes C. (2006), Impacts of artificial drainage of peatlands on runoff production and water quality, Developments in Earth Surface Processes, 9, 501-528.
Huang J., Zhan J., Yan H., Wu F., Deng X. (2013), Evaluation of the impacts of land use on water quality: A case study in the Chaohu Lake Basin.
Institute of Water Resources (IWR) (1997), Landuse effects on Water Quality, Michigan State University, Michigan, USA. Jaji M. O., Bamgbose O., Odukoya O. O., Arowolo T. A. (2007), Water quality assessment of ogun River, South West
Nigeria, Environ. Monit. Assess. 133: 473-482. Johnson B. L., Richardson W. B. (1995), Past, present and future concepts in large rivers ecology, Bioscience 45(3):134-142. Johnson L. B., Richards C., Host G. E., Arthur J. W. (1997), Landscape influences on water chemistry inmidwestern stream
ecosystems, Freshwater biology, 37: 193-208.

Land use Dynamics and Surface Water Quality in a Typical Urban Centre…
107
Klocking B., Haberlandt U. (2002), Impact of land use changes on water dynamics- a case study in temperatemeso and macroscale river basins, Physics and Chemistry of the Earth, 27: 619-629.
Mombersbora G., Ajayi S. O., Osibanjo O. (1981), Pollution studies on Nigeria Rivers: Toxic metals status of the surface water, in Ibadan City 5,49-53.
Mustapha G. (2014), Sources and pathway of environmental pollutants into surface water resources: A Review, Journal of Environments, 1(2), 54-59.
Nwankwo C. N., Oggagarue D. O. (2011), Effects of gas flaring on surface and ground waters in Delta State, Journal of Geology and Mining Research 3(5), pp131-136.
Ogwumike F. O. (2002), An appraisal of poverty reduction strategies in Nigeria, CBN Economic and Financial Review, 39(4), 1-17.
Ojima D. S., Galvin K. A. (1994), The global impact of land use change, Biosciences 44 (5) 300. Okeke I. N., Lamikanra A., Edelman R. (1999), Socio economic and behavioral factors leading to acquired bacterial
resistance to antibiotics in developing countries, Emerging infectious diseases, 5(1), 18. Oladele O., Adegbenro P. D., Adewole M. G., (2010), The impact of industries on surface water quality of River Ona and
River Alaro in Oluyoro Industrial Estate Ibadan, Nigeria, African Journal of Biotechnology, vol 10(4) pp. 696-702. Palma P., Alvarenga P., Palma V. L., Fernandes R. M., Soares A. V. M., Barbosa I. R. (2010), Assessment of
anthropogenic sources of water pollution using multivariate statistical techniques: A case study of the Alqueva’s reservoir, Portugal, Environmental Monitoring and Assessment, 165, 539-552.
Ren W., Zhong Y., Meligrana J., Anderson B., Watt W. E., Chen J., Leung H. L. (2003), Urbanization, land use, and water quality in Shanghai: 1947–1996, Environment International, 29(5), 649-659.
Rogers P. (2000), Landuse change in developing countries: Comparing India and China, DEAS/HUCE, Harvard University, Cambridge.
Sheykhi V., Moore F. (2012), Geochemical characterization of Kor River water quality, Fars province, Southwest Iran," Water Quality, Exposure and Health, vol. 4, pp. 25–38.
Vittori A. L., Trivisano C., Gessa C., Gherardi M., Simoni A., Vianello G., Zamboni N. (2010), Quality of municipal wastewater compared to surface waters of the river and crtificial canal network in different areas of the eastern Po Valley (Italy), Water Quality, Exposure and Health, vol. 2, pp. 1–13.
Wallace J. S., Acreman M. C., Sullivan C. A. (2003), The sharing of water between society and ecosystems: from conflict to catchment–based co–management, Philosophical Transactions of the Royal Society of London B: Biological Sciences, 358(1440), 2011-2026.
Wang P.F., Martin J., Morrison G. (1999), Water quality and eutrophication un Tampa Bay, Florida, Estuarine, Coastal and Shelf Science 49, 1–20
Wang X. (2001), Integrating water-quality management and land use planning in watershed context, Journal of Environmental Management, 61 25-36.
Yon S. T. Y., Che W. (2002), Modelling the relationship between land use and surface water quality, Journal of Environmental Management, 66: 4, pp. 377-393.
*** (1996), Frontiers, Tracking a killer: following cholera with every available means http://www.nsf.gov/od/lpa/ news/publicat/frontier/10- 96/10chlra.htm (Retrieved on July., 2016).
*** (2003), World Health Organization, Guidelines for Drinking Water Quality 3rdEdn, WHO, Geneva. *** (2006), National Population Commision, National Population Census.
Submitted: Revised: Accepted and published online August 02, 2016 April 26, 2017 May 09, 2017