Embed Size (px)
Citation preview
Seediscussions,stats,andauthorprofilesforthispublicationat:https://www.researchgate.net/publication/322236465
Laser-InducedBreakdownSpectroscopy:anadvancedmethodforanalysisofnanocarbonmaterialschemicalcomposition
ArticleinJournalofAnalyticalAtomicSpectrometry·January2018
DOI:10.1039/C7JA00331E
CITATIONS
0
READS
3
7authors,including:
VyacheslavFedorovichLebedev
ITMOUniversity
83PUBLICATIONS205CITATIONS
SEEPROFILE
AllcontentfollowingthispagewasuploadedbyVyacheslavFedorovichLebedevon04January2018.
Theuserhasrequestedenhancementofthedownloadedfile.
This is an Accepted Manuscript, which has been through the Royal Society of Chemistry peer review process and has been accepted for publication.
Accepted Manuscripts are published online shortly after acceptance, before technical editing, formatting and proof reading. Using this free service, authors can make their results available to the community, in citable form, before we publish the edited article. We will replace this Accepted Manuscript with the edited and formatted Advance Article as soon as it is available.
You can find more information about Accepted Manuscripts in the author guidelines.
Please note that technical editing may introduce minor changes to the text and/or graphics, which may alter content. The journal’s standard Terms & Conditions and the ethical guidelines, outlined in our author and reviewer resource centre, still apply. In no event shall the Royal Society of Chemistry be held responsible for any errors or omissions in this Accepted Manuscript or any consequences arising from the use of any information it contains.
Accepted Manuscript
rsc.li/jaas
JAASJournal of Analytical Atomic Spectrometrywww.rsc.org/jaas
ISSN 0267-9477
Themed Issue: Celebrating the 30th Anniversary of JAAS
Volume 31 Number 1 January 2016 Pages 1–346
CRITICAL REVIEWTimur A. Labutin et al. Femtosecond laser-induced breakdown spectroscopy
JAASJournal of Analytical Atomic Spectrometry
View Article OnlineView Journal
This article can be cited before page numbers have been issued, to do this please use: V. F. Lebedev, M.
K. Rabchinskii, M. Kozlyakov, D. Stepanov, A. Shvidchenko, N. V. Nikonorov and A. Vul, J. Anal. At.
Spectrom., 2018, DOI: 10.1039/C7JA00331E.
Journal Name
ARTICLE
This journal is © The Royal Society of Chemistry 20xx J. Name., 2013, 00, 1-3 | 1
Please do not adjust margins
Please do not adjust margins
Received 00th January 20xx,
Accepted 00th January 20xx
DOI: 10.1039/x0xx00000x
www.rsc.org/
Laser-Induced Breakdown Spectroscopy: an advanced method for
analysis of nanocarbon materials chemical composition
V. F. Lebedev*,a M. K. Rabchinskii,
b M. S. Kozlyakov,
a D. N. Stepanov,
a A. V. Shvidchenko,
b N. V.
Nikonorova and A. Ya. Vul’
b
Precise and express analysis of nanocarbon materials chemistry continues to be one of the key tasks in the field of
studying and following application of these unique structures. Despite large variety of the analytical techniques have been
commonly used for this purpose, development of new methods that will further expand efficiency of the nanocarbon
materials characterization is still needed. Hereby applicability of laser-induced breakdown spectrosocopy (LIBS) for study
of chemical composition of different types of nanocarbon structures was investigated. Graphene oxide, reduced graphene
oxide (analogous of pristine graphene) and detonation nanodiamonds were chosen as the most attractive representatives
of nanocarbon materials. The obtained results demonstrate that functionalization parameters, such as functionalization
degree and predominant type of the functional groups can be effectively determined on the base of the analyzed plasma
emission spectra. Furthermore, presence of various inorganic contaminants can be identified by the LIBS technique. In
comparison to common approach whith studying of samples in the form of thick pellets thin films of nanocarbon
structures on various substrates were succesfully analyzed. Several experimental features arise in this case, in particular
possible ablation of wafer and formation of thermal emission background. To overcome these challenges and to obtain
reliable informative spectra adjustment of the ablation parameters and additional spectra processing procedures were
applied. As a result, LIBS method can be a valuable and simple tool for quality control and characterization of various
nanocarbon structures.
1. Introduction
Despite the intensive research of nanocarbon materials for
more than two decades these unique structures still remain at
the forefront of nanotechnology, providing scientific and
technological excitement for researches in various disciplines1-
4. With their exceptional physico-chemical properties, these
nanomaterials are seem to have applications in many fields,
such as electronic, optoelectronic and energy devices,
nanocomposites and biomedical engineering as well as being
viewed as building blocks in upcoming nanotechnology
applications5,6
. One of the remarkable features intrinsic to
nanocarbon materials is their versatility for chemical
modification through either covalent or non-covalent
attachment of various functional groups and inorganic species.
This aspect provides an intriguing opportunity for tailoring
their physico-chemical properties in a desired way7-11
. For
instance, surface functionalization of detonation nanodiamond
can be used to change its wetting or adhesion characteristics
enhancing the nanoparticle dispersion in matrices whereas
covalent modification of graphene by fluorine, hydrogen or
oxygen-containing groups appeared to be an effective way for
altering its electronic and optical properties in a wide
range12,13
. On the other hand, various contaminants may also
preserve after the synthesis process and additionally affect the
materials physico-chemical properties in an undesirable way14-
16. Thus, express and precise control of the nanocarbon
materials chemical composition, as-synthesized or
subsequently modified, becomes of a great importance and is
a relevant task in the area of nanocarbon science. To meet this
demand, facile analytical methods capable of accurate study of
the materials chemical composition have to be developed.
Laser-induced breakdown spectroscopy (LIBS) is one of the
spectral methods that is intensively evolving nowadays owing
to its unique features, such as possibility of performing real-
time and in situ analysis of various types of samples (gas,
liquid, solid) and high sensitivity17-19
. In particular, presence of
various ions, atoms, molecules and even isotopes can be
identified by detection of the corresponding emission lines
that arise at different temperatures of the luminous plasma
plume20
. In comparison to other analytical techniques
commonly used for characterizing materials chemistry, such as
infra-red spectroscopy (IR spectroscopy), X-ray photoelectron
spectroscopy (XPS), electron energy loss spectroscopy (EELS),
etc. LIBS does not have limitations in the type of chemical
elements that can be detected what makes analysis of the
Page 1 of 11 Journal of Analytical Atomic Spectrometry
123456789101112131415161718192021222324252627282930313233343536373839404142434445464748495051525354555657585960
Jour
nalo
fAna
lytic
alA
tom
icS
pect
rom
etry
Acc
epte
dM
anus
crip
t
Publ
ishe
d on
03
Janu
ary
2018
. Dow
nloa
ded
by G
azi U
nive
rsite
si o
n 04
/01/
2018
17:
19:4
1.
View Article OnlineDOI: 10.1039/C7JA00331E
ARTICLE Journal Name
2 | J. Name., 2012, 00, 1-3 This journal is © The Royal Society of Chemistry 20xx
Please do not adjust margins
Please do not adjust margins
sample full chemical composition possible by using only single
method. Differentiation of distinct types of the functional
groups, presented in the assayed sample, is a challenging task
within LIBS method since produced plasmas contain emission
of species both ablated directly from the irradiated target and
produced by probable chemical reactions in gas phase.21,22
Nevertheless, dominant type of the functionalities presented
in the sample still can be determined by comparison of the
corresponding emission lines, giving an opportunity to identify
the studied material23
. Thus, taking also into account versatility
of the LIBS technique and absence of specific requirements to
parameters of the studied sample, use of this method seems
to be quite an effective approach for analysis of nanocarbon
materials chemical composition.
Notwithstanding this, only a single precedent has reported on
the use of LIBS for studying of nanocarbon materials, namely
graphene24
. However, in this work, authors concerned mainly
on the relationships between the optical emission from plasma
plumes of different graphene-based materials and their
structural properties, namely number of the layers and
stacking sequence, rather than analysis of materials chemical
composition, for instance presence of oxygen- and nitrogen-
containing functional groups that is of a high interest in the
case of graphene and graphene oxide (GO). At the same time,
no studies of any nanocarbon structures using LIBS method
beside the abovementioned study have been reported yet.
Hereby we present for the first time experimental results on
applying LIBS technique for studying of two classes of
nanocarbon materials – detonation nanodiamonds (DND) and
graphene oxide – that refer to sp3 and sp
2 carbon
nanoclusters, respectively. In particular, two types of
detonation nanodiamond samples, DND with positive
(denoted hereinafter as DND Z+) and negative (designated
further as DND Z-) zeta potential, along with graphene oxide
and thermally-reduced graphene oxide (rGO, analogous to
graphene) samples that differ in type and relative
concentration of the functional groups, presented in their
structure, were studied.
Emission bands attributed to C2 Swan system, CN, hydrogen
and oxygen, originating from incorporated nitrogen and
various hydrogen- and oxygen-containing species, were
observed, providing information about the overall content and
preeminent type of the functional groups presented in the
assayed nanocarbon materials. Moreover, emission signals of
several in-organic elements were also detected, demonstrating
that presence of various contaminants can be also effectively
identified by this method.
In comparison to millimeter-thick cylindrical pellets, used for
studying of graphene samples by J.Serrano et al.24
, all samples
were studied in the form of films with thickness of 100-300 nm
on quartz and silicon wafers. This approach allows to
significantly minimize the amount of material needed for an
analysis and also demonstrates further applicability of this
method for in-situ studying of the graphene and nanodiamond
coatings on various substrates commonly used in formation of
nanocarbon-based optoelectronic devices7,25
. In turn, study of
the LIBS spectra of thin films additionally revealed strong
influence of the sample thickness on the resulting plasma
emission spectra. In particular, formation of an intensive
broadband background signal can be observed in this case. As
it was experimentally determined this background signal
originates from thermal radiation of the sample. To solve the
problem of presence of the thermal background along with
temporal or spatial homogeneity in the expanding plasma and
thus to obtain reliable data of the sample composition
additional spectra processing procedures were applied.
Overall, the results obtained demonstrate that LIBS can be
effectively used as an express and comprehensive method for
identification of distinct types of nanocarbon materials and
analysis of their chemical composition.
2. Experimental
2.1 LIBS setup and acquisition conditions
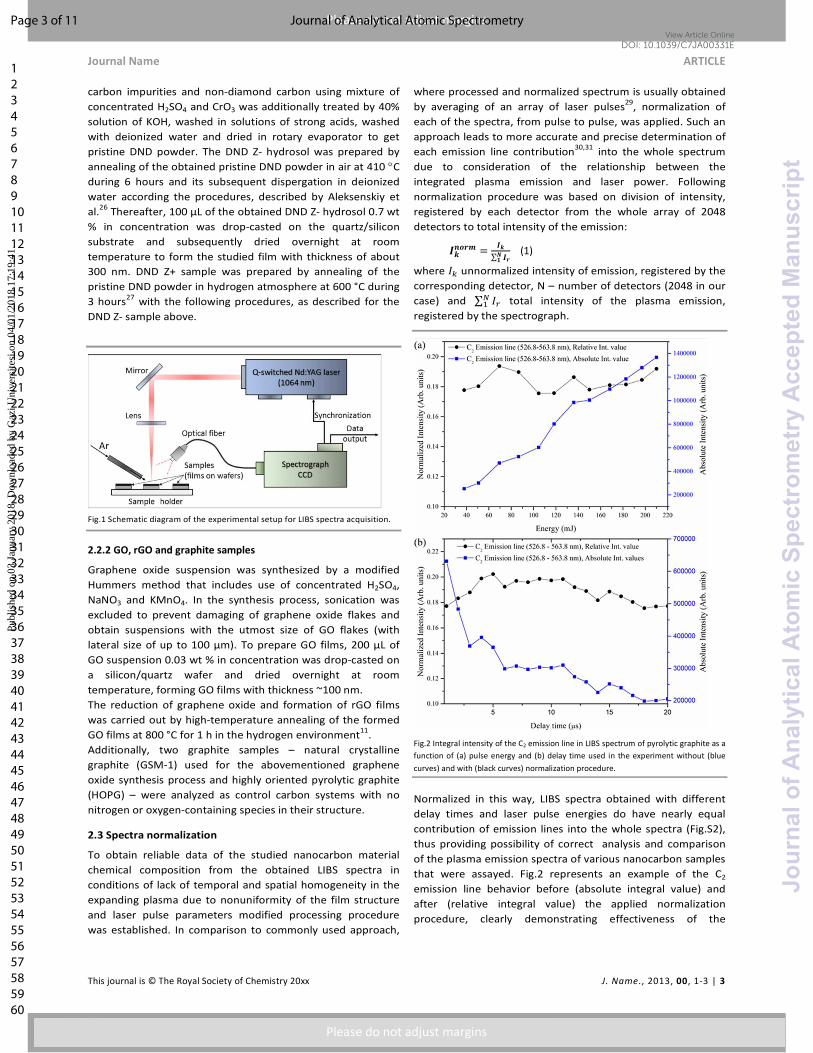
A scheme of the experimental set-up is shown in Fig. 1. A flash-
lamp-pumped Nd3+
:YAG laser LQ-129 (SolarLS JSC) was used as
an excitation source. The pulse generation was performed in
an active Q-switching mode with a repetition rate of frequency
2 Hz, pulse duration and energy varied from 50 to 20 ns and 50
mJ to 210 mJ, respectively. The laser beam was focused onto
the surface of the wafer with nanocarbon film via a lens with
the focal length f=100 mm. The diameter of the laser spot on
the sample surface was measured to be 125 μm. During the
whole series of the experiments configuration of the optical
elements and distance between the lens and surface of the
samples preserved the same, thus resulting in absence of
variation of the diameter of the laser spot. The laser jet
radiation was collected by the collimation lens COL-UV/VIS
(Avantes BV) and focused onto the end of the receiving optical
fiber with the core diameter 600 μm connected with the
spectrometer input. The plasma emission was recorded using a
high-speed fiber spectrometer AvaSpec-ULS2048L-USB2
(Avantes BV) with the spectral range of 336-886 nm,
determined by the diffraction grating that is used in our
particular model. Spectral resolution of the used
spectrophotometer is 1 nm. Detector array involves 2048 CCD
detectors with the gate width of CCD 1.05 ms. Control of the
spectrophotometer, launch of the laser with generation of the
probe pulse and preliminary spectra processing was carried
out using originally developed software on the base of NET
Framework 4.5. with use of the dynamic library avaspec.dll.
The studied samples were placed onto a manually moved
linear translator with a flat surface rectangular to the laser
beam direction. Measurements were performed both in the air
ambient and in argon flow (buffer gas). In the latter case, the
Ar flux with a flow rate of 0.7 l/min was directed to the sample
surface adjusted to exclude the ambient air completely from
the plasma plume. Image of the LIBS setup is shown in Fig.S1
2.2 Samples
2.2.1 DND samples
Industrial DND material from FGUP kombinat
Elektrokhimpribor (Russia) that is initially purified from non-
Page 2 of 11Journal of Analytical Atomic Spectrometry
123456789101112131415161718192021222324252627282930313233343536373839404142434445464748495051525354555657585960
Jour
nalo
fAna
lytic
alA
tom
icS
pect
rom
etry
Acc
epte
dM
anus
crip
t
Publ
ishe
d on
03
Janu
ary
2018
. Dow
nloa
ded
by G
azi U
nive
rsite
si o
n 04
/01/
2018
17:
19:4
1.
View Article OnlineDOI: 10.1039/C7JA00331E
Journal Name ARTICLE
This journal is © The Royal Society of Chemistry 20xx J. Name., 2013, 00, 1-3 | 3
Please do not adjust margins
Please do not adjust margins
carbon impurities and non-diamond carbon using mixture of
concentrated H2SO4 and CrO3 was additionally treated by 40%
solution of KOH, washed in solutions of strong acids, washed
with deionized water and dried in rotary evaporator to get
pristine DND powder. The DND Z- hydrosol was prepared by
annealing of the obtained pristine DND powder in air at 410 °C
during 6 hours and its subsequent dispergation in deionized
water according the procedures, described by Aleksenskiy et
al.26
Thereafter, 100 μL of the obtained DND Z- hydrosol 0.7 wt
% in concentration was drop-casted on the quartz/silicon
substrate and subsequently dried overnight at room
temperature to form the studied film with thickness of about
300 nm. DND Z+ sample was prepared by annealing of the
pristine DND powder in hydrogen atmosphere at 600 °С during
3 hours27
with the following procedures, as described for the
DND Z- sample above.
Fig.1 Schematic diagram of the experimental setup for LIBS spectra acquisition.
2.2.2 GO, rGO and graphite samples
Graphene oxide suspension was synthesized by a modified
Hummers method that includes use of concentrated H2SO4,
NaNO3 and KMnO4. In the synthesis process, sonication was
excluded to prevent damaging of graphene oxide flakes and
obtain suspensions with the utmost size of GO flakes (with
lateral size of up to 100 μm). To prepare GO films, 200 μL of
GO suspension 0.03 wt % in concentration was drop-casted on
a silicon/quartz wafer and dried overnight at room
temperature, forming GO films with thickness ~100 nm.
The reduction of graphene oxide and formation of rGO films
was carried out by high-temperature annealing of the formed
GO films at 800 °C for 1 h in the hydrogen environment11
.
Additionally, two graphite samples – natural crystalline
graphite (GSM-1) used for the abovementioned graphene
oxide synthesis process and highly oriented pyrolytic graphite
(HOPG) – were analyzed as control carbon systems with no
nitrogen or oxygen-containing species in their structure.
2.3 Spectra normalization
To obtain reliable data of the studied nanocarbon material
chemical composition from the obtained LIBS spectra in
conditions of lack of temporal and spatial homogeneity in the
expanding plasma due to nonuniformity of the film structure
and laser pulse parameters modified processing procedure
was established. In comparison to commonly used approach,
where processed and normalized spectrum is usually obtained
by averaging of an array of laser pulses29
, normalization of
each of the spectra, from pulse to pulse, was applied. Such an
approach leads to more accurate and precise determination of
each emission line contribution30,31
into the whole spectrum
due to consideration of the relationship between the
integrated plasma emission and laser power. Following
normalization procedure was based on division of intensity,
registered by each detector from the whole array of 2048
detectors to total intensity of the emission:
������ �
��
∑ ��
(1)
where �� unnormalized intensity of emission, registered by the
corresponding detector, N – number of detectors (2048 in our
case) and ∑ � �� total intensity of the plasma emission,
registered by the spectrograph.
Fig.2 Integral intensity of the C2 emission line in LIBS spectrum of pyrolytic graphite as a
function of (a) pulse energy and (b) delay time used in the experiment without (blue
curves) and with (black curves) normalization procedure.
Normalized in this way, LIBS spectra obtained with different
delay times and laser pulse energies do have nearly equal
contribution of emission lines into the whole spectra (Fig.S2),
thus providing possibility of correct analysis and comparison
of the plasma emission spectra of various nanocarbon samples
that were assayed. Fig.2 represents an example of the C2
emission line behavior before (absolute integral value) and
after (relative integral value) the applied normalization
procedure, clearly demonstrating effectiveness of the
Page 3 of 11 Journal of Analytical Atomic Spectrometry
123456789101112131415161718192021222324252627282930313233343536373839404142434445464748495051525354555657585960
Jour
nalo
fAna
lytic
alA
tom
icS
pect
rom
etry
Acc
epte
dM
anus
crip
t
Publ
ishe
d on
03
Janu
ary
2018
. Dow
nloa
ded
by G
azi U
nive
rsite
si o
n 04
/01/
2018
17:
19:4
1.
View Article OnlineDOI: 10.1039/C7JA00331E
ARTICLE Journal Name
4 | J. Name., 2012, 00, 1-3 This journal is © The Royal Society of Chemistry 20xx
Please do not adjust margins
Please do not adjust margins
approach used. Hereinafter all the obtained spectra are
presented in the normalized form.
3. Results and discussion
3.1 Spectra features related to the film form of the sample
One of the key factors that determine efficiency of use of
LIBS technique for analysis of nanocarbon materials chemical
composition is the form of the studied samples. Preparation of
cylindrical pellets with thickness of up to several millimetres by
pressing powder of the analyzed sample, the technique that is
commonly used in LIBS measurements24
, requires large
amount of the studied material, making this approach rather
inconvenient in the case of nanocarbon structures. At the
same time, formation of thin films with thickness of 10-100 nm
from graphene oxide, graphene or detonation nanodiamonds
on various substrates is quite common procedure that requires
only small amount of the corresponding nanocarbon material.
Furthermore, most of the nanodiamond- and graphene-based
optoelectronic devices that are designed nowadays25
are
mainly based on coatings, obtained from the corresponding
nanocarbon material, and determination of their chemical
composition in-situ is of a high interest. Thus, LIBS study of
nanocarbon materials in the form of films on a certain
substrate instead of pellets appears to be the most
appropriate approach. However, several challenges arise in
this case as was observed, resulting in necessity of additional
adjustment of energy parameters of the applied laser pulses
and spectra processing to obtain informative and
representative spectra.
Considering small thickness of the assayed sample, along with
fragmentation of the studied film ablation of the wafer under
it may proceed as well. This will lead to modification of the
obtained plasma emission spectra in an undesirable way due
to contribution of the components, released from the
substrate. To prevent this, several preliminary experiments
were carried out to adjust energy of the applied laser pulses so
it would be both over the plasma formation threshold for the
studied film and less than ablation threshold for the used
wafers, namely quartz and silicon. Reduction of the laser pulse
energy to the minimum level also provides decrease in
thickness of the layer of the sample that is ablated by single
laser pulse to the values that are less than total thickness of
the studied GO, rGO or DND film, additionally preventing
ablation of the wafer during first pulses. For whole set of the
studied films the minimal laser pulse energy, optimal for
obtaining informative plasma emission spectra, was estimated
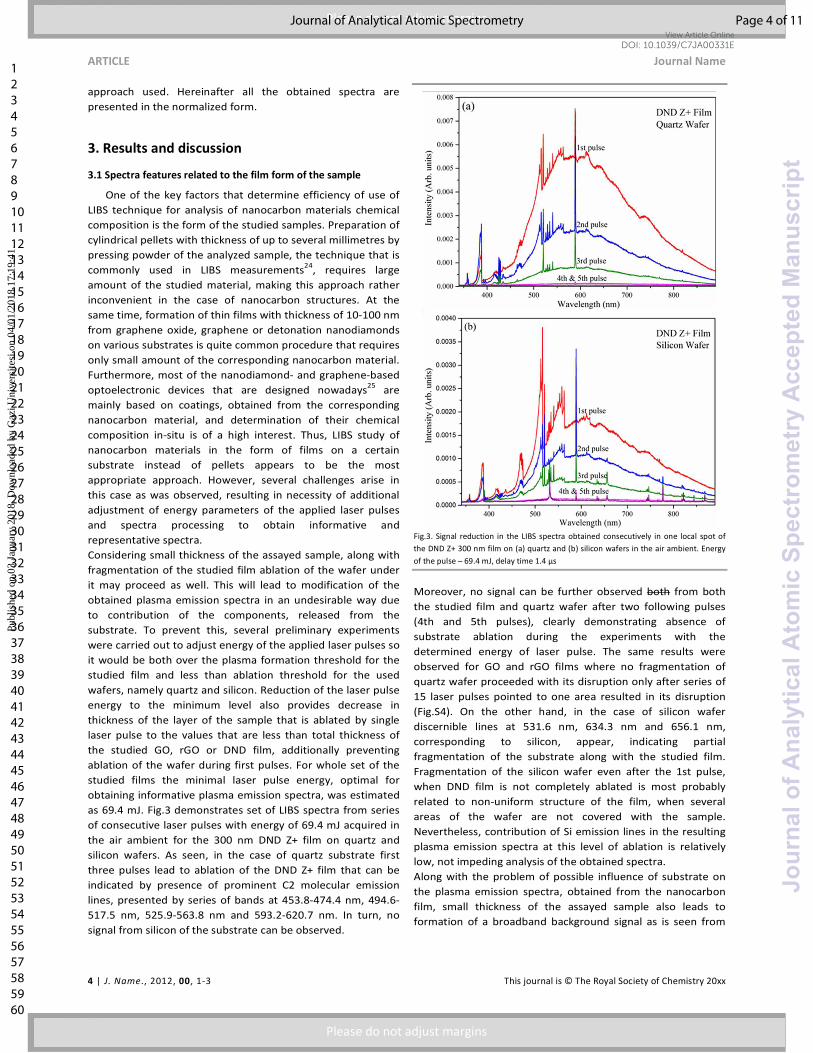
as 69.4 mJ. Fig.3 demonstrates set of LIBS spectra from series
of consecutive laser pulses with energy of 69.4 mJ acquired in
the air ambient for the 300 nm DND Z+ film on quartz and
silicon wafers. As seen, in the case of quartz substrate first
three pulses lead to ablation of the DND Z+ film that can be
indicated by presence of prominent C2 molecular emission
lines, presented by series of bands at 453.8-474.4 nm, 494.6-
517.5 nm, 525.9-563.8 nm and 593.2-620.7 nm. In turn, no
signal from silicon of the substrate can be observed.
Fig.3. Signal reduction in the LIBS spectra obtained consecutively in one local spot of
the DND Z+ 300 nm film on (a) quartz and (b) silicon wafers in the air ambient. Energy
of the pulse – 69.4 mJ, delay time 1.4 μs
Moreover, no signal can be further observed both from both
the studied film and quartz wafer after two following pulses
(4th and 5th pulses), clearly demonstrating absence of
substrate ablation during the experiments with the
determined energy of laser pulse. The same results were
observed for GO and rGO films where no fragmentation of
quartz wafer proceeded with its disruption only after series of
15 laser pulses pointed to one area resulted in its disruption
(Fig.S4). On the other hand, in the case of silicon wafer
discernible lines at 531.6 nm, 634.3 nm and 656.1 nm,
corresponding to silicon, appear, indicating partial
fragmentation of the substrate along with the studied film.
Fragmentation of the silicon wafer even after the 1st pulse,
when DND film is not completely ablated is most probably
related to non-uniform structure of the film, when several
areas of the wafer are not covered with the sample.
Nevertheless, contribution of Si emission lines in the resulting
plasma emission spectra at this level of ablation is relatively
low, not impeding analysis of the obtained spectra.
Along with the problem of possible influence of substrate on
the plasma emission spectra, obtained from the nanocarbon
film, small thickness of the assayed sample also leads to
formation of a broadband background signal as is seen from
Page 4 of 11Journal of Analytical Atomic Spectrometry
123456789101112131415161718192021222324252627282930313233343536373839404142434445464748495051525354555657585960
Jour
nalo
fAna
lytic
alA
tom
icS
pect
rom
etry
Acc
epte
dM
anus
crip
t
Publ
ishe
d on
03
Janu
ary
2018
. Dow
nloa
ded
by G
azi U
nive
rsite
si o
n 04
/01/
2018
17:
19:4
1.
View Article OnlineDOI: 10.1039/C7JA00331E
Journal Name ARTICLE
This journal is © The Royal Society of Chemistry 20xx J. Name., 2013, 00, 1-3 | 5
Please do not adjust margins
Please do not adjust margins
Fig.3 for DND Z+, which intensity reduces simultaneously with
fragmentation of the film. Since the presented spectra were
obtained with delay time of 1.4 μs it is unlikely that this
background signal originate from the inverse bremsstrahlung
radiation that dominates in the plasma emission spectra
during first hundreds of nanoseconds after the plasma plume
formation. At larger times, significant reduction in the overall
intensity of the inverse bremsstrahlung radiation happens.
Moreover, intensity of the observed background signal
depends on the thickness of the studied sample what is
demonstrated by comparison of LIBS spectra acquired for rGO
film (thickness of 100 nm) and 1 mm pellet of HOPG (Fig.S5),
where background signal cannot be observed for the latter one
with its presence in rGO spectra. Considering that reduction in
the film thickness results in simultaneous decrease of its
thermal conductivity and taking in account shape of the
background signal it was suggested that presence of
broadband background in the as-obtained spectra does
originate from thermal emission of the film and nanocarbon
clusters, namely individual graphene or graphene oxide
platelets and nanodiamond particles, directly ablated from the
assayed film. This assumption is further supported by the fact
that the observed background signal has several times higher
intensity in the spectra of DND films that have lower thermal
conductivity due to high number of interparticle interfaces in
comparison to rGO films, where value of in-plane thermal
conductivity is quite high.
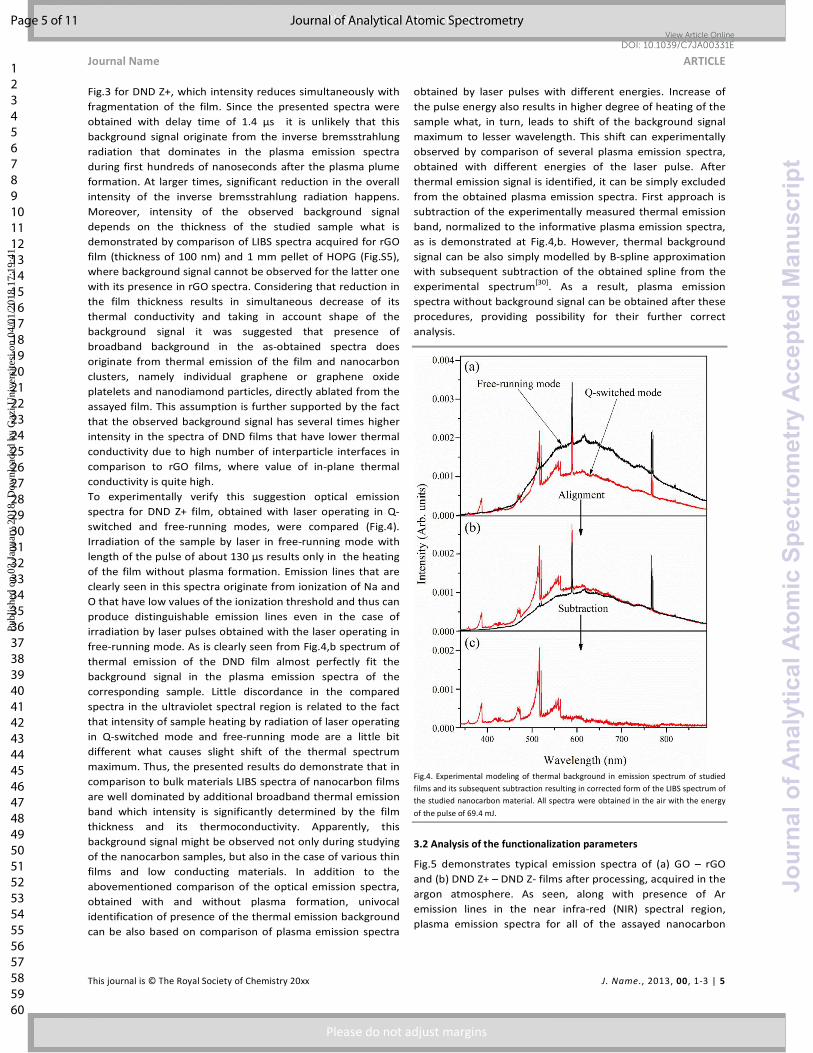
To experimentally verify this suggestion optical emission
spectra for DND Z+ film, obtained with laser operating in Q-
switched and free-running modes, were compared (Fig.4).
Irradiation of the sample by laser in free-running mode with
length of the pulse of about 130 μs results only in the heating
of the film without plasma formation. Emission lines that are
clearly seen in this spectra originate from ionization of Na and
O that have low values of the ionization threshold and thus can
produce distinguishable emission lines even in the case of
irradiation by laser pulses obtained with the laser operating in
free-running mode. As is clearly seen from Fig.4,b spectrum of
thermal emission of the DND film almost perfectly fit the
background signal in the plasma emission spectra of the
corresponding sample. Little discordance in the compared
spectra in the ultraviolet spectral region is related to the fact
that intensity of sample heating by radiation of laser operating
in Q-switched mode and free-running mode are a little bit
different what causes slight shift of the thermal spectrum
maximum. Thus, the presented results do demonstrate that in
comparison to bulk materials LIBS spectra of nanocarbon films
are well dominated by additional broadband thermal emission
band which intensity is significantly determined by the film
thickness and its thermoconductivity. Apparently, this
background signal might be observed not only during studying
of the nanocarbon samples, but also in the case of various thin
films and low conducting materials. In addition to the
abovementioned comparison of the optical emission spectra,
obtained with and without plasma formation, univocal
identification of presence of the thermal emission background
can be also based on comparison of plasma emission spectra
obtained by laser pulses with different energies. Increase of
the pulse energy also results in higher degree of heating of the
sample what, in turn, leads to shift of the background signal
maximum to lesser wavelength. This shift can experimentally
observed by comparison of several plasma emission spectra,
obtained with different energies of the laser pulse. After
thermal emission signal is identified, it can be simply excluded
from the obtained plasma emission spectra. First approach is
subtraction of the experimentally measured thermal emission
band, normalized to the informative plasma emission spectra,
as is demonstrated at Fig.4,b. However, thermal background
signal can be also simply modelled by B-spline approximation
with subsequent subtraction of the obtained spline from the
experimental spectrum[30]
. As a result, plasma emission
spectra without background signal can be obtained after these
procedures, providing possibility for their further correct
analysis.
Fig.4. Experimental modeling of thermal background in emission spectrum of studied
films and its subsequent subtraction resulting in corrected form of the LIBS spectrum of
the studied nanocarbon material. All spectra were obtained in the air with the energy
of the pulse of 69.4 mJ.
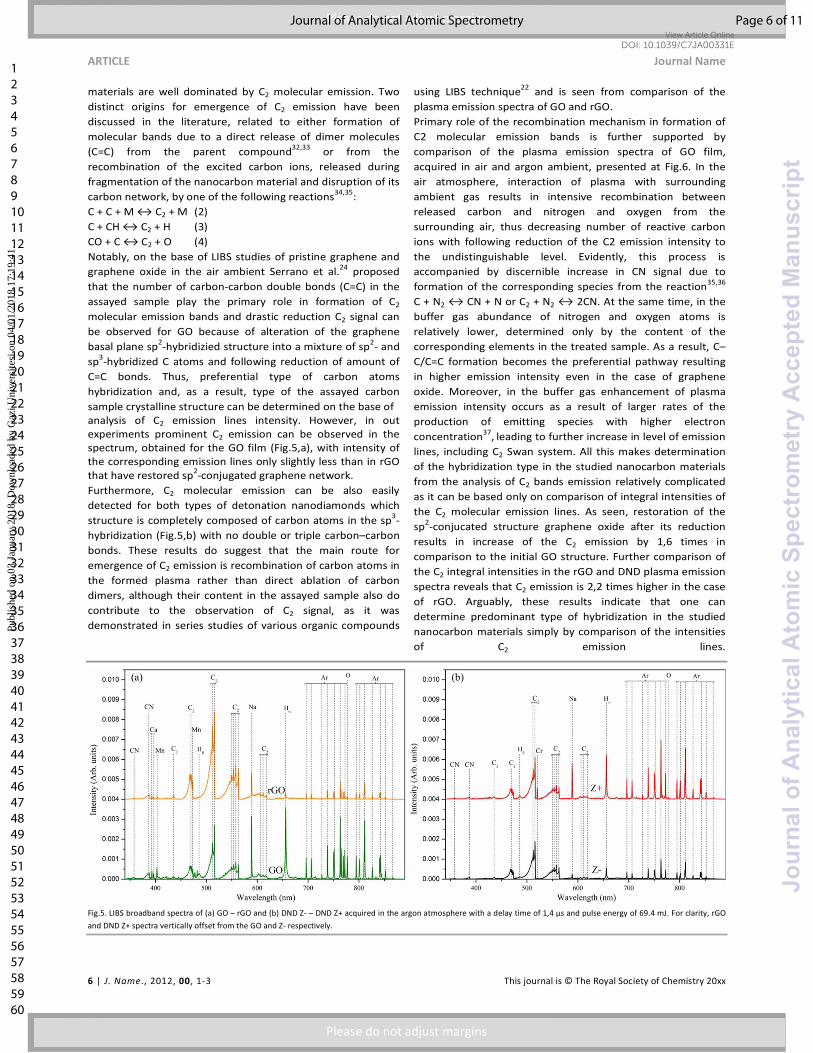
3.2 Analysis of the functionalization parameters
Fig.5 demonstrates typical emission spectra of (a) GO – rGO
and (b) DND Z+ – DND Z- films after processing, acquired in the
argon atmosphere. As seen, along with presence of Ar
emission lines in the near infra-red (NIR) spectral region,
plasma emission spectra for all of the assayed nanocarbon
Page 5 of 11 Journal of Analytical Atomic Spectrometry
123456789101112131415161718192021222324252627282930313233343536373839404142434445464748495051525354555657585960
Jour
nalo
fAna
lytic
alA
tom
icS
pect
rom
etry
Acc
epte
dM
anus
crip
t
Publ
ishe
d on
03
Janu
ary
2018
. Dow
nloa
ded
by G
azi U
nive
rsite
si o
n 04
/01/
2018
17:
19:4
1.
View Article OnlineDOI: 10.1039/C7JA00331E
ARTICLE Journal Name
6 | J. Name., 2012, 00, 1-3 This journal is © The Royal Society of Chemistry 20xx
Please do not adjust margins
Please do not adjust margins
materials are well dominated by C2 molecular emission. Two
distinct origins for emergence of C2 emission have been
discussed in the literature, related to either formation of
molecular bands due to a direct release of dimer molecules
(C=C) from the parent compound32,33
or from the
recombination of the excited carbon ions, released during
fragmentation of the nanocarbon material and disruption of its
carbon network, by one of the following reactions34,35
:
C + C + M ↔ C2 + M (2)
C + CH ↔ C2 + H (3)
CO + C ↔ C2 + O (4)
Notably, on the base of LIBS studies of pristine graphene and
graphene oxide in the air ambient Serrano et al.24
proposed
that the number of carbon-carbon double bonds (C=C) in the
assayed sample play the primary role in formation of C2
molecular emission bands and drastic reduction C2 signal can
be observed for GO because of alteration of the graphene
basal plane sp2-hybridizied structure into a mixture of sp
2- and
sp3-hybridized C atoms and following reduction of amount of
C=C bonds. Thus, preferential type of carbon atoms
hybridization and, as a result, type of the assayed carbon
sample crystalline structure can be determined on the base of
analysis of C2 emission lines intensity. However, in out
experiments prominent C2 emission can be observed in the
spectrum, obtained for the GO film (Fig.5,a), with intensity of
the corresponding emission lines only slightly less than in rGO
that have restored sp2-conjugated graphene network.
Furthermore, C2 molecular emission can be also easily
detected for both types of detonation nanodiamonds which
structure is completely composed of carbon atoms in the sp3-
hybridization (Fig.5,b) with no double or triple carbon–carbon
bonds. These results do suggest that the main route for
emergence of C2 emission is recombination of carbon atoms in
the formed plasma rather than direct ablation of carbon
dimers, although their content in the assayed sample also do
contribute to the observation of C2 signal, as it was
demonstrated in series studies of various organic compounds
using LIBS technique22
and is seen from comparison of the
plasma emission spectra of GO and rGO.
Primary role of the recombination mechanism in formation of
C2 molecular emission bands is further supported by
comparison of the plasma emission spectra of GO film,
acquired in air and argon ambient, presented at Fig.6. In the
air atmosphere, interaction of plasma with surrounding
ambient gas results in intensive recombination between
released carbon and nitrogen and oxygen from the
surrounding air, thus decreasing number of reactive carbon
ions with following reduction of the C2 emission intensity to
the undistinguishable level. Evidently, this process is
accompanied by discernible increase in CN signal due to
formation of the corresponding species from the reaction35,36
C + N2 ↔ CN + N or C2 + N2 ↔ 2CN. At the same time, in the
buffer gas abundance of nitrogen and oxygen atoms is
relatively lower, determined only by the content of the
corresponding elements in the treated sample. As a result, C–
C/C=C formation becomes the preferential pathway resulting
in higher emission intensity even in the case of graphene
oxide. Moreover, in the buffer gas enhancement of plasma
emission intensity occurs as a result of larger rates of the
production of emitting species with higher electron
concentration37
, leading to further increase in level of emission
lines, including C2 Swan system. All this makes determination
of the hybridization type in the studied nanocarbon materials
from the analysis of C2 bands emission relatively complicated
as it can be based only on comparison of integral intensities of
the C2 molecular emission lines. As seen, restoration of the
sp2-conjucated structure graphene oxide after its reduction
results in increase of the C2 emission by 1,6 times in
comparison to the initial GO structure. Further comparison of
the C2 integral intensities in the rGO and DND plasma emission
spectra reveals that C2 emission is 2,2 times higher in the case
of rGO. Arguably, these results indicate that one can
determine predominant type of hybridization in the studied
nanocarbon materials simply by comparison of the intensities
of C2 emission lines.
Fig.5. LIBS broadband spectra of (a) GO – rGO and (b) DND Z- – DND Z+ acquired in the argon atmosphere with a delay time of 1,4 μs and pulse energy of 69.4 mJ. For clarity, rGO
and DND Z+ spectra vertically offset from the GO and Z- respectively.
Page 6 of 11Journal of Analytical Atomic Spectrometry
123456789101112131415161718192021222324252627282930313233343536373839404142434445464748495051525354555657585960
Jour
nalo
fAna
lytic
alA
tom
icS
pect
rom
etry
Acc
epte
dM
anus
crip
t
Publ
ishe
d on
03
Janu
ary
2018
. Dow
nloa
ded
by G
azi U
nive
rsite
si o
n 04
/01/
2018
17:
19:4
1.
View Article OnlineDOI: 10.1039/C7JA00331E
Journal Name ARTICLE
This journal is © The Royal Society of Chemistry 20xx J. Name., 2013, 00, 1-3 | 7
Please do not adjust margins
Please do not adjust margins
Please do not adjust margins
However, parameters of ablation of various types of the
nanocarbon materials are significantly distinct and the
observed difference in C2 signals for the rGO and DND can also
arise due to this factor. Thus, additional information about the
ablation of the specific types of the assayed nanocarbon
materials is needed for evident differentiation of the
nanocarbon structures with distinct types of hybridization.
Alternatively, one of the other approaches can be based on
the analysis of plasma emission spectra in the air or another
chemically reactive atmosphere. In this case formation of C2
signal due to recombination of carbon ions will be suppressed
and the observed C2 emission lines will originate only from C=C
bonds that is a characteristic sign of sp2 type of conjugation.
However, further study is needed to verify this assertion,
although it coincides with results of J.Serrano et al.24
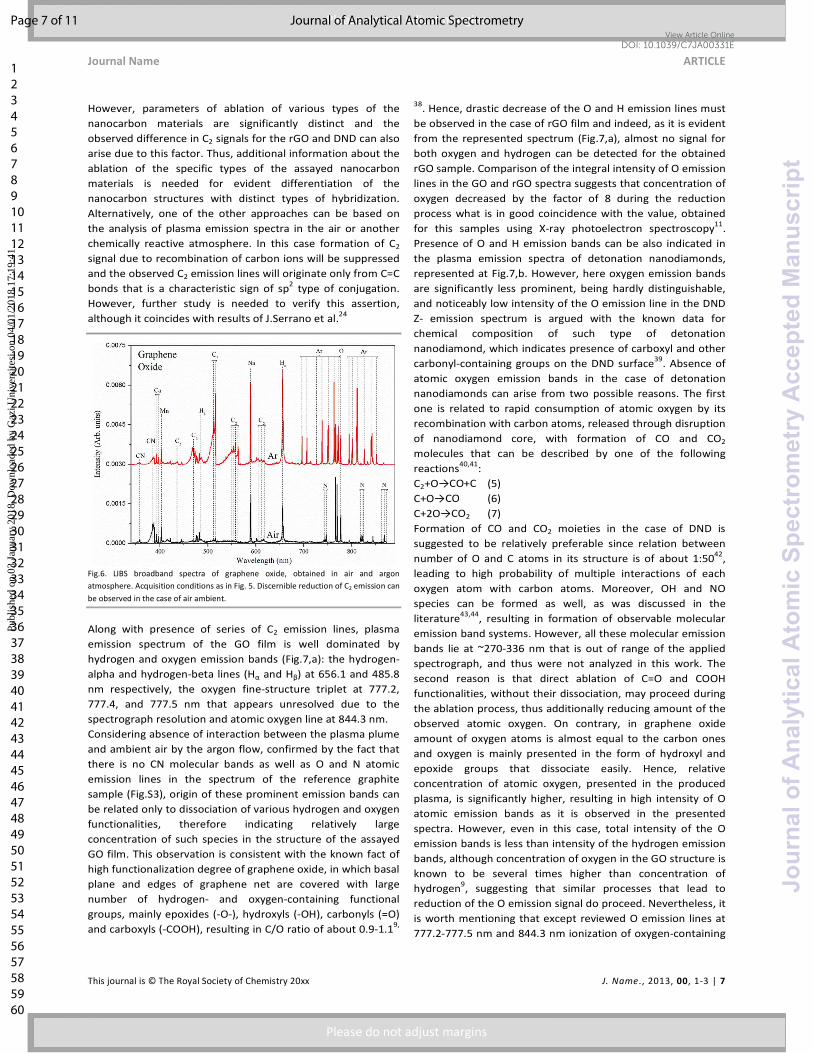
Fig.6. LIBS broadband spectra of graphene oxide, obtained in air and argon
atmosphere. Acquisition conditions as in Fig. 5. Discernible reduction of C2 emission can
be observed in the case of air ambient.
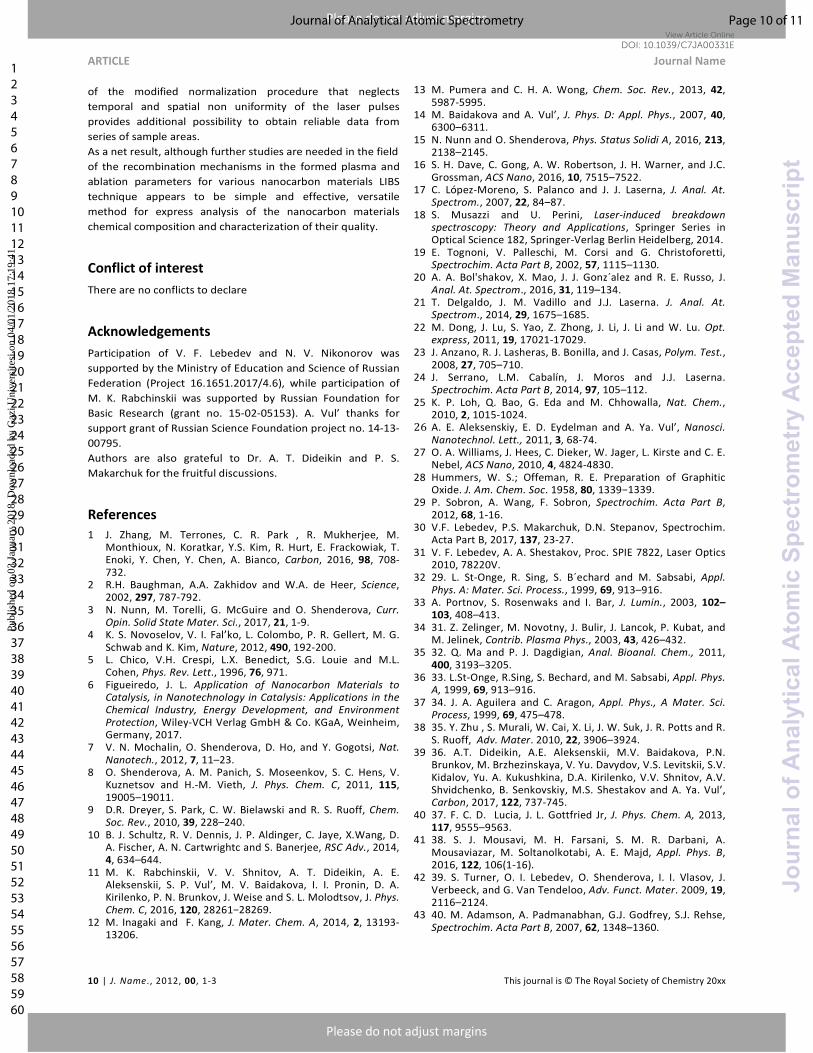
Along with presence of series of C2 emission lines, plasma
emission spectrum of the GO film is well dominated by
hydrogen and oxygen emission bands (Fig.7,a): the hydrogen-
alpha and hydrogen-beta lines (Hα and Hβ) at 656.1 and 485.8
nm respectively, the oxygen fine-structure triplet at 777.2,
777.4, and 777.5 nm that appears unresolved due to the
spectrograph resolution and atomic oxygen line at 844.3 nm.
Considering absence of interaction between the plasma plume
and ambient air by the argon flow, confirmed by the fact that
there is no CN molecular bands as well as O and N atomic
emission lines in the spectrum of the reference graphite
sample (Fig.S3), origin of these prominent emission bands can
be related only to dissociation of various hydrogen and oxygen
functionalities, therefore indicating relatively large
concentration of such species in the structure of the assayed
GO film. This observation is consistent with the known fact of
high functionalization degree of graphene oxide, in which basal
plane and edges of graphene net are covered with large
number of hydrogen- and oxygen-containing functional
groups, mainly epoxides (-O-), hydroxyls (-OH), carbonyls (=O)
and carboxyls (-COOH), resulting in C/O ratio of about 0.9-1.19,
38. Hence, drastic decrease of the O and H emission lines must
be observed in the case of rGO film and indeed, as it is evident
from the represented spectrum (Fig.7,a), almost no signal for
both oxygen and hydrogen can be detected for the obtained
rGO sample. Comparison of the integral intensity of O emission
lines in the GO and rGO spectra suggests that concentration of
oxygen decreased by the factor of 8 during the reduction
process what is in good coincidence with the value, obtained
for this samples using X-ray photoelectron spectroscopy11
.
Presence of O and H emission bands can be also indicated in
the plasma emission spectra of detonation nanodiamonds,
represented at Fig.7,b. However, here oxygen emission bands
are significantly less prominent, being hardly distinguishable,
and noticeably low intensity of the O emission line in the DND
Z- emission spectrum is argued with the known data for
chemical composition of such type of detonation
nanodiamond, which indicates presence of carboxyl and other
carbonyl-containing groups on the DND surface39
. Absence of
atomic oxygen emission bands in the case of detonation
nanodiamonds can arise from two possible reasons. The first
one is related to rapid consumption of atomic oxygen by its
recombination with carbon atoms, released through disruption
of nanodiamond core, with formation of CO and CO2
molecules that can be described by one of the following
reactions40,41
:
C2+O→CO+C (5)
C+O→CO (6)
C+2O→CO2 (7)
Formation of CO and CO2 moieties in the case of DND is
suggested to be relatively preferable since relation between
number of O and C atoms in its structure is of about 1:5042
,
leading to high probability of multiple interactions of each
oxygen atom with carbon atoms. Moreover, OH and NO
species can be formed as well, as was discussed in the
literature43,44
, resulting in formation of observable molecular
emission band systems. However, all these molecular emission
bands lie at ~270-336 nm that is out of range of the applied
spectrograph, and thus were not analyzed in this work. The
second reason is that direct ablation of C=O and COOH
functionalities, without their dissociation, may proceed during
the ablation process, thus additionally reducing amount of the
observed atomic oxygen. On contrary, in graphene oxide
amount of oxygen atoms is almost equal to the carbon ones
and oxygen is mainly presented in the form of hydroxyl and
epoxide groups that dissociate easily. Hence, relative
concentration of atomic oxygen, presented in the produced
plasma, is significantly higher, resulting in high intensity of O
atomic emission bands as it is observed in the presented
spectra. However, even in this case, total intensity of the O
emission bands is less than intensity of the hydrogen emission
bands, although concentration of oxygen in the GO structure is
known to be several times higher than concentration of
hydrogen9, suggesting that similar processes that lead to
reduction of the O emission signal do proceed. Nevertheless, it
is worth mentioning that except reviewed O emission lines at
777.2-777.5 nm and 844.3 nm ionization of oxygen-containing
Page 7 of 11 Journal of Analytical Atomic Spectrometry
123456789101112131415161718192021222324252627282930313233343536373839404142434445464748495051525354555657585960
Jour
nalo
fAna
lytic
alA
tom
icS
pect
rom
etry
Acc
epte
dM
anus
crip
t
Publ
ishe
d on
03
Janu
ary
2018
. Dow
nloa
ded
by G
azi U
nive
rsite
si o
n 04
/01/
2018
17:
19:4
1.
View Article OnlineDOI: 10.1039/C7JA00331E
ARTICLE Journal Name
8 | J. Name., 2012, 00, 1-3 This journal is © The Royal Society of Chemistry 20xx
Please do not adjust margins
Please do not adjust margins
species also should result in formation of series of O atomic
emission lines in the deep UV and NIR spectral regions, in
particular at 241.7-241.8 nm, 261.7-262.3 nm, 332.02-327.9
nm and 926.1-926.8nm, 948.1-948.7 nm, 950.6-952.8 nm that
cannot be detected in this work. Thus, total integral intensity
of the O atomic lines is actually higher what additionally
explains the observed discordance in O/H ratio in DND and GO
samples.
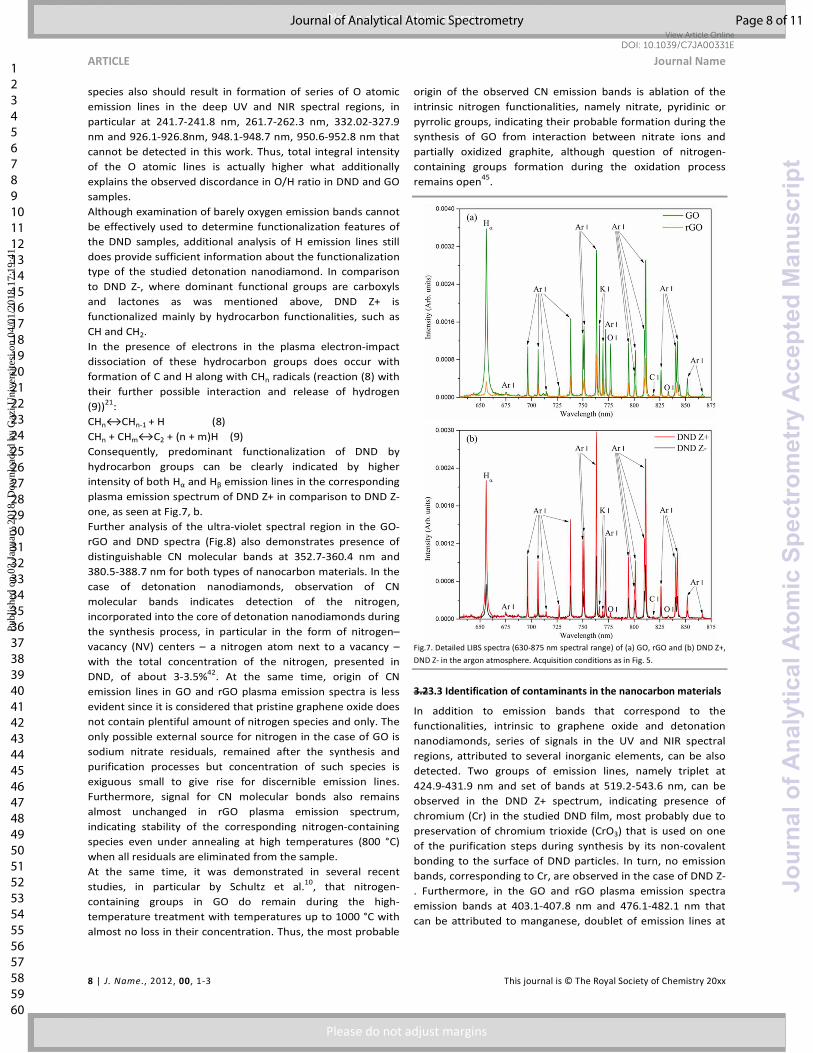
Although examination of barely oxygen emission bands cannot
be effectively used to determine functionalization features of
the DND samples, additional analysis of H emission lines still
does provide sufficient information about the functionalization
type of the studied detonation nanodiamond. In comparison
to DND Z-, where dominant functional groups are carboxyls
and lactones as was mentioned above, DND Z+ is
functionalized mainly by hydrocarbon functionalities, such as
CH and CH2.
In the presence of electrons in the plasma electron-impact
dissociation of these hydrocarbon groups does occur with
formation of C and H along with CHn radicals (reaction (8) with
their further possible interaction and release of hydrogen
(9))21
:
CHn↔CHn-1 + H (8)
CHn + CHm↔C2 + (n + m)H (9)
Consequently, predominant functionalization of DND by
hydrocarbon groups can be clearly indicated by higher
intensity of both Hα and Hβ emission lines in the corresponding
plasma emission spectrum of DND Z+ in comparison to DND Z-
one, as seen at Fig.7, b.
Further analysis of the ultra-violet spectral region in the GO-
rGO and DND spectra (Fig.8) also demonstrates presence of
distinguishable CN molecular bands at 352.7-360.4 nm and
380.5-388.7 nm for both types of nanocarbon materials. In the
case of detonation nanodiamonds, observation of CN
molecular bands indicates detection of the nitrogen,
incorporated into the core of detonation nanodiamonds during
the synthesis process, in particular in the form of nitrogen–
vacancy (NV) centers – a nitrogen atom next to a vacancy –
with the total concentration of the nitrogen, presented in
DND, of about 3-3.5%42
. At the same time, origin of CN
emission lines in GO and rGO plasma emission spectra is less
evident since it is considered that pristine graphene oxide does
not contain plentiful amount of nitrogen species and only. The
only possible external source for nitrogen in the case of GO is
sodium nitrate residuals, remained after the synthesis and
purification processes but concentration of such species is
exiguous small to give rise for discernible emission lines.
Furthermore, signal for CN molecular bonds also remains
almost unchanged in rGO plasma emission spectrum,
indicating stability of the corresponding nitrogen-containing
species even under annealing at high temperatures (800 °C)
when all residuals are eliminated from the sample.
At the same time, it was demonstrated in several recent
studies, in particular by Schultz et al.10
, that nitrogen-
containing groups in GO do remain during the high-
temperature treatment with temperatures up to 1000 °C with
almost no loss in their concentration. Thus, the most probable
origin of the observed CN emission bands is ablation of the
intrinsic nitrogen functionalities, namely nitrate, pyridinic or
pyrrolic groups, indicating their probable formation during the
synthesis of GO from interaction between nitrate ions and
partially oxidized graphite, although question of nitrogen-
containing groups formation during the oxidation process
remains open45
.
Fig.7. Detailed LIBS spectra (630-875 nm spectral range) of (a) GO, rGO and (b) DND Z+,
DND Z- in the argon atmosphere. Acquisition conditions as in Fig. 5.
3.23.3 Identification of contaminants in the nanocarbon materials
In addition to emission bands that correspond to the
functionalities, intrinsic to graphene oxide and detonation
nanodiamonds, series of signals in the UV and NIR spectral
regions, attributed to several inorganic elements, can be also
detected. Two groups of emission lines, namely triplet at
424.9-431.9 nm and set of bands at 519.2-543.6 nm, can be
observed in the DND Z+ spectrum, indicating presence of
chromium (Cr) in the studied DND film, most probably due to
preservation of chromium trioxide (CrO3) that is used on one
of the purification steps during synthesis by its non-covalent
bonding to the surface of DND particles. In turn, no emission
bands, corresponding to Cr, are observed in the case of DND Z-
. Furthermore, in the GO and rGO plasma emission spectra
emission bands at 403.1-407.8 nm and 476.1-482.1 nm that
can be attributed to manganese, doublet of emission lines at
Page 8 of 11Journal of Analytical Atomic Spectrometry
123456789101112131415161718192021222324252627282930313233343536373839404142434445464748495051525354555657585960
Jour
nalo
fAna
lytic
alA
tom
icS
pect
rom
etry
Acc
epte
dM
anus
crip
t
Publ
ishe
d on
03
Janu
ary
2018
. Dow
nloa
ded
by G
azi U
nive
rsite
si o
n 04
/01/
2018
17:
19:4
1.
View Article OnlineDOI: 10.1039/C7JA00331E
Journal Name ARTICLE
This journal is © The Royal Society of Chemistry 20xx J. Name., 2013, 00, 1-3 | 9
Please do not adjust margins
Please do not adjust margins
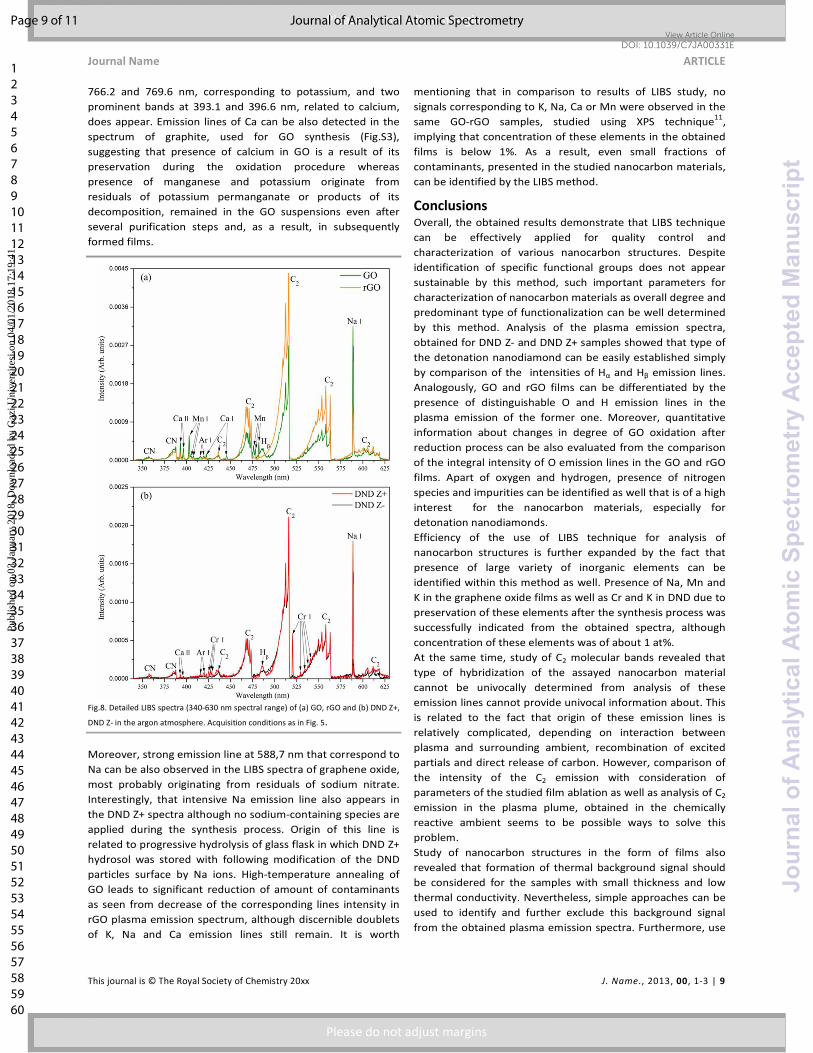
766.2 and 769.6 nm, corresponding to potassium, and two
prominent bands at 393.1 and 396.6 nm, related to calcium,
does appear. Emission lines of Ca can be also detected in the
spectrum of graphite, used for GO synthesis (Fig.S3),
suggesting that presence of calcium in GO is a result of its
preservation during the oxidation procedure whereas
presence of manganese and potassium originate from
residuals of potassium permanganate or products of its
decomposition, remained in the GO suspensions even after
several purification steps and, as a result, in subsequently
formed films.
Fig.8. Detailed LIBS spectra (340-630 nm spectral range) of (a) GO, rGO and (b) DND Z+,
DND Z- in the argon atmosphere. Acquisition conditions as in Fig. 5.
Moreover, strong emission line at 588,7 nm that correspond to
Na can be also observed in the LIBS spectra of graphene oxide,
most probably originating from residuals of sodium nitrate.
Interestingly, that intensive Na emission line also appears in
the DND Z+ spectra although no sodium-containing species are
applied during the synthesis process. Origin of this line is
related to progressive hydrolysis of glass flask in which DND Z+
hydrosol was stored with following modification of the DND
particles surface by Na ions. High-temperature annealing of
GO leads to significant reduction of amount of contaminants
as seen from decrease of the corresponding lines intensity in
rGO plasma emission spectrum, although discernible doublets
of K, Na and Ca emission lines still remain. It is worth
mentioning that in comparison to results of LIBS study, no
signals corresponding to K, Na, Ca or Mn were observed in the
same GO-rGO samples, studied using XPS technique11
,
implying that concentration of these elements in the obtained
films is below 1%. As a result, even small fractions of
contaminants, presented in the studied nanocarbon materials,
can be identified by the LIBS method.
Conclusions Overall, the obtained results demonstrate that LIBS technique
can be effectively applied for quality control and
characterization of various nanocarbon structures. Despite
identification of specific functional groups does not appear
sustainable by this method, such important parameters for
characterization of nanocarbon materials as overall degree and
predominant type of functionalization can be well determined
by this method. Analysis of the plasma emission spectra,
obtained for DND Z- and DND Z+ samples showed that type of
the detonation nanodiamond can be easily established simply
by comparison of the intensities of Hα and Hβ emission lines.
Analogously, GO and rGO films can be differentiated by the
presence of distinguishable O and H emission lines in the
plasma emission of the former one. Moreover, quantitative
information about changes in degree of GO oxidation after
reduction process can be also evaluated from the comparison
of the integral intensity of O emission lines in the GO and rGO
films. Apart of oxygen and hydrogen, presence of nitrogen
species and impurities can be identified as well that is of a high
interest for the nanocarbon materials, especially for
detonation nanodiamonds.
Efficiency of the use of LIBS technique for analysis of
nanocarbon structures is further expanded by the fact that
presence of large variety of inorganic elements can be
identified within this method as well. Presence of Na, Mn and
K in the graphene oxide films as well as Cr and K in DND due to
preservation of these elements after the synthesis process was
successfully indicated from the obtained spectra, although
concentration of these elements was of about 1 at%.
At the same time, study of C2 molecular bands revealed that
type of hybridization of the assayed nanocarbon material
cannot be univocally determined from analysis of these
emission lines cannot provide univocal information about. This
is related to the fact that origin of these emission lines is
relatively complicated, depending on interaction between
plasma and surrounding ambient, recombination of excited
partials and direct release of carbon. However, comparison of
the intensity of the C2 emission with consideration of
parameters of the studied film ablation as well as analysis of C2
emission in the plasma plume, obtained in the chemically
reactive ambient seems to be possible ways to solve this
problem.
Study of nanocarbon structures in the form of films also
revealed that formation of thermal background signal should
be considered for the samples with small thickness and low
thermal conductivity. Nevertheless, simple approaches can be
used to identify and further exclude this background signal
from the obtained plasma emission spectra. Furthermore, use
Page 9 of 11 Journal of Analytical Atomic Spectrometry
123456789101112131415161718192021222324252627282930313233343536373839404142434445464748495051525354555657585960
Jour
nalo
fAna
lytic
alA
tom
icS
pect
rom
etry
Acc
epte
dM
anus
crip
t
Publ
ishe
d on
03
Janu
ary
2018
. Dow
nloa
ded
by G
azi U
nive
rsite
si o
n 04
/01/
2018
17:
19:4
1.
View Article OnlineDOI: 10.1039/C7JA00331E
ARTICLE Journal Name
10 | J. Name., 2012, 00, 1-3 This journal is © The Royal Society of Chemistry 20xx
Please do not adjust margins
Please do not adjust margins
of the modified normalization procedure that neglects
temporal and spatial non uniformity of the laser pulses
provides additional possibility to obtain reliable data from
series of sample areas.
As a net result, although further studies are needed in the field
of the recombination mechanisms in the formed plasma and
ablation parameters for various nanocarbon materials LIBS
technique appears to be simple and effective, versatile
method for express analysis of the nanocarbon materials
chemical composition and characterization of their quality.
Conflict of interest
There are no conflicts to declare
Acknowledgements
Participation of V. F. Lebedev and N. V. Nikonorov was
supported by the Ministry of Education and Science of Russian
Federation (Project 16.1651.2017/4.6), while participation of
M. K. Rabchinskii was supported by Russian Foundation for
Basic Research (grant no. 15-02-05153). A. Vul’ thanks for
support grant of Russian Science Foundation project no. 14-13-
00795.
Authors are also grateful to Dr. A. T. Dideikin and P. S.
Makarchuk for the fruitful discussions.
References
1 J. Zhang, M. Terrones, C. R. Park , R. Mukherjee, M. Monthioux, N. Koratkar, Y.S. Kim, R. Hurt, E. Frackowiak, T. Enoki, Y. Chen, Y. Chen, A. Bianco, Carbon, 2016, 98, 708-
732. 2 R.H. Baughman, A.A. Zakhidov and W.A. de Heer, Science,
2002, 297, 787-792.
3 N. Nunn, M. Torelli, G. McGuire and O. Shenderova, Curr.
Opin. Solid State Mater. Sci., 2017, 21, 1-9. 4 K. S. Novoselov, V. I. Fal’ko, L. Colombo, P. R. Gellert, M. G.
Schwab and K. Kim, Nature, 2012, 490, 192-200. 5 L. Chico, V.H. Crespi, L.X. Benedict, S.G. Louie and M.L.
Cohen, Phys. Rev. Lett., 1996, 76, 971.
6 Figueiredo, J. L. Application of Nanocarbon Materials to
Catalysis, in Nanotechnology in Catalysis: Applications in the
Chemical Industry, Energy Development, and Environment
Protection, Wiley-VCH Verlag GmbH & Co. KGaA, Weinheim, Germany, 2017.
7 V. N. Mochalin, O. Shenderova, D. Ho, and Y. Gogotsi, Nat.
Nanotech., 2012, 7, 11–23. 8 O. Shenderova, A. M. Panich, S. Moseenkov, S. C. Hens, V.
Kuznetsov and H.-M. Vieth, J. Phys. Chem. C, 2011, 115,
19005–19011. 9 D.R. Dreyer, S. Park, C. W. Bielawski and R. S. Ruoff, Chem.
Soc. Rev., 2010, 39, 228–240.
10 B. J. Schultz, R. V. Dennis, J. P. Aldinger, C. Jaye, X.Wang, D. A. Fischer, A. N. Cartwrightc and S. Banerjee, RSC Adv., 2014, 4, 634–644.
11 M. K. Rabchinskii, V. V. Shnitov, A. T. Dideikin, A. E. Aleksenskii, S. P. Vul’, M. V. Baidakova, I. I. Pronin, D. A. Kirilenko, P. N. Brunkov, J. Weise and S. L. Molodtsov, J. Phys.
Chem. C, 2016, 120, 28261−28269. 12 M. Inagaki and F. Kang, J. Mater. Chem. A, 2014, 2, 13193-
13206.
13 M. Pumera and C. H. A. Wong, Chem. Soc. Rev., 2013, 42,
5987-5995. 14 M. Baidakova and A. Vul’, J. Phys. D: Appl. Phys., 2007, 40,
6300–6311.
15 N. Nunn and O. Shenderova, Phys. Status Solidi A, 2016, 213, 2138–2145.
16 S. H. Dave, C. Gong, A. W. Robertson, J. H. Warner, and J.C.
Grossman, ACS Nano, 2016, 10, 7515–7522. 17 C. López-Moreno, S. Palanco and J. J. Laserna, J. Anal. At.
Spectrom., 2007, 22, 84–87.
18 S. Musazzi and U. Perini, Laser-induced breakdown
spectroscopy: Theory and Applications, Springer Series in Optical Science 182, Springer-Verlag Berlin Heidelberg, 2014.
19 E. Tognoni, V. Palleschi, M. Corsi and G. Christoforetti, Spectrochim. Acta Part B, 2002, 57, 1115–1130.
20 A. A. Bol'shakov, X. Mao, J. J. Gonz´alez and R. E. Russo, J.
Anal. At. Spectrom., 2016, 31, 119–134. 21 T. Delgaldo, J. M. Vadillo and J.J. Laserna. J. Anal. At.
Spectrom., 2014, 29, 1675–1685.
22 M. Dong, J. Lu, S. Yao, Z. Zhong, J. Li, J. Li and W. Lu. Opt.
express, 2011, 19, 17021-17029. 23 J. Anzano, R. J. Lasheras, B. Bonilla, and J. Casas, Polym. Test.,
2008, 27, 705–710. 24 J. Serrano, L.M. Cabalín, J. Moros and J.J. Laserna.
Spectrochim. Acta Part B, 2014, 97, 105–112.
25 K. P. Loh, Q. Bao, G. Eda and M. Chhowalla, Nat. Chem., 2010, 2, 1015-1024.
26 A. E. Aleksenskiy, E. D. Eydelman and A. Ya. Vul’, Nanosci.
Nanotechnol. Lett., 2011, 3, 68-74. 27 O. A. Williams, J. Hees, C. Dieker, W. Jager, L. Kirste and C. E.
Nebel, ACS Nano, 2010, 4, 4824-4830.
28 Hummers, W. S.; Offeman, R. E. Preparation of Graphitic Oxide. J. Am. Chem. Soc. 1958, 80, 1339−1339.
29 P. Sobron, A. Wang, F. Sobron, Spectrochim. Acta Part B,
2012, 68, 1-16. 30 V.F. Lebedev, P.S. Makarchuk, D.N. Stepanov, Spectrochim.
Acta Part B, 2017, 137, 23-27.
31 V. F. Lebedev, A. A. Shestakov, Proc. SPIE 7822, Laser Optics 2010, 78220V.
32 29. L. St-Onge, R. Sing, S. B´echard and M. Sabsabi, Appl.
Phys. A: Mater. Sci. Process., 1999, 69, 913–916. 33 A. Portnov, S. Rosenwaks and I. Bar, J. Lumin., 2003, 102–
103, 408–413.
34 31. Z. Zelinger, M. Novotny, J. Bulir, J. Lancok, P. Kubat, and M. Jelinek, Contrib. Plasma Phys., 2003, 43, 426–432.
35 32. Q. Ma and P. J. Dagdigian, Anal. Bioanal. Chem., 2011,
400, 3193–3205. 36 33. L.St-Onge, R.Sing, S. Bechard, and M. Sabsabi, Appl. Phys.
A, 1999, 69, 913–916.
37 34. J. A. Aguilera and C. Aragon, Appl. Phys., A Mater. Sci.
Process, 1999, 69, 475–478. 38 35. Y. Zhu , S. Murali, W. Cai, X. Li, J. W. Suk, J. R. Potts and R.
S. Ruoff, Adv. Mater. 2010, 22, 3906–3924. 39 36. A.T. Dideikin, A.E. Aleksenskii, M.V. Baidakova, P.N.
Brunkov, M. Brzhezinskaya, V. Yu. Davydov, V.S. Levitskii, S.V.
Kidalov, Yu. A. Kukushkina, D.A. Kirilenko, V.V. Shnitov, A.V. Shvidchenko, B. Senkovskiy, M.S. Shestakov and A. Ya. Vul’, Carbon, 2017, 122, 737-745.
40 37. F. C. D. Lucia, J. L. Gottfried Jr, J. Phys. Chem. A, 2013, 117, 9555–9563.
41 38. S. J. Mousavi, M. H. Farsani, S. M. R. Darbani, A.
Mousaviazar, M. Soltanolkotabi, A. E. Majd, Appl. Phys. B, 2016, 122, 106(1-16).
42 39. S. Turner, O. I. Lebedev, O. Shenderova, I. I. Vlasov, J.
Verbeeck, and G. Van Tendeloo, Adv. Funct. Mater. 2009, 19, 2116–2124.
43 40. M. Adamson, A. Padmanabhan, G.J. Godfrey, S.J. Rehse,
Spectrochim. Acta Part B, 2007, 62, 1348–1360.
Page 10 of 11Journal of Analytical Atomic Spectrometry
123456789101112131415161718192021222324252627282930313233343536373839404142434445464748495051525354555657585960
Jour
nalo
fAna
lytic
alA
tom
icS
pect
rom
etry
Acc
epte
dM
anus
crip
t
Publ
ishe
d on
03
Janu
ary
2018
. Dow
nloa
ded
by G
azi U
nive
rsite
si o
n 04
/01/
2018
17:
19:4
1.
View Article OnlineDOI: 10.1039/C7JA00331E
Journal Name ARTICLE
This journal is © The Royal Society of Chemistry 20xx J. Name., 2013, 00, 1-3 | 11
Please do not adjust margins
Please do not adjust margins
44 41. R.W.B. Pearse, A.G. Gaydon, The Identification of
Molecular Spectra, Chapman and Hall, London, 1976. 45 42. D. R. Chowdhury, C. Singh and A. Paul, RSC Adv., 2014, 4,
15138–15145.
Page 11 of 11 Journal of Analytical Atomic Spectrometry
123456789101112131415161718192021222324252627282930313233343536373839404142434445464748495051525354555657585960
Jour
nalo
fAna
lytic
alA
tom
icS
pect
rom
etry
Acc
epte
dM
anus
crip
t
Publ
ishe
d on
03
Janu
ary
2018
. Dow
nloa
ded
by G
azi U
nive
rsite
si o
n 04
/01/
2018
17:
19:4
1.
View Article OnlineDOI: 10.1039/C7JA00331E
View publication statsView publication stats