Embed Size (px)
Citation preview
438 Volume 52, Number 3, 1998 APPLIED SPECTROSCOPY0003-7028 / 98 / 5203-0438$2.00 / 0q 1998 Society for Applied Spectroscopy
Laser-Induced Breakdown Spectroscopy of Liquids:Aqueous Solutions of Nickel and Chlorinated Hydrocarbons
LEONARD M. BERMAN* and PAUL J. WOLF ²Department of Engineering Physics, Air Force Institute of Technology, Wright-Patterson Air Force Base, Ohio 45433-7765
Spectrochemical analyses of aqueous solutions containing nickel orthe chlorinated hydrocarbons (CHCs) C2Cl4, CCl4, CHCl3, andC2HCl3 were performed with the use of laser-induced breakdownspectroscopy. A Nd:YAG laser operating at 60 mJ/pulse was fo-cused onto the surface of the liquid. Elemental line intensities weremonitored in the laser-produced plume as a function of analyte con-centration to determine detection limits. The limits of detection fornickel in water were 36.4 6 5.4 mg/L and 18.0 6 3.8 mg/L for laserirradiation at 1.06 m m and 355 nm, respectively. Ablation of pureCHCs at 355 nm produced extremely intense plasma emissions thatprimarily consisted of spectroscopic features attributed to CN, C3,H, N, and Cl. The spectra were structurally identical for all theCHCs except for differences in the intensities of various emissionlines. With the use of emission from neutral atomic chlorine as anidenti® er for CHC contamination of water, no detectable traces ofthese elements were observed in saturated aqueous solutions. Thedetection limits for the CHCs were well above the saturation limitsof CHC in water.
Index Headings: Emission spectroscopy; Laser-induced breakdownspectroscopy; Solution samples; Chlorinated hydrocarbons; Nickel.
INTRODUCTION
Laser ablation is a process of irradiating the surface ofa sample with a pulsed laser with suf® cient ¯ uence tovaporize and subsequently remove a small amount of ma-terial.1 The emission of line radiation from speci® c atom-ic and molecular elements in the resulting plume hasidenti® ed this technique as a viable analytical tool forspectrochemical analysis, otherwise known as laser-in-duced breakdown spectroscopy (LIBS) or laser-inducedplasma spectroscopy.2 LIBS has several potential advan-tages over other, more conventional analytical techniquesfor environmental analysis and process control.2,3 For ex-ample, it requires minimal sample preparation and smallsample size, and the analysis can be performed in nearreal time. The technique also provides good spatial andtemporal resolution for in situ, noninvasive, and remotesensing applications.4
LIBS, however, is rather dif® cult to use as a quanti-tative analytical technique because the spectral line in-tensities, which are proportional to the species concen-trations, are affected by several parameters. In particular,they are highly dependent on the amounts of vaporizationand the degree of ionization, which can change as a func-tion of laser wavelength, laser ¯ uence, pulse-to-pulsevariability, sample surface morphology, ambient gas pres-sure, and ambient gas species. High signal intensities areproduced immediately after the laser pulse, but the dis-crete line emissions are superimposed on a strong con-
Received 15 May 1997; accepted 19 September 1997.* Present address: 72055-OSW, Tinker AFB, OK 73145.² Author to whom correspondence should be sent.
tinuum background due to bremsstrahlung radiation,which hides many of the discrete features. In order toclearly observe these line emissions and obtain accurateanalyte concentrations from the spectra, the timing be-tween the arrival of the laser pulse and signal detectionmust be adjusted to allow the continuum emission to de-cay. This optimization process, unfortunately, also forcesa trade-off between the initially high signal intensitiesand the need to eliminate interferences in the element’semission spectrum.
Solid samples have been the most commonly studiedmedium for their application in environmental and in-dustrial process monitoring.5± 9 The detection of gaseouselements such as chlorine and ¯ uorine,10 mercury,11 andchlorinated hydrocarbons has also been reported.12 Thereare only a few publications regarding the analytical ap-plication of LIBS for aqueous solutions. Cremers and co-workers5,13 report detection limits for elements of themain groups I, II, and III and the determination of ura-nium at the surface of an aqueous solution. The detectionlimits for these elements (except Li) are generally greaterthan 1 mg/L. By isolating individual droplets, Archontakiand Crouch14 have reported approximately a factor of102 ± 103 improvement in the detection limits of many ofthese same species. Vlasov et al.15 report detection limitsfor the principal elements in sea water (for laser remotesensing), and Knopp et al.16 have applied LIBS to thedetection of metal ions in solution. The majority of so-lution LIBS studies deals with the determination of de-tection limits; however, studies exploring the factors thataffect signal strength have also been reported, such aswavelength dependencies,17 surface vs. bulk excitation,18
and hybrid techniques including laser-induced ¯ uores-cence coupled with laser ablation to produce, for exam-ple, 1 fg detection limits for Na in water.19
In this paper, we report on the analytical detection ofNi in water by surface excitation, utilizing both infrared(IR) radiation at 1064 nm and ultraviolet (UV) radiationat 355 nm from a Nd:YAG laser, which has not beenpreviously published despite the numerous metals ob-served by LIBS in solution. In addition, we describe thespectral emissions after UV irradiation of chlorinated hy-drocarbons (CHCs) both in pure solvent form and dilutedin water, and we provide upper-bound estimates for thedetectivity of CHCs in water.
EXPERIMENTAL
A `̀ standard’ ’ LIBS arrangement was used wherebythe surface of an aqueous solution was irradiated with afocused, pulsed laser, and the subsequent emission fromcharacteristic elemental lines was monitored as a functionof analyte concentration. A Nd:YAG laser (Quanta-Ray
APPLIED SPECTROSCOPY 439
DCR-3) provided 8 ns (full width at half-maximum,FWHM) pulses at a repetition rate of 5± 20 Hz with 60mJ/pulse. Both the fundamental (1.064 m m) and the fre-quency-tripled fundamental (355 nm) laser lines were uti-lized in these studies. The laser output was focused nor-mally onto the surface of the solution with the use of a10 cm focal length lens that was mounted on a precisiontranslation stage for ® ne focal point adjustment control.The solution was contained in a rectangular, open glasscuvette with dimensions 5 cm 3 1 cm 3 5.5 cm. Nobreakdown was observed when the laser waist was great-er than 1 cm above or below the surface of the liquidsample. In the latter case, microexplosions and bubblingwere observed in the water while the laser propagatedthrough the solution. Surface emission spectra that fea-tured well-pronounced emission lines were observed onlywhen the plasma was produced on the water surface. In-frared irradiation of the solution samples was accompa-nied by severe splashing, presumably due to a conversionof laser energy into heat. This splashing affected the liq-uid level. Therefore, the cuvette was mounted on an op-tical platform equipped with a micrometer adjustment tovertically displace the cell, if necessary, while maintain-ing both the optical alignment between the plume emis-sion and the spectrometer and the position of the laserwaist on the liquid surface.
The plasma emission was collected perpendicular tothe laser beam axis within 5 mm of the target surface. A10 cm focal length quartz lens focused the emission ontothe entrance slit of a spectrometer (Acton Research, Spec-tra Pro 275) that was equipped with a gated, image-in-tensi® ed, linear photodiode array (Princeton Applied Re-search OMA III) at the exit plane for signal detection.The slit width was typically 100 m m for the Ni:H2O so-lutions and 50 m m for the experiments involving solvents.A 300 nm blazed grating (grating 1) with 1200 grooves/mm dispersed the emission for wavelengths below 400nm and a 500 nm blazed grating (grating 2) with 600grooves/mm was utilized for wavelengths between 400and 760 nm. The instrumental resolution for the two grat-ings was 0.6 nm and 1.0 nm, respectively. The diodearray captured a spectral snapshot over a wavelengthrange of 50 nm for grating 1 and 100 nm for grating 2at a predetermined delay time and detector gate width.The spectra were averaged over 75 and 50 laser pulsesfor UV and IR laser irradiation, respectively, to producegood signal-to-noise ratios (SNRs).
A series of survey experiments were conducted to de-termine the optimum conditions for recording the emis-sion features originating from the elements under study.First, the signal intensities were monitored as a functionof gate width for a ® xed delay time (i.e., time betweensignal detection and the laser pulse) to determine themaximum signal intensity. Then, holding the gate width® xed, the delay time was varied until the continuumemission decayed and discrete line features dominated thespectra. The combination of gate width and time delaythat produced the optimum signal-to-background (i.e.,continuum radiation level) ratio for the IR irradiation ex-periments involving Ni in water was 50 m s and 8 m s,respectively. Similarly, the best signal-to-background ra-tio for UV irradiation was obtained with a 10 m s gatewidth and a 3 m s time delay. Lastly, a 10 m s gate width
and a 1 m s time delay were used for the CHC studiesunder UV laser irradiation.
The nickel solutions were prepared from a 1 M stocksolution of Ni in 5% HNO3 (J. T. Baker, Plasma Stan-dard). This solution was subsequently diluted in deion-ized water to obtain smaller Ni concentrations. The sol-vent solutions were prepared from concentrates. Thechlorinated hydrocarbons included tetrachloroethlyene(C2Cl4, HPLC grade, Sigma-Aldrich), trichloroethlyene(C2HCl3, electronic grade, Fischer), tetrachloromethane(CCl4, HPLC grade, Sigma-Aldrich), and trichlorometh-ane (CHCl3, HPLC grade, Sigma-Aldrich).
RESULTS AND DISCUSSION
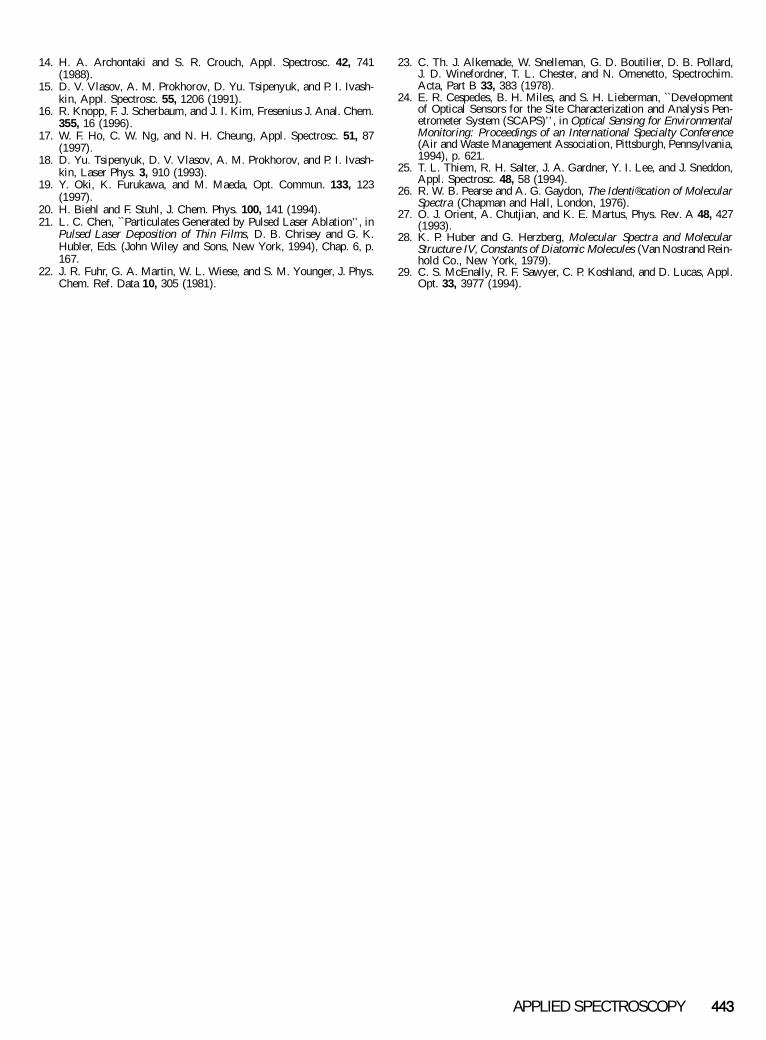
Emission Characteristics for Nickel in Water. Emis-sion spectra were obtained for various concentrations ofNi in water at wavelengths ranging between 280 and 440nm. Figure 1 shows sample spectra of plume emissionsrecorded with a 1 g/L solution. The discrete spectroscopicfeatures shown in Fig. 1a and 1b originated from elec-tronically excited states of neutral Ni atoms. Ni(II) emis-sion lines were not detected in this study. Molecular spe-cies were observed but they were attributed to the abla-tion products of deionized water in air. For example, thefeatures at 336.0 and 337.0 nm were respectively asso-ciated with the (v 9 , v²) 5 (0,0) and (1,1) vibrational tran-sitions in the NH ( A 3 P ® X 3 S 2 ) system.20 Other featureswhich contributed to the `̀ shape’ ’ of the backgroundemission in this wavelength region are shown in Fig. 1c.
Short wavelength (UV) laser radiation has been gen-erally more ef® cient at ablating metals in vacuum be-cause of the decrease in the absorption coef® cient withincreasing wavelength.21 Therefore, we anticipated moreef® cient production of excited Ni atoms and a concurrentreduction in the continuum emission after UV laser ab-lation. Figure 1b illustrates plasma emission spectra ob-tained after 355 nm irradiation. Analyses of the spectrashowed that the background emission decreased by ap-proximately a factor of 10 and the Ni emission lines be-came more discernible with shorter delay times as com-pared to the data in Fig. 1a. The emission recordings,however, contained spectroscopic features that were iden-tical to those observed under IR irradiation. For the pur-poses of this research, we chose the wavelength regiondepicted in Fig. 1 to study the behavior of Ni line inten-sities as a function of the analyte concentration, becausethis spectral region contained Ni transitions with bothhigh oscillator strengths, f, and minimal overlap withspectral features from ablated water.22 Speci® cally, thechanges in the intensity of the 341.48 nm ( f 5 0.12),352.45 nm ( f 5 0.13), and 361.94 nm ( f 5 0.18) Niemission lines were monitored as a function of the Niconcentration in water.
Detection Limits of Ni in Water. The detection limit,cL, was de® ned as a concentration resulting in a signalcorresponding to the 97.7% con® dence level.23 That is,the amplitude of this signal should be twice as large asthe standard deviation s associated with the total noiseof the system normalized by the sensitivity S of the meth-od:
cL 5 2s /S. (1)
440 Volume 52, Number 3, 1998
FIG. 1. Plume emission spectra obtained after irradiating a 1 g/L solution of Ni in water at: (a) 1.06 m m with a 50 m s gate width and an 8 m stime delay and (b) 355 nm with a 10 m s gate width and a 3 m s time delay. The spectrum in c is due to deionized water taken 8 m s after IR laserirradiation. The emission lines utilized in determining the detection limits of Ni I water are identi® ed in a.
FIG. 2. Plot of signal intensity vs. analyte concentration for solutionsof Ni in deionized water.
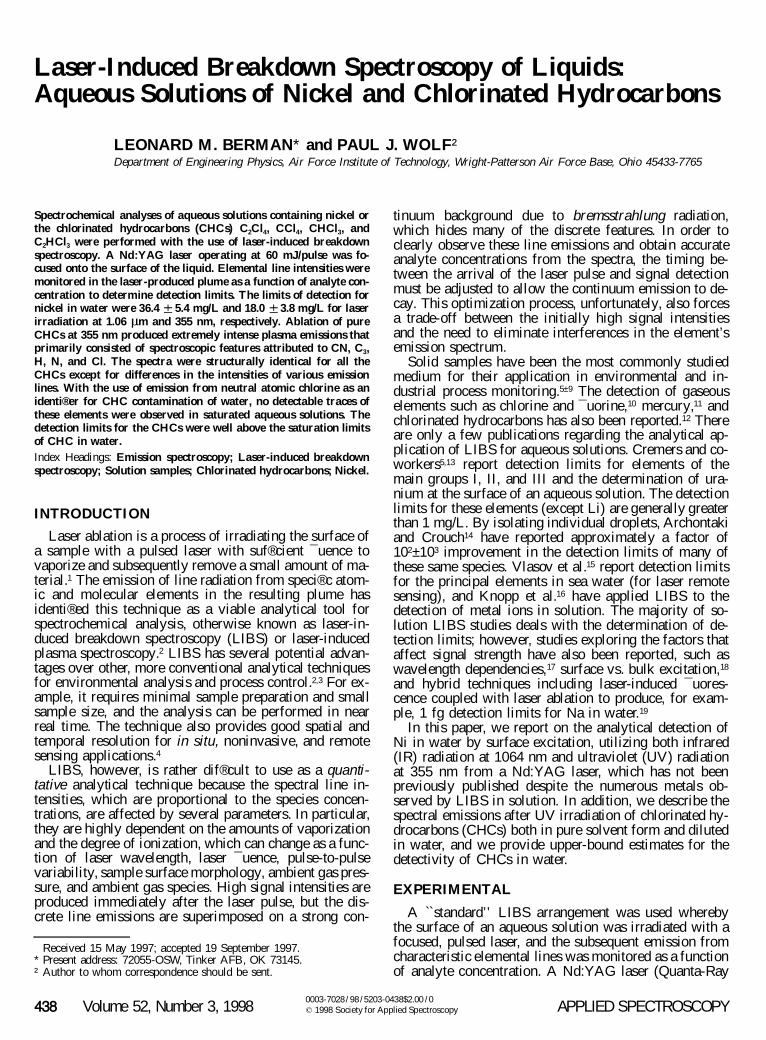
The sensitivity S was determined from the slope of acalibration curve that was constructed by plotting the an-alyte signal intensity obtained from the spectra vs. theknown concentration of analyte in solution. The intensityof a particular emission line was determined by measur-
ing the difference between the signal intensity at the peakof the emission line and the average off-line backgroundlevel. The root-mean-square noise s was obtained froma wavelength region in the spectra void of Ni emissionlines. The noise was computed by measuring the differ-ence between the minimum and maximum values of thesignal trace and averaging the values over the predeter-mined wavelength region (370 nm # l # 380 nm forUV excitation and 363 nm # l # 370 nm for IR exci-tation).
A plot of the calibration curve is depicted in Fig. 2 forboth the IR and UV irradiation studies. Linear ® ts to thedata resulted in a detection limit of 36.4 6 5.4 mg/L and20.7 6 4.3 mg/L for the IR and UV irradiation experi-ments, respectively. The UV data, however, showed aslight curvature at concentrations higher than 800 mg/L.The correlation coef® cient for the linear ® t was 0.993,and a quadratic ® t to the data produced a correlation co-ef® cient of 0.996. Eliminating the quadratic portion ofthe data, a linear ® t to the signal intensities at the lowerconcentrations ( , 800 mg/L) resulted in a detection limitof 18.0 6 3.8 mg/L. Statistically, this value is equal tothe previous value determined by ® tting the entire dataset, but we report the latter value to eliminate the pos-sibility of the effects of mechanisms that cause nonlinearintensity changes like self-absorption.13
An upper limit to the lowest number density of Ni
APPLIED SPECTROSCOPY 441
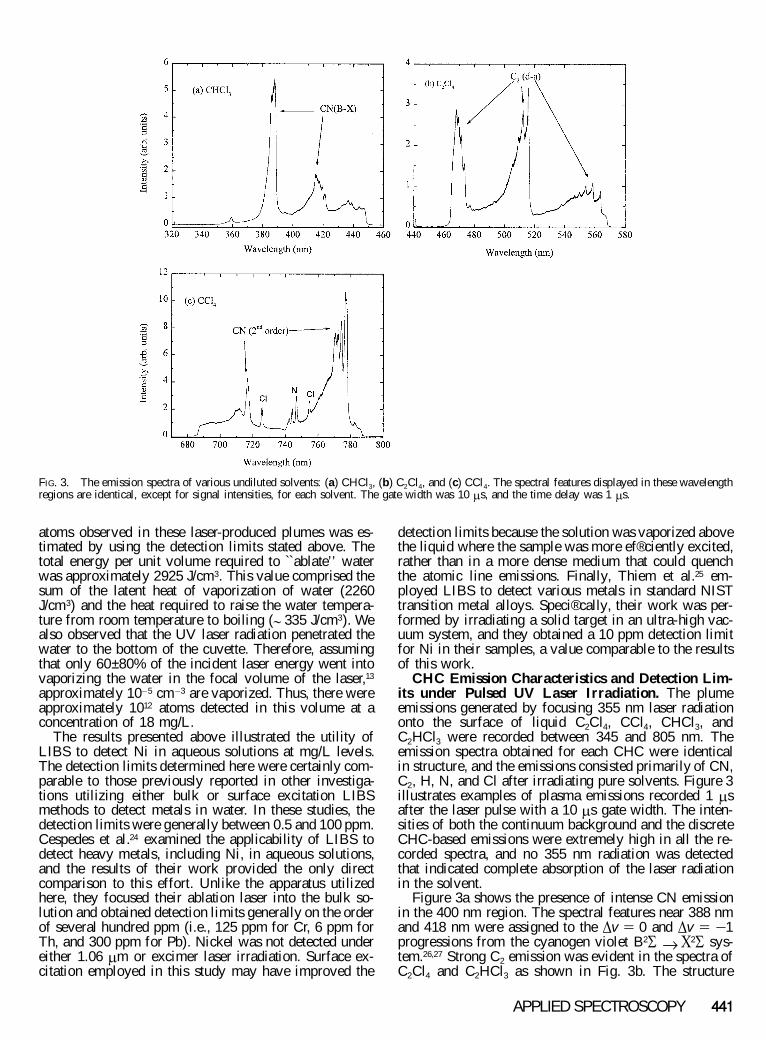
FIG. 3. The emission spectra of various undiluted solvents: (a) CHCl3, (b) C2Cl4, and (c) CCl4. The spectral features displayed in these wavelengthregions are identical, except for signal intensities, for each solvent. The gate width was 10 m s, and the time delay was 1 m s.
atoms observed in these laser-produced plumes was es-timated by using the detection limits stated above. Thetotal energy per unit volume required to `̀ ablate’ ’ waterwas approximately 2925 J/cm3. This value comprised thesum of the latent heat of vaporization of water (2260J/cm3) and the heat required to raise the water tempera-ture from room temperature to boiling ( ; 335 J/cm3). Wealso observed that the UV laser radiation penetrated thewater to the bottom of the cuvette. Therefore, assumingthat only 60± 80% of the incident laser energy went intovaporizing the water in the focal volume of the laser,13
approximately 102 5 cm2 3 are vaporized. Thus, there wereapproximately 1012 atoms detected in this volume at aconcentration of 18 mg/L.
The results presented above illustrated the utility ofLIBS to detect Ni in aqueous solutions at mg/L levels.The detection limits determined here were certainly com-parable to those previously reported in other investiga-tions utilizing either bulk or surface excitation LIBSmethods to detect metals in water. In these studies, thedetection limits were generally between 0.5 and 100 ppm.Cespedes et al.24 examined the applicability of LIBS todetect heavy metals, including Ni, in aqueous solutions,and the results of their work provided the only directcomparison to this effort. Unlike the apparatus utilizedhere, they focused their ablation laser into the bulk so-lution and obtained detection limits generally on the orderof several hundred ppm (i.e., 125 ppm for Cr, 6 ppm forTh, and 300 ppm for Pb). Nickel was not detected undereither 1.06 m m or excimer laser irradiation. Surface ex-citation employed in this study may have improved the
detection limits because the solution was vaporized abovethe liquid where the sample was more ef® ciently excited,rather than in a more dense medium that could quenchthe atomic line emissions. Finally, Thiem et al.25 em-ployed LIBS to detect various metals in standard NISTtransition metal alloys. Speci® cally, their work was per-formed by irradiating a solid target in an ultra-high vac-uum system, and they obtained a 10 ppm detection limitfor Ni in their samples, a value comparable to the resultsof this work.
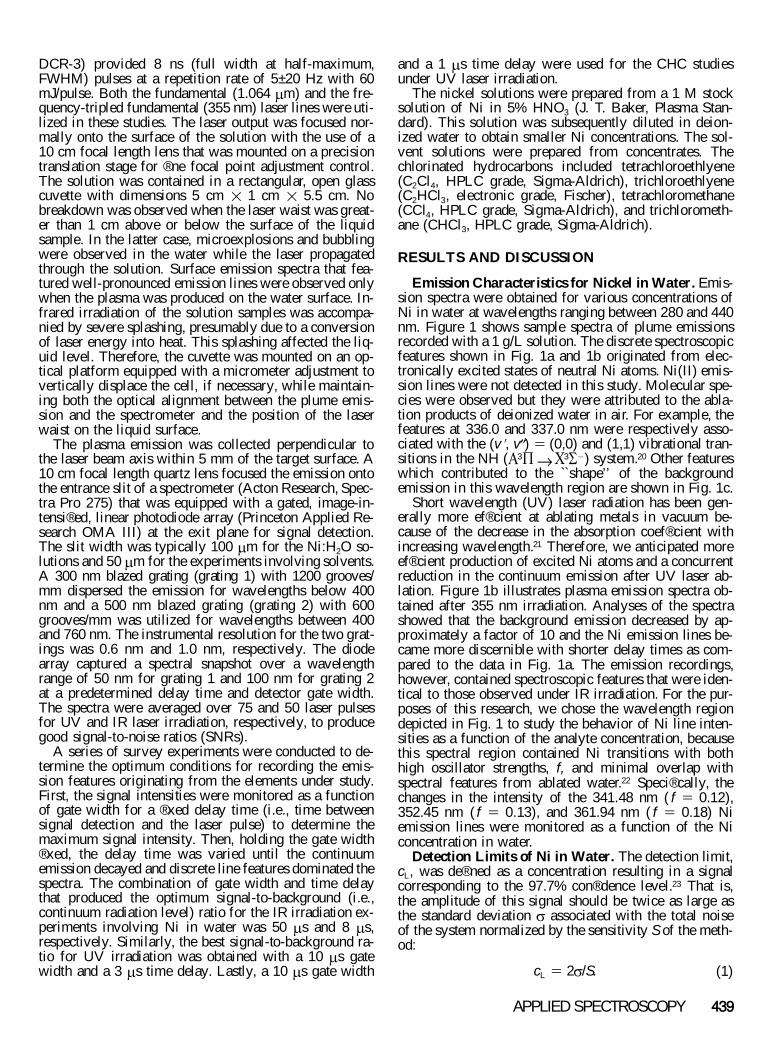
CHC Emission Characteristics and Detection Lim-its under Pulsed UV Laser Irradiation. The plumeemissions generated by focusing 355 nm laser radiationonto the surface of liquid C2Cl4, CCl4, CHCl3, andC2HCl3 were recorded between 345 and 805 nm. Theemission spectra obtained for each CHC were identicalin structure, and the emissions consisted primarily of CN,C2, H, N, and Cl after irradiating pure solvents. Figure 3illustrates examples of plasma emissions recorded 1 m safter the laser pulse with a 10 m s gate width. The inten-sities of both the continuum background and the discreteCHC-based emissions were extremely high in all the re-corded spectra, and no 355 nm radiation was detectedthat indicated complete absorption of the laser radiationin the solvent.
Figure 3a shows the presence of intense CN emissionin the 400 nm region. The spectral features near 388 nmand 418 nm were assigned to the D v 5 0 and D v 5 2 1progressions from the cyanogen violet B2 S ® X 2 S sys-tem.26,27 Strong C2 emission was evident in the spectra ofC2Cl4 and C2HCl3 as shown in Fig. 3b. The structure
442 Volume 52, Number 3, 1998
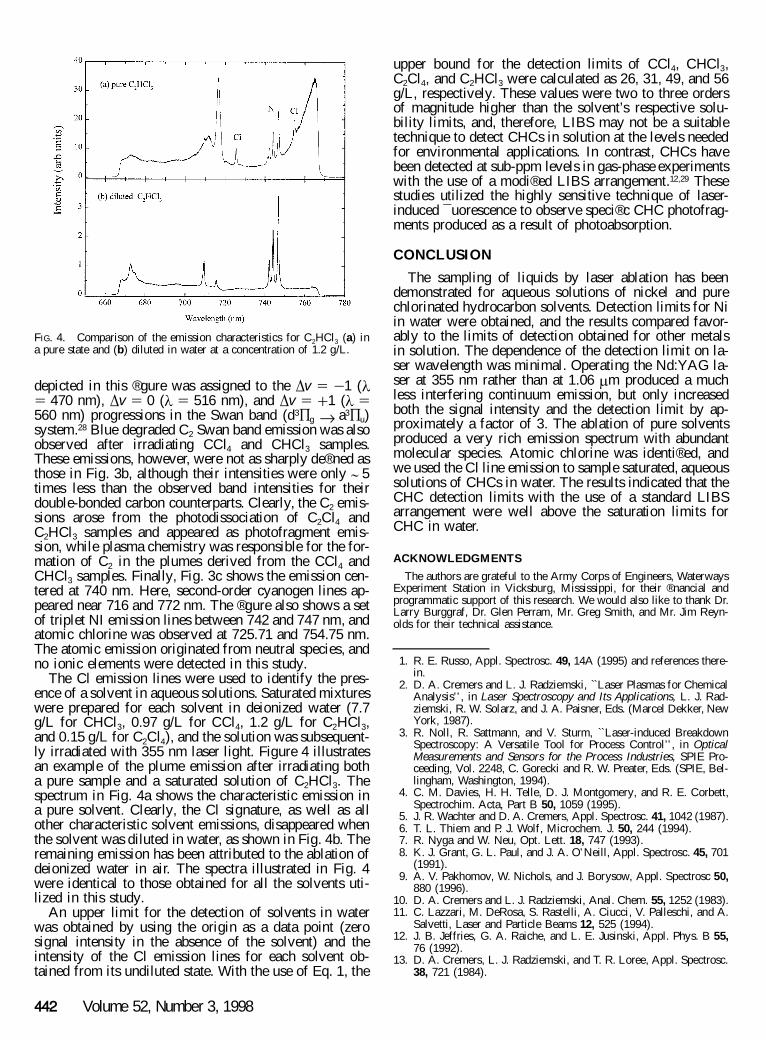
FIG. 4. Comparison of the emission characteristics for C2HCl3 (a) ina pure state and (b) diluted in water at a concentration of 1.2 g/L.
depicted in this ® gure was assigned to the D v 5 2 1 ( l5 470 nm), D v 5 0 ( l 5 516 nm), and D v 5 1 1 ( l 5560 nm) progressions in the Swan band (d3 P g ® a3 P u)system.28 Blue degraded C2 Swan band emission was alsoobserved after irradiating CCl4 and CHCl3 samples.These emissions, however, were not as sharply de® ned asthose in Fig. 3b, although their intensities were only ; 5times less than the observed band intensities for theirdouble-bonded carbon counterparts. Clearly, the C2 emis-sions arose from the photodissociation of C2Cl4 andC2HCl3 samples and appeared as photofragment emis-sion, while plasma chemistry was responsible for the for-mation of C2 in the plumes derived from the CCl4 andCHCl3 samples. Finally, Fig. 3c shows the emission cen-tered at 740 nm. Here, second-order cyanogen lines ap-peared near 716 and 772 nm. The ® gure also shows a setof triplet NI emission lines between 742 and 747 nm, andatomic chlorine was observed at 725.71 and 754.75 nm.The atomic emission originated from neutral species, andno ionic elements were detected in this study.
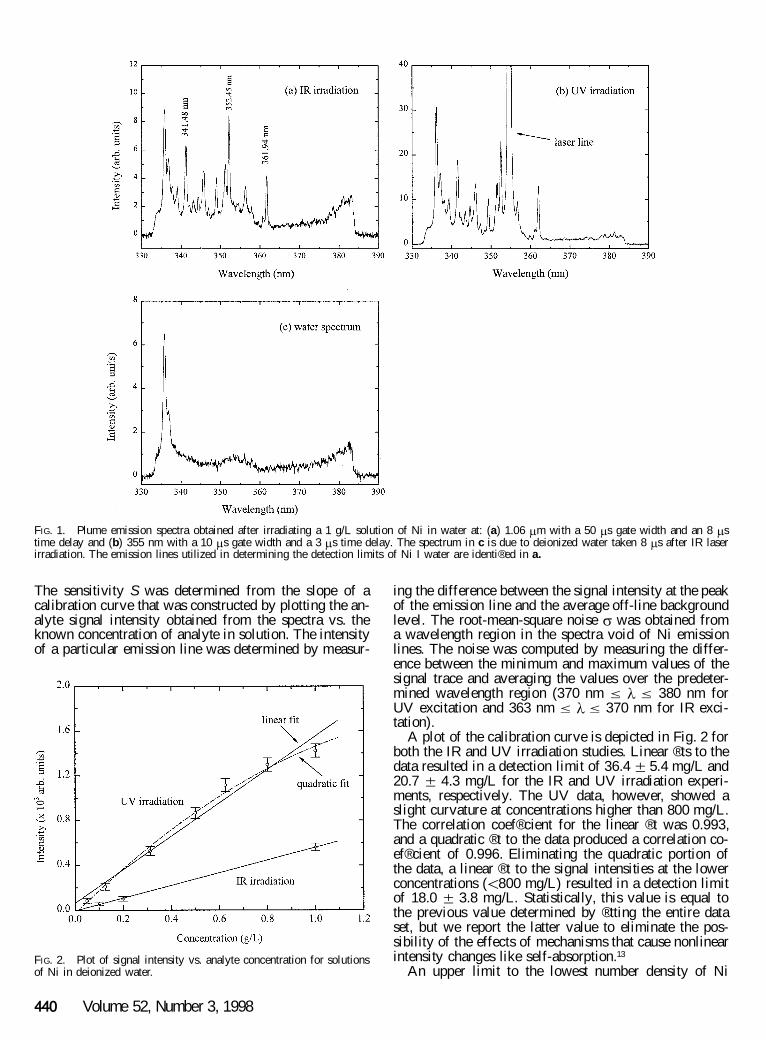
The Cl emission lines were used to identify the pres-ence of a solvent in aqueous solutions. Saturated mixtureswere prepared for each solvent in deionized water (7.7g/L for CHCl3, 0.97 g/L for CCl4, 1.2 g/L for C2HCl3,and 0.15 g/L for C2Cl4), and the solution was subsequent-ly irradiated with 355 nm laser light. Figure 4 illustratesan example of the plume emission after irradiating botha pure sample and a saturated solution of C2HCl3. Thespectrum in Fig. 4a shows the characteristic emission ina pure solvent. Clearly, the Cl signature, as well as allother characteristic solvent emissions, disappeared whenthe solvent was diluted in water, as shown in Fig. 4b. Theremaining emission has been attributed to the ablation ofdeionized water in air. The spectra illustrated in Fig. 4were identical to those obtained for all the solvents uti-lized in this study.
An upper limit for the detection of solvents in waterwas obtained by using the origin as a data point (zerosignal intensity in the absence of the solvent) and theintensity of the Cl emission lines for each solvent ob-tained from its undiluted state. With the use of Eq. 1, the
upper bound for the detection limits of CCl4, CHCl3,C2Cl4, and C2HCl3 were calculated as 26, 31, 49, and 56g/L, respectively. These values were two to three ordersof magnitude higher than the solvent’s respective solu-bility limits, and, therefore, LIBS may not be a suitabletechnique to detect CHCs in solution at the levels neededfor environmental applications. In contrast, CHCs havebeen detected at sub-ppm levels in gas-phase experimentswith the use of a modi® ed LIBS arrangement.12,29 Thesestudies utilized the highly sensitive technique of laser-induced ¯ uorescence to observe speci® c CHC photofrag-ments produced as a result of photoabsorption.
CONCLUSION
The sampling of liquids by laser ablation has beendemonstrated for aqueous solutions of nickel and purechlorinated hydrocarbon solvents. Detection limits for Niin water were obtained, and the results compared favor-ably to the limits of detection obtained for other metalsin solution. The dependence of the detection limit on la-ser wavelength was minimal. Operating the Nd:YAG la-ser at 355 nm rather than at 1.06 m m produced a muchless interfering continuum emission, but only increasedboth the signal intensity and the detection limit by ap-proximately a factor of 3. The ablation of pure solventsproduced a very rich emission spectrum with abundantmolecular species. Atomic chlorine was identi® ed, andwe used the Cl line emission to sample saturated, aqueoussolutions of CHCs in water. The results indicated that theCHC detection limits with the use of a standard LIBSarrangement were well above the saturation limits forCHC in water.
ACKNOWLEDGMENTS
The authors are grateful to the Army Corps of Engineers, WaterwaysExperiment Station in Vicksburg, Mississippi, for their ® nancial andprogrammatic support of this research. We would also like to thank Dr.Larry Burggraf, Dr. Glen Perram, Mr. Greg Smith, and Mr. Jim Reyn-olds for their technical assistance.
1. R. E. Russo, Appl. Spectrosc. 49, 14A (1995) and references there-in.
2. D. A. Cremers and L. J. Radziemski, `̀ Laser Plasmas for ChemicalAnalysis’ ’ , in Laser Spectroscopy and Its Applications, L. J. Rad-ziemski, R. W. Solarz, and J. A. Paisner, Eds. (Marcel Dekker, NewYork, 1987).
3. R. Noll, R. Sattmann, and V. Sturm, `̀ Laser-induced BreakdownSpectroscopy: A Versatile Tool for Process Control’ ’ , in OpticalMeasurements and Sensors for the Process Industries, SPIE Pro-ceeding, Vol. 2248, C. Gorecki and R. W. Preater, Eds. (SPIE, Bel-lingham, Washington, 1994).
4. C. M. Davies, H. H. Telle, D. J. Montgomery, and R. E. Corbett,Spectrochim. Acta, Part B 50, 1059 (1995).
5. J. R. Wachter and D. A. Cremers, Appl. Spectrosc. 41, 1042 (1987).6. T. L. Thiem and P. J. Wolf, Microchem. J. 50, 244 (1994).7. R. Nyga and W. Neu, Opt. Lett. 18, 747 (1993).8. K. J. Grant, G. L. Paul, and J. A. O’ Neill, Appl. Spectrosc. 45, 701
(1991).9. A. V. Pakhomov, W. Nichols, and J. Borysow, Appl. Spectrosc 50,
880 (1996).10. D. A. Cremers and L. J. Radziemski, Anal. Chem. 55, 1252 (1983).11. C. Lazzari, M. DeRosa, S. Rastelli, A. Ciucci, V. Palleschi, and A.
Salvetti, Laser and Particle Beams 12, 525 (1994).12. J. B. Jeffries, G. A. Raiche, and L. E. Jusinski, Appl. Phys. B 55,
76 (1992).13. D. A. Cremers, L. J. Radziemski, and T. R. Loree, Appl. Spectrosc.
38, 721 (1984).
APPLIED SPECTROSCOPY 443
14. H. A. Archontaki and S. R. Crouch, Appl. Spectrosc. 42, 741(1988).
15. D. V. Vlasov, A. M. Prokhorov, D. Yu. Tsipenyuk, and P. I. Ivash-kin, Appl. Spectrosc. 55, 1206 (1991).
16. R. Knopp, F. J. Scherbaum, and J. I. Kim, Fresenius J. Anal. Chem.355, 16 (1996).
17. W. F. Ho, C. W. Ng, and N. H. Cheung, Appl. Spectrosc. 51, 87(1997).
18. D. Yu. Tsipenyuk, D. V. Vlasov, A. M. Prokhorov, and P. I. Ivash-kin, Laser Phys. 3, 910 (1993).
19. Y. Oki, K. Furukawa, and M. Maeda, Opt. Commun. 133, 123(1997).
20. H. Biehl and F. Stuhl, J. Chem. Phys. 100, 141 (1994).21. L. C. Chen, `̀ Particulates Generated by Pulsed Laser Ablation’’ , in
Pulsed Laser Deposition of Thin Films, D. B. Chrisey and G. K.Hubler, Eds. (John Wiley and Sons, New York, 1994), Chap. 6, p.167.
22. J. R. Fuhr, G. A. Martin, W. L. Wiese, and S. M. Younger, J. Phys.Chem. Ref. Data 10, 305 (1981).
23. C. Th. J. Alkemade, W. Snelleman, G. D. Boutilier, D. B. Pollard,J. D. Winefordner, T. L. Chester, and N. Omenetto, Spectrochim.Acta, Part B 33, 383 (1978).
24. E. R. Cespedes, B. H. Miles, and S. H. Lieberman, `̀ Developmentof Optical Sensors for the Site Characterization and Analysis Pen-etrometer System (SCAPS)’ ’ , in Optical Sensing for EnvironmentalMonitoring: Proceedings of an International Specialty Conference(Air and Waste Management Association, Pittsburgh, Pennsylvania,1994), p. 621.
25. T. L. Thiem, R. H. Salter, J. A. Gardner, Y. I. Lee, and J. Sneddon,Appl. Spectrosc. 48, 58 (1994).
26. R. W. B. Pearse and A. G. Gaydon, The Identi® cation of MolecularSpectra (Chapman and Hall, London, 1976).
27. O. J. Orient, A. Chutjian, and K. E. Martus, Phys. Rev. A 48, 427(1993).
28. K. P. Huber and G. Herzberg, Molecular Spectra and MolecularStructure IV, Constants of Diatomic Molecules (Van Nostrand Rein-hold Co., New York, 1979).
29. C. S. McEnally, R. F. Sawyer, C. P. Koshland, and D. Lucas, Appl.Opt. 33, 3977 (1994).