Embed Size (px)
Citation preview

Late Quaternary Sedimentation History of the Lena Delta Spätquartäre Sedimentationsgeschichte im Lena-Delta _______________________________________________ Georg Johannes Schwamborn

Georg Johannes Schwamborn Stiftung Alfred-Wegener-Institut für Polar- und Meeresforschung
Forschungsstelle Potsdam
Telegrafenberg A43
D-14473 Potsdam Diese Arbeit ist die leicht veränderte Fassung einer Dissertation, die im November 2001
dem Institut für Geowissenschaften der Universität Potsdam vorgelegt wurde.

_____________________________________________________________________________________
i
Table of Contents
Zusammenfassung iii
Summary v 1 Introduction 1
1.1 Scientific background 1
1.2 Aims and objectives 5
1.3 Synopsis 5 2 Evolution of Lake Nikolay, Arga Island, Western Lena River delta
during Late Weichselian and Holocene time 7
2.1 Introduction 7
2.2 Methods 11
2.2.1 Geophysical profiling 11
2.2.2 Sediment sampling 12
2.2.3 Laboratory methods 12
2.2.4 Mathematical modeling 13
2.3 Results and discussion 15
2.3.1 Land deposits 15
2.3.2 Lake sediment stratigraphy 17
2.3.2.1 Organic carbon isotope record 19
2.3.2.2 Vegetation history 19
2.3.2.3 Seismic stratigraphy of basin fills 21
2.3.3 Talik development 23
2.3.3.1 Seismic indication 23
2.3.3.2 Results of mathematical modeling 26
2.3.4 GPR of permafrost deposits 28
2.4 Conclusions 28 3 Ground penetrating radar and high-resolution seismics – geophysical
profiling of a thermokarst lake in the western Lena Delta, N-Siberia 31
3.1 Introduction 31
3.2 Seismic Data Acquisition 33
3.3 GPR Data Acquisition 34
3.4 Sediment Sampling 36

_____________________________________________________________________________________
ii
3.5 EM Velocity Analysis 36
3.6 Resolution of GPR and Seismic Data 37
3.7 Results and Discussion 39
3.8 Conclusions 45 4 Late Quaternary sedimentation history of the Lena Delta 47
4.1 Introduction 47
4.2 Materials and methods 50
4.3 Results 51
4.3.1 Distribution of 14C and IR-OSL dated sediments 51
4.3.2 Heavy mineral analysis 56
4.3.3 Grain size characteristics and TOC content 59
4.4 Discussion 61
4.4.1 Third terrace - Lower sands 61
4.4.2 Third terrace - Ice Complex 62
4.4.3 Second terrace 63
4.4.4 First terrace 66
4.5 Conclusions 66 5 Summary 68 Appendix:
Materials and methods 74
Luminescence dating results of sediment sequences of the Lena Delta 80
Introduction 81
Luminescence Dating 82
Dating Results and Discussion 84
Geochronometry / Geochronology 86
Conclusion 88 References 89 Acknowledgements 101
Zusammenfassung/Summary _____________________________________________________________________________________
iii
Zusammenfassung Das nordsibirische Lena-Delta ist das größte Delta der Arktis und das zweitgrößte der
Welt. Die bedeutenden Faktoren für die Entwicklung des Lena-Deltas während des
Spätquartärs ähneln denen anderer Delta-Systeme; dies schließt den eustatischen
Meeresspiegelanstieg, die gelieferte Sedimentfracht des Flusses und tektonische
Bewegungen ein. Das Hauptziel dieser Arbeit ist die spätquartäre
Umweltrekonstruktion dieser Faktoren mithilfe von Sedimentanalysen und
geophysikalischen Messungen. Dabei liegt der Schwerpunkt im Nutzen eines multi-
methodischen Zugangs, um die verschiedenen fluviatilen und lakustrinen
Ablagerungsmilieus zu entschlüsseln. Sedimentstrukturen und Sedimenteigenschaften
(z.B. Schwermineralzusammensetzung, Korngrößenverteilungen, Gesamtgehalte an
organischem Kohlenstoff (TOC)) und Altersbestimmungen (AMS 14C und IR-OSL)
werden genutzt, um die wichtigsten Sedimenteinheiten der drei bedeutenden
geomorphologischen Terrassen, die das Lena-Delta aufbauen, zu unterscheiden.
Zusätzlich ermöglichen Analysen an Seesedimenten (Korngrößenverteilungen, TOC, C-
Isotopenverhältnisse im TOC, Pollenanalyse) des größten Sees innerhalb des Lena-
Deltas eine umweltgeschichtliche Rekonstruktion für den nordwestlichen Sektor des
Lena-Delta-Gebietes. Sie werden wesentlich durch geophysikalische Messungen
ergänzt (Georadar und hochauflösende Seismik).
Die Hauptstufen in der Entwicklung der geomorphologisch-sedimentären Abfolge des
Lena-Deltas können wie folgt zusammengefasst werden: das Lena-Delta ist ein
geomorphologischer Komposit aus Erosionsresten verschiedener spätpleistozäner
Flussstadien (dritte und zweite Terrasse) und eigentlicher, spätholozäner bis rezenter
Deltasedimentation (erste Terrasse). Letztere ist vor allem im östlichen Sektor zu
finden. Der westliche Sektor wird dominiert von torfig-sandigen und sandigen
Hochlagen und Inseln, deren Sedimente während des letzten glazialen
Meeresspiegeltiefstandes abgelagert wurden (dritte und zweite Terrasse).
Dritte Terrasse
Paläo-fluviale Sande und eingeschaltete Wurzelhorizonte, datiert auf den Zeitraum
~88-43 ka v.H. (ka = 1000 a), dokumentieren den frühesten nachweisbaren Beginn der
Sedimentabfolge, die das heutige geographische Lena-Delta umfasst. Schwer-
mineralogische Vergleiche belegen, dass die sandigen Sedimente der Lena entstammen.
Aufschlussbeschreibung, Korngrößenverteilungen und TOC-Gehalte zeigen, dass die

Zusammenfassung/Summary _____________________________________________________________________________________
iv
sedimentäre Fazies vergleichbar ist mit der rezenten Auen- bzw. floodplain-
Sedimentation. Die fluvialen Sande repräsentieren den unteren Bereich der dritten
Terrasse (0 bis 14 m ü.NN).
Der Sedimentationsnachweis für die zweite Hälfte des Weichsels (43-14 ka v.H.) ist
begrenzt auf den lokal entstandenen Eiskomplex. Korngrößen-, Schwermineral- und
TOC-Untersuchungen zu Folge handelt es sich bei dieser Formation um eine Abfolge
von polygenetischen, organikreichen Sedimenten. Sie stammen aus den südlich
gelegenen, küstennahen Gebirgszügen (Chekanovsky- und Kharaulakh-Gebirge) und
sind in deren Vorebenen abgelagert worden. Im Lena-Delta bilden sie die Deckschicht
der dritten Terrasse (14 bis 35 m ü.NN). Der abrupte Fazieswechsel zwischen den
liegenden Sanden und dem Eiskomplex wird als ein deutliches Anzeichen eines
tektonischen Einflusses auf die Sedimentverteilung und die Ablagerungsentstehung im
Lena-Delta gedeutet. Sedimente, die von der Lena geschüttet worden sind, sind für den
Zeitraum der Entstehung des Eiskomplexes nicht überliefert. Allerdings werden sie
entlang eines Flusslaufes der Lena vermutet, der zu einem Paläo-Delta verlief, das für
diese Zeit weiter nördlich anzunehmen ist.
Zweite Terrasse
Auf die Phase allgemeiner Stabilität der Umweltbedingungen während der
Eiskomplex-Bildung folgte eine neue Episode der fluviatilen Einschneidung und
Sedimentakkumulation der Lena zwischen >14,5 und 10,9 ka v.H. Die Sedimentation
erfolgte in einem verwilderten, verzweigten Flusssystem unter Bedingungen von
saisonal hohen Abflussraten und karger Vegetationsdecke. Die mächtigen
Sandsequenzen, die typisch sind für diese Periode, repräsentieren die zweite Terrasse
(10 bis 30 m ü.NN). Zu Beginn des Holozäns lässt im nordwestlichen Sektor des Lena-
Deltas die fluviale Sedimentationstätigkeit nach. Schließlich wird sie abgelöst durch
äolische Aktivität und anhaltenden, tiefreichenden Thermokarst (<7 ka v.H.). Dieses
Alter (unkalibriertes 14C-Alter) ist aus den ältesten Sedimenten des Nikolay-Sees
ermittelt worden.
Die Thermokarstprozesse setzten in inaktiv gewordenen Flussläufen ein. Sie erklären
die Entstehung der zahllosen Seebecken, die sich auf der zweiten Terrasse befinden,
einschließlich des Nikolay-Sees, der der größte und tiefste See unter ihnen ist. Das
Einsetzen des Thermokarstes fiel mit dem regionalen holozänen Klimaoptimum (7-5 ka
v.H. unkalibriertes 14C-Alter) zusammen. Seit ca. 5 ka v.H. unterliegt die Region

Zusammenfassung/Summary _____________________________________________________________________________________
v
stabilen Umweltbedingungen. Die Morphologie der Thermokarsteinsenkungen konnte
mithilfe hochauflösender Seismik und Georadar identifiziert werden. Die
Sedimentlagerung benachbarter Zonen aus limnischen und kryo-terrigenen Sedimenten
sind dabei in kombinierender Weise aufgezeichnet worden. Während prozessierte,
hochauflösende seismische Daten vor allem die wassergesättigten Beckensedimente
aufzeichnen, sind die Georadar-Profile besonders geeignet, den gefrorenen Untergrund,
der die Becken umgibt, abzubilden. Zusätzlich zeigen seismische Daten, dass die
einzelnen Thermokarstbecken in ihrem Untergrund Auftauzonen (Taliks) aufweisen.
Die Ausdehnung der Taliks führt zur Sedimentsetzung, die wesentlich für die
anhaltende Vertiefung der Seen verantwortlich ist.
Erste Terrasse
Die fluviale Abfolge setzte sich mit den holozänen (<8,5 ka v.H.) Sedimenten der
ersten Terrasse (0 to 10 m ü.NN) fort. Die Aufgabe des nordwestlichen Sektors und der
Wechsel des Hauptsedimentationsgebietes in den nordöstlich/östlichen Sektor des Lena-
Deltas wird mit tektonischen Bewegungen entlang einer N-S verlaufenden Bruchzone in
Verbindung gebracht, die beide Gebiete trennt. Der Meerespiegelanstieg in der Laptev
See gelangte in der Mitte des Holozäns an seine heutige Position, und die Delta-
Akkumulation in den Lena-Flussarmen der heutigen Delta-Ebene wurde eingeleitet. Auf
höher gelegenen Flächen der alluvialen Ebene konnten sich Böden bilden.
Altersinversionen entlang der Sedimentprofile der ersten Terrasse weisen auf ein
hochenergetisches Ablagerungsmilieu hin, das die Verwilderung der Flussarme auf der
Deltaebene einschließt. Die Sedimente der zweiten und dritten Terrasse sind in dieser
Phase anhaltender Thermoerosion und fluviatiler Abtragung ausgesetzt.
Im Gegensatz zu einigen Wissenschaftlern, die annehmen, dass pleistozäne
Vergletscherungen teilweise das Lena-Delta bedeckt hatten, unterstützen die
analytischen Ergebnisse dieser Arbeit diese These nicht - weder sedimentologisch (zum
Beispiel im Auftreten von Tillen oder Moränen) noch geophysikalisch (zum Beispiel im
Auffinden massiven Untergrundeises, das Gletschern entstammen könnte).
Summary The north Siberian Lena Delta is the largest delta in the Arctic and the second largest
in the world. Major controls on the Lena Delta development during the Late Quaternary
are similar to those of other deltaic systems, including eustatic sea-level rise, sediment
load and tectonics. Primary objectives of this thesis are directed to the Late Quaternary

Zusammenfassung/Summary _____________________________________________________________________________________
vi
environmental reconstruction of the major controls by means of sediment analyses and
geophysical measurements. Emphasis is placed upon the benefits arising from this
interdisciplinary approach to decipher the sedimentation history of the Lena Delta, i.e.
its main fluvial and lake environments. They are studied by core and outcrop analysis
and the measured sediment properties (heavy mineral composition, grain size
characteristics, total organic carbon content) and age determinations (AMS 14C and IR-
OSL*) allow to discriminate the main sedimentary units of the three major geomorphic
terraces. In addition, lake sediment analyses (grain size distributions, total organic
carbon content, isotopic ratio of the total organic carbon) complemented by geophysical
measurements (ground penetrating radar and high-resolution seismic) of the largest lake
held by the Lena Delta enable the environmental reconstruction of the northwestern part
(Arga Island) of the Lena Delta area.
The main stages of the morpho-sedimentary succession as deduced from the geologic
and geophysical datasets can be outlined as follows: the Lena Delta is a geomorphic
composite of erosional remnants from different Late Pleistocene-aged fluvial stages
(third and second terrace) and actual, Late Holocene-aged to modern deltaic
sedimentation (first terrace). The latter is found primarily in the eastern sector. The
western and northwestern sectors are dominated by exposed peaty-sandy and sandy
uplands and islands formed during the Last Glacial sea-level lowstand (third and second
terrace, respectively).
Third Terrace
Paleo fluvial sands and intercalated root horizons dated at ~88-43 ka BP (ka = 1000 a)
form the minimum start of the sediment succession comprised by the present-day Lena
Delta area. Evidence from heavy mineral studies supports that they derive from the
Lena River. Outcrop, grain size and total organic carbon data show that the sedimentary
facies is comparable to modern floodplain environments. The fluvial sands represent the
lower section of the third terrace (0 to 14 m a.s.l.).
Evidence for sedimentation activity during the second half of the Weichselian (43-14
ka BP) is restricted to the locally originated Ice Complex. According to grain size,
heavy mineral and total organic carbon studies this is a polygenetic and organic-rich
formation derived from and positioned at the foots of the north Yakutian mountains
(Chekanovsky and Kharaulakh Ridges). In the Lena Delta area they form the cover of
* accelerator mass spectrometry and infrared optically stimulated luminescence

Zusammenfassung/Summary _____________________________________________________________________________________
vii
the third terrace (14 to 35 m a.s.l.) upon the lower sandy layers mentioned above. The
strong facial change between the lower sand and the Ice Complex is seen as a strong
indication for tectonic influence on sediment dispersal and strata formation in the area.
Lena River derived sediments are not preserved from this period, but they are assumed
in a main river channel flowing to a paleo Lena Delta located further north.
Second Terrace
The phase of general environmental stability during Ice Complex formation was
followed by a new episode of incision and subsequent fluvial accumulation of the Lena
River between >14.5 to 10.9 ka BP. It took place in a braided system under conditions
of high peak discharges and diminished vegetation. The thick sandy sequences
characteristic for this period represent the second terrace (10 to 30 m a.s.l.). In the
beginning of the Holocene evidence for fluvial activity decreases in the northwestern
area of the Lena Delta. It is ultimately replaced by aeolian activity and continuing, deep
reaching thermokarst (<7 ka BP). This age (uncalibrated 14C years) has been revealed
from sediments of Lake Nikolay.
Thermokarst processes are taking place in the abandoned fluvial pathways. They
explain the origin of the numerous lake basins located on the second terrace including
Lake Nikolay as the largest and deepest of them. The onset of the thermokarst coincides
with the regional Holocene climate optimum. Since ca. 5 ka BP the region has been
under environmentally stable conditions. The morphology of the thermokarst terrain
could be identified with the aid of high-resolution seismic data and ground penetrating
radar (GPR). The stratigraphy of adjacent zones of limnic and cryo-terrigenic
environments has been recorded in combined measurements. Whereas processed high-
resolution seismic data is an effective means to display the water-saturated lake basin
fills, GPR profiles have been especially applicable for frozen ground surrounding the
lake depressions. In addition, seismic data show that the single thermokarst basins have
a distinctive zone of thawed subground (i.e. talik) below them. The expansion of the
talik leads to sediment settling and is essentially responsible for the continuing depth
increase of the lake.
First Terrace
The fluvial succession continues with the first terrace sediments (0 to 10 m a.s.l.) of
Holocene age (<8.5 ka BP). The abandonment of the northwestern sector and the shift
of the main depo-center towards the northeastern/eastern sector are associated with a

Zusammenfassung/Summary _____________________________________________________________________________________
viii
tectonic downwarping along a N-S trending fracture zone separating both areas. The
rise of the Laptev Sea water level was established at its modern position in the middle
of the Holocene and the recent deltaic fill of the river channels was initiated. Soils have
been developing on the higher sites of the alluvial plain of the first terrace. Age
inversions along the sediment profiles point to the high-energetic sedimentary
environment including the uncertainty of river arm migration on the delta plain.
Thermo- and fluvial erosion of second and third terrace sediments proceeds.
In contrast to a number of scientists believing that Pleistocene glaciers partly covered
the Lena Delta region the analytic data of this study do not support this - neither
sedimentological (for example in the occurrence of tills or moraines) nor geophysical
(for example in the detection of massive underground ice derived from glaciers).
1 Introduction _____________________________________________________________________________________
1
1 Introduction
1.1 Scientific Background Delta Characteristics River deltas are the main gateway for terrigenous sediment flux to the oceans during
transgression or highstands of sea level, when much river-borne material is trapped at
the coast to form thick sediment sequences. Extensive research on modern and ancient
delta sequences has provided an advanced understanding of the important processes and
facies within these settings (Fisk and McFarlan, 1955, Morgan, 1970, Galloway, 1975,
Nemec, 1990, Orton and Reading, 1993, Stanley and Warne, 1994, Postma, 1995). Yet,
all deltas differ widely in morphology and stratigraphy, reflecting complex interplay
among controls such as climate, eustasy, basin geology, catchment geology and
tectonics. Studies of Arctic delta processes, delta morphology and facies development
are relatively limited compared to the extensive literature on low-latitude deltas (Jenner
and Hill, 1998). Whereas the development of all deltas is governed by the interaction of
sediment supply, the stability of the receiving basin and wave and tide processes, an
additional primary factor in Arctic delta settings is the influence of climate, i.e.
permafrost and ice (Reimnitz, in press). The effects of frozen ground are reflected in the
sedimentary facies of northern latitude deltas and on sediment processes at the river
mouth. Such is the case for the north Siberian Lena Delta. The most direct
sedimentological indicator of its arctic setting are cryogenic features like ice wedges
and ice-bond deposits, which are widely spread in the delta plain. But also the
seasonally dependent water discharge is characteristic and different from deltas in lower
latitudes. It occurs mainly after ice break-up in early summer.
The Lena Delta Setting The Lena Delta is the largest delta in the Arctic and the second largest in the world
covering an area of 3.2 x 10⁴ km2 (Gordeev and Shevchenko, 1995). This is twice the
area of the Canadian Mackenzie Delta, which follows second and is one of the most
investigated deltas in the Arctic (French and Heginbottom, 1983, Walker, 1998). The
Lena River is 4400 km long and has its origin in the Baikal Mountains more than 20° of
latitude to the south. In addition to the Baikal area the Lena River also drains part of the
Siberian platform. The Lena River is a good example of those long arctic rivers that
transport the characteristics of the temperate latitude of their origin to the coast
(Gordeev and Shevchenko, 1995, Walker, 1998). These characteristics are observed far
1 Introduction _____________________________________________________________________________________
2
out in the sea. With the river´s second largest discharge (525 km3/yr) in the Arctic the
Lena Delta is the main connection between interfering continental and marine processes
within the Laptev Sea (Rachold et al., 2000). Sediments of the Laptev shelf off the Lena
Delta reflect the dominant influence by the Lena River for example on the heavy
mineral composition (Peregovich et al., 1999), the clay composition (Müller and Stein,
2000), the occurrence of freshwater algae (Matthiesen et al., 2000) and the organic
matter characteristics (Rachold and Hubberten, 1998). In addition, sediments
transported to the sea are partly incorporated into the sea ice (Dethleff et al., 2000).
At present, the delta surrounds a distinctive pattern of upstream and lateral islands.
Apart from a few Paleozoic and pre-Pleistocene rocky outcrops there are numerous
small sedimentary isles, only hundreds of meters or a few kilometres in length.
Geomorphologically a subdivision can be made to them into three terraces (Grigoriev,
1993). The first terrace (1-12 m a.s.l.) including active floodplains covers the main part
of the eastern delta sector between the Tumatskaya and the Bykovskaya branches (Fig.
1-1). This terrace is assumed the „active“ delta. The western sector between
Tumatskaya and Olenyokskaya branches consists of mainly sandy islands, from which
Arga Island is the largest. It has a diameter of 110 km and represents the major part of
the second terrace (20-30 m a.s.l.). Sandy sequences covered by the so-called “Ice
Complex” form the third terrace (30-55 m a.s.l.).
Arga Island has many lakes and is generally uncut by river branches. In contrast, the
rest of the delta area holds hundreds of branches. Of these, four are of major importance
and carry the bulk of the water. The largest, known as Trofimovskaya branch, has been
diverted strongly toward the east (Fig. 1-1). It receives 61% of the annual water
discharge, it is followed by the Bykovskaya branch with 25% towards southeast, by the
Tumatskaya branch to the north and by the Olenyokskaya branch to the west, each of
them with 7% (Alabyan et al., 1995, Ivanov and Piskun, 1995). The month of maximum
flow of the Lena River is June; more than one-third of the annual discharge occurs
during that month. The June amount is about 60 times that of April (Gordeev and
Sidorov, 1993). Starting in autumn the Lena Delta as well as the Laptev Sea is then
usually ice-covered for 8-9 months per year (Timokhov, 1994, Gordeev and Sidorov,
1993).
Winter ice and permafrost govern the stratigraphic development of interchannel and
channel-mouth deposits. Annual displacement of lateral and mid-channel bars is
estimated 50-60 m and is to be explained by the widespread distribution of permafrost

1 Introduction _____________________________________________________________________________________
3
in the delta plain (Korotayev, 1986). It retards all reworking of sediment along channels
to a rate of only one half or one third of that on rivers outside the permafrost zone. Ice
cover confines flow at primary channel mouths, promoting the bypassing of sediments
across the delta front during peak discharge in spring. Permafrost minimizes
consolidation subsidence and accommodation near the shore. This further enhances
sediment bypass.
Figure 1-1: Geomorphologic overview of the Lena Delta according to Grigoriev (1993). Values for the
river runoff in the major delta branches are added after Alabyan et al. (1995).
The modern alluvium consists of fine-grained sediment load (Grigoriev, 1993).
However, despite a low tidal range of 0.4 m (Ashik et al., 1999), the Lena Delta is not
prograding seaward but rather is undergoing shoreface erosion (Rachold et al., 2000).
During summer thermoerosion and –abrasion induces sediment transport and removes
sediment oceanward from the delta system into shelf channel and shelf floor
environments. These environments are considered separate depositional systems. In
contrast to the generally relative uniform physiography of the delta- front shoreline, the

1 Introduction _____________________________________________________________________________________
4
local outline becomes complex due to irregular thermokarst terrain. The ingression of
the sea into valleys and breached lake basins is attributed to the flooding by rising
relative sea levels (Romanovskii et al., 2000, Solomon et al., 2000).
Onshore wave-creating winds are moderate to occasionally strong in summer when the
Laptev Sea has become open water. Maximum wave heights during storms in the
Laptev Sea are in the range of 4-6 m (Are, 1996), but the wave incidence is attenuated
markedly in the nearshore area by a delta fringe along the 2-m isobath (Korotaev, 1986).
Below the fast ice in winter the gently sloping apron becomes frozen and is regarded a
typical feature of arctic river deltas (Are and Reimnitz, 2000).
Major controls on Lena Delta development during the Late Quaternary are similar to
those of other deltaic systems, including eustatic sea-level rise, sediment load and
tectonics (Goodbred and Kuehl, 2000, Stanley and Chen, 2000). However, for the Lena
Delta system the latter two controls seem dominant with 17.6 x 10⁶ t/yr of total
suspended matter discharge (Gordeev and Sidorov, 1993) that contribute to create the
largest delta in the Arctic (Walker, 1998) and active plate-driven tectonics in the area
(Mackey et al., 1998, Franke et al., 2000).
There are some investigators, who were concerned with reconstructing major stages in
the history of the Lena Delta or parts of it (Galabala, 1987, 1997, Korotaev, 1986,
Kunitsky, 1989, Grigoriev, 1993, Grosswald et al., 1999, Are and Reimnitz, 2000).
Despite the broad knowledge obtained various problems about geologic-
geomorphologic development and sediment environments of delta deposits remained
open. Paleogeographic reconstructions for the Late Pleistocene and the Holocene suffer
from a lack of analytical data sets, which allow interpreting questionable sedimentary
facies and environments. That is;
• some scientists believe that Pleistocene glaciers partly covered the Lena Delta
(Grosswald et al., 1999), but direct glacial traces in this area have not been found yet.
• Alluvium of the first terrace and modern floodplain levels are determined as Holocene,
but the exact ages of the borders between the Holocene levels are unknown (Grigoriev,
1993).
• The age correlation between the sandy second terrace (Arga Island) and the third
terrace (sandy sequences below ice-rich peaty sand, so-called “Ice Complex”) is still
discussed (Are and Reimnitz, 2000).
• The genesis of the sandy deposits of the second terrace is in debate (op. cit.).

1 Introduction _____________________________________________________________________________________
5
• The majority of the scientists believe that the Ice Complex was formed by fluvial and
polygenetic processes (Grigoriev, 1993, Sher, 1999), but also a loess-like origin is
proposed (Tomirdiaro, 1984).
• The genesis, age and morphology of the large and deep lakes on the second terrace
(Arga Island) is unknown (Are and Reimnitz, 2000).
1.2 Aims and Objectives Primary objectives of this thesis are directed to above listed concerns in order to
contribute to the ongoing debate. For the study a broader interdisciplinary methodology
is applied, whose important elements are:
(i) core and outcrop sampling at representative sediment sites in the Lena Delta. They
are regarded as representative according to previous works conducted in the area
(Grigoriev, 1993). (ii) Characterizing the sedimentary properties of terrace deposits (i.e.
grain size characteristics, heavy mineral associations, total organic carbon content). (iii)
Establishing an age frame for the morpho-sedimentary development of the Lena Delta
by using radiocarbon and luminescence datings. (iv) Application of geophysical
profiling (high-resolution seismic and GPR) in connection with sediment drilling and
lake sediment analysis (i.e. grain size characteristics, total organic carbon content,
isotopic ratios of the total organic carbon) in order to reconstruct the history of Lake
Nikolay and its surrounding environment. Lake Nikolay is the largest amongst the lakes
on Arga Island, and, therefore, might mirror large parts of the history of Arga Island and
the second terrace. (v) The potential is examined for the use of GPR data in comparison
with processed digital high-resolution seismic data for lake sediment profiling.
1.3 Synopsis
The study is written in the form of three papers representing independent but
successive units. Overlapping statements may occur due to the article structure. In the
following chapter 2, an interpretation is given on the origin of Lake Nikolay´s
surrounding and the formation of the lake basin. In chapter 3, the attention is devoted to
compare methodically the two geophysical recording systems used at Lake Nikolay.
Chapter 4 focuses on reconstructing the paleogeography of the three major
geomorphologic terraces building up the Lena Delta. Their development is regarded in
characteristic evolutionary stages for the sedimentation history of the delta area. The
chapter 5 summarizes the results by synthesizing the morpho-sedimentary succession
and points to a selected open question where future research may be directed to. Further

1 Introduction _____________________________________________________________________________________
6
information on the range of applied sedimentological methods and the measurements
conducted to the samples is presented in the appendix. This includes a report on the
measurements conducted to obtain luminescence (IR-OSL) ages for sandy sediments,
which are essential for this study. This report will be published very soon as well.
It is necessary to note that the term “Lena Delta” or “Lena Delta area” generally is
used in a broader geographical sense, related to the overall fan-like shape of the entire
sedimentation environment as seen from space or on topographic maps, respectively.
This is at first regardless of the virtual genesis of the various sedimentary formations,
which it comprises.

2 Evolution of Lake Nikolay ________________________________________________________________________________________
7
2 Evolution of Lake Nikolay, Arga Island, Western Lena Delta, during Late Pleistocene and Holocene time*
2.1 Introduction According to Grigoriev (1993) the Lena Delta protuberating into the North Siberian
Laptev Sea can be subdivided into three major geomorphological terraces (Fig. 2-1). The
northeastern part of the delta (first terrace including modern floodplain levels) is assumed
the "active" delta with accumulations of mainly sandy sequences and alluvial organic
matter of late Holocene age (Schwamborn et al. 2000a). The northwestern part consists of
mainly sandy deposits (second terrace). IR-OSL datings show a Late Pleistocene age for the
uppermost layers of the second terrace (Krbetschek et al., Appendix). Third terrace deposits
are found at the southern rim of the delta plain.
Figure 2-1: Location of the study site Lake Nikolay. The lake is positioned on Arga Island, which represents
the major part of the second terrace in the Lena Delta (after Grigoriev, 1993).
* Schwamborn, G., Andreev, A.A, Rachold, V., Hubberten, H.-W., Grigoriev, M.N., Tumskoy, V., Pavlova,
E.Yu., Dorozkhina, M.V., Polarforschung 70 (2000). Reprint kindly permitted.

2 Evolution of Lake Nikolay ________________________________________________________________________________________
8
They consist of ice-rich peaty sand accumulations (so-called Ice Complex) overlying
sequences of sandy sediments. They are of Early to Middle Pleistocene age (Krbetschek et
al., Appendix). Today the Lena Delta is part of the permafrost area of northern Siberia
where permafrost thickness reaches 500-600 m (Gavrilov et al., 1986). However, there is a
disagreement upon the extent of the ice sheet in the area during Late Pleistocene time.
Especially the origin of the sandy second terrace and the age and origin of the numerous
lakes located there is in discussion (Are and Reimnitz, 2000). Viewpoints contrary interpret
the history of Arga Island, which forms the main part of the second terrace, as glacial or
periglacial, respectively. One view favors a panarctic ice sheet covering the entire Arctic
continental margin during the last glaciation cycle (Grosswald and Hughes, 1999) whereas
another viewpoint regards the Eurasian continental margin as partially ice-free during that
time (Galabala, 1997). Deposits forming Arga Island developed in a distance to the
perimeter of a northern ice sheet.
Arga Island, 110 km in diameter, consists of well-sorted quartz sands and ice wedges
penetrating the sandy sediments are abundant. The Arga deposits are presumably of fluvial
origin (Grigoriev, 1993). However, several authors have considered other processes to
explain their genesis, i.e. a marine or lagoonal derivation, a limnic-alluvial or an alluvial-
aeolian origin (Grigoriev et al., 2000 and various authors cited therein). The sedimentary
environment is attributed to an intracontinental or half-open basin partly connected to the
sea. From the glacial viewpoint ice-rich frozen sands and silts are suggested that
accumulated in meltwater paleo-basins confined by a proximal marine ice sheet from the
north (Grosswald, 1998). Meltwater streams may even have tunneled under the grounding
line of the panarctic ice shelf (Grosswald and Hughes, 1999). The periglacial viewpoint
expressively excludes oscillations of the shelf ice sheet onto land and regards the sandy
accumulations as outwash plains derived from local snow glaciers located in the
mountainous areas on continental Siberia at the relevant time (Galabala, 1997). This also
includes a considerable amount of aeolian accumulation (Fig. 2-2).
Upon these sandy sediments a lake relief developed in the centrally positioned watershed
of the island. The long axis of most of the lakes shows a submeridional orientation
typifying lake depressions of elliptical shape. The maximum water depth is in the range of
10-30 m for most of the lakes (Grigoriev, 1993). These deep lake basins are surrounded by

2 Evolution of Lake Nikolay ________________________________________________________________________________________
9
shallow submerged rims (up to 1 km broad) with water depths of less than 2 m. Often two
or three basins merge to create a composite lake. Local thaw subsidence may create minor
depressions in the shallow lake areas. Lake Nikolay shows this typical form and bathymetry
(Fig. 2-3a).
The central lake basins are believed to be either fluvial or lagoonal or deflation
depressions that have been modified by aeolian and cryogenic processes as discussed in
Grigoriev et al. (2000 and authors cited therein). Another suggestion relies on the
assumption that the lake relief on Arga Island is a typical lake-thermokarst relief.
Figure 2-2: There are two main hypotheses upon the origin of the sandy deposits and the lake area placed in
the western Lena Delta: a glacial (a) and a periglacial (b) one. Map (a) points to the geomorphologic
complexes of the north Yakutian lowland and adjacent areas simplified according to Grosswald (1998) and
Grosswald et al. (1999). Map (b) shows the paleogeographical sketch-map of the Weichselian Glaciation in
Northern Siberia according to Galabala (1997).
large ice-shoved features
direction of horizontal glacial pressure
direction of long axes of the tundra oriented forms
inferred ice flowlines
maximum extension of oscillating ice sheets on land
areas of wide spread stable firn ice and snow glaciers
probable areas of shelf ice sheet and its southern limit
accumulative plaines resulting from erosional activities of firn and snow glaciers: (a) formed by loam, sandy loam and sand with polygonal ice wedges, (b) formed by accumulation of fresh water ground ice with mineral columns
ab
Olenyok
Lena
AldanVilyuy
Anabar
Novosibirsky Islands
Yana
Indig
irka
Koly
ma
Lena
(b)
500 km
Lena
(a)
100 km
2 Evolution of Lake Nikolay ________________________________________________________________________________________
10
A thawing of excess ice bodies in the subground is postulated in order to explain the thaw
settlement below the lake basins, even though discrete ice bodies have not been detected
yet (Are and Reimnitz, 2000). In contrast, the glacial viewpoint explains the lake basins as
erosion forms connected with glacial furrows (Grosswald et al., 1999).
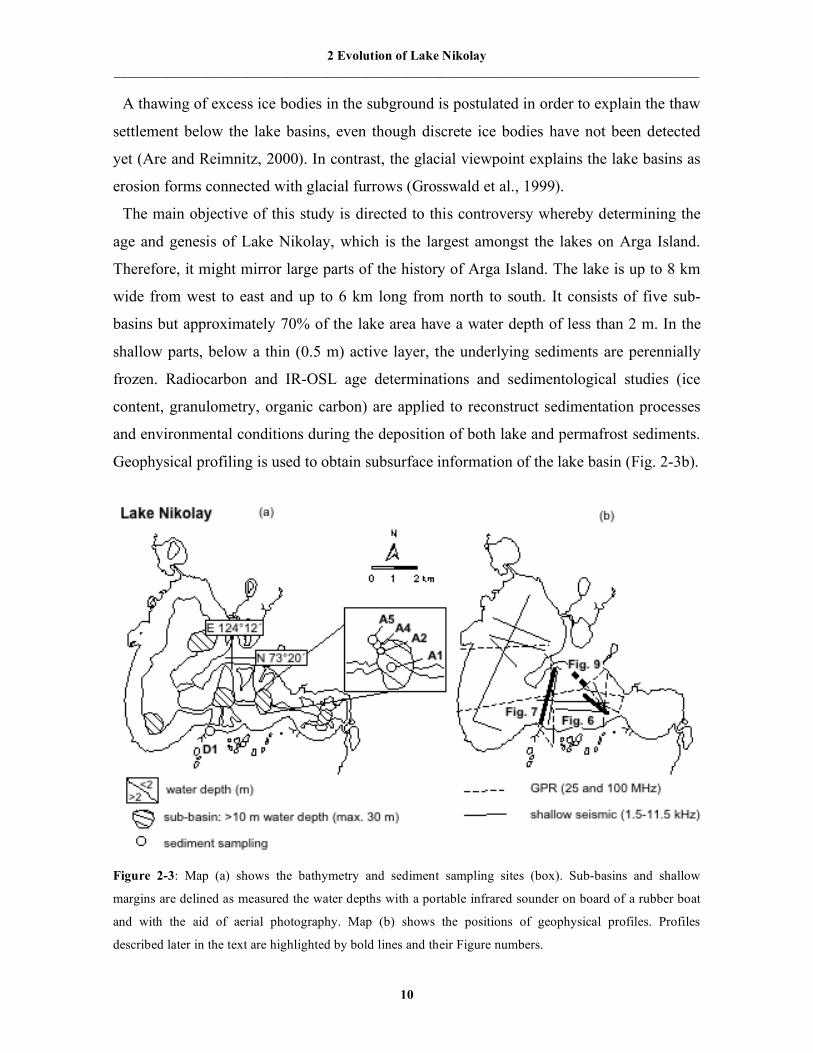
The main objective of this study is directed to this controversy whereby determining the
age and genesis of Lake Nikolay, which is the largest amongst the lakes on Arga Island.
Therefore, it might mirror large parts of the history of Arga Island. The lake is up to 8 km
wide from west to east and up to 6 km long from north to south. It consists of five sub-
basins but approximately 70% of the lake area have a water depth of less than 2 m. In the
shallow parts, below a thin (0.5 m) active layer, the underlying sediments are perennially
frozen. Radiocarbon and IR-OSL age determinations and sedimentological studies (ice
content, granulometry, organic carbon) are applied to reconstruct sedimentation processes
and environmental conditions during the deposition of both lake and permafrost sediments.
Geophysical profiling is used to obtain subsurface information of the lake basin (Fig. 2-3b).
Figure 2-3: Map (a) shows the bathymetry and sediment sampling sites (box). Sub-basins and shallow
margins are delined as measured the water depths with a portable infrared sounder on board of a rubber boat
and with the aid of aerial photography. Map (b) shows the positions of geophysical profiles. Profiles
described later in the text are highlighted by bold lines and their Figure numbers.

2 Evolution of Lake Nikolay ________________________________________________________________________________________
11
2.2 Methods Fieldwork and sampling was carried out during the expeditions LENA 1998 (Rachold and
Grigoriev, 1999) and LENA 1999 (Rachold and Grigoriev, 2000). Geophysical surveys and
sediment sampling have been performed for both lake and permafrost deposits. In addition,
mathematical modeling has been applied to aid geophysical data interpretation.
2.2.1 Geophysical Profiling A survey of shallow seismic and ground penetrating radar (GPR) was run to explore the
mosaique of limnic and cryo-terrigenic environments (Fig. 2-3 (b)). Seismic studies
concentrated on the deeper parts of the lake where the water depths range from 10 to 30 m
(the greatest depth in one of the sub-basins). A sediment echo sounder (GeoChirp 6100A
from Geoacoustics, UK) with high-frequency pulse of 1.5 to 11.5 kHz installed aboard a
rubber boat was used for surveying the deeper lake basins. It allows a theoretical vertical
resolution of ca. 35 cm (Quinn, 1997) of the processed Chirp data. Recording time of the
GeoChirp is restricted to a time window of 130 ms TWT (two-way travel time). The
seismic reflections are automatically processed during the cruises applying a cross-
correlation and analogue print-outs are provided already in the field. These prints are used
for presentation in this paper. An approximation of penetration depth is based on assuming
average sonic velocities of 1420 m/s for water and 1490 m/s for unconsolidated limnic
sediments (Niessen and Melles, 1995) and 1800 m/s for compressed sandy sediments
(Eyles and Mullins, 1997, Niessen and Jarrard, 1998).
GPR studies allowed extending the subsurface profiling to the marginal parts of the lake
where wave penetration into the permafrost was possible by electromagnetic (EM) means.
Profiling has been carried out using 25 and 100 MHz antenna pairs from the winter ice
cover in connection with drilling activities. GPR is an established technique for permafrost
investigations (Annan and Davies, 1976, Judge et al., 1991, Robinson et al., 1997) and the
potential of this method for surveying lake sediments through an ice cover has been
documented (Moorman and Michel, 1997).
A RAMAC impulse radar system (Mala/Geoscience) was used for GPR profiling. In order
to determine the velocity-depth function of the EM waves, common mid-point (CMP)
measurements were recorded at characteristic sites like shallow lake areas, deep basins and
on land. To verify the CMP measurements the thickness of the lake ice and the water

2 Evolution of Lake Nikolay ________________________________________________________________________________________
12
depths were measured in the field with a plumb line and a measuring tape. During the
summer surveys on land in August 1998 the thickness of the active layer was determined.
The propagation velocities for the EM waves were measured 55 m/µs for saturated lake
sediments, 161 m/µs for permafrost below the lake ice and 173 m/µs for lake ice. The value
for water is set to 33 m/µs according to Davies and Annan (1989). Estimates of depths in
different media are based on these values. As the resolution of GPR is dependent on the
wavelength in the different media (Moorman and Michel, 1997) the approximate vertical
resolution for example with the 100 MHz antenna pair was calculated in the permafrost 0.7
m and in the water-saturated lake sediments 0.3 m, respectively. In total, 13 profiles were
collected with data for about 25 km of lake sediments. The field survey was operated by a
computer and the resulting reflections were on-line visualized on the screen. Lab
processing of the radar sections included time-zero correction, band-pass filtering,
automatic gain control and corrections for topographic migration wherever necessary.
During the field work GPR was used to determine appropriate lake sediment coring sites.
Vice versa, the core data are used to interpret the reflection pattern of the radargrams.
2.2.2 Sediment Sampling A drilling transect was undertaken to obtain continuous core samples from one of Lake
Nikolay´s sub-basins to the shallow margin around it. The sampling sites (cores A1, A2, A4
and A5) are displayed in Figure 2-3 (a). Vertical drilling in both frozen and unfrozen lake
sediments was performed from the ice using a frozen-ground rotary coring kit consisting of
an engine power-auger unit, iron rods, and iron core barrels. Samples of second terrace
deposits around the lake have been retrieved by drilling into the permafrost at a manually
cleaned outcrop near the shore. A HILTI drilling machine was used to recover frozen
samples horizontally out of a 5 m sandy sequence (sampling site D1).
Core sections were cleaned, described and stored immediately after sectioning. By
packaging each individual sample in the field, it was unnecessary to maintain the samples
in their frozen state during transit to the laboratory.
2.2.3 Laboratory Methods After the sediment samples had been examined for moisture (gravimetric water content)
the grain-size distribution was determined by laser particle sizing (LS200, Coulter Corp.)
for both core and outcrop sediments. Individual samples were oxidized (3% H2O2) to

2 Evolution of Lake Nikolay ________________________________________________________________________________________
13
remove organic matter and dispersed (10% NH4OH) to diminish surface tension. Total
organic carbon (TOC) was analyzed with a Metalyt-CS-1000-S (Eltra Corp.) on pulverized
samples after removal of carbonate (10% HCl) at a temperature of 80°C. International
standard reference materials (GSD, 9, 10, 11) as well as double measurements were used to
check the external precision. The analytical precision of the analyses is ±5% for TOC
contents >1 wt% (wt = weight) and ±10% for TOC contents <1 wt%.
A stable carbon isotope profile was determined for organic material of core A1 from the
basin center. 13C/12C isotope ratios were measured using a FINNIGAN DELTA S mass
spectrometer after removal of carbonate with 10% HCl in Ag-cups and combustion to CO2
in a Heraeus elemental analyzer (Fry et al. 1992). Accuracy of the analytical methods was
checked by parallel analysis of international standard reference material. The analytical
precision of the carbon isotope analyses is ± 0.2 ‰.
Finally, the pollen record of core A1 was analyzed. Pollen samples were prepared using
standard techniques (Føgri and Iversen, 1989). For each sample 200-300 terrestrial pollen
grains were counted at 400x magnification. Spores were counted in addition and the
relative frequency of pollen, spores and algae was determined according to Berglund and
Ralska-Jasiveczowa (1986). Selected organic-rich layers and plant remains were used for
AMS radiocarbon dating at the Leibniz Laboratory, Kiel. Ages cited in the text are
expressed in radiocarbon ages (yr BP) unless calibrated into calendar years before present
(cal. yr B.P.) according to the intercept method (Stuiver et al., 1998).
2.2.4 Mathematical Modeling In one seismic profile, a prominent reflector is interpreted to show the boundary between
frozen and unfrozen sediment below one of the sub-basins. To test this hypothesis a
mathematical model has been calculated illustrating the thawing propagation. The two-
dimensional axisymmetrical model used takes into account cryolithogenic properties and
lake evolution in time. The equation for heat conduction is described by a finite differences
method. For simulation, the computational area was set to a size of 3600 m in horizontal
and 3000 m in vertical direction. The initial distribution of temperatures was determined
according to the boundary conditions. They are based on measured field data (water
temperature, depth, permafrost temperature according to Schwamborn et al. 2000b) and
include the age of the lake (Schwamborn et al., 2000a). The thawing development below

2 Evolution of Lake Nikolay ________________________________________________________________________________________
14
the deeper basin only has been estimated excluding the shallow-water margin around the
basin. The following presumptions are made:
1. Lake Nikolay predominantly has a thermokarst genesis; i.e. it has developed due to the
thawing of frozen deposits that have a thickness of at least 10 m and a volumetric ice
content of 25%.
2. Lake formation started at 7000 14C yr BP.
3. The occurrence of massive ice bodies is excluded and, thus, does not affect subsidence.
4. The thermophysical properties of the deposits at Lake Nikolay that could not be
determined are similar to those of sand deposits in the north of Western Siberia (Ershov,
1984). They have a comparable genesis, grain size and moisture (ice content). Since
these parameters are changeable, they are reviewed in versions of different groups (N1
through 3) of thermophysical properties (Table 2-1).
Region groups λ f λ t Cf Ct Q γ W
Common data for West Siberia,
fine sand, laIII-IV
N 1
2.2
2.16
1920
2630
113970
1700
0.2
Common data for West Siberia,
dusty sand, laIII-IV
N 2
1.82
1.46
1920
2630
113970
1700
0.2
Common data for West Siberia,
fine sand, laIII-IV
N 3
2.05
1.99
1860
2520
106995
1680
0.19
λf = frozen thermal conductivity [W/(m*K)] λt = unfrozen thermal conductivity [W/(m*K)] Cf = frozen heat capacity [J/m3*K] Ct = unfrozen heat capacity [J/m3*K] Q = latent heat [J/m3] γ = density [kg/m3] W = sand moisture
Table 2-1: Thermal properties of deposits adopted for the simulation according to Ershov (1984) and
Gavrilov et al. (2000). Three groups of Siberian sandy deposits (N1-N3) have been defined.
5. The geothermal heat flux at the lower boundary is 50 mW/m2 and the dynamics of mean
annual ground temperature are according to Vostok ice core data from Antarctica (Petit
et al., 1999), which have been customized for the Laptev Sea region (Gavrilov et al.,
2000).

2 Evolution of Lake Nikolay ________________________________________________________________________________________
15
2.3 Results and Discussion 2.3.1 Land Deposits
An outcrop near the southern lake shore exposes about 5 m of fine-grained sand belonging
to the second terrace of the Lena Delta (site D1 in Figure 2-3 (a)). The sand is bound by
lens-shaped texture ice and contains a complex system of narrow ice veins. It is noteworthy
that the geomorphic situation at the southern shore banks, where site D1 is located, is more
stable than at the northern ones. Thermoabrasion is active around the entire lake, but
especially along its northern margin. Due to the high latitudinal position of the area,
insolation is higher at southerly exposed slopes. Destruction and retreat of the northern
shore banks is more rapid, therefore supporting a lake elongation towards the north. For
Lake Nikolay this relationship - insolation effects and bank retreat - is favoured against a
predominance of wave (wind) action influencing the lake’s shape as preferred in a review
of literature on the elongation of oriented thaw lakes in periglacial regions by French
(1996).
The sediments as found at the bluffs around Lake Nikolay are lacking pronounced
bedding structures and appear as massive fine-sandy accumulations. Throughout the
sequence of site D1, the sediments show similar grain size distributions with mean grain
sizes varying between 2.0 and 2.5 phi (1st statistical moment). They are well to moderately
sorted (2nd statistical moment: 0.8-1.4) and poor in organic content (TOC content ≤ 0.1
wt%). Gravimetric ice content of the frozen sands does not exceed 20 wt%. The ice veins,
up to 0.5 m wide, build up ice wedge polygons of 10 to 15 m diameters towards the surface.
Formation of the ice wedges is probably of Late Pleistocene to Early Holocene age as
deduced from oxygen isotope measurements (H. Meyer unpublished data). The results
resemble measurements from Bykovsky Peninsula, southeast of the Lena Delta, which have
been dated accordingly (Meyer et al., in press). Downwards the fabric of ice veins can
reach depths of 50 m and more as indicated by GPR records (Schwamborn et al., 2000c).
Luminescence datings, which were conducted to the sandy sequence, reveal a time span of
deposition from 14,500 to 10,900 yr BP (Krbetschek et al., in press). Since the post
Pleistocene transgression of the Laptev Sea only reached its modern coastline at about
6000-5000 yr BP (Holmes and Creager, 1974, Bauch et al., 1999, Romanovskii et al.,
1999), the sediments of Arga Island have to be related to a continental environment. The

2 Evolution of Lake Nikolay ________________________________________________________________________________________
16
high sedimentation rate implied by the overlapping ranges of the luminescence ages
probably is associated with a fluvial environment under upper flow regime. It has been
shown at comparable river bed sediments of the Russian Plain and of the same age that
periglacial river channels during and posterior to the Weichselian Glaciation were formed
under conditions of high water flow during spring that is believed to have been up to eight
times greater than the modern discharges (Panin et al., 1999, Sidorchuk et al., 2000).
Correspondingly, marine records from the outer Laptev Shelf have revealed that significant
climate changes at the termination of the Pleistocene led to rapid increases of sediment
supply to the Arctic Ocean after 15,000 and 13,000 yr BP (Müller and Stein, 2000,
Boucsein et al., 2000, Spielhagen et al., 1998). This is supported by seismic penetration
into pre-Holocene paleoriver channels identified on the Laptev Sea shelf in Parasound
profiles (Kleiber and Niessen, 2000). The seismic records and drilling results suggest that
the river runoff was continuous through the major valleys on the exposed Laptev Shelf with
increased input between approximately 13,400 and 10,000 yr BP. Furthermore, these events
seem to coincide with abrupt changes in the hydrological and environmental conditions in
the non-glaciated continental lowland areas of Siberia. Numerous permafrost sites show
evidence for a rapid increase of denudation linked with activation of different
geocryological (solifluction, thermokarst, thermal erosion etc.) and fluvial processes during
this time (Siegert, 1999). For example, the formation of the deep and wide valleys of
tributaries of the middle Lena River were dated to have occurred before 14,000 yr BP
(Katasonova and Ziegert, 1982). Pronounced thermokarst processes started at 13,000 yr BP,
for example on glacial deposits with dead-ice bodies in the Labaz Lake area (Taymyr
Peninsula) (Siegert et al., 1999) and at Ice Complexes in the central Yakutian lowland
(Katasonov et al., 1999). In general, the north Yakutian lowlands are thought to have
remained ice-free for the last 50,000 yr BP (Romanovskii et al., 2000). Massive bodies of
Ice Complexes in the area, as on Bykovsky Peninsula, have preserved a continuous record
of environmental history from the Early Weichselian to Holocene time (Schirrmeister et al.,
2000, Siegert et al., in press). These climate-induced formations can only form in non-
glaciated environments.
Summarized, a periglacial and continental environment is proposed for Arga Island during
Late Pleistocene time. Seasonally dependent river activity with higher peak discharges led

2 Evolution of Lake Nikolay ________________________________________________________________________________________
17
to high sediment transport and deposition of thick fluvial sequences in the North Yakutian
lowlands. Partially they are preserved in morphological terraces like Arga Island north of
the continental mountains or distributed along river valleys on the Siberian mainland as
shown by Galabala (1997).
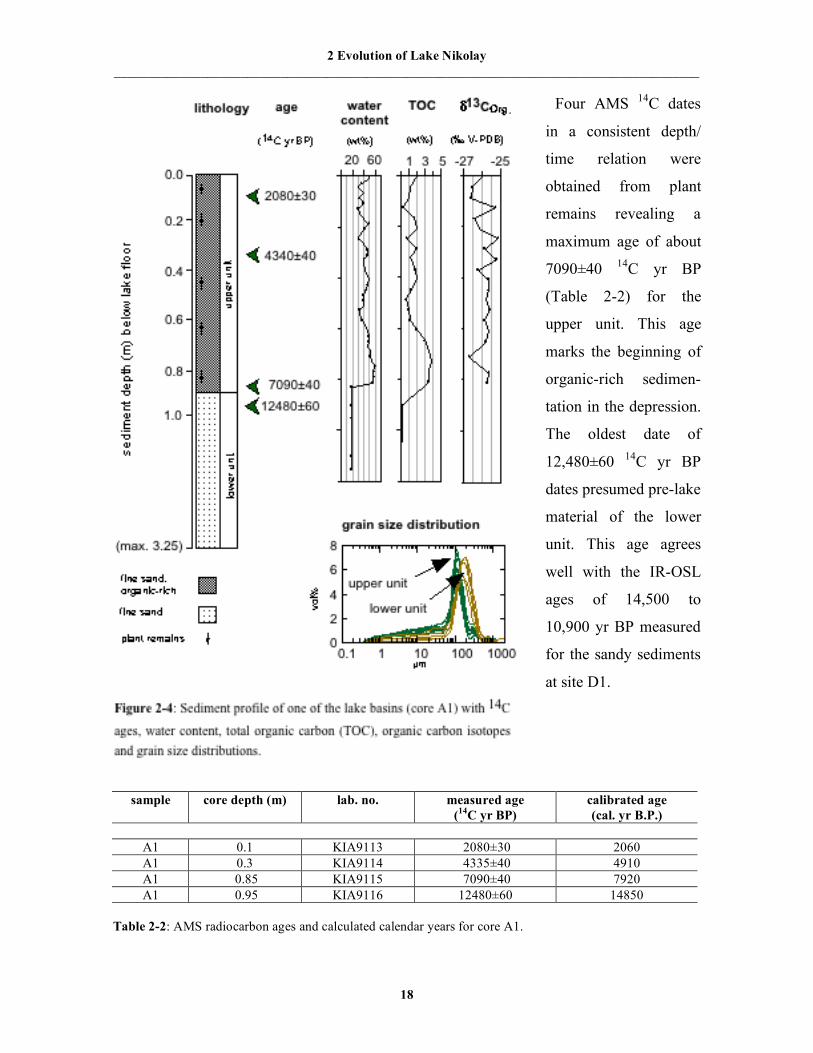
2.3.2 Lake Sediment Stratigraphy Lake basin sediments were sampled in the middle of one sub-basin (core A1) of Lake
Nikolay, where sedimentation is not affected by marginal gravitational sliding. Core A1 has
been recovered in a length of 3.25 m. Based on field description and according to physical
and biogeochemical measurements the core can be divided into two sedimentary units (Fig.
2-4). The upper unit (0.9 m) consists of organic-rich fine sand (max. TOC content: 3.9
wt%, water content: 30 to 60 wt%) with sporadical plant fragments. This unit is regarded as
lake sediment reaching from the modern status backwards in time. The lower unit of the
core (2.35 m) consists of organic-poor fine sand. The sands of this unit are interpreted to
have the same origin as the sediments at the bluffs around the lake. The structureless sandy
sediments of the lower unit from core A1 match the sandy deposits of site D1 in terms of
similar mean grain sizes (1st statistical moment: 2.4 to 3.4 phi), sorting (2nd statistical
moment: 1.3 to 2.1), low TOC content (<0.1) and water content (<20 wt%).
When comparing the grain size characteristics of the lower and the upper unit of core A1
both core units show a narrow range of grain size (Fig. 2-4). Yet, a shift in the median by
~64 µm from coarser grains in the lower unit to finer grains in the upper unit can be seen.
This is interpreted as resulting from a considerable aeolian contribution to the sedimen-
tation of the upper unit. In the modern lake sediments, sand derived from aeolian transport
admixes with presumably suspended material from the small inlets around the lake. This
may lead to a slight decrease in mean grain size due to a preferential transport of sand with
smaller grain sizes. The incomplete vegetation cover in the area and exposed ground would
have allowed considerable transport of silty sand by wind. Strong winter winds are capable
to expose bare ground and move sandy dust across the surface, as seen on the lake ice and
on land during our field work. Holocene aeolian sediments are widely spread on Arga
Island. They consist of silty sand with vertical plant stems and roots (Galabala, 1997).
2 Evolution of Lake Nikolay ________________________________________________________________________________________
18
Four AMS 14C dates
in a consistent depth/
time relation were
obtained from plant
remains revealing a
maximum age of about
7090±40 14C yr BP
(Table 2-2) for the
upper unit. This age
marks the beginning of
organic-rich sedimen-
tation in the depression.
The oldest date of
12,480±60 14C yr BP
dates presumed pre-lake
material of the lower
unit. This age agrees
well with the IR-OSL
ages of 14,500 to
10,900 yr BP measured
for the sandy sediments
at site D1.
sample core depth (m) lab. no. measured age
(14C yr BP) calibrated age (cal. yr B.P.)
A1 0.1 KIA9113 2080±30 2060 A1 0.3 KIA9114 4335±40 4910 A1 0.85 KIA9115 7090±40 7920 A1 0.95 KIA9116 12480±60 14850
Table 2-2: AMS radiocarbon ages and calculated calendar years for core A1.

2 Evolution of Lake Nikolay ________________________________________________________________________________________
19
2.3.2.1 Organic Carbon Isotope Record The organic carbon isotope record (δ13Corg.) of the lake sediments includes 21 samples of
bulk organic material of the upper unit from core A1. The low TOC values for the
underlying pre-lake sediments show that organic matter plays a negligible role (Fig. 2-4).
Organic-rich sediments of the upper unit have been deposited with a narrow range of
δ13Corg. values between –25 and –27 ‰ V-PDB. This is similar to δ13Corg. values from –
26.6 to -24.3 ‰ V-PDB of terrestrial plant material in this climatic region (Gundelwein,
1998). In contrast, fresh-water plankton generally has depleted δ13Corg. values of –30.0±3
‰ V-PDB (Ariztegui and McKenzie, 1995). Modern autochthonous macrophytes of Lake
Nikolay fall between these two ranges with values of –26.3 ‰ V-PDB. A negative
correlation between TOC concentrations and the δ13Corg. values in the upper unit is seen in
Figure 2-4. A prominent maximum in the TOC content at about 7000-6000 14C yr BP and a
few minor TOC maxima following towards the top of the section are paralleled by shifts of
δ13Corg. towards lighter values. These findings indicate that lighter δ13Corg. values can be
explained by an increasing contribution from plankton. Thus, light δ13Corg. values indicate
high lake-internal productivity and correlation with high TOC values mirrors lake
production for Lake Nikolay rather than terrestrial supply. It confirms the suggestion of
little supply from the catchment made by the grain size data. The generally rather small
range of carbon isotopes indicates that the lake environment seemed environmentally stable
at least after the bioproductive maximum between 7000-6000 14C yr BP.
2.3.2.2 Vegetation History Also the pollen spectra of core A1 provide information about paleoenvironmental changes
over the last 12,500 14C yr (Fig. 2-5). A high percentage of algae (Pediastrum and
Botryococccus) occur in the lower unit of the core radiocarbon dated at 12,480±60 14C yr
BP. This is associated with a shallow water environment, for example a water pond, at that
time. Pollen data reflect that scarce sedge and grass dominated the vegetation with some
Artemisia communities on dryer ground. Rare grains of Alnus fruticosa, Betula nana and
Salix may reflect the reworked character of the sediments, or these species might have
grown in well-protected places of the Lena River valley. Generally, very few pollen were
found in the sandy sediments between 0.9 and 1.0 m (zone I).

2 Evolution of Lake Nikolay ________________________________________________________________________________________
20
Figure 2-5: Pollen spectra of core A1. The determination of the relative frequency of pollen is based on the
sum of tree and herbs pollen. The percentage of spores is based on the sum of pollen and spores. The
percentage of redeposited taxa (Tertiary spores and Pinaceae) is based on the sum of pollen and redeposited
taxa. The percentage of algae is based on the sum of pollen and algae.
Pollen spectra deposited at the onset of the upper unit about 7000 14C yr BP (zone II)
suggest that shrubby vegetation (Alnus fruticosa and Betula nana) dominated around the
lake. High amounts of Cyperaceae, Ericales pollen, Equisetum spores and the presence of
Menyanthes trifoliata pollen indicate wide distribution of wetlands. Shrubby tundra with
shrub alder (Alnus fruticosa) and dwarf birch (Betula nana) dominated around the lake
from 7000 to 6000 14C yr BP. This requires that climate was significantly warmer then
today. Other pollen and plant macrofossil data from the area also support that the warmest
climate occurred during that time (MacDonald et al., 2000, Andreev et al., 2001, Pisaric et
al., 2001, Andreev et al., in press). The pollen concentration is highest, reflecting high
productivity of plant communities on Arga Island. These data are in a good agreement with
0
10
20
30
40
50
60
70
80
90
100
2080±30
4335±40
7090±40
12,485±60
20 40
Aln
us fru
ticosa-t
ype
20
Betu
la s
ect. N
anae
20
B. sect. A
lbae
20
Pin
us
20 40
Pic
ea
Salix
20 40
Poaceae
20 40 60
Cypera
ceae
20 40
Ericale
s
Menyanth
es trifo
liata
20 40
Equis
etu
m
Lycopodiu
m
Encaly
pta
20 40
Pin
aceae
20B
otr
yococcus
20
Pedia
str
um
200 400 600 800
Tota
l polle
n c
oncentr
ation
200 400 600 800
Polle
n a
nd s
pore
s s
um
Zone
III
II
I
Trees and Shrubs Herbs and Semishrubs Spores Redep. Algae
+
+
+
+
+
+
+
+
++ ++
+
+
+ + +
+
++
+
+
+
+
+
+
+
+
+
+
+
+
+
+
+
+
+
++
+
+
+
+
++
+
+
+
+
+ +
+

2 Evolution of Lake Nikolay ________________________________________________________________________________________
21
a TOC maximum between 7000 and 6000 14C yr BP in the lake sediments (Fig. 2-4).
Between 6000 and 5000 14C yr BP a decrease of Alnus fruticosa and Betula nana pollen
and a significant increase of long-distance transported pollen of Picea obovata, Pinus
pumila and P. sylvestris document changes in the local vegetation and a decrease in
productivity of the plant communities. Such deterioration of climatic conditions is probably
connected with the sea-level rise to its present level about 6000-5000 yr BP (Bauch et al.
1999). The climate after that time in many coastal Arctic regions became more maritime
(Andreev and Klimanov, 2000). Shrub alder communities were probably growing on the
island during that time. Disappearance of Alnus from pollen spectra after 4300-4200 14C yr
BP is in a good agreement with pollen data from Bykovsky Peninsula, southeast of the
Lena Delta, where Alnus fruticosa pollen also declined about that time (Andreev et al., in
press). It is interesting to note that the youngest Larix remains found above the modern
treeline (Tit-Ary Island area) are also dated at 4200 14C yr BP (MacDonald et al., 2000).
Pollen data suggest that climate during that period was the most favorable for the terrestrial
and limnic ecosystems. Pollen spectra dated at 4000-2000 14C yr BP reflect that herb-
shrubby tundra with dwarf birch (Betula nana) dominated around the lake during this
period. Relatively high amounts of reworked Pinaceae pollen and Encalypta spores (moss
growing on disturbed soils) reflect scarce vegetation cover during that time.
Vegetation cover and climate became similar to modern conditions at about 2000 14C yr
BP (zone III). Open sedge and grass communities have been dominating in the area since
then. The high percentages of long distance transported pollen such as Picea and Pinus
reflect low pollen productivity of local plant communities.
2.3.2.3 Seismic Stratigraphy of Basin Fills As has been shown Lake Nikolay is dominated by sandy sediments. The basin fill covers
different subaqueous relief levels and varies in thickness in the decimeter to meter range
(Schwamborn et al., 1999). Based on the geometry of subbottom profile shown in Figure 2-
6 three seismic units can be identified. They are referred to as seismic units (SU) 1 through
3.
SU 1: The uppermost boundary shows continuous to semi-continuous reflections of
laterally alternating high and low amplitudes. Changing backscatter of the reflectors may be
due to variations of organic matter content in the sediments, which at site A1 mainly

2 Evolution of Lake Nikolay ________________________________________________________________________________________
22
consist of organic-rich fine sand as seen in the core. The first reflections of SU 1 are
underlain by a narrow band, which is seismically transparent. The total thickness of both
parts of this unit amounts to 0.5-1.0 m. SU 1 continuously overlies the underlying units.
The draping of SU 2 by SU 1 without large differences in SU1 thicknesses indicates
sedimentation from “pelagic” rain. This suspensional transport through the water column
may be promoted by the small inflows shown in Figure 2-3 (a) and aeolian sediment supply
as mentioned earlier.
SU 2: The top of SU 2 is marked by a strong continuous reflector. Below this, the unit
alternates from transparent parts to parts with several internal reflectors. The unit locally
thins to decimeters and pinches out in the central parts of the basin, but thickens to as much
as 5 m at the margin. It suggests that slumping or turbidity currents will have caused the
observed geometry. Core A1 indicates the lithofacies of this unit as fine sand in the relevant
part of the core. The water content changes sharply from 30 to 60 wt% in the upper part of
the core to about 20 wt% in the lower part, which is relevant to SU 2. This contrast in water
content is interpreted to have caused the uppermost reflections of SU 2.
SU 3: The upper surface of SU 3 varies from smooth to hummocky. Below a strong upper
reflector, internal reflectors are horizontally stratified or spotty. The causes of the internal
reflectors of SU 3 remain unclear since the core A1 does not provide a clear indication. It
consists of fine sand only in the relevant part of the core as already described for SU 2.
Unfortunately, a multiple of the upper surface of SU 3 occurs in the seismic data. This
interferes with further stratigraphic interpretations and a lower boundary of SU 3 is not
clearly visible. Either wave penetration has ceased due to loss of energy or the restriction of
the GeoChirp´s time window prevents more subbottom detail. Assuming the same material
below the lake as around it, as indicated by sediment data from core A1 and site D1, the
subground of Lake Nikolay consists of massive fine sand down to at least 60 m sediment
depth. This is suggested by GPR measurements around site D1, which show a continuous
radar facies pointing to a uniform geological substrate of this thickness (Schwamborn et al.,
2000c).

2 Evolution of Lake Nikolay ________________________________________________________________________________________
23
Figure 2-6: Shallow seismic profile illustrating the acoustic stratigraphy of the studied basin sediments (VE:
~1:5). For interpretations of the seismic units 1 through 3 (SU 1-3) see the text. Approximate locations of
cores A1, A2, A4 and A5 drilled through the lake ice are added.
2.3.3 Talik Development
2.3.3.1 Seismic Indication
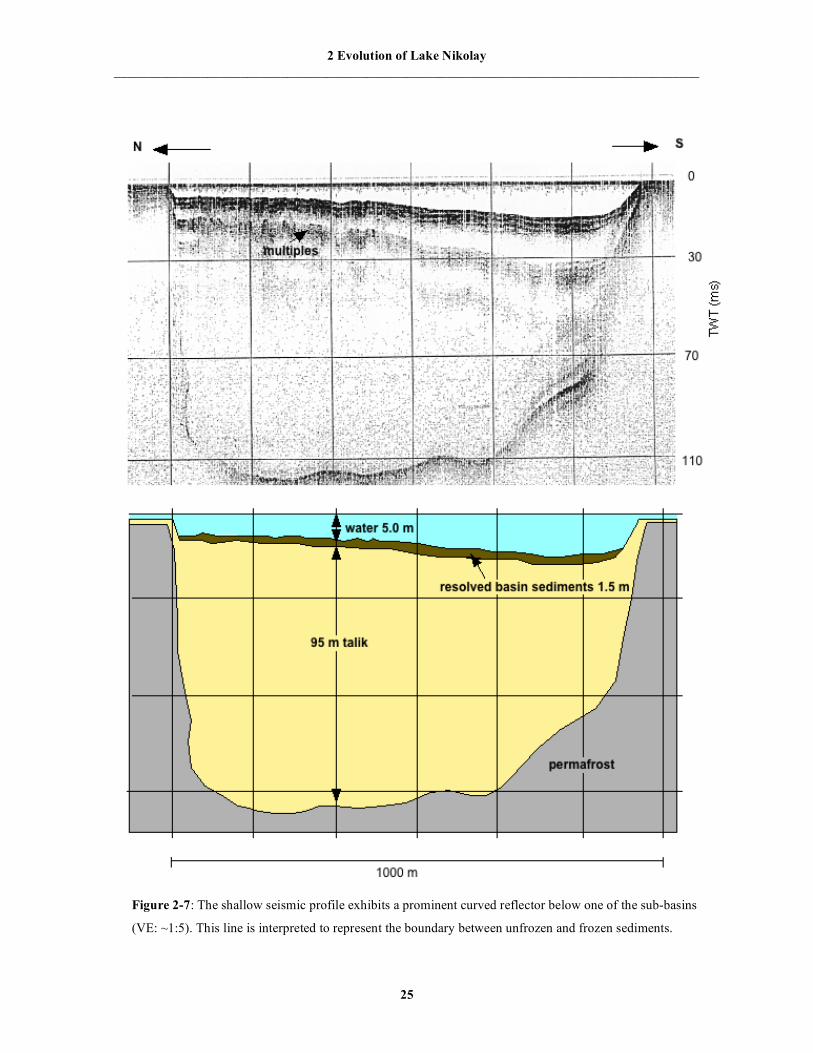
One of the seismic profiles penetrates as much as 120 ms TWT and reveals a curved
reflector below one of the sub-basins (Fig. 2-7, for location see Fig. 2-3b). This reflector
corresponds to about 95 m of fill at maximum below the water column. With a steep drop
in the beginning of the profile, the unit thickens to about 110 ms TWT in the southern part
of the basin. It then thins slightly towards the northern part of the profile before abruptly
pinching out. In contrast to layered seismic reflections, which are generally indicative of
sediment changes, the trough-like curved seismic boundary is assumed to be created by the
talik-permafrost boundary. Outside of the talik outline, seismic penetration is prevented by
the permafrost table and sediment structures within the permafrost remain unknown. The
lack of internal reflectors for the recorded talik area suggests that the acoustic waves have
penetrated a fairly homogenous substrate with little internal sedimentary structure and/or
NW
21.5
1.5
TW
T (
ms)
11.5
tota
l depth
(m
)
multiple
1300 m
SU2
SU3
SU1
fine sand
fine sand, organic rich
frozen sand
A5 A4A2 A1
SE
0
3
18
6
9
12
15
legend:

2 Evolution of Lake Nikolay ________________________________________________________________________________________
24
low acoustic contrasts, respectively. Possible sedimentary changes may be too subtle to be
resolved. An additional sedimentary explanation for the acoustic transparency could be the
fact that internal layering of talik sediments may have been destroyed due to thaw and
subsidence.
On the other hand, the propagation of acoustic energy through the water column and sub-
surface generally results in energy loss due to spherical spreading of the wave front,
attenuation by inter-granular friction loss and the reflection coefficient of each material
interface crossed (Sheriff and Geldart, 1995).
The general lack of internal reflectors, i.e. material interfaces, in the recorded talik means
that the attenuation of signal loss is low. Furthermore, multiples caused by the water/lake-
sediment interface are weaker than in other profiles. This implies that a greater proportion
of the energy may have penetrated the subground, thus enabling the higher penetration.
Nevertheless, with increasing penetration depth higher acoustic contrasts are needed to be
resolved by seismic means.
To describe the clear reflections presumably caused by the permafrost table below the
sub-basin a calculation of the reflection coefficient for this boundary has been applied.
Following Kearey and Brooks (1984) a reflection coefficient (R) for a deeper reflection can
be calculated for seismic data using the following relationship:
ρ2 ν2 - ρ1 ν1 Z2 – Z1
R = = (1) ρ2 ν2 + ρ1 ν1 Z2 + Z1
where ρ, ν, Z are the density, the P-wave velocity, the acoustic impedance for an upper
(Z1) and a lower (Z2) rock layer, respectively. If R = 0 all the incident energy is transmitted.
This is the case when there is no contrast of acoustic impedance across an interface (i.e. Z1
= Z2), even if the density and velocity values are different in the two layers. If R = +1 or –1,
all the incident energy is reflected. Values of reflection coefficient R for interfaces between
different rock types rarely exceed ±0.5 and are typically less than ±0.2 (Kearey and Brooks,
1984). There are no field or laboratory measurements available for the fine-grained
sediments of Lake Nikolay. Therefore, in our case study ν1 is 1800 m/s as the assumed
wave velocity in the fine sandy talik sediments, introduced earlier, ν2 is 3700 m/s as the
wave velocity in unconsolidated permafrost according to measurements on frozen fine sand
2 Evolution of Lake Nikolay ________________________________________________________________________________________
25
Figure 2-7: The shallow seismic profile exhibits a prominent curved reflector below one of the sub-basins
(VE: ~1:5). This line is interpreted to represent the boundary between unfrozen and frozen sediments.

2 Evolution of Lake Nikolay ________________________________________________________________________________________
26
from the Canadian Arctic (Zimmerman and King, 1986). The latter is a minimum value;
seismic velocities in frozen sand can even reach 4190 m/s (Zimmerman and King, op.cit).
Density values for ρ1 and ρ2 are set to 1.7 g/cm3 according to measurements on fine sand of
deposits in the north of Western Siberia (Ershov, 1984), which are regarded to be
comparable with those of Lake Nikolay. However, frozen sands may have slightly lower
density values since the density of ice (0.92 g/cm3) is lower than that of water.
The result of the calculation of the reflection coefficient for the presumed talik-permafrost
boundary is following equation (1) +0.35. The high contrast between the two acoustic
impedances allows the boundary to be detected even when there is left only a small amount
of seismic energy in greater depth. The differences in the acoustic impedances are mainly
caused by their large differences in wave velocities for unfrozen and frozen media.
The permafrost table detected by drilling at one basin margin supports the seismic
interpretation. The cryolithogenic properties of sediment cores A2, A4 and A5 next to one
lake basin show that the subsurface is unfrozen fine sand (Fig. 2-6). It only becomes a
thoroughly frozen subground at the end of the core transect in a distance of 15-20 m to the
basin (core A5). Grain size distributions and ice/water contents of the fine sands from cores
A2, A4 and A5 resemble those of the lower unit of core A1.
2.3.3.2 Results of Mathematical Modeling To aid seismic interpretation for the subsurface below the basin a mathematical model has
been calculated. It predicts the expansion of a thawing front below the lake basin, where a
fresh water body with temperatures above 0°C induces thawing of surrounding permafrost
ground. The model is intended to characterize the cryolithogenic properties of the
subground, where no drilling results can provide verification. It is applied to the sub-basin
shown in Figure 2-7. Accepting the initial and boundary conditions and the thermophysical
values for the geological material (see Table 2-1) the model calculates a talik expansion
below the deeper basin as displayed in Figure 2-8. The calculation initiates at 120,000 yr
BP. At 7000 yr BP the lake formation starts and extends to its maximum given size at
present with a rate of 2 m/yr. The temperature of the bottom sediments is received to be at
first 4°C, and then it decreases down to 2.5°C in conformity to field data.
We note that the shallow seismic profile does not cover the center of the basin, but is
shifted towards its western margin. Thus, the maximum values calculated by the model

2 Evolution of Lake Nikolay ________________________________________________________________________________________
27
have to be corrected towards the basin margins assuming that greater water depth in the
center of the basin has led to a greater talik depth below it (Table 2-3). The data in Table 2-
3 demonstrate that the talik depth under the lake is dependent mainly on ground heat
conduction in thawed and frozen geologic material, respectively.
Figure 2-8: Results of mathematical modeling of talik formation below one of Lake Nikolay´s sub-basins.
The total depth (m) of the lake talik is dependent on the accepted thermophysical properties. Min. and max.
results reflect the range originated by the different values of groups N1 through 3 (see Table 2-1). Location of
seismic profile from Fig. 2-7 is indicated. It has been gained perpendicular to the west-east oriented
mathematical model.
Therefore, the talik depths obtained for groups N1 and N3 describing similar geologic
material are similar, for group N2 it is smaller. The average depth of the talik bottom at the
basin margin as deduced from the mathematical model is calculated at 106 m. The
estimated depth of the curved reflector in the seismic chart (95 mtalik + 1.5 mresolved basin
sedimentation + 5 mwater column = 101.5 mtotal depth) is in a good agreement with the calculated talik
depth in the model (see Fig. 2-8) and the values of Table 2-3. Consequently, the

2 Evolution of Lake Nikolay ________________________________________________________________________________________
28
mathematical model can support the interpretation that the curved seismic reflector
represents the boundary between unfrozen and frozen sediment.
bottom depth (m) of the lake talik below lake surface in dependence on the groups N1 through N3
distance from basin margin (m)
N1st group of thermophysical properties
N2nd group of thermophysical properties
N3rd group of thermophysical properties
100 82.8 73.4 81.7 150 116.1 100.4 114.5 200 135.1 115.8 133.7
central part of the basin 159.3 134.3 158.7 total bottom depth (m) of the talik boundary below the lake surface according to seismic data: ~101.5 m
Table 2-3: Calculated total bottom depth (m) of lake talik according to the modeling results and in
dependance on the distance from the basin margin.
2.3.4 GPR of Permafrost Deposits GPR profiles from the shallow margins of the lake, in contrast to the seismic records,
display several internal reflectors in the sediments (Fig. 2-9). The radar profile of Figure 2-
9 has been recorded as the continuation of seismic profile of Figure 2-6 towards northwest.
The sediments consist of frozen fine sand as seen in core A5. Below the winter lake ice
cover (thickness: 1.2 m) sediment structures are resolved down to a penetration depth of ca.
23 m with the 100 MHz antenna pair. The frozen sand as recovered in core A5 exhibits
horizontal to slightly inclined reflectors in the radargram, probably representing fluvial
bedding structures. The inclined bedding points towards the basin located at the
southeastern end of the profile. This suggests that the thermokarst depression was
established in the center of a former fluvial pathway.
2.4 Conclusions We can reconstruct the following post Pleistocene evolution of depositional processes in
the Lake Nikolay area from our data set.
At ca. 15,000 to 11,000 yr BP, a continental sedimentation dominates the environment of
Arga Island. Sandy deposits formed with high sedimentation rates indicate a fluvial
environment under upper flow regime. Sediments underlying today’s lake basins in the area
consist of fine sand that is comparable with the surrounding sandy environment.

2 Evolution of Lake Nikolay ________________________________________________________________________________________
29
Figure 2-9: Radar profile of the shallow lake margin obtained with the 100 MHz antenna pair and the
lithofacies of core A5.
Gravitational sliding of marginal sediments into individual basins took place before lake
sedimentation starts at about 7000 14C yr BP after a transition period from a fluvial to a
shallow water to a limnic environment. The beginning of lake sedimentation coincides with
the onset of the regional Holocene climatic optimum. Limnic sedimentation consisting of
organic-rich sands in the center of the sub-basins takes place with average sedimentation
rates of about 0.1 m per 1000 years.
Lake Nikolay has induced a talik expansion below its deeper basins. Mathematical
modeling of the talik expansion supports the interpretation that thaw subsidence of the
sandy subground alone is sufficient to have created the deeper basins on Arga Island even
though the ice content is low in the subground. Neither geological (for example the
occurrence of till, moraine) nor geophysical (for example the detection of glacial furrows or
scratch marks) results are obtained, which support the hypothesis of a glacially caused
morphology of the area as deduced from remote sensing techniques according to Grosswald

2 Evolution of Lake Nikolay ________________________________________________________________________________________
30
et al. (1999). The occurrence of massive underground ice proposed by Are and Reimnitz
(2000) cannot be proven by GPR and shallow seismic measurements, either.
Presumably small ponds in abandoned fluvial pathways rather extended in depth and size
due to thermokarst processes promoted in the ice-poor sandy subsurface. Thermokarst is
still active especially at the northern shores where insolation is higher than at the southern
shores and shore banks are retreating more rapidly due to thermoabrasion. This process
promotes the elongation of the lake’s shape. The spreading of the shorelines has merged
several small thermokarst lakes together forming today’s Lake Nikolay as the largest lake
hold by the second terrace of the Lena Delta.

3 Ground penetrating radar and high-resolution seismics ________________________________________________________________________________________
31
3 High-resolution seismic and ground-penetrating radar– geophysical
profiling of a thermokarst lake in the western Lena Delta, N-Siberia*
Abstract High-resolution seismic and ground-penetrating radar (GPR) data have been acquired over
Lake Nikolay in the western Lena Delta in order to study the uppermost basin fill and the
bordering frozen margins. GPR (100 MHz antenna pair) measurements were completed on the
frozen lake and its permafrost margins, while high-resolution seismic data were acquired from
the lake during open water conditions in summer using a 1.5-11.5 kHz Chirp profiler. The
combined use of the two profiling systems allows stratigraphic profiling in both frozen and
unfrozen parts of the lake. Shallow seismic reflection images of the uppermost 4 to 5 m of
sediments are compared to GPR sections, which have approximately the same horizontal and
vertical resolution. Short sediment cores aid calibrate the geophysical data.
3.1 Introduction The Lena Delta is a large Arctic delta and the main connection between continental and
marine environments in the Laptev Sea (Rachold et al., 1999). The climatic and sedimentary
conditions of the Lena Delta are different from those of delta regions in lower latitudes
because it is part of the continuous permafrost zone of northern Siberia. Permafrost
thicknesses can reach more than 600 metres in the area (Grigoriev, 1960). Lake Nikolay is the
largest confined water body in the Lena Delta and is situated in the northwestern part of Arga
Island (Figure 3-1). This lake is one of numerous lakes belonging to a type of oriented lake
which is a widespread geomorphological feature on Arga Island (Grigoriev, 1993). From west
to east, Lake Nikolay is about 8 km wide and from north to south ca. 6 km long.
Approximately 70 % of the lake area has a water depth of less than 2 m. Below these shallow
margins an active layer exists with an average thaw depth of ca. 0.5-0.6 m in late summer.
During winter, this shallow marginal area is completely frozen and covered by lake ice. A
maximum water depth of 30 m is recorded in a series of sub-basins. In these sub-basins, the
basin fill remains unfrozen below a water column, which has an ice cover 2 to 3 m thick 1during the winter months.
* Schwamborn, G., Dix, J.K., Bull, J.M., Rachold, V., Permafrost and Periglacial Processes 13 (2002). Reprint kindly permitted.

3 Ground penetrating radar and high-resolution seismics ________________________________________________________________________________________
32
Recent studies suggest that Lake Nikolay has a thermokarst origin (Schwamborn et al.,
2000). Age determinations and pollen analyses of lake sediments reveal that its formation is
related to a regional climatic optimum at ca. 7 ka BP (uncalibrated radiocarbon years).
Continuous sediment subsidence due to thawing subground (i.e. thermokarst) is thought to
have promoted the creation of the lake depression. To locate the coring site and to reveal
structural information on the sediment bedding within Lake Nikolay, ground-penetrating radar
(GPR) measurements with a 100 MHz antenna pair were acquired during the winter of 1999.
These activities complement shallow seismic (Chirp) measurements collected as a pre-survey
of the sediment fill in the preceding summer season (see Figure 3-1).
Figure 3-1: Map of Lake Nikolay on Arga Island (western Lena Delta). The locations of geophysical profiles and
sediment coring are highlighted that are described in the text. The 2 m bathymetric line marks the boundary to
which the shallow margins are completely frozen during winter. Sub basins and shallow margins are delined as
measured the water depths with a portable infrared sounder on board of a rubber boat and with the aid of aerial
photography.
GPR sounding is an established technique for permafrost investigations (Annan and Davis,
1976, Arcone et al., 1998, Judge et al., 1991, Robinson et al., 1997, Hinkel et al., 2001), active
layer surveys (Doolittle et al., 1990) and lake sediment profiling (Mellet, 1995). Mellet (1995)
3 Ground penetrating radar and high-resolution seismics ________________________________________________________________________________________
33
and Moorman and Michel (1997) have shown the potential of the GPR method for surveying
sediments through a lake-ice cover. Literature on seismic surveys of lake sediments is well-
established, for example Niessen et al. (1999) have used the same Chirp sound source as for
this study, Abbott et al. (2000) operated with a 3-7 kHz seismic pulse system, and Mullins and
Halfman (2001) deployed a sub-bottom profiling system that has sweep frequencies of 2 to 12
kHz. A comparison of higher frequency GPR data (50 and 100 MHz) to a seismic system on
open water (using a 7 kHz transducer) demonstrated that these techniques often provide
complementary information (Delaney et al., 1992, Sellman et al., 1992).
In this study, the combined use of Chirp and GPR data was guided by our desire to know,
whether a cost-intensive field campaign of seismic pre-survey at a remote arctic site could be
omitted from a field investigation. With regard to the GPR measurements it was necessary to
establish whether the quality of GPR profiling acquired through a winter lake-ice cover was
satisfactory enough to provide the needed subsurface information for subsequent sediment
coring from the ice and to eventually replace the summer seismic program.
To find suitable answers, the following procedure was chosen. Profiles of the basin fills and
profiles of the shallow margins were obtained in equal manner with both profilers. The post-
processing flows for Chirp and GPR data were adjusted to assure a thorough comparison of
the data sets. The vertical and horizontal resolutions of the Chirp and the GPR data were lined
up to show that they delivered similar resolution characteristics even though the propagation
velocities are very different. Short sediment cores were used to aid geophysical data
interpretation.
3.2 Seismic Data Acquisition A Chirp subbottom profiler (GeoChirp™ by GeoAcoustics) with a 32 ms 1.5-11.5 kHz
sweep source was used to collect 25 km of profiles across the lake. The system, which can be
used on open water only, was mounted upon a surface-towed catamaran, attached to which
was an 8-element, single-channel 0.5-15 kHz hydrophone streamer. The whole system was
operated from a small inflatable boat. The transmission trigger rate was set to four chirps per
second and the survey speed was approximately 1.6 ms-1. A global positioning system (GPS)
receiver provided survey navigation.
Chirp profilers are digital, frequency-modulated (FM) sources with a predetermined and
repeatable source signature for high-resolution, normal incidence seismic reflection data

3 Ground penetrating radar and high-resolution seismics ________________________________________________________________________________________
34
acquisition. The Chirp systems comprise calibrated, linear electronic components and transmit
signals containing pre-determined phase and amplitude corrections (Quinn, 1997). This
ensures that no anomalies occur in the transducers or the transmitting and receiving
electronics. The S/N ratio of Chirp data is improved through matched filter processing by
correlating the reflection data with the pre-determined transmitted pulse (Schock and LeBlanc,
1990). If reflections or noise do not match the outgoing Chirp waveform, the filter attenuates
the unwanted signal. See Quinn (1997) and Quinn et al. (1998) for a description on Chirp
profiling generally and Niessen et al. (1997) for a description of the specific system used.
The post-processing flow applied in the lab has been designed to improve data clarity and
lateral continuity specifically for high-resolution Chirp data (Quinn, 1997, Quinn et al., 1998,
Lenham, 2000). The processing sequence includes bandpass filtering (Ormsby), F-X
deconvolution, AGC, a Stolt F-K migration, an F-K filtering and the application of a dynamic
S/N filter (Figure 3-2). The first three algorithms in the processing sequence are standard
seismic processing applications (Yilmaz, 1987). The application of the dynamic S/N filter as a
final step is less standard and is particularly suitable to Chirp data (Quinn, 1997). For
converting the TWT (two-way travel) times into depth, p-wave velocities of 1420 ms-1 and
1490 ms-1 are assumed for the water column and the lake sediments respectively, after Niessen
and Melles (1995).
3.3 GPR Data Acquisition GPR profiling was conducted along flagged traverse lines within Lake Nikolay using the 100
MHz antenna pair from RAMAC (Malå/Geoscience). A GPS receiver provided the navigation.
Data were collected with settings as listed in Table 3-1. They were found to offer the best
trade-off between signal-to-noise (S/N) ratio and time required for data acquisition. Since the
lake water has low conductivity (<50 µS/cm) good penetration of the GPR signals was
permitted through the water column. In total thirteen GPR profiles (23 km total) of the lake
basins and the surrounding margins were collected. GPR profiling was completed using a
diesel vehicle, the antenna pair being mounted on a textile sheet and towed behind the vehicle.
The transmitting and receiving antennae had a constant offset of one metre and were arranged
perpendicular to the profile direction.

3 Ground penetrating radar and high-resolution seismics ________________________________________________________________________________________
35
Figure 3-2: The GPR data processing flow (right) resembles the Chirp data processing flow (left) to enable a
more thorough comparison of the digital data. SEG-Y stands for a tape standard developed by the Society of
Exploration Geophysicists (SEG).
The GPR data were imported into seismic processing software (ProMAX™) and an optimal
processing flow determined according to the seismic processing procedure (Figure 3-2). This
comprised a true amplitude recovery, a spiking/predictive deconvolution, automatic gain
control (AGC), dynamic S/N filtering and finally a (Ormsby) bandpass filter.
antenna pair 100 MHz antenna offset 1 m
samples per trace 1536 stacks 128
sampling frequency 1016 MHz
Table 3-1: GPR system settings for lake sediment profiling.

3 Ground penetrating radar and high-resolution seismics ________________________________________________________________________________________
36
3.4 Sediment Sampling
Sampling of frozen and unfrozen sediments was performed using a frozen-ground rotary
coring kit consisting of an engine power-auger unit, iron rods, and iron core barrels. The stable
winter ice cover of the lake served as the coring platform. Core sections were cleaned,
described and stored immediately after sectioning into 5 cm intervals. After transit to the
laboratory the individual samples were examined for moisture (gravimetric water content)
expressed in weight percent (wt%).
3.5 EM Velocity Analyses In order to determine the velocity depth function for the electro-magnetic (EM) waves several
common mid-point (CMP) measurements were recorded. Antenna spacing was changed with
constant increments of 1 m to offsets of 100 m at maximum. This generated an antenna-
separation versus travel-time plot, from which the propagation velocity of subsurface materials
can be deduced (Annan and Davis, 1976).
These profiles were recorded at characteristic
sites such as deep basins or the shallow
margins (Figure 3-3). The main drawback of
this technique is that velocity determination of
deeper layers becomes increasingly difficult
due to the weakening strength of returns, the
presence of refractions, and the complicated
geometry of the travel paths of reflections
(Moorman and Michel, 1997). Consequently,
direct calculations of signal propagation
velocity were made by comparing the TWT
times between reflections on GPR profiles
with measured thicknesses of the lake-ice
cover, the water column, and the sediment
layers in the core (Figure 3-4). The thickness
of lake ice and the water depth were measured
manually with a plumb line and a measuring
tape. During the summer measurements, the
100
200
300
0
TWT (ns) velocities of
ice
permafrost
air
1 100length (m)
0.17 m/ns
0.30 m/ns
0.16 m/ns
Figure 3-3: Example of CMP deduced subsurface
velocities. Measurements have been conducted over
a shallow margin of Lake Nikolay where frozen
sediments lie directly underneath the lake ice. For
position see Figure 3-5.

3 Ground penetrating radar and high-resolution seismics ________________________________________________________________________________________
37
thickness of the active layer at the
shallow margins was determined in a
comparable way with a prick rod. Two
cores, one into the basin sediments,
and one into a frozen margin, enabled
us to identify the materials and
sedimentary boundaries, respectively.
The propagation velocities for the EM
waves used in this study are listed in
Table 3-2 along with the method of
determination and extant values
published in Davis and Annan (1989).
material determination method EM velocity (m/ns) literature value
air CMP 0.30 0.30 ice CMP 0.17 0.16
frozen ground below ice CMP 0.16 0.11-0.15* saturated sand direct measurement 0.06 0.06
fresh water direct measurement 0.036 0.033 * according to RAMAC/GPR Operating Manual (1997)
Table 3-2: EM velocity values used to estimate depth scales with literature values according to Davis and Annan
(1989) for comparison.
3.6 Resolution of GPR and Seismic Data
Vertical Resolution
The depth (or vertical) resolution of both EM and seismic waves is dependent on the
wavelength (λ) in the different media so the approximate vertical resolution can be calculated
from the following formula:
λ = ν / f (1)
where ν is the propagation velocity [ms-1] of the wavelet within the material, and f is the
antenna frequency [Hz] used. The theoretical depth resolution is about one-quarter of the
wavelength in the different media (Sheriff and Geldart, 1995). Deconvolution processing has
been applied to both Chirp and GPR data sets to enhance them. Using the dominant frequency
of the direct wave arriving at the system's receiver has approximated the dominant
material
fine sand
fine sand, organic rich
water
ice
core
8
6
4
2
0 m
16
14
12
10
thickness
2.2 m
11.5 m
0.9 m
2.4 m
total depth water contentTWT times
26 ns
634 ns
30 ns
90 ns
20 60 wt%
Figure 3-4: Coring results for the lake sediment site, the
respective material thicknesses and the deduced TWT
times in the GPR section.

3 Ground penetrating radar and high-resolution seismics ________________________________________________________________________________________
38
wavelength. In case of the here-used Chirp profiler the dominant frequency was found to be 3
kHz by screen control. Likewise the GPR center frequency of 100 MHz has been confirmed.
In order to approximate the theoretical resolvable bed thicknesses that can be estimated with
the different profiling systems the velocity information relevant to the profiling system and the
sub-bottom environment was taken. The obtained theoretical depth resolution for GPR data
amounts to 0.12 m in the saturated uppermost basin fill and to 0.3 m in frozen deposits. The
same equation applied to the Chirp data of lake sediments results in 0.12 m depth resolution
(see also Table 3-3). However, in most terrains the vertical resolution is found to be 2 or 3
times the theoretical vertical resolution, depending upon surface roughness and slope, volume
scattering, pulse bandwidth, dispersivity, properties contrast etc.
system GPR (100 MHz) GPR (100 MHz) Chirp (1.5-11.5 kHz) dominant return frequency 100 MHz 100 MHz 3 kHz
environment frozen basin margins lake sediments propagation velocity 0.16 m/ns 0.06 m/ns 1490 m/s
vertical resolution 0.4 m 0.15 m 0.12 m horizontal resolution* 5.7 m 2.8 m 3.1 m *depth position and 10 m of frozen ground 10 m of water column
relevant propagation velocity in the overlying material
0.16 m/ns
0.036 m/ns
1420 m/s
horizontal shot interval 1 m 1 m 0.4 m
Table 3-3: Resolution of GPR and Chirp data in the different environments. Vertical resolving limit is assumed
to be one quarter of the dominant wavelength. Horizontal resolution (=2r) of the sediments is dependent on the
depth position and the materials above with their relevant propagation velocities (listed in italic letters).
The ability to compare physical event identification using the two systems Chirp and GPR is
caused by having similar wavelengths in the same environment. The dominant 3 kHz
frequency of the Chirp corresponds to a wavelength of 0.5 m in saturated sands and the 100
MHz dominant frequency of the GPR corresponds to a wavelength of 0.6 m in the same
environment, although the relevant propagation velocities are very different (1490 ms -1 and
0.06 mns -1, respectively).
Horizontal Resolution Spatial (or horizontal) resolution refers to the reflected energy that arrives from a circular
zone (Fresnel zone) on the reflector. Its radius increases with depth. The radius r of the first
Fresnel zone can be approximated by
r = [ν / 2 ] [ t / f ] 0.5 (2)

3 Ground penetrating radar and high-resolution seismics ________________________________________________________________________________________
39
where ν is the wave velocity [ms-1] along its path, t is the TWT time [s] for the wave reflected
from a given depth and f is the frequency [Hz] of the wave. From equation (2), it can be seen
that the spatial resolution decreases as a function of depth (i.e. the increase of time) but is
modified by the different wave velocities in the different media. Calculated examples are
given in Table 3-3.
The derivation of the Fresnel zone radius approximation is analogous for both, seismic and
EM waves, although this equation gives only a rough estimate of the horizontal resolution
limit. It actually depends on many factors; for example, in case of Chirp data the beam angle
and, therefore, the footprint of the system, is also dependent upon the transducer array and the
bandwidth of the source (Quinn, 1997). In case of GPR data it is dependent on the direction
and shape of the EM cone transmitted into the ground (Arcone, 1995).
A final factor effecting horizontal resolution of the profiles is the horizontal shot interval. In
the case of the Chirp survey, this factor is dependent upon survey speed (in our measurements
1.6 ms-1) and the chosen pulse rate (in our measurements 4 shots per second, i.e. 0.4 m per
trace). In the case of the GPR surveys, it is the chosen shot spacing (in our measurements 1 m
per trace). The shot interval for both profilers is smaller than the calculated horizontal
resolution (=2r), or Fresnel zone, respectively. The horizontal portions equivalent to the
“effective” Fresnel zone are, thus, covered several times by subsequent traces. The coverage
increases with closer spaced shot intervals. Hence, it is a significant factor in the effective
horizontal resolution and should be considered in data interpretation, in our case especially in
the seismic profiles.
3.7 Results and Discussion Aerial photographs show dark areas at the centre of the Lake Nikolay surrounded by brighter
areas towards the shore. The brightness is interpreted as being correlating with lake
bathymetry. The results from GPR and seismic measurements confirm this interpretation
showing several relatively deep central lake basins (10 to 30 m) surrounded by shallower
areas. The irregular shape of the lake floor often shows one or two morphological steps framed
by steep slopes before reaching the deepest part of the basin. Not all of the survey results are
shown here; rather, one example is displayed where certain geophysical features are verified
by sediment drilling. In this example, a Chirp line is compared with a radargram that has been
obtained over the same lake basin (Figure 3-5). Because of inaccuracies during online-

3 Ground penetrating radar and high-resolution seismics ________________________________________________________________________________________
40
positioning with GPS between the two field seasons the locations of the profiles differ by
±100-200 m. This can be seen, for example, by slight differences following the basin floor
surface. However, both profile lines are complementing one another, since the depositional
situation does not change decisively as inferred from additional profile lines not shown here.
Profiling of the frozen basin margin
A comparison of Chirp with GPR measurements of the shallow frozen basin margin can be
made when regarding the left part of Figure 3-5. At top, the seismic profile obtained during
open water conditions is displayed and, at bottom, the equivalent radargram is displayed as
obtained during the winter season from the lake ice. Below a shallow water column of less
than 2 m, the Chirp profile exhibits a strong reflection response within a shallow sediment
depth. This is due to the permafrost table, which was at a depth of 0.5 m during the summer
season. Previous seismic studies have shown that seismic systems will not trigger reliably in
less than approximately 2 m water depth (Delaney et al., 1992, Quinn, 1997) making
quantitative assessments unreliable for that water depth. In our case the returning echo in that
shallow depth appears as a convolution of the direct pressure wave, its reflection from the lake
surface and from the shallow lake bottom and, finally, the shallow permafrost table underneath
as mentioned above. It causes almost total reflection of the seismic waves, thus, preventing
imaging of internal structures within the frozen basin margins using the seismic system.
Multiples of the permafrost table are observed beneath and ringing effects may explain the
further distortions, which come to pass down the section.
In contrast, sub-bottom information of the shallow margin is revealed in the GPR profile.
From the top the radargram begins with continuous high-amplitude events, which are the
direct air wave arrivals. This occurs because the EM velocity in air (the speed of light = 0.30
m/ns) is much faster than in any geological material. Thus, the waves travelling directly
through air between the two antennae are the first to arrive. They are followed by the ground
wave on top of the ice cover. Below the lake ice cover, the frozen basin margin has a number
of internal horizontal to inclined reflectors. The lowest reflectors are found at a depth of ca. 23
m and mark the depth of resolved EM penetration with the 100 MHz antenna pair in the frozen
subground. At the permafrost coring location, as marked in the radargram, the lake ice has a
thickness of 1.2 m and is lying directly on frozen ground. The frozen subsurface is made of
fine sand and has been drilled down to a sediment depth of 7 m. The internal reflectors

3 Ground penetrating radar and high-resolution seismics ________________________________________________________________________________________
41
Figure 3-5: The Chirp (a) and the GPR (b) profile have been gained over the same lake basin and are regarded to
complement each other. Bathymetric information, EM penetration into frozen ground and position of short cores
with their lithofacies are added.
exhibited in the frozen margin are interpreted as inclined fluvial bedding planes of the frozen
sand observable only by GPR means but not in the core. This sedimentary detail is likely to be
caused by electrical-impedance contrasts at the sedimentary boundaries.
Profiling of the uppermost basin fill
In Figure 3-6(a-d) a pair of Chirp and GPR profiles is displayed. These magnify the sediment
fill seen in Figure 3-5 on the right side. The seismograms at the top are displayed as the
default printout from the field (a) and as the post-processed section (b). The radargrams at the
bottom display both the unprocessed (c) and processed GPR section (d). With both techniques
water depth and morphology of the basin can be well determined and compared. The water
depth deduced from the seismogram is 13.1 m (see also Figure 3-4), the value deduced from
the radargram is 13.7 m for the approximate same locality. This approximate profile match
includes the GPS inaccuracies and that the winter elevation of the ice surface to the summer
400length (m) 100 200 300TWT (ms)
5
25
15
0
200
400
600
800
TWT (ns)
!h = 23 m
permafrost core & CMP site of Fig. 3
lake sediment core
organic rich fine sand fine sandice
active layer
shallow water < 2 m
0.5 m
ice cover
air and ground wave
multiples
frozen sand
!h = 13.7 m
!h = 13.1 m
legend:

3 Ground penetrating radar and high-resolution seismics ________________________________________________________________________________________
42
level of the water as the horizontal reference level is not further taken into account. The lake
sediments have been sampled and relevant material thicknesses are given in Figure 3-4. The
location of lake sediment coring is marked in Figures 3-5 and 3-6d.
When comparing the magnified profiles of the lake sediments, both records offer straight
visual interpretability, especially after enhancement of the data. There is a lateral variability in
reflector coherency along the Chirp section due to noise (Figure 3-6a). Figure 3-6b has
improved in S/N ratio and reflector continuity is enhanced. The same is valid for the GPR
section (Figures 3-6c and d). Both the Chirp and the GPR profile allow defining major
physical boundaries within the sediment fill as marked by the arrows. On top of the sediments
one strong reflector is revealed followed by a weaker amplitude event in the uppermost section
of the sedimentary basin. The upper one is interpreted as the beginning of the lake sediments,
the second one the base of it (Figures 3-6b and c, see the two white arrows). The upper seismic
unit amounts to 0.8 m in thickness. The thickness between the upper two pronounced
reflectors as picked from the raw GPR section is 0.9 m. This was calculated combining the
TWT time with the drilling results in order to calculate the EM wave velocity as introduced
earlier. The upper unit in the geophysical profiles can be linked to a lacustrine organic-rich
sand cover as revealed from the core (Figure 3-4). It represents the lake sedimentation from
the modern state backward in time. In contrast, the sandy sediments following below in the
core section are interpreted to belong to fluvial and/or eolian deposits. This characterizes the
environment in which the lake depressions evolved (Schwamborn et al., 2000).
Since the water content decreases from 40-60 wt% in the organic-rich fine sand of the upper
part of the core to about 20 wt% in the organic-poor fine sands of the lower part of the core,
this sharp physical contrast is regarded as the cause for the second strong reflections in both
geophysical records. The water content largely controls the dielectric contrast from different
geologic material as measured by the GPR method (Davis and Annan, 1989). Similarly the
elastic boundaries as measured by seismic means, and which are defined by the density and
velocity contrast, are themselves closely related to the porosity and, thus, to the water content
(Niessen et al., 1999).
The Chirp imagery appears to characterize the bottom sediments further down as being more
chaotic sediments with short, disconnected and bent reflectors next to horizontally to
subhorizontally aligned reflectors. It is suggested that closely-spaced grain size and sorting

3 Ground penetrating radar and high-resolution seismics ________________________________________________________________________________________
43
Figure 3-6: Comparison of Chirp (a and b) and GPR (c and d) data from survey lines of the same lake basin at
Lake Nikolay. The separation of the lines is due to GPS inaccuracies; (a) raw correlated Chirp section, (b)
processed Chirp section, (c) raw GPR section, (d) processed GPR section with the position of the lake sediment
core marked. White arrows indicate explained horizons, whereas black arrows with question marks indicate
unexplained horizons. For more discussion see the text.

3 Ground penetrating radar and high-resolution seismics ________________________________________________________________________________________
44
differences affect the porosity of the fine sandy sediment as seen in the relevant part of the
core. However, this interpretation may only be acceptable as long as there is no direct ground-
truth verification available for the Chirp track. The basin sediments are resolved within the
Chirp profile to a depth of ca. 4.5 m (6 ms TWT).
In the comparable part of the GPR section the reflections show lateral continuity and
coherent horizontal wavelet successions (Figure 3-6d). The processed profile shows some of
the lower reflectors pinching out especially in the left part of the section. This argues for true
signal penetration rather than reverberations of the EM energy within the basin sediments.
Inspection of the raw data wavelets supports the suggestion that the reflected arrivals within
the lake sediments arose from real sediment boundaries, although the incoming signal wavelet
is irregular and is partly lengthened (Figure 3-7). This is due to reverberations in the lake ice
caused by the high dielectric contrast between the lake ice (relative permittivity εr=3-4) and
the lake water (εr=81). As the depth resolution of the GPR is in the order of 0.12 m, the
internal reflections from within the basin sediments (enhanced in the processed Figure 3-6d)
are thought to represent apparent layering and not individual bedding planes, which could
have been verified. This is supported by a lack of bedding planes as observed within the lake
sediment core. However, the apparent stratigraphic resolution in the lake sediments may also
be induced by polarization effects as suggested by Delaney et al. (1992). This is especially
true for the parallel reflection pattern in the right part of the section, where internal multiples
cannot be discounted. Furthermore, a strong reflection horizon cannot be explained yet
(marked by the dark arrow with a question mark). The sediment coring reached beyond the
relevant depth but no obvious macroscopic sediment boundary can be observed. Although the
high amplitude event appears in both Chirp and GPR records, its nature remains obscure. The
maximum resolved depth of the EM waves into the basin sediments is about 4.2 m (140 ns
TWT).
In general, the Chirp and GPR profiles show similar penetration capabilities within the
uppermost 4 to 5 m of basin sediments. The calculated resolution characteristics match fairly
well for both profilers as presented in Table 3-3. More subtle stratigraphic detail is revealed in
the Chirp profile providing better definition of discrete targets just beneath the basin floors.
This is likely a result of improved S/N ratio due to known pulse output allowing effective
correlation and a smaller trace interval applied. We ignore the difference in profile positions at

3 Ground penetrating radar and high-resolution seismics ________________________________________________________________________________________
45
this place. A continuing upper unit can be distinguished from a lower unit with various high-
amplitude elements and detached, broken to sub-horizontal orientated reflectors. In contrast,
GPR raw data of the basin fill shows less variability but higher horizontal continuity of
reflectors. They also allow one to discriminate between an upper and a lower unit. Processed
profiles can be interpreted less straightforwardly, since the records may suffer from
polarization limited resolution and internal multiples may be enhanced.
The upper unit in the geophysical profiles
can be linked to the lacustrine organic-rich
sand of the core. The lower unit shows
organic-poor fine sand suggesting a material
derived from a fluvial and/or eolian
environment.
3.8 Conclusions The Chirp and the GPR sections produce
consistent but different images of the Lake
Nikolay basin environment. Correlation of
the Chirp and GPR data with core data is
seen on the scale of only some stratigraphic
boundaries. It is remarkable that the amount
of resolved features with both profilers is
better than could be verified by core data. A
more comprehensive investigation of lake-
sediment cores (i.e. density logging,
dielectric changes) is needed to further
understand the origin of internal reflectors.
From a practical viewpoint GPR profiling
from the lake ice is capable of allowing one
to dispense with a preceding seismic pre-
survey on open water. Both frozen and unfrozen parts of the investigated thermokarst lake
could be imaged and stratigraphic details resolved. This makes the GPR system a superior tool
when working in arctic lake settings. It allows continuous profiling from basin to shallow

3 Ground penetrating radar and high-resolution seismics ________________________________________________________________________________________
46
areas. Thus, it also saves costs and enables geophysical profiling and subsequent sediment
coring during only one field season on the ice. To improve the horizontal resolution of the
GPR data, it will be useful to do data acquisition at finer sampling intervals.

4 Late Quaternary Sedimentation History of the Lena Delta ________________________________________________________________________________________
47
4 Late Quaternary Sedimentation History of the Lena Delta ∗
Abstract Core and outcrop analysis from Lena mouth deposits have been used to reconstruct the
Late Quaternary sedimentation history of the Lena Delta. Sediment properties (heavy
mineral composition, grain size characteristics, organic carbon content) and age
determinations (14C AMS and IR-OSL) are applied to discriminate the main sedimentary
units of the three major geomorphic terraces, which build up the delta.
The development of the terraces is controlled by complex interactions among the
following four factors. (1) Channel migration. According to the distribution of 14C and IR-
OSL age determinations of Lena mouth sediments, the major river runoff direction shifted
from the west during the marine isotope stages 5 to 3 (third terrace deposits) towards the
northwest during marine isotope stage 2 and transition to stage 1 (second terrace), to the
northeast and east during the Holocene (first terrace deposits). (2) Eustasy. Sea-level rise
from Last Glacial lowstand to the modern sea-level position, reached at 6-5 ka BP, resulted
in back-filling and flooding of the palaeovalleys. (3) Neotectonics. The extension of the
Arctic Mid-Ocean Ridge into the Laptev Sea shelf acts as a halfgraben pattern showing
dilatation movements with different subsidence rates. From the continent side differential
neotectonics with uplift and transpression in the Siberian coast ridges are active. Both of
them likely have influenced river behaviour (i.e. providing accommodation place).
Especially deposits building up the second terrace in the western sector have probably been
preserved against fluvial erosion due to uplift. The actual delta setting comprises only the
eastern sector of the Lena Delta. (4) Peat formation. Polygenetic formation of ice-rich peaty
sand (“Ice Complex”) was most extensive (7-11 m in thickness) in the southern part of the
delta area between 43 and 14 ka BP (third terrace deposits). In recent times, alluvial peat
(5-6 m in thickness) is accumulated on top of the deltaic sequences in the eastern sector
(first terrace).
4.1 Introduction The Lena Delta is the largest delta in the Arctic occupying an area of 3.2 x 10⁴ km2
(Gordeev and Shevchenko, 1995). With the second largest river discharge in the Arctic
∗ Schwamborn, G., Rachold, V., Grigoriev, M.N., Quat. International 89 (2002). Reprint kindly permitted.

4 Late Quaternary Sedimentation History of the Lena Delta ________________________________________________________________________________________
48
(525 km3/a) it is the main connection between interfering continental and marine processes
within the Laptev Sea (Rachold et al., 1999). The distinctive pattern of upstream and lateral
islands surrounded by the delta holds hundreds of river branches. Today four major delta
branches carry the bulk of the water. The largest, known as Trofimovskaya branch, is
directed toward the east and receives 61% of the annual water discharge (Fig. 4-1). It is
followed by the Bykovskaya branch with 25% towards southeast, by the Tumatskaya
branch to the north and the Olenyokskaya branch to the west, each of them with 7%
(Alabyan et al., 1995). During the last two decades several studies have been conducted on
geomorphology (Korotaev, 1986, Grigoriev, 1993), cryolithology (Kunitsky, 1989),
hydrology (Alabyan et al., 1995, Rachold et al., 1996), paleogeography (Fukuda, 1994,
Galabala, 1997, Are and Reimnitz, 2000), tectonics (Avetisov, 1999, Franke et al., 2000),
coastal retreat (Are, 1999) etc. in the Lena Delta area. However, the sedimentation history
as well as the processes that control the lateral extension of the Lena Delta in total are
poorly understood.
Figure 4-1: Geomorphologic overview of the Lena Delta (after Grigoriev, 1993) and distribution of sampling
sites.
4 Late Quaternary Sedimentation History of the Lena Delta ________________________________________________________________________________________
49
According to Grigoriev (1993), the Lena Delta can be subdivided into three
geomorphologic terraces. The first terrace including active floodplains (1-12 m a.s.l.)
covers the main part of the eastern delta sector between the Tumatskaya and the
Bykovskaya branches (Fig. 4-1). This terrace is assumed the „active“ delta. The western
sector between Tumatskaya and Olenyokskaya branches consists of mainly sandy islands,
from which Arga Island is the largest. It has a diameter of 110 km and represents the major
part of the second terrace (20-30 m a.s.l.). Sandy sequences covered by the so-called “Ice
Complex” form the third terrace (30-55 m a.s.l.). They outline individual islands along
Olenyokskaya and Bykovskaya branches at the southern rim of the delta setting. The third
terrace can further be subdivided into two areas due to a considerable difference in altitude
(more than 20 m) between the western and the eastern sector (Grigoriev, 1993, Pavlova and
Dorozkhina, 1999, 2000). The age relationships between the major fluvial terraces are not
yet clear. Especially age and origin of the second sandy terrace and the third terrace
including the Ice Complex is still being discussed (Are and Reimnitz, 2000). The term “Ice
Complex” is applied to permafrost sequences, which usually consist of fine-grained loess-
like sediments within organic-rich to peaty formations. They have a high content of
segregated ice and polygonal ice wedges several meters in height and width. These deposits
were formed during the Late Pleistocene regression (marine isotope stages 5-3) on the dry
Laptev Sea shelf and in the North Siberian lowlands (Soloviev, 1989, Sher, 1995,
Alekseev, 1997, Romanovskii et al., 2000). Ice Complex (IC) deposits in the region are
regarded as remnants of a Late Pleistocene accumulation plain (Sher, 1999). In the Lena
Delta they reach thicknesses of 20-30 m (Grigoriev, 1993). Knowledge about the age of the
IC, the underlying sands and the sands of the second terrace is necessary for understanding
the modern structure of the delta. Originally, the second terrace was considered to be
younger than the IC remnants and to be overlapping them (Ivanov, 1970, 1972 in Are and
Reimnitz, 2000). Later it was proposed that the sands composing the second terrace are
underlying the IC (Galabala, 1987 in Are and Reimnitz, 2000).
Not only the age but also the origin of the sandy sediments of the second and third terrace
is in debate. Both, glacial and periglacial genesis have been suggested. It was proposed that
glaciers along with subglacial and proglacial meltwater were the agents that created the
sandy sediments (Grosswald, 1998, Grosswald and Hughes, 1999). Fluvio-nival processes

4 Late Quaternary Sedimentation History of the Lena Delta ________________________________________________________________________________________
50
under periglacial conditions in a far distance to a northern ice shield but in connection with
local snow glaciers from the south are suggested by others (Galabala, 1997). Various
authors discuss an alluvial or even a marine origin of the sandy sediments as summarised in
Are and Reimnitz (2000). The origin of the IC is regarded controversial, as well. Fluvial
(Slagoda, 1993), niveo-fluvial (Kunitsky, 1989), aeolian (Tomirdiaro, 1996), ice-dammed
alluvial (Grosswald et al., 1999) or polygenetic processes as discussed in Schirrmeister et
al. (1999) have been proposed.
The main objective of the present study is to reconstruct the paleogeographic and
paleoenvironmental development of the Lena Delta area during the late Pleistocene and
Holocene. Sediment sampling has been conducted at selected sediment profiles of the three
terraces (Fig. 4-1). They are regarded as representative localities for the Lena Delta setting
according to previous studies carried out in the area (Grigoriev, 1993). At first, new
sediment datings are accomplished to establish age relations between the delta terraces. The
datings are used together with recently published luminescence and radiocarbon age
determinations from Lena Delta sediments. Secondly, in order to identify the source region
of the sandy sediments composing the second and the third terrace including the Ice
Complex heavy mineral studies are applied. The heavy mineral distributions serve as a
helpful tool for provenance studies and paleoenvironmental reconstructions (Morton and
Hallsworth, 1994, Dill, 1998, Peregovich et al., 1999). Although heavy mineral studies are
available for recent Lena River sediments (Serova and Gorbunova, 1997, Behrends et al.,
1999, Hoops, 2000), a comparison of terrace deposits is missing. Thirdly, grain size
distributions and total organic-carbon (TOC) contents are used to characterize the
sedimentary environments of the terrace sediments and the major sediment facies,
respectively.
4.2 Material and Methods Fieldwork was carried out during the expeditions LENA 1998 (Schwamborn et al., 1999)
and LENA 2000 (Schirrmeister, in press). Sampling was done by permafrost drilling to
recover frozen sediment cores (max. depth 9.25 m) and through natural exposures. River
bedload sediments are used to compare for their grain size characteristics. Relevant
sampling was carried out during an expedition to the Lena River in 1995 (Rachold et al.,
1997). Sediment sections and sampling sites are equally distributed on the terraces and the

4 Late Quaternary Sedimentation History of the Lena Delta ________________________________________________________________________________________
51
major fluvial branches. They are regarded as representative sediment sites according to
previous works conducted in the area (Grigoriev, 1993), therefore, reflecting the general
sedimentary and geomorphologic situation in the delta.
Grain size distributions for terrace sediments have been determined by laser particle
sizing (LS200, Coulter Corp.). Prior to the measurements the individual samples were
oxidized (3%-H2O2) to remove organic matter and disperged (10%-NH4OH) to diminish
surface tension. TOC was analyzed using a Metalyt-CS-1000-S (Eltra Corp.) in
corresponding pulverized samples after removal of carbonate with HCl (10%) at a
temperature of 80°C. Heavy mineral analysis has been applied to the 63-125 µm sub-
fraction. Sample preparation was performed according to standard procedures (Boenigk,
1983, Mange and Maurer, 1992). The heavy minerals were separated using sodium
metatungstate solution (Na6(H2W12O40)xH2O) with a density of 2.89 g/cm3. On average
>200 transparent grains were counted on slides. Results are expressed in grain %. Samples
from sections of each terrace and the IC (Kurungnakh section) were examined for their
heavy mineral spectra. Samples were chosen from bottom, middle and top sediment layers
of the representative profiles. Heavy mineral data of recent Lena River sediments of the
same grain size fraction obtained by Hoops (2000) are used for comparison.
AMS radiocarbon dating of sediments is based on selected organic-rich layers and plant
remains. Measurements have been performed at the Leibniz Laboratory for Age
Determinations, University of Kiel. Only the 14C AMS ages of the extracted residues free
of humic acids are used for age interpretation. Results are expressed using a timescale
based on 14C ages (ka BP). For a more complete assessment of age determinations for Lena
Delta sediments published results of radiocarbon (Kuptsov and Lisitsin, 1996, Pavlova et
al., 1999) and luminescence datings (Krbetschek et al., in press) are incorporated in the
review of aged sediments.
4.3 Results 4.3.1 Distribution of 14C- and IR-OSL-dated sediments and their lithological
description
An overview of the radiocarbon and luminescence datings for Lena Delta sediments
reveals that different ages can be found at similar hypsometric marks and time ranges of the
individual terraces may overlap each other (Table 4-1).

4 Late Quaternary Sedimentation History of the Lena Delta ________________________________________________________________________________________
52
The third terrace as observed along the Olenyokskaya branch is exposed as an up to ~35
m high shore cliff. The lower part of the section is dominated by ice-poor (<25 wt% (wt =
weight)) sandy layers showing wavy bedding that are intercalated with root horizons (0-14
m a.s.l.). The amount of root horizons decreases towards the top. This sediment facies is
comparable to the recent alluvium of the first terrace as observed in nearby located sandy
islands along the river. At the easternmost outcrops of the third terrace (see Fig. 4-1) the
same lithofacies of sandy sediments has been detected by drilling (Grigoriev, 1993).
Datings of the lower sandy sediments span a range from 88 ka to 37 ka BP (Nagym and
Kurungnakh sections in Table 4-1). Measured AMS ages are placed at the limits of the age
range covered by the 14C method making the age determinations from both methods
suitable only to narrow the sedimentation period to the time of marine isotope stages 5 to
early 3 according to Martinson et al. (1987). On top, the sandy sequence is covered by the
IC consisting of ice-rich (up to 80 wt%) peaty deposits in alternation with organic-rich silty
sand (14-35 m a.s.l.). Ice wedges of 5-10 meters in height and width occur throughout the
IC. Formation of IC deposits took place between 43 ka BP (Nagym and Kurungnakh
sections in Table 4-1) and 14 ka BP as indicated by a radiocarbon dating from the upper
part of the Sobo section (Fig. 4-2 and Table 4-1). The IC deposits overlie the lower sandy
sequences with a sharp facial boundary.
Outcrops of the second terrace (Arga section) show massive, organic-poor, fine-sandy
sequences. Commonly they have a low ice content (<25 wt%) but contain a net of narrow-
standing (dm scale) ice veins. Formation of the ice veins took place probably at the
transition time of Late Pleistocene to Early Holocene as deduced from oxygen isotope
measurements (H. Meyer, unpublished data). The results resemble measurements from
Bykovsky Peninsula, southeast of the Lena Delta, which have been dated to this time
(Meyer et al., in press). According to IR-OSL and 14C age determinations the sandy
sediments have a Late Pleistocene (14.5 to 10.9 ka BP) to early Holocene age (6.4 ka BP,
Jeppiries section) (Table 4-1). Although the age data from the Arga section are not
completely in correct chronological order from the bottom to the top of the profile, the
overlapping of the error ranges does not allow to discuss age inversion (Krbetschek et al.,
in press). It seems likely that the overlapping error ranges of the luminescence datings are

4 Late Quaternary Sedimentation History of the Lena Delta ________________________________________________________________________________________
53
associated with a high accumulation rate implied by a fluvial environment under upper flow
regime.
Figure 4-2: Representative sediment sections with radiocarbon and luminescence ages. References for age
determinations are given in Table 4-1.
In the easternmost Delta area (Sardakh section), where modern sedimentation is taking
place (first terrace deposits), alluvial facies of the sediments changes from peaty sands at
the bottom to silty-sandy peats towards the surface (Fig. 4-2). The sediments have high ice
contents (>50 wt%) and subaerial or buried ice wedges of 2-3 meters in height and width
are common. The ages of the first terrace change from early Holocene (8.5 ka BP) in the
west (M. Tumatskaya section) to late Holocene (<2.8 ka BP) in the east (Samoylov and
Sardakh sections) to latest Holocene (<1.4 ka BP) in the north (Sagastyr section). The
pattern of radiocarbon dates from Samoylov and Sardakh, as a group, shows poor
correlation between age and depth. Various age inversions in core sample and outcrop dates

4 Late Quaternary Sedimentation History of the Lena Delta ________________________________________________________________________________________
54
in these sections indicate that the sediments from the inner delta plain are highly reworked.
The numerous small islands on the delta plain undergo erosion at the river exposed shore
section altitude (m a.s.l.)
lab. no. measured age (14C yr BP)
* (IR-OSL ka BP)
reference
First terrace Samoylov (core) 7.5 KIA-8169 435 ±30 this study Samoylov (core) 6.6 KIA-8170 230 ±25 this study Samoylov (core) 6.2 KIA-8171 500 ±25 this study Samoylov (core) 1.3 KIA-8172 2605 ±30 this study Samoylov (core) 1.2 KIA-8173 2530 ±30 this study Samoylov (core) 0.4 KIA-8174 2635 ±35 this study Samoylov (core) 0.1 KIA-8175 2730 ±40 this study
Samoylov (outcrop) 6.2 IORAN-4167 3700 ±260 Kuptsov & Lisitsin 1996 Samoylov (outcrop) 4.2 IORAN-4164 4220 ±240 Kuptsov & Lisitsin 1996 Samoylov (outcrop) 3.6 IORAN-4101 2140 ±110 Kuptsov & Lisitsin 1996
Sardakh (core) 8.5 KIA-6759 2755 ±25 this study Sardakh (core) 8.1 KIA-6760 1360 ±20 this study Sardakh (core) 6.6 KIA-6761 2525 ±30 this study Sardakh (core) 3.9 KIA-6762 3460 ±30 this study Sardakh (core) 1.7 KIA-6763 3025 ±35 this study Sardakh (core) 0.6 KIA-6764 3420 ±35 this study Sardakh (core) -0.2 KIA-6765 2830 ±35 this study
Sagastyr (outcrop) 0.4 KIA-12519 360 ±25 this study Sagastyr (outcrop) 0.6 KIA-12520 645 ±25 this study Sagastyr (outcrop) 0.9 KIA-12521 650 ±25 this study Sagastyr (outcrop) 1.1 LU-4201 1400 ±90 Pavlova et al. 1999
M. Tumatskaya (outcrop) 2.5 LU-4191 8570 ±160 Pavlova et al. 1999 Second terrace Arga (outcrop) 25.9 ARG-5 * 13.1 ±1.1 Krbetschek et al. 2001 Arga (outcrop) 25.3 ARG-4 * 12.0 ±1.1 Krbetschek et al. 2001 Arga (outcrop) 24.6 ARG-3 * 13.3 ±1.5 Krbetschek et al. 2001 Arga (outcrop) 23.2 ARG-1 * 13.4 ±1.1 Krbetschek et al. 2001
Jeppiries (outcrop) 7.5 LU-4198 6430 ±120 Pavlova et al. 1999
Third terrace (Ice Complex) Sobo (outcrop) IC-top 14.0 GIN-4115 14340 ±150 Grigoriev 1993
Nagym (outcrop) IC-bottom 11.0 KIA-9899 42930 +3100/-2230 Krbetschek et al. 2001 Kurungnakh (outcrop) IC-bottom 14.0 KIA-6755 42910 +840/-760 Krbetschek et al. 2001
Third terrace (lower sands) Nagym (outcrop) 10.3 OLE-6 * 55.0 ± 9.0 Krbetschek et al. 2001 Nagym (outcrop) 5.8 OLE-3 * 49.0 ±22.0 Krbetschek et al. 2001 Nagym (outcrop) 5.1 KIA-6753 > 56790 Krbetschek et al. 2001 Nagym (outcrop) 4.0 OLE-2 * 52.0 ±10.0 Krbetschek et al. 2001 Nagym (outcrop) 3.4 OLE-1 * 57.0 ± 9.0 Krbetschek et al. 2001 Nagym (outcrop) 3.1 KIA-6754 > 54520 Krbetschek et al. 2001
Kurungnakh (outcrop) 12.5 KIA-6756 37230 +510/-480 Krbetschek et al. 2001 Kurungnakh (outcrop) 8.9 OLE-10 * 65.0 ± 8.0 Krbetschek et al. 2001 Kurungnakh (outcrop) 7.7 KIA-6757 39400 +510/-480 Krbetschek et al. 2001 Kurungnakh (outcrop) 5.7 OLE-8 * 71.0 ±40.0 Krbetschek et al. 2001 Kurungnakh (outcrop) 4.3 OLE-7 * 88.0 ±14.0 Krbetschek et al. 2001 Kurungnakh (outcrop) 4.0 KIA-6758 49440 +1760/-1440 Krbetschek et al. 2001
Table 4-1: List of 14C and IR-OSL datings of Lena Delta sediments.

4 Late Quaternary Sedimentation History of the Lena Delta ________________________________________________________________________________________
55
banks and show accumulation at the opposite tips in downstream position. Most probably
organic material that was initially incorporated and stored upstream for a period has been
remobilized and finally deposited on the delta plain. This finding like previous studies
(Stanley and Chen, 2000) argues that the use of the youngest dates is preferable. Based on
the existing information it is not possible to identify the exact facial boundary of channel
fill and the beginning of organic-rich deltaic sedimentation. To accurately date the
beginning of modern delta accumulation longer cored profiles with reliable age
determinations from the modern depocenter are needed. Only a larger number of datings in
the Holocene part could confirm the tendency that from west to east the deposits are getting
younger.
According to recent studies on the Late Pleistocene and Holocene history of the Laptev
Sea the post-glacial sea level rise only reached the modern coastline at 6-5 ka BP (Bauch et
al., 1999, Romanovskii et al., 1999, Müller-Lupp et al., 2000, Hubberten and Romanovskii,
in press). These studies show that in the Laptev Sea the post-glacial sea-level rise followed
the glacio-eustatic sea-level record reconstructed by Fairbanks (1989). For the Early to
Middle Weichselian the sea level curve after Chappell et al. (1996) can be applied
(Romanovskii et al., 1999, Hubberten and Romanovskii, in press). The continental shelf is
very flat with a break occurring at 50 to 60 m water depth and varies in width from 300 km
to over 500 km (Holmes and Creager, 1974). This implies that during the deposition time of
the sandy sediments of the third terrace and the IC at 60 ka and 30 ka BP, respectively, the
sea level was about 60 m lower than at present (Hubberten and Romanovskii, in press). The
sea level at 12.7 ka BP, the deposition time of the uppermost sediments of the second
terrace, is calculated to have been lower by approximately 70 m than at present (Müller-
Lupp et al., 2000). Thus, the paleo-coastline of the Laptev Sea was in far distance to the
north (>150 km) throughout the Late Pleistocene and early Holocene. Then, after the
termination of the Last Glacial, the sea first invaded the mouths of the Pleistocene river
valleys on the shelf as seen in sediment cores from the Laptev Shelf (Bauch et al., 1999,
Peregovich et al., 1999). In consequence, all deposits in today’s Lena Delta showing ages
older than 6-5 ka BP have to be related to intra-continental sedimentation environments at
the relevant times.

4 Late Quaternary Sedimentation History of the Lena Delta ________________________________________________________________________________________
56
4.3.2 Heavy mineral analysis The sandy sediments from all three terraces are similar in their heavy mineral associations
(Table 4-2). They are dominated by amphibole (30 %) followed by varying amounts of
garnet, epidote, ortho- and clinopyroxene (each 10 % ±2 %). Typically, terrace sands have
considerable amounts (8-17 %) of opaque minerals and alterites (rock fragments and
weathered particles). Apatite is present (3 %), zircon, biotite and titanite are observed in
accessory amounts (<2 %). Recent Lena River sands, in comparison, are generally
characterized by the same heavy mineral assemblage, mainly by the dominance of
amphibole (27 %) and opaque minerals (23 %), followed by alterites (11 %) and typically
similar amounts of orthopyroxene, garnet (each 10%) and clinopyroxene (8 %). Epidote is
less abundant than in the terrace sands (2 %), apatites, zircon, biotites, titanites and
metamorphic minerals like sillimanite and kyanite are equally common, but rare (<2 %).
sample amp cpx opx ep zr gar ap sill ky rut tit bio alt opaque
nr. of grains
First terrace top (Sardakh section) 26.4 11.2 10.4 10.4 1.6 8.0 4.8 0 0 0 0.8 0 8.8 17.6 250
Middle (Sardakh section) 23.3 9.0 9.0 11.3 2.3 9.8 4.5 0 0.8 0 1.5 0 11.3 17.3 266 bottom (Samoylov section) 29.8 13.2 11.6 9.1 0.8 7.4 4.1 0 0 0 0 0 5.8 18.2 242
mean % 26.5 11.1 10.3 10.2 1.5 8.6 4.3 0 0.4 0 0.8 0 8.5 17.7 Second terrace
top (Arga section) 29.7 11.7 18.0 8.1 0.0 14.4 2.7 0 0 0 1.8 0 1.8 11.7 222 middle (Arga section) 29.4 6.3 8.7 10.3 1.6 10.3 5.6 0 0 0 0 0 16.7 11.1 252 bottom (Arga section) 28.4 8.1 13.5 13.5 0.7 8.8 2.7 0 0 0 0.7 0 11.5 12.2 296
mean % 29.2 8.7 13.4 10.6 0.8 11.2 3.7 0 0 0 0.8 0 10.0 11.7 Third terrace (lower sands)
top (Kurungnakh section) 26.0 10.6 11.5 10.6 1.9 12.5 0.0 0 0 0 1.0 0 6.7 19.2 260 middle (Kurungnakh section) 27.1 8.2 8.2 8.2 1.2 10.6 5.9 0 0 0 3.5 1.2 10.6 15.3 255 bottom (Kurungnakh section) 31.5 5.6 7.9 9.0 3.4 10.1 4.5 0 1.1 0 1.1 0.0 11.2 14.6 267
mean % 28.2 8.1 9.2 9.3 2.2 11.1 3.5 0 0.4 0 1.9 0.4 9.5 16.4 modern Lena sediments
delta of Lena River * 25.9 5.8 10.9 2.2 2.9 10.2 1.1 0.4 0.4 0.7 0.4 0 13.5 25.5 274 delta of Lena River * 29.7 9.6 10.4 2.0 0.4 10.4 1.2 0 0 0 2.4 2.8 9.6 21.3 249
mean % 27.8 7.7 10.7 2.1 1.7 10.3 1.1 0.2 0.2 0.4 1.4 1.4 11.6 23.4 * data after Hoops (2000) amp=amphibole, cpx=clinopyroxene, opx=orthopyroxene, ep=epidote, zr=zircon, gar=garnet, ap=apatite, sill=sillimanite, ky=kyanite, rut=rutile, tit=titanite, bio=biotite, alt=alterite; opaque Table 4-2: Results of heavy mineral analysis for terrace sediments (in grain %). Means have been calculated
since the heavy mineral compositions from the individual samples resemble each other within each terrace.

4 Late Quaternary Sedimentation History of the Lena Delta ________________________________________________________________________________________
57
The heavy mineral composition of the IC deposits (Kurungnakh section) is clearly
different from the Lena River signal (Table 4-3). It shows highest amounts of garnet (25 %)
and enrichment in epidote (15 %). Amphibole is common like opaque grains (14-15 %), but
IC sediments are poor in pyroxenes (<2 %). It has to be noted that zoisit, a mineral, which
does not appear elsewhere in the delta sediments, can be observed (8 %). Apatite (8 %) is
more abundant than in the Lena River derived sediments. Korund and tourmaline are found
in accessory amounts besides zircon. Comparative studies of brook sediments from the
Chekanovsky Ridge south and southwest of the Lena Delta (Fig. 4-1) show that garnet here
dominates (45 %), as well. Like in the IC equal amounts of amphibole, apatite, zoisit and
epidote occur (6-8 %), although with varying amounts (Table 4-3).
Sample amp cpx opx tourm ep zr gar ap zoi stau tit kor alt opaque
nr. of grains
Ice Complex top (Kurungnakh section) 15.9 0.9 1.9 1.9 15.9 1.9 25.2 3.7 12.1 0 0.9 0 6.5 13.1 321
middle (Kurungnakh section) 12.0 1.1 2.2 1.1 15.2 1.1 25.0 12.0 4.3 0 2.2 1.1 4.3 18.5 276 bottom (Kurungnakh section) 15.3 1.0 2.0 1.0 16.3 1.0 25.5 7.1 6.1 0 2.0 1.1 5.1 16.3 294
mean % 14.4 1.0 2.0 1.3 15.8 1.3 25.2 7.6 7.5 0 1.7 0.7 5.3 16.0 Chekanovsky Ridge (N 72°40´, E 123°30´)
brook sediments 7.6 0 0 0 7.6 2.2 45.7 9.8 5.4 2.2 0 0 5.4 14.1 276 brook sediments 9.6 0 0 0 8.5 1.1 42.6 10.6 4.3 4.3 0 0 6.4 12.8 282 brook sediments 8.5 0 0 0 8.5 3.2 45.7 8.5 6.4 3.2 0 0 4.3 11.7 282
mean % 8.6 0 0 0 8.2 2.1 44.7 9.6 5.4 3.2 0 0 5.4 12.9 amp=amphibole, cpx=clinopyroxene, opx=orthopyroxene, tourm= tourmaline, ep=epidote, zr=zircon, gar=garnet, ap=apatite, zoi=zoisit, stau=staurolite, tit=titanite, kor=korund, alt=alterite; opaque Table 4-3: Results of heavy mineral analysis for IC sediments and Chekanovsky Ridge brook sediments (in
grain %). Means have been calculated since the heavy mineral compositions from the individual samples
resemble each other within the IC and the brook sediments, respectively.
In summary, the following essentials can be deduced from the heavy mineral studies:
sandy sediments of the three fluvial terraces except those from the IC deposits show a
heavy mineral composition similar to that of recent Lena River sediments (Fig. 4-3). The
Lena River signal is characterized by an integral heavy mineral composition due to the
large catchment comprising terrigenous clastic and metamorphic rocks (Hoops, 2000). That
means, the source area of the sandy sediments in the terraces of the Lena Delta during the
entire time of fluvial to deltaic accumulation was the Lena catchment. According to
comparative studies, the source area of the IC´s clastic material is most likely found in the

4 Late Quaternary Sedimentation History of the Lena Delta ________________________________________________________________________________________
58
Chekanovsky Ridge. Brook sediments from Chekanovsky outlets (Fig. 4-1) show a heavy
mineral composition very similar to the composition of the IC sediments. Correlation of the
IC and the detrital material from the Chekanovsky Ridge is supported by the same palette
of dominant minerals contributing to the heavy mineral spectra (Fig. 4-3). Hydrodynamic
reasons may have caused the smaller relative amount of garnet in the IC sediments. Thus,
the mountain ridges to the south could not have been thoroughly glaciated between ~43 and
14 ka BP when they acted as a source area. A similar conclusion for IC deposits from
Bykovsky Peninsula, southeast of the Lena Delta, which are derived from the Kharaulakh
mountains, has been published recently (Siegert et al., in press).
Figure 4-3: Heavy mineral associations of geomorphological terraces 1 through 3 and IC deposits and their
assumed sediment sources. The same abbreviations for mineral names are valid as in Tables 4-2 and 4-3, ztr =
zircon + tourmaline + rutile.

4 Late Quaternary Sedimentation History of the Lena Delta ________________________________________________________________________________________
59
4.3.3 Grain Size Characteristics and TOC Content Grain size parameters are valuable in discriminating depositional subenvironments
(Engelhardt et al., 1973, Füchtbauer, 1988). Arithmetic mean (1st statistical moment) and
sorting (2nd statistical moment) reflect the flow strength and the degree of uniformity in the
deposits produced by current action during grain transport and deposition (Tucker, 1996).
Sediment grain size data for Lena Delta sediments (Fig. 4-4 A-B) indicate that there are two
different sediment populations building the three terraces and one interposing between
them. Moderately sorted
Figure 4-4: Mean values, sorting and TOC content of sediment samples. Sample groups listed are first,
second and third terrace (lower sands) and IC sediments, comparisons are from grab samples of Lena River
bedload. (A) Scatter plot of mean versus sorting for the samples utilized. (B) Mean and sorting show the
separation and grouping of sample sets. Error bars indicate standard deviation. (C) Scatter plot of relationship
between mean and TOC content. (D) Mean and TOC with error bars show the separation and grouping of
sample sets.
fine sands (‘lower sands’) forming the base of the third terrace match the sandy sediments
of the second terrace (Fig. 4-4B). In contrast, sediments from the IC are finer and poorly
sorted. Moreover, unlike any other sedimentary facies in the delta, the sediments from the
IC show polymodal grain size distributions (Fig. 4-5). Thus, multiple transport processes

4 Late Quaternary Sedimentation History of the Lena Delta ________________________________________________________________________________________
60
for the formation of the IC sediments have to be considered. First terrace deposits are
positioned between IC sediments and the former two (Fig. 4-4B). Their grain size
distribution and sorting undergo a development along the sediment profiles from river
bedload at the bottom of the deltaic sequences to suspension load bedding towards the top
as shown for Sardakh and Sagastyr sections (Schwamborn et al., 2000b). Generally, smaller
mean grain sizes correspond to poorer sorting, e.g. for deltaic sediments of the first terrace
and the organic-rich IC sediments. However, presumably wave-winnowed, well-sorted fine
sands have been found as intercalations within silty-sandy to peaty first terrace deposits.
Fig. 4-4B indicates that, with regard to mean
Figure 4-5: Grain size distributions for IC deposits and lower sands from Kurungnakh section.
grain size, third and second terrace sands plot close to recent fluvial bedload sands of the
major delta branches. They show overlapping ranges in the standard deviation. In addition,
the second statistical moment (sorting) supports the conclusion that they may have been
derived from the same parent population, since they show overlapping error bars.

4 Late Quaternary Sedimentation History of the Lena Delta ________________________________________________________________________________________
61
Therefore, the pre-Holocene aged sandy sediments of the second and the third terrace are
attributed to fluvial bedload sedimentation. A low TOC-content (<0.4 wt%) is common to
these suggested bedload sands
(Fig. 4-4 C-D). In contrast,
high TOC contents (<18 wt%)
are associated with fine
grained sediments that are
preferentially deposited in the
deltaic plain (first terrace) and
the IC.
4.4 Discussion The review of the age deter-
minations and mineralogical
properties allows a general
reconstruction of the sediment
succession in the Lena Delta
(Fig. 4-6).
4.4.1 Third terrace - Lower
sands (Nagym and Kurung-
nakh sections)
The third terrace represents
a fluvial stage of the Lena
River for the period of ~88 ka
to 43 ka BP. Grain size
characteristics of the sandy
deposits from the third terrace
are associated with a bedload
environment. Sediment struc-
tures like wavy bedding and
cryoturbations with inter-

4 Late Quaternary Sedimentation History of the Lena Delta ________________________________________________________________________________________
62
layers of root horizons point to a fluvial sedimentation under shallow water conditions
comparable to recent floodplain environments.
4.4.2 Third terrace - Ice Complex (Nagym and Kurungnakh sections)
IC deposits on top of the fluvial sequences of the third terrace are regarded as periglacial
polygenetic formations of Late Pleistocene time between 43 ka and 14 ka BP. They are
derived from the Chekanovsky Ridge and presumably transported to the northern foreland
through local outflows. Multiple processes like gravitational sliding, surface-water run-off,
solifluction and most likely wind may have reworked, transported and redeposited
primarily accumulated material. Changing hydraulic conditions or reworking may have
modified the heavy mineral composition in single sediment layers. Water flow, both in the
uplands and the lowlands, was active during seasonal thawing of irregularly distributed
snow cover, that is, of snow and firn fields, which were probably widespread in the area
(Kunitsky, 1989, Galabala, 1997, Kunitsky et al., in press). Although fluvial activity
through Late Pleistocene time is seen in seismic data of the exposed Laptev shelf (Kleiber
and Niessen, 1999), IC deposition in the area of today’s Olenyokskaya branch is only
possible during a time of Lena River inactivity in this delta sector. Otherwise, the locally
derived and fine-grained sediments would have been removed with the Lena River
downflow.
The strong facies change from the underlying fluvial sands to the IC is interpreted as
resulting from tectonic activity. There are strong indications for tectonic movements in the
Lena Delta area. This includes the development of extensional halfgraben structures on the
Laptev shelf to the north due to riftogenesis (Drachev et al., 1998, Hinz et al., 1998, Franke
et al., 2000) and compression tectonics in the continental mountain ridges to the south
(Romanovskii, 1978, Grinenko, 1998, Mikulenko and Timirshin, 1996). Fault systems
belonging to the “Lena-Taymyr dislocation” run subparallel to the coastal line from the
Taymyr Penninsula in the west to the Lena Delta area in the east (Mikulenko and
Timirshin, 1996). Here, the course of the fault system is marked by the Olenyokskaya
branch and is regarded as a central structure within the Lena Delta (Fig. 4-7). It is
associated with uplifting of the continental side. Considerable tectonic movements in the
Verkhoyansk and Kharaulakh mountains to the south are reported to have occurred until 50

4 Late Quaternary Sedimentation History of the Lena Delta ________________________________________________________________________________________
63
ka BP (Romanovskii, 1978). Local uplifting ranged from several hundred to more than one
thousand meters.
Figure 4-7: (a) Distribution of recent earthquake occurrence (magnitude 5-6) in the Lena Delta area (after
Avetisov, 1999). The Lena Delta is demarcated by tectonic boundaries between the western and the eastern
sector (according to Pavlova and Dorozkhina, 2000) and along the Olenyokskaya branch in the south
(according to Mikulenko and Timirshin, 1996). (b) Thicknesses of upper Cretacious-Cenozoic deposits in the
Lena Delta area (after Grigoriev et al., 1996).
4.4.3 Second terrace (Arga section) Sedimentological and mineralogical parameters indicate that sediments of the second
terrace are similar to recent Lena River bedload. The lack of silt, clay or organic matter in
the Arga sands is interpreted as a result of a highly energetic periglacial channel network.
The overlapping IR-OSL age determinations of the Arga sands suggest high accumulation
rates. This points to a braided river system implying an upper flow regime, since for the
same slope braided rivers tend to have higher discharges than meandering rivers (Allen,
1970, Panin et al., 1999). Braided rivers are generally found close to the hinterland, where
the slope of the drainage basin is high and low sinuosity rivers flow on flat foreland plains
(Quirk, 1996). In the case of the Lena River the slope providing the fluvial energy may be
(a)
-1 thickness (km) of Upper Cretacious-Cenozoic deposits
(b)
-1
-2-3
-3-4
-3 -3
-4
-2
-1
-2
-4 -3
-2
-3
-2-3
-2
-4
-3
100 km100 km
Tiksi
1980
1986
1963
1964
tectonic boundary
tectonic boundary
mechanism
tension
compression
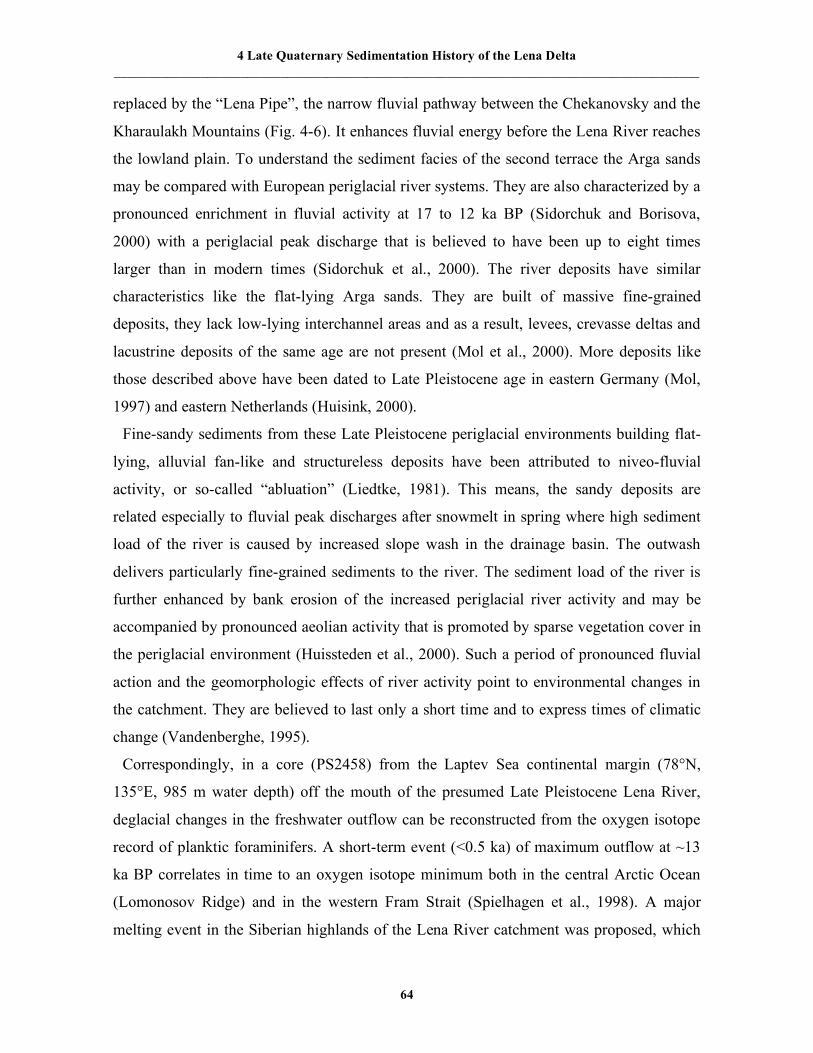
4 Late Quaternary Sedimentation History of the Lena Delta ________________________________________________________________________________________
64
replaced by the “Lena Pipe”, the narrow fluvial pathway between the Chekanovsky and the
Kharaulakh Mountains (Fig. 4-6). It enhances fluvial energy before the Lena River reaches
the lowland plain. To understand the sediment facies of the second terrace the Arga sands
may be compared with European periglacial river systems. They are also characterized by a
pronounced enrichment in fluvial activity at 17 to 12 ka BP (Sidorchuk and Borisova,
2000) with a periglacial peak discharge that is believed to have been up to eight times
larger than in modern times (Sidorchuk et al., 2000). The river deposits have similar
characteristics like the flat-lying Arga sands. They are built of massive fine-grained
deposits, they lack low-lying interchannel areas and as a result, levees, crevasse deltas and
lacustrine deposits of the same age are not present (Mol et al., 2000). More deposits like
those described above have been dated to Late Pleistocene age in eastern Germany (Mol,
1997) and eastern Netherlands (Huisink, 2000).
Fine-sandy sediments from these Late Pleistocene periglacial environments building flat-
lying, alluvial fan-like and structureless deposits have been attributed to niveo-fluvial
activity, or so-called “abluation” (Liedtke, 1981). This means, the sandy deposits are
related especially to fluvial peak discharges after snowmelt in spring where high sediment
load of the river is caused by increased slope wash in the drainage basin. The outwash
delivers particularly fine-grained sediments to the river. The sediment load of the river is
further enhanced by bank erosion of the increased periglacial river activity and may be
accompanied by pronounced aeolian activity that is promoted by sparse vegetation cover in
the periglacial environment (Huissteden et al., 2000). Such a period of pronounced fluvial
action and the geomorphologic effects of river activity point to environmental changes in
the catchment. They are believed to last only a short time and to express times of climatic
change (Vandenberghe, 1995).
Correspondingly, in a core (PS2458) from the Laptev Sea continental margin (78°N,
135°E, 985 m water depth) off the mouth of the presumed Late Pleistocene Lena River,
deglacial changes in the freshwater outflow can be reconstructed from the oxygen isotope
record of planktic foraminifers. A short-term event (<0.5 ka) of maximum outflow at ~13
ka BP correlates in time to an oxygen isotope minimum both in the central Arctic Ocean
(Lomonosov Ridge) and in the western Fram Strait (Spielhagen et al., 1998). A major
melting event in the Siberian highlands of the Lena River catchment was proposed, which

4 Late Quaternary Sedimentation History of the Lena Delta ________________________________________________________________________________________
65
contributed to high fluvial activity at that time. Widespread thick sand deposits are
described in the northern Yakutian lowlands and in the river lowlands of the Lena River
catchment, amongst them the Arga sands (Galabala, 1997). A periglacial origin was
interpreted including fluvial and aeolian activity. Equivalent deposits on the Laptev shelf
may be found in submarine channels, separated by shoals, which cross the shelf and
connect the river mouths with troughs or the shelf break further north (Lastotschkin, 1982,
Pavlidis et al., 1997, Kleiber and Niessen, 1999). Geophysical investigations on Arga
Island carried out with a radio-echo sound system suggest that the sandy environment
found here continues at least down to about 60 m (Schwamborn et al., 2000a). Fluvial
sediments on Bykovsky Peninsula, southeast of the Lena Delta region, which presumably
belong to the periglacial slope wash, have recently been dated to 12 ka BP in conformity
with the Arga sands (Schirrmeister and Grosse, unpublished data). Thus, a similar genesis,
i.e. periglacial outwash sedimentation during early summer peak discharge of the Lena
River, may be postulated for the sandy deposits on Arga Island.
At the onset of the Holocene this fluvial plain was abandoned and between 8-7 ka BP the
initiation of thermokarst created hollows and lakes in the surface (Schwamborn et al., in
press – see chapter 2). Glacial features as an evidence for glaciation in the area according to
Grosswald et al. (1999) have neither been found exposed on Arga Island nor in the lake
sediments of Lake Nikolay (Schwamborn et al., in press – see chapter 2), which is centrally
positioned in the area of presumed glaciation.
Because nowadays the river discharge does not reach the topographic level of 20 m a.s.l.
corresponding to the average elevation of the second terrace, a tectonic uplift of the western
sector, or downlift of the eastern sector, respectively, is evident. A sublongitudinal fracture
zone running through the Lena Delta is seen to separate the western from the eastern sector
already by Lungershausen (1967). Geomorphologically most conspicuous, the base of the
IC deposits shows a considerable difference in altitude (more than 20 m) between the
western and the eastern sections (Grigoriev, 1993, Pavlova and Dorozkhina, 2000). From
10 to 28 m a.s.l. in the western sector the base dips to –8 to –10 m a.s.l. in the eastern
sector. In addition, whereas a full complex of terraces is developed in the western sector the
eastern sector is dominated by floodplain alluvium and to relics of the third terrace. This
has been taken as an confirmation for a tectonic boundary between these two Lena Delta

4 Late Quaternary Sedimentation History of the Lena Delta ________________________________________________________________________________________
66
sectors running from north to south along the Tumatskaya branch (Pavlova and
Dorozkhina, 2000) (Fig. 4-7). Possible equivalent sandy sediments of the second terrace in
the eastern sector are considered to have been removed by fluvial erosion. Neotectonic
activity is documented until recent times (Avetisov, 1999). Both, compression and tension
patterns are reported in the area with earthquake magnitudes between 5 and 6 (Fig. 4-7).
Furthermore, the tectonic situation shows an aulacogenic character of the most eastern Lena
Delta area with a Quaternary sediment infill four times as high than in the western areas as
revealed by gravimetric and seismic measurements (Grigoriev et al., 1996). Regional
subsidence reaches from 1 km in the western delta sector down to 4-5 km off the delta in
the east (Fig. 4-7). The asymmetry of the downwarp located east off the delta and its very
irregular western border are characteristic of rifts that have formed at the junction of
substantially different lithospheric plates (Avetisov, 2000).
4.4.4 First terrace (Samoylov, Sardakh and Sagastyr sections) In the Holocene actual delta sector the fluvial facies of the sediments changes from
organic-rich sands at the bottom to silty-sandy peats towards the surface. This gradual
facies change is regarded typical for the transition of delta growth on top of backfilled
fluvial channels. However, the exact facial boundary could not have been detected so far.
Inversions of age determinations document high-energetic sedimentation conditions on the
delta plain. The accumulation takes place shortly after river high-stand in early summer.
Generally, the ages change from early Holocene in the west to late Holocene in the east
possibly indicating a river migration of this direction. In the Early Holocene climatic
warming and restoration of vegetation led to a decrease of peak discharges of the Lena
River, presumably a decrease of bedload and a relatively increased load of fine-grained
material and organic-rich suspension. Only material in the clay-sized fraction is still being
washed out to the sea. This resulted in a change of river pattern from aggrading braided
channels to floodplain sedimentation or slightly meandering channels according to
Korotaev (1986).
4.5 Conclusions The Lena Delta area is a geomorphic composite of erosional remnants from different Late
Pleistocene- to Holocene-aged fluvial stages and actual deltaic sedimentation. The latter is
found primarily in the eastern sector. The western sector is dominated by exposed peaty-

4 Late Quaternary Sedimentation History of the Lena Delta ________________________________________________________________________________________
67
sandy and sandy uplands formed during the Last Glacial sea-level lowstand. Lower fluvial
sands of the third terrace represent Paleo-Lena River deposits of Late Pleistocene age
(marine isotope stages 5 to early 3). The overlying Ice Complex deposits result from local
outwash from the nearby mountain ridges to the south. Periglacially characterized river
deposits of the second terrace represent a Lena River stadium of Late Weichselian time.
These deposits are interpreted as a river response to a short-term climatic change in the
catchment.
The general outline of the modern delta began to form only since the middle of the
Holocene. It is remarkable that the initiation of the delta at its modern position is retarded
compared to the mean timing of the initial Holocene delta development compiled by
Stanley and Warne (1994). They calculated a mean of ~7.0 ka BP for northern latitude
deltas whereas the deltaic sedimentation of the Lena Delta only has started after 6-5 ka BP
as seen from the transgression history of the Laptev Sea (Bauch et al., 1999). This may be
due to the great lateral extension of the Laptev shelf (up to 500 km) and its low bottom
slope inclination (Are, 1996).
The delta is part of a seismically active zone with considerable block uplift. The tectonic
activity is responsible for preserving mainly the western parts of the second and third
terraces against fluvial erosion. Tectonic movement is also regarded as crucial for the
strong facial boundary between the fluvial sands of the third terrace and the overlying Ice
Complex.
The sediment analyses do not support the hypothesis for a Late Pleistocene-time
glaciation in the Lena Delta area simultaneously to the north European Weichselian
glaciation. In combination with core analysis and seismic surveys from the Laptev shelf
sediment analyses suggest a continuous sedimentation of Lena River sands in the area
throughout Late Pleistocene and Holocene time. The period not covered by fluvial
sedimentation (between 43 and 14 ka BP) may be explained by progressive river erosion of
these sediments.

5 Summary _____________________________________________________________________________________
68
5 Summary Since the Weichselian deglaciation, eustatic and regional isostatic changes in sea level
have profoundly altered worldwide coastal geometries. Structures relating to
Pleistocene coastal and near-coastal lowlands have therefore undergone marine
inundation and subsequent exposure. Naturally, this is likewise the case in the Lena
Delta area.
The goal of this thesis is to gain an overall understanding of the sedimentation history
and the environmental conditions during evolutional stages of the Lena Delta. This
study shows that the data sets from sediment analyses (grain size distributions, heavy
mineral compositions, biogeochemical analyses) and geophysical measurements
(ground penetrating radar and high-resolution seismics) allow to outline the morpho-
sedimentary succession of the Lena Delta (Fig. 5-1). Emphasis is placed upon the

5 Summary _____________________________________________________________________________________
69
Figure 5-1:Morpho-sedimentary succession in the Lena Delta. The timescale to the left is according to
the orbitally based chronostratigraphy with conventional marine isotope stages after Martinson et al.
(1987).
benefits arising from an interdisciplinary approach to decipher fluvial and lake
environments. Conclusions and hypotheses relating to individual studies within this
report are presented in the previous chapters. Overall findings arising during this
investigation are as follows:
• The Lena Delta is a geomorphic composite of erosional remnants from different
Late Pleistocene-aged fluvial stages and actual, Late Holocene-aged to modern
deltaic sedimentation. The latter is found primarily in the eastern sector. The
western sector is dominated by exposed peaty-sandy and sandy uplands formed
during the Last Glacial sea-level lowstand. Thermokarst processes have profoundly
altered large areas of the Lena Delta, especially in its western sector.
• Paleo fluvial sands and intercalated root horizons dated at ~88-43 ka BP form the
minimum start of the sediment succession comprised by the present-day Lena Delta
area. Evidence from heavy mineral studies supports that they derive from the Lena
River. Outcrop, grain size and total organic carbon data show that the sedimentary
facies is comparable to modern floodplain environments. The fluvial sands represent
the lower section of the third terrace (0 to 14 m a.s.l.).
• Evidence for fluvial activity during the second half of the Weichselian (43 to 14 ka
BP) is restricted to the locally originated Ice Complex. According to grain size,
heavy mineral and total organic carbon studies this is a polygenetic and organic-rich
formation derived from and positioned at the foots of the north Yakutian mountains
(Chekanovsky and Kharaulakh Ridges). In the Lena Delta area they form the cover
of the third terrace (14 to 35 m a.s.l.) upon the lower sandy layers mentioned above.
The strong facial change between the Ice Complex and the lower sand is seen as a
strong indication for tectonic influence on sediment dispersal and strata formation in
the Lena Delta area. Lena River derived sediments are not preserved from this
period, but they are assumed in a main river channel flowing to a paleo Lena Delta
located further north.
• The phase of general environmental stability during Ice Complex formation was
followed by a new episode of incision and subsequent fluvial accumulation of the
Lena River between >14.5 to 10.9 ka BP (Fig. 5-2). It took place in a braided system
under conditions of high peak discharges and diminished vegetation. The thick

5 Summary _____________________________________________________________________________________
70
sandy sequences characteristic for this period represent the second terrace (10 to 30
m a.s.l.). In the beginning of the Holocene evidence for fluvial activity decreases in
the northwestern area of the Lena Delta. It is ultimately replaced by aeolian activity
and deep reaching thermokarst (<7 ka BP, uncalibrated radiocarbon years). This age
has been revealed from sediments of Lake Nikolay.
• Thermokarst processes explain the origin of the numerous lake basins located on the
second terrace including Lake Nikolay as the largest and deepest of them. They take
place in the abandoned fluvial pathways. The onset of the thermokarst coincides
with the regional Holocene climate optimum.
• The morphology of the thermokarst terrain could be identified with the aid of a
combination of high-resolution seismic data and GPR. It was possible to study
adjacent zones of limnic and cryo-terrigenic environments. Whereas processed high-
resolution seismic data is an effective means to display the water-saturated lake
basin fills, GPR profiles are especially applicable for frozen ground surrounding the
lake depressions. Seismic data, which are supported by mathematical modeling,
show that the single thermokarst basins have induced a thawing propagation in their
subground, which causes the sediment settling and the continuing depth increase of
the lakes.

5 Summary _____________________________________________________________________________________
71
Figure 5-2: Tectono-sedimentary evolution of the Lena Delta during Late Pleistocene and Holocene with
emphasis on the western sector. Ice Complex deposition along the foots of the highlands was followed by
lateral and vertical sedimentation of a braided Lena river run-off shortly before the termination of the
Pleistocene. Due to a relative tectonic uplift of the sector (<11 ka BP) and a subsequent river migration to
the east the sedimentation phase in the area ceased in the early Holocene. Thermokarst started to take
place in the abandoned fluvial pathways. The present stage of delta construction (first terrace) in the
eastern sector was initiated after termination of the glacio-eustatic sea level rise in the middle of the
Holocene. Ice Complex deposits (third terrace) and sandy sediments of the western sector (second terrace)
are progressively eroded preferentially along the fault lines by the river in inner-delta areas or due to
thermoerosion along the coastline (not illustrated in the figure).
• The fluvial succession continues with the first terrace sediments (0 to 10 m a.s.l.) of
Holocene age (<8.5 ka BP). The abandonment of the northwestern sector and the
shift of the main depo-center towards the northeastern/eastern sector are associated
with a tectonic downwarping along a N-S trending fracture zone separating both
areas. The rise of the Laptev Sea water level was established at its modern position
and the recent deltaic fill of the river channels was initiated. Soils are developed on
the higher sites of the alluvial plain of the first terrace. Thermo- and fluvial erosion
of second and third terrace sediments proceeds. Masses of dry sand can be deflated
from the shores when strong and persistent winds drive over the delta. The exact
ages of the borders between the first terrace and the modern floodplain levels could
not be determined. This is due to age inversions along the profiles, different ages
revealed for the same altitudes or same ages revealed for different altitudes.
Reworking of material may have caused these overlapping effects in connection
with the uncertainty of river arm migration on the delta plain.
• In contrast to a number of scientists believing that Pleistocene glaciers partly
covered the Lena Delta area (Grosswald, 1998, Grosswald et al., 1999) the analytic
data of the presented studies do not support this - neither sedimentary (for example
through the occurrence of tills or moraines) nor geophysical (for example through
the detection of massive underground ice derived from glaciers). In addition, direct
glacial traces in the area have not been found either. Glacial influence is also ruled
out for the time range covered by the period of Ice Complex formation (43-14 ka
BP). Various micro and macro fossils preserved therein document a great variety of

5 Summary _____________________________________________________________________________________
72
faunal and floral life as shown by Schirrmeister et al. (1999) excluding the nearness
of a northern ice shield.
A Selected Open Question
The periods of the major stages of sedimentation in the Lena Delta are not matching
the temporal boundaries of the Weichselian paleoclimate stages following the oxygen
isotope stages presented by Martinson et al. (1987) (Fig. 5-1). This illustrates the
importance of long-term (scale of 10,000s of years) regional climatic conditions in the
river system. The fluvial response seems generally stable in its tectonic framework and
is determined by the climate derivatives like the vegetation and river runoff in the
catchment. The overall climatic conditions are likely to have prevailed during most of
the Weichselian time (Meyer et al., in press). On- and offset of the locally generated Ice
Complex formation clearly do not match boundaries of the oxygen isotope stages,
either. Besides, the Ice Complex formation belonging to the widely spread ice-rich
permafrost deposits in the Yakutian North is regarded a long-term phenomena in the
alluvial lowlands. It may have started even in pre-Eemian time at ca. 200 ka BP
(Schirrmeister et al., submitted). Only parts of its evolution are exposed in the Lena
Delta area.
In contrast, short-term river dynamics seem to be reflected in the deposition of the
second terrace. They point to an instability phase governed by an intrinsic evolution in
the catchment. The apparently impulsive deposition of a high quantity of sediment
suggests a time of climatic transition according to Vandenberghe (1995). This may be
related to more global factors at the termination of Pleistocene time. But to obtain
answers to this question more studies are needed in the drainage basin of the Lena
River.
Of special interest for changes in the freshwater outflow to the Arctic Ocean is the
glaciation history in the mountains of NE Siberia. A decay of the mountain glaciation at
ca. 15 ka BP (uncalibrated radiocarbon years) is indicated by age data obtained from
glaciolacustrine deposits in the Lena River catchment (Spielhagen et al., in prep.). In
warming periods, when the glaciers retreated, favourable conditions for the formation of
dammed lakes may have existed. When breaching these lakes could have supplied
considerable masses of water to flow to the north. However, only a few glacial deposits

5 Summary _____________________________________________________________________________________
73
have been dated so far in the Verkhoyansk mountains south of the Lena Delta (Siegert,
pers. comm.).
Another explanation for rising water masses during that time could be the melting of
widely spread snow glaciers in the mountains and lowlands of Yakutia as proposed by
Galabala (1997). The proposed snow fields and inactive thin ice sheets would also
increase the water flow reacting sensitively by melting more rapidly during warming
periods.
To further understand the origin of the second terrace of the Lena Delta it is, therefore,
recommended to conduct studies in the Lena River catchment.

Appendix _____________________________________________________________________________________
74
APPENDIX - Material and Methods
Chirp Data Acquisition Chirp is a high-resolution, digital, frequency-modulated (FM) sub-bottom profiling
system. It is capable of obtaining water depth and cross-sectional profiles of the sea- or
lake-bed and the unconsolidated sediments and strata of the shallow subsurface. This
system can operate in shallow water depths (>2.5 m) and can acquire data in an industry
standard format (SEG-Y), which enables its straightforward transfer to off-line
processing packages. The Chirp source differs from conventional, single frequency,
sub-bottom profilers by having a repeatable, swept-frequency pulse. This results in the
data having a significantly improved signal-to-noise ratio (i.e. greater clarity), whilst the
wide range of frequencies within the single pulse limits the classic trade-off between
penetration and resolution. Chirp seismic reflection data supporting this thesis was
acquired utilizing a GeoAcoustics GeoChirp™ profiler, which comprises four ceramic
transducers, outputting a 32 ms 1.5-11.5 kHz frequency sweep in the so-called high-
resolution mode. The returning sweep of signals is processed in the Chirp Transceiver
over a period of 130 ms. The separate transmitting and receiving electronics preserves
the linearity of the acquisition system and allows simultaneous transmission and
reception (Schock et al., 1994). The system was mounted upon a surface-towed
catamaran, attached to which is an 6-element, single-channel 0.5-15 kHz hydrophone
streamer having an offset of 2 m behind the transducer array (Fig. A-1).
Figure A-1: Design of the Chirp catamaran used demonstrating transducer and hydrophone configuration
(graphics: courtesy by R. Quinn, modified).

Appendix _____________________________________________________________________________________
75
The catamaran was operated from an inflatable boat (3.6 m) and the output power was
400 W. For survey navigation a global positioning system (GPS) receiver (Trimble
Scoutmaster) was used. A scheme of the sub-bottom profiling system as deployed by
the AWI-Potsdam can be found elsewhere (Niessen et al., 1997).
The component algorithms of a post-processing flow applied to the correlated data
gained in the field are taken from Quinn (1997), Quinn et al. (1998) and Lenham
(2000). The reader is referred to these authors in general for a broader discussion on the
frequency content and application of the Chirp system.
The principal aim of the processing sequence as in general is to increase the overall
signal-to-noise ratio by the application of predictive filters and to enhance the lateral
coherency of the data. The effectiveness of these coherency enhancing methods benefits
from the repeatability of the Chirp´s source pulse, as the frequency of the signal content
remains relatively constant throughout the correlated profiles and is therefore readily
distinguishable from any arbitrary noise component (Schock and LeBlanc, 1990,
Verbeek and McGee, 1995).
GPR Data Acquisition Ground penetrating radar (GPR) operates in a similar fashion to seismo-acoustic
systems like the above described Chirp system, except, it emits electromagnetic energy
pulses instead of acoustic energy pulses. As the energy radiates out, a reflection is
created whenever the wave front reaches an interface between materials with different
electrical properties. The strength of the reflection is proportional to the magnitude of
the contrast between the dielectric constants of the two materials.
The RAMAC impulse radar system used for the presented studies was manufactured
by Mala GeoScience, Sweden (www.malag.se), consisting of (1) the antenna assembly
(which includes 25 or 100 MHz transmitter and receiver), (2) the control unit, which
generates timing signals for the transmitter and receiver, and processes the incoming
data from the receiver, and (3) a laptop computer connected to the control unit, for
entering the survey parameters, providing real-time data display and to record the data
to disk (Fig. A-2). The control unit and battery used to power the system are carried in a
backpack and the computer is slung off the backpack in front of the operator. With this
system, the two antennas are connected to the control unit by fibre optic cables in order
to eliminated electromagnetic interference. The field employment was ruled by
computer and the resulting reflections on-line visualized on the screen.

Appendix _____________________________________________________________________________________
76
Figure A-2: Schematic diagram of the RAMAC GPR equipment. The transmitter and the receiver
antennae are connected with the control unit by optical fibre. The scheme shows two horizons in the
subsurface reflecting parts of the energy.
The GPR data requires certain fundamental processing to highlight the main features
of the profiles. A combination of time-zero drift correction, remove of clipping, deWow
(remove of the low-frequent DC component by applying a high-pass and a running
average filter), a band-pass and mean filtering and automatic gain control yielded the
clearest images of the subsurface.
Sediment Analyses The following laboratory analyses have been conducted on the sediment samples: All
sediment data presented are available through the geoscientific database PANGAEA to
be found at http://www.pangaea.de.
Water Content In the beginning, sediment samples packed in polysterole boxes have been examined
for moisture. The gravimetric water/ice content was obtained as the difference between
the fresh-sample-weight and dry-sample-weight after samples had been deep-frozen (-
24° C) and freeze-dried.
Grain Size Distribution
Grain size distribution has been determined by laser particle sizing (LS200, Coulter
Corp.). This allows measurements in the range of 2 µm to 2 mm. Large plant remains

Appendix _____________________________________________________________________________________
77
were hold back in a sieve with a mesh size of 2 mm on beforehand. To remove organic
matter suspensions of
the samples were oxidized (3 %-H2O2) and treated with NH4OH (10 %) to diminish
surface tension. This procedure was repeated until the reaction ceased. Hereafter, the
samples have been given to the supply unit where grains are ultrasonicated, stirred and
centrifuged to be dispersed and transported. The supply unit is connected to the
measuring unit by tubes. Here, a laser beam produces a diffraction pattern as it passes
though the sample: the laser beam is deflected at various angles depending on the size
of the individual particle and - as already observed by Fraunhofer – intensity maxima
and minima occur at specific distances from the central light beam. The so-called
‘Fraunhofer law’ describes the physical relationships, and with the help of this law, and
at a known optical wavelength, the particle sizes can be calculated from the distance
between the maxima. For this purpose, the distribution of the angle and the
corresponding distribution of intensity of the diffracted light are detected with a special
high-resolution multi-element detector (Bumcke, 2000). A connected computer
calculates the particle size distribution according to granular size and mass from the
multitude of diffraction patterns created during one measurement. The results are
expressed in vol% and displayed in graphic or tabular form on the screen or via a
printer. A comparison with the pipette method, which is based on settling velocities
following Stoke´s Law, shows that absolute clay contents are lowered but contents in
the silt fraction are raised by the laser technique. The differences are attributed to
deviations from the sphere form and when particle density is heterogeneous (Konert and
Vandenberghe, 1997, Molinaroli et al., 2000).
Biogeochemical Analyses For measurements of total carbon (TC) and total organic carbon (TOC) an aliquot of
the sediment samples was pulverized (to <63 µm) and homogenized using an achate
sediment mill. The contents of TC were analyzed with a CHNS-932 determinator (LECO
Corp.). The elemental analyzer is designed to measure 2 mg of infill. Samples were
heated (1100° C) in oxygen in a Leco furnace and the evolved CO2 was evaluated by IR
spectroscopy.
TOC was measured with a Metalyt-CS-1000-S (ELTRA Corp.) in samples (100 mg)
that have been treated with HCl (10 %) at a temperature of 80° C to remove the
Appendix _____________________________________________________________________________________
78
carbonate. Samples were heated (1400° C) and carried in oxygen during analysis. The
TOC content is measured by IR spectroscopy.
International standard reference materials (GSD, 9, 10, 11) as well as double
measurements were used to check the external precision. The following standard
deviations have been accepted:
- TC and TOC: ± 5 % for content >1 wt %, ± 10 % for content <1 wt %.
Stable carbon isotope ratios 13C/12C of organic carbon were measured on pre-acidified
(200 µl of 10 % HCl, heated up to 60° C for 120 min.) samples by high-temperature
combustion (~1000° C) in a HERAEUS Elemental Analyzer coupled with a FINNIGAN
MAT Delta S mass spectrometer (Fry et al., 1992). The CO2 was cryogenically purified
in a vacuum line and measured for stable carbon composition with a multiport system.
The isotopic compositions are reported as δ−values (in ‰) relative to the international
V-PDB (Vienna PeeDee Belemnite) standard (Coplen, 1995). Results are expressed vs.
V-PDB in the form:
δ13C org. (‰) = [(13C/12Csample-13C/12Cstandard)/(13C/12Cstandard)] x 1000.
Accuracy of the analytical methods was checked by parallel analysis of international
standard reference material (PTFE-foil IAEA-CH-7: -31.77 ‰ V-PDB). The analytical
precision of the carbon isotope analyses is ± 0.2 ‰.
Heavy Mineral Analysis Sample preparation was performed according to standard procedures (Boenigk, 1983,
Mange and Maurer, 1991). First samples of 50 g were oxidized (3 %-H2O2) and
dispersed (conc. NH4OH). In order to obtain comparative datasets to previous studies
(Peregovich, 1999, Hoops, 2000) the fraction 63-125 µm was separated by dry-sieving
using an ATM Sonic Sifter. The heavy minerals were separated using sodium
metatungstate solution (Na6(H2W12O40)xH2O) with a density of 2.89 g/cm3. Samples of
approximately 1-3 g were dispersed in the solution and centrifuged for 20 minutes
(3000 rpm = rounds per minute). The heavy fraction was frozen in liquid nitrogen. The
light fraction was decanted and the heavy minerals rinsed on filters and dried. For
optical identification using a polarization microscope, the heavy fraction was mounted
with a “Quick-stick” immersion liquid (n = 1.68) of Cargille Meltmount™ on slides. On
average >200 grains were identified and counted. This allows an error of ≤ 5 % for
frequently occurring mineral species and guarantees that minor species are detected as
well (Mange and Maurer, 1991). The results are expressed in grain%.

Appendix _____________________________________________________________________________________
79
Radiocarbon Dating Mainly fine plant remains, picked under the Stereomicroscope, were used for
radiocarbon dating. Measurements were performed by Accelerator Mass Spectroscopy
(AMS) at the “Leibniz Labor für Altersbestimmung und Isotopenforschung” of the
University of Kiel. The 14C ages are given as conventional ages; i.e. the ages expressed
in years before present (yr BP) were calculated on the basis of the measured activity
using a 14C half-life of 5568 years according to Stuiver and Polach (1977). Radiocarbon
ages <20,000 yr BP have been calibrated into calendar years before present (cal. yr
B.P.) according to the intercept method (Stuiver et al., 1998).
Luminescence Dating
Luminescence dating procedure has been conducted to sandy sediments that were
either organic-free or presumably with ages beyond the range of the radiocarbon
method. Field work and lab measurements have been achieved under conduct of the
Saxon Academy of Sciences in Leipzig, Quaternary Geochronology Section, Bernhard-
von-Cotta-Str. 4, 09596 Freiberg. Methodology and results are documented in the
following article “Luminescence dating results of sediment sequences of the Lena
Delta” (see next page).

Appendix: Luminescence Dating _____________________________________________________________________________________
80
Luminescence dating results of sediment sequences of the Lena Delta∗
Summary The age correlation between the three main geomorphologic terraces in the Lena
Delta, especially that of the second sandy terrace (Arga Island) and the third terrace (Ice
Complex and underlying sands) is still being discussed. Knowledge about the age of the
Ice Complex and its underlying sands, and the Arga sands is necessary for
understanding the past and modern structure of the delta. Geochronometric data have
been acquired for three sediment sequences from the Lena Delta by luminescence dating
using the potassium feldspar IR-OSL technique. Additionally, 14C dates are available
for geochronological discussion. Typical sediments of the upper part of Arga Island as
found in the area of Lake Nikolay are of Late Pleistocene age (14.5 – 10.9 ka). Typical
third terrace sediments from two sequences located at the Olenyokskaya branch are
older. At the profile “Nagym“, sandy sequences were most probably deposited between
about 65 ka and 50 ka before present. The lower part of the sandy sequence at
“Kurungnakh Island” is possibly older than the sediments of the section at Nagym.
However, methodological difficulties in luminescence dating (insufficient bleaching at
the time of deposition) and younger 14C dates make the discussion of the results
difficult.
Zusammenfassung Die Altersbeziehungen zwischen den drei geomorphologischen Hauptterrassen des
Lena-Deltas sind noch ungeklärt und Gegenstand laufender Diskussionen. Ihre Kenntnis
ist jedoch nötig, um die Paläogeographie des Deltas zu rekonstruieren und seine heutige
Struktur zu verstehen. Mit Lumineszenz-Altersbestimmung wurden geochronometrische
Daten für drei Sedimentsequenzen des Lena-Deltas ermittelt. Dabei gelangte die
Methode der IR-OSL Datierung an Kalifeldspäten zur Anwendung. Für eine
geochronologische Diskussion der Untersuchungsergebnisse stehen desweiteren AMS 14C-Alter zur Verfügung. Typische Sedimente des oberen Teils der Arga Insel im
Gebiet des Nikolay-Sees (zweite Terrasse des Lena-Deltas) haben ein spätpleistozänes
Alter (14,5 bis 10,9 ka). Die sandigen Sedimente der Schichtsequenzen des Olenyok-
Arms (dritte Terrasse des Lena-Deltas) sind älter. Für den mittleren Teil des Profils
Nagym ist eine Ablagerung vor etwa 65 ka bis 50 ka wahrscheinlich. Der untere Teil
des Profils auf der Insel Kurungnakh ist möglicherweise älter als die Sedimente von
∗ Krbetschek, M.R., Gonser, G., Schwamborn, G., Polarforschung 70 (2000). Reprint kindly permitted.

Appendix: Luminescence Dating _____________________________________________________________________________________
81
Nagym. Methodische Schwierigkeiten der Lumineszenz-Datierung (unzureichende
Bleichung zum Zeitpunkt der Ablagerung) und jüngere 14C-Alter gestalten die
Diskussion der Ergebnisse jedoch schwierig.
Introduction Luminescence dating methods are able to determine the last light exposure of mineral
grains and therefore the time of deposition of a great variety of sediments. Basic
physical research and the development of new dating techniques led to their increasing
importance for Quaternary geochronology in the last decade. Mostly they are the only
methods to get reliable geochronometric information from aeolian or waterlaid
sediments in the age range from a few thousand to a few hundred thousand of years.
Luminescence dating methods are based on the characteristics of various minerals to
store natural ionising radiation by its transformation into luminescence capability.
Mineral grains are permanently exposed to such radiation owing to natural Uranium,
Thorium and Potassium-40 in the sediment and to cosmic rays. During transport and
deposition, a former luminescence signal is deleted by light exposure. Stored in the
dark, the luminescence signal increases and becomes a measure for the time of the
sediment’s deposition. Dating methods using optical stimulation of radiation-induced
stored luminescence replace the thermoluminescence (TL) methods of the 1980’s in
sediment dating to a large extent. The signal of Optically Stimulated Luminescence
(OSL) is reset to zero within a few minutes’ light exposure, also under dimmed
conditions. The Infrared Optically Stimulated Luminescence (IR-OSL, IRSL) method
(Hütt et al., 1988) based on feldspar minerals was applied in the present study. The
internationally acknowledged age range of the IR-OSL method is about 1 ka to 150 ka
(1 ka = 1000 a). Further basic physical research is necessary to get reliable results of
greater age. Recent overviews of OSL, sediment dating and dating procedures are given
by Aitken (1998), Prescott and Robertson (1997) and Wintle (1997).
The age correlation between the different terraces in the Lena Delta, especially that of
the second sandy terrace (Arga Island) and the third (Ice Complex) is still being
discussed (Are and Reimnitz, 2000). Knowledge about the age of the Ice Complex, the
underlying sands and the Arga sands is necessary for understanding the past and modern
structure of the delta. Originally, the second terrace was considered to be younger than
the Ice Complex remnants and to be overlapping them. Later it was proposed that the
sands composing the second terrace underlie the Ice Complex. No geochronometric data

Appendix: Luminescence Dating _____________________________________________________________________________________
82
for the sediments were available until now. The present study comprises luminescence
dating at three sediment sequences – one from Arga Island (adjacent to Lake Nikolay)
and two from the third terrace (Olenyokskaya Branch) (Fig. L-1). Additionally, seven
AMS radiocarbon dates are available, which have been measured at the Leibniz
Laboratory, University of Kiel.
Figure L-1: Location map of the Lena Delta (after Grigoriev, 1993) and the sediment sequences
investigated.
Luminescence Dating Samples have been taken from sandy fluvial sediments. At the Arga section, the
outcrop was cleaned by melting the sediment with lake water. A layer of about 1.5 m
was removed and the samples were taken using a metal hole corer, combined with an
accumulator drilling machine. During the drilling process, the frozen sediment material
was transferred into a light-tight black plastic tube inside the corer. The sediment
samples from the Olenyokskaya Branch area are of non-frozen material. About 0.5 – 1
m sediment was removed and light tight plastic tubes and a nylon hammer were used for
taking the samples. All containers have been sealed to prevent any loss of water.
The sample preparation was carried out under laboratory light conditions (dimmed red
light) and for additional light safety most of the time the material was handled in light-

Appendix: Luminescence Dating _____________________________________________________________________________________
83
tight containers. In-situ and saturation water content were analysed at first. After sieving
(100 – 160 µm), removing of organic substances and carbonates by H2O2 and HCl
treatment, respectively, mineral separation was carried out. Potassium feldspar
extraction was performed by a feldspar flotation procedure, followed by heavy liquid
density separation (sodium polytungstate) of the fraction <2.58 g cm-3. Standard HF,
HCl etching was applied to remove the alpha ray affected part of the grains. Between all
steps of separation, the material was washed in distilled water to a neutral pH-condition.
The palaeodose (DE) has been determined by the additive-dose method. Luminescence
measurements of the 410 nm feldspar IR-OSL emission (Krbetschek et al. 1997) using
an optical interference filter (peak-max. 410 nm, 20 nm width at half peak transmission)
have been carried out on a modified Riso-TL/OSL-DA 12 reader, running the IR
stimulation at 40 mW cm-2. 48 sample aliquots of about 4 mg (volume normalisation)
were used. Natural sample aliquots were IR-OSL normalised by pulse measurements
(0.1 s), irradiated (90Sr/ 90Y ß-source, dose rate 0.92 Gy/min, 6-8 additive dose values)
and measured after storage for at least 1 week at room temperature and preheat for 48 h
at 140 °C. After a 0.1 s pulse measurement (short shine) the IR-OSL signal of the
aliquots was detected at 100 s stimulation duration (shine down).
Data evaluation is illustrated in Fig. L-2a-c. A single exponential saturation dose
characteristic growth curve fit was used to calculate the palaeodose. The IR-OSL
measurements (Fig. L-2a) were normalised by the natural short shine signal. After “late
light” (80-100 s) background subtraction (Aitken and Xie, 1992) the shine down plateau
was calculated (Fig. L-2b). The growth curve fit was repeated to calculate the final
palaeodose and error determination using the integral values of the plateau (Fig. L-2c).
A fading test has been carried out for each sample (>2 month storage at RT). The U, Th
and 40K concentration of the sediment samples have been determined by low level high
resolution gamma spectrometry. No significant radioactive disequilibrium was
observed. The internal dose rate of 40K was calculated based on the potassium
concentration of the feldspar grains determined with a recently developed spectral
radiophosphorescence technique (Dütsch and Krbetschek, 1997). Cosmic dose rate
estimation is based on Prescott and Hutton (1988). The age and error calculations have
been done using the computer-software of Grün (1992), based on the procedure
described in Aitken (1985). The error includes systematic and random errors which
arise from: irradiation source calibration, possibly changing water content in the past,

Appendix: Luminescence Dating _____________________________________________________________________________________
84
errors in radionuclide-, cosmic dose rate-, feldspar internal dose rate- and palaeodose
determination.
Figure L-2: Sample ARG 5: a) IR-OSL measurements (mean shine down curves: natural signal; additive
dose 20, 40, 60, 100, 200, 320 Gy), b) DE vs. stimulation time (shine down plateau), c) IR-OSL dose
characteristic (plateau-integral).
Dating Results and Discussion The results of different analytical procedures are listed together with the final age
calculations in Table L-1. The radioisotope concentration of Uranium and Thorium is
slightly higher in most of the Olenyokskaya sediment samples compared to those from
Arga. The age data from the Arga sediment profile have relative errors in the range of
about ±10 % whereas those of the Olenyokskaya sequences are significantly higher and
reach more than ±40 % for some samples. This is caused by a generally high error in
palaeodose determination due to a high scatter of IR-OSL measurement results. In the
case of the samples OLE 4, 5, 9 the calculation of the palaeodose, based on such data,
was not possible. For OLE 5, this is additionally caused by an insufficient number of
sample aliquots for IR-OSL measurement due to low potassium feldspar concentration.

Appendix: Luminescence Dating _____________________________________________________________________________________
85
Sample Radioisotope Concentration Water Dnat DE Age U / ppm Th / ppm K / % % mGy a-1 Gy ka
ARG 1 1.1±0.09 4.9±0.25 3.3±0.28 23±2 3.74±0.11 50±2.6 13.4±1.1 ARG 2 1.0±0.05 3.8±0.25 2.4±0.26 20±5 * * * ARG 3 0.9±0.06 3.4±0.25 2.4±0.19 22±2 3.04±0.17 40±3.9 13.3±1.5 ARG 4 1.1±0.09 4.4±0.27 2.7±0.16 25±5 3.24±0.22 39±2.4 12.0±1.1 ARG 5 1.1±0.05 3.7±0.20 2.4±0.18 18±5 3.23±0.23 42±2.0 13.1±1.1 OLE 1 1.4±0.09 5.9±0.96 2.6±0.14 10±5 3.85±0.27 219±30 57 ±9 OLE 2 1.5±0.08 6.6±1.53 2.7±0.14 24±5 3.37±0.26 176±31 52 ±10 OLE 3 1.6±0.25 5.9±0.32 2.5±0.17 31±5 3.00±0.25 147±64 49 ±22 OLE 4 1.6±0.07 5.9±0.67 2.5±0.19 18±5 3.44±0.27 ** ** OLE 5 1.1±0.06 4.6±0.30 2.6±0.17 25±5 3.14±0.25 ** ** OLE 6 1.0±0.09 4.3±0.20 2.4±0.13 18±5 3.20±0.24 177±25 55 ±9 OLE 7 1.7±0.11 7.1±0.27 2.2±0.13 35±5 2.72±0.22 238±32 88 ±14 OLE 8 0.9±0.06 3.5±0.22 2.0±0.12 28±5 2.54±0.21 180±100 * OLE 9 1.5±0.07 6.1±0.27 2.1±0.15 32±5 2.67±0.23 ** **
OLE 10 1.5±0.07 6.4±0.30 2.2±0.14 16±5 3.30±0.24 215±22 65 ±8 * not determined **determination not possible Dint = 0.78 ± 0.08 mGy/a (ARG1, OLE1-10) ; 0.76± 0.08 mGy/a (ARG 3-5) Table L-1: Analytical results of IR-OSL dating.
The natural IR-OSL of the sample aliquots (short shine normalisation values)
characterises the samples’ non-homogeneity to some extent. Although random errors of
the aliquot-preparation and that of the measurement instrumentation are included, such
measurements can uncover different effects caused by changing material composition.
Large data scatter may occur, if the luminescence behaviour of the grains is highly
variable (e.g. the signal is emitted by a few bright shining grains while most show weak
luminescence dose response) or the feldspar fraction is a mixture of grains with large
differences of the bleaching degree at the time of deposition. Insufficient zeroing of the
luminescence signal prior to sediment deposition is known to be a main source of error
in luminescence dating of some types of sediment. In the case of sediments from polar
regions, deposited in a river delta, this is of particular importance. Both, the seasonal
lack or reduction of sunlight and the ice-melting period may cause insufficient
bleaching of the IR-OSL signal. The latter leads to sediment reworking, high sediment
load of the water and transport over short distances – factors that drastically reduce the
duration or intensity of sunlight exposure.
The natural IR-OSL normalisation values of the samples are shown in Figure L-3. It is
obvious that the samples from the Olenyokskaya sequences are characterised by high
scatter. Additionally a modern sample (NP 7) from the central delta region was
investigated. It has the highest scatter of the normalisation measurements (Fig. L-3) and
no reliable dose (which should be zero) could be obtained. The samples from the

Appendix: Luminescence Dating _____________________________________________________________________________________
86
Arga/Lake Nikolay sediment profile seem to be less affected by insufficient bleaching.
The reason may be a longer transport distance.
Figure L-3: Relative standard deviation of the natural normalisation measurements (0.1 s short shine)
calculated for 24 aliquots each, except the modern sediment NP7, where the value is based on the
measurement of 12 aliquots.
Geochronometry / Geochronology A scheme of the sediment sequences with the luminescence dating results is given in
Figure L-4. AMS radiocarbon dates are added for further discussion (Table L-2). The
results of IR-OSL age determination show a very narrow age range in which the
sediment sequence of Arga / Lake Nikolay must have been formed. Taking into account
the errors of the data, its formation can be constrained to 14.5 to 10.9 ka before present.
Taking into account the error ranges, the data are consistent and there should not be a
basic influence of insufficient bleaching on the age data from Arga. It seems likely that
the high accumulation rate implied by the overlapping ranges of the luminescence
datings is associated with a fluvial environment under upper flow regime. The deposits
are derived most probably from the periglacial Lena River, which flowed on the
exposed Laptev shelf at that time (Schwamborn et al., in press).
As mentioned above, for the dating results from the Olenyokskaya profiles high errors
are typical and most probably caused by insufficient bleaching at the time of deposition.
Therefore, limitations are set for the geochronological interpretation of the data. The
data from the Nagym sequence (OLE 1,2,3,6) span a range from 49 ka to 57 ka. No

Appendix: Luminescence Dating _____________________________________________________________________________________
87
further time resolution is possible because the errors overlap. Deposition between about
65 to 40 ka before present is most probable, based on the IR-OSL dating results.
However, the 14C data (root horizons) of the lower part may narrow this range.
Figure L-4: Scheme of the sediment sequences investigated, compiled with the IR-OSL and 14C age data.
It seems likely, that the deposition took place between about 65 ka and 50 ka.
Predominantly wavy bedding interrupted by root horizons indicate a fluvial
sedimentation under shallow water conditions.
sample depth (m a.s.l.) lab. no. measured age (14C yr BP) Nagym 11.0 (base of Ice Complex) KIA 9899 42,930 +3100/-2230 Nagym 5.1 KIA 6753 > 56,790 Nagym 3.1 KIA 6754 > 54,520 Kurungnakh 14.0 (base of Ice Complex) KIA 6755 42,910 +840/-760 Kurungnakh 12.5 KIA 6756 37,230 +510/-480 Kurungnakh 7.7 KIA 6757 39,400 +510/-480 Kurungnakh 4.0 KIA 6758 49,440 +1760/-1440
(a.s.l. = above sea level; i.e. above Lena River water level, 08.-10.08.98) Table L-2: AMS 14C ages of third terrace deposits.

Appendix: Luminescence Dating _____________________________________________________________________________________
88
The OSL data from the sequence at Kurungnakh Island (OLE 7,10) are between 88 ka
and 65 ka. A deposition of the lower part of the sequence between about 100 ka and 60
ka is likely. This is not in accordance with the 14C dates, which are of younger age.
Thus, the age determinations from both methods are suitable only to narrow the
sedimentation time to Early to Middle Weichselian time. The OLE-samples may be
influenced by insufficient bleaching. This can cause age overestimation. However, there
is a chronological order. It seems, that age overestimation due to partial bleaching does
not describe the discrepancy between the IR-OSL and 14C ages sufficiently. The
measured AMS ages are placed at the limits of the age range covered by the 14C
method. Contamination by young allochthonous carbon is the biggest problem in
radiocarbon dating of old samples. Whereas 1% contamination with recent carbon
yields a value of age underestimation of 200 a for a 10 ka old sample, it is 7 ka (!) for a
40 ka old sample (Geyh and Schleicher, 1990). Because even small contaminations
influence such old data drastically, radiocarbon ages of more than about 30 ka should
thus be viewed as minimum ages (Geyh and Schleicher, 1990). The small sample
amount used in AMS dating may intensify this problem. According to the IR-OSL data,
therefore, the lower part of the Kurungnakh Island profile is possibly older than the
Nagym sediment sequence.
Conclusion Geochronometric data have been acquired for three sediment sequences from the Lena
Delta by luminescence dating using the potassium feldspar IR-OSL technique.
Furthermore, 14C dates are available for geochronological discussion. The sediments of
the upper part of Arga Island (second terrace), in the area of Lake Nikolay, are of Late
Pleistocene age (14.5 – 10.9 ka). The sediments from sequences at the Olenyokskaya
branch (third terrace) are older. At the profile Nagym, the middle part was most
probably deposited between about 65 ka and 50 ka before present. The lower part of the
sequence at Kurungnakh Island is possibly older than the sediments of the section at
Nagym, but methodological difficulties in luminescence dating (insufficient bleaching
at the time of deposition) and younger 14C dates make the discussion of the results
difficult.

References _____________________________________________________________________________________
89
References Abbott, M.B., Finney, B.P., Edwards, M.E. and Kelts, K.R. 2000. Lake-level
Reconstuctions and Paleohydrology of Birch Lake, Central Alaska, based on Seismic Reflection Profiles and Core Transects. Quaternary Research, 53, 154-166.
Aitken, M.J. 1985. Thermoluminescence Dating. Academic Press, London 1985, 359 p. Aitken, M.J. 1998. An Introduction to Optical Dating. Oxford Science Publications,
Oxford 1998, 267 p. Aitken, M.J. and Xie, J. 1992. Optical dating using infrared diodes: young samples.
Quaternary Science Reviews, 11, 147-152. Alabyan, A.M., Chalov, R.S., Korotaev, V.N., Sidorchuk, A.U. and Zaytsev, A.A. 1995.
Natural and Technologic water and sediment supply to the Laptev Sea. In: Kassens, H., Piepenburg, D., Thiede, J., Timokhov, L., Hubberten, H.-W. and Priamikov, S. eds. Reports on the Polar Research, 75, 265-271.
Alekseev, M.N. 1997. Paleogeography and geochronology in the Russian Eastern Arctic during the second half of the Quaternary. Quaternary International, 41/42, 11-15.
Allen, J.R.L. 1970. Physical Processes of Sedimentation. Elsevier, New York, 248 p. Andreev, A.A. and Klimanov, V.A. 2000. Quantitative Holocene climatic
reconstruction from Arctic Russia. Journal of Paleolimnology, 24,1, 81-91. Andreev, A.A., Klimanov, V.A. and Sulerzhitsky, L.D. 2001. Vegetation and climate
history of the Yana River lowland, Russia, during the last 6400 years. Quaternary Science Reviews, 20, 1-3, 259-266.
Andreev, A.A., Schirrmeister, L., Siegert, C., Bobrov, A.A., Demske, D. Seiffert, M. and Hubberten, H.-W. in press. Paleoenvironmental changes in Northeastern Siberia during the Late Pleistocene - evidences from pollen records of the Bykovsky Peninsula. Polarforschung.
Annan, A.P. and Davis, J.L. 1976. Impulse radar sounding in permafrost. Radio Science, 11, 383-394.
Arcone, S.A. 1995. Numerical studies of the radiation patterns of resistevely loaded dipoles. Journal of Applied Geophysics, 33, 39-52.
Are, F. 1996. Dynamics of the littoral zone of Arctic Seas state of the art and goals. Polarforschung, 64, 123-131.
Are, F. 1999. The role of the coastline for sedimentation in the Laptev Sea. In: Kassens, H., Bauch, H., Dmitrenko, I., Eicken, H., Hubberten, H.-W., Melles, M., Thiede, J. and Timokhov, L. eds. Land-Ocean systems in the Siberian Arctic: dynamics and history, Springer, Berlin, 287-299.
Are, F.E. and Reimnitz, E. 2000. An overview of the Lena River Delta setting: geology, tectonics, geomorphology, and hydrology. Journal of Coastal Research 16, 4, 1083-1093.
Ariztegui, D. and McKenzie, J.A. 1995. Temperature-dependent carbon-isotope fractionation of organic matter: a potential paleoclimatic indicator in Holocene lacustrine sequences. In: Frenzel, B. ed. Problems of stable isotopes in tree-rings, lake sediments and peat-bogs as climatic evidence for the Holocene, Stuttgart, Gustav Fischer Verlag, 17-28.
Ashik, I., Dvorkin, Y. and Vanda, Y. 1999. Extreme Oscillations of the Sea Level in the Laptev Sea. In: Kassens, H., Bauch, H., Dmitrenko, I., Eicken, H., Hubberten, H.-W., Melles, M., Thiede, J. and Timokhov, L. eds. Land-Ocean systems in the Siberian Arctic: dynamics and history, Springer, Berlin, 37-41.
Avetisov, G.P. 1999. Geodynamics of the zone of continental continuation of Mid-Arctic earthquakes belt Laptev Sea. Physics of the Earth and Planetary Interiors, 114, 59-70.

References _____________________________________________________________________________________
90
Avetisov, G.P. 2000. Once again on the earthquakes of the Laptev Sea, Geological-Geophysical Features of the Lithosphere of the Arctic Region, St. Petersburg, Ministry of Natural Resources of Russian Federation, All-Russia Research Institute for Geology and Mineral Resources of the World Ocean, 3, 104-114 in Russian.
Bano, M., Marquis, G., Niviere, B., Maurin, J.C. and Cushing, M. 2000. Investigating alluvial and tectonic features with ground-penetrating radar and analyzing diffractions patterns. Journal of Applied Geophysics, 43, 33–41.
Bauch, H., Kassens, H., Erlenkeuser, H., Grootes, P.M., Dehn, J., Peregovich, B. and Thiede, J. 1999. Depositional environment of the Laptev Sea Arctic Siberia during the Holocene. Boreas, 28, 194-204.
Behrends, M., Hoops, E. and Peregovich, B. 1999. Distribution patterns of heavy minerals in Siberian Rivers, the Laptev Sea and the eastern Arctic Ocean. In: Kassens, H., Bauch, H., Dmitrenko, I., Eicken, H., Hubberten, H.-W., Melles, M., Thiede, J. and Timokhov, L. eds. Land-Ocean systems in the Siberian Arctic: dynamics and history, Springer, Berlin, 265-286.
Berglund, B.E. and Ralska-Jasiveczowa, M. 1986. Pollen analysis and pollen diagrams. In: Berglund, B.E. ed., Handbook of Holocene paleoecology and paleohydrology, New York, Interscience, 455-484.
Boenigk, W. 1983. Schwermineralanalyse. Ferdinand Enke Publishers, Stuttgart, 158 p. Boucsein, B., Fahl, K. and Stein, R. 2000. Variability of river discharge and Atlantic
water inflow at the Laptev Sea continental margin during the past 15,000 years: implications from maceral and biomarker records. International Journal of Earth Sciences, 89, 578-591.
Bumcke, G. 2000. Particle Size Analysis in the Laboratory - Technology and Equipment, 23 p. 13-23.
Chappell, J., Omura, A., Esat, T., McCulloch, M., Pandolfi, J., Ota, Y. and Pillans, B. 1996. Reconciliation of late Quaternary sea levels derived from coral terraces at Huaon Peninsula with deep sea oxygen istope records. Earth and Planetary Science Letters, 141, 227-236.
Coplen, T.B. 1995. Reporting of stable carbon, hydrogen, and oxygen isotopic abundances. Reference and intercomparison materials for stable isotopes of light elements, IAEA-TECDOC-825, Vienna, 31-34.
Davis, J.L. and Annan, A.P. 1989. Ground-Penetrating-Radar for High-Resolution Mapping of Soil and Rock Stratigraphy. Geophysical Prospecting, 37, 531-551.
Delaney, A.J., Sellmann, P.V. and Arcone, S.A. 1992. Sub-bottom Profiling: A comparison of Short-Pulse Radar and Acoustic Data. Proc. of the Fourth International Conference on Ground Penetrating Radar, Rovaniemi Finland, Geological Survey of Finland, Special Paper 16, 149-157.
Dethleff, D., Rachold, V., Tintelnot, M. and Antonow, M. 2000. Sea-ice transport of riverine sediments from the Laptev Sea to the Fram strait based on clay mineral studies. International Journal of Earth Science, 89, 3, 496-502.
Dill, H.G. 1998. A review of heavy minerals in clastic sediments with case studies from the alluvial-fan through the nearshore-marine environments. Earth-Science Reviews, 45, 103-132.
Doolittle, J.A., Hardisky, M.A. and Gross, M.F. 1990. A Ground-Penetrating Radar study of active layer thicknesses in areas of moist sedge and wet sedge tundra near Bethel, Alaska, U.S.A. Arctic and Alpine Research, 22 2, 175-182.
Drachev, S.S., Savostin, L.A., Groshev, V.G. and Bruni, I.E. 1998. Structure and Geology of the Continental Shelf of the Laptev Sea, Eastern Russian Arctic. Tectonophysics, 298, 357-393.

References _____________________________________________________________________________________
91
Dütsch, C. and Krbetschek, M. R. 1997. New methods for a better K-40 internal dose rate determination. Radiation Measurements, 27, 377-382.
Engelhardt, W. v., Füchtbauer, H. and Müller, G. 1973. Die Bildung von Sedimenten und Sedimentgesteinen. Schweizerbart´sche Verlagsbuchhandlung, Stuttgart, 372 p. 56-154.
Ershov, E.D. ed. 1984. Thermalphysic properties of the rocks. Moscow, MSU, 204 p. in Russian.
Eyles, N. and Mullins, H.T. 1997. Seismic-stratigraphy of Shuswap Lake, British Columbia, Canada. Sedimentary Geology, 109, 283-303.
Eyles, N., Boyce, J.I., Halfman, J.D. and Koseoglu, B. 2000. Seismic stratigraphy of Waterton Lake, a sediment-starved glaciated basin in the Rocky Mountains of Alberta, Canada and Montana, USA. Sedimentary Geology, 130, 288-311.
Fairbanks, R.G. 1989. A 17,000 year glacio-eustatic sea-level record: influence of glacial melting on the Younger Dryas event and deep-ocean circulation. Nature, 342, 637-642.
Fisk, H.N. and McFarlan, E.J. 1955. Late Quaternary Deltaic Deposits of the Mississippi River Local Sedimentation and Basin Tectonics. In: Poldervaart, A. ed. Crust of the Earth, Vol. Special Paper 62, Geol. Soc. America, 279-302.
Føgri, K. and Iversen, J. 1989. Textbook of Pollen Analysis 4th edition revised by K. Føgri, P.E. Kaland and K. Krzyinski. Chichester, Wiley, 200 p.
Franke, D., Krüger, F. and Klinge, K. 2000. Tectonics of the Laptev Sea - Moma ´Rift´ Region: Investigation with Seismologic Broadband Data. Journal of Seismology, 4, 99-116.
French, M. and Heginbottom, J.A. 1983. Guidebook to permafrost and related features of the Northern Yukon Territory and Mackenzie Delta, Canada. in Fourth International Conference on Permafrost and International Geographical Union, Commission on the Significance of Periglacial Phenomena, University of Alaska, Fairbanks, Alaska, U.S.A., 18-21.
French, H.M. 1996. The Periglacial Environment. Longman, London, 121-124. Fry, B., Brand, W., Mersch, F.J., Tholke, K. and Garritt, R. 1992. Automated analysis
system for coupled δ13C and δ15N measurements. Analytical Chemistry, 64, 288-291.
Füchtbauer, H. 1988. Sedimente und Sedimentgesteine. Schweizerbart´sche Verlags-buchhandlung, Stuttgart, 1141 p. 116-139, 244-249.
Fukuda, M. 1994. Occurrence of Ice Complex Edoma in Lena River Delta Region and Big Lhyakhovsky Island, High Arctic Eastern Siberia. Proc. of the Second Symposium on the Joint Siberian Permafrost Studies between Japan and Russia in 1993, Hokkaido, 1-9.
Galabala, R.O. 1987. New data on the Lena Delta structure. Quaternary of North-East USSR, Magadan, 152-172 in Russian.
Galabala, R.O. 1997. Perelekti and the initiation of glaciation in Siberia. Quaternary International 41/42, 152-171.
Galloway, W.E. 1975. Process framework for describing the morphologic and stratigraphic evolution of deltaic depositional system, In: Broussard, M.L.E. ed. Deltas: Models for Exploration, Geological Society, Houston TX, 87–98.
Gavrilov, A.V., Garagulya, L.S., Ershov, E.D. and Kondratyeva, K.A. 1986. Map of Regions showing conditions for frozen and unfrozen ground, 1:25,000,000, ISBN: 0-9685013-0-3.
Gavrilov, A.V., Tumskoy, V.E. and Romanovskii, N.N. 2000. Mean annual ground temperature oscillation in the Laptev Sea region during the last 400 kyr: method of

References _____________________________________________________________________________________
92
paleotemperature curves compilation for mathematical simulation of terrestrial and offshore permafrost.- Rhythms of natural processes in the Earth cryosphere, Abstracts: 265-266 in Russian.
Geyh, M. and Schleicher, H. 1990. Absolute Age Determination - Physical and Chemical Dating Methods and their Application. Berlin, Springer, 503 p.
Goodbred, S.L. and Kuehl, S.A. 2000. The significance of large sedimet supply, active tectonism, and eustasy on margin sequence development: Late Quaternary stratigraphy and evolution of the Ganges-Brahmaputra delta. Sedimentary Geology, 133, 227-248.
Gordeev, V.V. and Sidorov, I.S. 1993. Concentrations of major elements and their outflow into the Laptev Sea by the Lena River. Marine Chemistry, 43, 33-45.
Gordeev, V.V. and Shevchenko, V.P. 1995. Chemical Composition of suspended sediments in the Lena River and its mixing zone. Russian-German Cooperation, Laptev Sea System. Reports on Polar Research, 176, 154-169.
Grigoriev, M.N. 1993. Cryomorphogenesis of the Lena River mouth area. SB RAS, Yakutsk, 176 p. in Russian.
Grigoriev, M.N., Imaev, V.S., Imaeva, L.P., Kozmin, B.M., Kunitsky, V.V., Larionov, A.G., Mikulenko, K.I., Skryabin, R.M. and Timirshin, K.V. 1996. Geology, seismicity, and cryogenic processes in the Arctic areas of western Yakutia. Yakutian Scientific Center SD RAS, Yakutsk, 84 p. in Russian.
Grigoriev, M.N., Rachold, V. and Schwamborn, G. 2000. Problem of genesis and formation of the lakes Arga-Muora-Sise Island, Northwest sector of the Lena Delta. In: Proc. of the International Conference "Lakes of Cold Regions", 66-81 in Russian.
Grigoriev, N.F. 1960. The temperature of permafrost in the Lena delta basin – deposit conditions and properties of the permafrost in Yakutia. Yakutsk, 2, 97-101 in Russian.
Grinenko, O.V. 1998. Vserossiyskoe soveshchanie "Glavnye itogi v izuchenii chetvertichnogo perioda i osnovnye napravleniya issledovaniya v XXI veke". Tezisy dokladov., Sankt Petersburg, 155-156 in Russian.
Grosswald, M.G. 1998. Late-Weichselian Ice Sheets in Arctic and Pacific Sibiria. Quaternary International, 45/46, 3-18.
Grosswald, M.G. and Hughes, T.J. 1999. The Case For an Ice Shelf in the Pleistocene Arctic Ocean. Polar Geography, 23/1, 23-54.
Grosswald, M.G., Hughes, T.J. and Lasca, N.P. 1999. Oriented lake-and-ridge assemblages of the Arctic coastal plains: glacial landforms modified by thermokarst and solifluction. Polar Record, 35, 215-230.
Grün, R. 1992. „Age“ application software. Riso National Institute, Riso/Denmark 1992.
Gundelwein, A. 1998. Eigenschaften und Umsetzung organischer Substanz in nordsibirischen Permafrostböden. Hamburger Bodenkundliche Arbeiten, 39, 162 p.
Hinkel, K.M., Doolittle, J.A., Bockheim, J.G., Nelson, F.E., Paetzold, R., Kimble, J.M. and Travis, R. 2001. Detection of Subsurface Permafrost Features with Ground-Penetrating Radar, Barrow, Alaska. Permafrost and Periglacial Processes, 12, 179-190.
Hinz, K., Block, M., Cramer, B., Franke, D., Kos´ko, M., Meyer, H., Neben, S., Reichert C. and Roeser, H.-A. 1999. Die Laptev-See - russ. Arktis: neue geowissenschaftliche Erkenntnisse über den geologischen Bau und die Entwicklung des riesigen Schelfes der Laptev-See. Geo-Berlin 1998, Gemeinsame Jahrestagung von DGG, DMG, GGW und Pal. Ges., Berlin, p. 133.

References _____________________________________________________________________________________
93
Holmes, M.L. and Creager, J.S. 1974. Holocene History of the Laptev Continental Shelf. In: Herman, Y. ed., Marine Geology and Oceanography, Berlin, Springer Verlag, 211-229.
Hoops, E. 2000. Schwermineralverteilungen in ostsibirischen Flusssedimenten. Unpublished PhD thesis, University of Potsdam.
Hubberten, H.-W. and Romanovski N.N. in press. Terrestrial and offshore permafrost evolution of the Laptev Sea region during the last Pleistocene-Holocene glacial-eustatic cycle. In: Paepe, R. ed. Permafrost Response on Economic Development, Environmental Security and Natural Resources Potential, Proc. NATO-ARW, Novosibirsk, 1998, Kluwer, Dordrecht.
Hütt, G., Jaek, I. and Tchonka, J. 1988. Optical Dating: K-feldspar optical response stimulation spectra. Quaternary Science Reviews, 7, 381-385.
Huisink, M. 2000. Changing river styles in response to Weichselian climate changes in the Vecht valley, eastern Netherlands. Sedimentary Geology, 133, 115-134.
Huissteden, van J.K., Vandenberghe, J., Hammen, v.d.T. and Laan, W. 2000. Fluvial and aeolian interaction under permafrost conditions: Weichselian Late Pleniglacial, Twente, eastern Netherlands. Catena, 40, 307-321.
Ivanov, O.A. 1970. The main stages of evolution of North-East USSR subarctic plains during the Cenozoic. Severnyi Ledovityi okean i ego poberezye v kaynozoye. Gidrometeozidat, Leningrad, 474-479 in Russian.
Ivanov, O.A. 1972. The stratigraphy and correlation of Neogene and Quaternary sediments on subarctic plains of East Yakutia. Problemy izucheniya chetvertichnogo perioda. Nauka, Moscow, 202-211 in Russian.
Ivanov, V.V. and Piskun, A.A. 1995. Distribution of river water and suspended sediments in the river deltas of the Laptev Sea. Reports on the Polar Research, 75, 142-153.
Jenner, K.A. and Hill, P.R. 1998. Recent, arctic deltaic sedimentation: Olivier Islands, Mackenzie Delta, North-west Territories, Canada, Sedimentology, 45, 987-1004.
Jol, H.M. 1995. Ground penetrating radar antennae frequencies and transmitter powers compared for penetration depth, resolution and reflection continuity. Geophysical Prospecting, 43, 693-709.
Judge, A.S., Tucker, C.M., Pilon, J.A. and Moorman, B.J. 1991. Remote Sensing of Permafrost by Ground-Penetrating Radar at Two Airports in Arctic Canada. Arctic, 44, 1, 40-48.
Katasonov, E.M., Ivanov, M.S., Siegert, C., Katasonova, E.G. and Pudov, G.G. 1979. Structure and absolute geochronology of Alas deposits in Central Yakutia. Novosibirsk, Nauka, 96 p. in Russian.
Katasonova, Y.G. and Ziegert, H.G. 1982. Slope sediments in river valleys of Central Yakutia. In: Geology of the Cenozoic of Yakutia, Yakutsk, SO AN SSSR, 110-121 in Russian.
Kearey, P. and Brooks, M. 1984. An Introduction to Geophysical Exploration. Blackwell Scientific Publications, 296 p. 38-39.
Kleiber, H.P. and Niessen, F. 1999. Late Pleistocene Paleoriver Channels on the Laptev Sea Shelf - Implications from Sub-Bottom Profiling. In: Kassens, H., Bauch, H., Dmitrenko, I., Eicken, H., Hubberten, H.-W., Melles, M., Thiede, J. and Timokhov, L. eds. Land-Ocean systems in the Siberian Arctic: dynamics and history, Springer, Berlin, 657-665.
Kleiber, H.P. and Niessen, F. 2000. Variations of continental discharge pattern in space and time: Implications from the Laptev Sea continental margin, Arctic Siberia. International Journal of Earth Sciences, 89, 605-616.

References _____________________________________________________________________________________
94
Konert, M. and Vandenberghe, J. 1997. Comparison of laser grain size analysis with pipette and sieve analysis: a solution for the underestimation of the clay fraction. Sedimentology, 44, 523-535.
Korotaev, V.N. 1986. Geomorphology of river deltas on the Arctic coast of Siberia. Polar Geography and Geology, 10, 139-147.
Krbetschek, M.R., Götze, J., Dietrich, A. and Trautmann, T. 1997. Spectral information from minerals relevant for luminescence dating. In: Wintle, A.G. ed. Review on luminescence and electron spin resonance dating and allied research. Radiation Measurements, 27, 695-748.
Krbetschek, M.R., Gonser, G. and Schwamborn, G. in press. Luminescence dating results on sediment sequences of the Lena Delta. Polarforschung.
Kunitsky, V.V. 1989. Cryolithology in the Lena River Mouth. Permafrost Institute Press, Yakutsk, Russia, 162 p. in Russian.
Kunitsky, V.V., Schirrmeister, L., Grosse, G. and Kienast, F. in press. Snow patches in nival landscapes and their role for the Ice Complex formation in the Laptev Sea lowlands. Polarforschung.
Kuptsov, V.M. and Lisitsin, A.P. 1996. Radiocarbon of Quaternary along shore and bottom deposits of the Lena and the Laptev Sea sediments. Marine Chemistry, 53, 301-311.
Lastochkin, A.N. 1982. Methodi Marskaga Geomorfologitcheskaga Kartografirowaniya. Leningrad, Nedra, Leningradskoye Otdelenye in Russian.
Lenham, J.W. 2000. High Resolution Seismology, Archaeology and Submerged Landscapes - an interdisciplinary Study, University of Southampton, 226 p.
Liedtke, H. 1981. Die Nordischen Vereisungen in Mitteleuropa. Forschungen zur deutschen Landeskunde 204, Zentralausschuß für dt. Landeskunde, Trier, 307 p.
Lungershausen, G.F. 1967. Neotectonics of the Siberian platform and surrounding mountains. Tektonicheskie dvizheniya i noveishie struktury zemnoi kory, Nedra, Moscow, 410-417 in Russian.
MacDonald, G.M., Velichko, A.A., Kremenetski, C.V., Borisova, O., Goleva, A.A., Andreev, A.A., Cwynar, L.C., Riding, R.T., Forman, S.L., Edwards, T.W.D., Aravena, R., Hammarlund, D., Szeicz, J.M. and Gattaulin, V.N. 2000. Holocene Treeline History and Climate Change Across Northern Eurasia. Quaternary Research, 53, 302-311.
Mackey, K.G., Fujita, K. and Ruff, L.J. 1998. Crustal thickness of Northeast Russia. Tectonophysics, 284, 283-297.
Mange, M.A. and Maurer, H.F.W. 1991. Schwerminerale in Farbe. Ferdinand Enke Publishers, Stuttgart, 148 p.
Martinson, D.G., Pisias, N.G., Hays, J.D., Imbrie, J., Moore, T.C. and Shackleton, N.J. 1987. Age dating and the orbital theory of the ice ages; development of a high-resolution 0-300,000-year chronostratigraphy. Quaternary Research, 27, 1-29.
Matthiesen, J., Kunz-Pirrung, M. and Mudie, P.J. 2000. Freshwater chlorophycean algae in recent marine sediments of the Beaufort, Laptev and Kara Seas Arctic Ocean as indicators of river runoff. International Journal of Earth Sciences, 89, 3, 470-485.
Mellet, J.S. 1995. Profiling of ponds and bogs using ground-penetrating radar. Journal of Paleolimnology, 14, 233-240.
Meyer, H., Dereviagin, A., Siegert, C. and Hubberten, H.-W. in press. Paleoclimate studies on Bykovsky Peninsula, North Siberia - hydrogen and oxygen isotopes in ground ice. Polarforschung.
Mikulenko, K.I. and Timirshin, K.V. 1996. Geological construction of the Lena Delta. In: Grigoriev, M.N., Imaev, V.S., Imaeva, L.P., Kozmin, B.M., Kunitsky, V.V.,

References _____________________________________________________________________________________
95
Larionov A.G., Mikulenko, K.I., Skryabin, R.M. and Timirshin, K.V. eds. Geology, seismicity, and cryogenic processes in the Arctic areas of western Yakutia, Yakutian Scientific Center SD RAS, Yakutsk, 29-39 in Russian.
Mol, J. 1997. Fluvial response to Weichselian climate changes in the Niederlausitz Germany. Journal of Quaternary Science, 21, 43-60.
Mol, J., Vandenberghe, J. and Kasse, C. 2000. River response to variations of periglacial climate in mid-latitude Europe. Geomorphology, 33, 131-148.
Molinaroli, E., Falco, G. De, Rabitti, S. and Portaro, R.A. 2000. Stream-scanning laser system, electric sensing counter and settling grain size analysis: a comparison using reference materials and marine sediments. Sedimentary Geology, 130, 269-281.
Moorman, B.J. and Michel, F.A. 1997. Bathymetric mapping and sub-bottom profiling through lake ice with ground-penetrating radar. Journal of Paleolimnology, 18, 61-73.
Morgan, J.P. 1970. Depositional Processes and Products in the Deltaic Environment, In: Morgan, J.P. ed. Deltaic Sedimentation - modern and ancient, Society of Economic Paleontologists and Mineralogists, Tulsa Oklahoma USA, 31-47.
Morton, A.C. and Hallsworth, C. 1994. Identifying provenance-specific features of detrital heavy mineral assemblages in sandstones. Sedimentary Geology, 90, 241-256.
Müller, C. and Stein, R. 2000. Variability of fluvial sediments supply to the Laptev Sea continental margin during Late Weichselian to Holocene times: implications from clay mineral records. International Journal of Earth Sciences, 89, 592-604.
Müller-Lupp, T., Bauch, H.A., Erlenkeuser, H., Hefter, J., Kassens, H. and Thiede, J. 2000. Changes in the deposition of terrestrial organic matter on the Laptev Sea shelf during the Holocene; evidence from stable carbon isotopes. International Journal of Earth Sciences, 89, 3, 563-568.
Nemec, W. 1990. Deltas - remarks on terminology and classification. In: Colella, A. and Prior, D.B. eds. Coarse-Grained Deltas, Blackwell Scientific Publications, Oxford, 3-12.
Niessen, F. and Melles, M. 1995. Lacustrine sediment echosounding and physical properties. In: Hubberten, H.-W. ed.: The Expedition Arctis –X/2 of RV Polarstern ´94, Reports on Polar Research, 174, 69-75.
Niessen, F., Kopsch, C., Ebel, T. and Federov, G.B. 1997. Sub-bottom Profiling in Levinson-Lessing and Taymyr Lakes. In: Melles, M., Hagedorn, B. and Bolshiyanov, D.Yu. eds. Russian German Cooperation: The Expedition Taymyr / Severnaya Zemlya, Reports on Polar Research, 237, 70-78.
Niessen, F. and Jarrard, R.D. 1998. Velocity and Porosity of Sediments from CRP-1 Drillhole, Ross Sea, Antarctica. Terra Antarctica, 5, 311-318.
Niessen, F., Ebel, T., Kopsch, C. and Fedorov, G.B. 1999. High-Resolution Seismic Stratigraphy of Lake Sediments on the Taymyr Peninsula, Central Siberia. In: Kassens, H., Bauch, H., Dmitrenko, I., Eicken, H., Hubberten, H.-W., Melles, M., Thiede, J. and Timokhov, L. eds. Land-ocean Systems in the Siberian Arctic: Dynamics and History. Springer-Verlag, Berlin, 437-456.
Orton, G.J. and H.G. Reading 1993. Variability of deltaic processes in terms of sediment supply, with particular emphasis on grain size. Sedimentology, 40, 475-512.
Panin, A.V., Sidorchuk, A.Y. and Chernov, A.V. 1999. Historical background to floodplain morphology: examples from the East European Plain. In: Marriott, S.B. and Alexander, J. eds., Floodplains: Interdisciplinary Approaches, London: Geological Society, Special Publications, 163, 217-229.

References _____________________________________________________________________________________
96
Pavlidis, Y.A., Dunayev, N.N. and Shcherbakov, F.A. 1997. The Late Pleistocene Paleogeography of Arctic Eurasian Shelves. Quaternary International, 41-42, 3-9.
Pavlova, E., Dorozkhina, M. and Rachold, V. 1999. Geomorphological structure of the western sector of the Lena River delta. Terra Nostra, 99/11: Fifth Workshop on Russian-German Cooperation: Laptev Sea System, Program and Abstracts, St. Petersburg, p. 57.
Pavlova, E. and Dorozkhina, M. 1999. Geological-geomorphological studies in the northern Lena River Delta. In: Rachold, V. and Grigoriev, M.N. eds. Expeditions in Siberia in 1999, Reports on Polar Research, 315, 112-128.
Pavlova, E. and Dorozkhina, M. 2000. Geological-Geomorphological Studies in the western and central sectors of the Lena River Delta. In: Rachold, V. and Grigoriev, M.N. eds. Expeditions in Siberia in 2000, Reports on Polar Research, 354, 75-90.
Peregovich, B. 1999. Die postglaziale Sedimentationsgeschichte der Laptewsee: schwermineralogische und sedimentpetrographische Untersuchungen. Berichte zur Polarforschung, 316, 85 p.
Peregovich, B., Hoops, E. and Rachold, V. 1999. Sediment transport to the Laptev Sea Siberian Arctic during the Holocene - evidence from the heavy mineral composition of fluvial and marine sediments. Boreas, 28, 205-214.
Petit, J.R., Jouzel, J., Raynaud, D., Barkov, N.I., Barnola, J.-M., Basile, I., Bender, M., Chappellaz, J., Davis, M., Delaygue, G., Delmotte, M., Kotlyakov, V.M., Legrand, M., Lipenkov, V.Y., Lorius, C., Pépin, L., Ritz, C., Saltzman, E. and Stievenard, M. 1999. Climate and atmospheric history of the past 420,000 years from the Vostok ice core, Antarctica. Nature, 399, 429-436.
Pisaric, M.F.J., MacDonald, G.M., Velichko, A.A. and Cwynar, L.C. 2001. The late-glacial and post-glacial vegetation history of the northwestern limits of Beringia based on pollen, stomate and megafossil evidence. Quaternary Science Reviews, 20, 235-245.
Postma, G. 1995. Sea-level-related architectural trends in coarse grained delta complexes. Sedimentary Geology, 98, 3-12.
Prescott, J.R. and Hutton, J.T. 1988. Cosmic ray and gamma ray dosimetry for TL and ESR. Nucl. Tracks Radiat. Meas., 14, 223-227.
Prescott J.R. and Robertson, G.B. 1997. Sediment dating by luminescence: a review. In: Wintle, A.G. ed. Review on luminescence and electron spin resonance dating and allied research. Radiation Measurements, 27, 893-922.
Quinn, R.J. 1997. Marine high-resolution reflection seismology: acquisition, processing and applications. Unpublished Ph.D. thesis, University of Southampton.
Quinn, R., Bull, J.M. and Dix, J.K. 1998. Optimal processing of marine high-resolution seismic reflection chirp data. Marine Geophysical Researches, 20, 13-20.
Quirk, D.G. 1996. ´Base profile´: a unifying concept in alluvial sequence stratigraphy, In: Howell, J.A. and Aitken, J.F. eds. High Resolution Sequence Stratigraphy: Innovations and Applications, Geological Society, London, Special Publication 104, 37-49.
Rachold, V., Alabyan, A., Hubberten, H.-W., Korotaev, V.N. and Zaitsev, A.A. 1996. Sediment transport to the Laptev Sea – hydrology and geochemistry of the Lena river. Polar Research, 15, 183-196.
Rachold, V., Hoops, E., Alabyan, A., Korotaev, V.N. and Zaitsev, A.A. 1997. Expedition to the Lena and Yana rivers June-September 1995. Reports on Polar Research, 248, 193-210.

References _____________________________________________________________________________________
97
Rachold, V. and Grigoriev, M.N. eds. 1999. Russian-German Cooperation SYSTEM LAPTEV SEA 2000: The Lena Delta 1998 Expedition, Reports on Polar Research, 315, 81-144.
Rachold, V. Grigoriev, M.N. and Antonow, M. 1999. Modern Sedimentation and Environmental History of the Lena Delta. In: Rachold, V. and Grigoriev, M.N. eds., Russian-German Cooperation SYSTEM LAPTEV SEA 2000: The Lena Delta 1998 Expedition, Reports on Polar Research, 315, 81-82.
Rachold, V. and Grigoriev, M.N. eds. 2000. Russian-German Cooperation SYSTEM Laptev Sea 2000: The Expedition LENA 1999. Reports on Polar Research, 354, 269 p.
Rachold, V., Grigoriev, M.N., Are, F.E., Solomon, S., Reimnitz, E., Kassens, H., Antonow, M. 2000. Coastal erosion vs. riverine sediment discharge in the Arctic Shelf seas. International Journal of Earth Sciences, 89, 3, 450-460.
RAMAC/GPR Operating Manual 1997. Version 2.28. Malå Geoscience. Reimnitz in press. Interactions of river discharge with sea ice in proximity of Arctic
Deltas: A review. Polarforschung. Rensbergen, P.v., de Batist, M., Beck, Ch. and Chapron, E. 1999. High-resolution
seismic stratigraphy of glacial to interglacial fill of a deep glacigenic lake: Lake Le Bourget, Northwestern Alps, France. Sedimentary Geology, 128, 99-129.
Robinson, S.D., Burgess, M.M., Judge, A.S., Kettles, I.M., Moorman, B.J. and Wolfe, S.A. 1997. The use of Ground Penetrating Radar in permafrost environments: Recent applications, Program and Abstract 27th Arctic Workshop, Department of Geography, University of Ottawa, Feb. 27. - March 2., 1997, Lewkowicz, A.G. and Kokelj, S.V. eds., 191-193.
Romanovskii, N.N. 1978. Effect of neotectonic movements on formation of permafrost regions. In: Sanger, F.J. and Hyde, P.J. eds. Second international conference on permafrost; USSR contribution, Natl. Acad. Sci., Washington, D.C., United States, 184-188.
Romanovskii, N.N., Kholodov, A.L., Gavrilov, A.V., Tumskoy, V.E., Hubberten, H.W. and Kassens, H. 1999. Ice-bonded permafrost thickness in the eastern part of the Laptev Sea shelf. Kryosphera Zemli, 3, 22-32 in Russian.
Romanovskii, N.N., Hubberten, H.W., Gavrilov, A.V., Tumskoy, V.E., Tipenko, G.S., Grigoriev, M.N. and Siegert, C. 2000. Thermokarst and Land-Ocean Interactions, Laptev Sea Region, Russia. Permafrost and Periglacial Processes, 11, 137-152.
Schirrmeister, L., Siegert, C., Kunitsky, V. and Sher, A. 1999. Paleoclimate Signals of Ice-rich Permafrost. In: Rachold, V. and Grigoriev, M.N. eds. Expeditions in Siberia in 1998, Reports on Polar Research, 315, 145-152.
Schirrmeister, L., Siegert, C., Meyer, H., Derevyagin, A., Kienast, F., Andreev, A., Kunitsky, V., Tumskoy, V. and Grootes, P. 2000. Paleoenvironmental and Paleoclimatic Records from Permafrost Deposits in the Arctic Region of Northern Siberia. In: Proc. Intern. Conference on Past Global Changes, Prague, Sept. 6-9, 2000, GeoLines 11, Institute of Geology, AS CR, 147-150.
Schirrmeister, L. in press. Late Quaternary and recent environmental situation around the Olenyok Channel western Lena Delta and on Bykovsky Peninsula. In: Rachold, V. and Grigoriev, M.N. eds. Expeditions in Siberia in 2000, Reports on Polar Research, 85-98.
Schirrmeister, L., Oezen, D. and Geyh, M.A. submitted. 230Th/U age determination of frozen peat in permafrost deposits of Bol´shoy Lyakhovsky Island North Siberia. Quaternary Research.

References _____________________________________________________________________________________
98
Schock, S.G. and LeBlanc, L.R. 1990. Chirp Sonar: new technologies for subbottom profiling. Sea Technology, 31, 9, 37-43.
Schock, S.G., LeBlanc, L.R. and Panda, S. 1994. Spatial and temporal design considerations for a marine sediment classification sonar. IEEE Journal of Oceanic Engineering, 19, 406-415.
Schwamborn, G., Schneider, W., Grigoriev, M., Rachold, V. and Antonow, M. 1999. Sedimentation and environmental history of the Lena Delta. In: Rachold, V. and Grigoriev, M.N. eds., Russian-German Cooperation SYSTEM LAPTEV SEA 2000: The Lena Delta 1998 Expedition, Reports on Polar Research, 315, 94-111.
Schwamborn, G., Rachold, V., Grigoriev, M.N. and Krbetschek, M. 2000a. Late Quaternary Sedimentation History of the Lena Delta. In: Proc. Intern. Conference on Past Global Changes, Prague, Sept. 6-9, 2000, GeoLines 11, Institute of Geology, AS CR, 35-38.
Schwamborn, G., Schneider, W., Grigoriev, M.N., Rachold, V. and Antonow, M. 2000b. Sedimentation and environmental history of the Lena Delta. In: Rachold, V. and Grigoriev, M.N. eds., The Expedition LENA 1999, Reports on Polar Research, 354, 57-64.
Schwamborn, G., Rachold, V., Schneider, W., Grigoriev, M. and Nixdorf, U. 2000c. Ground Penetrating Radar and Shallow Seismic – Stratigraphic and Permafrost Investigations of Lake Nikolay, Lena Delta, Arctic Siberia. Proc. of Eighth International Conference on Ground Penetrating Radar, SPIE Vol. 4084, 783-789.
Schwamborn, G., Tumskoy, V., Andreev, A.A., Rachold, V., Grigoriev, M.N., Pavlova, E.Y., Dorozkhina, M.V. and Hubberten, H.-W. in press. Evolution of Lake Nikolay, Arga Island, Western Lena River delta, during Late Weichselian and Holocene time. Polarforschung.
Sellmann, P.V., Delaney, A.J. and Arcone, S.A. 1992. Sub-bottom Surveying in Lakes with Ground-Penetrating-Radar. CRREL Reports, USA Cold Regions Research and Engineering Laboratory, 92-8, 18 p.
Serova, V.V. and Gorbunova, Z.N. 1997. Mineral composition of soil, aerosols, suspended matter and bottom sediments of the Lena estuary and the Laptev Sea. Oceanology, Marine Geology, 37, 131-135.
Sher, A. 1995. Is there any real evidence for a huge shelf ice sheet in east Siberia? Quaternary International, 28, 39-40.
Sher, A. 1999. Ice Complex of the Laptev Sea shelf area: paleoecology, age and other problems and current solutions. Quaternary Environment of the Eurasian North QUEEN, abstracts – 3rd Workshop, Øystese, Norway 16-18 April 1999, p. 55.
Sheriff, R.E. 1980. Nomogram for Fresnel-zone calculation. Geophysics, 45, 5, 968-972.
Sheriff, R.E. 1985. Aspects of Seismic Resolution. In: Berg, O.R. and Woolverton, D.G. eds. Seismic Stratigraphy II; an integrated approach to hydrocarbon exploration, AAPG Memoir, 39, 1-10.
Sheriff, R.E. and Geldart, L.P. 1995. Exploration Seismology. Cambridge University Press, 592 p.
Sidorchuk, A.Y. and Borisova, O.K. 2000. Method of paleogeographical analogues in paleohydrological reconstructions. Quaternary International, 72, 95-106.
Sidorchuk, A.Y., Panin, A.V., Borisova, O.K., Elias, S.A. and Syvistki, J.P. 2000. Channel morphology and river flow in the northern Russian Plain in the Late Glacial and Holocene. International Journal of Earth Sciences, 89, 541-549.

References _____________________________________________________________________________________
99
Siegert, C. 1999. Late Quaternary denudation processes in permafrost landscapes of Central Siberia and their impact on the Arctic Ocean. In: Abstracts - Third QUEEN Workshop Oeystese, Norway, 16-18 April, 1999.
Siegert, C., Derevyagin, A.Y., Shilova, G.N., Hermichen, W.-D. and Hiller, A. 1999. Paleoclimatic indicators from permafrost sequences in the eastern Taymyr lowland. In: Kassens, H., Bauch, H., Dmitrenko, I., Eicken, H., Hubberten, H.-W., Melles, M., Thiede, J. and Timokhov, L. eds. Land-ocean systems in the Siberian Arctic: dynamics and history, Berlin, Springer-Verlag, 477-502.
Siegert, C., Schirrmeister, L. and Babiy, O.A. in press. The composition of Late Pleistocene permafrost deposits - new sedimentological, mineralogical and geochemical data from the Ice Complex of the Bykovsky Peninsula, Northern Siberia. Polarforschung.
Slagoda, E. A. 1993. Genesis and microstructure of cryolithogenic deposits of the Bykovsky Peninsula and the Muostakh Island. PhD thesis, Permafrost Institute Yakutsk, RAS Siberian Section, 218 p. in Russian.
Solomon, S., Mudie, P.J., Cranston, R., Hamilton, T., Thibaudeau, S.A. and Collins, E.S. 2000. Characterisation of marine and lacustrine sediments in a drowned thermokarst embayment, Richards Island, Beaufort Sea, Canada. International Journal of Earth Sciences, 89, 3, 503-521.
Soloviev, P. A. 1989. Agricultural Atlas of Yakutskaya ASSR. GUGK Press, Moscow, p. 27.
Spielhagen, R., Erlenkeuser, H. and Heinemeier, J. 1998. Deglacial freshwater outflow from Lena River Siberia, Quaternary Environment of the Eurasian North QUEEN. Abstracts - 2nd Workshop, St. Petersburg, 5-6 February 1998, p. 48.
Spielhagen, R.F., Siegert, C., Erlenkeuser, H., Heinemeier, J. in prep.. Deglacial history of river run-off across the Laptev Sea Arctic.
Stanley, D.J. and Chen, Z. 2000. Radiocarbon dates in China´s Holocene Yangtze Delta: Record of Sediment Storage and Reworking, Not Timing of Deposition. Journal of Coastal Research, 16, 1126-1132.
Stanley, D.J. and Warne, A.G. 1994. Worldwide Initiation of Holocene Marine Deltas by Deceleration of Sea-Level Rise. Science, 265, 228-231.
Stuiver, M. and Polach, H.A. 1977. Discussion: Reporting of 14C Data. Radiocarbon, 19, 3, 355-363.
Stuiver, M., Reimer, P.J., Bard, E., Beck, J.W., Burr, G.S., Hughen, K.A., Cromer, B., McCormic, G., van der Plicht, J. and Spurk, M. 1998. INTCAL 98 radiocarbon age calibration, 24,000-0 cal BP. Radiocarbon, 40, 1041-1083.
Timokhov, L.A. 1994. Regional characteristics of the Laptev and the east Siberian Seas: Climate, Topography, Ice Phases, Thermohaline regime, Circulation. Reports on Polar Research,. 144, 15-31.
Tomirdiaro, S.V. 1984. Periglacial Landscapes and Loess Accumulation in the Late Pleistocene Arctic and Subarctic. In: Velichko, A.A. ed. Late Quaternary Environments of the Soviet Union. University of Minnesota, Minneapolis, 141-151.
Tomirdiaro, S.V. 1996. Palaeogeography of Beringia and Arctida. In: West, F.H. ed. American Beginnings, University of Chicago, Chicago, 58-69.
Tucker, M. 1996. Methoden der Sedimentologie. Ferdinand Enke Verlag, Stuttgart, 67-79.
Vandenberghe, J. 1995. Timescales, Climate and River Development. Quaternary Science Reviews, 14, 631-638.
Verbeek, N.H. and McGee, T.M. 1995. Characteristics of high-resolution marine reflection profiling sources. Journal of Applied Geophysics, 33, 4, 251-269.

References _____________________________________________________________________________________
100
Walker, H.J. 1998. Arctic Deltas. Journal of Coastal Research, 14, 3, 718-738. Wintle, A.G. 1997. Luminescence dating: laboratory procedures and protocols. In:
Wintle, A.G. ed. Review on luminescence and electron spin resonance dating and allied research. Radiation Measurements, 27, 769-817.
Yilmaz, O. 1987. Seismic data processing. Investigations in Geophysics 2, Society of Exploration Geophysicists, Tulsa, Oklahoma.
Zimmerman, R.W. and King, M.S. 1986. The effect of the extent of freezing on seismic velocities in unconsolidated permafrost. Geophysics, 51, 1285-1290.

Acknowledgements _____________________________________________________________________________________
101
Acknowledgements Most of the results described in this text are a product of work sponsored by the
BMBF (German ministry for science) for the project "System Laptev Sea 2000" (TP 6)
over a period of almost three years. Hereafter, the AWI Potsdam supported this work. In
the final stage it has been rounded up by an EU grant received as a “Marie Curie
training fellowship” at the Southampton University, School of Ocean and Earth
Sciences. During the whole time the continuous encouragement and support of a
number of senior scientists and colleagues has allowed me to pursue the ordered and
uninterrupted development of this study.
I am particularly grateful to the following scientists: Prof. Dr. Hans-Wolfgang
Hubberten, Prof. Dr. Manfred Strecker and Prof. Dr. Martin Melles for reviewing this
doctoral thesis. Prof. Dr. Hubberten as head of the AWI Potsdam department gave me a
great deal of free space to develop my own creativity but also supported my efforts
whenever necessary.
I am especially thankful to my super(ad)visor throughout the project, Dr. V. Rachold.
You have always been supportive and ready with advice and insight, whether the
research was thesis related or diversionary. I thank you for the many opportunities that
you have provided and for the help that you have offered in those endeavors. Dr. Justin
Dix and Dr. Jon Bull are thanked for supervising the instructive and comfortable stay at
the Southampton Oceanography Center.
All co-authors and reviewers of the relevant published papers are kindly recognised
for their meaningful contributions, constructive help and effective support.
Both in the field and in the laboratory many people have contributed to this project
over the years whereby specific groups in the AWI Potsdam community have made my
work not only successful, but also extremely enjoyable. I was impressed by the pleasant
welcome and interest of scientists at this place and that they have created an inviting
and stimulating atmosphere. The doors were always open for a discussion. In particular,
thanks to Christine Siegert, who knows so much and was ready at any time for any
single permafrost detail to check and discuss about.
Administration items were no matter of confusion or worry especially because of
Helga Henschel and Christine Litz. Thanks to you and Frau I. Sass the main building is
always sympathetic to me!

Acknowledgements _____________________________________________________________________________________
102
The field campaigns conducted as part of this thesis were also a team effort and to the
people who helped make it all come together I am particularly indebted to Misha
Grigoriev, my Russian advisor and first-class scientific address for the Lena Delta. You
were generous with your vast knowledge about the icy delta that I could gain from and I
liked your thoughtful but also humorous attitude towards the matter.
Mathias Krbetschek’s contribution is highly appreciated in providing a fruitful and
enjoyable cooperation in the matter of luminescence dating.
In the laboratory at Ute Bastian, Maren Stapke and Lutz Schönicke deserve many
thanks for helping in process samples.
Waldemar Schneider! Lutz Schirrmeister! Very special thanks are due to you. You
have argued against, defended, struggled with, supported and most importantly laughed
at (and with) me all the times when each was necessary. Thank you very much
Waldemar and Lutz. By the way, I think the relationships we form are more important
than the knowledge we acquire and I guess you will agree.
Laughing ...- that reminds me of Hanno Meyer. But of course this is not the only thing
we shared fortunately very often. As my work mate in time and location your
importance to me must be appreciated. I enjoyed valuable discussions as I had a lot of
fun out of the (amusing) fact that we shared the same disposition towards our fate.
Through my years of studying my family has been a huge source of support and
encouragement. I thank them all (even when they seemed baffled by what I could
possibly be working on for so long).
Last but not least, next to all the delight I felt spending time with my “little big piece”
of research I have even more delight spending my time with you @!