Embed Size (px)
Citation preview
LATENT HEAT STORAGE FOR AN OFF-GRID PV
COOLING SYSTEM IN EGYPT
By
Mohamed Shehata
A Thesis Submitted to the Faculty of Engineering at Cairo University and
Kassel University in Partial Fulfillment of the Requirements for the Degree
of
Master of Science
in
Renewable Energy and Energy Efficiency
Kassel University, Kassel, Germany
Faculty of Engineering, Cairo University, Giza, Egypt
November 2014
LATENT HEAT STORAGE FOR AN OFF-GRID PV
COOLING SYSTEM IN EGYPT
By
Eng. Mohamed Shehata
A Thesis Submitted to the Faculty of Engineering at Cairo University and
Kassel University in Partial Fulfillment of the Requirements for the Degree
of
Master of Science
in
Renewable Energy and Energy Efficiency
Under the Supervision of
Prof. Dr. Adel Khalil
Prof. Dr. Dirk Dahlhaus
Mechanical Power Department
Faculty of Engineering, Cairo University
Electrical Engineering Department
Kassel University, Germany
Kassel University, Kassel, Germany
Faculty of Engineering, Cairo University, Giza, Egypt
November 2014
LATENT HEAT STORAGE FOR AN OFF-GRID PV
COOLING SYSTEM IN EGYPT
By
Mohamed Shehata
A Thesis Submitted to the Faculty of Engineering at Cairo University and
Kassel University in Partial Fulfillment of the Requirements for the Degree
of
Master of Science
in
Renewable Energy and Energy Efficiency
Approved by the
Examining Committee
____________________________
Prof. Dr. Adel Khalil, Thesis Main Advisor
____________________________
Prof. Dr. Sayed Kaseb
____________________________
Dr. Hani Nokraschy
Kassel University, Kassel, Germany
Faculty of Engineering, Cairo University, Giza, Egypt
November 2014
4
Acknowledgements
It is my pleasure to thank all those who made this thesis possible. I would like to
express my deepest appreciation to Fraunhofer Institute for Environmental Safety and
Energy Technology (UMSICHT), Germany for hosting the topic of my thesis. It has
been a pleasure to work with Dipl.-Ing. Peter Schwerdt, head of thermal energy storage
research group, whom I would like to thank for his cooperation and constructive
criticism.
It gives me great pleasure in acknowledging the support of the master program
administration team for their true cooperation and support.
Special thanks go to my master thesis academic supervisors for their indescribable
cooperation, guidance, and for giving me part of their valuable time.
I would also like to thank, first and foremost, my academic Professors for their sincere
concern of passing their knowledge forward. I am indebted to my colleagues who
always offered their help, and above all for making this program special.
I owe my deepest gratitude to my parents and family members for their invaluable
support. I wouldn’t have reached this stage without them.
This work fulfils part of my personal referential valuables. I hope the technical
enclosed engineering solution could contribute in making my country Egypt a better
place.
5
Abstract
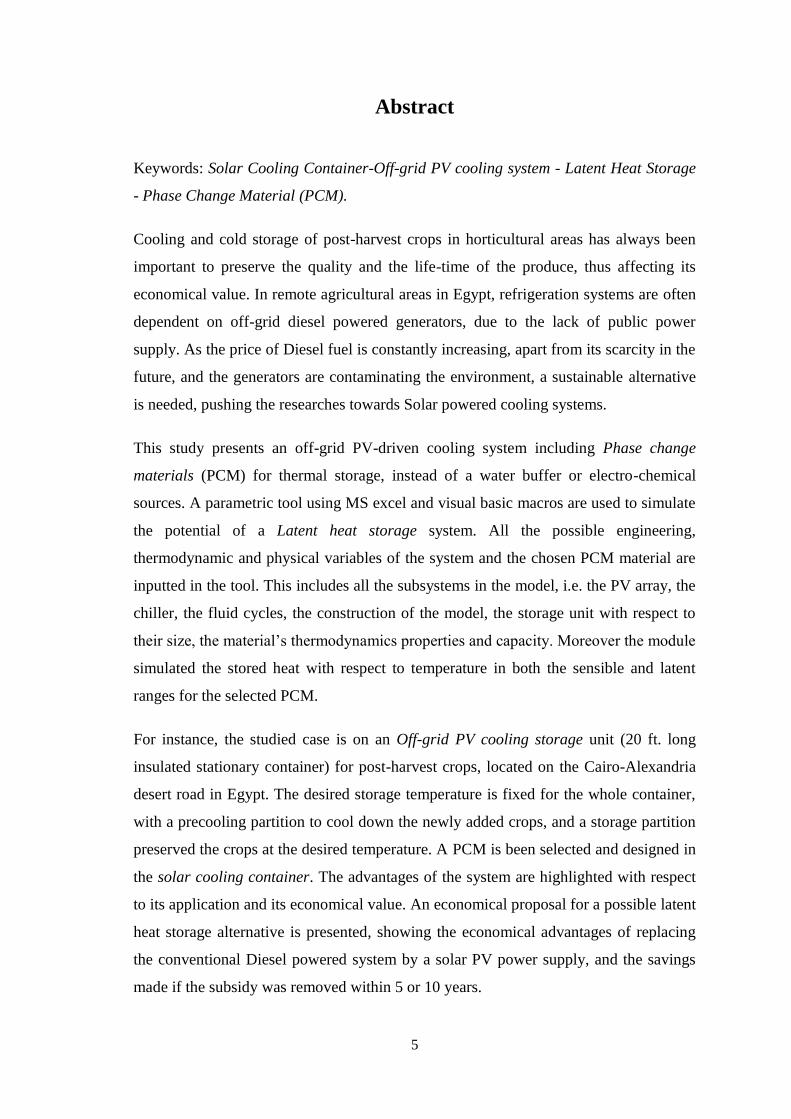
Keywords: Solar Cooling Container-Off-grid PV cooling system - Latent Heat Storage
- Phase Change Material (PCM).
Cooling and cold storage of post-harvest crops in horticultural areas has always been
important to preserve the quality and the life-time of the produce, thus affecting its
economical value. In remote agricultural areas in Egypt, refrigeration systems are often
dependent on off-grid diesel powered generators, due to the lack of public power
supply. As the price of Diesel fuel is constantly increasing, apart from its scarcity in the
future, and the generators are contaminating the environment, a sustainable alternative
is needed, pushing the researches towards Solar powered cooling systems.
This study presents an off-grid PV-driven cooling system including Phase change
materials (PCM) for thermal storage, instead of a water buffer or electro-chemical
sources. A parametric tool using MS excel and visual basic macros are used to simulate
the potential of a Latent heat storage system. All the possible engineering,
thermodynamic and physical variables of the system and the chosen PCM material are
inputted in the tool. This includes all the subsystems in the model, i.e. the PV array, the
chiller, the fluid cycles, the construction of the model, the storage unit with respect to
their size, the material’s thermodynamics properties and capacity. Moreover the module
simulated the stored heat with respect to temperature in both the sensible and latent
ranges for the selected PCM.
For instance, the studied case is on an Off-grid PV cooling storage unit (20 ft. long
insulated stationary container) for post-harvest crops, located on the Cairo-Alexandria
desert road in Egypt. The desired storage temperature is fixed for the whole container,
with a precooling partition to cool down the newly added crops, and a storage partition
preserved the crops at the desired temperature. A PCM is been selected and designed in
the solar cooling container. The advantages of the system are highlighted with respect
to its application and its economical value. An economical proposal for a possible latent
heat storage alternative is presented, showing the economical advantages of replacing
the conventional Diesel powered system by a solar PV power supply, and the savings
made if the subsidy was removed within 5 or 10 years.
6
Table of Contents
Acknowledgements ......................................................................................................... 4
Abstract ........................................................................................................................... 5
Table of Contents ............................................................................................................ 6
List of Figures ................................................................................................................. 7
List of Tables ................................................................................................................... 8
Nomenclature .................................................................................................................. 9
1 Motivation .............................................................................................................. 12
2 Introduction ........................................................................................................... 13
3 Literature review ................................................................................................... 15
3.1 Literature survey .............................................................................................. 15
3.1.1 PV driven solar cooling researches and systems ...................................... 15
3.1.2 PCM projects ............................................................................................ 19
3.2 System design for precooling of crops ............................................................ 21
3.3 Energy storage systems .................................................................................... 23
3.3.1 Batteries .................................................................................................... 23
3.3.2 Thermal energy storage (TES) - Latent heat storage ................................ 24
3.4 PCM as thermal energy storage for cooling application.................................. 27
3.4.1 Phase change materials ............................................................................. 28
3.4.2 PCM Selection .......................................................................................... 32
3.4.3 PCM - problems and possible solutions ................................................... 34
3.5 Gap analysis and work motivation .................................................................. 38
3.6 Work scope ...................................................................................................... 38
4 Physical model and system design ....................................................................... 39
4.1 System design .................................................................................................. 39
4.2 System operation description ........................................................................... 41
4.3 Container partitioning ...................................................................................... 43
4.4 Physical model ................................................................................................. 44
4.4.4 Climatic conditions ................................................................................... 44
4.4.5 System scale ............................................................................................. 46
5 Case study .............................................................................................................. 60
5.1 Technical feasibility ......................................................................................... 60
7
5.1.1 System components and capacities .......................................................... 60
5.1.2 Selection criteria ....................................................................................... 61
5.2 Economic assessment and sensitivity analysis ................................................ 65
5.2.2 Operation costs and maintenance ............................................................. 67
5.2.3 Economical assessment ............................................................................ 67
5.2.4 Comparing the proposed system with the conventional system ............... 70
5.3 Results .............................................................................................................. 73
6 Conclusion and recommendations ....................................................................... 76
7 Bibliography .......................................................................................................... 78
Appendix A – Storage requirements for vegetables, and fruits [19]. ...................... 81
Appendix B – Various PCM materials and their phase change temperature [32]. 82
Appendix C – Datasheets ............................................................................................. 84
Appendix D – Examples of operational system behavior ......................................... 91
List of Figures
Figure 3-1: Left: Vehicle using PCTSU unit, Right: Refrigeration process for the vehicle including
cooling unit ................................................................................................................................................ 15 Figure 3-2 Left: PVmilk cooling center, right: solar cooling container..................................................... 18 Figure 3-3 Left: Polypropylene capillary tubes heat exchanger, Right: HDPE storage container together
with the capillary–tube matrix inserted. (Source: ZAE Bayern) ............................................................... 20 Figure 3-4 Latent and sensible heat storage vs. temperature (source: ZAE Bayern) ................................. 24 Figure 3-5 Temperature vs. stored heat (sensible manner) [13] ................................................................ 25 Figure 3-6 PCM material classes that are being investigated, Melting Enthalpy vs. Temperature (Source:
ZAE Bayern) ............................................................................................................................................. 27 Figure 3-7 Heating and cooling PCM material showing the sub-cooling range [13] ................................ 33 Figure 4-1 Design alternatives for the proposed physical model .............................................................. 40 Figure 4-2 Schematic Diagram for the PV-cooling system using batteries for electrical energy storage
and PCM as thermal storage ...................................................................................................................... 42 Figure 4-3 Schematic diagram of the container partitions showing the precooling partition on the left, and
on the right is the storage room holding the cold [25]. .............................................................................. 43 Figure 4-4 Up: Chosen location – Bottom: Egyptian national grid ........................................................... 44 Figure 4-5 GHI map for the chosen location and the surrounding areas [44] .......................................... 45 Figure 4-6 Annual GHI for the selected location ...................................................................................... 45 Figure 4-7 Shenzhen Shine Solar Co., Ltd, China Module [50] ................................................................ 47 Figure 4-8 Tilted PV array, Left: Folded PV during non-operating hours, Right: Unfolded during
operation .................................................................................................................................................... 48 Figure 4-9 Battery cycles vs. the depth of discharge [29] ......................................................................... 49 Figure 4-10 - MPP of a 12V PV module .................................................................................................... 50 Figure 4-11 DC vapor compression chiller (Picture Masterflux) .............................................................. 51 Figure 4-12 Left: Chiller COP vs. ambient temperature, Right: Maximum cooling capacity of the chiller
vs. Ambient Temperature, using a quadratic function. .............................................................................. 52
8
Figure 4-13 Heat exchanger evaporator with connections for the refrigerant and the chilled fluid cycle
(Source: GEA, Germany) .......................................................................................................................... 53 Figure 4-14 Thermal storage unit including the pre-cooling and the cold storage partitions .................... 54 Figure 4-15 Total cooling components ...................................................................................................... 56 Figure 4-16 Cooling load components rate for each hour [31] .................................................................. 57 Figure 4-17 cooling load fluctuation and GHI for the chosen location ..................................................... 59 Figure 5-1 System matrix output using cold-water as thermal storage material........................................ 62 Figure 5-2 System matrix output using ice as thermal storage material .................................................... 63 Figure 5-3 System matrix output using Paraffin RT5HC as thermal storage material .............................. 64 Figure 5-4 Annual Cash Flow of the seven alternatives compared to a conventional system .................. 68 Figure 5-5 Annual Cash-outflow for both the proposed PV system and the Diesel alternative ............... 71 Figure 5-6 The accumulated savings of the proposed PV system for a 5 and 10 years for the
corresponding diesel subsidy removal plans. ............................................................................................ 72 Figure 5-7 Chiller COP during a year of operation ................................................................................... 73 Figure 5-8 PV electricity utilization .......................................................................................................... 74 Figure 5-9 Proposed System5 (Ice/4.06 PV/7.3 chiller/1.2 Battery): Operation parameters in summer
(hottest days) ............................................................................................................................................. 75
List of Tables
Table 3-1 Example of lowest safe storage temperature [19] ..................................................................... 22 Table 3-2 PCM: Some eutectic water salt solution compounds ................................................................ 28 Table 3-3 PCM: Some salt hydrate compounds [13] ................................................................................ 29 Table 3-4 Example of nitrates, chlorides, carbonates, and fluorides ......................................................... 30 Table 3-5 Organic Paraffin compounds sample ........................................................................................ 30 Table 3-6 Fatty acid compounds ............................................................................................................... 31 Table 3-7 Sugar alcohol compounds ......................................................................................................... 31 Table 3-8 Organic and Inorganic PCM comparison .................................................................................. 32 Table 4-1 Shenzhen Shine Solar Co., Ltd, China module aspects ............................................................. 47 Table 4-2 Selected PCM material and their physical properties ................................................................ 55 Table 4-3 loading/unloading scenario [25]. ............................................................................................... 58 Table 5-1 Selected system alternatives ...................................................................................................... 65 Table 5-2 Components investment cost for the PV-driven cooling system ............................................... 66 Table 5-3 Lifetime of each component...................................................................................................... 67 Table 5-4 Material’s Price ......................................................................................................................... 67 Table 5-5 Annual Cash Flow for the seven technical alternatives ............................................................. 68 Table 5-6 Net Present Value of the technical alternatives (10% interest rate) .......................................... 69 Table 5-7 Diesel system components cost and lifetime ............................................................................. 70 Table 5-8 Proposed system specifications ................................................................................................. 74
9
Nomenclature
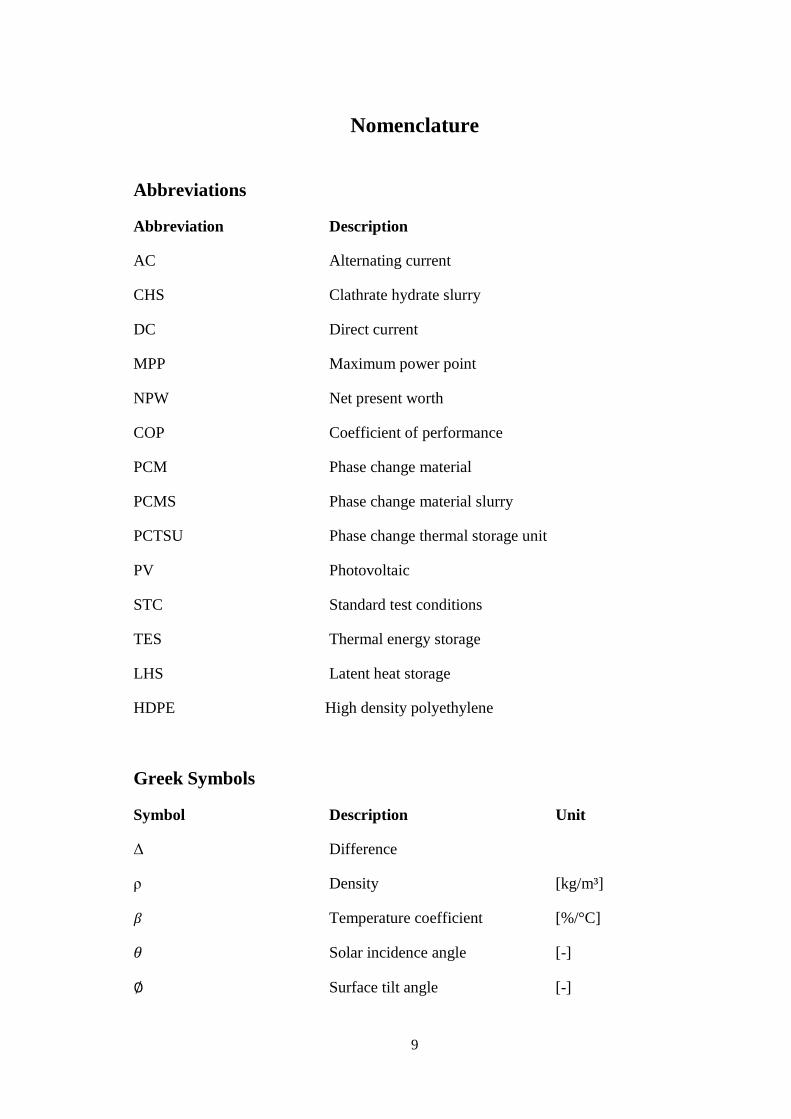
Abbreviations
Abbreviation Description
AC Alternating current
CHS Clathrate hydrate slurry
DC Direct current
MPP Maximum power point
NPW Net present worth
COP Coefficient of performance
PCM Phase change material
PCMS Phase change material slurry
PCTSU Phase change thermal storage unit
PV Photovoltaic
STC Standard test conditions
TES Thermal energy storage
LHS Latent heat storage
HDPE High density polyethylene
Greek Symbols
Symbol Description Unit
Δ Difference
ρ Density [kg/m³]
𝛽 Temperature coefficient [%/°C]
𝜃 Solar incidence angle [-]
∅ Surface tilt angle [-]
10
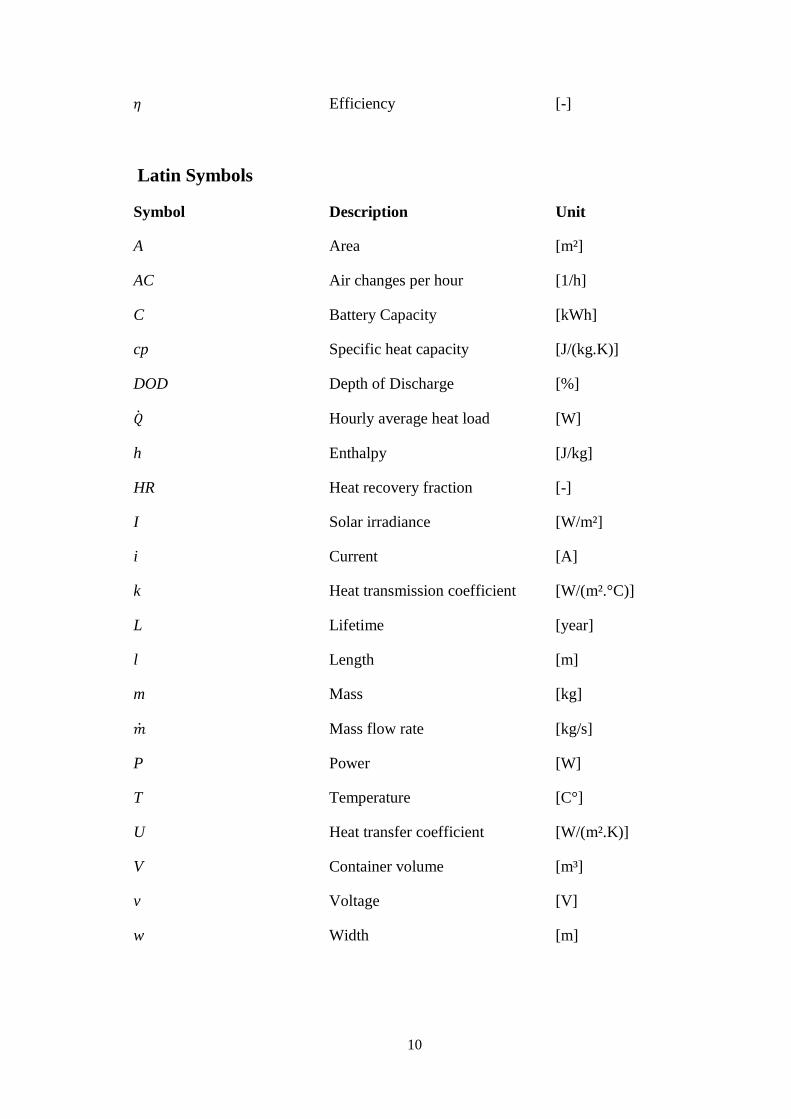
𝜂 Efficiency [-]
Latin Symbols
Symbol Description Unit
A Area [m²]
AC Air changes per hour [1/h]
C Battery Capacity [kWh]
cp Specific heat capacity [J/(kg.K)]
DOD Depth of Discharge [%]
�� Hourly average heat load [W]
h Enthalpy [J/kg]
HR Heat recovery fraction [-]
I Solar irradiance [W/m²]
i Current [A]
k Heat transmission coefficient [W/(m².°C)]
L Lifetime [year]
l Length [m]
m Mass [kg]
�� Mass flow rate [kg/s]
P Power [W]
T Temperature [C°]
U Heat transfer coefficient [W/(m².K)]
V Container volume [m³]
v Voltage [V]
w Width [m]
11
Subscripts
Symbol Description
CO2 Carbon dioxide
Nox Nitrogen oxide
eq Equivalent
i Electric current
in Inside air
inf Infiltration
max Maximum
MPP Maximum power point
N Direct normal
new Newly loaded
o Outer
p Produce
pre Previously loaded
PV Photovoltaic module
roof Container Roof
t Transmission
V Ventilation
v Voltage
wall Container wall
dis Discharge
bat Battery
tot Total
cell Cell
12
1 Motivation
Solar cooling is an essential application for the MENA countries. Most of the MENA
countries are located on the solar-belt and the seasonal demand corresponds to the
radiation intensity, as most of the required cooling demand is in summer.
It is not only about cooling for residential sector and buildings but also for crops. Most
of the agricultural lands are not covered by the local national electricity grid. However
the post-harvest crops need to be cooled down quickly in order to maintain their
quality. The common nowadays available solution is Diesel generators. Remote areas
have problems with the availability of Diesel fuel, and most probably will face
problems due to the continuously increasing price of the Diesel fuel.
As an energy engineer with a material science background, I was challenged to
investigate the possibility of implementing an off-grid PV driven cooling container
using special material for thermal storage to reduce the volume of the thermal storage
unit investigated in a previous study at Fraunhofer UMSICHT. Nevertheless protecting
the environment has been always a motivating factor to find a solution replacing the use
of Diesel generators with an environmental friendly technical solution.
13
2 Introduction
Nearly most of the horticulture produce are characterized by their short harvesting
season. Storage for a certain period of time either short or long is definitely required not
only to prolong the market freshness duration of the product, but also to regulate the
flow of the product and the processing-season [1]. This implies the economical value
behind storing the harvested crops. Precooling is important to harvested crops, however
it is recommended even to quickly precool the harvested produce to avoid any chemical
or biological changes resulting in deteriorating the quality of the stored produce.
Microorganisms’ growth rate will decrease at considerable lower temperatures.
Microorganisms’ growth rate depends also on the relative humidity and the ventilation
rate of the air inside the storage unit [2].
Ventilation of the produce is essential to avoid the excess of ethylene in the storage.
Ethylene pollution will be responsible for yellowing the leafy vegetables such as
broccoli and spinach. Ethylene causes also russet spotting and some other undesired
effects that have to be avoided in the system [1].
In some horticulture areas the produce needs either to be cooled-down immediately
after harvesting, and/or to be transported to remote areas. The produce will keep its
properties only by being pre-cooled and stored in a refrigerated environment. In some
cases it has to be transported for long time and distances, in which a
cooling/refrigeration system is required. Despite of the continuous increase in the fuel
price, and the nowadays systems use Diesel for cooling.
There is no controversy that using Diesel in a horticultural areas without even
considering the presence of the sun-radiation is inefficient, since the fuel prices is
ascending and the PV-technology quality in ascending however its price is descending.
Introducing the power problem which substantially is represented in the fuel either
scarcity or high price. Especially in Egypt depending on the sun as energy source for
the refrigeration system is favorable especially for off-grid regions. In Egypt there are a
lot of agricultural areas where refrigeration for harvested crops is needed. Even today
not all the agricultural areas are connected to the Egyptian national grid. Even in case
14
of using Diesel fuel to supply the refrigeration system, the cost of Diesel is getting
higher and it is not that easy to get nowadays.
In this study a technically and economically feasible engineering solution/system,
operating at low cost and considerable efficiency (COP), is investigated to solve such
near-future problem. Egypt lies on the ‘Solar belt’ in which the highest sun radiation
intensity is recorded, which brought up the need to think about a PV-cooling system
with some kind of energy storage for continuous cold supply.
In chapter 3 a moderately extensive research will demonstrate and uncover the recent
state-of-the-art of PCM technology with all the recent findings and the technology used
in real projects with respect to PCM in cooling. In section 3.2, the system design
precautions for precooling of fruits and vegetables with respect to the chosen design
will be discussed. Different energy storage systems are introduced in chapter 3.3 more
information about phase change material as thermal storage systems is discussed in
section 3.4.
Getting deeper in understanding the system through its physical, mathematical models
and the system design is presented in chapter 5.
A case study, in which a developed tool is used to calculate the various engineering
variables, is performed in chapter 6, including an overview on the climate of the chosen
location, in addition to the system requirements, which will be briefly mentioned to
possibly assess the nowadays market-product alternatives. A developed MS Excel-tool,
including visual basic macros, simulating the liquid/solid-transition with respect to the
load provided, is used to illustrate the difference between water and PCM as a thermal
storage.
15
3 Literature review
3.1 Literature survey
3.1.1 PV driven solar cooling researches and systems
As mentioned before the proposed system is a PV driven refrigeration system which
includes the PCM as latent heat storage (LHS). Other approaches for similar application
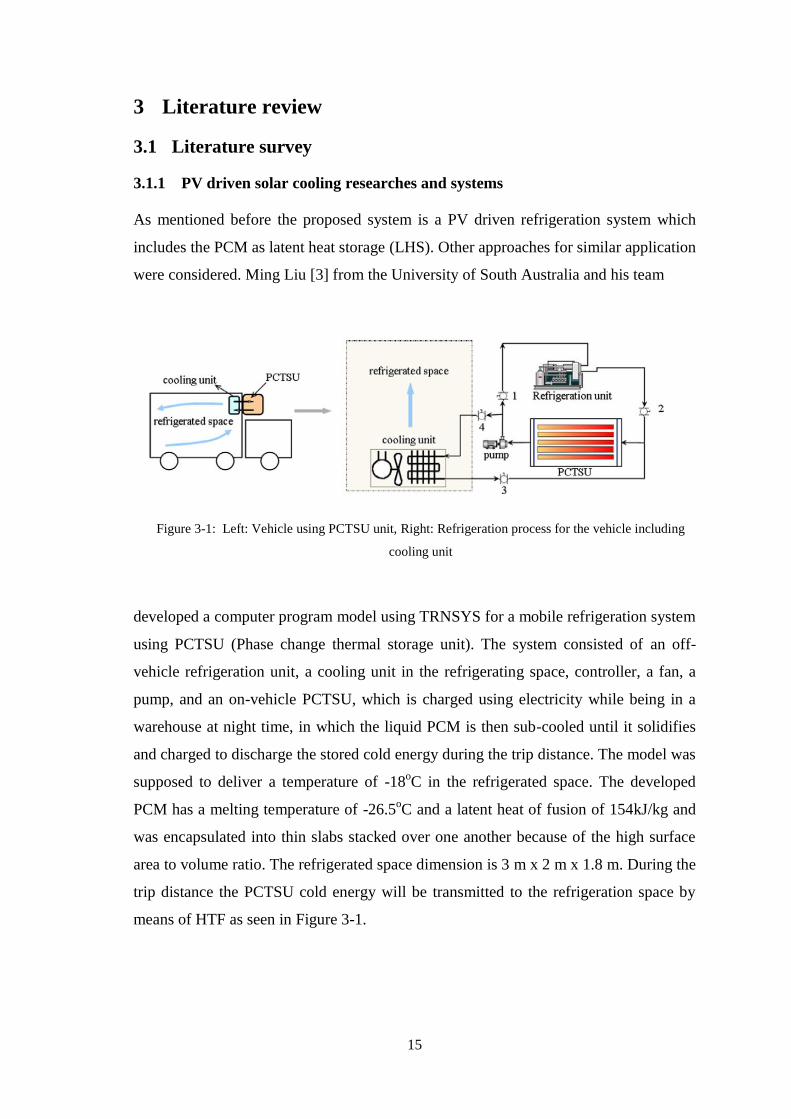
were considered. Ming Liu [3] from the University of South Australia and his team
developed a computer program model using TRNSYS for a mobile refrigeration system
using PCTSU (Phase change thermal storage unit). The system consisted of an off-
vehicle refrigeration unit, a cooling unit in the refrigerating space, controller, a fan, a
pump, and an on-vehicle PCTSU, which is charged using electricity while being in a
warehouse at night time, in which the liquid PCM is then sub-cooled until it solidifies
and charged to discharge the stored cold energy during the trip distance. The model was
supposed to deliver a temperature of -18oC in the refrigerated space. The developed
PCM has a melting temperature of -26.5oC and a latent heat of fusion of 154kJ/kg and
was encapsulated into thin slabs stacked over one another because of the high surface
area to volume ratio. The refrigerated space dimension is 3 m x 2 m x 1.8 m. During the
trip distance the PCTSU cold energy will be transmitted to the refrigeration space by
means of HTF as seen in Figure 3-1.
Figure 3-1: Left: Vehicle using PCTSU unit, Right: Refrigeration process for the vehicle including
cooling unit
16
It was expected that the charging process would take 8hrs during off-peak period (11:00
pm – 07:00 am) and to reach a temperature of -36°C by the end of the charging process.
The results were reported after being simulated on hourly basis for Adelaide, Australia,
which has a mild Mediterranean climate. The maximum cooling load without
considering any door openings during transportation was considered to be 23.0 MJ, and
the rated power for both pump and fan was 200 W (64W Pump, 184 W fan
respectively) including 20% safety factor requiring total of 250 kg of PCM operating
for 10hrs (09:00 – 19:00). The minimum load without any door opening through a trip
of 19.6 hrs was 518 W (270 W Transmission load, and 184+64 W losses). The
maximum load with 20 times door openings (one door opening takes 36 sec.) is 56.5
MJ requiring total of 390 kg of PCM requiring 30 min to reach -18oC after each door
opening. The maximum load with 20 door openings will require 18 slabs of dimension
1.6 x 0.5 2x 0.02 m, however the maximum load without door openings will require 12
PCM slabs with dimension 1.6 x 0.52 x 0.02 m [3].
In 2009 Francis Agyenim, Ian Knight, and Michael Rhodes [4] investigated a home-
scaled solar absorption cooling air-conditioning system. The system was built in
Cardiff University in UK as seen in. The system consisted of a 4.5 kW LiBr/H2O
absorption chiller, a vacuum tube solar collector and a 1000 l cold storage water tank. It
was reported at an average ambient temperature of 24 ° C, and chilled water
temperature was 7.4 ° C, the average thermal COP of the system was 0.58. It required
almost 180–250 liter of water to store 1 kW cooling capacity, which is an extreme
problem for application in desert areas and in areas where water is a scarce source. The
same problem was reported by other researches from Spain, India, and USA by Rosiek
et al., Chidambaram et al. and Ortiz et al., respectively. Utilization of a water storage
was a common problem; the volume of the water storage tank will be large because of
the small overall heat storage density of water, despite of its large specific heat
capacity. The volume of the storage tank could be reduced, when a LHS was used [5].
In UK in 1997 the first solar trailer was tested and investigated. Bahaj [6] has studied
the economics of a PV driven refrigeration trailer. The Solar-trailer PV array was
mounted on its roof (35 m2),
and it peak power output was 4.4 kWp charging a lead-
acid battery system of 28 kWh. The operating temperature of the storage varied
between 3°C and 7°C, and the average delivery time was defined to be 3.5 hrs. The DC
17
power required was reported to be 2.1 kWh in December, reaching 28 kWh in August.
The system was mainly developed in an attempt to replace a conventional diesel
refrigerated trailer powered by 2.25 liters. It was meant to eliminate the regular diesel
servicing costs including maintenance and diesel price which is rising with time and to
avoid the noise as well coming out from the diesel-trailer which enables flexibility in
delivery times to stores and residential areas. Bahaj assessed economically the PV
chilled delivery in comparison with cooling application powered by Diesel, and he
found that for two solar trailers, the payback time for PV refrigerated supermarket
trailer is 16.6 years with an interest rate of 5%.
Another similar case was tested in New Mexico, USA in 2000. Robert E. Foster & Luis
Estrada [7] investigated a battery free solar refrigerator. The refrigerator used a DC
compression chiller and had a microprocessor controller that enabled the maximum
power-point tracking (MPPT), and a variable speed DC compressor, avoiding the use of
an inverter. The battery free solar refrigerator depended mainly on ice for storage; this
is accomplished by using water-glycol as PCM into the insulated refrigerator unit. The
smallest PV module enabling the operation was 80 Wp, as a 60 Wp wasn’t able to start
the compressor. The units were designed by SOLUS Refrigeration Inc. (known today as
SunDanzer), based on the developments of the founder within the NASA advanced
refrigerator technology program, which was patented afterwards in 2002 [8, 9].
A feasibility study similar to Bahaj [6] was conducted by Bergeron [10] in 2001. It
focused on PV solar-powered refrigeration, which was used to transport chilled
deliveries. This study focused on three cities in the USA instead of UK. Bergeron
performed the study on a 16 m-long long-haul trailer. The door openings were limited
to maintain the refrigeration and the freezing temperature within the trailer to be (3°C)
and (-18°C) respectively. During summer (hot weather) the thermal load required to
freeze was expected to be almost 50% more than that required for refrigeration,
consequently the expected drop in COP was estimated by 50%. For this specific reason
this technology (Solar trailer) was not taken as an optimal option for operations that
require freezing. However Bergeron tried to propose some new
developments/modifications to his feasibility study in which he tried to decrease the
peak of the thermal load from 3131 W to 200 W by replacing 1 inch of Polyurethane
with vacuum panels. By increasing the areas of the heat exchangers, reviewing
18
candidate refrigerants, considering 2-stage compressors, and reducing the power of the
fan, the COP of the proposed Rankine-cycle was enhanced. By the time of the study the
most efficient available PV modules were covering the top of the trailer totaling a 5.7
Wp. The system was battery-free including a PCM as thermal energy storage. The
phase change material was NaCl aqueous eutectic solution. According to the climatic
data for the three chosen U.S. cities a 20-year-life cost analysis was demonstrated and
was used to compare between PV solar driven trailers and diesel refrigerated trailers. It
was obvious from the study that elimination of the auxiliary diesel power unit was not
proven to be as valuable as expected since most of the cost shares were operating costs.
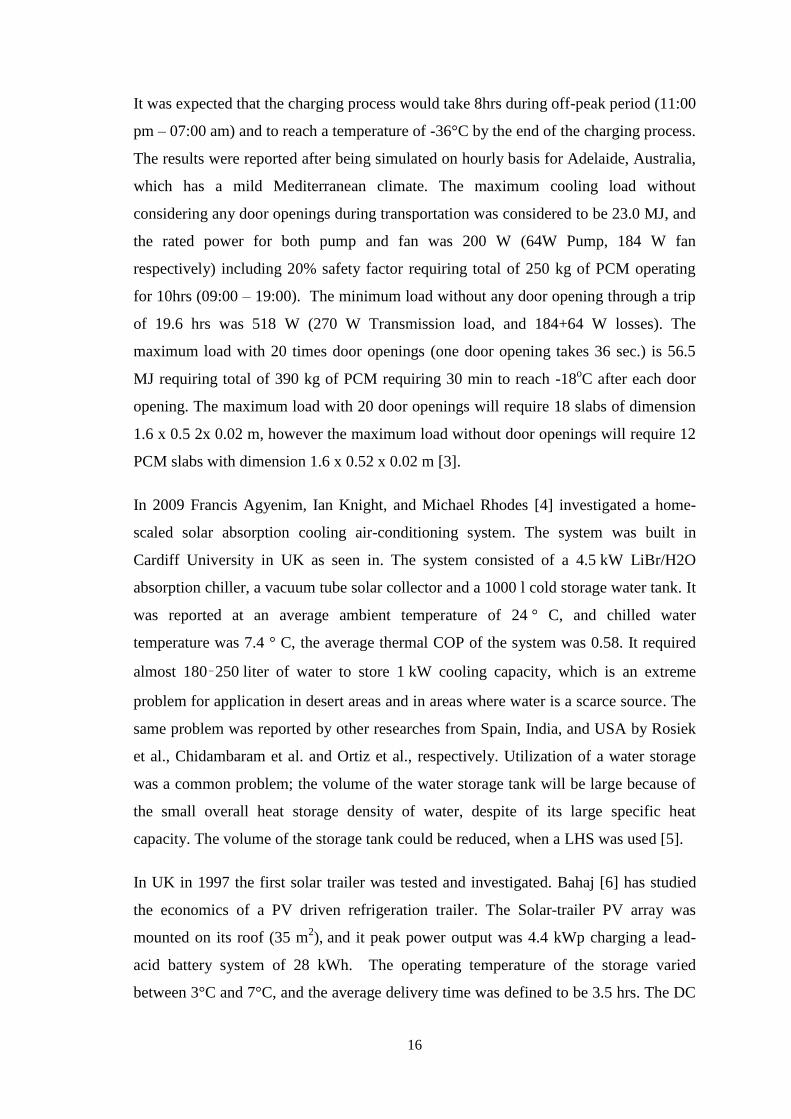
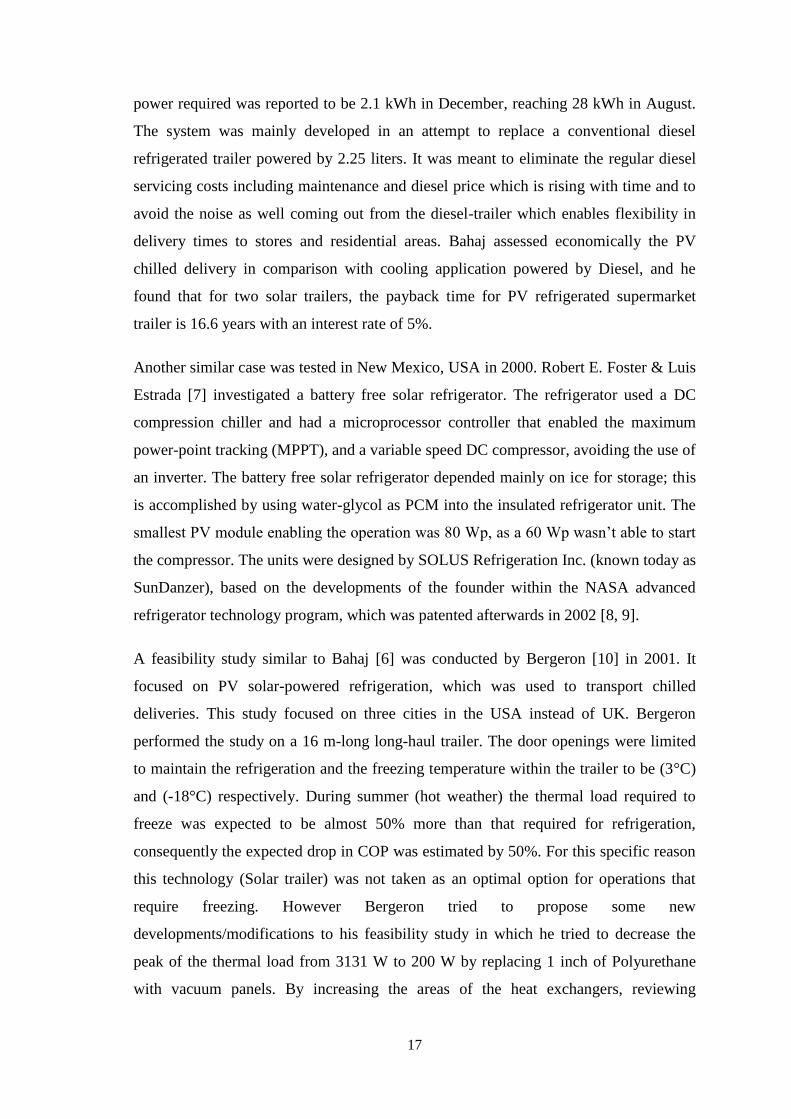
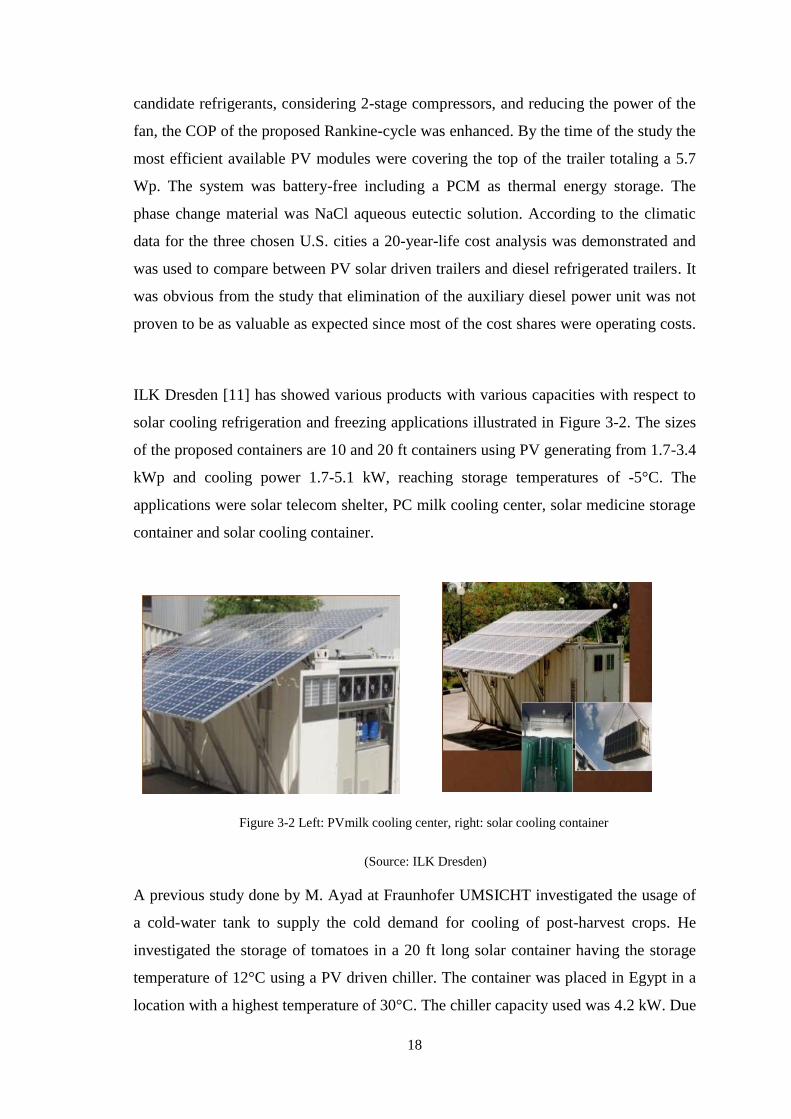
ILK Dresden [11] has showed various products with various capacities with respect to
solar cooling refrigeration and freezing applications illustrated in Figure 3-2. The sizes
of the proposed containers are 10 and 20 ft containers using PV generating from 1.7-3.4
kWp and cooling power 1.7-5.1 kW, reaching storage temperatures of -5°C. The
applications were solar telecom shelter, PC milk cooling center, solar medicine storage
container and solar cooling container.
A previous study done by M. Ayad at Fraunhofer UMSICHT investigated the usage of
a cold-water tank to supply the cold demand for cooling of post-harvest crops. He
investigated the storage of tomatoes in a 20 ft long solar container having the storage
temperature of 12°C using a PV driven chiller. The container was placed in Egypt in a
location with a highest temperature of 30°C. The chiller capacity used was 4.2 kW. Due
Figure 3-2 Left: PVmilk cooling center, right: solar cooling container
(Source: ILK Dresden)
19
to the high temperature difference between ambient and chiller temperature
(evaporator, 1.7oC) the COP of the proposed system was 2.54. The system used
batteries of capacity 1.2 kWh and a Diesel generator of 2 kW to supply the uncovered
load and was intended for emergencies as well. For supplying a load of 9998 kWh
annually with specific loading and unloading scenarios the study required a cold-water
tank volume of 3 m3. This has resulted in having a solar fraction of 98.9% with total of
96.4 hours uncovered by the sun, which made the need of a back-up Diesel unit
indispensable.
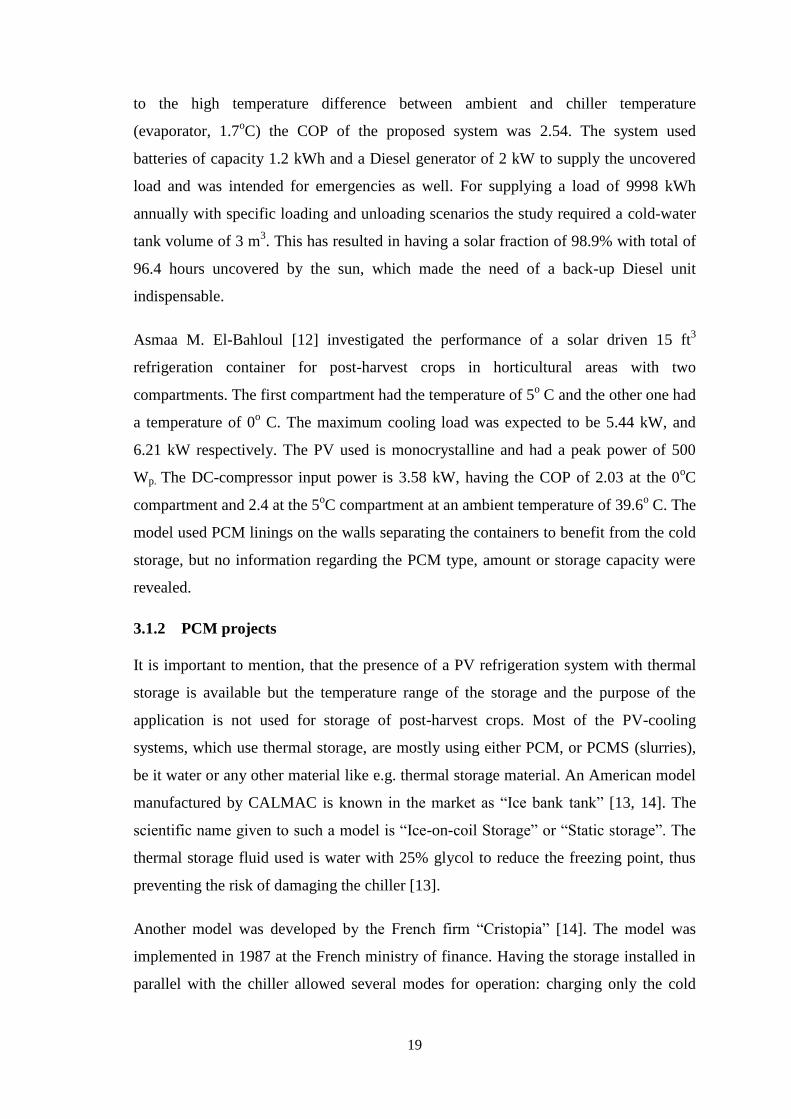
Asmaa M. El-Bahloul [12] investigated the performance of a solar driven 15 ft3
refrigeration container for post-harvest crops in horticultural areas with two
compartments. The first compartment had the temperature of 5o C and the other one had
a temperature of 0o C. The maximum cooling load was expected to be 5.44 kW, and
6.21 kW respectively. The PV used is monocrystalline and had a peak power of 500
Wp. The DC-compressor input power is 3.58 kW, having the COP of 2.03 at the 0oC
compartment and 2.4 at the 5oC compartment at an ambient temperature of 39.6
o C. The
model used PCM linings on the walls separating the containers to benefit from the cold
storage, but no information regarding the PCM type, amount or storage capacity were
revealed.
3.1.2 PCM projects
It is important to mention, that the presence of a PV refrigeration system with thermal
storage is available but the temperature range of the storage and the purpose of the
application is not used for storage of post-harvest crops. Most of the PV-cooling
systems, which use thermal storage, are mostly using either PCM, or PCMS (slurries),
be it water or any other material like e.g. thermal storage material. An American model
manufactured by CALMAC is known in the market as “Ice bank tank” [13, 14]. The
scientific name given to such a model is “Ice-on-coil Storage” or “Static storage”. The
thermal storage fluid used is water with 25% glycol to reduce the freezing point, thus
preventing the risk of damaging the chiller [13].
Another model was developed by the French firm “Cristopia” [14]. The model was
implemented in 1987 at the French ministry of finance. Having the storage installed in
parallel with the chiller allowed several modes for operation: charging only the cold
20
storage unit which is named “STL”, cooling using the chiller only, and cooling with the
chiller supported from the storage unit.
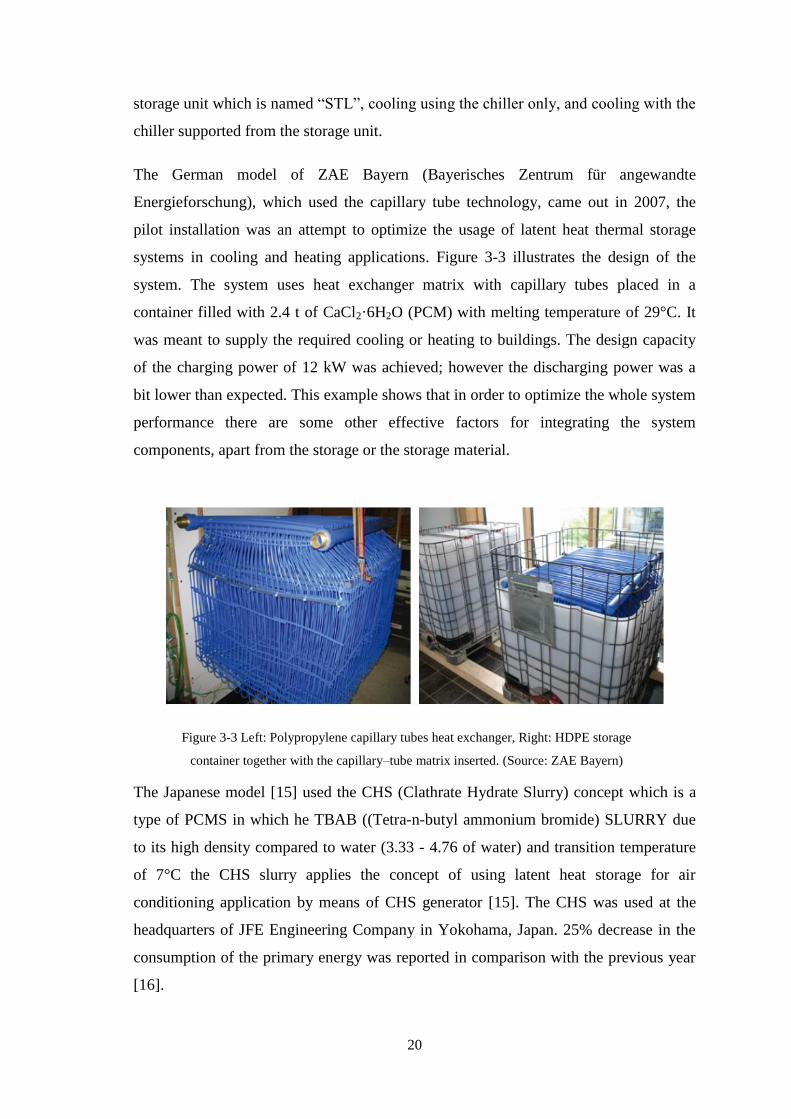
The German model of ZAE Bayern (Bayerisches Zentrum für angewandte
Energieforschung), which used the capillary tube technology, came out in 2007, the
pilot installation was an attempt to optimize the usage of latent heat thermal storage
systems in cooling and heating applications. Figure 3-3 illustrates the design of the
system. The system uses heat exchanger matrix with capillary tubes placed in a
container filled with 2.4 t of CaCl2·6H2O (PCM) with melting temperature of 29°C. It
was meant to supply the required cooling or heating to buildings. The design capacity
of the charging power of 12 kW was achieved; however the discharging power was a
bit lower than expected. This example shows that in order to optimize the whole system
performance there are some other effective factors for integrating the system
components, apart from the storage or the storage material.
The Japanese model [15] used the CHS (Clathrate Hydrate Slurry) concept which is a
type of PCMS in which he TBAB ((Tetra-n-butyl ammonium bromide) SLURRY due
to its high density compared to water (3.33 - 4.76 of water) and transition temperature
of 7°C the CHS slurry applies the concept of using latent heat storage for air
conditioning application by means of CHS generator [15]. The CHS was used at the
headquarters of JFE Engineering Company in Yokohama, Japan. 25% decrease in the
consumption of the primary energy was reported in comparison with the previous year
[16].
Figure 3-3 Left: Polypropylene capillary tubes heat exchanger, Right: HDPE storage
container together with the capillary–tube matrix inserted. (Source: ZAE Bayern)
21
3.2 System design for precooling of crops
Precaution of the system design depends mainly on the type of pre-cooling. For
example, in case of forced air pre-cooling, as the actual case focuses on forced air pre-
cooling- precautions taken are mainly aiming to minimize the water loss in the produce,
as a refrigeration system dehumidifies cold-room air as a result of condensation of the
water vapor on the evaporator coil. As a result of condensation the relative humidity
will be lowered in the room, which will increase the water vapor pressure deficit
between the air in the surrounding and the produce. In order to compensate that deficit,
the product loses moisture to the air to minimize the water loss during cooling and
storage. It is recommended to remove the product from the forced-air pre-cooler once a
cooling of 7/8 or 15/16 1is achieved [17]. This applies to the other pre-cooling types i.e.
Hydro-cooling, Vacuum cooling, Package icing, and Room cooling. But since this
study is focusing only on forced air-cooling, the precautions of the used technique are
discussed.
As for the produce there are as well some precautions to be considered while designing
the system. The produce should promptly be cooled down to the lowest possible
temperature to preserve its properties. Lowest possible temperature is almost a 0.5 to
almost 1°C above the freezing point of that produce. The gas releases and
transformation of some fruits and vegetables at low temperature has to be considered as
well [2]. There are some environmental factors that might cause disorder. These
environmental factors depend on the temperature, and the O2 and CO2 levels. “Low
Temperature and High Temperature injuries” is the process in which the tissues of the
produce is simply exposed to high temperature resulting in damaging the crops, or very
low temperatures below their freezing temperature, which will injury the produce. As
for the second factor the O2 and CO2 level it is recommended to keep the CO2 as low as
possible and O2 in the desired level for the stored kind of vegetables and/or fruits [1].
Another important item is the low temperature cooling of the harvested crops. Storage
requirement for fruits and vegetables is shown in appendix A for further information.
When cooling the crops down to temperatures below their freezing point, ice crystals
are formed. At low cooling rate these crystals will continue to grow which will affect
1 7/8 and 15/16 from 100% cooling and will help to estimate the cooling time [17]
22
the produce quality. This is a reason why this study is only concerned about pre-cooling
and cold storage of the produce, but not freezing [2]. Moreover the minimization of the
loss of moisture of the stored produce is recommended. Loosing moisture will result in
lowering the product quality, which will definitely affect its economical value. The
moisture-loss rate varies from a crop to another; the best way to minimize the moisture
loss is keeping the crops at the appropriate conditions of air temperature, relative
humidity and circulation air velocity. The Circulation of the air is essential to limit the
change in temperature in the storage room/tank [2]. On the other hand and apart from
the storage conditions, some methods like skin coating and moisture-proof films such
as waxing are used in order to reduce the transpiration and extend the life-time of the
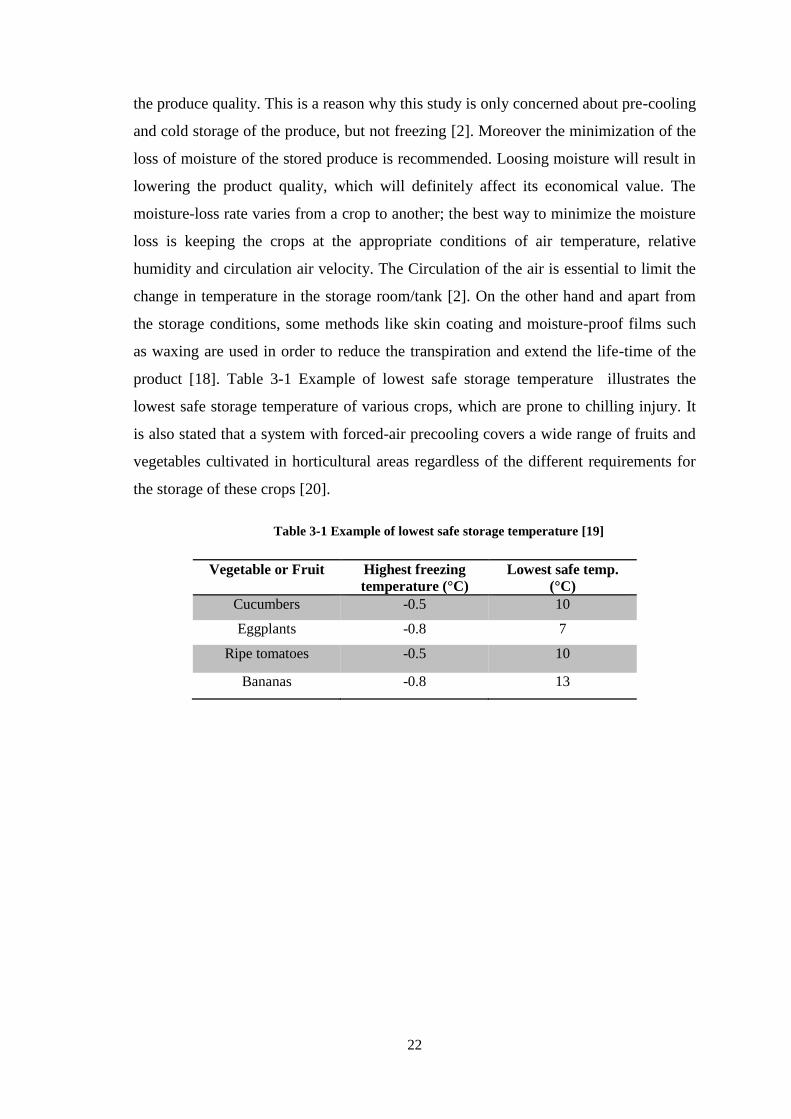
product [18]. Table 3-1 Example of lowest safe storage temperature illustrates the
lowest safe storage temperature of various crops, which are prone to chilling injury. It
is also stated that a system with forced-air precooling covers a wide range of fruits and
vegetables cultivated in horticultural areas regardless of the different requirements for
the storage of these crops [20].
Table 3-1 Example of lowest safe storage temperature [19]
Vegetable or Fruit Highest freezing
temperature (°C)
Lowest safe temp.
(°C)
Cucumbers -0.5 10
Eggplants -0.8 7
Ripe tomatoes -0.5 10
Bananas -0.8 13
23
3.3 Energy storage systems
3.3.1 Batteries
A Battery was first invented by Luigi Calvin in 1791, and has been an open research
field up till today. Nowadays there are many kinds of batteries, depending on the type
of the application and its requirements.
A battery/accumulator is an electro-chemical device converting chemical energy into
electrical energy and vice-versa. The chemical energy contained in its active material is
transformed to electrical energy by means of oxidation-reduction reactions (redox). The
main use of a battery is to store energy to be used later when the normal energy source
is no longer supplying the application (discharge). This study will mainly consider PV
system solar rechargeable batteries. For the PV systems the batteries are used as back
up in a stand-alone solar (PV) system supplying the load during the non-sunshine
period. Batteries optimize the use of PV source; however despite its importance in the
PV system it is also very expensive. The share of the batteries in the total PV system
cost is almost 20-40%, besides the regular maintenance [21].
For most of the applications requiring long-time battery supply like i.e. PV applications
a “deep discharge battery” is required, for which the allowable depth of charge (DOD)
should be 80% or more [21]. For designing a PV system not only the DOD has to be
taken into consideration, but also the battery lifetime, represented by the number of
complete charge-discharge cycles before the nominal capacity drops below 80% of its
initial rated capacity. Another factor is the discharge/charge rate (C-rating), which is
the charge or discharge rate represented by the capacity of the battery over the full
hours to charge or discharge. Also an important factor is the self-discharge rate. This
factor refers to the loss in electrical capacity when the battery is not used.
There are also some factors affecting the battery performance, like voltage level,
discharge current, and temperature during discharge. Definitely when considering all
the pre-mentioned aspects, the use of the batteries will be more efficient which means
that the efficiency of the designed PV system will improve [21].
24
3.3.2 Thermal energy storage (TES) - Latent heat storage
From the various principles and technologies of energy storage this study will
concentrate on thermal energy storage. Thermal energy storage can be called heat or
cold storage, when it simply allows the preservation or storage of heat or cold to be
utilized afterwards when the providing source is off, and the storage method has to be
reversible. This study is focused more on the physical process for thermal energy
storage, which are either “sensible heat” or “latent heat”, depending on the application
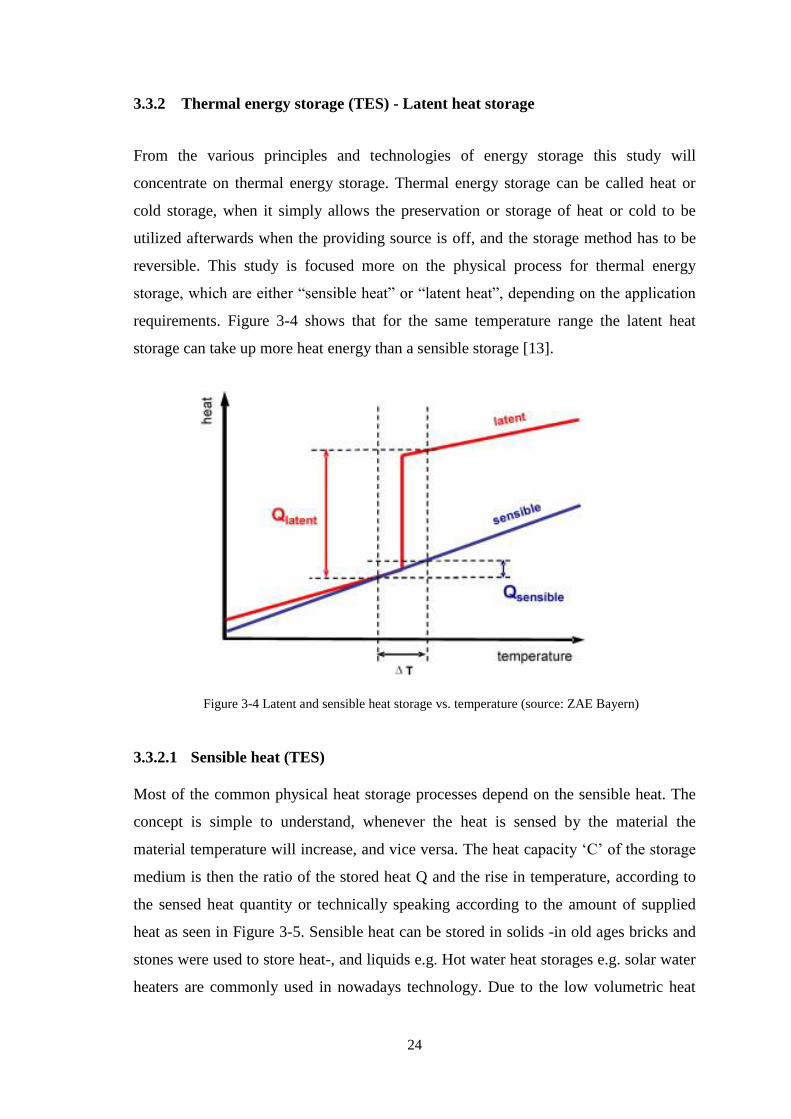
requirements. Figure 3-4 shows that for the same temperature range the latent heat
storage can take up more heat energy than a sensible storage [13].
3.3.2.1 Sensible heat (TES)
Most of the common physical heat storage processes depend on the sensible heat. The
concept is simple to understand, whenever the heat is sensed by the material the
material temperature will increase, and vice versa. The heat capacity ‘C’ of the storage
medium is then the ratio of the stored heat Q and the rise in temperature, according to
the sensed heat quantity or technically speaking according to the amount of supplied
heat as seen in Figure 3-5. Sensible heat can be stored in solids -in old ages bricks and
stones were used to store heat-, and liquids e.g. Hot water heat storages e.g. solar water
heaters are commonly used in nowadays technology. Due to the low volumetric heat
Figure 3-4 Latent and sensible heat storage vs. temperature (source: ZAE Bayern)
25
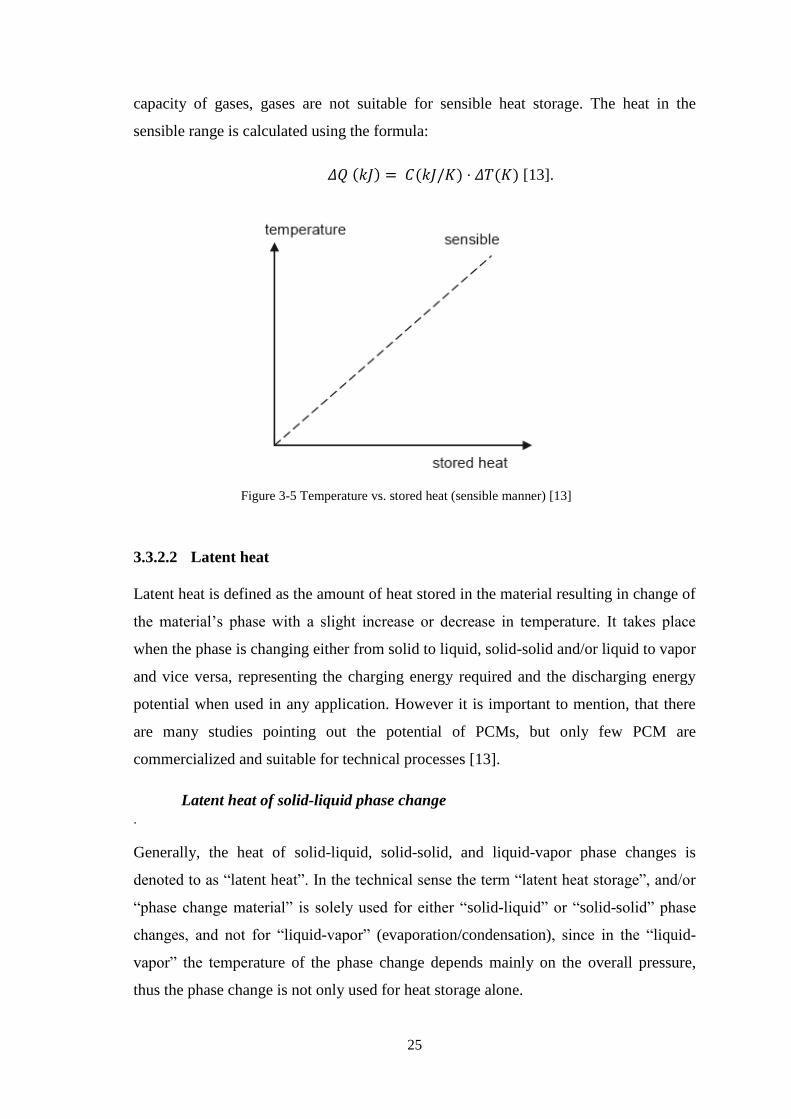
capacity of gases, gases are not suitable for sensible heat storage. The heat in the
sensible range is calculated using the formula:
𝛥𝑄 (𝑘𝐽) = 𝐶(𝑘𝐽/𝐾) ⋅ 𝛥𝑇(𝐾) [13].
3.3.2.2 Latent heat
Latent heat is defined as the amount of heat stored in the material resulting in change of
the material’s phase with a slight increase or decrease in temperature. It takes place
when the phase is changing either from solid to liquid, solid-solid and/or liquid to vapor
and vice versa, representing the charging energy required and the discharging energy
potential when used in any application. However it is important to mention, that there
are many studies pointing out the potential of PCMs, but only few PCM are
commercialized and suitable for technical processes [13].
Latent heat of solid-liquid phase change
.
Generally, the heat of solid-liquid, solid-solid, and liquid-vapor phase changes is
denoted to as “latent heat”. In the technical sense the term “latent heat storage”, and/or
“phase change material” is solely used for either “solid-liquid” or “solid-solid” phase
changes, and not for “liquid-vapor” (evaporation/condensation), since in the “liquid-
vapor” the temperature of the phase change depends mainly on the overall pressure,
thus the phase change is not only used for heat storage alone.
Figure 3-5 Temperature vs. stored heat (sensible manner) [13]
26
The solid-liquid phase change is the commonly used type of PCM because the phase
change solid-liquid (melting) or liquid-solid (solidification) is characterized by its high
heat capacity per unit volume and can store large amounts of heat or cold when the
suitable material is selected. During phase change a change in density may be expected:
while melting paraffin shows an increase of almost 10% in the material’s volume, ice
shows a volume reduction when melting to water. Even during melting, and while the
material phase is transforming i.e. from solid to liquid, the material will keep its
temperature constant at a certain point known as “melting temperature” or “phase
change temperature.
Water and PCM as latent heat storage (lhs)
No controversy that the best-known PCM (lhs) is water. Water is used also as a sensible
heat storage and latent heat storage since ages to store cold. However nowadays it is
very common to find applications depending on water as a cold storage unit. In the
previous study, which was done at Fraunhofer UMSICHT, 3m³ water tank storage was
investigated for the cooling container.
Additives might be added to change the properties of water or to change the phase
change temperature to meet the requirements of a certain application. As well cooling
by means of natural ice and snow is considered as a state of the art. There are some
PCM materials depending on water as water salt solution or mixtures of water and other
compounds or even materials. These mixtures are known as salt hydrates, which mainly
salts are mixed with water. The use of the material class depends on the main
requirements of a specific application, i.e. melting enthalpy and phase change
temperature. More is illustrated in Figure 3-6 showing various possible PCM classes
with respect to their melting temperature.
27
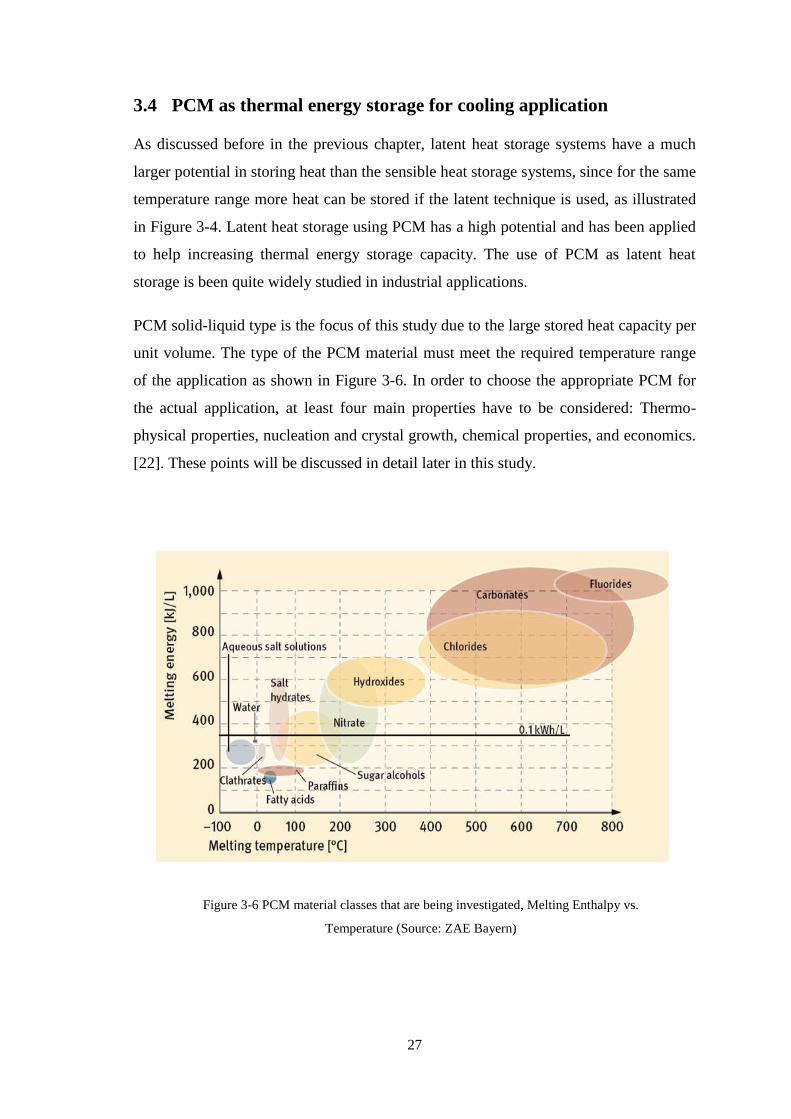
3.4 PCM as thermal energy storage for cooling application
As discussed before in the previous chapter, latent heat storage systems have a much
larger potential in storing heat than the sensible heat storage systems, since for the same
temperature range more heat can be stored if the latent technique is used, as illustrated
in Figure 3-4. Latent heat storage using PCM has a high potential and has been applied
to help increasing thermal energy storage capacity. The use of PCM as latent heat
storage is been quite widely studied in industrial applications.
PCM solid-liquid type is the focus of this study due to the large stored heat capacity per
unit volume. The type of the PCM material must meet the required temperature range
of the application as shown in Figure 3-6. In order to choose the appropriate PCM for
the actual application, at least four main properties have to be considered: Thermo-
physical properties, nucleation and crystal growth, chemical properties, and economics.
[22]. These points will be discussed in detail later in this study.
Figure 3-6 PCM material classes that are being investigated, Melting Enthalpy vs.
Temperature (Source: ZAE Bayern)
28
3.4.1 Phase change materials
Phase change materials can be classified mainly into organic and inorganic PCMs. The
melting temperature range covered by the inorganic materials is much larger than that
covered by the organic materials. Inorganics are characterized by their high density;
however they often show corrosive behavior when used with metals.
3.4.1.1 Inorganic PCMs
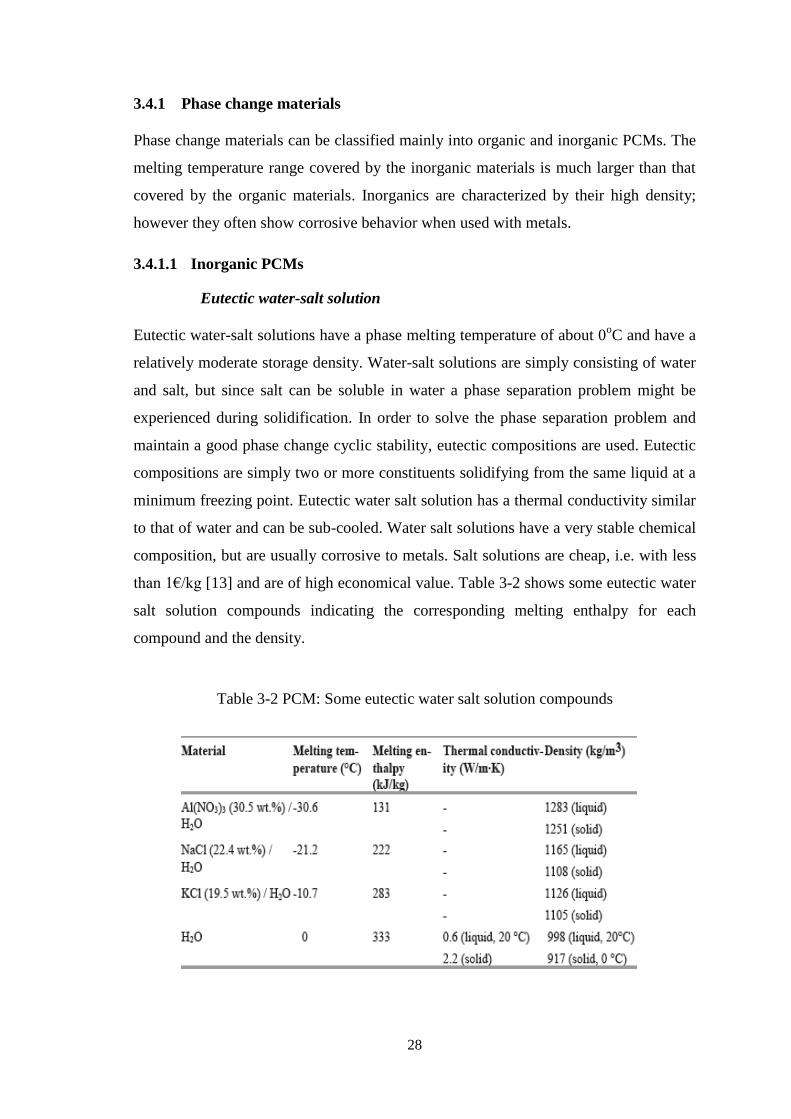
Eutectic water-salt solution
Eutectic water-salt solutions have a phase melting temperature of about 0oC and have a
relatively moderate storage density. Water-salt solutions are simply consisting of water
and salt, but since salt can be soluble in water a phase separation problem might be
experienced during solidification. In order to solve the phase separation problem and
maintain a good phase change cyclic stability, eutectic compositions are used. Eutectic
compositions are simply two or more constituents solidifying from the same liquid at a
minimum freezing point. Eutectic water salt solution has a thermal conductivity similar
to that of water and can be sub-cooled. Water salt solutions have a very stable chemical
composition, but are usually corrosive to metals. Salt solutions are cheap, i.e. with less
than 1€/kg [13] and are of high economical value. Table 3-2 shows some eutectic water
salt solution compounds indicating the corresponding melting enthalpy for each
compound and the density.
Table 3-2 PCM: Some eutectic water salt solution compounds
29
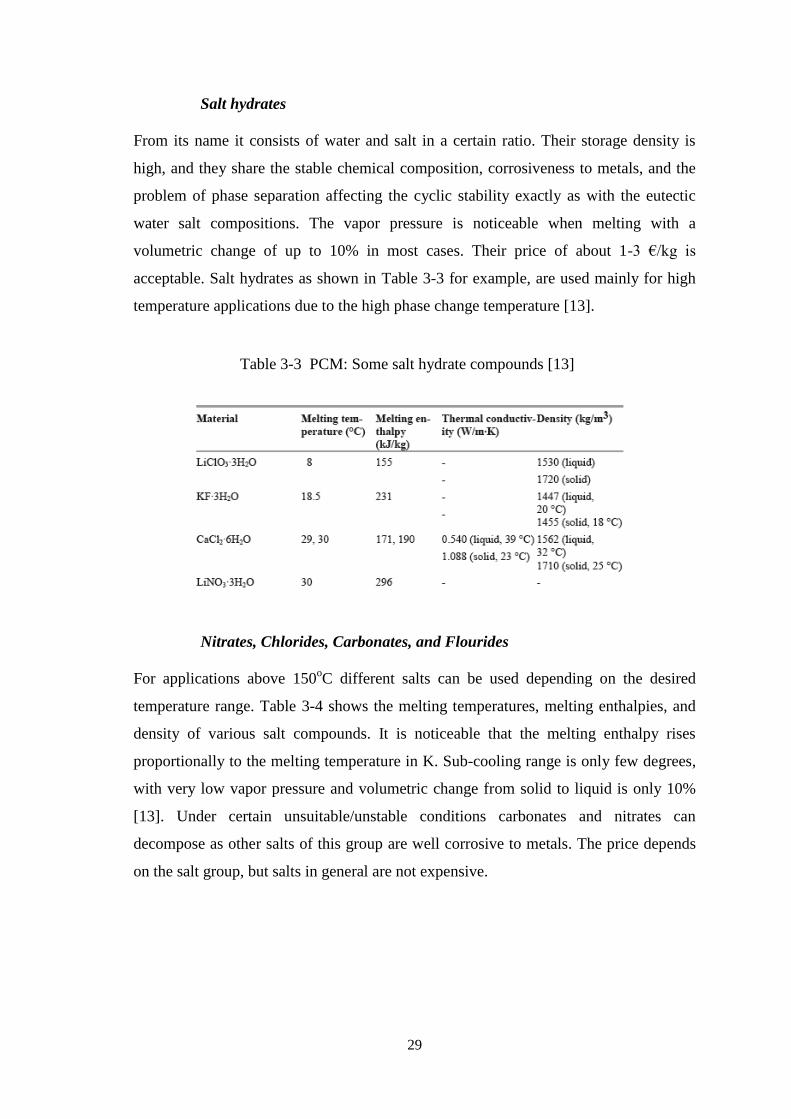
Salt hydrates
From its name it consists of water and salt in a certain ratio. Their storage density is
high, and they share the stable chemical composition, corrosiveness to metals, and the
problem of phase separation affecting the cyclic stability exactly as with the eutectic
water salt compositions. The vapor pressure is noticeable when melting with a
volumetric change of up to 10% in most cases. Their price of about 1-3 €/kg is
acceptable. Salt hydrates as shown in Table 3-3 for example, are used mainly for high
temperature applications due to the high phase change temperature [13].
Nitrates, Chlorides, Carbonates, and Flourides
For applications above 150oC different salts can be used depending on the desired
temperature range. Table 3-4 shows the melting temperatures, melting enthalpies, and
density of various salt compounds. It is noticeable that the melting enthalpy rises
proportionally to the melting temperature in K. Sub-cooling range is only few degrees,
with very low vapor pressure and volumetric change from solid to liquid is only 10%
[13]. Under certain unsuitable/unstable conditions carbonates and nitrates can
decompose as other salts of this group are well corrosive to metals. The price depends
on the salt group, but salts in general are not expensive.
Table 3-3 PCM: Some salt hydrate compounds [13]
30
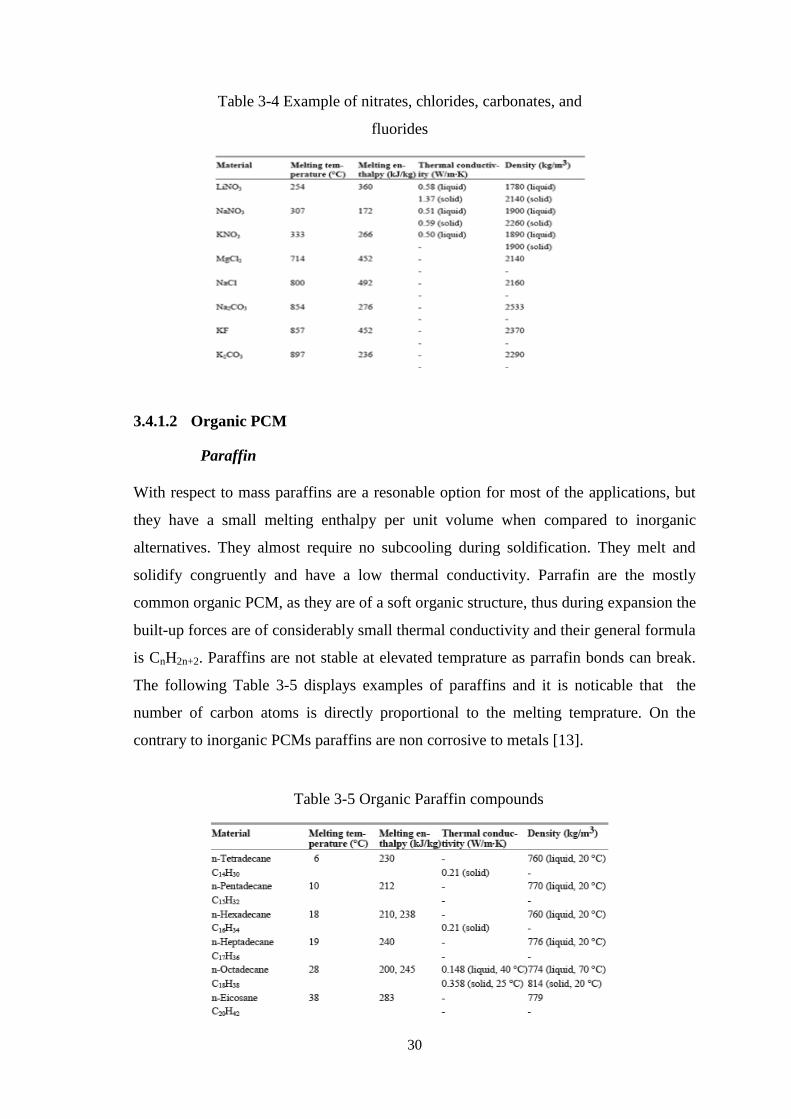
3.4.1.2 Organic PCM
Paraffin
With respect to mass paraffins are a resonable option for most of the applications, but
they have a small melting enthalpy per unit volume when compared to inorganic
alternatives. They almost require no subcooling during soldification. They melt and
solidify congruently and have a low thermal conductivity. Parrafin are the mostly
common organic PCM, as they are of a soft organic structure, thus during expansion the
built-up forces are of considerably small thermal conductivity and their general formula
is CnH2n+2. Paraffins are not stable at elevated temprature as parrafin bonds can break.
The following Table 3-5 displays examples of paraffins and it is noticable that the
number of carbon atoms is directly proportional to the melting temprature. On the
contrary to inorganic PCMs paraffins are non corrosive to metals [13].
Table 3-4 Example of nitrates, chlorides, carbonates, and
fluorides
Table 3-5 Organic Paraffin compounds
sample
31
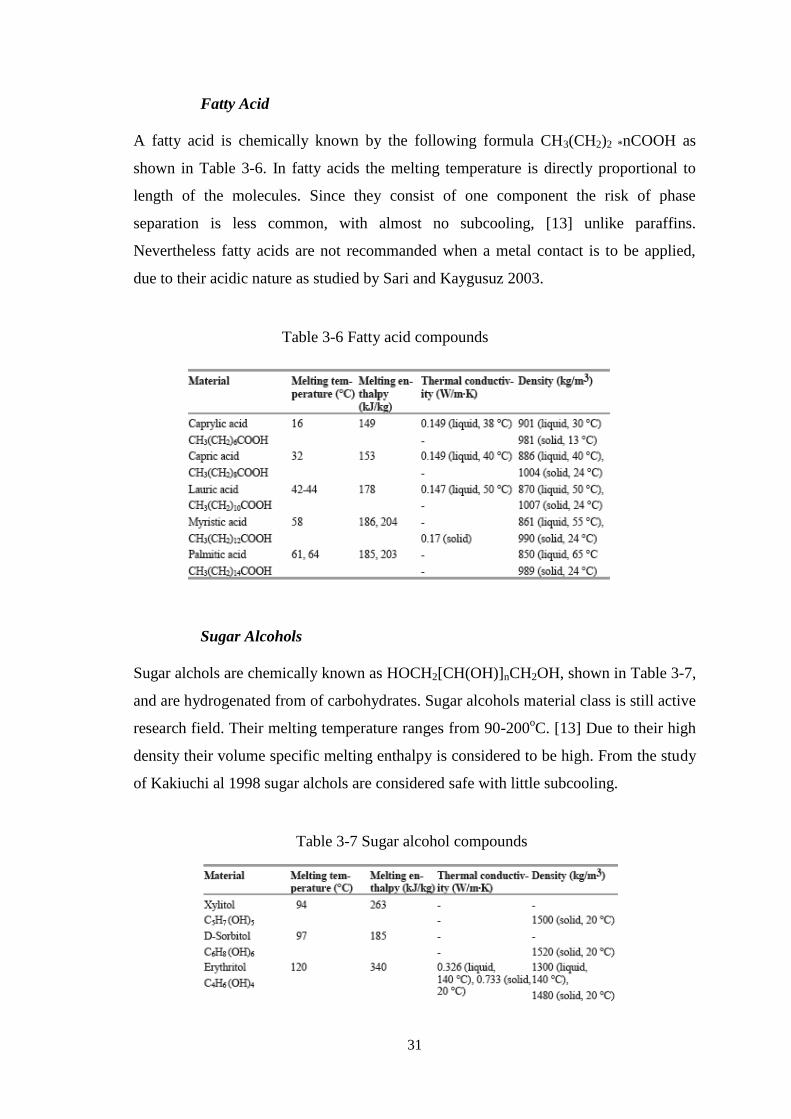
Fatty Acid
A fatty acid is chemically known by the following formula CH3(CH2)2 *nCOOH as
shown in Table 3-6. In fatty acids the melting temperature is directly proportional to
length of the molecules. Since they consist of one component the risk of phase
separation is less common, with almost no subcooling, [13] unlike paraffins.
Nevertheless fatty acids are not recommanded when a metal contact is to be applied,
due to their acidic nature as studied by Sari and Kaygusuz 2003.
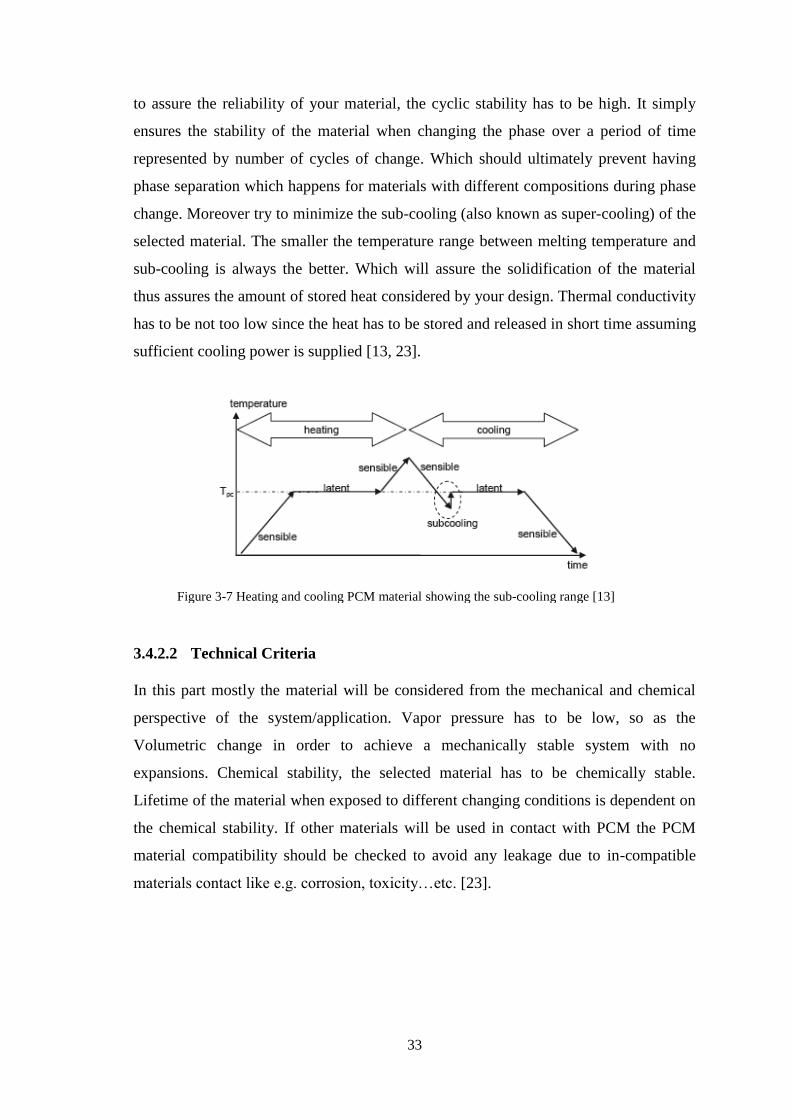
Sugar Alcohols
Sugar alchols are chemically known as HOCH2[CH(OH)]nCH2OH, shown in Table 3-7,
and are hydrogenated from of carbohydrates. Sugar alcohols material class is still active
research field. Their melting temperature ranges from 90-200oC. [13] Due to their high
density their volume specific melting enthalpy is considered to be high. From the study
of Kakiuchi al 1998 sugar alchols are considered safe with little subcooling.
Table 3-6 Fatty acid compounds
Table 3-7 Sugar alcohol compounds

32
3.4.2 PCM Selection
It is obvious from the properties stated in the previous section that PCM is application
dependent. It was mentioned previously, that the main two important properties for any
PCM are the phase change temperature as shown in “Appendix B”, and the melting
enthalpy (Solid-liquid case). But still there are some other factors, which have to be
taken into consideration when selecting a PCM material. The family groups of organic
and inorganic PCMs indicate the main PCM classes from which the material that best
fit the specific application will be selected.
After indicating the material classes there are some other properties to be determined in
order to ease the selection process, which will be discussed in details in this chapter.
Table 3-8 will help us to understand the main differences between the main classes of
PCM (organic/Inorganic).
Table 3-8 Organic and Inorganic PCM comparison
Organic Inorganic
Advantages
Little or almost no super-cooling
(sub-cooling)
Considerably high volumetric heat
storage capacity
No phase segregation High thermal conductivity
Chemically stable Available/abundant at low cost
Safe and non-reactive specially when
used to metals (Except fatty acid)
Non flammable
Recyclable Sharp melting point
Disadvantage
Low thermal conductivity Required Super-cooling (Sub-cooling)
Low volumetric heat storage capacity Nucleating agents are needed
Flammable
After identifying the class of your PCM if it is organic or inorganic, the following 3
main criteria have to be checked as well to ensure, that the selected material best
matches the corresponding application.
3.4.2.1 Physical Criteria
It is important that the phase change temperature of your chosen PCM matches your
application. For this temperature range it is important as well to choose the highest heat
storage capacity or phase change enthalpy in order to minimize the mass and/or the
volume of the used material. One of the most important factors is the cycling stability,
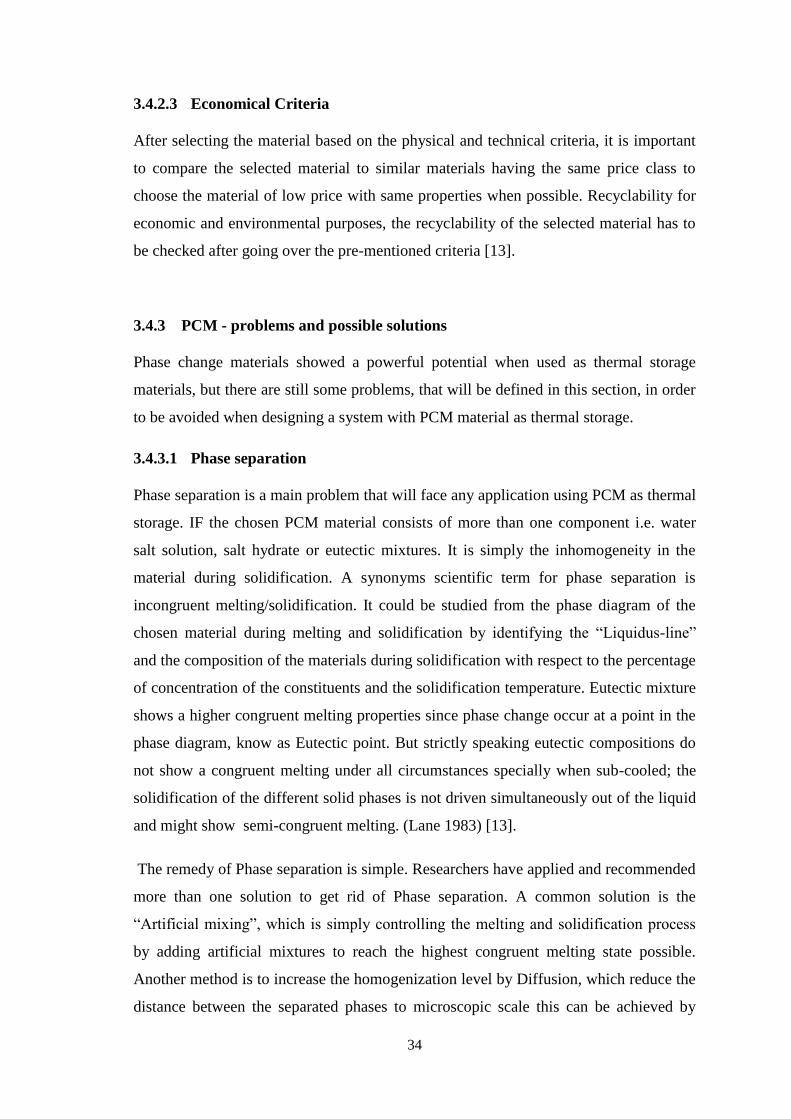
33
to assure the reliability of your material, the cyclic stability has to be high. It simply
ensures the stability of the material when changing the phase over a period of time
represented by number of cycles of change. Which should ultimately prevent having
phase separation which happens for materials with different compositions during phase
change. Moreover try to minimize the sub-cooling (also known as super-cooling) of the
selected material. The smaller the temperature range between melting temperature and
sub-cooling is always the better. Which will assure the solidification of the material
thus assures the amount of stored heat considered by your design. Thermal conductivity
has to be not too low since the heat has to be stored and released in short time assuming
sufficient cooling power is supplied [13, 23].
3.4.2.2 Technical Criteria
In this part mostly the material will be considered from the mechanical and chemical
perspective of the system/application. Vapor pressure has to be low, so as the
Volumetric change in order to achieve a mechanically stable system with no
expansions. Chemical stability, the selected material has to be chemically stable.
Lifetime of the material when exposed to different changing conditions is dependent on
the chemical stability. If other materials will be used in contact with PCM the PCM
material compatibility should be checked to avoid any leakage due to in-compatible
materials contact like e.g. corrosion, toxicity…etc. [23].
Figure 3-7 Heating and cooling PCM material showing the sub-cooling range [13]
34
3.4.2.3 Economical Criteria
After selecting the material based on the physical and technical criteria, it is important
to compare the selected material to similar materials having the same price class to
choose the material of low price with same properties when possible. Recyclability for
economic and environmental purposes, the recyclability of the selected material has to
be checked after going over the pre-mentioned criteria [13].
3.4.3 PCM - problems and possible solutions
Phase change materials showed a powerful potential when used as thermal storage
materials, but there are still some problems, that will be defined in this section, in order
to be avoided when designing a system with PCM material as thermal storage.
3.4.3.1 Phase separation
Phase separation is a main problem that will face any application using PCM as thermal
storage. IF the chosen PCM material consists of more than one component i.e. water
salt solution, salt hydrate or eutectic mixtures. It is simply the inhomogeneity in the
material during solidification. A synonyms scientific term for phase separation is
incongruent melting/solidification. It could be studied from the phase diagram of the
chosen material during melting and solidification by identifying the “Liquidus-line”
and the composition of the materials during solidification with respect to the percentage
of concentration of the constituents and the solidification temperature. Eutectic mixture
shows a higher congruent melting properties since phase change occur at a point in the
phase diagram, know as Eutectic point. But strictly speaking eutectic compositions do
not show a congruent melting under all circumstances specially when sub-cooled; the
solidification of the different solid phases is not driven simultaneously out of the liquid
and might show semi-congruent melting. (Lane 1983) [13].
The remedy of Phase separation is simple. Researchers have applied and recommended
more than one solution to get rid of Phase separation. A common solution is the
“Artificial mixing”, which is simply controlling the melting and solidification process
by adding artificial mixtures to reach the highest congruent melting state possible.
Another method is to increase the homogenization level by Diffusion, which reduce the
distance between the separated phases to microscopic scale this can be achieved by
35
gelling and the gel can be formed using polymers. A similar idea to gelling is
thickening, in which the viscosity of the material is increased, thus different phases
cannot separate far away until the whole PCM becomes solid [13].
3.4.3.2 Sub-cooling
When using a PCM for cooling application, many PCMs will not store the latent heat
absorbed during solidification even when its phase change temperature is reached. It
will only start storing the cold when the temperature is slightly below its melting
temperature and crystallization is initiated. This is known as sub-cooling or super-
cooling. Incase of no sub-cooling the material will only store and release sensible heat
energy, in other words the nucleation process of form the solid nucleus in the material
has to be completely accomplished. There are two types of nucleation, a- Homogeneous
nucleation, which is caused by the PCM itself, b- Heterogeneous nucleation, which is
caused by addition of nucleating additives, which introduced a way to get rid or to
minimize the sub-cooling in the PCM, which is adding nucleators to cause
heterogeneous nucleation.
3.4.3.3 Mechanical stability, Leakage and Heat transfer
Most of the cases (Liquid-solid phase) the PCM might experience leakage or a bulk
mass is used, which result in slow heat transfer between the PCM and the environment.
The best way to contract such a problem is to encapsulate the material. In general the
design and the shape of the used PCM depend on the application. There is no standard
form for the PCM to be shaped in; however there are some used forms that enhance the
operational properties of the PCM. For instance, to prevent the leakage of PCM, the
PCM can be encapsulated. For features thermal conductivity and mechanical
enhancements the PCM can be composited with other materials. This part focuses on
the yet found forms of PCM.
Encapsulated PCM
Encapsulation is another effective way for improving the PCM heat conduction
properties. Encapsulation might be macro-encapsulatiuon, micro-encapsulation or even
Nano-encapsulation. The technique used to produce such producets is heterogeneuos
polymerization e.g. dispersion polymerization, emulsion polymerization,
36
microemulsion polymerization, or miniemulsion polymerization. The shell material
differs as the appliation differs [13].
Composite PCM
Mixtures of binary and multiple materials with PCM are composited together to obtain
the design phase change temperature. With respect to our application the composite
PCM can be categorized into composite PCM for convention air-conditioning systems,
and PCM for low temperature cooling system. A new active research field is still
investigating the Nnano-composite PCM. It is reported that the Nano-particles can
affect the structure of the base fluid. Li et al. investigated a Nano-scaled TiO2 and Cu
into an organic PCM. Liu prepared a TiO2-BaCl2-H2O phase change Nano-composite
with various TiO2 volume fractions, and an increase of 19.8% and 26.8% in the thermal
conductivity of the compound was report after the addition of TiO2 and Cu
respectively. In addition, when the volume fraction of BACL2 approached 1.13% the
sub-cooling effect almost vanished [5]. However it is reported that as the evaporating
temperature increase the COP linearly increase [5]. Another way is to add composites
with higher thermal conductivity to increase the overall thermal conductivity of the
PCM as introduced by Hafner and Schwarzer in 1999.
3.4.3.4 PCM Economics
Cost Components of PCM
As any other commodity the market price is controlled by the demand and supply
relationship. Today’s PCM market is not fully mature or yet developed, because of the
relatively young age of the technology. This will result in limited demand, which is
responsible for the relative high prices of PCM. The drop in the future prices of the
PCM depends mainly on its potential of being utilized in many applications.
Manufactures will adjust their prices on the future expectations of the market. All the
studies and investigations taking place nowadays are very important and essential in
identifying a market segment to define the price of the PCM and the technology used in
producing such a material. In other words taking the material from laboratories to mass
37
production will require an increase in the know-how level accompanied by a cost
reduction in the PCM materials [24].
The primary cost of any PCM product is governed by the cost of the raw material used
for that product and the cost of the technology used as well. i.e. encapsulation,
microencapsulation …etc. preventing the leakage and contamination of PCM. It is
obvious that the raw material cost be it organic or in organic plus the technology used
or the composited material added to enhance the properties of the chosen PCM will
influence the primary price of the chosen technology until the market demand starts to
show a massive need for the material to be present. It is expected that with time the
PCM material will get cheaper since the material (organic and inorganic) is abundant
and already cheap and the technology will get cheaper in the near future [24].
Material Cost of Phase Change Materials
The type of the PCM represents significantly the price class whether it is organic,
inorganic, or even biomaterial. For instance commercial organic paraffinic PCM is a
by-product of the oil refineries that represents their abundance supply at low price. But
for paraffin the price increase by increasing its purity. Pure paraffin wax (>99%) is
more expensive than any other of technical grade lower that that purity level. The cost
of paraffin wax is estimated to be ($1.88−$2.00/kg). An illustrative example for the
price comparison would be the price of a pure laboratory grade ‘eicosane’ is
($53.90/kg) and the technical grade of a lower purity is ($7.04/kg). The fatty acid PCM
e.g. ‘stearic acid’, and ‘palmitic acid’ are ($1.43−$1.56/kg), and ($1.61−$1.72/kg)
respectively [24].
It is not defined yet how much will it cost to convert paraffin into form-stable
composites. But ‘Syntroleum corporation’ plant uses low price HDPE (high density
poly-ethylene) in continuous process using extruders/pelletizers to produce PCM pellets
60-70 % paraffin pellets in HDPE with cost range ($6.60/kg and $8.80/kg), which is
lower than that of the microencapsulated [24].
As for inorganics the cost of calcium chloride PCM is ($0.13−$0.20/kg). In India PCM
Energy produces a house prepared salt hydrate PCMs that contains no impurities, the
raw material used costs around ($1.98−$3.96/kg). The product is in the packaged form
instead of microencapsulated with price of The PCM products are in the packaged form
38
instead of microencapsulated ($3.08−$4.95/kg) with about 20-35 % packaging cost
from the total cost [24].
3.5 Gap analysis and work motivation
From the presented survey, it is noticeable, that the field investigating the usage of
latent heat/cold storage is not yet widely implemented for preserving post-harvest
crops. In other words the usage of PCM as a storage alternative for low temperatures is
rarely implemented. However most of the implemented work is either for seasonal
cooling in buildings or vaccine fridges (small volumes) or building composites.
Moreover the investigation of a stationary container, which is driven only by solar
energy is not yet found, but used with the conventional Diesel generator to either
compensate the losses or to back-up the system. These reasons made this research an
essential investigation to discover the potential of the latent storage for refrigeration of
post-harvest crops without the need of a Diesel generator.
3.6 Work scope
This study will mainly focus on the latent storage to preserve post-harvest crops at the
desired temperature in a stationary PV- cooling unit. A proposed system will be
described and compared to other latent and sensible storage systems to illustrate the
potential of the chosen system. The proposed solution will be economically assessed
against other latent and sensible alternatives. Furthermore the proposed system will be
compared to the conventional alternative (Diesel generator) to illustrate the potential of
the proposed system for a cleaner environment and savings of fossil resources. Whether
the condensing unit, the batteries, the evaporator, and the solar controller are going to
be placed inside or outside the container is not yet decided but in the scope of this study
it is assumed that these components are going to be placed outside the container.
39
4 Physical model and system design
For this study an Excel parametric tool from Fraunhofer UMSICHT is been further
developed and modified to suit the scope of the work. The parametric simulation is able
to consider the effects of using different cooling loads, different system capacities,
different locations as well as different operating conditions. A visual basic script is used
to calculate and estimate the solids content of the PCM storage, representing its “charge
state”. This varies with the supplied cooling load which depends on the variation of the
radiation and the climatic data of the chosen location. All the variables are defined,
inputted and interrelated to compute and simulate the expected solar fraction for a
variety of possible system alternatives. The parametric model measures the required
load on an hourly basis for the whole year depending on the solar radiation intensity at
the chosen location. The model can be used for any location and various parameters
like container size, cooling load capacity, battery capacity, chiller capacity, and thermal
storage material. Upon successful execution of the simulation the project is to be truly
implemented on ground. All the variables of the system will be discussed in this chapter
in details.
4.1 System design
The system considered for this study consists of almost four main components. The
first main component is the thermal storage unit or the container, which is a 20 ft long
insulated container to pre-cool the newly added crops and to store the produce at the
desired temperature. Another main component is the PV array, and the third main
component is the refrigeration cycle, which will consist in this case of a DC (Direct
current) driven vapor compression chiller, a condenser, an expansion valve and an
evaporator with a fan coil unit to dispense the cooled air into the room/insulated
container. The fourth main component of the system is the battery. This study will
focus on the thermal storage using the PCM (phase change material). The design of the
thermal storage in the container may vary according to the chosen PCM and
technology, which will be discussed in details later on in this study. Figure 4-1 shows
some possible storage technologies. It illustrates the various operations modes, which
entirely depend on the application circumstances.
40
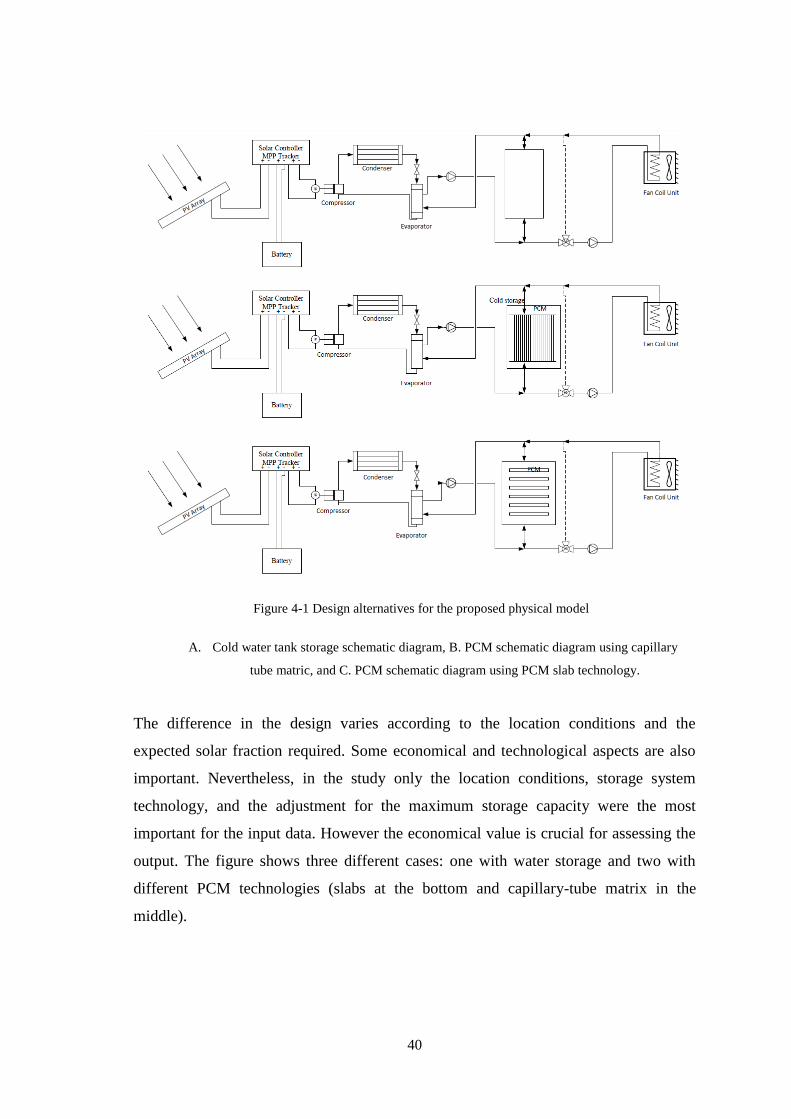
The difference in the design varies according to the location conditions and the
expected solar fraction required. Some economical and technological aspects are also
important. Nevertheless, in the study only the location conditions, storage system
technology, and the adjustment for the maximum storage capacity were the most
important for the input data. However the economical value is crucial for assessing the
output. The figure shows three different cases: one with water storage and two with
different PCM technologies (slabs at the bottom and capillary-tube matrix in the
middle).
Figure 4-1 Design alternatives for the proposed physical model
A. Cold water tank storage schematic diagram, B. PCM schematic diagram using capillary
tube matric, and C. PCM schematic diagram using PCM slab technology.
41
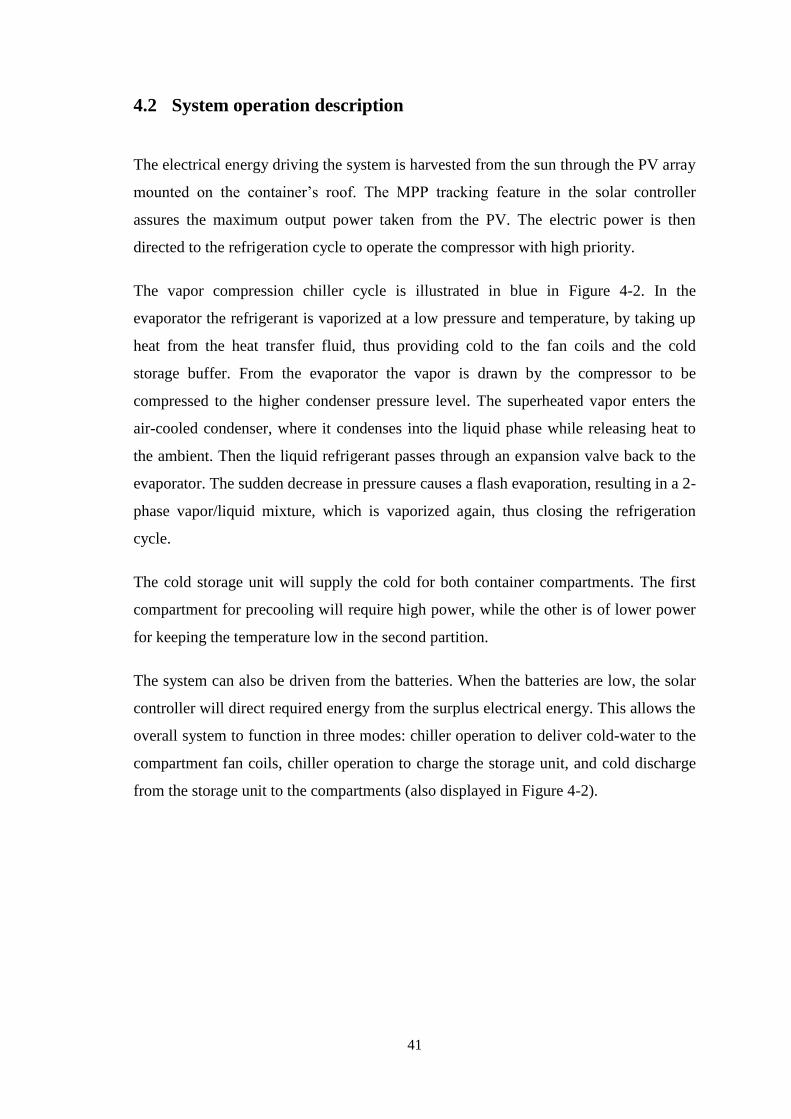
4.2 System operation description
The electrical energy driving the system is harvested from the sun through the PV array
mounted on the container’s roof. The MPP tracking feature in the solar controller
assures the maximum output power taken from the PV. The electric power is then
directed to the refrigeration cycle to operate the compressor with high priority.
The vapor compression chiller cycle is illustrated in blue in Figure 4-2. In the
evaporator the refrigerant is vaporized at a low pressure and temperature, by taking up
heat from the heat transfer fluid, thus providing cold to the fan coils and the cold
storage buffer. From the evaporator the vapor is drawn by the compressor to be
compressed to the higher condenser pressure level. The superheated vapor enters the
air-cooled condenser, where it condenses into the liquid phase while releasing heat to
the ambient. Then the liquid refrigerant passes through an expansion valve back to the
evaporator. The sudden decrease in pressure causes a flash evaporation, resulting in a 2-
phase vapor/liquid mixture, which is vaporized again, thus closing the refrigeration
cycle.
The cold storage unit will supply the cold for both container compartments. The first
compartment for precooling will require high power, while the other is of lower power
for keeping the temperature low in the second partition.
The system can also be driven from the batteries. When the batteries are low, the solar
controller will direct required energy from the surplus electrical energy. This allows the
overall system to function in three modes: chiller operation to deliver cold-water to the
compartment fan coils, chiller operation to charge the storage unit, and cold discharge
from the storage unit to the compartments (also displayed in Figure 4-2).
42
Expansion
Valve
E-3M
PV Array
Battery
Solar Controller
MPP Tracker+ - + -+ -
Cold storage
PCM
Air-cooledCondenser
Compressor
Evaporator
Fan Coil Unit Fan Coil Unit
P-202
Figure 4-2 Schematic Diagram for the PV-cooling system using batteries for electrical energy storage and PCM as thermal storage
(Red: PV system, Blue: Vapor compression chiller cycle and Green: The capillary tube PCM, fan coil for precooling and the fan coil for cooling storage unit
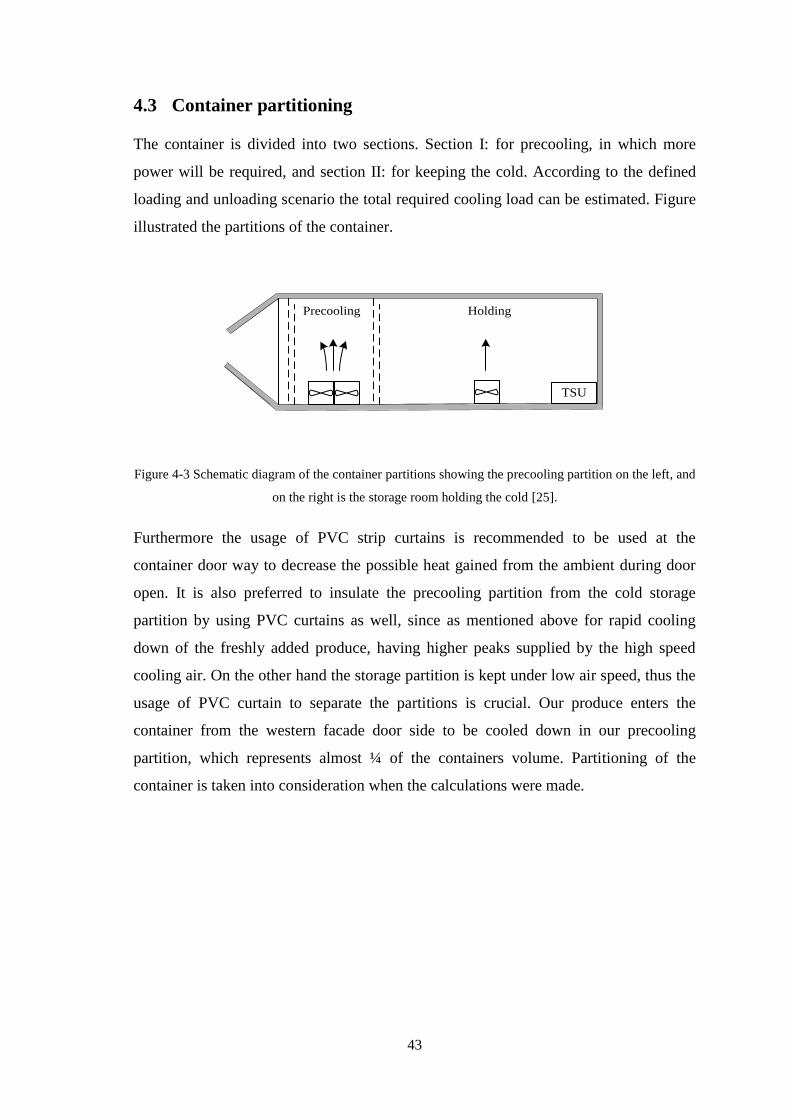
43
4.3 Container partitioning
The container is divided into two sections. Section I: for precooling, in which more
power will be required, and section II: for keeping the cold. According to the defined
loading and unloading scenario the total required cooling load can be estimated. Figure
illustrated the partitions of the container.
TSU
HoldingPrecooling
Figure 4-3 Schematic diagram of the container partitions showing the precooling partition on the left, and
on the right is the storage room holding the cold [25].
Furthermore the usage of PVC strip curtains is recommended to be used at the
container door way to decrease the possible heat gained from the ambient during door
open. It is also preferred to insulate the precooling partition from the cold storage
partition by using PVC curtains as well, since as mentioned above for rapid cooling
down of the freshly added produce, having higher peaks supplied by the high speed
cooling air. On the other hand the storage partition is kept under low air speed, thus the
usage of PVC curtain to separate the partitions is crucial. Our produce enters the
container from the western facade door side to be cooled down in our precooling
partition, which represents almost ¼ of the containers volume. Partitioning of the
container is taken into consideration when the calculations were made.
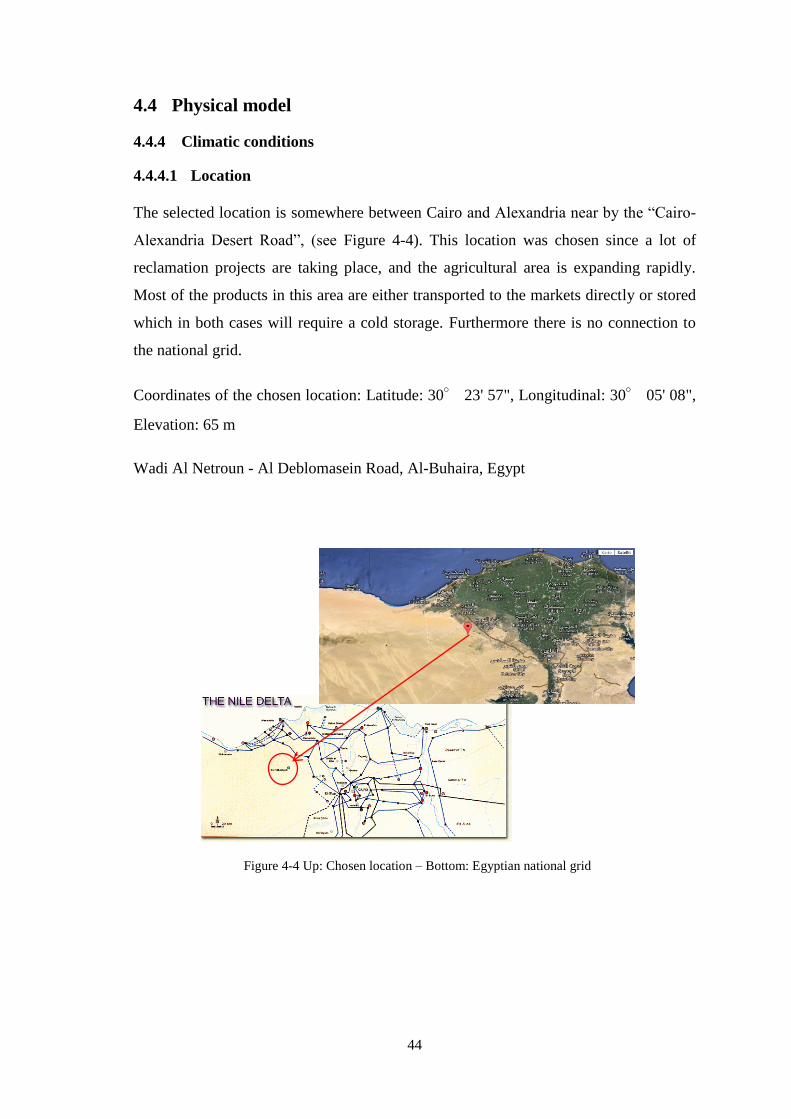
44
Figure 4-4 Up: Chosen location – Bottom: Egyptian national grid
4.4 Physical model
4.4.4 Climatic conditions
4.4.4.1 Location
The selected location is somewhere between Cairo and Alexandria near by the “Cairo-
Alexandria Desert Road”, (see Figure 4-4). This location was chosen since a lot of
reclamation projects are taking place, and the agricultural area is expanding rapidly.
Most of the products in this area are either transported to the markets directly or stored
which in both cases will require a cold storage. Furthermore there is no connection to
the national grid.
Coordinates of the chosen location: Latitude: 30° 23' 57", Longitudinal: 30° 05' 08",
Elevation: 65 m
Wadi Al Netroun - Al Deblomasein Road, Al-Buhaira, Egypt
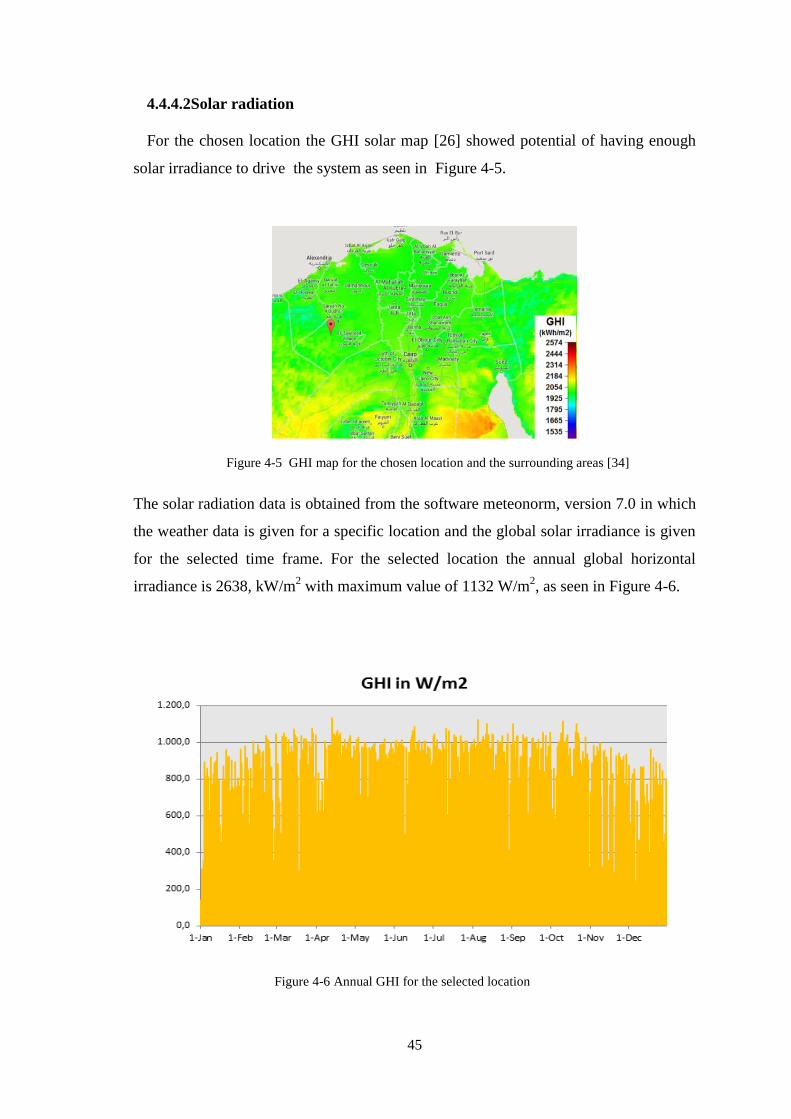
45
4.4.4.2Solar radiation
For the chosen location the GHI solar map [26] showed potential of having enough
solar irradiance to drive the system as seen in Figure 4-5.
The solar radiation data is obtained from the software meteonorm, version 7.0 in which
the weather data is given for a specific location and the global solar irradiance is given
for the selected time frame. For the selected location the annual global horizontal
irradiance is 2638, kW/m2 with maximum value of 1132 W/m
2, as seen in Figure 4-6.
Figure 4-5 GHI map for the chosen location and the surrounding areas [34]
Figure 4-6 Annual GHI for the selected location
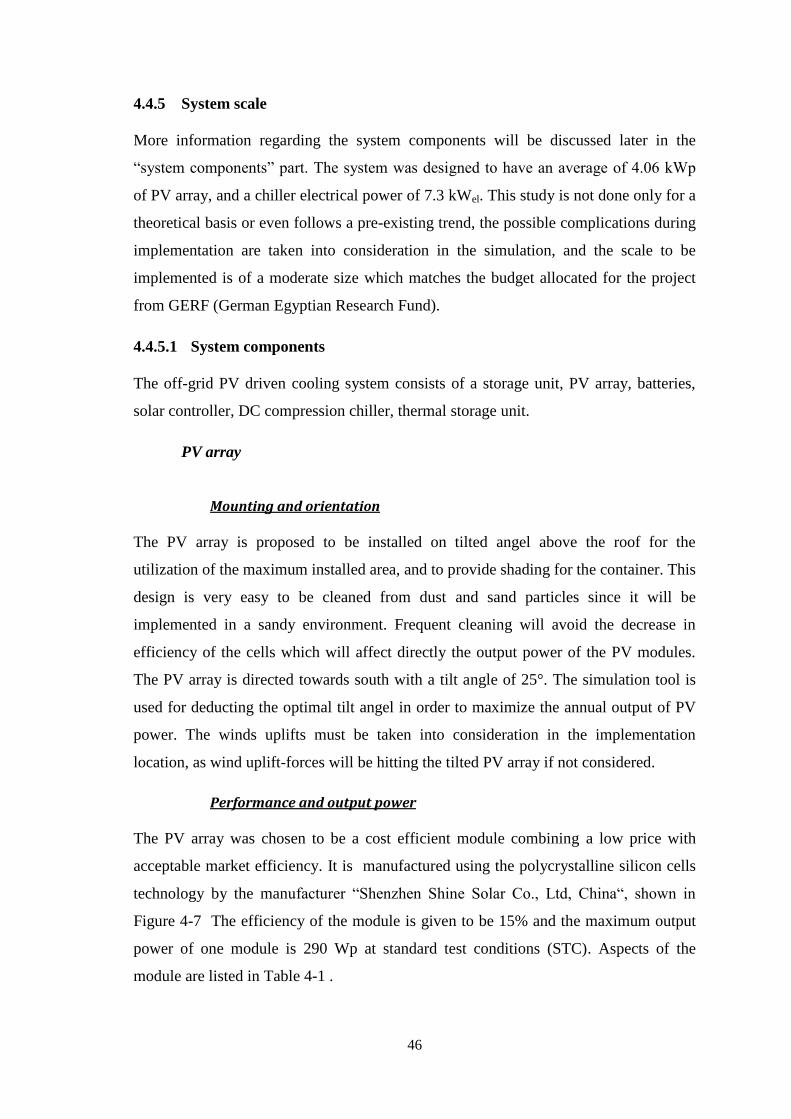
46
4.4.5 System scale
More information regarding the system components will be discussed later in the
“system components” part. The system was designed to have an average of 4.06 kWp
of PV array, and a chiller electrical power of 7.3 kWel. This study is not done only for a
theoretical basis or even follows a pre-existing trend, the possible complications during
implementation are taken into consideration in the simulation, and the scale to be
implemented is of a moderate size which matches the budget allocated for the project
from GERF (German Egyptian Research Fund).
4.4.5.1 System components
The off-grid PV driven cooling system consists of a storage unit, PV array, batteries,
solar controller, DC compression chiller, thermal storage unit.
PV array
Mounting and orientation
The PV array is proposed to be installed on tilted angel above the roof for the
utilization of the maximum installed area, and to provide shading for the container. This
design is very easy to be cleaned from dust and sand particles since it will be
implemented in a sandy environment. Frequent cleaning will avoid the decrease in
efficiency of the cells which will affect directly the output power of the PV modules.
The PV array is directed towards south with a tilt angle of 25°. The simulation tool is
used for deducting the optimal tilt angel in order to maximize the annual output of PV
power. The winds uplifts must be taken into consideration in the implementation
location, as wind uplift-forces will be hitting the tilted PV array if not considered.
Performance and output power
The PV array was chosen to be a cost efficient module combining a low price with
acceptable market efficiency. It is manufactured using the polycrystalline silicon cells
technology by the manufacturer “Shenzhen Shine Solar Co., Ltd, China“, shown in
Figure 4-7 The efficiency of the module is given to be 15% and the maximum output
power of one module is 290 Wp at standard test conditions (STC). Aspects of the
module are listed in Table 4-1 .
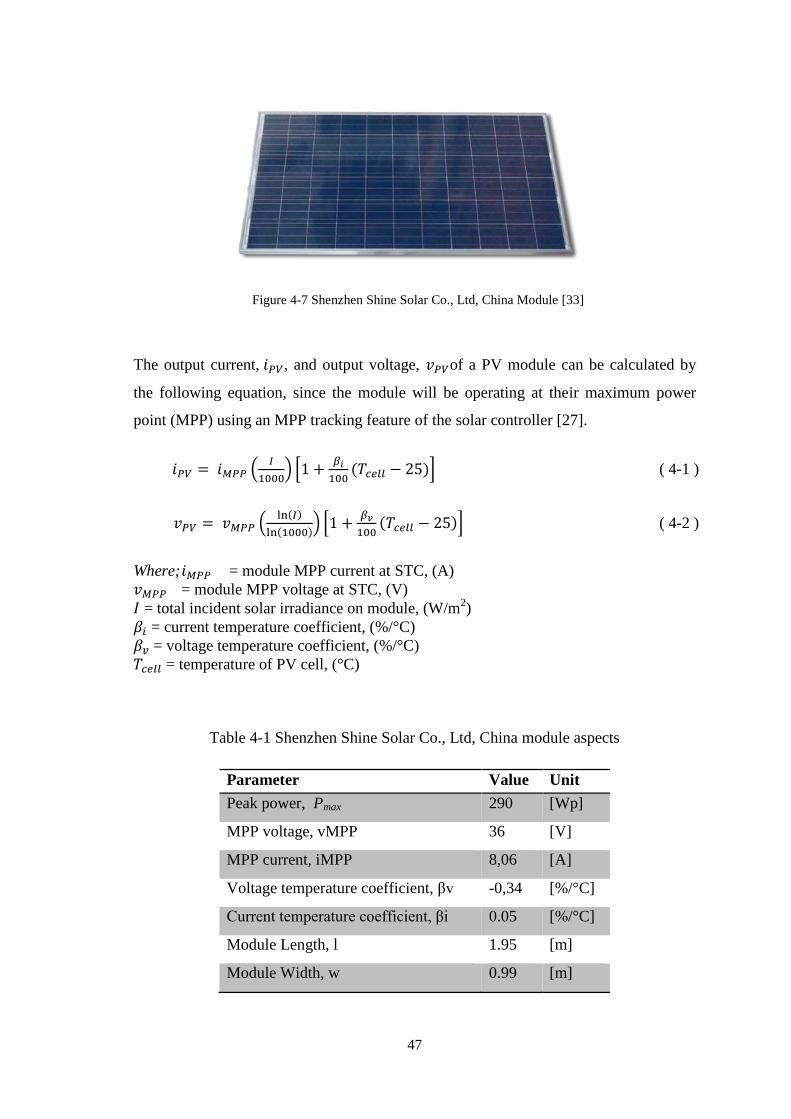
47
The output current, 𝑖𝑃𝑉, and output voltage, 𝑣𝑃𝑉of a PV module can be calculated by
the following equation, since the module will be operating at their maximum power
point (MPP) using an MPP tracking feature of the solar controller [27].
𝑖𝑃𝑉 = 𝑖𝑀𝑃𝑃 (𝐼
1000) [1 +
𝛽𝑖
100(𝑇𝑐𝑒𝑙𝑙 − 25)] ( 4-1 )
𝑣𝑃𝑉 = 𝑣𝑀𝑃𝑃 (ln(𝐼)
ln(1000)) [1 +
𝛽𝑣
100(𝑇𝑐𝑒𝑙𝑙 − 25)] ( 4-2 )
Where; 𝑖𝑀𝑃𝑃 = module MPP current at STC, (A)
𝑣𝑀𝑃𝑃 = module MPP voltage at STC, (V)
𝐼 = total incident solar irradiance on module, (W/m2)
𝛽𝑖 = current temperature coefficient, (%/°C)
𝛽𝑣 = voltage temperature coefficient, (%/°C)
𝑇𝑐𝑒𝑙𝑙 = temperature of PV cell, (°C)
Table 4-1 Shenzhen Shine Solar Co., Ltd, China module aspects
Parameter Value Unit
Peak power, Pmax 290 [Wp]
MPP voltage, vMPP 36 [V]
MPP current, iMPP 8,06 [A]
Voltage temperature coefficient, βv -0,34 [%/°C]
Current temperature coefficient, βi 0.05 [%/°C]
Module Length, l 1.95 [m]
Module Width, w 0.99 [m]
Figure 4-7 Shenzhen Shine Solar Co., Ltd, China Module [33]
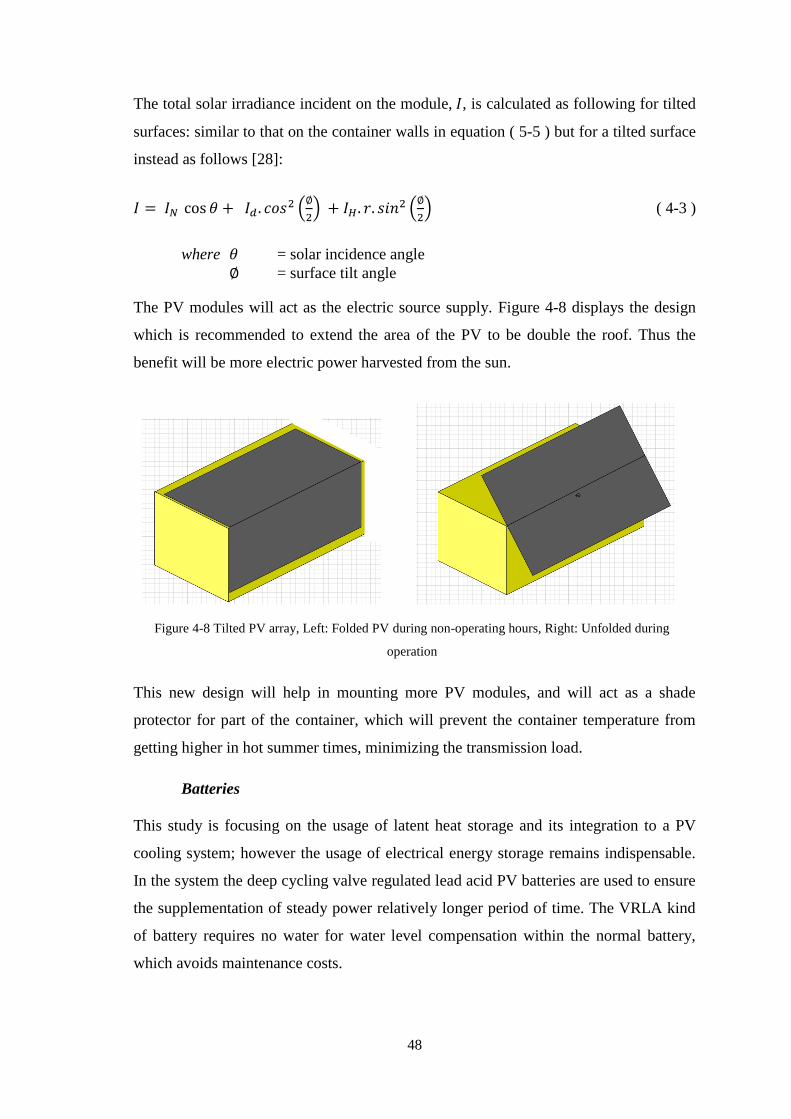
48
The total solar irradiance incident on the module, 𝐼, is calculated as following for tilted
surfaces: similar to that on the container walls in equation ( 5-5 ) but for a tilted surface
instead as follows [28]:
𝐼 = 𝐼𝑁 cos 𝜃 + 𝐼𝑑 . 𝑐𝑜𝑠2 (∅
2) + 𝐼𝐻. 𝑟. 𝑠𝑖𝑛2 (
∅
2) ( 4-3 )
where 𝜃 = solar incidence angle
∅ = surface tilt angle
The PV modules will act as the electric source supply. Figure 4-8 displays the design
which is recommended to extend the area of the PV to be double the roof. Thus the
benefit will be more electric power harvested from the sun.
This new design will help in mounting more PV modules, and will act as a shade
protector for part of the container, which will prevent the container temperature from
getting higher in hot summer times, minimizing the transmission load.
Batteries
This study is focusing on the usage of latent heat storage and its integration to a PV
cooling system; however the usage of electrical energy storage remains indispensable.
In the system the deep cycling valve regulated lead acid PV batteries are used to ensure
the supplementation of steady power relatively longer period of time. The VRLA kind
of battery requires no water for water level compensation within the normal battery,
which avoids maintenance costs.
Figure 4-8 Tilted PV array, Left: Folded PV during non-operating hours, Right: Unfolded during
operation
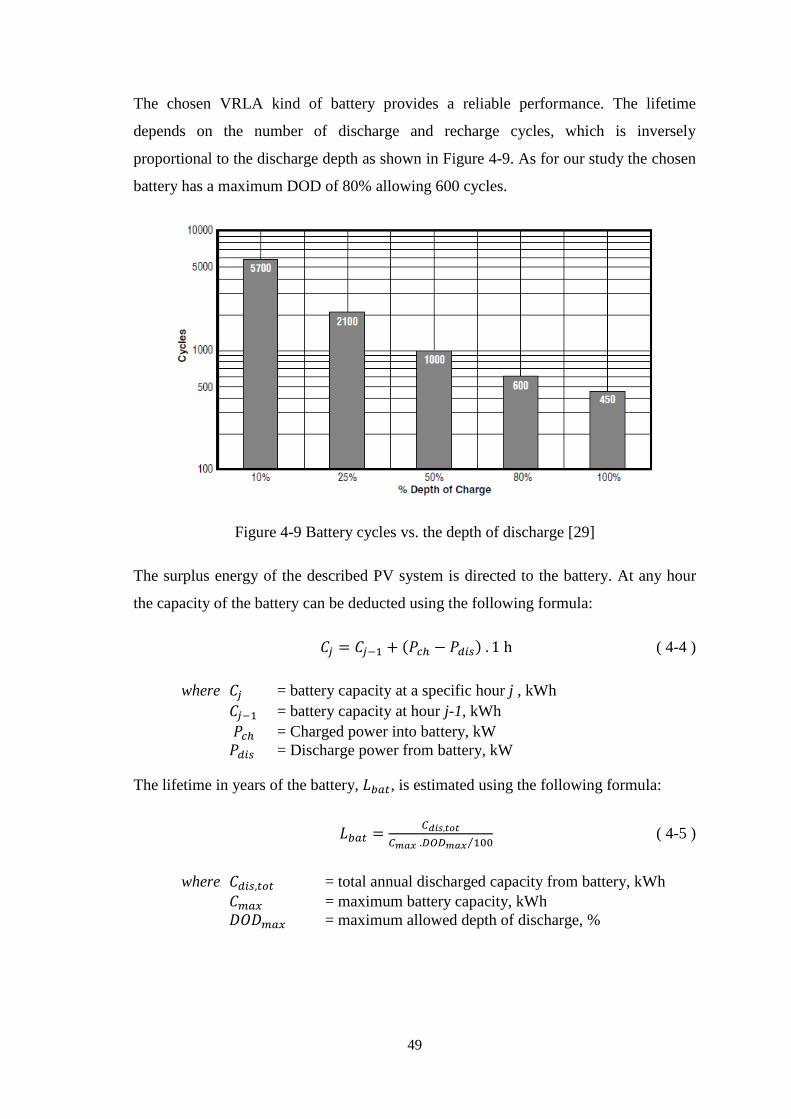
49
The chosen VRLA kind of battery provides a reliable performance. The lifetime
depends on the number of discharge and recharge cycles, which is inversely
proportional to the discharge depth as shown in Figure 4-9. As for our study the chosen
battery has a maximum DOD of 80% allowing 600 cycles.
Figure 4-9 Battery cycles vs. the depth of discharge [29]
The surplus energy of the described PV system is directed to the battery. At any hour
the capacity of the battery can be deducted using the following formula:
𝐶𝑗 = 𝐶𝑗−1 + (𝑃𝑐ℎ − 𝑃𝑑𝑖𝑠) . 1 h ( 4-4 )
where 𝐶𝑗 = battery capacity at a specific hour j , kWh
𝐶𝑗−1 = battery capacity at hour j-1, kWh
𝑃𝑐ℎ = Charged power into battery, kW
𝑃𝑑𝑖𝑠 = Discharge power from battery, kW
The lifetime in years of the battery, 𝐿𝑏𝑎𝑡, is estimated using the following formula:
𝐿𝑏𝑎𝑡 =𝐶𝑑𝑖𝑠,𝑡𝑜𝑡
𝐶𝑚𝑎𝑥 .𝐷𝑂𝐷𝑚𝑎𝑥 100⁄ ( 4-5 )
where 𝐶𝑑𝑖𝑠,𝑡𝑜𝑡 = total annual discharged capacity from battery, kWh
𝐶𝑚𝑎𝑥 = maximum battery capacity, kWh
𝐷𝑂𝐷𝑚𝑎𝑥 = maximum allowed depth of discharge, %
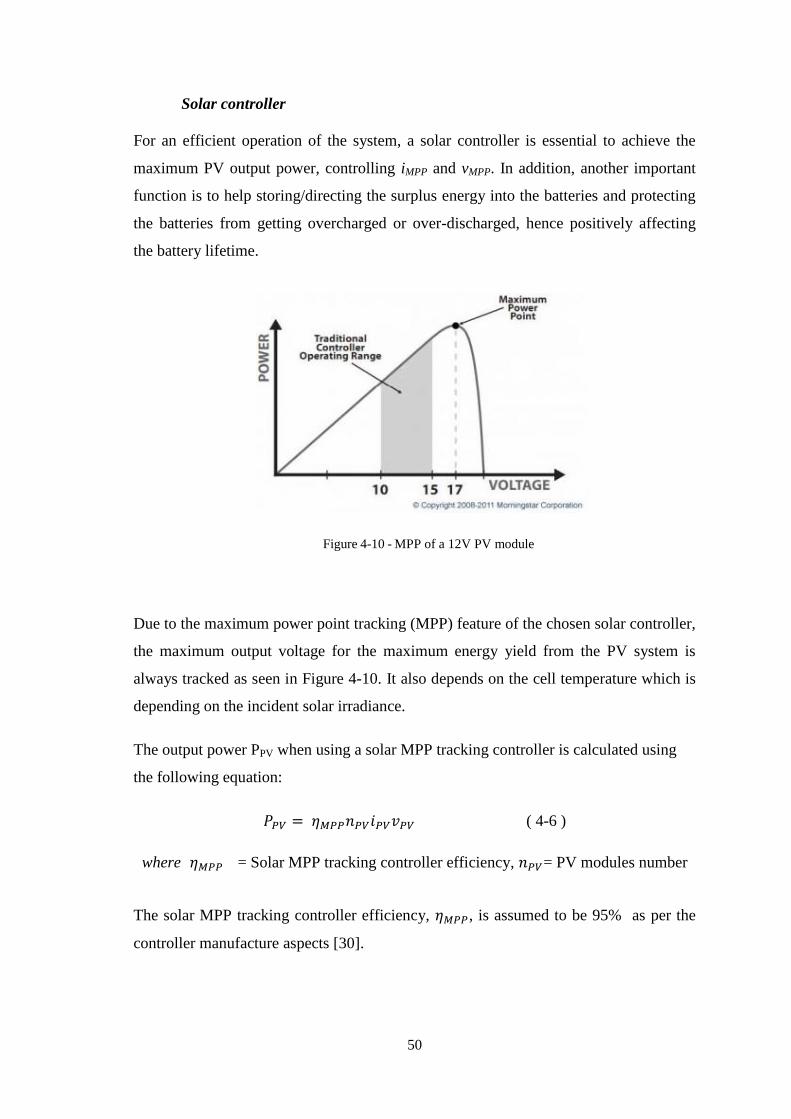
50
Solar controller
For an efficient operation of the system, a solar controller is essential to achieve the
maximum PV output power, controlling iMPP and vMPP. In addition, another important
function is to help storing/directing the surplus energy into the batteries and protecting
the batteries from getting overcharged or over-discharged, hence positively affecting
the battery lifetime.
Due to the maximum power point tracking (MPP) feature of the chosen solar controller,
the maximum output voltage for the maximum energy yield from the PV system is
always tracked as seen in Figure 4-10. It also depends on the cell temperature which is
depending on the incident solar irradiance.
The output power PPV when using a solar MPP tracking controller is calculated using
the following equation:
𝑃𝑃𝑉 = 𝜂𝑀𝑃𝑃𝑛𝑃𝑉𝑖𝑃𝑉𝑣𝑃𝑉 ( 4-6 )
where 𝜂𝑀𝑃𝑃 = Solar MPP tracking controller efficiency, 𝑛𝑃𝑉= PV modules number
The solar MPP tracking controller efficiency, 𝜂𝑀𝑃𝑃, is assumed to be 95% as per the
controller manufacture aspects [30].
Figure 4-10 - MPP of a 12V PV module
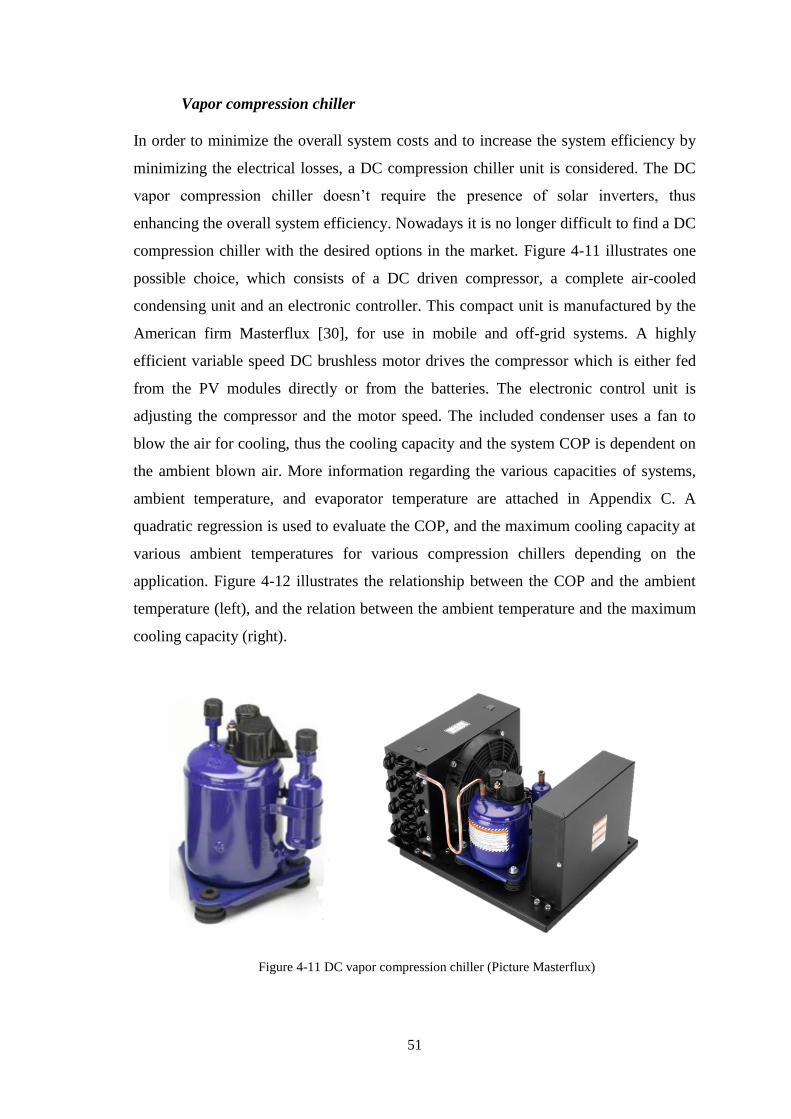
51
Vapor compression chiller
In order to minimize the overall system costs and to increase the system efficiency by
minimizing the electrical losses, a DC compression chiller unit is considered. The DC
vapor compression chiller doesn’t require the presence of solar inverters, thus
enhancing the overall system efficiency. Nowadays it is no longer difficult to find a DC
compression chiller with the desired options in the market. Figure 4-11 illustrates one
possible choice, which consists of a DC driven compressor, a complete air-cooled
condensing unit and an electronic controller. This compact unit is manufactured by the
American firm Masterflux [30], for use in mobile and off-grid systems. A highly
efficient variable speed DC brushless motor drives the compressor which is either fed
from the PV modules directly or from the batteries. The electronic control unit is
adjusting the compressor and the motor speed. The included condenser uses a fan to
blow the air for cooling, thus the cooling capacity and the system COP is dependent on
the ambient blown air. More information regarding the various capacities of systems,
ambient temperature, and evaporator temperature are attached in Appendix C. A
quadratic regression is used to evaluate the COP, and the maximum cooling capacity at
various ambient temperatures for various compression chillers depending on the
application. Figure 4-12 illustrates the relationship between the COP and the ambient
temperature (left), and the relation between the ambient temperature and the maximum
cooling capacity (right).
Figure 4-11 DC vapor compression chiller (Picture Masterflux)
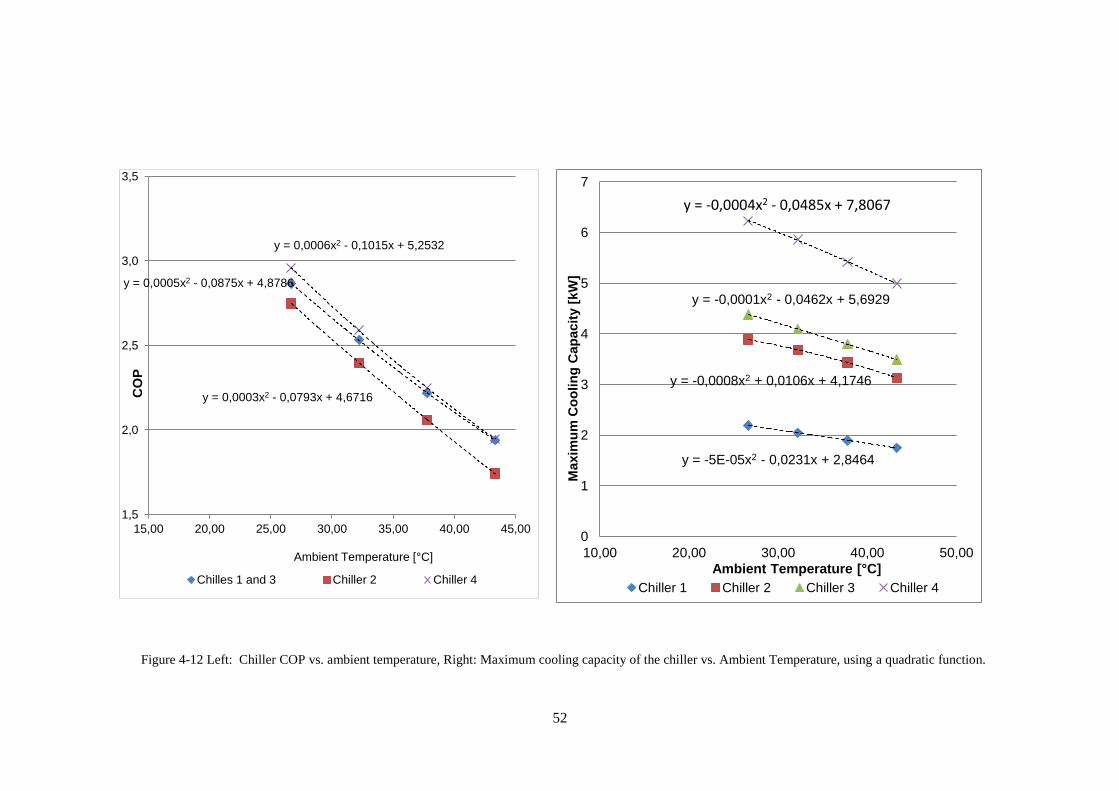
52
Figure 4-12 Left: Chiller COP vs. ambient temperature, Right: Maximum cooling capacity of the chiller vs. Ambient Temperature, using a quadratic function.
y = 0,0005x2 - 0,0875x + 4,8786
y = 0,0003x2 - 0,0793x + 4,6716
y = 0,0006x2 - 0,1015x + 5,2532
1,5
2,0
2,5
3,0
3,5
15,00 20,00 25,00 30,00 35,00 40,00 45,00
CO
P
Ambient Temperature [°C]
Chilles 1 and 3 Chiller 2 Chiller 4
y = -5E-05x2 - 0,0231x + 2,8464
y = -0,0008x2 + 0,0106x + 4,1746
y = -0,0001x2 - 0,0462x + 5,6929
y = -0,0004x2 - 0,0485x + 7,8067
0
1
2
3
4
5
6
7
10,00 20,00 30,00 40,00 50,00
Maxim
um
Co
olin
g C
ap
acit
y [
kW
] Ambient Temperature [°C]
Chiller 1 Chiller 2 Chiller 3 Chiller 4
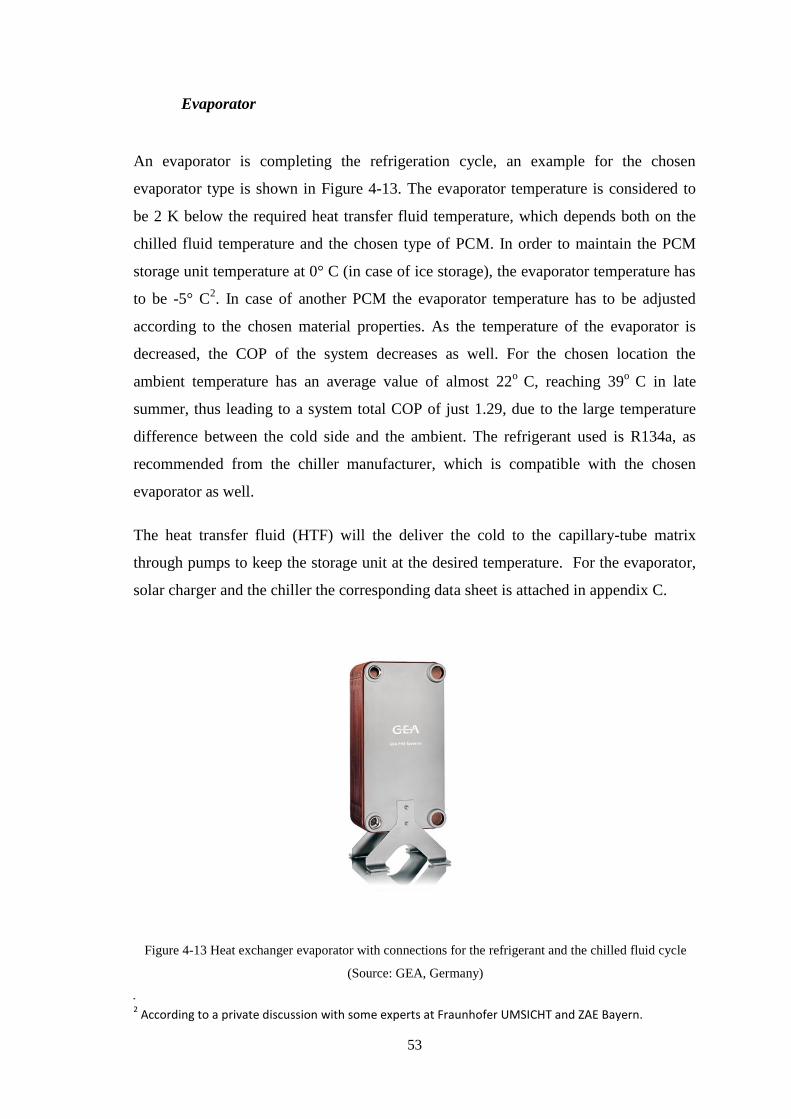
53
Evaporator
An evaporator is completing the refrigeration cycle, an example for the chosen
evaporator type is shown in Figure 4-13. The evaporator temperature is considered to
be 2 K below the required heat transfer fluid temperature, which depends both on the
chilled fluid temperature and the chosen type of PCM. In order to maintain the PCM
storage unit temperature at 0° C (in case of ice storage), the evaporator temperature has
to be -5° C2. In case of another PCM the evaporator temperature has to be adjusted
according to the chosen material properties. As the temperature of the evaporator is
decreased, the COP of the system decreases as well. For the chosen location the
ambient temperature has an average value of almost 22o
C, reaching 39o
C in late
summer, thus leading to a system total COP of just 1.29, due to the large temperature
difference between the cold side and the ambient. The refrigerant used is R134a, as
recommended from the chiller manufacturer, which is compatible with the chosen
evaporator as well.
The heat transfer fluid (HTF) will the deliver the cold to the capillary-tube matrix
through pumps to keep the storage unit at the desired temperature. For the evaporator,
solar charger and the chiller the corresponding data sheet is attached in appendix C.
2 According to a private discussion with some experts at Fraunhofer UMSICHT and ZAE Bayern.
Figure 4-13 Heat exchanger evaporator with connections for the refrigerant and the chilled fluid cycle
(Source: GEA, Germany)
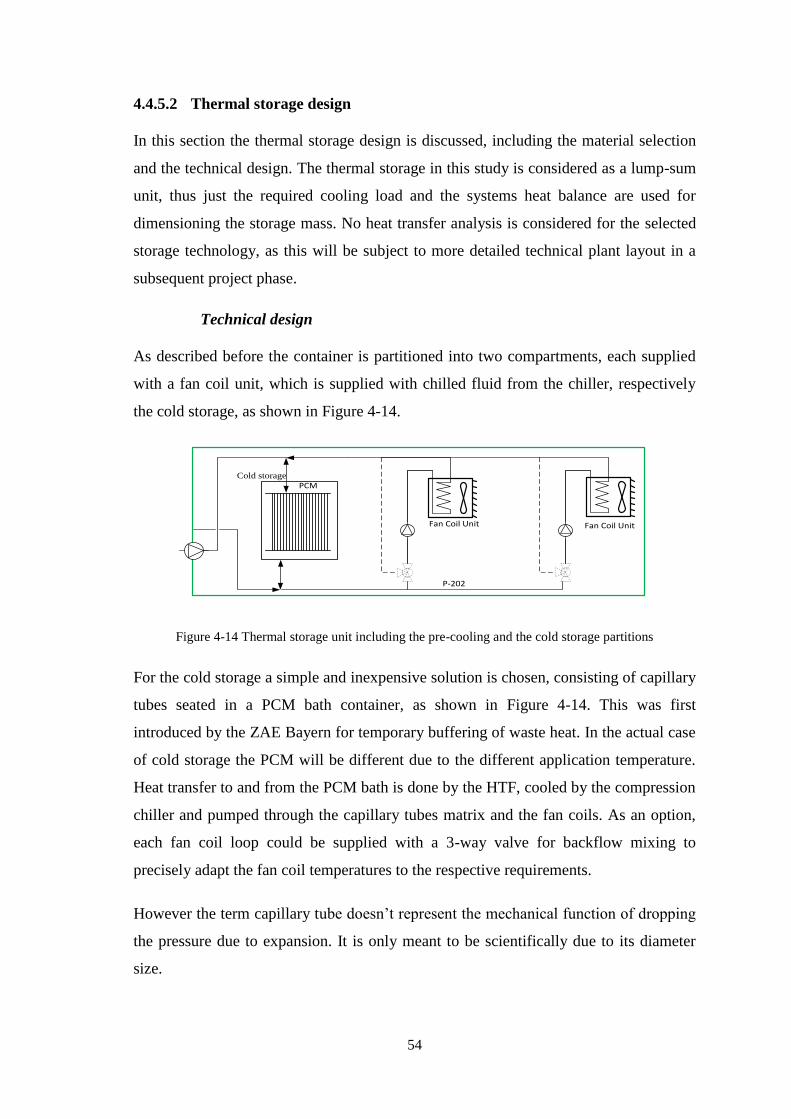
54
4.4.5.2 Thermal storage design
In this section the thermal storage design is discussed, including the material selection
and the technical design. The thermal storage in this study is considered as a lump-sum
unit, thus just the required cooling load and the systems heat balance are used for
dimensioning the storage mass. No heat transfer analysis is considered for the selected
storage technology, as this will be subject to more detailed technical plant layout in a
subsequent project phase.
Technical design
As described before the container is partitioned into two compartments, each supplied
with a fan coil unit, which is supplied with chilled fluid from the chiller, respectively
the cold storage, as shown in Figure 4-14.
Cold storage
PCM
Fan Coil Unit Fan Coil Unit
P-202
Figure 4-14 Thermal storage unit including the pre-cooling and the cold storage partitions
For the cold storage a simple and inexpensive solution is chosen, consisting of capillary
tubes seated in a PCM bath container, as shown in Figure 4-14. This was first
introduced by the ZAE Bayern for temporary buffering of waste heat. In the actual case
of cold storage the PCM will be different due to the different application temperature.
Heat transfer to and from the PCM bath is done by the HTF, cooled by the compression
chiller and pumped through the capillary tubes matrix and the fan coils. As an option,
each fan coil loop could be supplied with a 3-way valve for backflow mixing to
precisely adapt the fan coil temperatures to the respective requirements.
However the term capillary tube doesn’t represent the mechanical function of dropping
the pressure due to expansion. It is only meant to be scientifically due to its diameter
size.
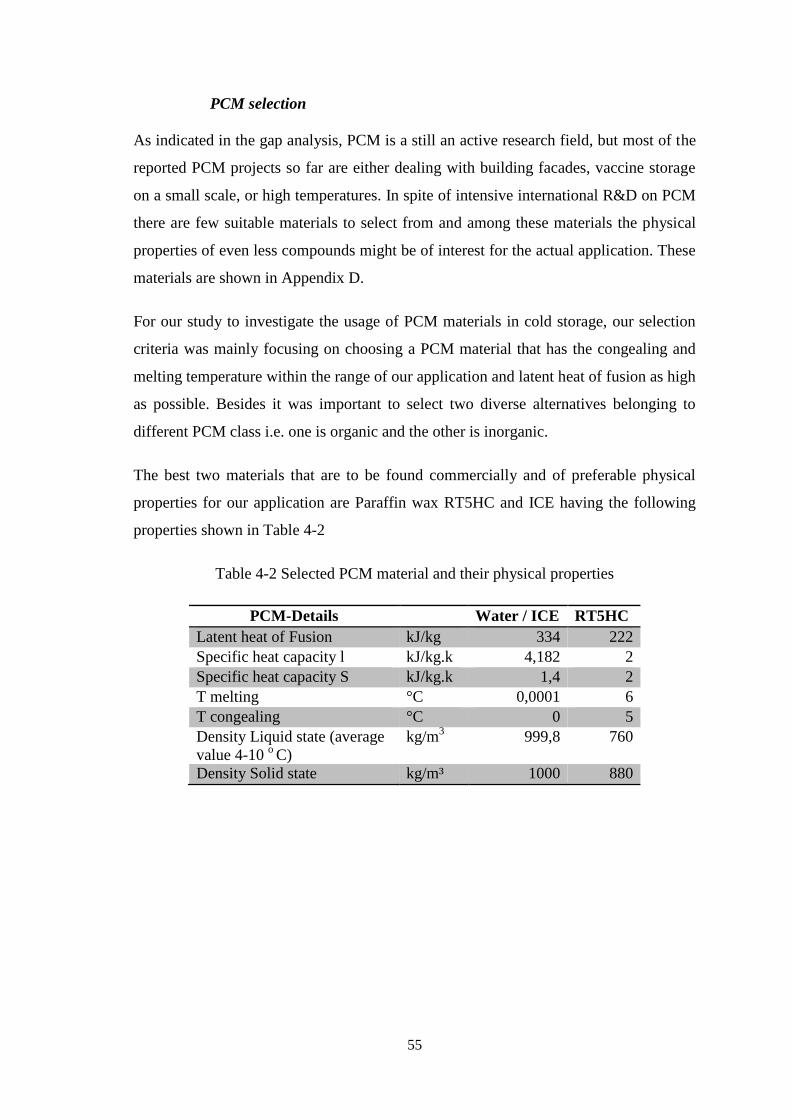
55
PCM selection
As indicated in the gap analysis, PCM is a still an active research field, but most of the
reported PCM projects so far are either dealing with building facades, vaccine storage
on a small scale, or high temperatures. In spite of intensive international R&D on PCM
there are few suitable materials to select from and among these materials the physical
properties of even less compounds might be of interest for the actual application. These
materials are shown in Appendix D.
For our study to investigate the usage of PCM materials in cold storage, our selection
criteria was mainly focusing on choosing a PCM material that has the congealing and
melting temperature within the range of our application and latent heat of fusion as high
as possible. Besides it was important to select two diverse alternatives belonging to
different PCM class i.e. one is organic and the other is inorganic.
The best two materials that are to be found commercially and of preferable physical
properties for our application are Paraffin wax RT5HC and ICE having the following
properties shown in Table 4-2
Table 4-2 Selected PCM material and their physical properties
PCM-Details Water / ICE RT5HC
Latent heat of Fusion kJ/kg 334 222
Specific heat capacity l kJ/kg.k 4,182 2
Specific heat capacity S kJ/kg.k 1,4 2
T melting °C 0,0001 6
T congealing °C 0 5
Density Liquid state (average
value 4-10 o C)
kg/m3 999,8 760
Density Solid state kg/m³ 1000 880
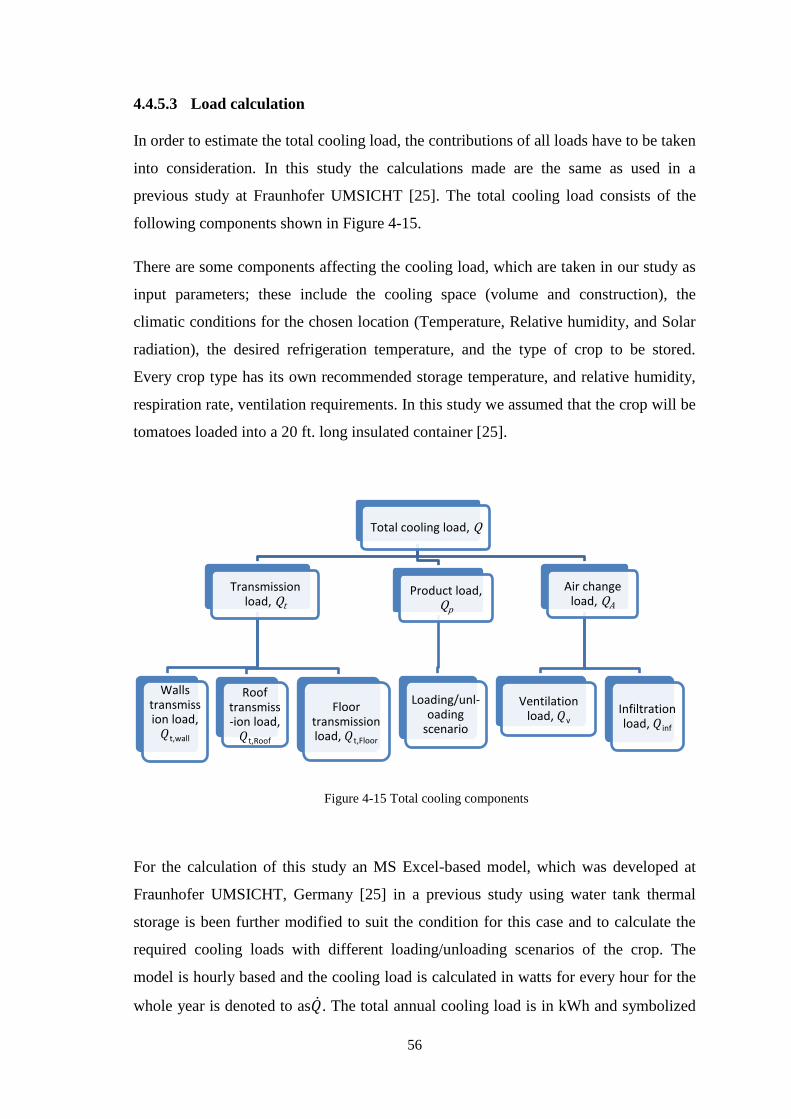
56
4.4.5.3 Load calculation
In order to estimate the total cooling load, the contributions of all loads have to be taken
into consideration. In this study the calculations made are the same as used in a
previous study at Fraunhofer UMSICHT [25]. The total cooling load consists of the
following components shown in Figure 4-15.
There are some components affecting the cooling load, which are taken in our study as
input parameters; these include the cooling space (volume and construction), the
climatic conditions for the chosen location (Temperature, Relative humidity, and Solar
radiation), the desired refrigeration temperature, and the type of crop to be stored.
Every crop type has its own recommended storage temperature, and relative humidity,
respiration rate, ventilation requirements. In this study we assumed that the crop will be
tomatoes loaded into a 20 ft. long insulated container [25].
For the calculation of this study an MS Excel-based model, which was developed at
Fraunhofer UMSICHT, Germany [25] in a previous study using water tank thermal
storage is been further modified to suit the condition for this case and to calculate the
required cooling loads with different loading/unloading scenarios of the crop. The
model is hourly based and the cooling load is calculated in watts for every hour for the
whole year is denoted to as��. The total annual cooling load is in kWh and symbolized
Figure 4-15 Total cooling components
Total cooling load, Q
Transmission load, Qt
Walls transmission load,
𝑄t,wall
Roof transmiss-ion load,
𝑄t,Roof
Floor transmission load, 𝑄t,Floor
Product load, Qp
Loading/unl-oading
scenario
Air change load, QA
Ventilation load, 𝑄v
Infiltration load, 𝑄inf
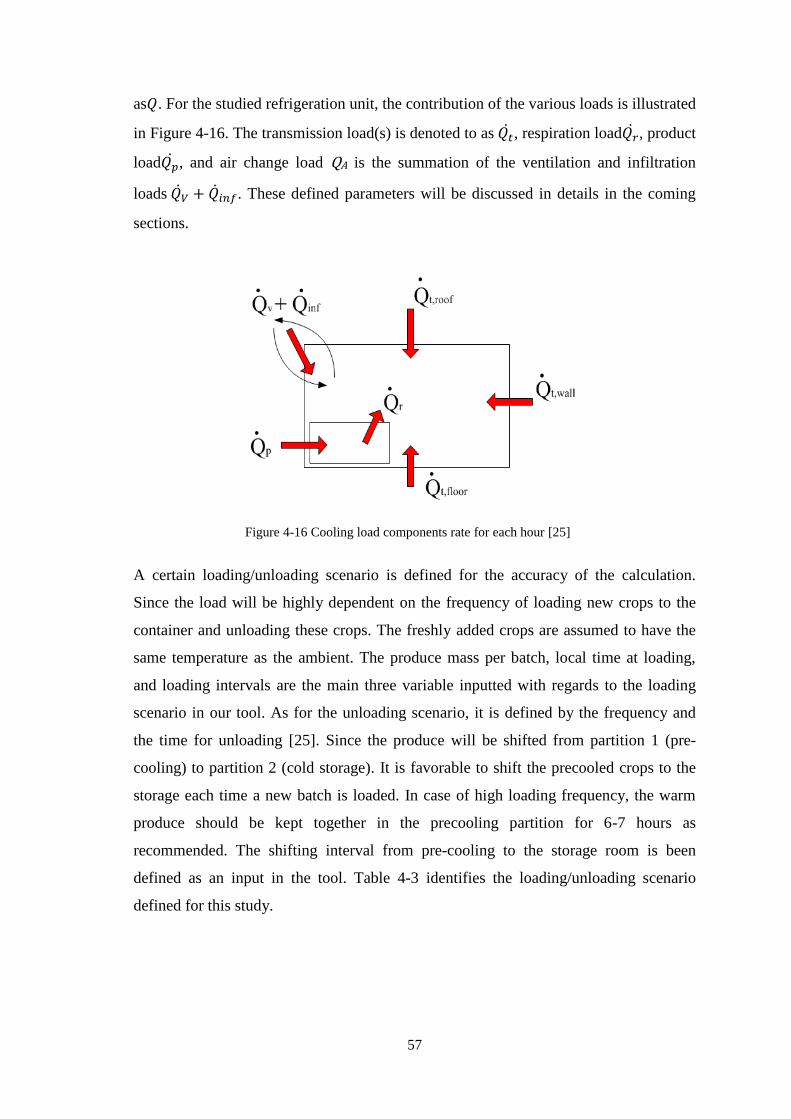
57
as𝑄. For the studied refrigeration unit, the contribution of the various loads is illustrated
in Figure 4-16. The transmission load(s) is denoted to as 𝑄𝑡 , respiration load𝑄��, product
load𝑄��, and air change load QA is the summation of the ventilation and infiltration
loads 𝑄𝑉 + ��𝑖𝑛𝑓. These defined parameters will be discussed in details in the coming
sections.
A certain loading/unloading scenario is defined for the accuracy of the calculation.
Since the load will be highly dependent on the frequency of loading new crops to the
container and unloading these crops. The freshly added crops are assumed to have the
same temperature as the ambient. The produce mass per batch, local time at loading,
and loading intervals are the main three variable inputted with regards to the loading
scenario in our tool. As for the unloading scenario, it is defined by the frequency and
the time for unloading [25]. Since the produce will be shifted from partition 1 (pre-
cooling) to partition 2 (cold storage). It is favorable to shift the precooled crops to the
storage each time a new batch is loaded. In case of high loading frequency, the warm
produce should be kept together in the precooling partition for 6-7 hours as
recommended. The shifting interval from pre-cooling to the storage room is been
defined as an input in the tool. Table 4-3 identifies the loading/unloading scenario
defined for this study.
Figure 4-16 Cooling load components rate for each hour [25]
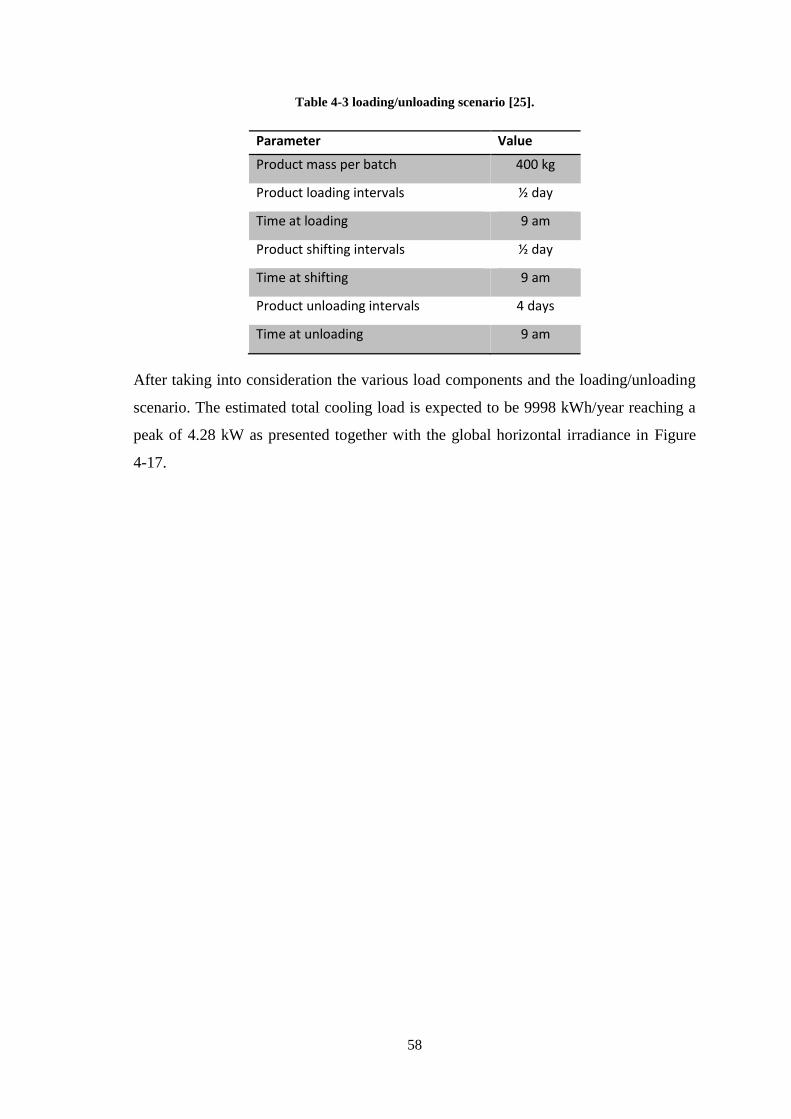
58
Table 4-3 loading/unloading scenario [25].
Parameter Value
Product mass per batch 400 kg
Product loading intervals ½ day
Time at loading 9 am
Product shifting intervals ½ day
Time at shifting 9 am
Product unloading intervals 4 days
Time at unloading 9 am
After taking into consideration the various load components and the loading/unloading
scenario. The estimated total cooling load is expected to be 9998 kWh/year reaching a
peak of 4.28 kW as presented together with the global horizontal irradiance in Figure
4-17.
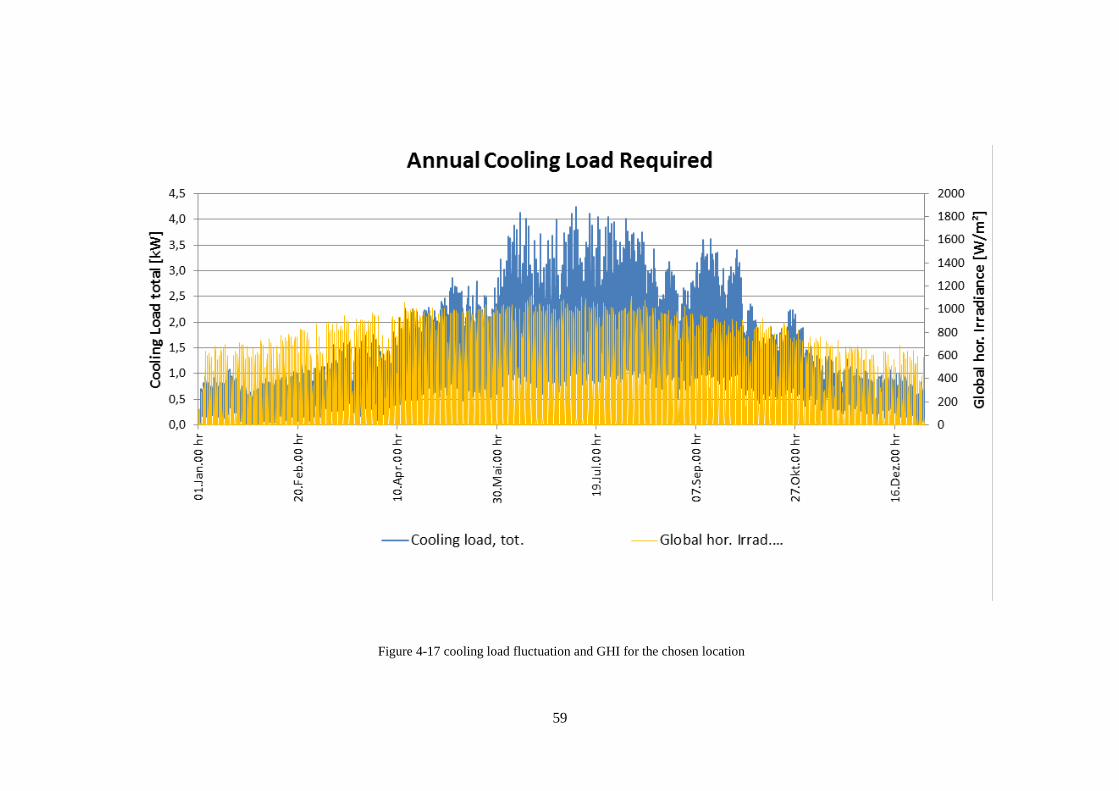
59
Figure 4-17 cooling load fluctuation and GHI for the chosen location
60
5 Case study
In this part, after indicating all the variables and their values, it will be described how
all the inputs are inserted in the excel model to compute the performance of the
components and the overall system as well as the solar fraction. From the various
technically feasible alternatives some will be selected to be economically assessed,
after estimating the required total cooling load to be 9998 kWh/a, depending on the pre-
mentioned load components and the assumed loading and unloading scenario. The
operation requirements will now define the size and the required capacity of the system
components. The technical solution is presented in the following section, in which
some possible alternatives are investigated and the criteria for the system are set.
Afterwards a technical feasibility and economical feasibility will be carried out to
determine the selected model.
5.1 Technical feasibility
In order to investigate the feasibility of the technical proposal, first the selection criteria
have to be set . As mentioned before the system has to abandon the dependency on the
Diesel generator, and should be of high economical value. These are the main aspects
set for the selection criteria.
All the system parameters were brought and implemented together in an excel-sheet to
simulate the interrelation between the various system components including the
boundary condition of each component. The input of this model is dynamic and can be
used for any material, any chiller capacity, PV field capacity, and any battery capacity.
The model runs on an hourly basis to simulate the load required and the source inputted
to supply that load for the whole year. The output is the solar fraction which is mainly
the percentage of the cooling load generated from the electric power harvested from the
sun, compared to the overall cooling demand.
5.1.1 System components and capacities
In the Excel-model the main system components’ sizes and capacities were inputted as
well as the PCM properties to calculate the solar fraction. The various alternatives are
including 4 different chiller capacities, 6 different PV field capacities, 6 different
battery capacities and 3 different PCM buffer sizes.
61
5.1.2 Selection criteria
While selecting the proposed system out of the executed excel-model, it is important to
keep the number of batteries as low as possible, but to have at least one battery. It is
required for the system to have a solar load coverage value between 99.5%- 99.9% with
a low number of underperforming hours. From each storage component various system
capacities are chosen, these technical alternatives are described and discussed in the
next section to indicate the most economical alternative. The systems are presented in
the following three figures for water, ice and Paraffin RT5HC respectively. These
figures represent the output of the tool. The output is the solar fraction. The cells having
the greenest color is representing the maximum solar coverage which is 100%. The
least solar coverage is represented in light red. The PCM mass increases when moving
towards the right, so as for the PV peak power. Moving downwards represent the
increase in the battery capacity and the chiller capacity. The selected technical
alternatives are framed in bold black. It is recommended to select as up, and left as
possible.
Figure 5-1 System matrix output using cold-water as thermal storage material, shows
the output of the cold-water storage. Three systems were selected having the same cold-
water mass of up to 3 tons with different battery, PV power and chiller capacity.
Figure 5-2 System matrix output using ice as thermal storage material, represents the
output of the tool for the alternative “ice-storage”. In comparison to Figure 5-1 it is
visible that the cold-water output chart shows more green cells in the chart, which is
due to a better chiller COP of the water system (higher evaporation temperature).
Nevertheless two alternatives of “ice-storage” can be selected, having the same battery
and chiller capacities, but different ice mass and PV peak power.
The third storage alternative is the Paraffin. The output of the system using Paraffin is
shown in Figure 5-3. Also two system alternatives were selected having different PV
peak-power.
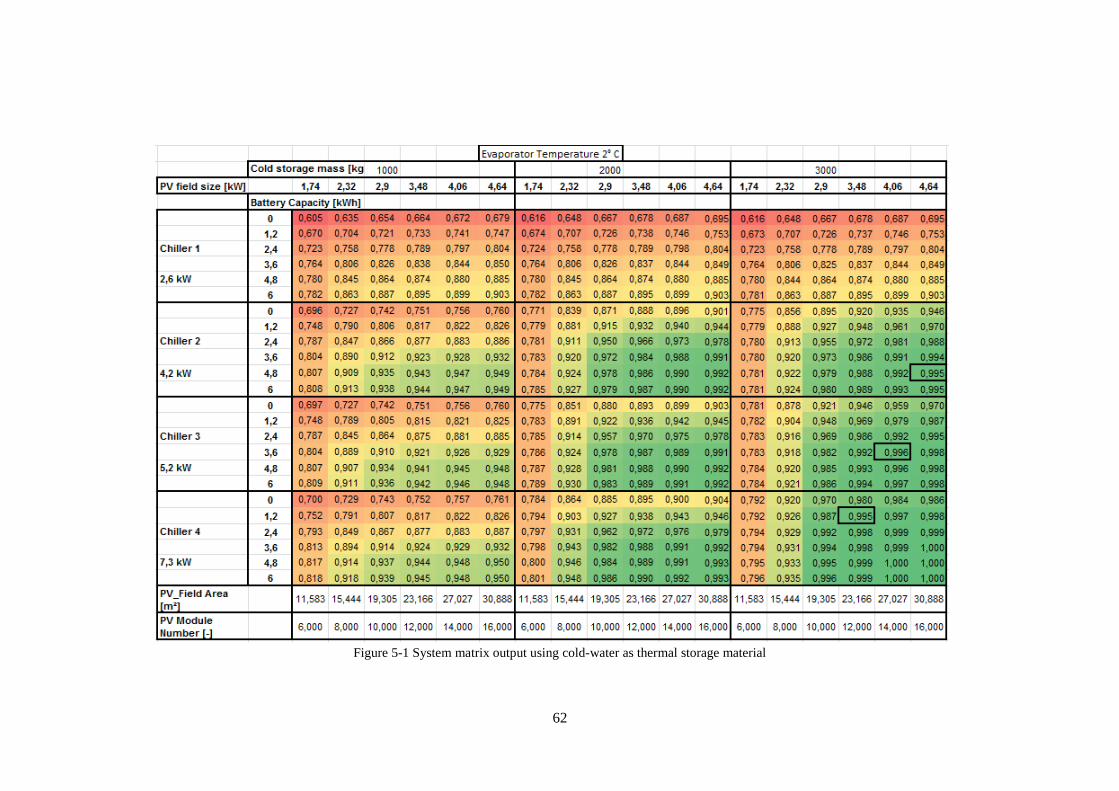
62
Figure 5-1 System matrix output using cold-water as thermal storage material
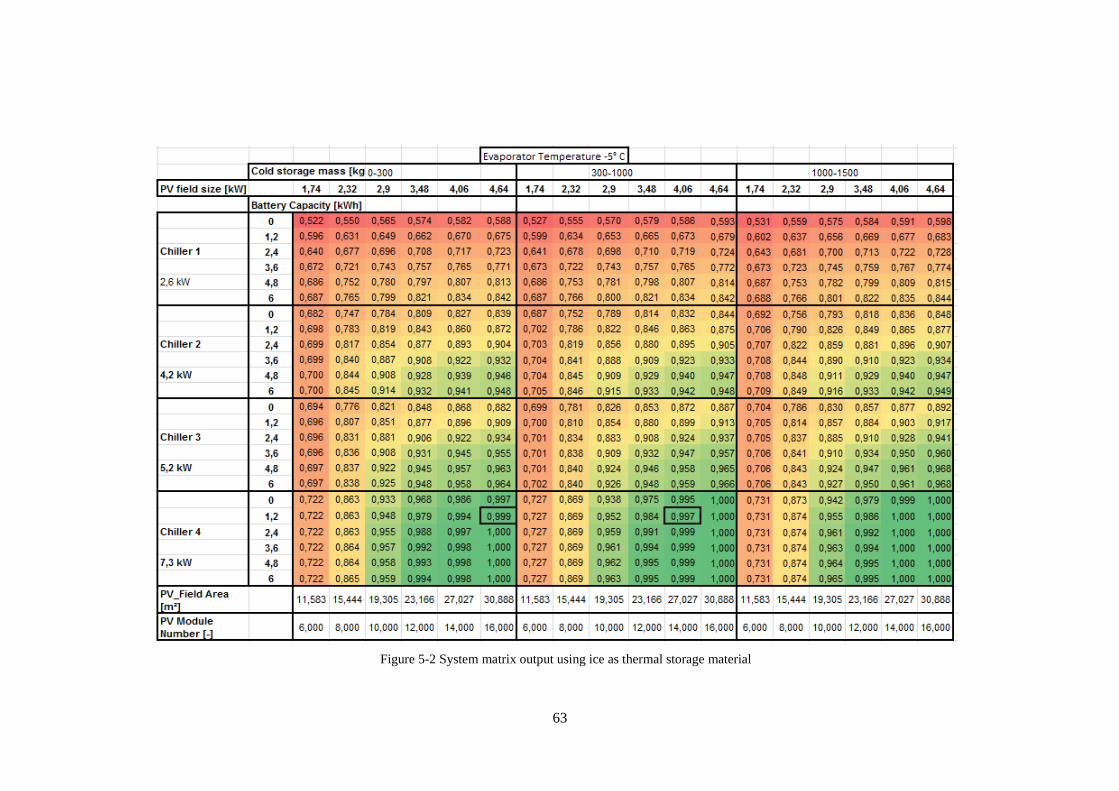
63
Figure 5-2 System matrix output using ice as thermal storage material
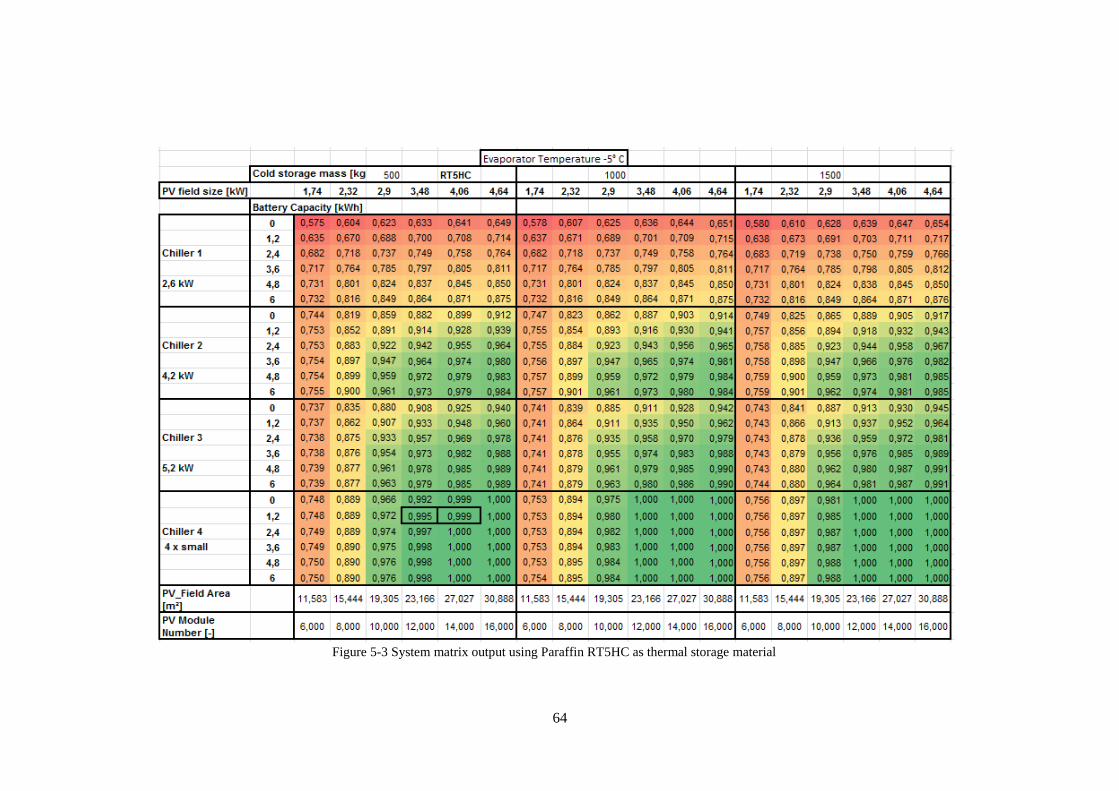
64
Figure 5-3 System matrix output using Paraffin RT5HC as thermal storage material
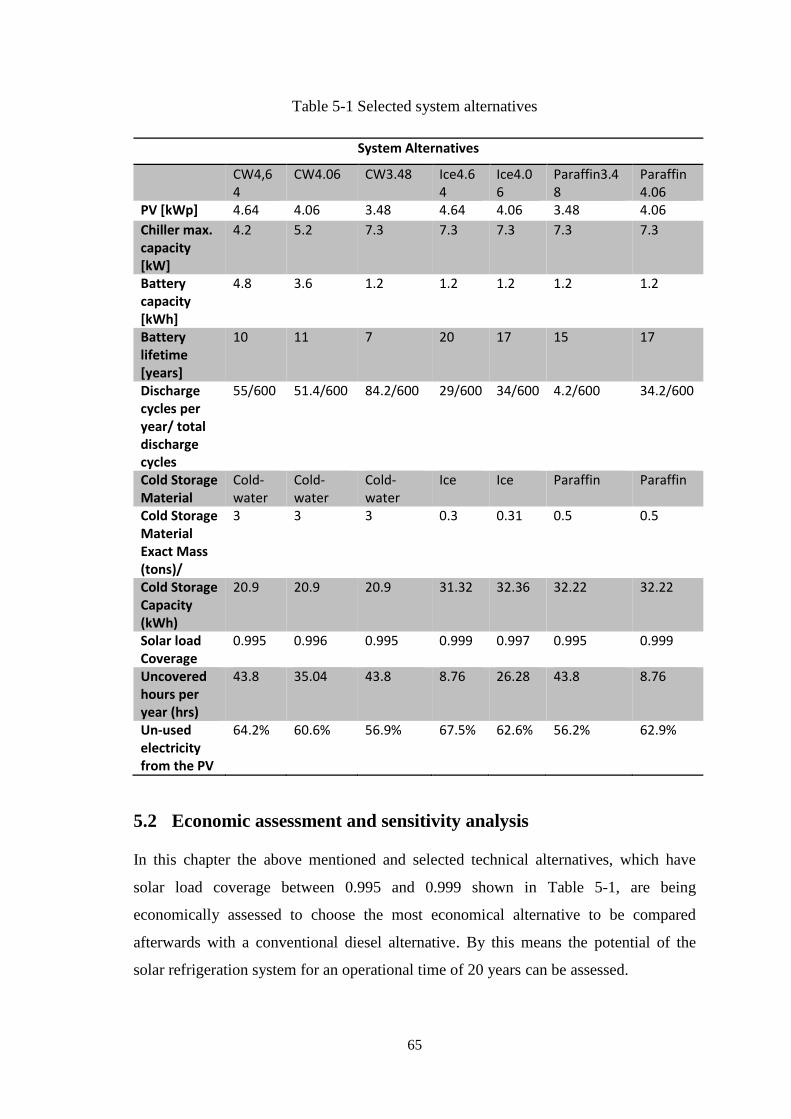
65
Table 5-1 Selected system alternatives
System Alternatives
CW4,64
CW4.06 CW3.48 Ice4.64
Ice4.06
Paraffin3.48
Paraffin 4.06
PV [kWp] 4.64 4.06 3.48 4.64 4.06 3.48 4.06
Chiller max. capacity [kW]
4.2 5.2 7.3 7.3 7.3 7.3 7.3
Battery capacity [kWh]
4.8 3.6 1.2 1.2 1.2 1.2 1.2
Battery lifetime [years]
10 11 7 20 17 15 17
Discharge cycles per year/ total discharge cycles
55/600 51.4/600 84.2/600 29/600
34/600
4.2/600 34.2/600
Cold Storage Material
Cold-water
Cold-water
Cold-water
Ice Ice Paraffin Paraffin
Cold Storage Material Exact Mass (tons)/
3 3 3 0.3 0.31 0.5 0.5
Cold Storage Capacity (kWh)
20.9 20.9 20.9 31.32 32.36 32.22 32.22
Solar load Coverage
0.995 0.996 0.995 0.999 0.997 0.995 0.999
Uncovered hours per year (hrs)
43.8 35.04 43.8 8.76 26.28 43.8 8.76
Un-used electricity from the PV
64.2% 60.6% 56.9% 67.5% 62.6% 56.2% 62.9%
5.2 Economic assessment and sensitivity analysis
In this chapter the above mentioned and selected technical alternatives, which have
solar load coverage between 0.995 and 0.999 shown in Table 5-1, are being
economically assessed to choose the most economical alternative to be compared
afterwards with a conventional diesel alternative. By this means the potential of the
solar refrigeration system for an operational time of 20 years can be assessed.
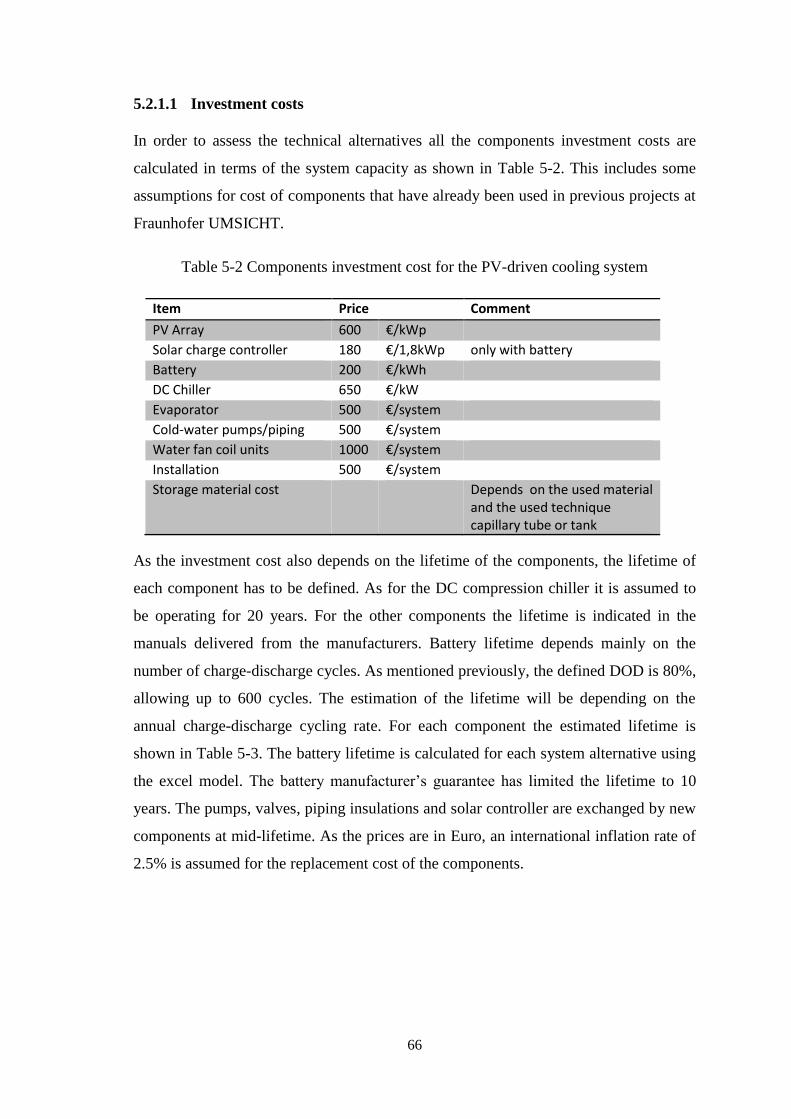
66
5.2.1.1 Investment costs
In order to assess the technical alternatives all the components investment costs are
calculated in terms of the system capacity as shown in Table 5-2. This includes some
assumptions for cost of components that have already been used in previous projects at
Fraunhofer UMSICHT.
Table 5-2 Components investment cost for the PV-driven cooling system
Item Price Comment
PV Array 600 €/kWp
Solar charge controller 180 €/1,8kWp only with battery
Battery 200 €/kWh
DC Chiller 650 €/kW
Evaporator 500 €/system
Cold-water pumps/piping 500 €/system
Water fan coil units 1000 €/system
Installation 500 €/system
Storage material cost Depends on the used material and the used technique capillary tube or tank
As the investment cost also depends on the lifetime of the components, the lifetime of
each component has to be defined. As for the DC compression chiller it is assumed to
be operating for 20 years. For the other components the lifetime is indicated in the
manuals delivered from the manufacturers. Battery lifetime depends mainly on the
number of charge-discharge cycles. As mentioned previously, the defined DOD is 80%,
allowing up to 600 cycles. The estimation of the lifetime will be depending on the
annual charge-discharge cycling rate. For each component the estimated lifetime is
shown in Table 5-3. The battery lifetime is calculated for each system alternative using
the excel model. The battery manufacturer’s guarantee has limited the lifetime to 10
years. The pumps, valves, piping insulations and solar controller are exchanged by new
components at mid-lifetime. As the prices are in Euro, an international inflation rate of
2.5% is assumed for the replacement cost of the components.
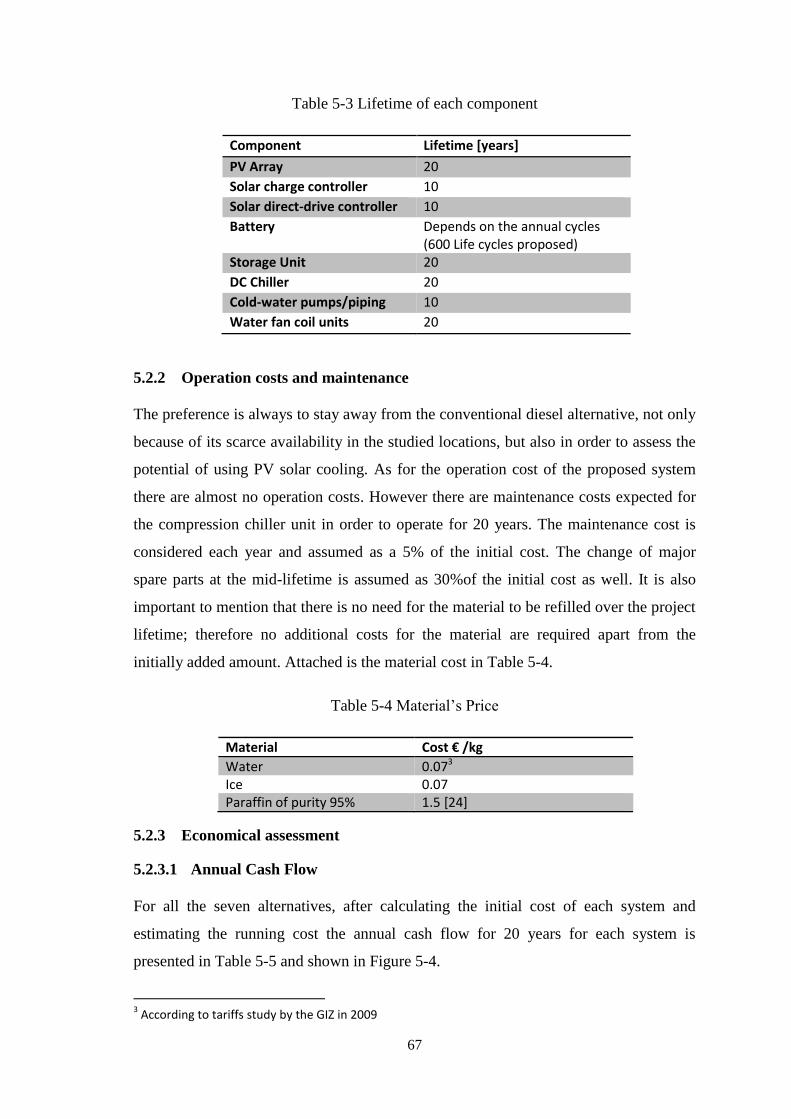
67
Table 5-3 Lifetime of each component
Component Lifetime [years]
PV Array 20
Solar charge controller 10
Solar direct-drive controller 10
Battery Depends on the annual cycles (600 Life cycles proposed)
Storage Unit 20
DC Chiller 20
Cold-water pumps/piping 10
Water fan coil units 20
5.2.2 Operation costs and maintenance
The preference is always to stay away from the conventional diesel alternative, not only
because of its scarce availability in the studied locations, but also in order to assess the
potential of using PV solar cooling. As for the operation cost of the proposed system
there are almost no operation costs. However there are maintenance costs expected for
the compression chiller unit in order to operate for 20 years. The maintenance cost is
considered each year and assumed as a 5% of the initial cost. The change of major
spare parts at the mid-lifetime is assumed as 30%of the initial cost as well. It is also
important to mention that there is no need for the material to be refilled over the project
lifetime; therefore no additional costs for the material are required apart from the
initially added amount. Attached is the material cost in Table 5-4.
Table 5-4 Material’s Price
Material Cost € /kg
Water 0.073 Ice 0.07 Paraffin of purity 95% 1.5 [24]
5.2.3 Economical assessment
5.2.3.1 Annual Cash Flow
For all the seven alternatives, after calculating the initial cost of each system and
estimating the running cost the annual cash flow for 20 years for each system is
presented in Table 5-5 and shown in Figure 5-4.
3 According to tariffs study by the GIZ in 2009
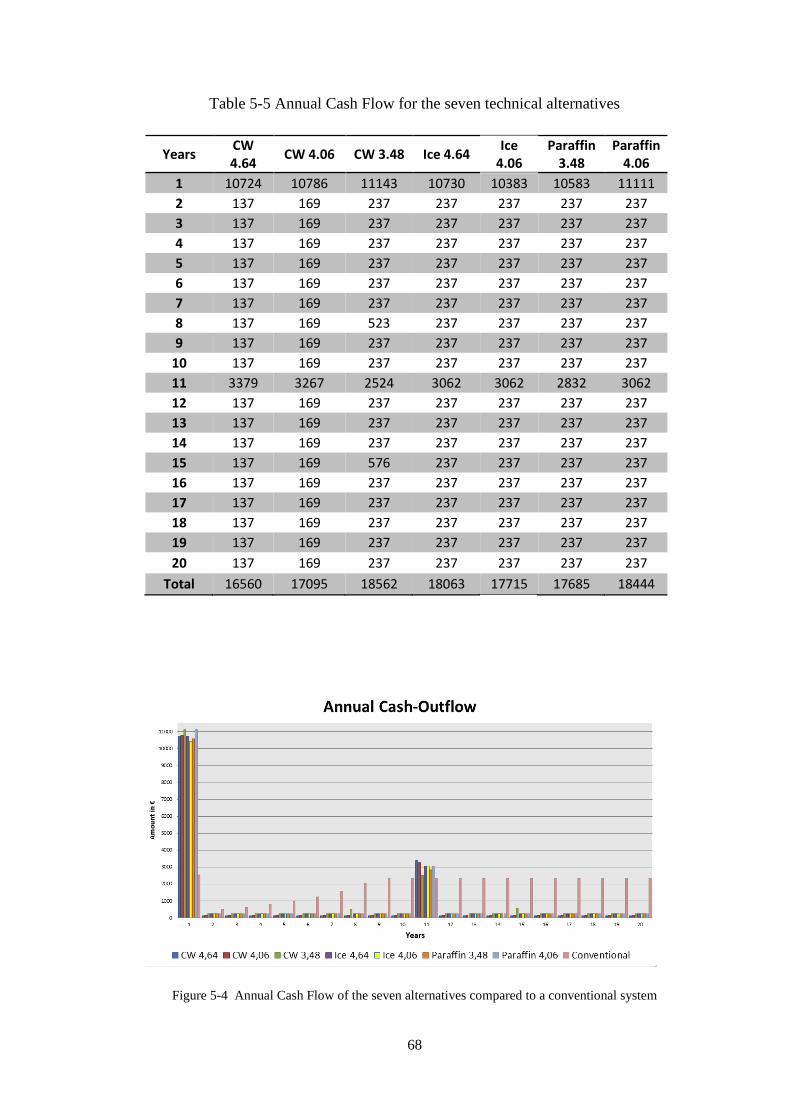
68
Table 5-5 Annual Cash Flow for the seven technical alternatives
Years CW 4.64
CW 4.06 CW 3.48 Ice 4.64 Ice
4.06 Paraffin
3.48 Paraffin
4.06
1 10724 10786 11143 10730 10383 10583 11111
2 137 169 237 237 237 237 237
3 137 169 237 237 237 237 237
4 137 169 237 237 237 237 237
5 137 169 237 237 237 237 237
6 137 169 237 237 237 237 237
7 137 169 237 237 237 237 237
8 137 169 523 237 237 237 237
9 137 169 237 237 237 237 237
10 137 169 237 237 237 237 237
11 3379 3267 2524 3062 3062 2832 3062
12 137 169 237 237 237 237 237
13 137 169 237 237 237 237 237
14 137 169 237 237 237 237 237
15 137 169 576 237 237 237 237
16 137 169 237 237 237 237 237
17 137 169 237 237 237 237 237
18 137 169 237 237 237 237 237
19 137 169 237 237 237 237 237
20 137 169 237 237 237 237 237
Total 16560 17095 18562 18063 17715 17685 18444
Figure 5-4 Annual Cash Flow of the seven alternatives compared to a conventional system
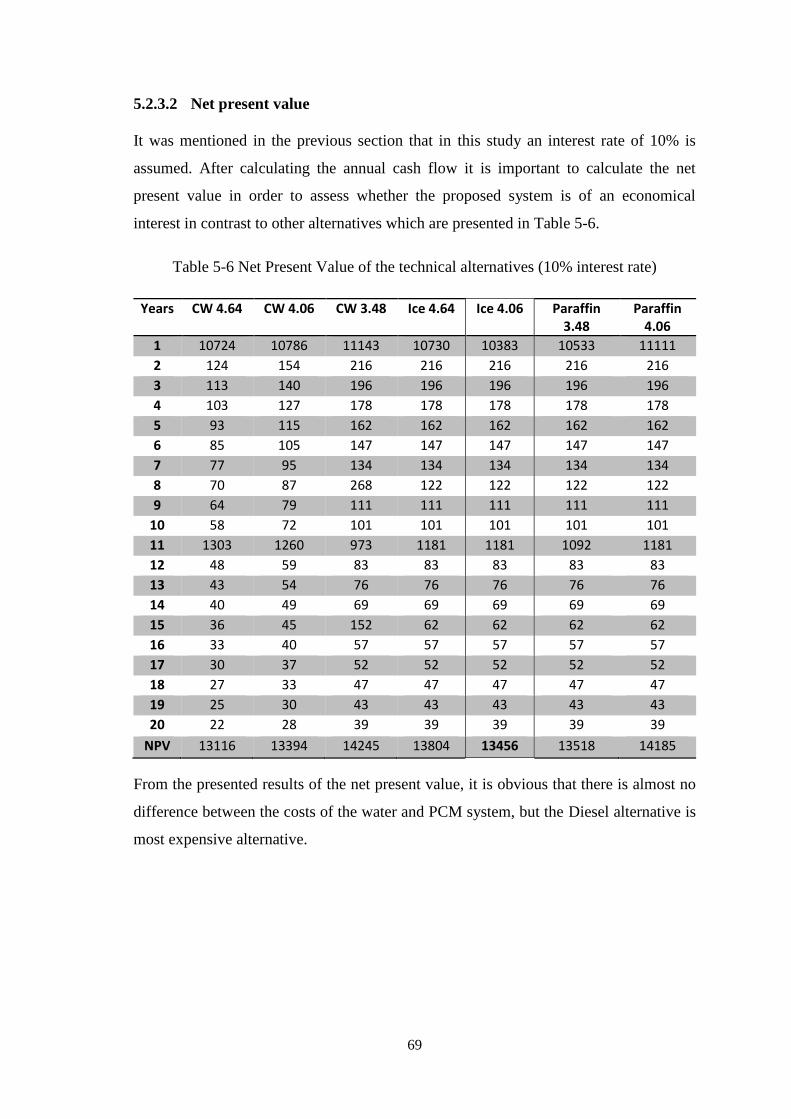
69
5.2.3.2 Net present value
It was mentioned in the previous section that in this study an interest rate of 10% is
assumed. After calculating the annual cash flow it is important to calculate the net
present value in order to assess whether the proposed system is of an economical
interest in contrast to other alternatives which are presented in Table 5-6.
Table 5-6 Net Present Value of the technical alternatives (10% interest rate)
Years CW 4.64 CW 4.06 CW 3.48 Ice 4.64 Ice 4.06 Paraffin 3.48
Paraffin 4.06
1 10724 10786 11143 10730 10383 10533 11111
2 124 154 216 216 216 216 216
3 113 140 196 196 196 196 196
4 103 127 178 178 178 178 178
5 93 115 162 162 162 162 162
6 85 105 147 147 147 147 147
7 77 95 134 134 134 134 134
8 70 87 268 122 122 122 122
9 64 79 111 111 111 111 111
10 58 72 101 101 101 101 101
11 1303 1260 973 1181 1181 1092 1181
12 48 59 83 83 83 83 83
13 43 54 76 76 76 76 76
14 40 49 69 69 69 69 69
15 36 45 152 62 62 62 62
16 33 40 57 57 57 57 57
17 30 37 52 52 52 52 52
18 27 33 47 47 47 47 47
19 25 30 43 43 43 43 43
20 22 28 39 39 39 39 39
NPV 13116 13394 14245 13804 13456 13518 14185
From the presented results of the net present value, it is obvious that there is almost no
difference between the costs of the water and PCM system, but the Diesel alternative is
most expensive alternative.
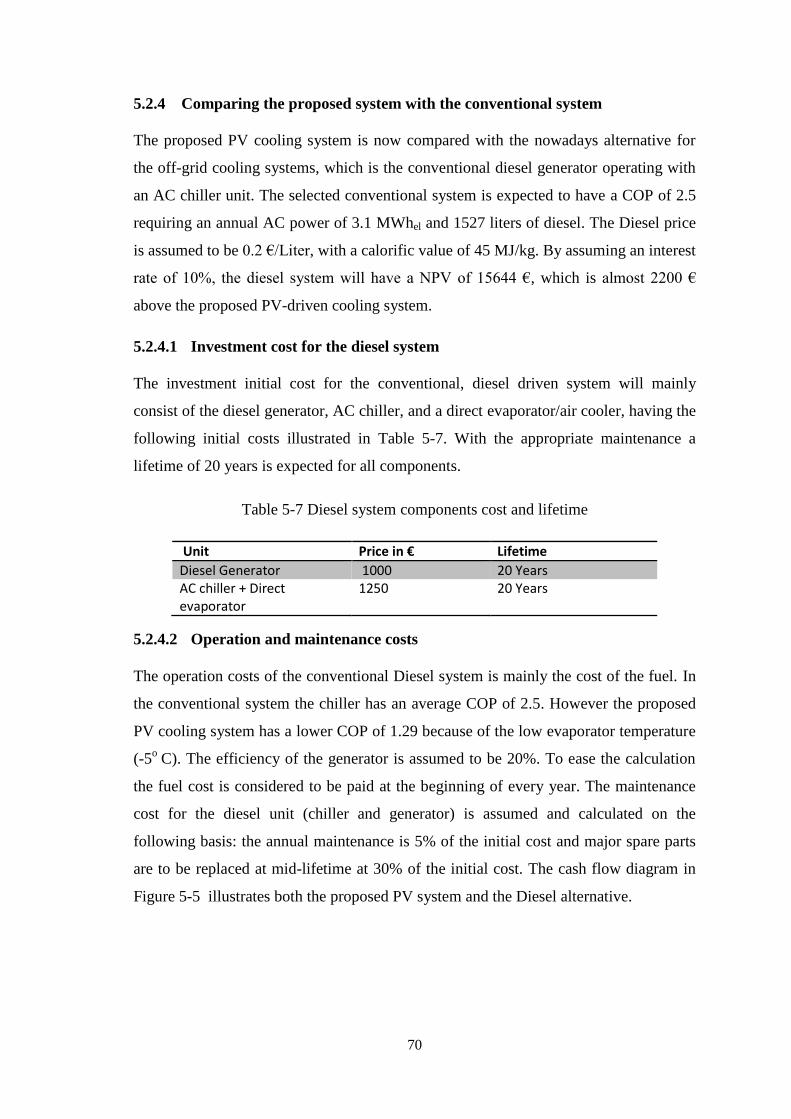
70
5.2.4 Comparing the proposed system with the conventional system
The proposed PV cooling system is now compared with the nowadays alternative for
the off-grid cooling systems, which is the conventional diesel generator operating with
an AC chiller unit. The selected conventional system is expected to have a COP of 2.5
requiring an annual AC power of 3.1 MWhel and 1527 liters of diesel. The Diesel price
is assumed to be 0.2 €/Liter, with a calorific value of 45 MJ/kg. By assuming an interest
rate of 10%, the diesel system will have a NPV of 15644 €, which is almost 2200 €
above the proposed PV-driven cooling system.
5.2.4.1 Investment cost for the diesel system
The investment initial cost for the conventional, diesel driven system will mainly
consist of the diesel generator, AC chiller, and a direct evaporator/air cooler, having the
following initial costs illustrated in Table 5-7. With the appropriate maintenance a
lifetime of 20 years is expected for all components.
Table 5-7 Diesel system components cost and lifetime
Unit Price in € Lifetime
Diesel Generator 1000 20 Years AC chiller + Direct evaporator
1250 20 Years
5.2.4.2 Operation and maintenance costs
The operation costs of the conventional Diesel system is mainly the cost of the fuel. In
the conventional system the chiller has an average COP of 2.5. However the proposed
PV cooling system has a lower COP of 1.29 because of the low evaporator temperature
(-5o
C). The efficiency of the generator is assumed to be 20%. To ease the calculation
the fuel cost is considered to be paid at the beginning of every year. The maintenance
cost for the diesel unit (chiller and generator) is assumed and calculated on the
following basis: the annual maintenance is 5% of the initial cost and major spare parts
are to be replaced at mid-lifetime at 30% of the initial cost. The cash flow diagram in
Figure 5-5 illustrates both the proposed PV system and the Diesel alternative.
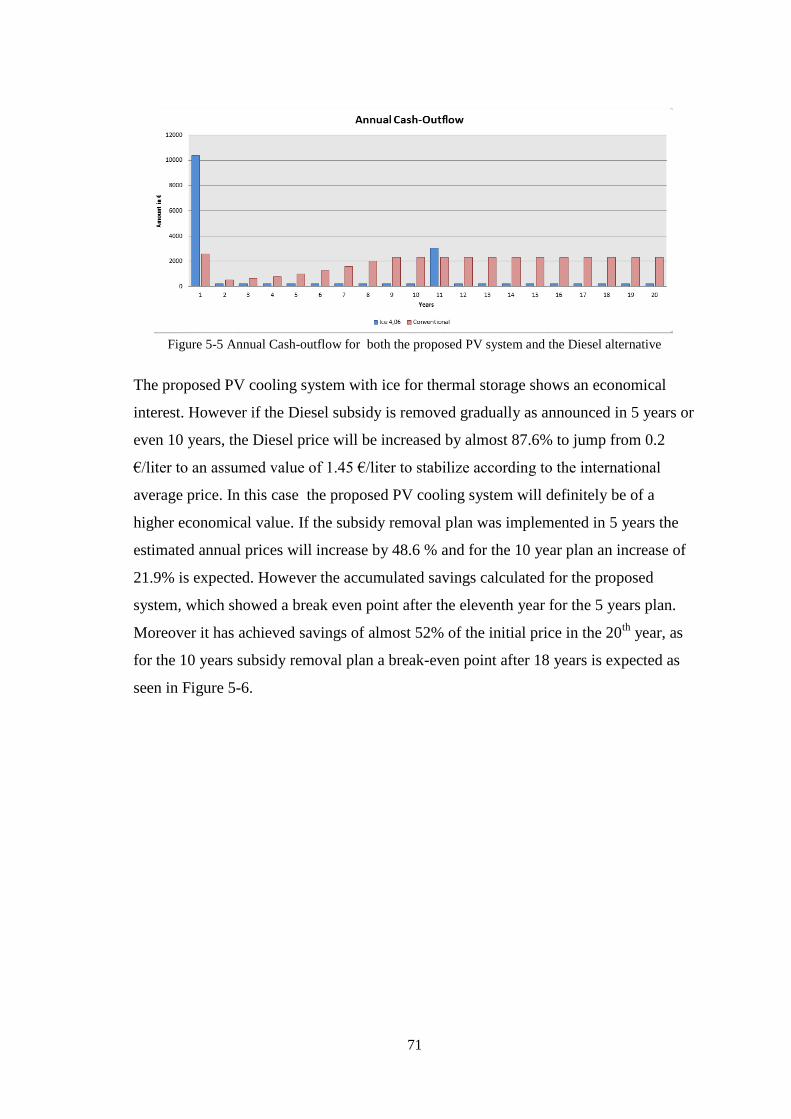
71
Figure 5-5 Annual Cash-outflow for both the proposed PV system and the Diesel alternative
The proposed PV cooling system with ice for thermal storage shows an economical
interest. However if the Diesel subsidy is removed gradually as announced in 5 years or
even 10 years, the Diesel price will be increased by almost 87.6% to jump from 0.2
€/liter to an assumed value of 1.45 €/liter to stabilize according to the international
average price. In this case the proposed PV cooling system will definitely be of a
higher economical value. If the subsidy removal plan was implemented in 5 years the
estimated annual prices will increase by 48.6 % and for the 10 year plan an increase of
21.9% is expected. However the accumulated savings calculated for the proposed
system, which showed a break even point after the eleventh year for the 5 years plan.
Moreover it has achieved savings of almost 52% of the initial price in the 20th
year, as
for the 10 years subsidy removal plan a break-even point after 18 years is expected as
seen in Figure 5-6.
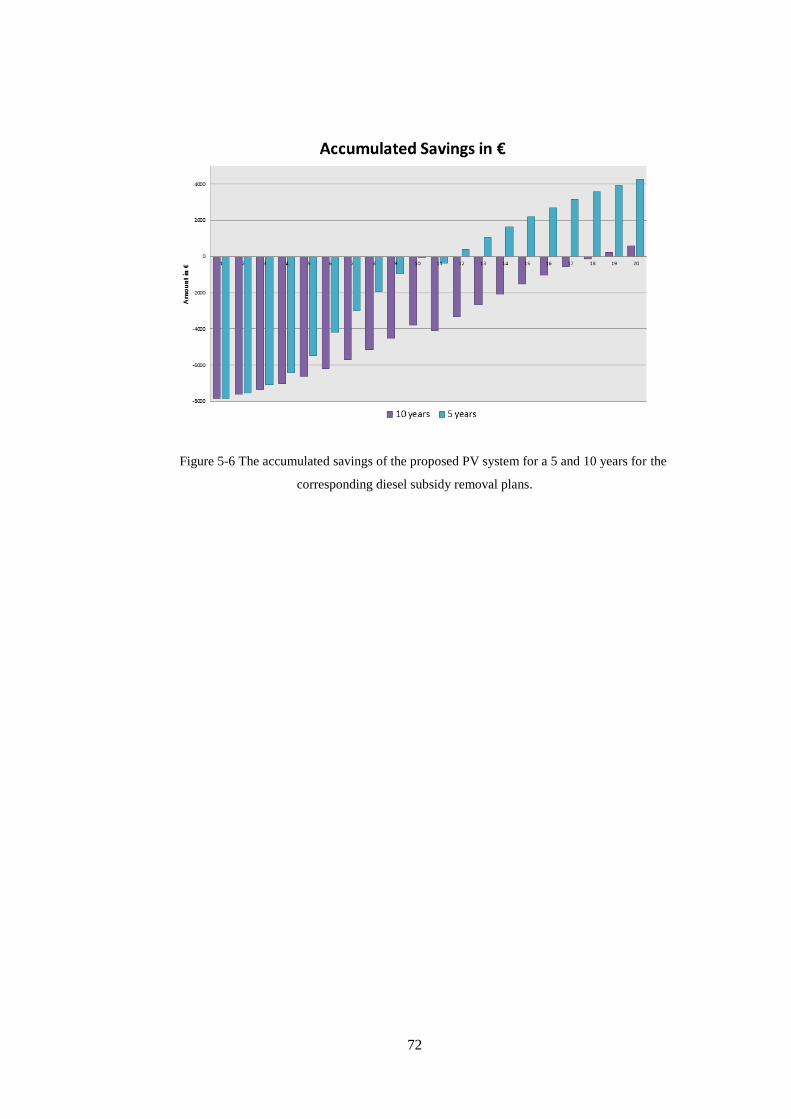
72
Figure 5-6 The accumulated savings of the proposed PV system for a 5 and 10 years for the
corresponding diesel subsidy removal plans.
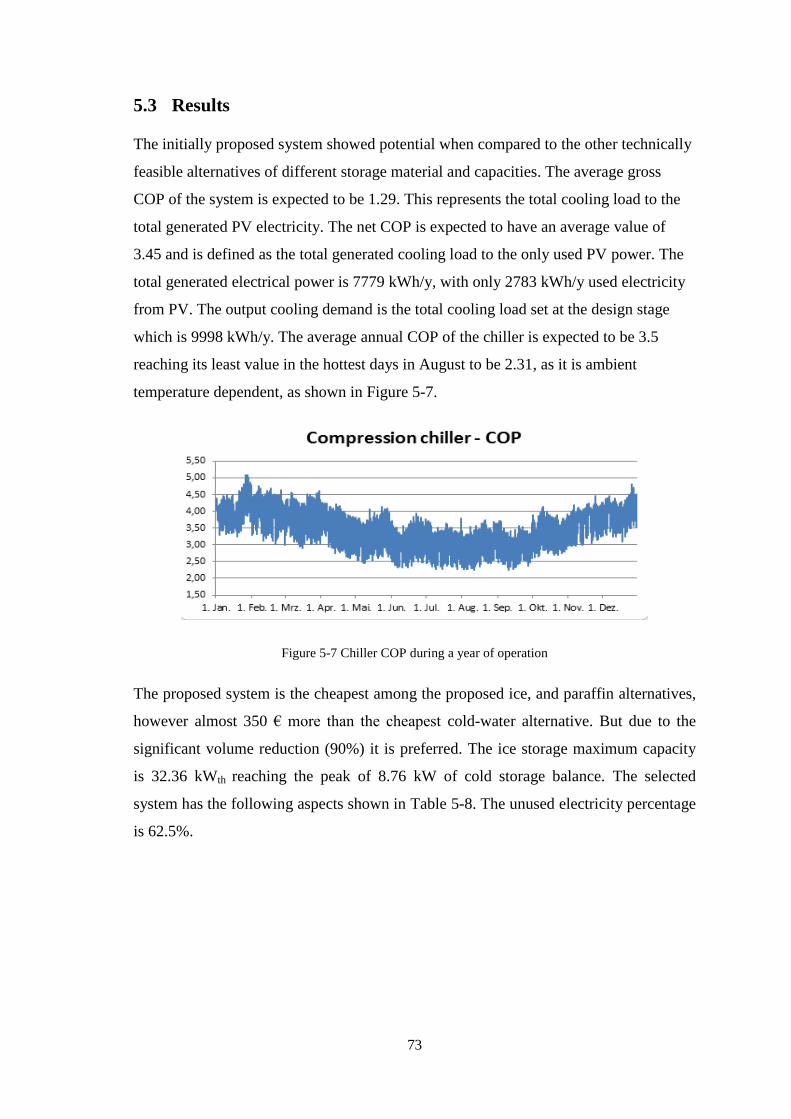
73
5.3 Results
The initially proposed system showed potential when compared to the other technically
feasible alternatives of different storage material and capacities. The average gross
COP of the system is expected to be 1.29. This represents the total cooling load to the
total generated PV electricity. The net COP is expected to have an average value of
3.45 and is defined as the total generated cooling load to the only used PV power. The
total generated electrical power is 7779 kWh/y, with only 2783 kWh/y used electricity
from PV. The output cooling demand is the total cooling load set at the design stage
which is 9998 kWh/y. The average annual COP of the chiller is expected to be 3.5
reaching its least value in the hottest days in August to be 2.31, as it is ambient
temperature dependent, as shown in Figure 5-7.
Figure 5-7 Chiller COP during a year of operation
The proposed system is the cheapest among the proposed ice, and paraffin alternatives,
however almost 350 € more than the cheapest cold-water alternative. But due to the
significant volume reduction (90%) it is preferred. The ice storage maximum capacity
is 32.36 kWth reaching the peak of 8.76 kW of cold storage balance. The selected
system has the following aspects shown in Table 5-8. The unused electricity percentage
is 62.5%.
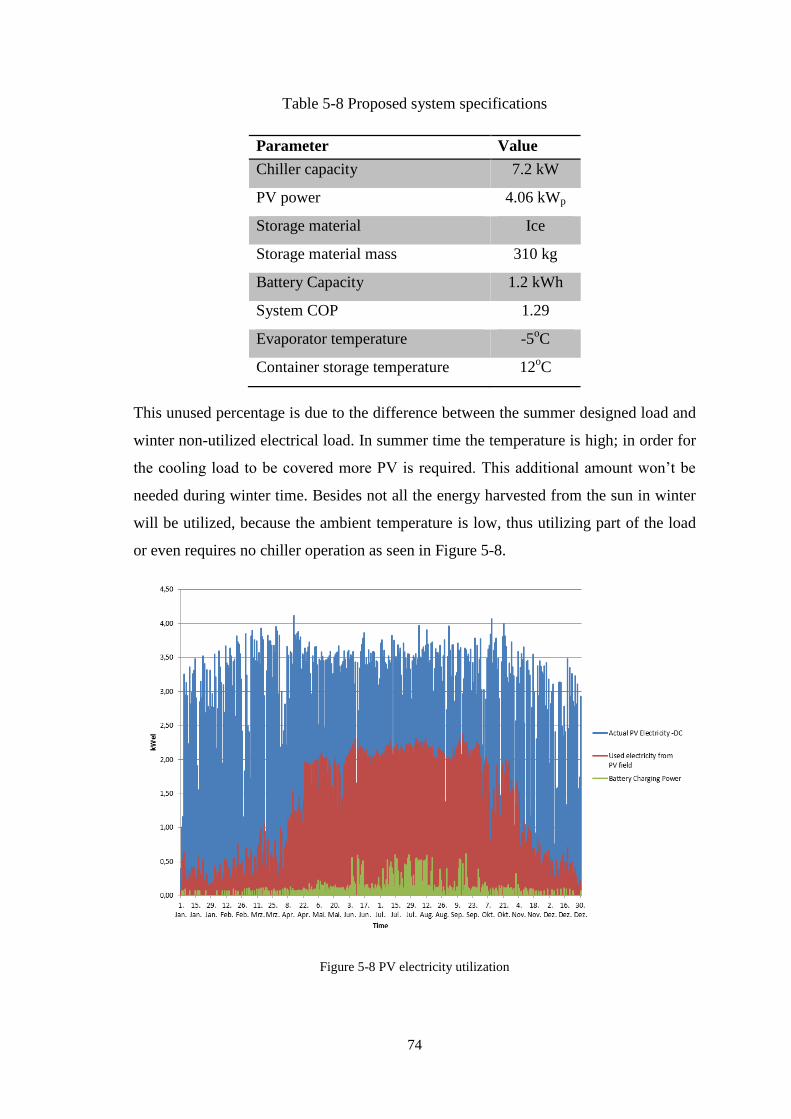
74
Table 5-8 Proposed system specifications
Parameter Value
Chiller capacity 7.2 kW
PV power 4.06 kWp
Storage material Ice
Storage material mass 310 kg
Battery Capacity 1.2 kWh
System COP 1.29
Evaporator temperature -5oC
Container storage temperature 12oC
This unused percentage is due to the difference between the summer designed load and
winter non-utilized electrical load. In summer time the temperature is high; in order for
the cooling load to be covered more PV is required. This additional amount won’t be
needed during winter time. Besides not all the energy harvested from the sun in winter
will be utilized, because the ambient temperature is low, thus utilizing part of the load
or even requires no chiller operation as seen in Figure 5-8.
Figure 5-8 PV electricity utilization
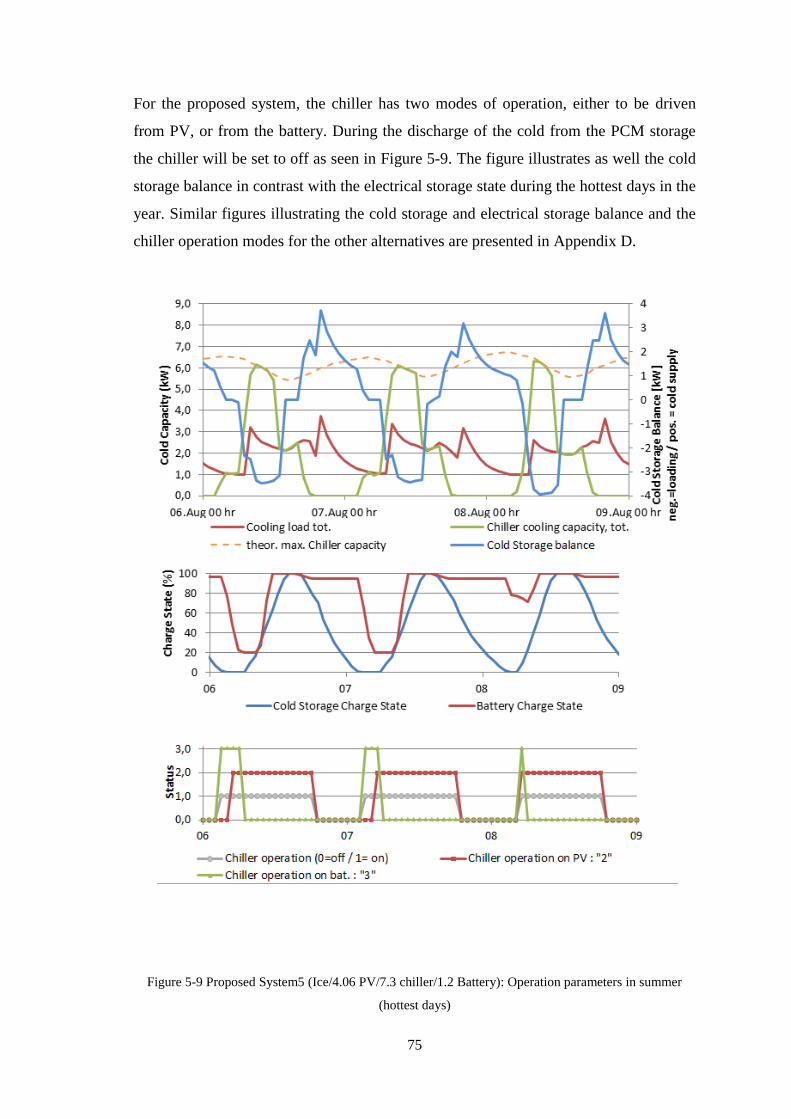
75
For the proposed system, the chiller has two modes of operation, either to be driven
from PV, or from the battery. During the discharge of the cold from the PCM storage
the chiller will be set to off as seen in Figure 5-9. The figure illustrates as well the cold
storage balance in contrast with the electrical storage state during the hottest days in the
year. Similar figures illustrating the cold storage and electrical storage balance and the
chiller operation modes for the other alternatives are presented in Appendix D.
Figure 5-9 Proposed System5 (Ice/4.06 PV/7.3 chiller/1.2 Battery): Operation parameters in summer
(hottest days)
76
6 Conclusion and recommendations
From the presented study the potential of the latent heat storage in replacing the
sensible heat storage unit can be noticed. As for the case, using 310 kg of ice as latent
heat storage maximized the storage capacity to reach 32.36 kWh, 36% more than the
storage capacity of 3 tons of water in the sensible range and 40% more for the same
mass of paraffin. Moreover the volume of the storage unit has reduced 90% compared
to cold-water storage.
The proposed system uses the direct contact principle of a capillary-tube matrix and
reaches a solar fraction of 99.7% with only about 26 insufficient operating hours per
year. The system is able to cover the required annual cooling load of 9998 kW. The
percentage of the used PV electricity is expected to be 37.4% as there is a huge amount
of unused generated electricity, due to the layout for summer maximum load and the
low cooling power demand in winter time.
In spite of the subsidized diesel price in Egypt, the proposed system shows an
economical interest, as the net present value including an inflation and interest rates of
2,5% and 10% respectively, was 13470 € against the conventional Diesel driven system
which costs 15644 € with difference of 2200 € for a 20 years’ lifetime assumed.
Moreover the proposed system saves the environment from 80.94 tons of CO2, and
0,918 tons of NOx for the same lifetime [31]. For a gradual subsidy removal plan of 5
and/or 10 years with an annual price increase of 48.6% and 21.9% respectively, the
proposed model shows a break even point after 11 and 18 years.
It is recommended for future researches to investigate the thermal storage using cascade
PCM storage with different phase change temperatures. Cascaded thermal storage
materials/composites might have the potential of holding the cold for longer time,
which means the operating time of the chiller is reduced, resulting in less battery
capacities and rest assured less costs.
Furthermore, other forms of PCM i.e. Nano-encapsulated PCM or PCMS for
refrigeration purposes are recommended for investigations well. Using capillary tube
matrix made of high thermal conductive material to allow rapid charging and
4 Estimated value according to the selected Diesel fuel with emission rate of 2.65 kg CO2/liter

77
discharging of heat from the storage would be recommended for future research work,
as well as applying the usage of multiple evaporators within the same container
allowing multiple storage temperatures.
78
7 Bibliography
[1] Rahman, M.Shafiur, Food Preservation, New York: Taylor and Francis, 2007.
[2] Y. A. Çengel, "Ch.17 Refrigeration and Freezing of Foods," in Heat and Mass Transfer: A
Practical Approach, 3rd ed., McGraw-Hill, 2007, pp. 17.1 - 17.58.
[3] Ming Liu, Wasim Saman, Frank, "Computer simulation with TRNSYS for a mobile
refrigeration system incorporating a phase change thermal storage unit," El Sevier, p. 10,
28 June 2014.
[4] Francis Agyenim, Ian Knight, & Michael Rhodes, "Design and experimental testing of the
performance of an outdoor," p. 10, 2010.
[5] X.Q. Zhai, X.L. Wang, T.Wang, R.Z Wang, "A review on phase change cold storage in air-
conditioning system: Materials and applications," 2013.
[6] Bahaj, A. S.; James, P., "Economics of Solar Powered Refrigerated Transport Applications,"
in Photovoltaic Specialists Conference, 2002.
[7] Foster, Robert E.; Estrada, Luis ; Bergeron, David, "Photovoltaic Direct Drive Refrigerator
with Ice Storage: Preliminary Monitoring Results," in ISES Solar World Congress, Adelaide,
Australia, 2001.
[8] M. K. Ewert and D. J. Bergeron, "Solar Powered Refrigeration System". United States of
America Patent US6469487, 22 October 2002.
[9] NASA, "Solar Powered Refrigeration System," 2 August 2011. [Online]. [Accessed 3
December 2013].
[10] D. Bergeron, "Solar Powered Refrigeation for Transport Application - A Feasibility Study,"
Sandia National Laboratories, 2001.
[11] ILK-Dresden, "Available Solar cooling application," ILK-Dresden .
[12] Asmaa Ahmed M.El-Bahloul, Ahmed Hamza H.Ali, and Shinichi Ookawara, "Investigation
of the performance of solar driven refrigerator for post harvest crops in hot arid remote
areas," New Borg El-Arab, 2014.
[13] Mehling; Cabeza, L.F, Heat and Cold Storage with PCM, Berlin: Springer-Verlag Berlin
Heidelberg, 2008.
[14] CALMAC, "Ice tank technology," USA.
[15] Hidemasa Ogoshi, Eiji Matsuyama,Hideyuki Miyamoto,Takeshi Mizukami - JFE Engineering
Corporation, "Clathrate Hydrate Slurry, CHS Thermal energy storage System," JFE, Japan,
79
2010.
[16] I. E. A. -, "Energy Storage Technology Roadmap," 14 March 2014. [Online]. [Accessed 22 9
2014].
[17] Thompson, James F., "Pre-cooling and Storage Facilities," in The Commercial Storage of
Fruits, Vegetables, and Florist and Nursery Stocks, Agriculture Handbook 66, United States
Department of Agriculture, ARS, Beltsville, 2004.
[18] Becker, Bryan R.; Fricke, Brian A., "Transpiration and Respiration of Fruits and
Vegetables," in New Developments in Refrigeration for Food Safety and Quality,
International Institute of Refrigeration, Paris, France and American Society of Agricultural
Engineers, St.Joseph, Michigan, 1996, pp. 110-121.
[19] American Society for Heating, Refrigeration, and Air-conditioning Engineers, ASHRAE
Handbook - Refrigeration, ASHRAE, 2002.
[20] National Horticulture Board, "Cold Storage for Horticultural Produce Requiring Pre-
cooling Before Storage," Ministry of Agriculture, Government of India, Haryana, 2010.
[21] Solanki, Chetan Singh, Solar Photovoltaics: Fundumemntals, Technologies, and
Applications, New Delhi: Asoke K.Ghosh, PHl Learning private limited, 2009.
[22] E. Oróa, A. de Gracia, A. Castell, M.M. Farid & L.F. Cabeza, "Review on phase change
materials (PCMs) for cold thermal energy storage applications," El sevier, 2012.
[23] L.F Cabeza, A.Castell, C.Barreneche, A.de Gracia, A.I. Fernandez, "Materials used as PCM
in thermal energy storage in buildings: A review," El Sevier, p. 23, 2011.
[24] NREL (Jan Kosny, Nitin Shukla, and Ali Fallahi), "Cost Analysis of Simple Phase Change
Material-Enhanced Building Envelopes in Southern U.S. Climates," NREL, p. 74, 2013.
[25] M. Ayad, "Off grid PV-drive cooling for post-harvest crops in desert areas in Egypt,"
Fraunhofer UMSICHT, Oberhausen, 2014.
[26] B. BM, "Solar-Med-Atlas".
[27] V. Quaschning, "Electrische Beschreibung von Solarmodulen," in Regenerative
Energiesysteme, 6th ed., Hanser, 2009, p. 193.
[28] M. El-Refaie, Solar Radiation, 2011.
[29] MK Battery, US, Solar VRLA gel batteries, 2012.
[30] Masterflux, US, "Products - Condensing Units," 2014.

80
[31] Dipl.-Ing. Wolfgang Maus, Dr.rer.nat. Eberhard Jacob,Dipl.-Ing. Martin Härtl, Dipl.-Ing.
Philipp Seidenspinner, Prof. Dr. Georg Wachtmeister, "Synthetische Kraftstoffe – OME1:
Ein potenziell nachhaltig hergestellter," Internat. Wiener Motorensymposium, Fortschritt-
Berichte VDI Reihe 12, Nr. 777, Bd.1, 325-347 (2014).
[32] Belén Zalba, José Ma Marına, Luisa F. Cabezal, and Harald Mehling, "Review on thermal
energy storage with phase change: materials, heat transfer analysis and applications," El
sevier, 2002.
[33] Shenzen Shine Solar Co., Ltd, "Polycrystalline Solar Module," China.
[34] German Aerospace Centre (DLR), "Solar-Med-Atlas - Map".
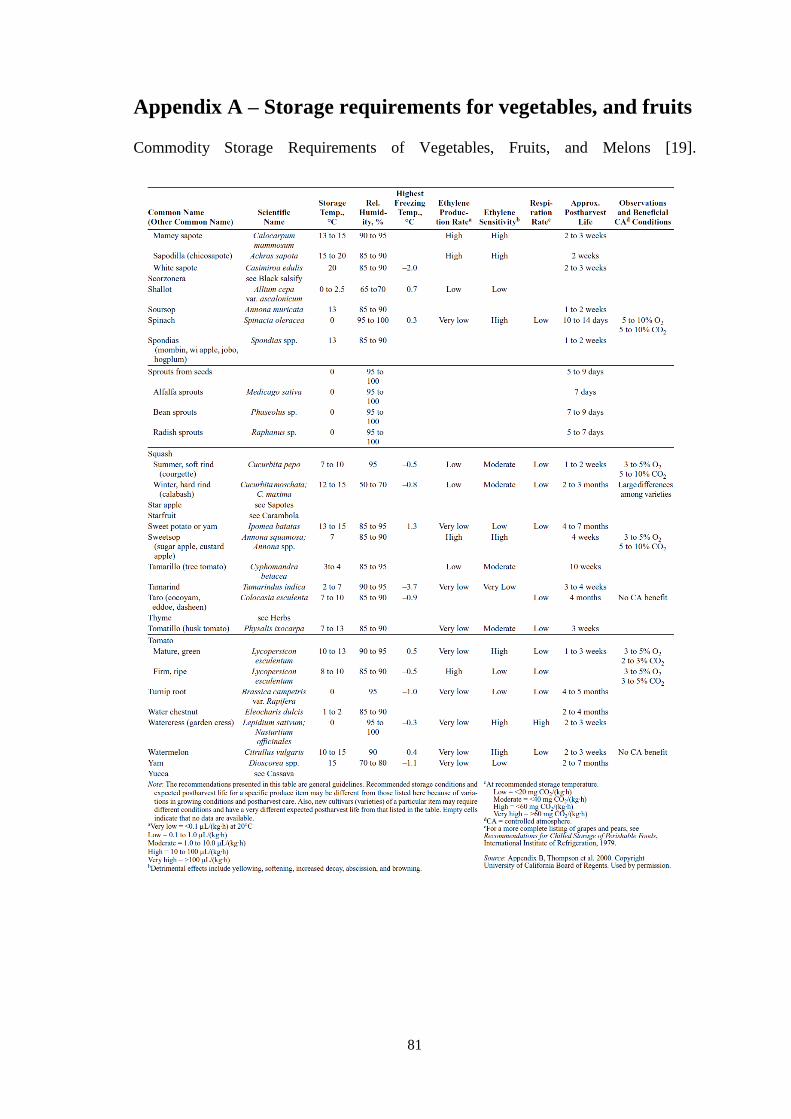
81
Appendix A – Storage requirements for vegetables, and fruits
Commodity Storage Requirements of Vegetables, Fruits, and Melons [19].
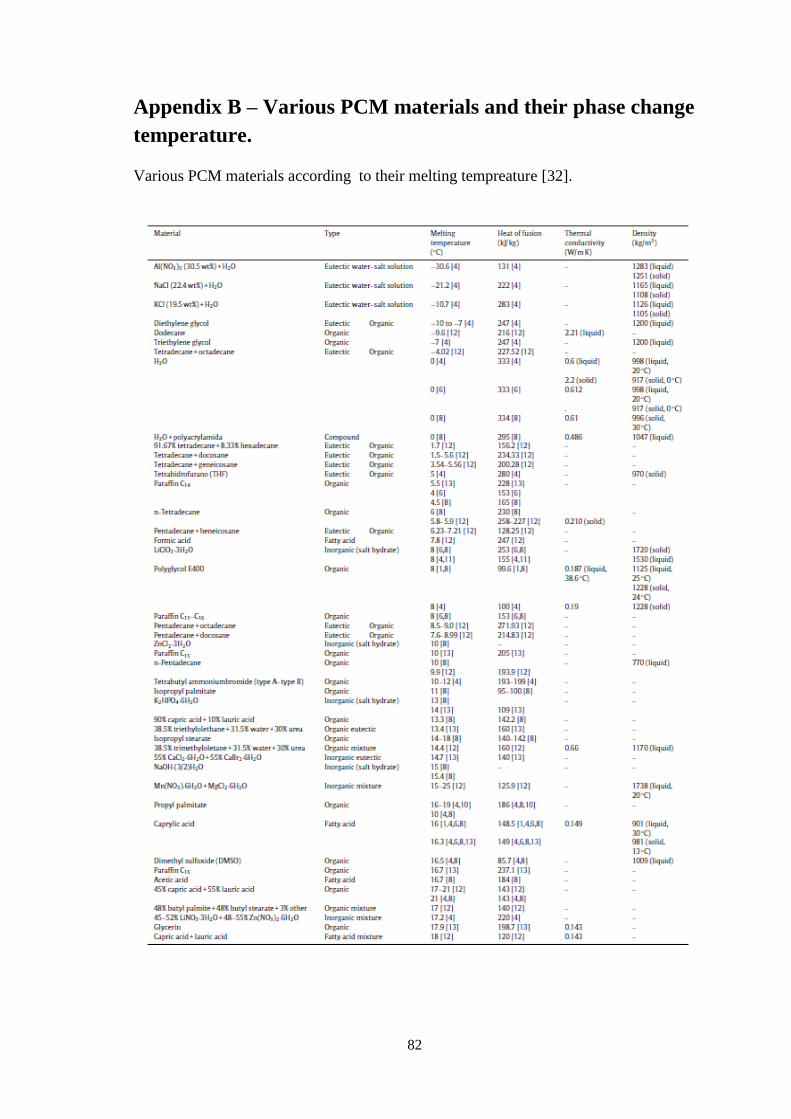
82
Appendix B – Various PCM materials and their phase change
temperature.
Various PCM materials according to their melting tempreature [32].
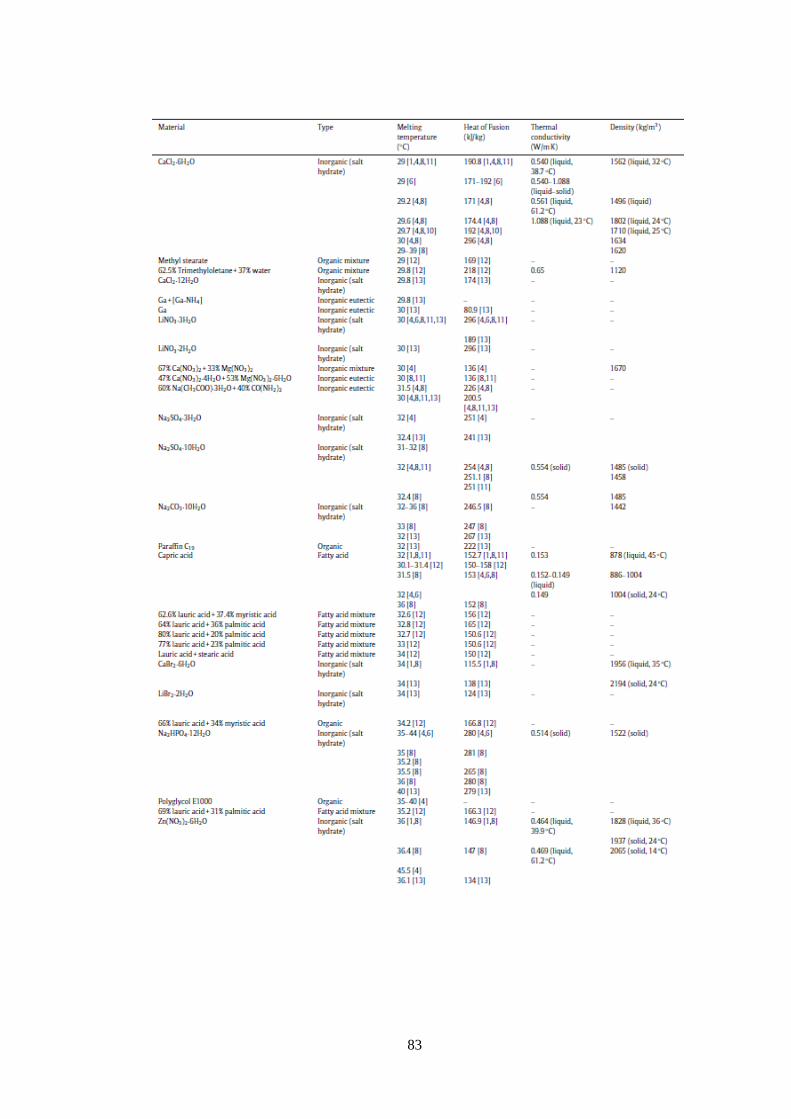
83
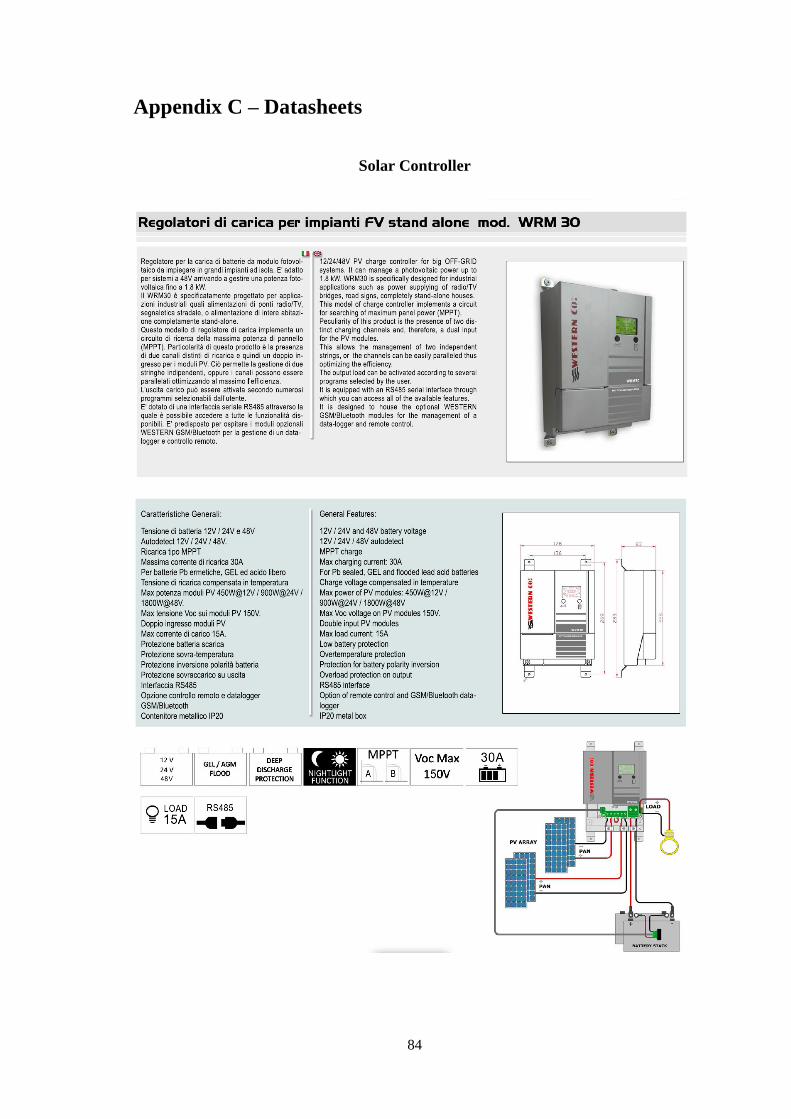
84
Appendix C – Datasheets
Solar Controller
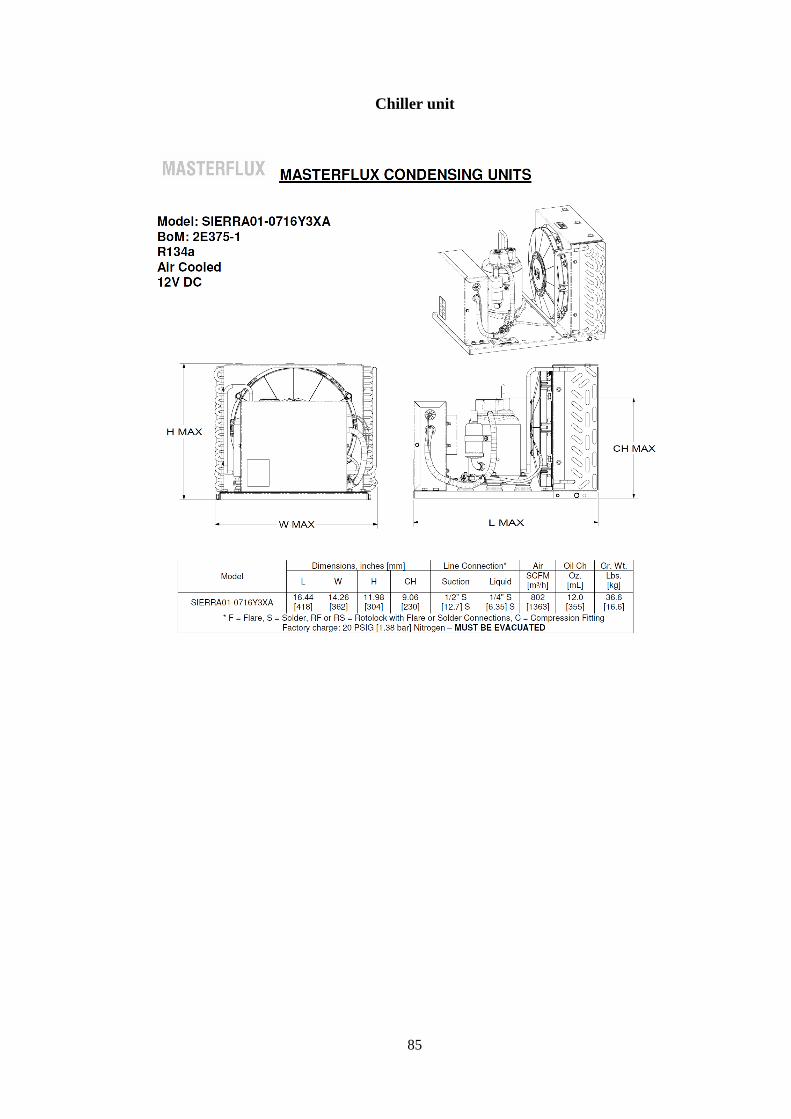
85
Chiller unit
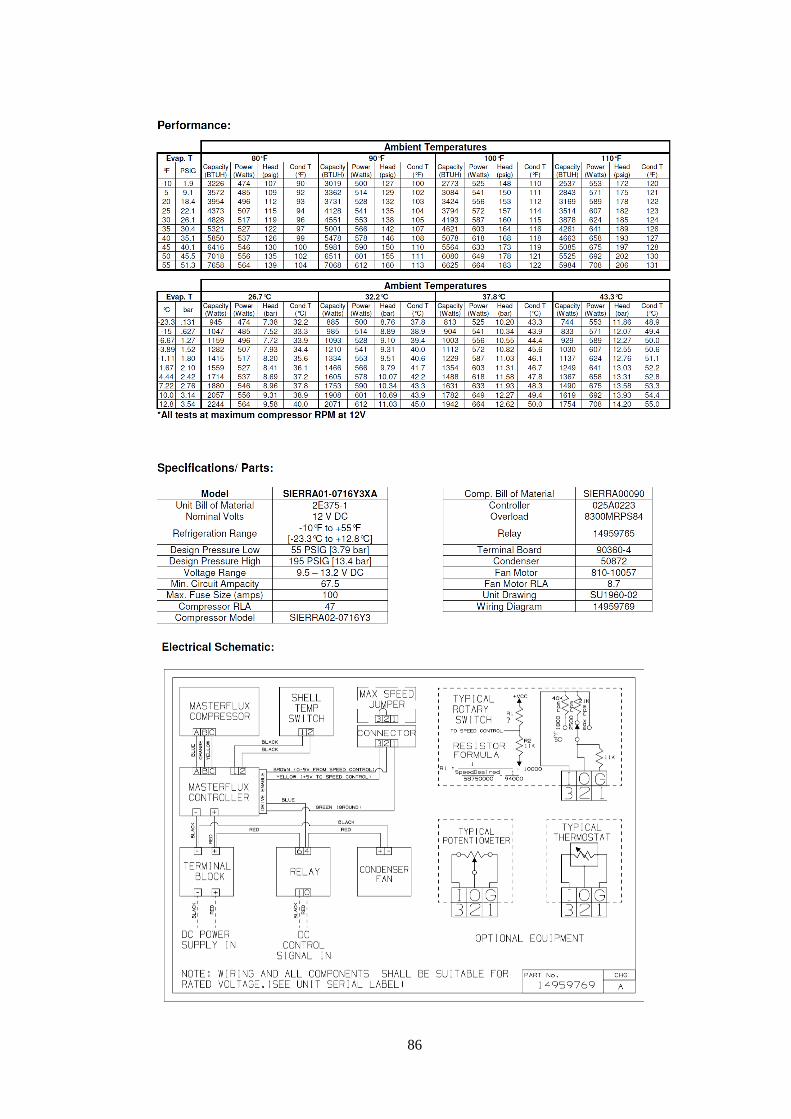
86
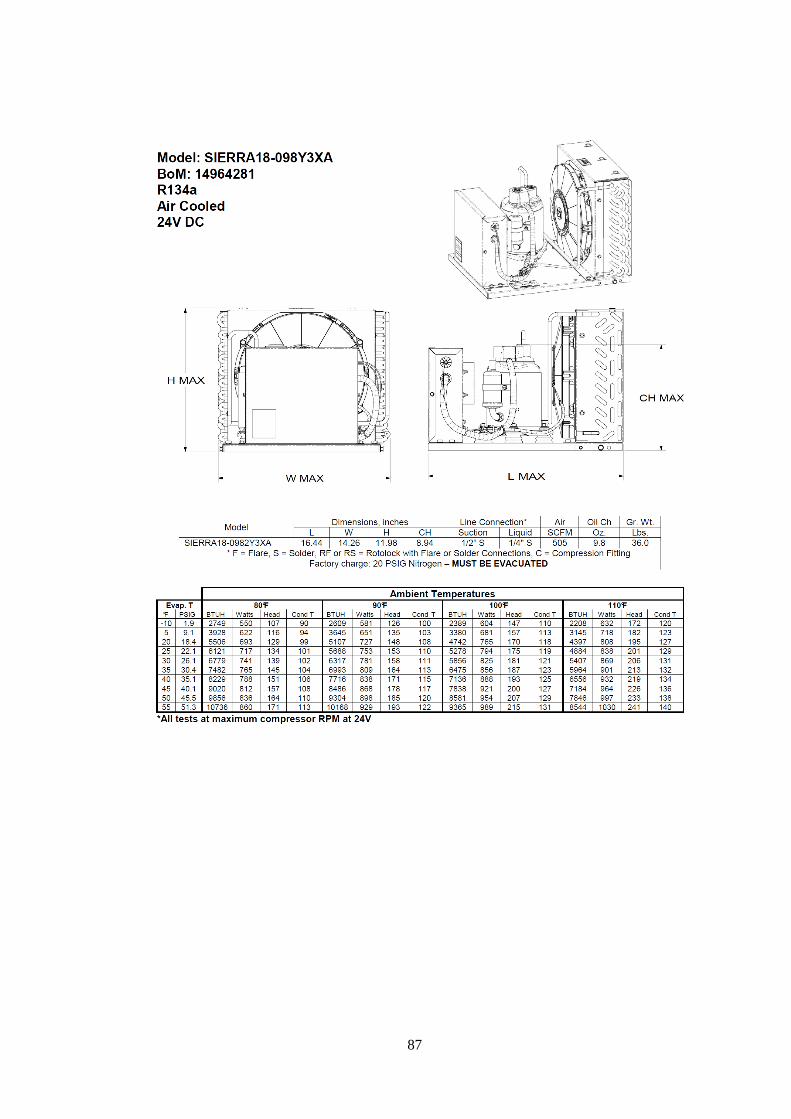
87
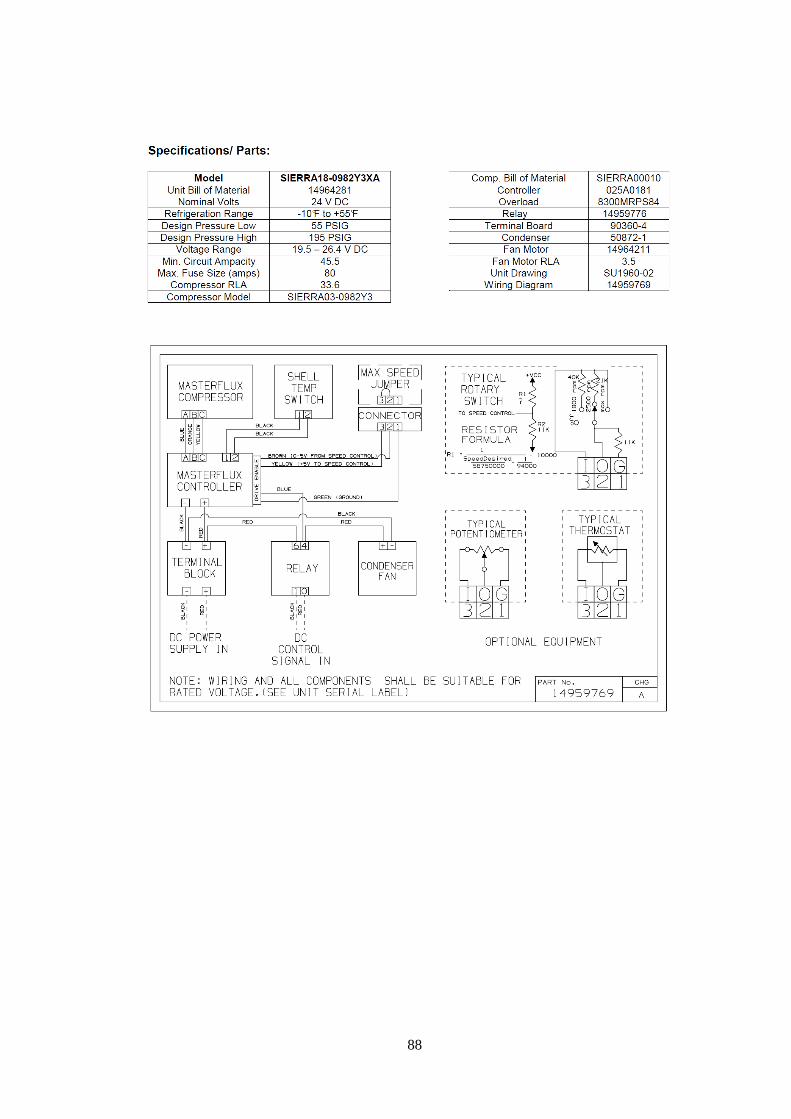
88
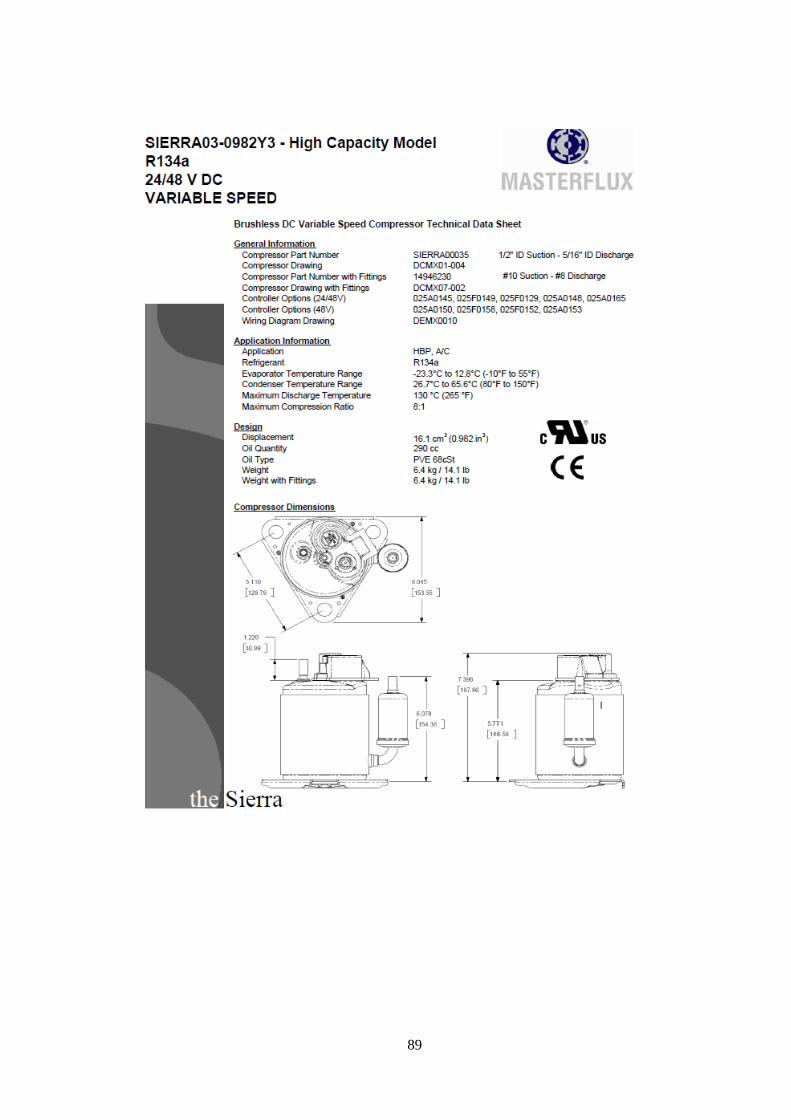
89
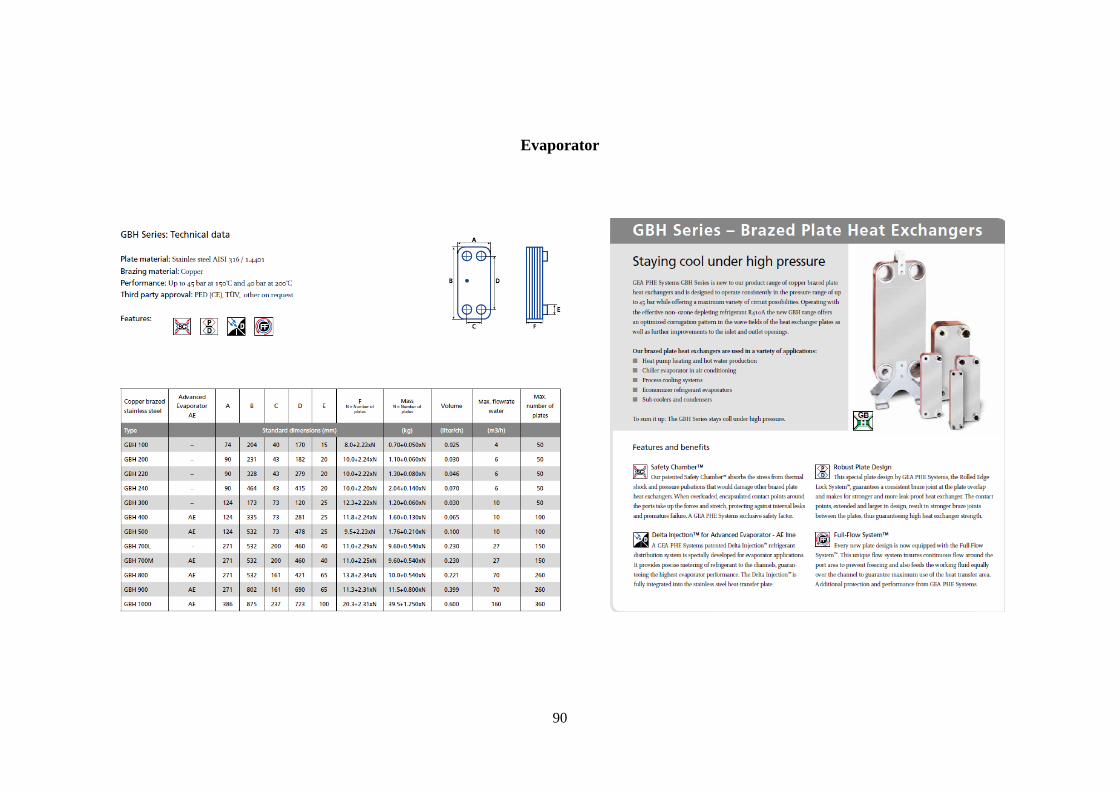
90
Evaporator
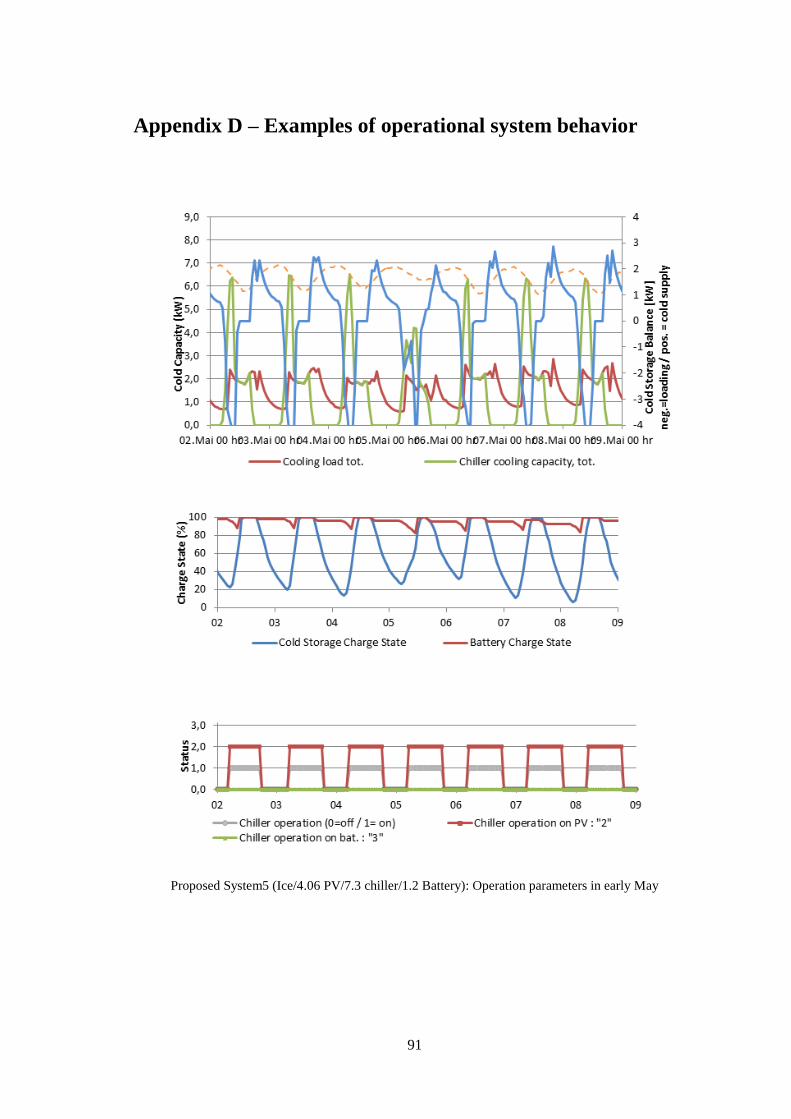
91
Appendix D – Examples of operational system behavior
Proposed System5 (Ice/4.06 PV/7.3 chiller/1.2 Battery): Operation parameters in early May
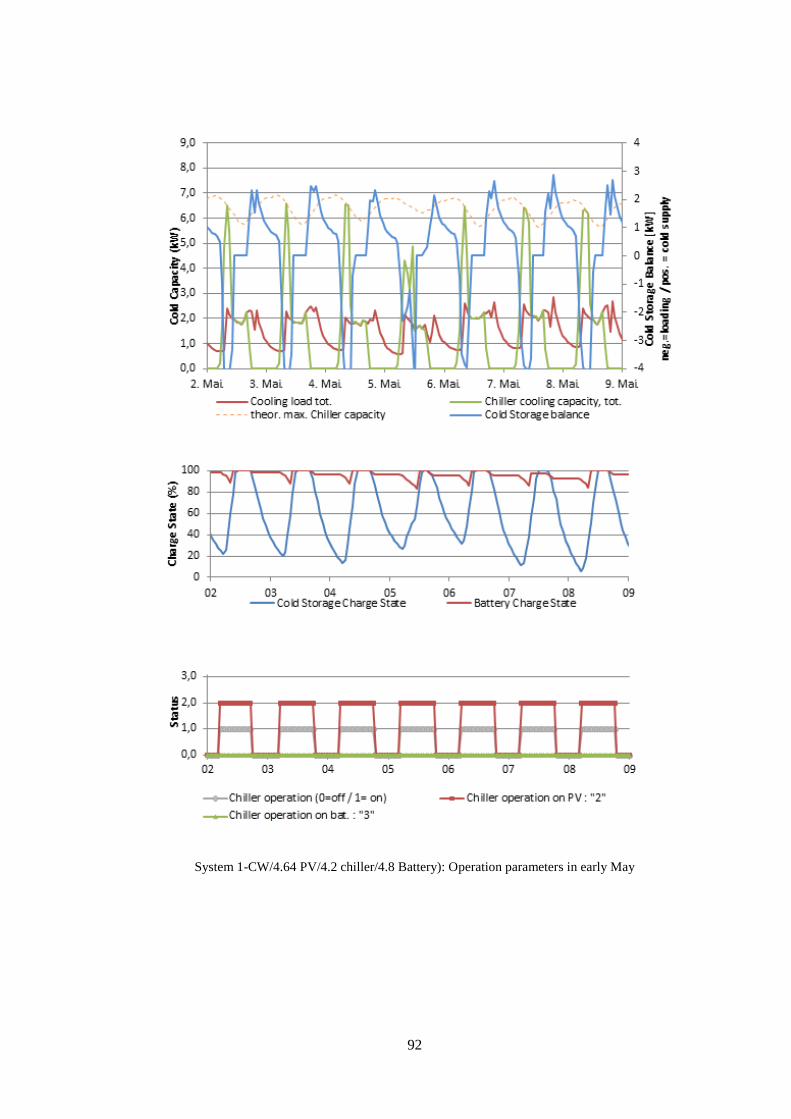
92
System 1-CW/4.64 PV/4.2 chiller/4.8 Battery): Operation parameters in early May
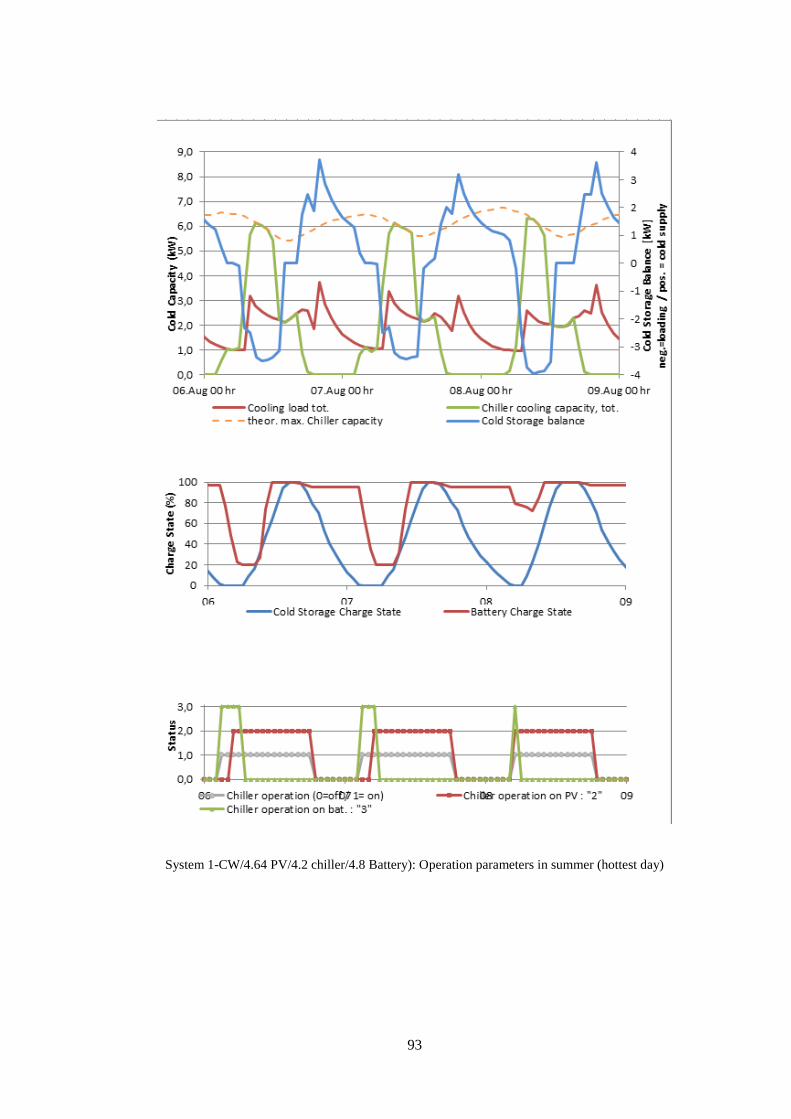
93
System 1-CW/4.64 PV/4.2 chiller/4.8 Battery): Operation parameters in summer (hottest day)
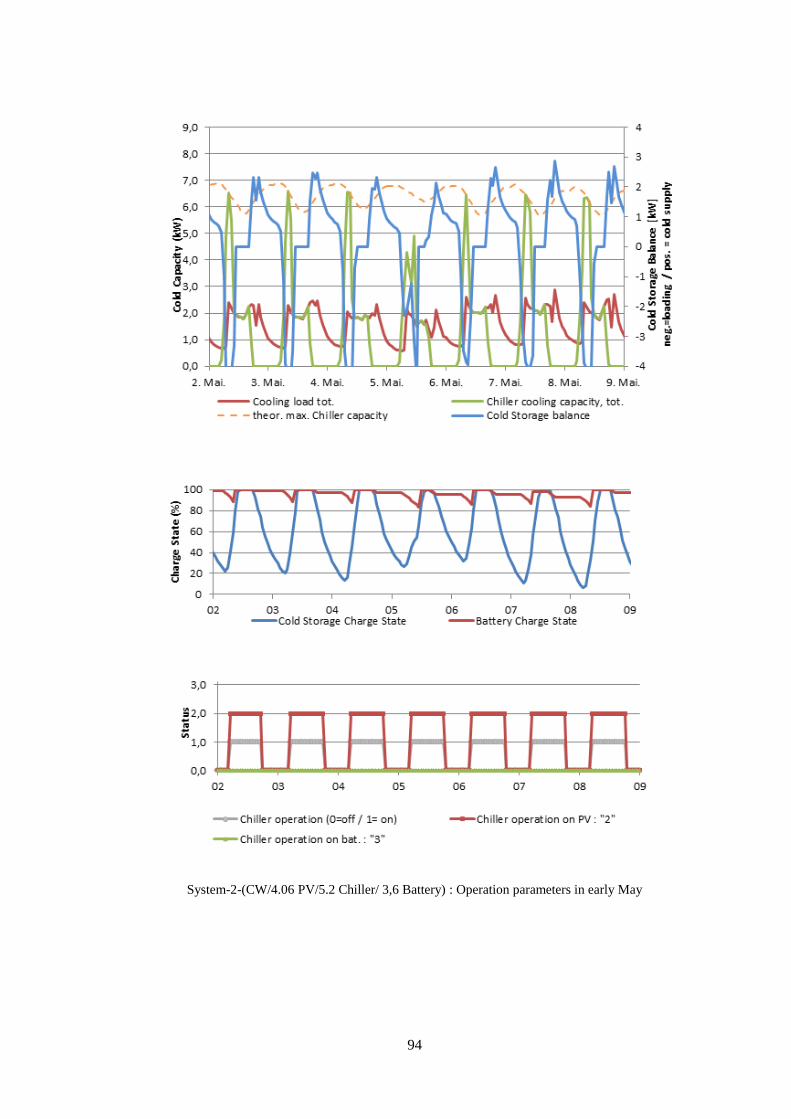
94
System-2-(CW/4.06 PV/5.2 Chiller/ 3,6 Battery) : Operation parameters in early May
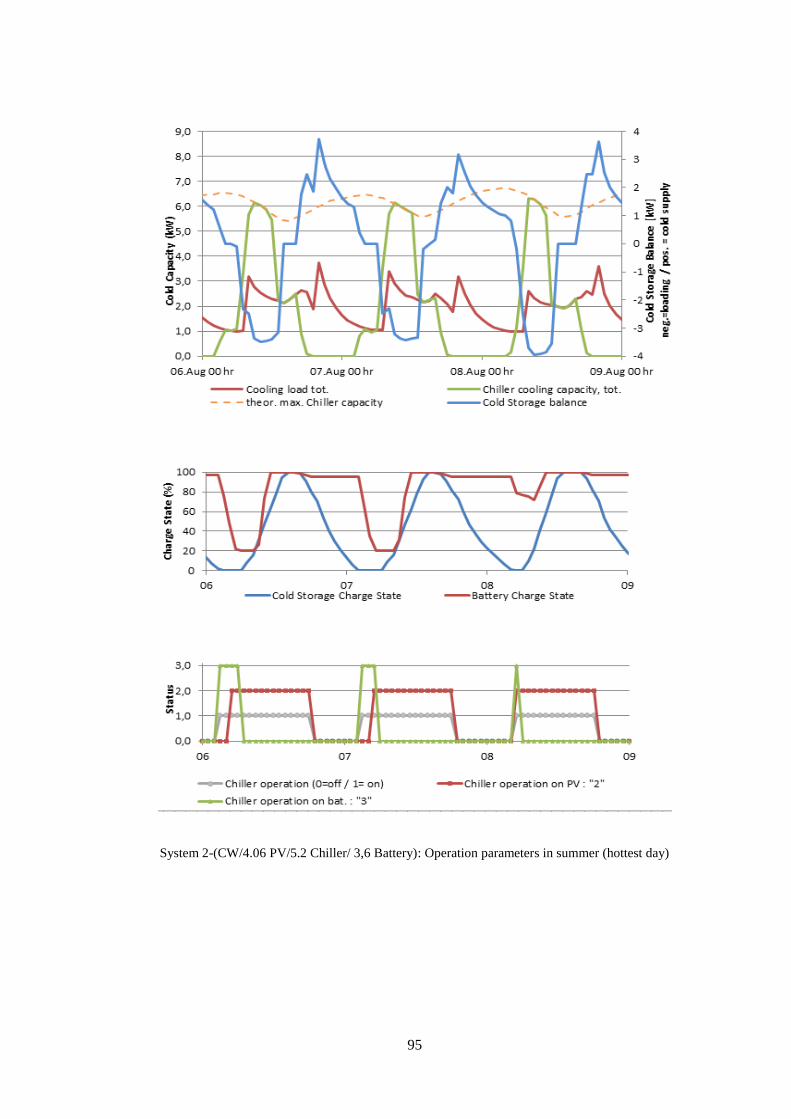
95
System 2-(CW/4.06 PV/5.2 Chiller/ 3,6 Battery): Operation parameters in summer (hottest day)
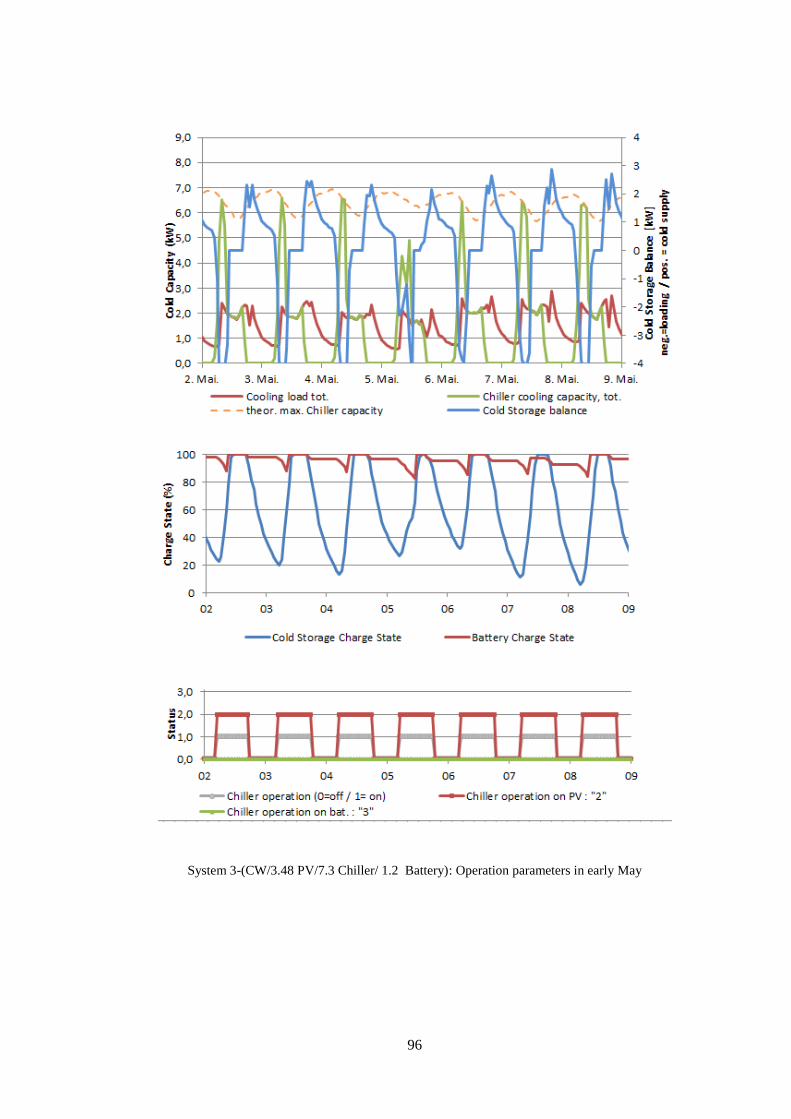
96
System 3-(CW/3.48 PV/7.3 Chiller/ 1.2 Battery): Operation parameters in early May
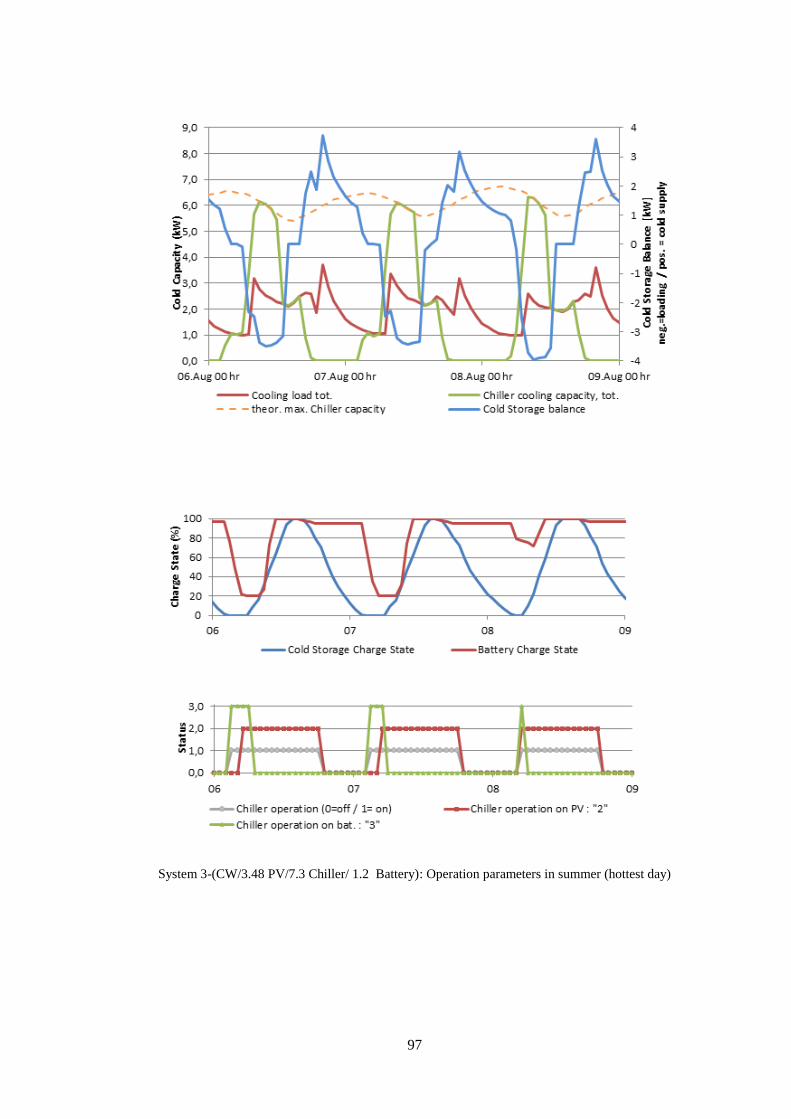
97
System 3-(CW/3.48 PV/7.3 Chiller/ 1.2 Battery): Operation parameters in summer (hottest day)
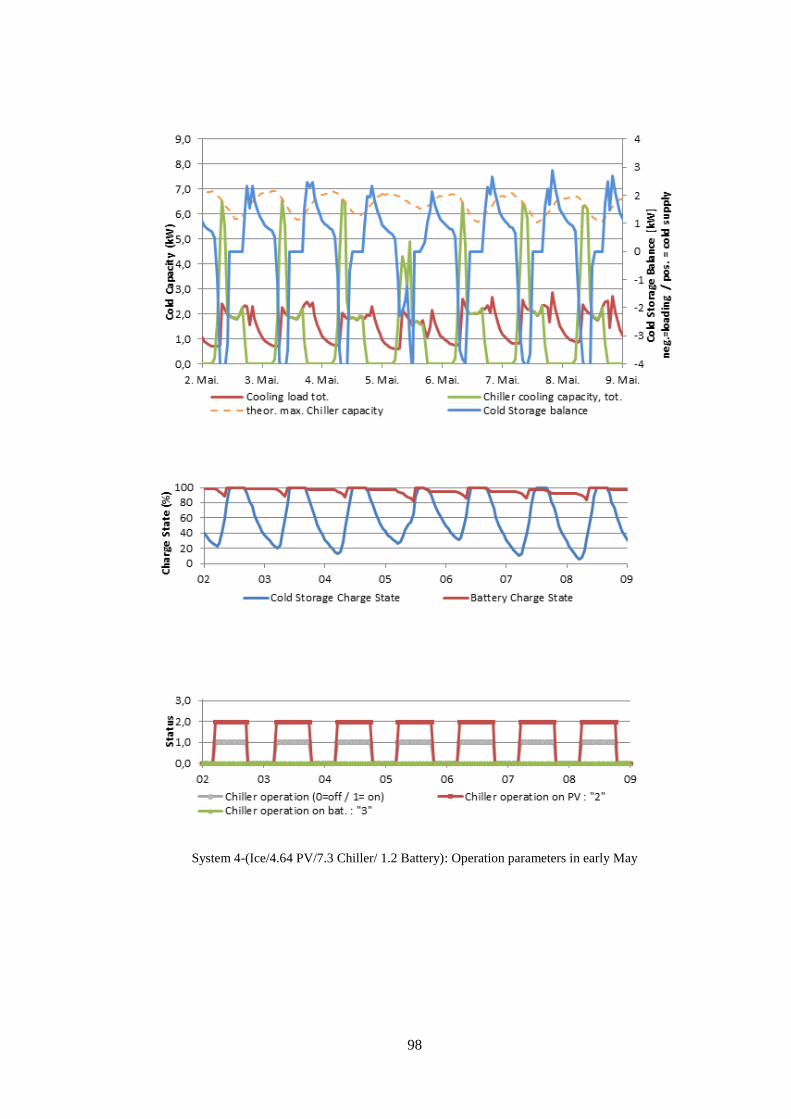
98
System 4-(Ice/4.64 PV/7.3 Chiller/ 1.2 Battery): Operation parameters in early May
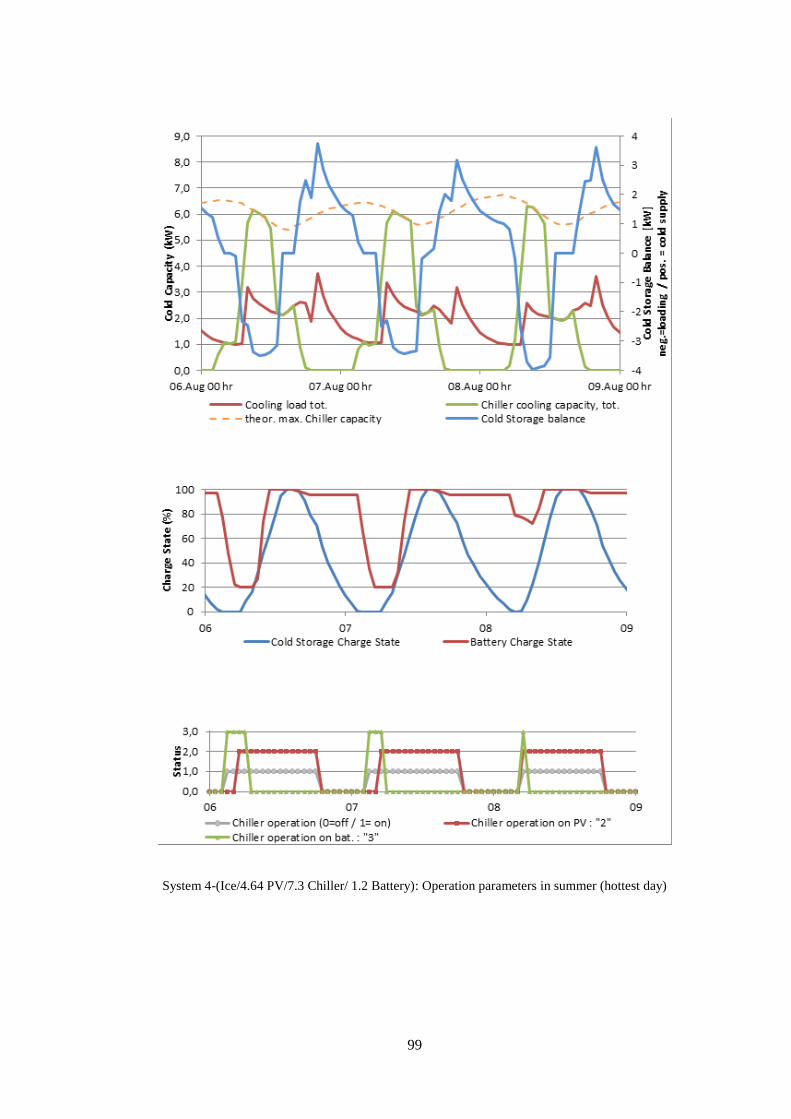
99
System 4-(Ice/4.64 PV/7.3 Chiller/ 1.2 Battery): Operation parameters in summer (hottest day)
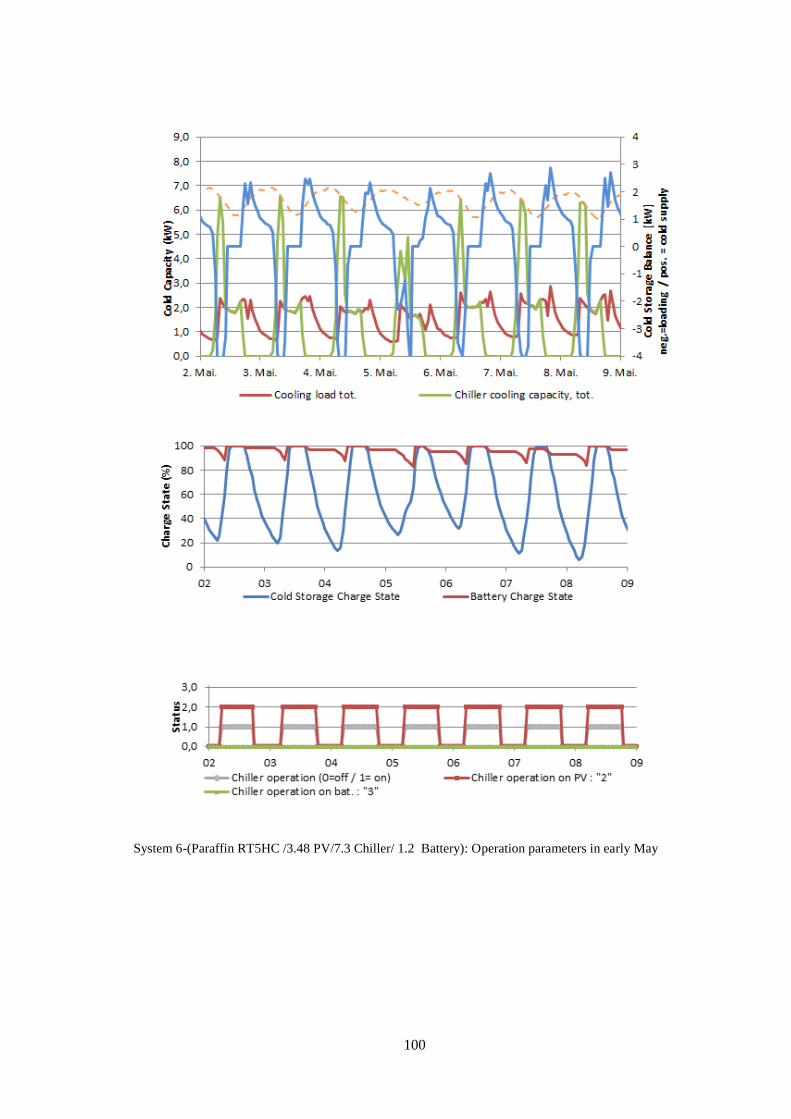
100
System 6-(Paraffin RT5HC /3.48 PV/7.3 Chiller/ 1.2 Battery): Operation parameters in early May
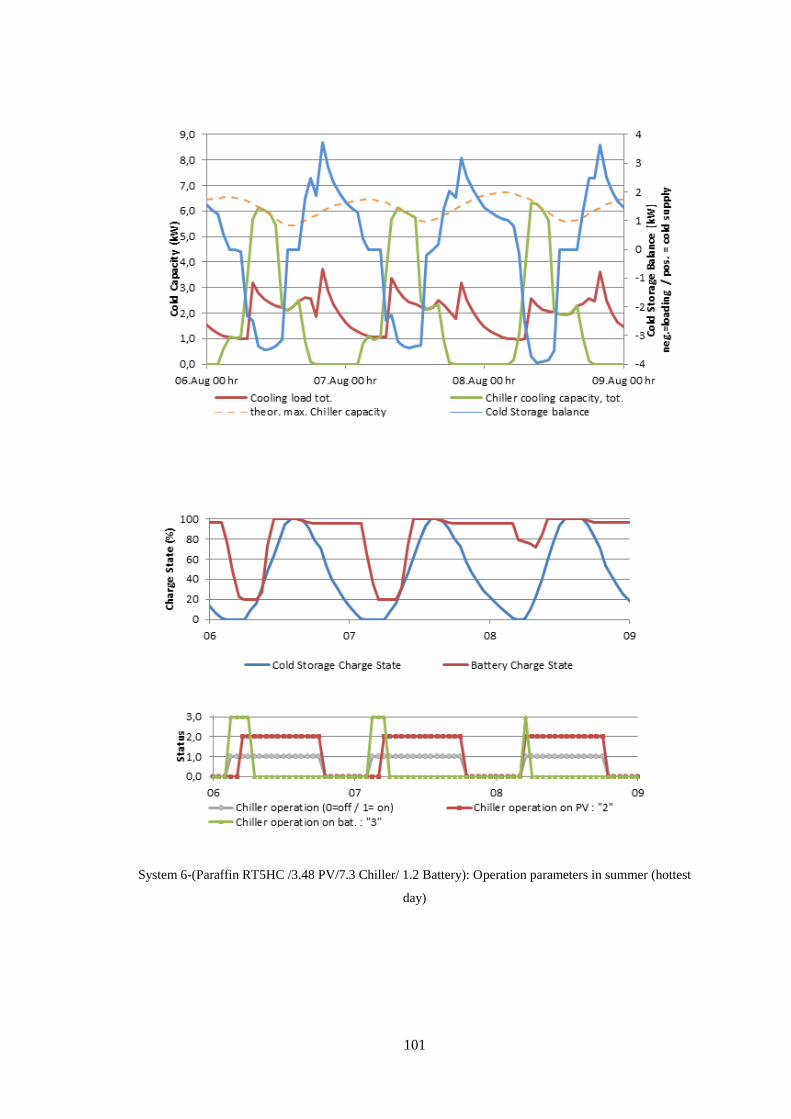
101
System 6-(Paraffin RT5HC /3.48 PV/7.3 Chiller/ 1.2 Battery): Operation parameters in summer (hottest
day)
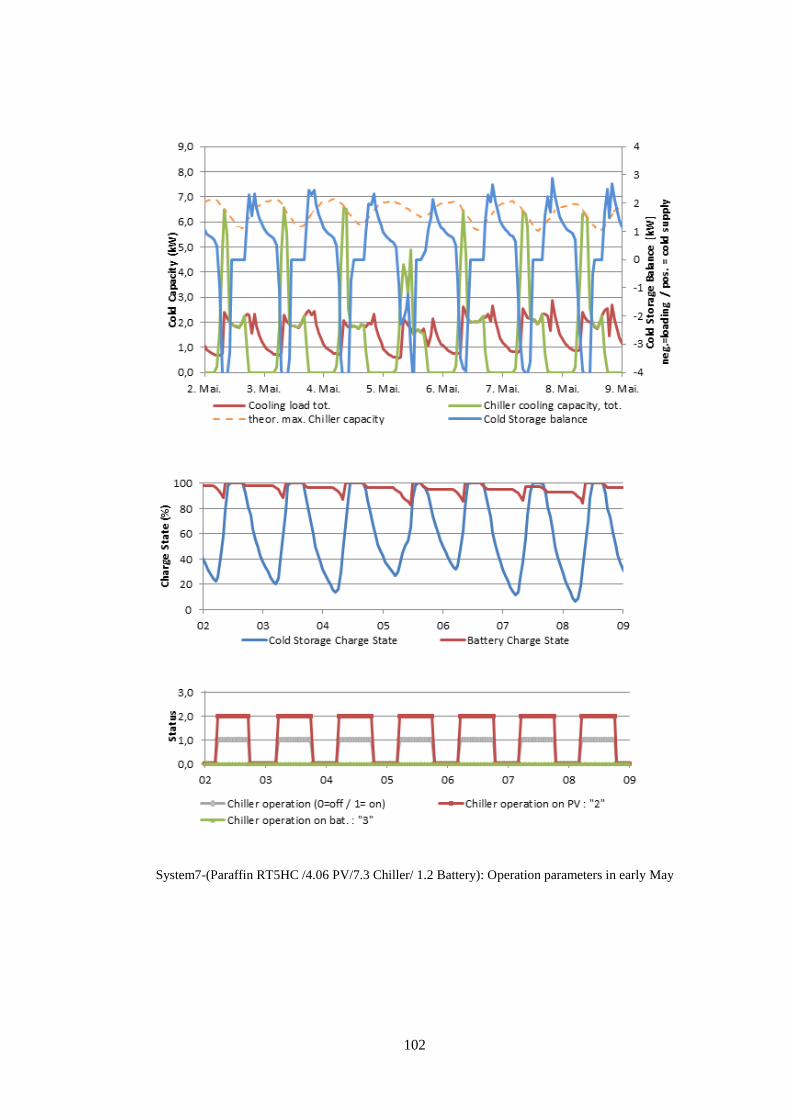
102
System7-(Paraffin RT5HC /4.06 PV/7.3 Chiller/ 1.2 Battery): Operation parameters in early May
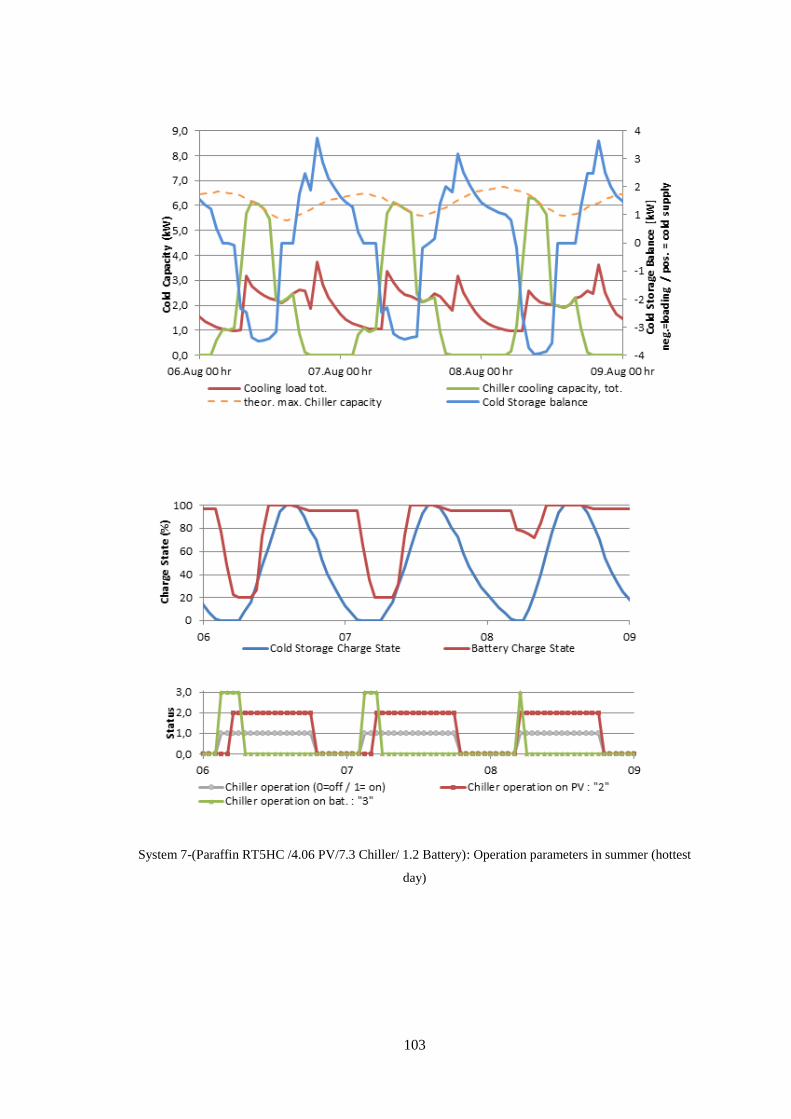
103
System 7-(Paraffin RT5HC /4.06 PV/7.3 Chiller/ 1.2 Battery): Operation parameters in summer (hottest
day)