Embed Size (px)
DESCRIPTION
construction materials
Citation preview

i
Laterized Quarry Dust and Recycled Concrete as Alternative Building
Materials
Timothy Musiomi Musembe
A thesis submitted in partial fulfilment for the Degree of Master of Science in
Civil Engineering in the Jomo Kenyatta University of Agriculture and
Technology
2009
ii
DECLARATION
This thesis is my original work and has not been presented for a degree in any other
University.
Signature.................................................... Date...................................................
Timothy Musiomi Musembe
This thesis has been submitted for examination with our approval as University
Supervisors:
Signature.................................................... Date...................................................
Prof. Walter Oyawa
JKUAT, Kenya
Signature.................................................... Date...................................................
Mr. Paul Mulu
JKUAT, Kenya

iii
DEDICATION
This research work is dedicated to my lovely wife Christine and our charming
daughter Bright

iv
ACKNOWLEDGEMENT
My sincerest and deepest thanks go to my supervisors Prof. Walter Oyawa and Mr.
Paul Mulu, without whose unending support and guidance I would not have
completed this work.
The academic and technical staff at the Department of Civil, Construction and
Environmental Engineering at Jomo Kenyatta University of Agriculture and
Technology has been of great help in this research and their skills and commitment
have helped to make the project forthcoming and successful.
I would also wish to thank my very dear wife Christine who has been an
inspiration. This great lady has demonstrated real patience throughout this research
work.

v
TABLE OF CONTENTS
DECLARATION ....................................................................................................................... ii
DEDICATION .......................................................................................................................... iii
ACKNOWLEDGEMENT .................................................................................................... iv
TABLE OF CONTENTS ........................................................................................................ v
LIST OF TABLES .................................................................................................................... x
LIST OF FIGURES ................................................................................................................. xi
LIST OF PLATES .................................................................................................................. xv
LIST OF APPENDICES .................................................................................................... xvii
LIST OF ABBREVIATIONS ......................................................................................... xviii
CHAPTER ONE ........................................................................................................................ 1
1.0 INTRODUCTION ........................................................................................................ 1
1.1 Background ............................................................................................................. 1
1.2 Problem statement and justification ................................................................. 5
1.3 Objectives of the study ......................................................................................... 7
CHAPTER TWO ....................................................................................................................... 8
2.0 LITERATURE REVIEW ............................................................................................ 8
2.1 Introduction ............................................................................................................................ 8
2.2 Quarry wastes ........................................................................................................................ 8
2.3 Lateritic material ................................................................................................................. 11
2.4 Recycled concrete aggregates .......................................................................................... 14
2.5 Stabilized earth blocks ....................................................................................................... 16
vi
2.6 Outline of concrete mix design ....................................................................................... 18
CHAPTER THREE ................................................................................................................ 20
3.0 MATERIALS AND METHODS ........................................................................... 20
3.1 Introduction .......................................................................................................................... 20
3.2 Material sampling and preparation ................................................................................. 20
3.2.1 Cement ............................................................................................................................... 20
3.2.2 River sand .......................................................................................................................... 20
3.2.3 Natural crushed aggregates ........................................................................................... 21
3.2.4 Quarry dust wastes .......................................................................................................... 21
3.2.5 Laterite ............................................................................................................................... 21
3.2.6 Recycled concrete aggregates ...................................................................................... 22
3.2.7 Conventional building blocks ....................................................................................... 23
3.3 Material physical properties test ..................................................................................... 23
3.3.1 Density tests ...................................................................................................................... 23
3.3.2 Silt content test ................................................................................................................. 24
3.3.3 Water absorption test ...................................................................................................... 24
3.3.4 Sieve analysis or gradation test .................................................................................... 24
3.4 Studies on concrete mixes and optimal material combination ................................ 25
3.4.1 Optimum QDNbi content .............................................................................................. 25
3.4.2 Optimum RCA content .................................................................................................. 25
3.4.3 Optimum laterized quarry dust content ..................................................................... 25
3.4.4 Workability tests .............................................................................................................. 26
vii
3.4.5 Compressive strength test .............................................................................................. 27
3.5 Studies on masonry block mixes and optimal material combination .................... 27
3.5.1 Optimum cement content .............................................................................................. 27
3.5.2 Optimum quarry dust combination ............................................................................. 27
3.5.3 Optimum laterite content ............................................................................................... 28
3.5.4 Compressive strength test of masonry blocks .......................................................... 28
3.5.5 Water absorption test of blocks.................................................................................... 28
3.6 Reinforced concrete beam testing ................................................................................... 29
3.6.1 Specimen preparation ..................................................................................................... 29
3.6.2 Testing procedure and instrumentation ...................................................................... 30
3.7 Masonry wall panel testing ............................................................................................... 31
3.7.1 Specimen preparation ..................................................................................................... 31
3.7.2 Testing procedure and instrumentation ...................................................................... 33
CHAPTER FOUR ................................................................................................................... 35
4.0 MATERIAL PHYSICAL PROPERTIES ............................................................ 35
4.1 Introduction .......................................................................................................................... 35
4.2 Results and discussion ....................................................................................................... 35
4.2.1 Relative density ................................................................................................................ 35
4.2.2 Silt content ........................................................................................................................ 37
4.2.3 Water absorption ............................................................................................................. 38
4.2.4 Gradation of aggregates ................................................................................................. 39
4.3 Summary and conclusion .................................................................................................. 48

viii
CHAPTER FIVE ..................................................................................................................... 49
5.0 STUDIES ON LATERIZED QUARRY DUST CONCRETE MIXES ............... 49
5.1 Introduction .......................................................................................................................... 49
5.2 Results and discussion ....................................................................................................... 50
5.2.1 Optimum quarry (QDNbi) dust content ..................................................................... 50
5.2.2 Optimum recycled concrete aggregates (RCA) content ........................................ 53
5.2.3 Optimum laterized quarry dust content ..................................................................... 57
5.3 Summary and conclusion .................................................................................................. 64
CHAPTER SIX ........................................................................................................................ 66
6.0 STUDIES ON LATERIZED QUARRY DUST BLOCK MIXES ........................ 66
6.1 Introduction .......................................................................................................................... 66
6.2 Results and discussion ....................................................................................................... 67
6.2.1 Optimum cement content .............................................................................................. 67
6.2.2 Optimum quarry dust wastes combination ............................................................... 70
6.2.3 Optimum laterite content ............................................................................................... 73
6.3 Summary and conclusion .................................................................................................. 76
CHAPTER SEVEN ................................................................................................................ 77
7.0 REINFORCED CONCRETE BEAMS ........................................................................ 77
7.1 Introduction and beam details .......................................................................................... 77
7.2 Results and conclusion ...................................................................................................... 78
7.2.1 Moment versus central deflection ............................................................................... 78
7.2.2 Crack patterns ................................................................................................................... 91

ix
7.3 Cost comparison .................................................................................................................. 94
7.4 Summary and conclusion .................................................................................................. 95
CHAPTER EIGHT ................................................................................................................. 96
8.0 MASONRY WALL PANEL ........................................................................................... 96
8.1 Introduction and wall panel description ........................................................................ 96
8.2 Results and discussion ....................................................................................................... 97
8.2.1 Compressive strength of wall panels .......................................................................... 97
8.2.2 Stress-strain characteristics of wall panels .............................................................. 101
8.2.3 Cracking pattern ............................................................................................................. 119
8.3 Cost comparison ................................................................................................................ 124
8.4 Summary and conclusion ................................................................................................ 125
CHAPTER NINE .................................................................................................................. 126
9.0 CONCLUSION ................................................................................................................. 126
CHAPTER TEN .................................................................................................................... 128
10.0 RECOMMENDATIONS ............................................................................................. 128
REFERENCES ....................................................................................................................... 129
APPENDICES ........................................................................................................................ 135

x
LIST OF TABLES
Table 1.1: Gaseous emission of various construction materials.........................3
Table 1.2: Energy requirements of various construction materials....................4
Table 2.1: Theoretical conditions for concretionary laterite development.......13
Table 3.1: Beam specimen details.....................................................................30
Table 3.2: Wall panel details.............................................................................33
Table 4.1: Basic material properties..................................................................36
Table 7.1: Beam details……………………………………………………...78
Table 8.1: Wall panel details.............................................................................97
Table 8.2: Cost of conventional and alternative blocks..................................124
Table A1: Concrete mixes for conventional and alternative concrete........... 136
Table B1: Block mixes for alternative blocks................................................ 137

xi
LIST OF FIGURES
Figure 4.1: Gradation curves for river sand, QDNbi, QDNdar and Laterite-
BS 882:1973 Grading Zone 1........................................................41
Figure 4.2: Particle size distribution for river sand, QDNbi, QDNdar and
Laterite-BS 882:1973 Grading Zone 2..........................................42
Figure 4.3: Gradation curves for river sand, QDNbi, QDNdar and Laterite-BS
882:1973 Grading Zone 3..............................................................43
Figure 4.4: Particle size distribution for river sand, QDNbi, QDNdar and
Laterite-BS 882:1973 Grading Zone 4..........................................43
Figure 4.5: Gradation curves for river sand, QDNbi, QDNdar and Laterite-
ASTM Standard C33-78...............................................................45
Figure 4.6: Gradation curves for natural crushed aggregates (NCA) and
recycled concrete aggregates (RCA)-BS 882:1973.....................47
Figure 4.7: Gradation curve for natural crushed aggregates (NCA) and
recycled concrete aggregates (RCA) - ASTM Standard C33-
78...................................................................................................47
Figure 5.1: The effect of QDNbi content on slump.........................................51
Figure 5.2: The effect of QDNbi content on the compacting
factor..............................................................................................52
Figure 5.3: Variation of compressive strength with QDNbi content...............52
Figure 5.4: The effect of RCA content on slump............................................55
Figure 5.5: The effect of RCA content the compacting factor........................55

xii
Figure 5.6: Variation of compressive strength with RCA content..................56
Figure 5.7: The effect of laterite content on slump and NCA as coarse
aggregates......................................................................................59
Figure 5.8: Variation of compacting factors with laterite content and NCA
as coarse aggregates.......................................................................60
Figure 5.9: The relationship between compressive strength and laterite content
and NCA as coarse aggregates......................................................60
Figure 5.10: The effect of laterite content on slump and RCA
as coarse aggregates.......................................................................61
Figure 5.11: Variation of compacting factors with laterite content and RCA as
coarse aggregates...........................................................................61
Figure 5.12: The relationship between compressive strength and laterite content
and RCA as coarse aggregates......................................................62
Figure 5.13: The relationship between compressive strength and laterite content
and NCA as coarse aggregates......................................................63
Figure 6.1: Variation of water absorption with cement content .....................68
Figure 6.2: The effect of cement content on compressive strength of
blocks.............................................................................................68
Figure 6.3: The relationship between cement content and density of
blocks.............................................................................................70
Figure 6.4: Variation of water absorption with QDNdar content....................71
Figure 6.5: The effect of QDNdar content on compressive strength of
blocks.............................................................................................72
xiii
Figure 6.6: Variation of the density of blocks with QDNdar content............73
Figure 6.7: Variation of water absorption with laterite content.......................74
Figure 6.8: Variation of compressive strength of blocks with laterite
content............................................................................................75
Figure 7.1: Moment versus deflection of conventional concrete beam
with mix ratio 1:1.5:3 reinforced with 2Y10 ................................79
Figure 7.2: Moment versus deflection of alternative concrete beam
with mix ratio 1:1.5:3 reinforced with 2Y10................................80
Figure 7.3: Moment versus deflection of conventional concrete beam
with mix ratio 1:1.5:3 reinforced with 2Y8..................................81
Figure 7.4: Moment versus deflection of alternative concrete beam
with mix ratio 1:1.5:3 reinforced with 2Y8..................................82
Figure 7.5: Moment-deflection curves for concrete beams of
varying steel content......................................................................83
Figure 7.6: Moment versus deflection of conventional concrete beam
with mix ratio 1:2:4 reinforced with 2Y10....................................85
Figure 7.7: Moment versus deflection of alternative concrete beam
with mix ratio 1:2:4 reinforced with 2Y10....................................86
Figure 7.8: Moment versus deflection of conventional concrete beam
with mix ratio 1:1:2 reinforced with 2Y10....................................86
Figure 7.9: Moment versus deflection of alternative concrete beam
with mix ratio 1:1:2 reinforced with 2Y10....................................87

xiv
Figure 7.10: Moment-deflection curves for concrete beams of alternative and
conventional concrete of varying strength...................................89
Figure 8.1: Compressive strengths of wall panels.........................................99
Figure 8.2: Stress versus strain for reinforced conventional block wall
jointed in 1:3 mortar....................................................................102
Figure 8.3: Stress versus strain for unreinforced conventional block wall
jointed in 1:3 mortar....................................................................104
Figure 8.4: Stress versus strain for reinforced alternative block wall
jointed in 1:3 mortar....................................................................106
Figure 8.5: Stress versus strain for unreinforced alternative block wall
jointed in 1:3 mortar joint............................................................108
Figure 8.6: Stress versus strain for unreinforced conventional block wall
jointed in 1:4 mortar joint............................................................111
Figure 8.7: Stress versus strain for unreinforced alternative block wall
jointed in 1:4 mortar joint............................................................113
Figure 8.8: Stress versus strain for large unreinforced conventional
block wall jointed in 1:3 mortar joint..........................................116
Figure 8.9: Stress versus strain for large unreinforced alternative block
wall jointed in 1:3 mortar joint....................................................118

xv
LIST OF PLATES
Plate 3.1: Quarry dust in a quarry site..............................................................21
Plate 3.2: Machine dressed blocks...................................................................23
Plate 3.3: Experimental set up for testing blocks on a UTM...........................28
Plate 3.4: Experimental set-up of concrete beam ready for testing.................31
Plate 3.5: Laterized quarry dust block being removed from the machine.......32
Plate 3.6: Experimental set up for wall panels.................................................34
Plate 7.1: Beam AltConc1-1-2. Crack pattern at ultimate load.......................92
Plate 8.1: Cracking pattern for reinforced conventional block wall
utilizing 1:3 jointing mortar....................................................... 120
Plate 8.2: Cracking pattern for plain conventional block wall
utilizing 1:3 jointing mortar....................................................... 121
Plate 8.3: Cracking pattern for reinforced alternative block wall
utilizing 1:3 jointing mortar....................................................... 122
Plate 8.4: Cracking pattern for plain alternative block wall
utilizing 1:3 jointing mortar....................................................... 123
Plate C1: Beam AltConc1-2-4.......................................................................137
Plate C2: Beam ConvConc1-2-4................................................................... 138
Plate C3: Beam AltConc1-1.5-3(10).............................................................139
Plate C4: Beam ConvConc1-1.5-3(10)……………………………………140
Plate C5: Beam AltConc1-1.5-3(8)………………………………………..141
Plate C6: Beam ConvConc1-1.5-3(8)............................................................142
xvi
Plate C7: Beam AltConc1-1-2.......................................................................143
Plate C8: Beam ConvConc1-1-2................................................................... 144

xvii
LIST OF APPENDICES
Appendix A: Concrete mixes..........................................................................135
Appendix B: Masonry block mixes............................................................... 136
Appendix C: Concrete beams crack patterns..................................................137

xviii
LIST OF ABBREVIATIONS
BS British standards
ECCO Environmental Council of Concrete Organizations
QD Quarry dust
NCA Natural crushed aggregates
RCA Recycled concrete aggregates
RS River sand
xix
ABSTRACT
The use of conventional materials is facing two main challenges of high cost and
large-scale depletion of the sources thus creating environmental problems. These
challenges demand that alternative materials be explored that are not only affordable
but are also environmentally friendly. In this regard, laterized quarry dust and
recycled concrete are proposed as possible alternative building material.
To date, extensive studies have been done on laterite, quarry dust and recycled
aggregates, separately. However, there is lack of data on performance of blended
materials as well as large scale tests on structural elements made from the alternative
materials. This research therefore seeks to assess the performance of blended
alternative materials when used in concrete and blocks. In the study, samples of
materials were investigated to determine basic properties following which the
optimum proportions of ingredient materials were determined for concrete and block
mix. Finally, the viability of using the materials was assessed for large scale
concrete beams and wall panels.
The results demonstrate that there is great potential of laterized quarry dust concrete
and blocks. When recycled concrete aggregates are used, 30% of river sand can be
replaced with laterized quarry dust and still attain compressive strength of 20
N/mm2. In addition, the flexural capacities of alternative as well as conventional
concrete beams were found to be within 5%. The findings are intended to contribute
to sustainable construction of low cost housing and development.

1
CHAPTER ONE
1.0 INTRODUCTION
1.1 Background
In Kenya, good quality concrete is manufactured from natural river sand and natural
crushed aggregates satisfying the grading requirements of British standards or
Kenya standards (Arai, 1986). River sand is harvested from river beds while the
coarse aggregate is obtained by crushing natural rock in quarries. The manufacture
of conventional concrete is governed by the Kenya or British standards. The
availability of the conventional aggregates for concrete manufacture has become
scarce in some areas due to; limited occurrence brought by over-exploitation in
harvesting, excessive cost of the material on the market, reduced supply due to
increasing demand and transportation difficulties due to the poor state of the roads
(Mostafa, 1990).
Besides concrete construction, most of the housing construction in Kenya is done in
masonry. The main materials used are; burnt ceramic bricks, concrete blocks and
machine dressed natural stones. The use of burnt ceramic bricks is increasingly
discouraged due to the high cost of energy requirements and negative environmental
impacts such as air pollution. The use of concrete blocks as well as dressed natural
stones faces similar challenges as the conventional concrete.
There is also growing emphasis on sustainability in construction industry. This has
lead to a paradigm shift in the building industry with emphasis on sustainable
construction. Sustainability is defined as the ‘need to ensure that development meets
2
the needs of the present without compromising on the ability of the future
generations to meet their own needs’ (Brundtland, 1987). Sustainability has three
main dimensions namely; ecological sustainability, economic sustainability and
social sustainability. Ecological sustainability in construction is achieved when the
materials used produce low emissions, pollutants and have both recycling economy
and resource efficiency. Economic sustainability is ensured by optimisation in low
cost construction techniques, maintenance of the engineering systems and
construction techniques which have low life-cycle cost. Social sustainability on the
other hand focuses on social satisfaction of the construction from material
harvesting, production and final structure. Most of the conventional construction
materials such as steel and concrete have low rating as far as sustainability is
concerned when compared to the traditional earth based construction material.
Emission of toxic substances and energy requirements of construction material
during manufacture has been used as a measure of ecologic sustainability of
materials. Of importance are the carbon dioxide and sulphur dioxide gases that are
emitted by materials during manufacture. Table 1.1 shows the equivalent gases
emitted during the manufacture of some of the most common construction materials.

3
Table 1.1: Gaseous emission of various construction materials
Material Equivalent carbon dioxide emission gCO2/kg
Equivalent sulphur dioxide emission gSO2/kg
Aluminium 11800 95 Steel (profiles)
2540 11.2
Steel galvanized
4080 21
Paint synthetics
1700 6
PVC 2050 14.3 Cement 1000 - Clay tile fired 295 2.3 Concrete 123 0.4 Brick 225 0.8 Concrete tile 220 0.7 Wood 774 1.6
It is seen from the table that aluminium produces the highest amount of carbon
dioxide. This is followed by galvanized steel. Concrete production produces the
least amount of gaseous emissions. Earth-based materials generally have lower
emission values as compared to the conventional concrete production. In Table 1.2,
energy requirements for construction material during manufacture have been
summarised. Here again aluminium and steel have the highest energy requirements
for their manufacture. Stabilized earth, natural stone and aggregates have the lowest
energy requirements. Stabilized earth requires between 0.3 and 0.8MJ of energy for
every kg produced. Timber has lower energy requirements of between 0.1 and
5MJ/kg. However, since cutting down of trees in detrimental to the environment, the
use of timber in many countries is discouraged.

4
Table 1.2: Energy requirements of various construction materials
Material Energy requirements MJ/kg Aluminium 130-270 Steel 20-60 Steel galvanized >60 PVC 50-90 Concrete-in-situ 0.6-2 Cement Fibre cement
4-8 Average 4.8
Lime 3-10 Lime/cement mortar 0.5-1 Stabilised earth 0.3-0.8 Sand-lime bricks Clay bricks
0.7-1.2 Average 2.5
Concrete blocks and tiles 0.9-1.6 Natural stone, sand, aggregates, soil <0.3 Ceramics, bricks and tiles 1.5-8 Corrugated galvanized steel sheets, 0.4mm Ceramic roofing tiles, 12mm Concrete roofing tiles, 12mm Micro concrete roofing tiles, 8mm
60 4 1.3 1.3
Gypsum plaster 1-4 Timber 0.1-5
Due to the numerous challenges and shortcomings of conventional construction
materials, the search for alternative sustainable construction material has been
seriously considered by several researchers. In Kenya, research work has been done
on several local materials in order to establish their potential use in construction. For
example; quarry dust (Kioko, 1996; Mulu et al., 1998), low cost masonry blocks
(Oyawa, 2004; Karanja, 2003). On the global scale, the same trend has been
experienced particularly in India, Malaysia and Nigeria. In India, more research is
being carried out on quarry dust also called manufactured sand (Babu et al., 1997;
Nagaraj et al., 1996; Narasimahan et al., 1999). In Nigeria there is growing interest
in researching on the possible use of laterite, a common and abundant material in
5
African continent, in concrete production as river sand substitute. Results obtained
so far are encouraging.
Although several research activities have been carried out on sustainable material
such as wastes and recycled material, the necessary information that can aid in
design with the material is still limited. In addition, most of the waste and recycled
material have been found to posses some undesirable engineering properties that
hinder their application in practice. No data is available on the effects of blending of
the materials which could modify and improve some of the undesirable properties of
the materials when applied separately. This research aims at resolving some of these
issues by evaluating the potential of laterite soil, quarry dust and recycled concrete
as supplementary of complementary materials for eco-concrete production.
1.2 Problem statement and justification
Conventional building materials like sand and crushed aggregates are expensive due
to excessive cost of extraction and transportation from natural sources. Moreover
large-scale extraction of these sources creates environmental problems in form of
resource depletion and toxic emissions. As environmental issues, transportation
challenges and other constraints make the availability and use of conventional
material less attractive, alternative supplementary or complimentary materials need
to be found. Presently in Kenya, river sand poses the problem of acute shortage in
many areas, leading to serious problems with respect to its availability, cost and
environmental impact. In such a situation laterized quarry dust is foreseen to be an
economic alternative to the river sand. Laterite soil is readily available in Kenya
6
while quarry sites have heaps of quarry dust, a waste product in the production of
crushed coarse aggregates.
Another material that could be investigated as a supplementary material is recycled
concrete derived from demolition of old buildings. Many of the existing buildings in
most of the towns have been in existence for many years. The value of land has
increased a lot favouring high rise structures to meet the high demand for space.
Furthermore there is growing demand for change of use of the existing buildings.
Due to these reasons many buildings are already being demolished. Some
demolition of buildings, by the government, previously built on land set aside for
road expansion has increased waste material specifically concrete which pose
disposal challenges. It is expected that demolitions will increase as demand for new
facilities that meet the current society’s needs also increase. Recycling has many
advantages. In this time of increasing attention to the environmental impact and
sustainable development, recycled Portland cement concrete has much to offer: it is
resource efficient thus minimizing depletion of our natural resources; it is energy
efficient in all phases of production.
In summary and in view of prevailing environmental, economic and social
challenges in the construction industry, this research aims at studying the
performance of recycled concrete aggregates and laterized quarry dust in concrete
and masonry. It is believed that blending these materials together in concrete will
also combine their advantages in the resulting applications.
7
1.3 Objectives of the study
General objective:
The main objective is to study the performance of recycled concrete and laterized
quarry dust as aggregates in concrete and filler in masonry for sustainable
construction.
Specific objectives:
1. To determine and compare the main material properties of the alternative
and conventional materials.
2. To evaluate concrete mixes and hence determine the optimum proportions
of constituent materials in alternative sustainable concrete.
3. To evaluate building block mixes and hence determine the optimum
proportions of constituent materials in alternative sustainable blocks.
4. To determine the structural behavior in bending, under static loading, of
reinforced concrete beams made from the alternative sustainable concrete
viz-a-viz conventional concrete.
5. To establish the comparative structural behavior, under static axial
compression, of masonry wall panels made from the alternative blocks and
conventional machine dressed blocks.

8
CHAPTER TWO
2.0 LITERATURE REVIEW
2.1 Introduction
Research work has generally been carried out on all the proposed alternative
materials with a view of utilising the materials in construction. Studies on the
alternative materials have however been done in different parts of the world. For
instance, much of the data on laterized concrete is as a result of studies that have
been carried out by researchers in Nigeria (Udoeyo et al., 2006; Osunade et al.,
1994: Ata et al., 2005) while studies on quarry dust have been extensively done in
India and Australia (Babu et al., 1997; Nagaraj et al., 1996; Narasimahan et al.,
1999). Up to date, there are generally no guidelines for practical application of the
proposed alternative materials.
2.2 Quarry wastes
In Kenya, there are two common types of quarry dust wastes; one from natural
aggregate crushing quarries (QDNbi) and the other from mechanical stone dressing
quarries (QDNdar). Quarry dust is defined as a residue, tailing or other non-voluble
waste material after the extraction and processing of rock to form fine particles less
than 4.75mm (Ilangovan et al., 2007). The utilization of quarry dust has been
accepted as a building material in the industrially advanced countries of the west for
the past three decades (Nisnevich et al., 2007). This is as a result of sustained
research and development work undertaken with respect to increasing application of
this industrial waste. The level of utilization of quarry dust in industrialized nations
9
like Australia, France, Germany and UK has reached more than 60% of its total
production (Ilangovan et al., 2007). The use of quarry dust in Kenya has not been
much as compared to some advanced countries due to lack of sufficient
experimental data and guidelines on utilisation of the material in construction.
Usually, quarry dust is used in large scale in highways as a surfacing material and in
manufacturing the hollow blocks and lightweight prefabricated elements.
Previous work by Mulu et al (1998) indicates that crushed rock quarry dust has
physical properties comparable to natural sand and hence the desirable properties
needed for the concrete manufacture except for its fineness which requires high
cement content. Ilangovan et al (2007) investigated the performance of quarry dust
in concrete. In their study, concrete with 100% replacement of river sand was
prepared and used to cast test cubes and concrete beams that were tested for
compressive strength, tensile strength and durability behaviour. The results showed
that the compressive, flexural strength and durability studies of concrete made of
Quarry Rock Dust were nearly 10% more than the conventional concrete.
Raman et al (2007) carried out non-destructive evaluation of flowing concrete
incorporating quarry dust. In their research, flowing concrete was produced using
quarry dust as partial replacement of natural mining sand. Non-destructive
properties such as dynamic modulus of elasticity, ultrasonic pulse velocity and
initial surface absorption were investigated. The slump, slump flow, V-funnel flow,
air content and compressive strength were also observed. The results indicated that
10
quarry dust does not significantly affect the non-destructive properties of concrete
except the initial surface absorption.
The characteristics of quarry dust as a low cost construction material in Kenya was
investigated by Mulu et al (2003). The physical properties and grading
characteristics of typical quarry dust were investigated and compared with those of
natural river sand. The engineering properties of hardened concrete samples were
also determined. The results of this study indicated that, generally an increase in
quarry dust content in concrete lead to decrease in compressive strength. However, it
was found that when 25% of quarry dust replaces river sand in concrete, the
compressive strength of the concrete was higher than concrete utilizing river sand.
Generally there is lack of adequate information on quarry dust from machine
dressing quarries. Much research has focused on the waste from aggregate crushing
quarries. Mulu et al (2003) reported that silt content and water absorption of this
material is very high as compared to conventional river sand. This research aimed at
investigating the engineering properties of the material and its potential use in low
cost construction. Musiomi et al (2007) while investigating the effect of mortar
types on the strength of masonry walls made of stabilized quarry dust blocks found
that the dust performed adequately both in blocks and mortar. In the study, six wall
panels were built from laterized quarry dust blocks and different mortar joint
conditions. The walls were then tested on a loading frame while monitoring the
surface strains on blocks and mortar. Both vertical and horizontal surface strains
were monitored. The blocks that were used contained quarry dust from machine
11
dressing plants. The results indicated that the wall panels with mortar joint
containing the quarry dust as the blocks had compressive strength comparable to
conventional walls. Ductility of alternative walls was however, higher by 30%.
From previous work, it can be deduced that quarry dust can be used to replace river
sand in concrete without adversely affecting the mechanical properties. The present
study seeks to establish the optimum proportions of quarry dust required to replace
sand in concrete. It is expected that addition of quarry dust will reduce the
workability of the concrete since the dust contain a lot of fine material as compared
to the conventional river sand. In this study, quarry dust from machine dressing
plant is limited to the production of masonry blocks. The dust is produced from soft
rock with high water absorption which makes the material unsuitable for concrete
production.
2.3 Lateritic material
Laterite is a pedogenic and highly weathered natural material formed by the
concentration of hydrated oxides of iron and aluminium, further oxidized to form an
insoluble precipitate of fine particles. Further concentration and dehydration and
subsequent cementation forms hard concretionary nodules or the coalescence of
particles into a hard vesicular mass of honeycomb structure where cavities may
contain the host soil (Aleva, 1994; Bardosy et al., 1990).
The soluble hydrated ferrous oxide (FeO) dissolves in water and is leached from
parent rock together with aluminium oxide into a host soil. Further oxidation occurs
12
to the ferrous oxide resulting in ferric oxide (Fe2O3), which is insoluble and
precipitates into fine particles. Concentration of the oxides is either by residual
accumulation or by solution, movement and chemical precipitation. Increased
concentration due to loss of moisture results in the formation of discrete soft nodules
of soil cemented with the precipitate. This process and the subsequent hardening of
the nodules are referred to as concretionary development. The presence of oxides of
iron and aluminium together with silica and kaolinite clay minerals in various
different proportions gives laterite the distinct ochre, yellow, purple or red colour of
which red is the most predominant emanating from the red iron oxide (Aleva, 1994;
Bardosy et al., 1990; Schellman, 1983).
Depending on the degree of concretionary development, the physical properties of
laterite varies widely from soil to rock-like material. In order for laterite to form,
there should be parent rock rich in iron, aluminium and silica and the climatic
conditions should include moderate to high temperatures and moderate to high
rainfall with distinct dry and wet season. Laterite occurs mostly in the tropical and
sub-tropical regions with lowest maximum temperatures above 18ºC and the
average temperature over 24ºC (Aleva, 1994; Bardosy et al., 1990; Schellman,
1983). The other conditions that are a prerequisite for the formation of laterite are
summarized in Table 2.1:

13
Table 2.1: Theoretical conditions for concretionary laterite development
Annual rainfall
(mm)
750 - 1000 1000 - 1500 1500 - 2000
Length of Dry
Season
7 6 5
Type of Laterite Rock laterite Hard
concretionary
gravels
Min. requirements
for concretions to
develop
The abundance of the laterite in tropical region has generated research interest in the
material. There is an attempt to determine the performance of laterite in concrete
production regardless of its great deviation from the conventional concrete material
in terms of physical properties (Adepegda, 1975; Balogun, 1982; Osunade, 1994).
The effect of using laterite as fine aggregate in concrete was first studied by
Adepegda (1975). He compared the properties of concrete made with conventional
aggregates and the laterized concrete.
The possibility of replacing sand in concrete with laterite was also investigated by
Balogun (1982). In another study, Balogun and Adepegda (1982) found that the
most suitable mix of laterized concrete for structural purposes is 1:1.5:3, using
batching by weight with water/cement ratio of 0.65, provided that the laterite content
is kept below 50% of the fine aggregate content. In a study by Osunade (1994), it
was found that shear and tensile strength of laterized concrete increased with curing
duration. Laterite containing wide range of particle size also resulted to higher
strength.
14
In a recent study by Ata et al (2005), it was established that Poisson’s ratio of
laterized concrete ranges between 0.25 and 0.35 and increases with age. In addition,
it was noted that methods of curing, compaction and water/cement ratio have little
influence on Poisson’s ratio. Poisson’s ratio of laterized concrete increases as the
mix becomes less rich.
Investigation by Udoeyo et al (2006) show that concrete with up to 40%
replacement level of sand by laterite attained compressive strength of 20 N/mm2.
This indicates that it is possible to use laterite as partial replacement for sand up to
this level. Additionally, the results showed that the compressive, split tensile and
flexural strengths and the percentage water absorption of the concrete decrease with
increase in the replacement level of sand. In this study, the viability of replacing
river sand with laterite mixed with quarry dust is investigated. The amount of laterite
was generally kept low since too much of laterite has adverse effects on the
engineering properties of concrete.
2.4 Recycled concrete aggregates
Recycled concrete aggregate (RCA) is obtained by crushing old concrete from
demolished concrete structures. This material is being applied to a large scale in
construction work in the developed countries such as the USA, Europe and Japan. In
the USA, studies have reported that there is no longer any barriers to the use of
recycled concrete as aggregates in new concrete (ECCO, 1999). The technology of
concrete recycling is well established in the USA where the recycled concrete
aggregate is used for new roads, streets and highway construction. Studies report
15
that concrete recycling to produce structural grade concrete for non-pavement uses
is technically feasible with certain precautions such as avoiding contaminated
materials (ECCO, 1999). For example, it is generally accepted that when natural
sand is used, up to 30% of natural crushed aggregate can be replaced with coarse
recycled concrete aggregate without significantly affecting the mechanical
properties of the concrete (Hansen, 1992).
Limbachiya et al (2004) carried out an extensive study on the performance of
recycled aggregate concrete. The effects of up to 100% coarse recycled concrete
aggregate on fresh, engineering and durability properties were established and its
suitability for use in a series of designated applications was assessed. The study
demonstrated that up to 30% coarse recycled concrete aggregates can be used,
without any modification in the mix design, in concrete construction with
performance similar to natural aggregate concrete. The results also indicates that for
recycled concrete aggregate samples obtained from four different sources, there was
no significant variation in strength of concrete at a given recycled concrete
aggregate content. This indicates that there is no significant effect of the properties
of parent materials on compressive strength of concrete. The RCA concrete mixes
were found to possess bulk engineering and durability properties similar to the
corresponding natural aggregate concrete, providing they were designed to have
equal strength.
The influence of recycled aggregate on the stress-strain relation of concrete was
investigated by Marcus et al (2008). The results of their study indicated that by

16
using recycled concrete and recycled clay for concrete aggregate, a gain of
deformation has to be accepted. Hence, in construction where deformations have to
be considered, the smaller elastic modulus, resulting from the use of recycled
aggregate, is noticed. The study also confirmed that there is no decrease in the
compressive strength, when aggregate derived from recycled concrete of clay is
used. From these results, the components made of concrete with recycled aggregate
can be designed with the same characteristic values as components of concrete made
with natural aggregates.
In the present study, recycled aggregates from concrete with varying compressive
strength is investigated because previous studies (Limbachiya et al., 2004)
demonstrate that the properties of the parent concrete do not influence the new
concrete utilizing recycled concrete aggregates. The study also seeks to evaluate
concrete with 100% replacement of natural with recycled aggregates from
demolished concrete. Recycled aggregates from burnt clay were found to increase
the elastic modulus and hence deformability of hardened concrete (Marcus et al.,
2008).
2.5 Stabilized earth blocks
Recently, there has been renewed interest by researchers on the application of earth
based construction techniques (Venkatarama et al., 2007; Alutu et al., 2006). This is
particularly so in the developing countries where there is shortage of adequate
housing for the ever increasing poor population. Stabilized soil blocks and earth
rammed walls are examples of earth based construction. Venkatarama et al (2007)
17
studied the influence of soil grading on the characteristics of soil-cement blocks and
shear-bond strength of soil-cement block masonry triplets. They examined the
influence of clay content of soil-cement block on strength, absorption and durability
characteristics and interfacial mortar-block bond shear strength. The results
indicated that the optimum clay content leading to maximum strength is in the range
of 14-16%. The results also show that the initial rate of water absorption decreases
with increase in clay content of the block.
Alutu et al (2006) in their study on the strength, durability and cost effectiveness of
cement-stabilized laterite hollow blocks, reported that for 7% cement content and
13.8 N/mm2 compactive pressure, blocks of compressive strength of at least 2.0
N/mm2 at 28 days are produced. The blocks showed no features of wear after
exposure to rain with weight losses within 2.4% after 12-cycled of wetting-
brushing-drying. A study on the ecological housing material in Kenya was done by
Sakata et al (2005). In their study they investigated the fundamental properties of
stabilized soil blocks. Stabilized soil blocks were made from various soil types
including laterite and red coffee soil. The stabilized soil blocks utilizing laterite
material attained compressive strength of 2.8 N/mm2 which is adequate for single
storey residential house. In another study by Musiomi et al (2007), the viability of
utilising quarry dust in making eco-blocks was investigated. Masonry walls prepared
from stabilised quarry dust blocks were tested in compression while monitoring
strains in blocks and mortar. The study established that, the walls had compressive
strength comparable to conventional walls.
18
To date, a number of studies have been carried out on earth based construction.
Various researchers have given some guidelines on the properties of the ingredient
materials as well as the proportions of the mix. However, building standards with
guidelines that are based on extensive studies are generally lacking. This has limited
the application of the earth based materials in construction because the designers
lack confidence in the limited available data.
The present study focuses on the feasibility of using stabilised laterized quarry dust
blocks in construction. The amount of cement required to stabilise the material is
limited to a range of 0 to 13% of the materials because red soil and murram have
been found to make satisfactory blocks when stabilised with 5-11% of Portland
cement.
2.6 Outline of concrete mix design
Mix design is defined as the process of selecting suitable ingredients of concrete and
determining their relative quantities with the object of producing concrete of certain
minimum properties, notably consistence, strength, and durability (Neville, 1993).
The concrete mix design is performed to ensure that the concrete mix formulation
meets or exceeds the specification requirements. Aggregates takes up to 60-90% of
the total volume of concrete. Selection of aggregate type and particle size
distribution greatly affects the workability of concrete as well as the mechanical
strength, permeability, durability and the total cost of hardened concrete (Genadij et
al., 1998). Therefore, aggregate mix design is an essential part of the concrete mix
design and optimisation.
19
Neville (1993) reviewed various studies on concrete mix design and established that
although there are certain desires for good grading curves for aggregates, no ideal
grading exist, and excellent concrete can be made with a wide range of aggregate
grading. This conclusion forms the basis upon which unconventional aggregates,
which do not meet the standard grading curves, can be investigated for their viability
in concrete production. The alternative aggregates that are investigated in this study
are unconventional and hence their particle size distribution differs from the
standard curves specified in codes of practice. For instance, recycled concrete
aggregates are generally large as compared to the conventional natural crushed
aggregates and hence their respective gradation curves are different. Therefore,
gradation curves for the alternative materials are developed in this study so as to
compare with the existing standards.
20
CHAPTER THREE
3.0 MATERIALS AND METHODS
3.1 Introduction
In order to achieve the objectives of the study, each of the materials was investigated
to establish the fundamental material properties following which the optimum
proportions of ingredient materials were determined for concrete mix and masonry
block mix. Finally the viability of using the materials was assessed for large scale
concrete beams and masonry wall panels. Reinforced concrete beams were cast and
tested in bending to assess flexural response, while wall panels were tested in
compression in the laboratory to evaluate compressive behaviour.
3.2 Material sampling and preparation
3.2.1 Cement
Cement was used in the production of concrete and as binder material in masonry
blocks and mortar. The cement used was Portland pozzolana cement of normal
strength of 32.5 N/mm2 as per the Kenya Standards (KS-18-1:2001). In this study
cement type is not a variable hence was obtained from one source.
3.2.2 River sand
River sand was required for the production of concrete. River sand from Machakos,
which is commonly used in Nairobi, was used in the study. The material was
obtained from a dealer in Nairobi. The river sand satisfying British Standards (BS
882) and American Standards (ASTM C33-78) grading requirements for fine
aggregates was used in the study.
21
3.2.3 Natural crushed aggregates
Natural crushed coarse aggregate was required for the production of concrete. The
material was obtained from Athi River situated to the south of Nairobi. The natural
crushed aggregates satisfying both the BS 882 and ASTM C33-78 grading
requirements for coarse aggregates was used in the study.
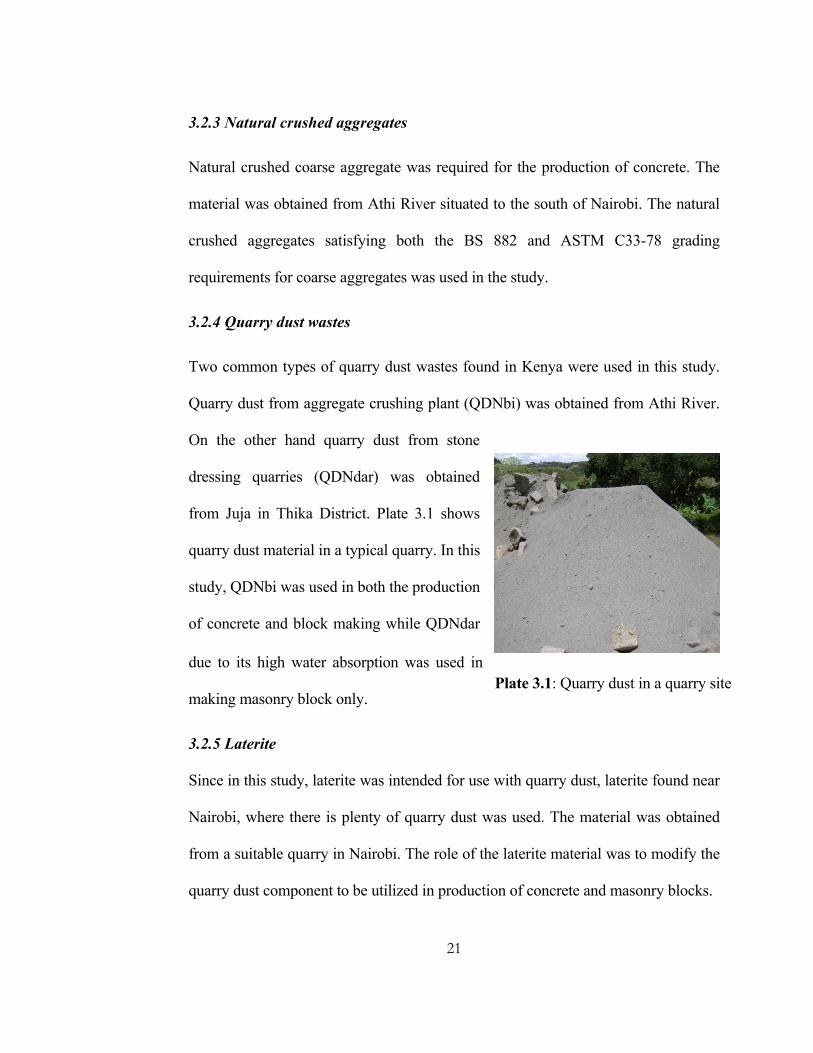
3.2.4 Quarry dust wastes
Two common types of quarry dust wastes found in Kenya were used in this study.
Quarry dust from aggregate crushing plant (QDNbi) was obtained from Athi River.
On the other hand quarry dust from stone
dressing quarries (QDNdar) was obtained
from Juja in Thika District. Plate 3.1 shows
quarry dust material in a typical quarry. In this
study, QDNbi was used in both the production
of concrete and block making while QDNdar
due to its high water absorption was used in
making masonry block only.
3.2.5 Laterite
Since in this study, laterite was intended for use with quarry dust, laterite found near
Nairobi, where there is plenty of quarry dust was used. The material was obtained
from a suitable quarry in Nairobi. The role of the laterite material was to modify the
quarry dust component to be utilized in production of concrete and masonry blocks.
Plate 3.1: Quarry dust in a quarry site
22
3.2.6 Recycled concrete aggregates
From the literature, it has been reported that the grade of the parent concrete does
not significantly influence the mechanical properties of new concrete manufactured
from recycled concrete aggregates (ECCO, 1999). Therefore, concrete of varying
compressive strength was used as parent material for the production of recycled
concrete aggregates.
Recycled concrete aggregates were obtained by manually crushing laboratory tested
concrete cylinders and cubes some as old as over 15 years. The old concrete was
sorted out to remove all foreign unwanted materials before crushing. The material
was then manually crushed by use of sledge hammer. A 5 mm sieve was then used
to separate the fine dust from the aggregates. Only material retained on the 5mm
sieve was used for concrete production as coarse aggregates. Confirmatory test was
also set up to confirm that the properties of parent concrete do not influence the
performance of the new concrete. To carry out this conventional concrete of known
compressive strength was made in the laboratory. The conventional concrete was
then used in casting small sized slabs. The concrete slabs were then cured using
standard procedure for 28 days. After this period, the concrete slabs were manually
crushed and the material separated using the 5 mm sieve. New concrete was then
produced for the recycled concrete aggregates of known strength and compared to
concrete utilizing the old parent concrete of unknown strength.

23
3.2.7 Conventional building blocks
Conventional building blocks were
obtained from a typical quarry at
Ndarugu, Thika district. A photo of
conventional machine dressed blocks is
shown in Plate 3.2. The blocks were
reduced in size to march the size of the
stabilized quarry dust blocks using a
bench mounted cutter. This was done in order to allow comparison of the results to
be made.
3.3 Material physical properties test
The main material physical properties tests carried out on the aggregates included
density, silt content, water absorption and gradation tests. Specific gravity data is
used in describing the aggregate while bulk density is used for proportioning
material in mix design. Silt content information is important in determining the
suitability of a particular material in concrete production and the water requirement
of the concrete mix. Finally, gradation information is useful in establishing
workability requirement of the concrete mix.
3.3.1 Density tests
Bulk density test was carried out according to the standard procedures required by
BS812: Part 2 of 1996. The bulk density measurements were done in two states of
Plate 3.2: Machine dressed blocks,

24
the aggregates: loose and compacted state. In both cases, the aggregates were oven
dried. Apparent specific gravity test was carried out according to the standard
procedures required by BS812: Part 2 of 1996. Apparent specific gravity is defined
as the ratio of the weight of the aggregate dried in an oven at 100 to 110oC for 24
hours to the weight of water occupying a volume equal to that of the solid including
the impermeable pores (Neville, 1981). Bulk and apparent densities for both the
fine and coarse aggregates were determined.
3.3.2 Silt content test
Silt content in fine aggregates was determined according to the standard procedures
required by BS812: Part 2 of 1996 and KS-02-95 of 1984.
3.3.3 Water absorption test
Water absorption tests were conducted on all the fine and coarse aggregates. The
water absorption of the aggregate was determined by measuring the increase in
weight of an oven-dried sample when immersed in water for 24 hours. The water
absorption was defined as the ratio of the increase in weight to the weight of the dry
sample, expressed as a percentage. The test was carried out according to BS 812:
Part 2 of 1975 requirements
3.3.4 Sieve analysis or gradation test
The sieve analysis test involves dividing a sample of aggregate into fractions which
contain particles between specific size limits, these being the openings of standard

25
sieves. Gradation test was carried out using sieves to the requirements of BS812:
Part 1; 1975. This was done for all the fine and coarse aggregates used in this study.
3.4 Studies on concrete mixes and optimal material combination
3.4.1 Optimum QDNbi content
The optimum QDNbi content test was aimed at determining the optimum fine
aggregate combination of river sand and quarry dust to give concrete with the best
performance. In the conventional concrete of nominal mix 1:1.5:3 for cement, river
sand and natural crushed aggregates, respectively, river sand was partially replaced
with 0, 25, 50, 75 and 100% of quarry dust (crushed rock quarry dust). Test cubes
were then prepared and tested for compressive strength at the age of 7, 28 and 90
days using standard procedures.
3.4.2 Optimum RCA content
In this study, only the coarse part of recycled concrete aggregate is proposed for use
in concrete production. In the conventional concrete of nominal mix 1:1.5:3 for
cement, river sand and natural crushed aggregates respectively, natural crushed
coarse aggregates was partially replaced with recycled concrete. Test cubes were
then be prepared and tested for compressive strength at the age of 7, 28 and 90 days
using standard procedures.
3.4.3 Optimum laterized quarry dust content
The performance of laterite as fine material replacement in concrete has been
studied and found to produce good results. Udoeyo et al (2006) demonstrated that

26
concrete with up to 40% replacement level of sand by laterite attained the designed
strength of 20 N/mm2. This research aims at utilizing laterized quarry dust as river
sand replacement in concrete. In concrete utilizing natural crushed aggregates and an
optimum combination of river sand and quarry dust as determined above, the
amount of quarry dust was partially replaced with 0, 12.5, 25, 37.5 and 50% of
laterite material. This test was aimed at evaluating the behaviour of the combined
material when natural crushed aggregates are used. The effect of partially replacing
quarry dust with laterite when recycled concrete aggregates are used as coarse
aggregates was also investigated. In this case, the amount of quarry dust was
partially replaced with 0, 20, 40 and 60% of laterite material. Test cubes were then
be prepared and tested for compressive strength at the age of 7, 28 and 90 days using
standard procedures.
3.4.4 Workability tests
The most common workability test methods are the slump test, the compacting
factor test and the Vebe test. Since the materials used in the concrete production are
not conventional, two methods; the slump test and the compacting factor test were
used. Slump test was carried out on samples of fresh concrete as per the
requirements of BS1881: Part 102 of 1983. Compacting factor test was also carried
out on samples of fresh concrete as per the requirements of BS1881: Part 103 of
1983. Both tests were carried out immediately after mixing the concrete.

27
3.4.5 Compressive strength test
Laboratory compressive strength test on concrete cubes is important because it gives
an indication of the mechanical strength of the concrete which is a very important
parameter in the design of any concrete structure. The concrete test cubes were
prepared according to BS1881: Part 108 of 1983 requirements. After 7, 28 and 90
days, the cured cubes and cylinders were tested according to BS1881: Part 116 of
1983 requirements.
3.5 Studies on masonry block mixes and optimal material combination
3.5.1 Optimum cement content
To determine the optimum cement content, laterized quarry dust of mix ratio 1:1:2
for QDNbi, QDNdar and laterite, respectively, was stabilized with cement content
varying between 3 to 14%. The stabilized quarry dust block mixes were then used to
make machine pressed blocks which were cured at room temperature for 7 days and
let to dry in a shed.
3.5.2 Optimum quarry dust combination
The optimum quarry dust combination was determined by evaluating block mixes
containing various proportions of quarry waste from machine dressed blocks. In a
block mix containing 7% of Portland cement, QDNbi was partially replaced with 0,
25, 50, 75 and 100% of QDNdar. The laterite content was kept equal to the quarry
dust combined content.

28
3.5.3 Optimum laterite content
To determine the optimum laterite content in block mix, quarry dust material was
partially replaced with 0, 25, 50, 75 and 100% of laterite. The quarry dust material
in the mix consisted of quarry dust from aggregates crushing plant and quarry waste
from machine dressed stone quarry in equal proportions.
3.5.4 Compressive strength test of masonry blocks
Cured masonry blocks were tested for
compression strength on a universal
testing machine (Plate 3.3) after 7, 28 and
90 days from the day of casing. Three
blocks were tested for each case and the
average compressive strength reported as
the compressive strength of the blocks at
that specified age.
3.5.5 Water absorption test of blocks
The water absorption test was carried out on blocks after curing and subsequent
drying at the age of 28 days from the date of casting. The test was determined by
measuring the increase in weight of dried sample of blocks when immersed in water
for 24 hours (the source of the water being removed). The ratio of the increase in
weight to the weight of the dry sample, expressed as a percentage, is termed
absorption.
Plate 3.3 Experimental set up fortesting blocks on a UTM.

29
3.6 Reinforced concrete beam testing
3.6.1 Specimen preparation
Beams measuring 1200 mm length x 150 mm wide x 200 mm depth were tested to
determine the flexural behaviour when subjected to a central point load. The beams
were reinforced with varying amount of reinforcement with cover to steel
reinforcement being maintained at 30 mm. Shear reinforcement in form of links
were also provided to enhance shear capacity of the beam and ensure the beams fail
in bending and not shear mode. First, reinforcement cage was prepared for each
beam. The cage was then placed in prepared formwork in which spacer blocks were
used to position the reinforcement in order to maintain cover to the reinforcement
bars at 30 mm. Concrete of various material compositions was prepared and the
beams cast by placing the concrete in the mould and vibrating using poker vibrator.
After 24 hours the beams were demoulded and rapped in wet cloth for curing. Water
was used for curing the beams for 7 days. The beams were then let to harden up to
an age of 28 days. A total of 8 beams were tested in this study. During casting of the
beams, standard concrete cubes were also cast and cured for testing after 28 days.
Table 3.1 shows details of the beam specimen.

30
Table 3.1 Beam specimen details
Beam Material Concrete Mix
Bottom reinforcement
Rebars % age steel
ConvConc1-2-4 Conventional concrete
1:2:4 2Y10 0.523
ConvConc1-1.5-3(8) Conventional concrete
1:1.5:3 2Y8 0.333
ConvConc1-1.5-3(10)
Conventional concrete
1:1.5:3 2Y10 0.523
ConvConc1-1-2 Conventional concrete
1:1:2 2Y10 0.523
AltConc1-2-4 Alternative concrete
1:2:4 2Y10 0.523
AltConc1-1.5-3(8) Alternative concrete
1:1.5:3 2Y8 0.333
AltConc1-1.5-3(10) Alternative concrete
1:1.5:3 2Y10 0.523
AltConc1-1-2 Alternative concrete
1:1:2 2Y10 0.523
3.6.2 Testing procedure and instrumentation
Well cured beam was placed on a steel beam on which roller supports had been
mounted by use of clamps in order to prevent movement of supports during testing.
The beam was checked for verticality using a spirit level. An electrical resistance
strain gauge was then pasted at the centre bottom face of the beam. The strain gauge
was used to measure the strain of concrete surface of the beam. Linear Variable
Displacement Transducer (LVDT) to measure beams central displacement was
positioned at the central point of the beam near the bottom. LVDT and electrical
resistance strain gauge were connected to a data logger (TDS 302) which was in turn
connected to a computer to automatically take measurements. Load applied was

31
measured by the Universal Testing Machine (UTM) and recorded by the data
logger. During testing, settlement load was first applied on the beams. This was
done in order to check that the entire system was working well. The beam was then
loaded to failure while monitoring the formation and general pattern of crack.
Beams failed by breaking of steel reinforcement which was accompanied by loud
noise. The procedure was repeated for all the other seven beams. Plate 3.2 shows the
concrete beam set-up ready for testing.
Plate 3.4 Experimental set-up of concrete beam ready for testing
3.7 Masonry wall panel testing
3.7.1 Specimen preparation
3.7.1.1 Stabilized laterized quarry dust masonry blocks
Stabilised laterized quarry dust masonry blocks were made by mixing cement,
QDNbi, QDNdar and laterite in appropriate proportions. After mixing the materials
in dry state, water was added to the material then it was thoroughly mixed.
32
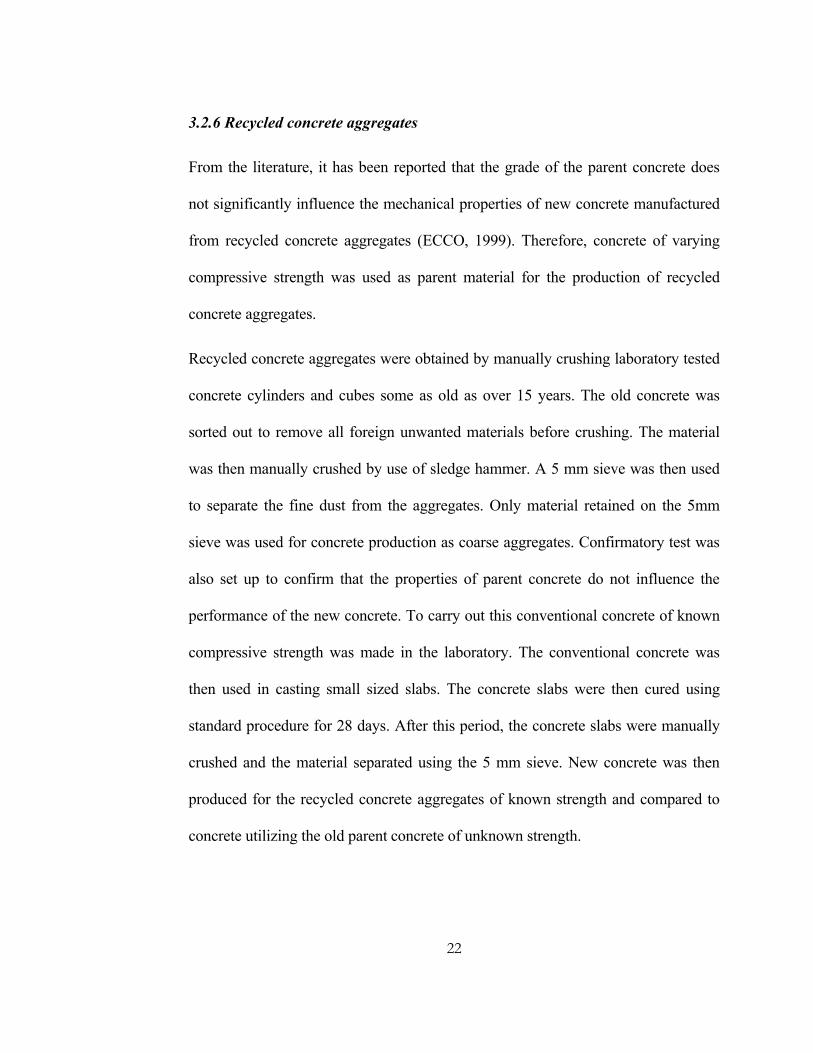
Thereafter the mixture was pressed using a standard block pressing machine to make
blocks of size 290 x 140 x 120 mm. The block was then removed and stored in a
shed. This was repeated for each masonry block mix prepared. Curing was done
after 24 hours for a period of 7 days by sprinkling water on the blocks. Plate 3.5
shows the stabilized quarry dust masonry block being removed from the machine.
Plate 3.5 Laterized quarry dust block being removed from the machine
3.7.1.2 Wall panels
Wall panels of varying dimensions were build on steel plates fitted with handles for
ease of lifting the walls to the testing machine. Details of wall panels tested in this
study are shown in Table 3.2. The variables investigated included the strength of
mortar joint, the effect of reinforcement on wall behaviour and the effect of size of
the panel on wall behaviour. A total of 10 wall panels were tested.
33
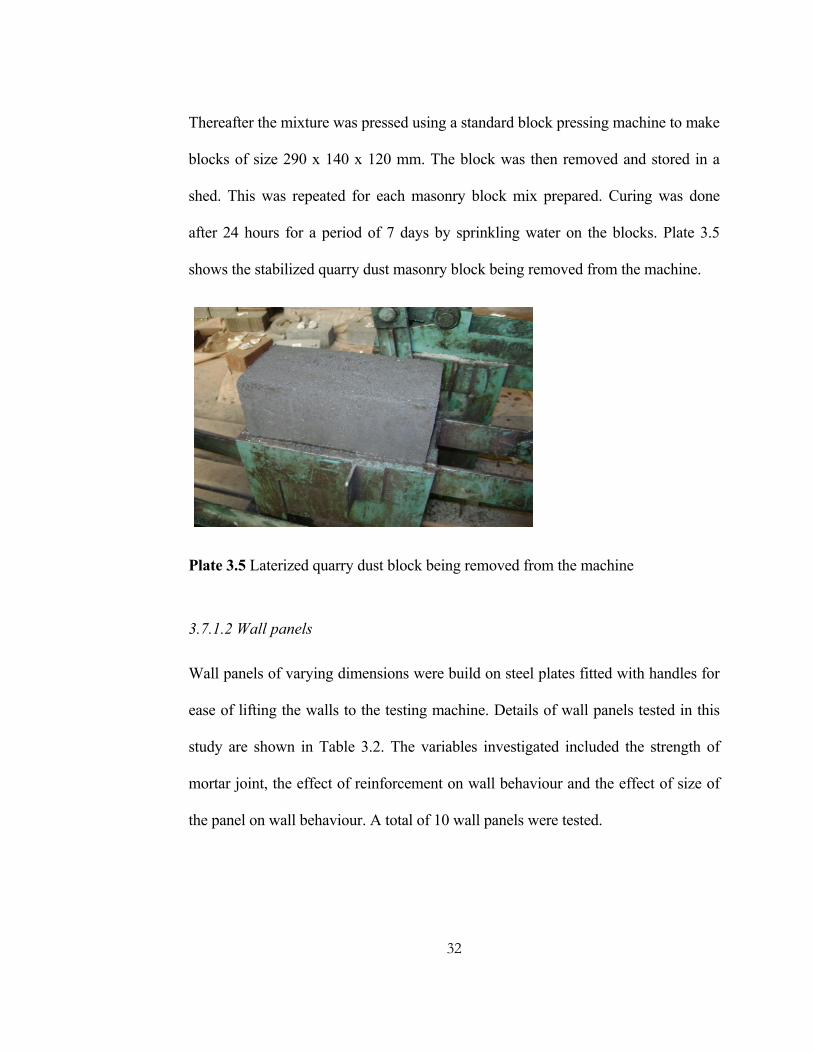
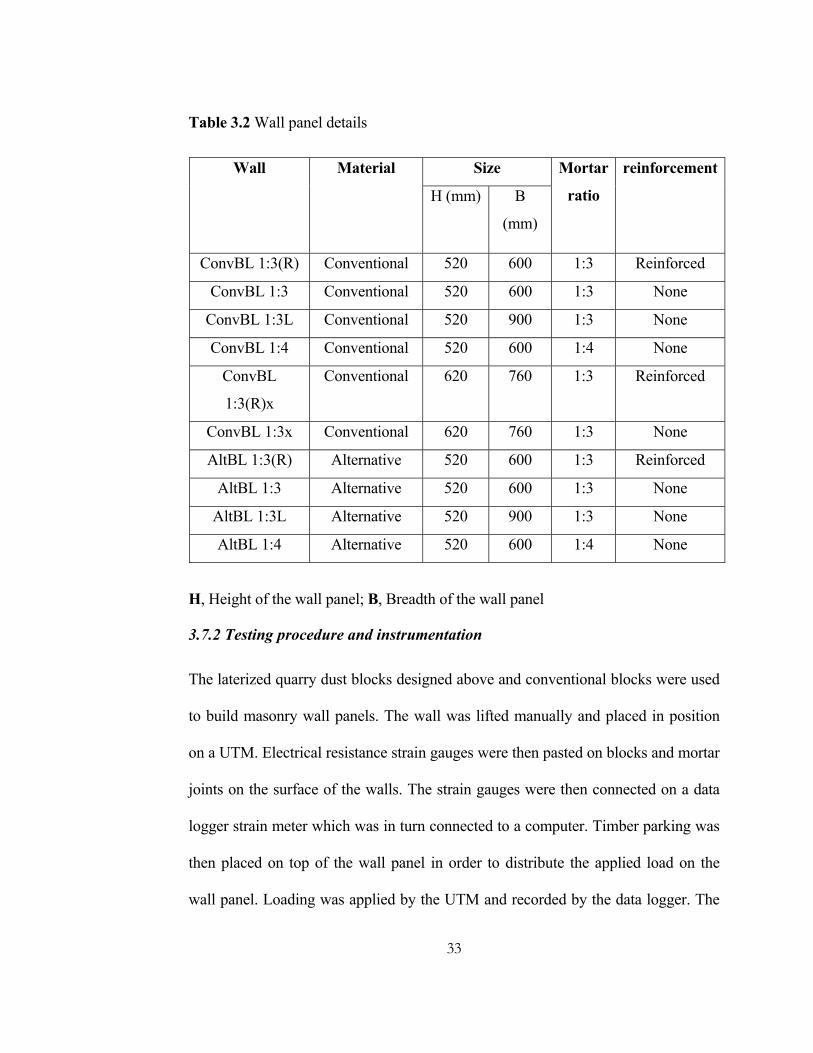
Table 3.2 Wall panel details
Wall Material Size Mortar
ratio
reinforcement
H (mm) B
(mm)
ConvBL 1:3(R) Conventional 520 600 1:3 Reinforced
ConvBL 1:3 Conventional 520 600 1:3 None
ConvBL 1:3L Conventional 520 900 1:3 None
ConvBL 1:4 Conventional 520 600 1:4 None
ConvBL
1:3(R)x
Conventional 620 760 1:3 Reinforced
ConvBL 1:3x Conventional 620 760 1:3 None
AltBL 1:3(R) Alternative 520 600 1:3 Reinforced
AltBL 1:3 Alternative 520 600 1:3 None
AltBL 1:3L Alternative 520 900 1:3 None
AltBL 1:4 Alternative 520 600 1:4 None
H, Height of the wall panel; B, Breadth of the wall panel
3.7.2 Testing procedure and instrumentation
The laterized quarry dust blocks designed above and conventional blocks were used
to build masonry wall panels. The wall was lifted manually and placed in position
on a UTM. Electrical resistance strain gauges were then pasted on blocks and mortar
joints on the surface of the walls. The strain gauges were then connected on a data
logger strain meter which was in turn connected to a computer. Timber parking was
then placed on top of the wall panel in order to distribute the applied load on the
wall panel. Loading was applied by the UTM and recorded by the data logger. The

34
wall panel was then loaded to failure with the surface strains and load being
automatically recorded by the assembly. This was repeated for all the other wall
panels. The experimental set-up for wall testing is shown in Plate 3.6.
(a) Schematic representation
(b) Photo of experimental set-up for wall panels Plate 3.6 Experimental set up for wall panels
Strain gauge
To Computervia TDS Meter

35
CHAPTER FOUR
4.0 MATERIAL PHYSICAL PROPERTIES
4.1 Introduction
In this chapter, material properties for all the aggregates investigated are evaluated.
The main material properties that have been found to influence the material
behaviour include gradation, clay or silt content, water absorption and density
(which is primarily used in determining batching proportions in mix design). Other
mechanical properties also exist but their influence is application dependent hence
have not been the focus in this study. The gradation of aggregates, clay or silt
content, water absorption and density of the material were determined according to
the requirements of BS812: Part 2 of 1996 and KS-02-95 of 1984.
4.2 Results and discussion
4.2.1 Relative density
Both the bulk and the specific relative densities were used to describe the aggregates
in this study. The bulk density of material was determined both in the loose and
dense state. The values for bulk and specific densities of river sand, QDNbi,
QDNdar, laterite, natural crushed aggregates and recycled concrete aggregates are
shown in Table 4.1. From the table, the bulk densities of river sand and QDNbi in
the loose state are 1405 and 1354 kg/m3, respectively. Loose state densities for
QDNdar and laterite material are 950 and 1162 kg/m3, respectively. These values
compare well with the results reported by Raman et al (2007) and Mulu et al (1998).
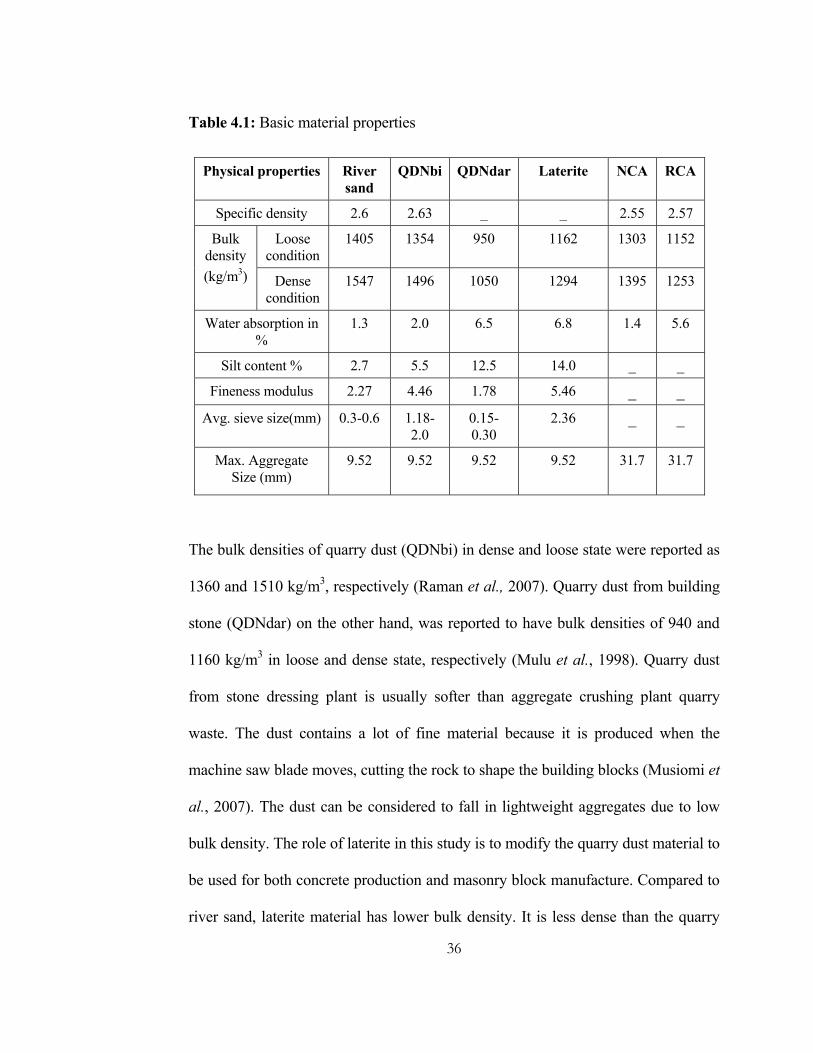
36
Table 4.1: Basic material properties
Physical properties River sand
QDNbi QDNdar Laterite NCA RCA
Specific density 2.6 2.63 _ _ 2.55 2.57 Bulk
density (kg/m3)
Loose condition
1405 1354 950 1162 1303 1152
Dense condition
1547 1496 1050 1294 1395 1253
Water absorption in %
1.3 2.0 6.5 6.8 1.4 5.6
Silt content % 2.7 5.5 12.5 14.0 _ _ Fineness modulus 2.27 4.46 1.78 5.46 _ _
Avg. sieve size(mm) 0.3-0.6 1.18-2.0
0.15-0.30
2.36 _ _
Max. Aggregate Size (mm)
9.52 9.52 9.52 9.52
31.7 31.7
The bulk densities of quarry dust (QDNbi) in dense and loose state were reported as
1360 and 1510 kg/m3, respectively (Raman et al., 2007). Quarry dust from building
stone (QDNdar) on the other hand, was reported to have bulk densities of 940 and
1160 kg/m3 in loose and dense state, respectively (Mulu et al., 1998). Quarry dust
from stone dressing plant is usually softer than aggregate crushing plant quarry
waste. The dust contains a lot of fine material because it is produced when the
machine saw blade moves, cutting the rock to shape the building blocks (Musiomi et
al., 2007). The dust can be considered to fall in lightweight aggregates due to low
bulk density. The role of laterite in this study is to modify the quarry dust material to
be used for both concrete production and masonry block manufacture. Compared to
river sand, laterite material has lower bulk density. It is less dense than the quarry
37
dust from aggregate crushing plant but denser than the dust from stone dressing
quarries.
In the coarse aggregates, the loose state bulk densities of natural crushed and
recycled concrete aggregates were 1303 and 1152 kg/m3, respectively. The
corresponding values for dense state density were 1395 and 1253 kg/m3,
respectively. Recycled concrete aggregate had lower bulk density than conventional
aggregates. Limbachiya et al (2004) while investigating the performance of recycled
aggregate concrete reported bulk density in loose state for RCA and natural crushed
aggregates (NCA) as 1190 and 1340 kg/m3, respectively. These values are generally
comparable to the results obtained in this study. The use of recycled concrete
aggregate as course aggregates in concrete production has been accepted in
industrially advanced countries such as the USA, Japan and the UK (ECCO, 1999).
It is generally accepted that when river sand is used, up to 30% of natural aggregates
can be replaced with recycled concrete aggregates without affecting properties of
concrete (ECCO, 1999).
4.2.2 Silt content
The determination of silt content was carried out according to the standard
procedures required by BS812; Part2, 1996: Methods of Sampling and Testing of
Mineral Aggregates, Sands and Fillers. The silt content for river sand, QDNbi,
QDNdar and laterite material is also shown in Table 4.1. From the table, the silt
content of 2.7 and 5.5% were present in river sand and QDNbi, respectively. The
values for QDNdar and laterite were 12.5 and 14%, respectively. Laterite material
38
contain the highest amount of silt or clay content followed by the QDNdar. River
sand recorded the lowest silt content. BS 882:1973 specifies maximum silt content
of 15% in crushed stone sand and 3% in natural or crushed gravel sand. River sand
and laterite material are obtained naturally without any specific processing. Laterite
has silt content of 14% and hence does not meet the minimum requirements for silt
content according to BS 882:1973. River sand on the other hand has silt content of
2.7% which is less than the maximum value of 3% specified in BS 882:1973. High
silt content in construction material has the effect of increasing the water
requirement of concrete needed to achieve a specified level of workability.
4.2.3 Water absorption
Water absorption was determined for all the fine and coarse aggregates by
measuring the increase in weight of an oven-dried sample when immersed in water
for 24 hours. Table 4.1 shows water absorption of all the fine and coarse aggregates.
In the fine material, laterite recorded the highest absorption followed by QDNdar.
River sand had absorption of 1.3% which was the lowest in fine aggregates.
Quarry dust (QDNbi) was found to have higher water absorption than river sand
because the quarry dust contains crusher dust which has the effect of increasing the
water absorption of the material. The values of water absorption quoted for river
sand and quarry dust as 1.3 and 2%, respectively, are generally within the limits
proposed by Neville (2007) for commonly used fine aggregates. Quarry dust from
stone quarries (QDNdar) has even higher water absorption than QDNbi because it is
produced from soft rock. During processing of the two materials, QDNdar is
39
produced with high contents of fine material than QDNbi. Due to high fine material
content, the dust has high water absorption and silt content than the conventional
river sand and the quarry dust from the aggregate crushing plant. The high water
absorption of the dust restricts its use as fine aggregates in concrete production. In
this study, the dust is recommended for use in making of masonry blocks only since
it has been demonstrated to perform well in cement stabilized blocks. The results in
Table 4.1 shows that laterite material has the highest water absorption and silt
content than all the other fine aggregates. The high content of fine material in laterite
leads to the high water absorption of the material.
Natural crushed aggregates had absorption of 1.4% while recycled concrete
aggregates recorded a value of 5.6%. The high water absorption for recycled
concrete aggregates is due to the cement paste attached to aggregates in the material
(Limbachiya et al., 2004). The values of water absorption reported by Limbachiya et
al (2004) in their study are 5.5 and 2.5% for RCA and NCA, respectively. The
findings in this study therefore, confirm earlier research work on the materials.
4.2.4 Gradation of aggregates
Gradation of aggregates was obtained by dividing samples of material using
standard sieves according to the standard procedures required by BS812; Part2,
1996: Methods of Sampling and Testing of Mineral Aggregates, Sands and Fillers.
The standard sieves that were used for gradation test of coarse aggregates include;
2.36, 4.75, 9.5, 12.5, 19.0, 25.0, 38.1 and 50.0 mm, while fine materials were
analysed using standard sieves of sizes 0.15, 0.30, 0.60, 1.18, 2.36, 4.75 and 9.5

40
mm. It has been reported that compressive strength of fully compacted concrete with
a given water/cement ratio is independent of the grading of the aggregates. Hence
grading is of importance only as far as it affects workability (Neville, 1981).
The gradation curves for the river sand, quarry dust and laterite are shown in
Figure 4.1. In the figure, the gradation curves are plotted together with the standard
limits of Zone 1 for fine aggregates according to BS 882:1973. The figure shows
that all the fine materials investigated fall outside the standard limits specified for
Zone 1 fine aggregates as per the British standards. River sand and QDNdar are
finer than the requirements of Zone 1 while QDNbi and laterite are coarser. The
trend in the gradation curves is evident in the values of fineness modulus of the
respective materials. Fineness modulus is a single parameter used to give an
indication of the particle size distribution in fine aggregates. In Table 4.1, laterite
has the largest fineness modulus of 5.46 and then followed by QDNbi, river sand
and QDNdar in that order. The fineness modulus for the QDNbi, river sand and
QDNdar were 4.46, 2.27 and 1.78, respectively. Therefore, the fineness modulus
and the gradation curves show that laterite contain the largest amount of coarse
material and then followed by QDNbi, river sand and QDNdar in that order.

41
Figure 4.1 Gradation curves for river sand, QDNbi, QDNdar and Laterite-BS 882:1973 Grading Zone 1.
In Figure 4.2, gradation curves for river sand, quarry dust and laterite are shown.
The figure shows that out of all the fine aggregates investigated, it is only river sand
that satisfies the requirements of Zone 2 according to BS 882:1973. QDNdar contain
large amount of fine material that make its gradation curve to cross the lower
boundary line that defines Zone 2. Laterite and QDNbi contain large amount of
coarse material and hence they fall outside the specified limits for Zone 2.
Generally, Zone 2 defines fine aggregates that are finer than the aggregates that meet
Zone 1 of BS 882:1973 requirements.
0
20
40
60
80
100
120
0.1 1 10
% Cum
mulative pa
ssing
Sieve size in mm
RS
QDNbi
QDNdar
LAT
ZONE 1

42
Figure 4.2 Particle size distribution for river sand, QDNbi, QDNdar and Laterite-BS 882:1973 Grading Zone 2
Gradation curves for river sand, quarry dust and laterite, plotted with Zone 3 limits
of the British standards, are shown in Figure 4.3. Out of all the fine aggregates, only
river sand satisfies the particle size distribution requirements of Zone 3 according to
BS882 of 1973. QDNdar, due to high silt content, crosses the boundary line for
Zone 3 and hence does not satisfy the requirements of this zone. QDNbi and laterite
on the other hand, contain a lot of coarse material and hence do not meet the
requirements for Zone 3 as per BS882 of 1973.
In Figure 4.4, particle size distribution curves for fine aggregates are shown plotted
on Zone 4 limits of British standards. Zone 4 defines aggregates that fall in finest
category of fine aggregates. Aggregates that fall in this category usually require
special consideration to workability as well as compressive strength since.
0
20
40
60
80
100
120
0.1 1 10
% Cum
mulative pa
ssing
Sieve size in mm
RS
QDNbi
QDNdar
LAT
ZONE 2

43
Figure 4.3 Gradation curves for river sand, QDNbi, QDNdar and Laterite-BS 882:1973 Grading Zone 3
Figure 4.4 Particle size distribution for river sand, QDNbi, QDNdar and Laterite-BS 882:1973 Grading Zone 4
0
20
40
60
80
100
120
0.1 1 10
% Cum
mulative pa
ssing
Sieve size in mm
RS
QDNbi
QDNdar
LAT
ZONE 3
0
20
40
60
80
100
120
0.1 1 10
% Cum
mulative pa
ssing
Sieve size in mm
RS
QDNbi
QDNdar
LAT
ZONE 4
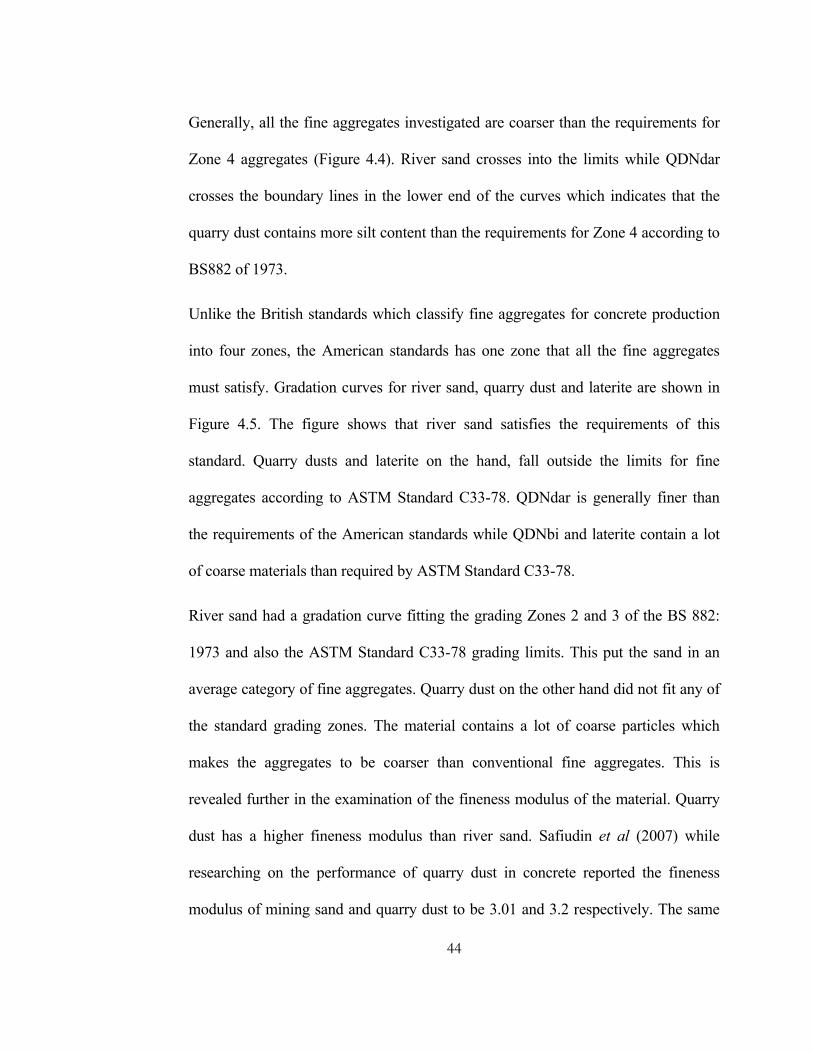
44
Generally, all the fine aggregates investigated are coarser than the requirements for
Zone 4 aggregates (Figure 4.4). River sand crosses into the limits while QDNdar
crosses the boundary lines in the lower end of the curves which indicates that the
quarry dust contains more silt content than the requirements for Zone 4 according to
BS882 of 1973.
Unlike the British standards which classify fine aggregates for concrete production
into four zones, the American standards has one zone that all the fine aggregates
must satisfy. Gradation curves for river sand, quarry dust and laterite are shown in
Figure 4.5. The figure shows that river sand satisfies the requirements of this
standard. Quarry dusts and laterite on the hand, fall outside the limits for fine
aggregates according to ASTM Standard C33-78. QDNdar is generally finer than
the requirements of the American standards while QDNbi and laterite contain a lot
of coarse materials than required by ASTM Standard C33-78.
River sand had a gradation curve fitting the grading Zones 2 and 3 of the BS 882:
1973 and also the ASTM Standard C33-78 grading limits. This put the sand in an
average category of fine aggregates. Quarry dust on the other hand did not fit any of
the standard grading zones. The material contains a lot of coarse particles which
makes the aggregates to be coarser than conventional fine aggregates. This is
revealed further in the examination of the fineness modulus of the material. Quarry
dust has a higher fineness modulus than river sand. Safiudin et al (2007) while
researching on the performance of quarry dust in concrete reported the fineness
modulus of mining sand and quarry dust to be 3.01 and 3.2 respectively. The same

45
values were also quoted by Raman et al (2007) in their study on quarry dust
although he used pit sand as opposed to mining sand.
Figure 4.5 Gradation curves for river sand, QDNbi, QDNdar and Laterite- ASTM Standard C33-78
Quarry dust from stone dressing plant approximate the grading Zone 3 of BS
882:1973 but contain a lot of fine material that makes it deviate from the standard
limits for conventional material. River sand on the other hand fit the grading Zones
2 and 3 of BS 882:1973 and ASTM Standard C33-78 grading. The fineness modulus
of river sand and dust are 2.27 and 1.78, respectively. If used for concrete
production, the dust would increase the water demand of the concrete hence
negatively affect the compressive strength of the concrete.
Sieve analysis results indicated that laterite contain coarser particles than the other
fine aggregate materials. Therefore, the gradation curve of laterite is not fitting any
of the standard grading limits for fine aggregates. The material, however, contains
0
20
40
60
80
100
120
0.1 1 10
% Cum
mulative pa
ssing
Sieve size in mm
RS
QDNbi
QDNdar
LAT
ASTM
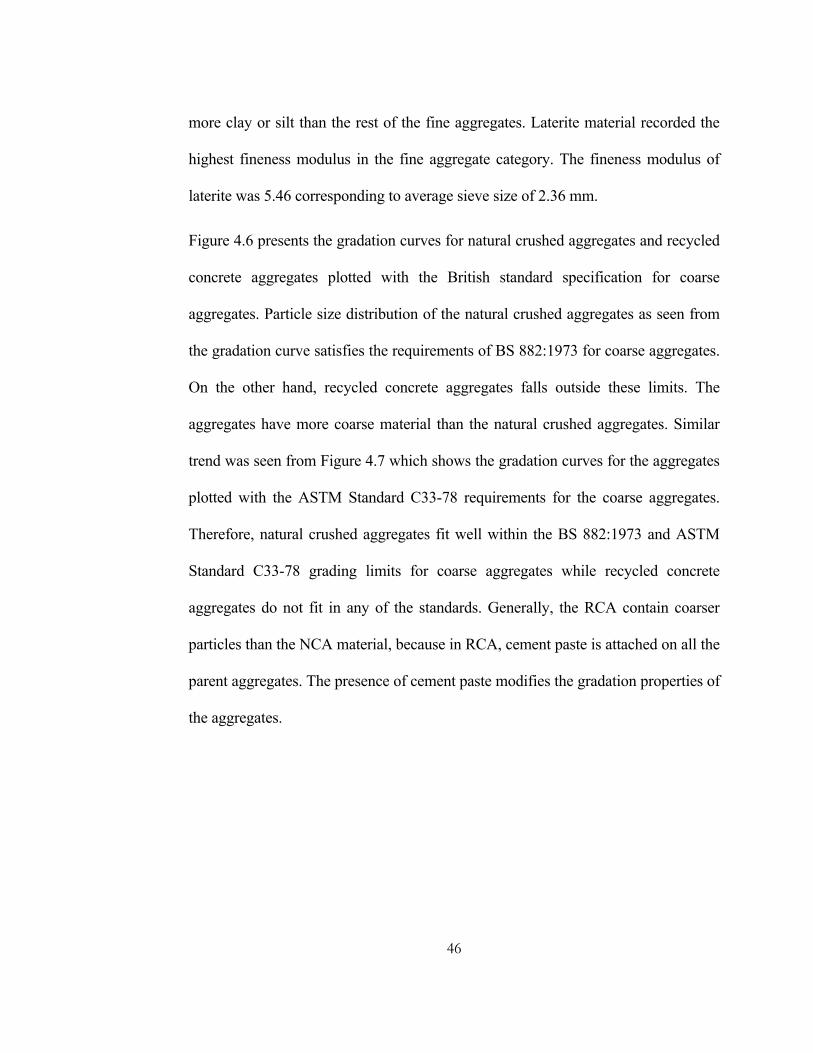
46
more clay or silt than the rest of the fine aggregates. Laterite material recorded the
highest fineness modulus in the fine aggregate category. The fineness modulus of
laterite was 5.46 corresponding to average sieve size of 2.36 mm.
Figure 4.6 presents the gradation curves for natural crushed aggregates and recycled
concrete aggregates plotted with the British standard specification for coarse
aggregates. Particle size distribution of the natural crushed aggregates as seen from
the gradation curve satisfies the requirements of BS 882:1973 for coarse aggregates.
On the other hand, recycled concrete aggregates falls outside these limits. The
aggregates have more coarse material than the natural crushed aggregates. Similar
trend was seen from Figure 4.7 which shows the gradation curves for the aggregates
plotted with the ASTM Standard C33-78 requirements for the coarse aggregates.
Therefore, natural crushed aggregates fit well within the BS 882:1973 and ASTM
Standard C33-78 grading limits for coarse aggregates while recycled concrete
aggregates do not fit in any of the standards. Generally, the RCA contain coarser
particles than the NCA material, because in RCA, cement paste is attached on all the
parent aggregates. The presence of cement paste modifies the gradation properties of
the aggregates.

47
Figure 4.6 Gradation curves for natural crushed aggregates (NCA) and recycled concrete aggregates (RCA)-BS 882:1973
Figure 4.7 Gradation curve for natural crushed aggregates (NCA) and recycled concrete aggregates (RCA)- ASTM Standard C33-78
0
20
40
60
80
100
120
1 10 100
% Cum
mulative pa
ssing
Sieve size in mm
NCA
RCA
BS 882
0
20
40
60
80
100
120
1 10 100
% Cum
mulative pa
ssing
Sieve size in mm
NCA
RCA
ASTM
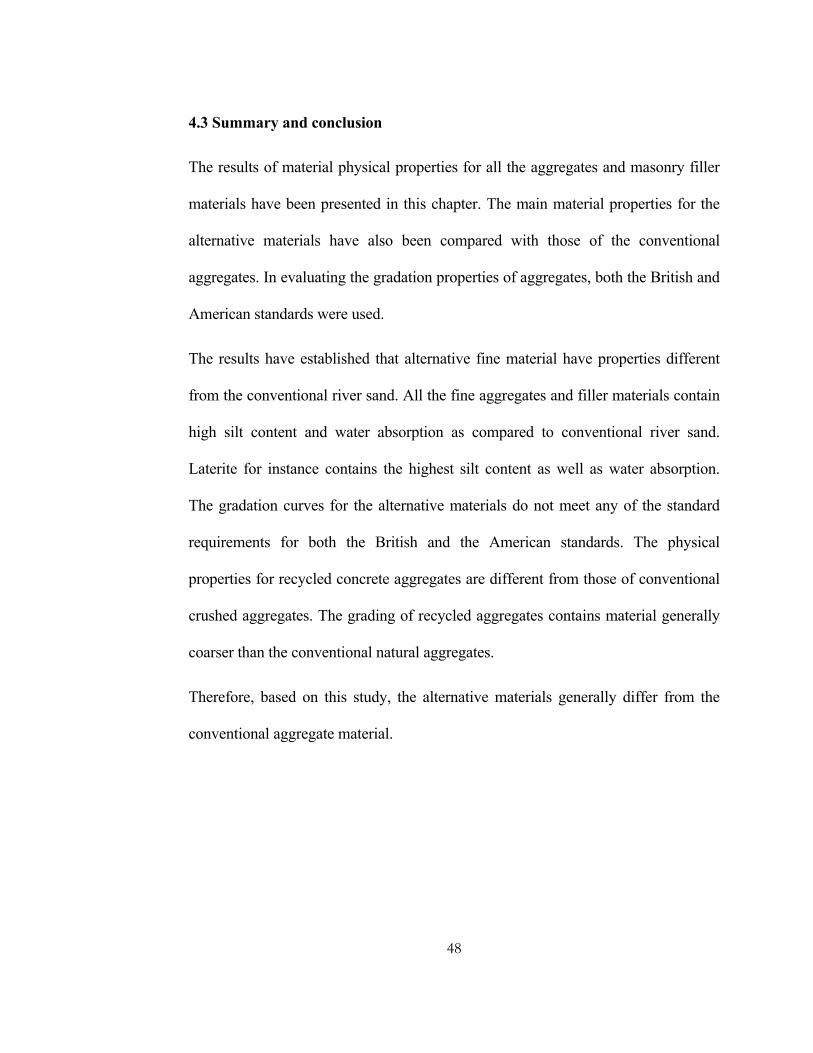
48
4.3 Summary and conclusion
The results of material physical properties for all the aggregates and masonry filler
materials have been presented in this chapter. The main material properties for the
alternative materials have also been compared with those of the conventional
aggregates. In evaluating the gradation properties of aggregates, both the British and
American standards were used.
The results have established that alternative fine material have properties different
from the conventional river sand. All the fine aggregates and filler materials contain
high silt content and water absorption as compared to conventional river sand.
Laterite for instance contains the highest silt content as well as water absorption.
The gradation curves for the alternative materials do not meet any of the standard
requirements for both the British and the American standards. The physical
properties for recycled concrete aggregates are different from those of conventional
crushed aggregates. The grading of recycled aggregates contains material generally
coarser than the conventional natural aggregates.
Therefore, based on this study, the alternative materials generally differ from the
conventional aggregate material.
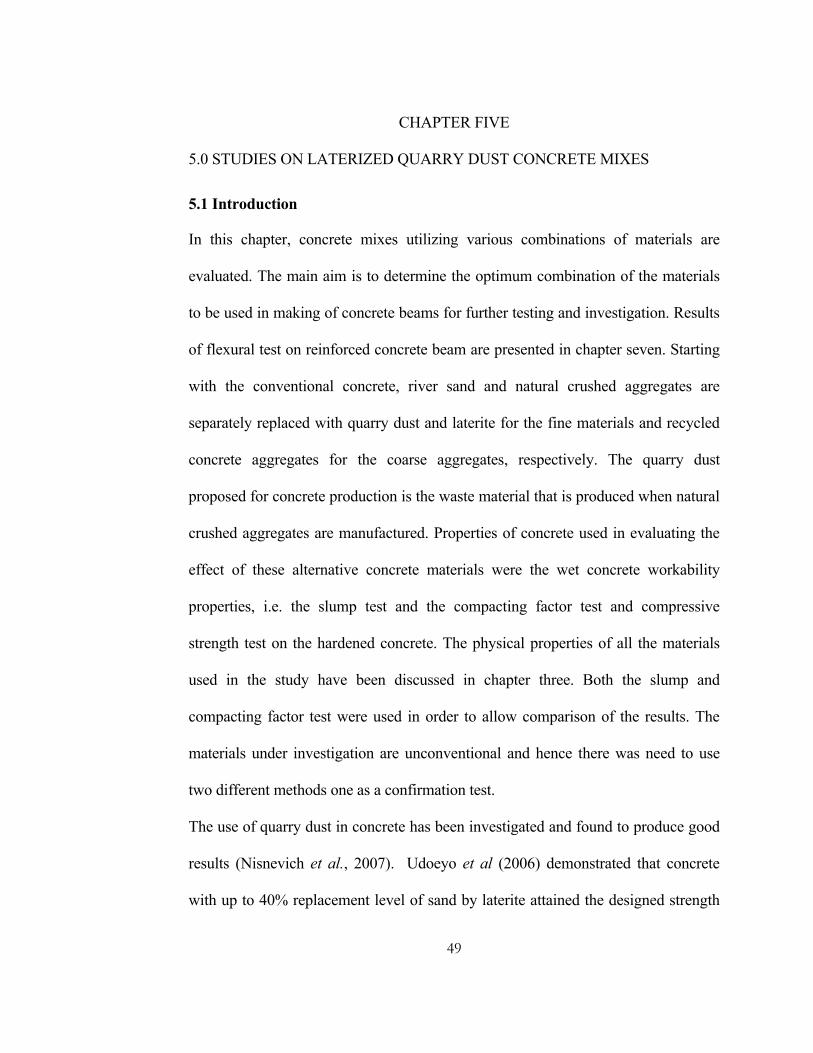
49
CHAPTER FIVE
5.0 STUDIES ON LATERIZED QUARRY DUST CONCRETE MIXES
5.1 Introduction
In this chapter, concrete mixes utilizing various combinations of materials are
evaluated. The main aim is to determine the optimum combination of the materials
to be used in making of concrete beams for further testing and investigation. Results
of flexural test on reinforced concrete beam are presented in chapter seven. Starting
with the conventional concrete, river sand and natural crushed aggregates are
separately replaced with quarry dust and laterite for the fine materials and recycled
concrete aggregates for the coarse aggregates, respectively. The quarry dust
proposed for concrete production is the waste material that is produced when natural
crushed aggregates are manufactured. Properties of concrete used in evaluating the
effect of these alternative concrete materials were the wet concrete workability
properties, i.e. the slump test and the compacting factor test and compressive
strength test on the hardened concrete. The physical properties of all the materials
used in the study have been discussed in chapter three. Both the slump and
compacting factor test were used in order to allow comparison of the results. The
materials under investigation are unconventional and hence there was need to use
two different methods one as a confirmation test.
The use of quarry dust in concrete has been investigated and found to produce good
results (Nisnevich et al., 2007). Udoeyo et al (2006) demonstrated that concrete
with up to 40% replacement level of sand by laterite attained the designed strength
50
of 20 N/mm2. It is also generally accepted that when natural sand is used, up to 30%
of natural crushed aggregate can be replaced with coarse recycled concrete
aggregate without significantly affecting the mechanical properties of the concrete
(Hansen, 1992). So far no attempt has been made to study the performance of a
combination of these materials. No data is also available on the performance of
concrete beams utilizing these alternative concrete materials. This chapter therefore
presents data on the properties of concrete incorporating these alternative materials.
5.2 Results and discussion
5.2.1 Optimum quarry (QDNbi) dust content
To carry out this test, river sand in conventional concrete of mix ratio 1:1.5:3 for
Portland cement, river sand and natural aggregates respectively, was partially
replaced with 0, 25, 50, 75 and 100% of quarry dust. Figure 5.1 shows the The effect
of QDNbi content on slump in a concrete mix. From the figure it can be shown that
the slump of fresh concrete was reducing with increasing amount of QDNbi in the
mix. This was due to the large amount of fine material present in the quarry dust as
compared to the river sand (Mulu et al., 2003). Fine materials generally require
much water to coat the individual particles of the materials in order to provide the
necessary lubrication between the particles that is needed to allow easy movement
during placing of the concrete. This trend in the slump test was confirmed by the
compacting factor test results (Figure 5.2). The results showed that there was a
reduction in compacting factor of concrete with increase in the quarry dust content.
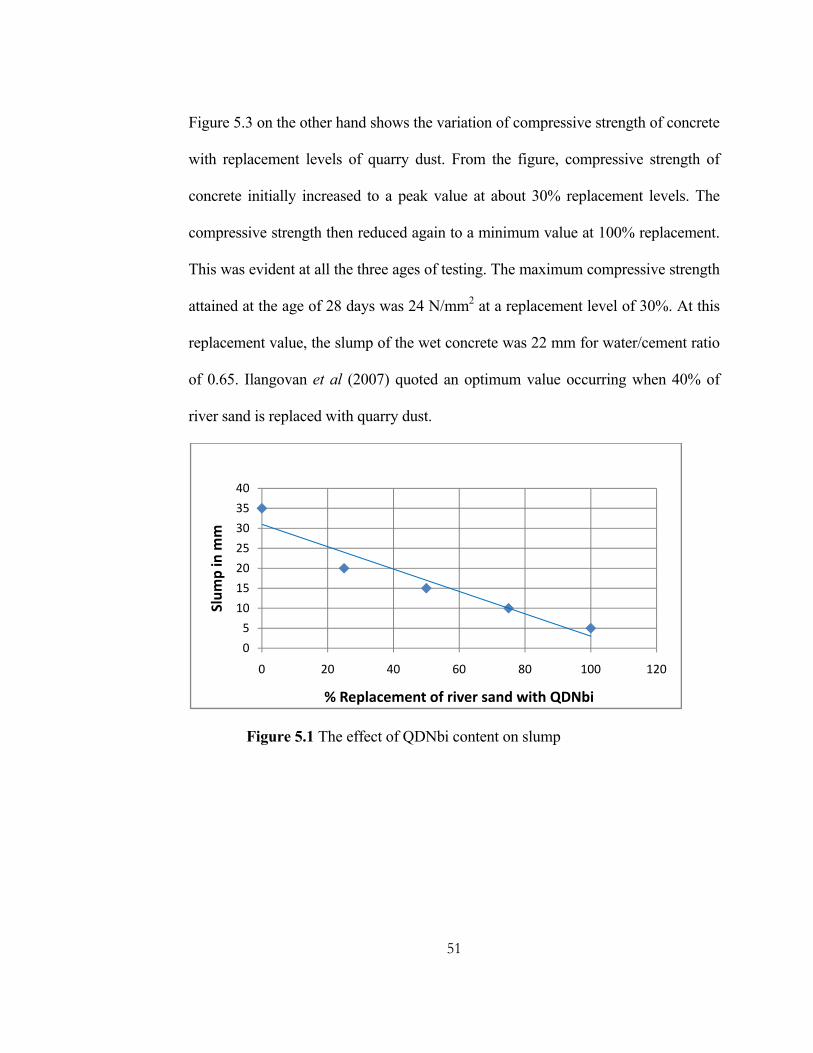
51
Figure 5.3 on the other hand shows the variation of compressive strength of concrete
with replacement levels of quarry dust. From the figure, compressive strength of
concrete initially increased to a peak value at about 30% replacement levels. The
compressive strength then reduced again to a minimum value at 100% replacement.
This was evident at all the three ages of testing. The maximum compressive strength
attained at the age of 28 days was 24 N/mm2 at a replacement level of 30%. At this
replacement value, the slump of the wet concrete was 22 mm for water/cement ratio
of 0.65. Ilangovan et al (2007) quoted an optimum value occurring when 40% of
river sand is replaced with quarry dust.
Figure 5.1 The effect of QDNbi content on slump
0
5
10
15
20
25
30
35
40
0 20 40 60 80 100 120
Slum
p in m
m
% Replacement of river sand with QDNbi

52
Figure 5.2 Variation of compacting factor with QDNbi content
Figure 5.3 Variation of compressive strength with QDNbi content
The results also reveal that increase in the amount of quarry dust in concrete mix
leads to reduction in workability of wet concrete. The quarry dust material as used in
this study, contain a lot of finer materials as compared to the natural river sand. The
presence of fine material in the concrete, demands for extra water content in order to
0.76
0.77
0.78
0.79
0.8
0.81
0.82
0.83
0.84
0 20 40 60 80 100 120
Compa
cting Factor
%Replacement of river sand with QDNbi
0
5
10
15
20
25
30
35
0 20 40 60 80 100 120
Compressive stren
gth (N/m
m2 )
% Replacement of river sand with QDNbi
7days 28 days 90days

53
achieve a specified level of workability (Mulu et al., 2003). At low replacement
levels of river sand with quarry dust, the fine material introduced in the concrete mix
has the effect of filling the small void spaces in the concrete which remain when
conventional materials are used.
Researchers of high performance concrete have discovered that one of the methods
of achieving high strength in concrete is to ensure that the fine void in concrete are
filled as much as possible (Ilangovan et al., 2007). This has lead to introduction of
fine waste material into high performance concrete. Although material such as
ground granulated blast furnace slag and silica fumes have cementitious properties,
they have an effect of filling any fine pores in concrete hence leading to a very
compact high strength concrete. Therefore, the consequence of introducing quarry
dust in small amounts is to increase the compressive strength of concrete. At high
replacement, however, there is a reduction in compressive strength of concrete as the
amount of quarry dust increases. Concrete containing large amount of quarry dust
have low workability which consequently affects placing and compaction of the
concrete. Compaction of concrete has great influence on compressive strength of
concrete (Neville, 1993).
5.2.2 Optimum recycled concrete aggregates (RCA) content
To determine the optimum RCA, the natural crushed aggregate in conventional
concrete of mix ratio 1:1.5:3 for cement, river sand and natural crushed aggregates,
respectively, was partially replaced with 0, 25, 50, 75 and 100% of recycled
concrete aggregates.
54
The relationship between the slump of wet concrete and recycled concrete
aggregates content is shown in Figure 5.4. The figure shows that the slump of wet
concrete was reducing with increase in replacement of natural crushed aggregates
with recycled concrete aggregates. This trend in concrete slump was confirmed by
the results from compacting factor test as shown in Figure 5.5. The reduction of
workability of fresh concrete is due to the high water absorption behaviour of the
recycled concrete aggregates (Limbachiya et al., 2004). Figure 5.6 shows the effect
of recycled concrete aggregates content on the compressive strength of concrete
with. The figure shows that compressive strength of concrete is not significantly
affected by the change in the amount of recycled concrete aggregates in the mix.
It has been reported that when river sand is used, up to 30% of natural crushed
aggregates can be replaced with recycled concrete aggregates (ECCO, 1999). Since
there is no significant effect of the recycled concrete aggregates on the compressive
strength of concrete, total replacement of natural crushed aggregates by recycled
concrete aggregates is adopted in this study. At 100% replacement level, the
workability of concrete is practically suitable. The slump recorded at this level was
80 mm. The alternative concrete used to cast beams contains recycled concrete
aggregates as coarse aggregates.
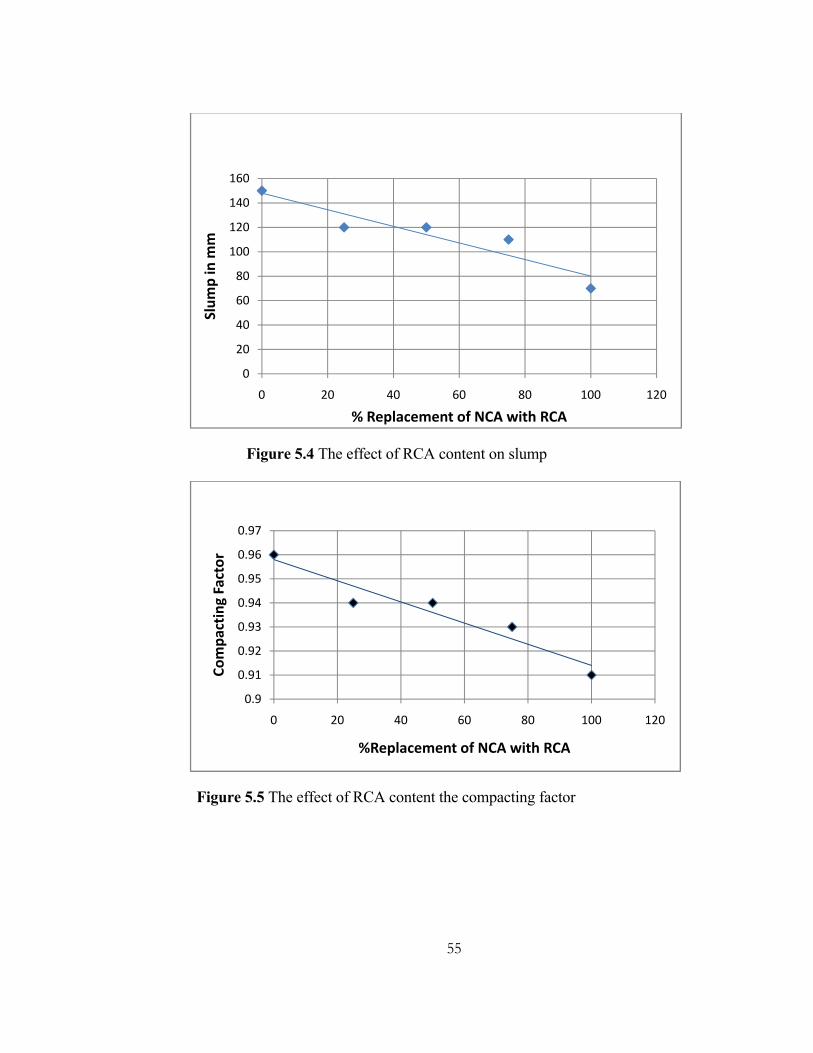
55
Figure 5.4 The effect of RCA content on slump
Figure 5.5 The effect of RCA content the compacting factor
0
20
40
60
80
100
120
140
160
0 20 40 60 80 100 120
Slum
p in m
m
% Replacement of NCA with RCA
0.9
0.91
0.92
0.93
0.94
0.95
0.96
0.97
0 20 40 60 80 100 120
Compa
cting Factor
%Replacement of NCA with RCA

56
Figure 5.6 Variation of compressive strength with RCA content
Recycled concrete aggregates contain natural crushed aggregates and cement sand
paste used in the parent concrete material. The use of recycled concrete aggregates
in industrially advanced countries has been accepted. The results have indicated that
the workability of fresh concrete reduces with increase in the amount of recycled
concrete aggregates in the concrete mix. The cement sand paste attached on the
natural aggregates has high water absorption. Some of the mixing water is therefore
held up by the recycled concrete aggregates and is not available for mixing the
concrete materials. Water absorption of recycled concrete aggregates was reported
to be 2 to 3 times higher than the corresponding natural aggregates (Limbachiya et
al., 2004).
0
5
10
15
20
25
30
35
0 20 40 60 80 100 120
Compressive stren
gth (N/m
m2)
% Replacement of NCA with RCA
7days 28 days 90days
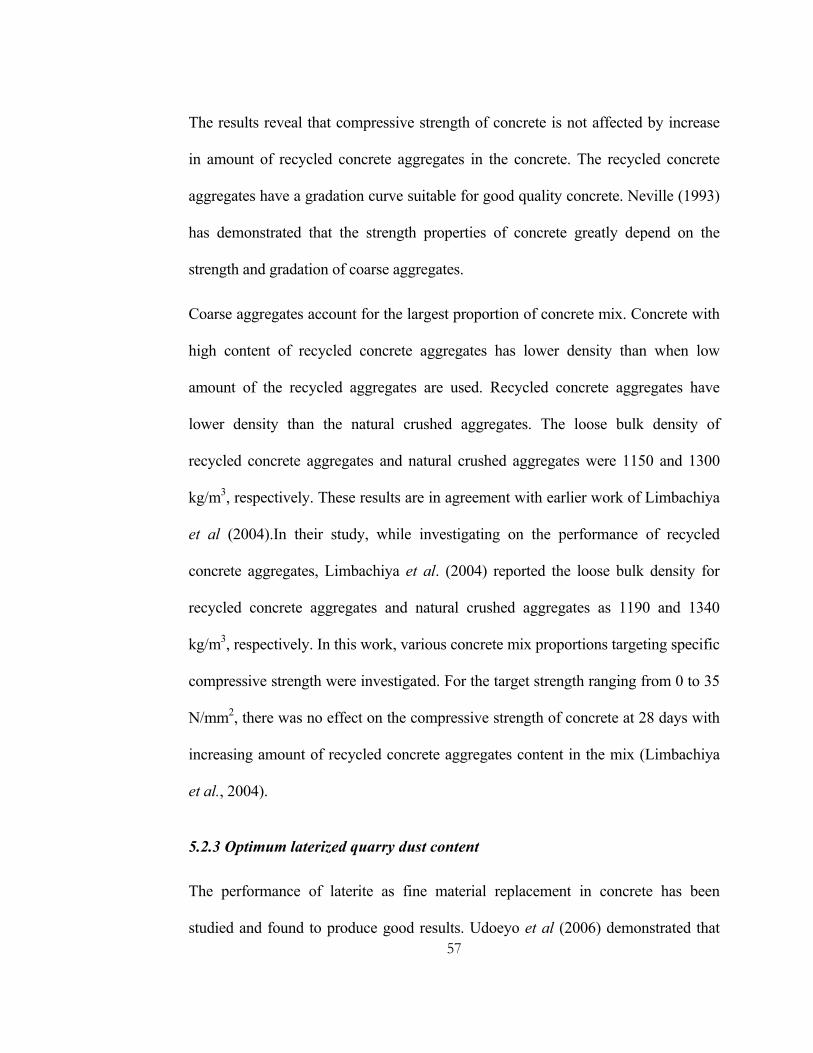
57
The results reveal that compressive strength of concrete is not affected by increase
in amount of recycled concrete aggregates in the concrete. The recycled concrete
aggregates have a gradation curve suitable for good quality concrete. Neville (1993)
has demonstrated that the strength properties of concrete greatly depend on the
strength and gradation of coarse aggregates.
Coarse aggregates account for the largest proportion of concrete mix. Concrete with
high content of recycled concrete aggregates has lower density than when low
amount of the recycled aggregates are used. Recycled concrete aggregates have
lower density than the natural crushed aggregates. The loose bulk density of
recycled concrete aggregates and natural crushed aggregates were 1150 and 1300
kg/m3, respectively. These results are in agreement with earlier work of Limbachiya
et al (2004).In their study, while investigating on the performance of recycled
concrete aggregates, Limbachiya et al. (2004) reported the loose bulk density for
recycled concrete aggregates and natural crushed aggregates as 1190 and 1340
kg/m3, respectively. In this work, various concrete mix proportions targeting specific
compressive strength were investigated. For the target strength ranging from 0 to 35
N/mm2, there was no effect on the compressive strength of concrete at 28 days with
increasing amount of recycled concrete aggregates content in the mix (Limbachiya
et al., 2004).
5.2.3 Optimum laterized quarry dust content
The performance of laterite as fine material replacement in concrete has been
studied and found to produce good results. Udoeyo et al (2006) demonstrated that

58
concrete with up to 40% replacement level of sand by laterite attained the designed
strength of 20 N/mm2. The present study aims at utilizing laterized quarry dust as
river sand replacement in concrete. In concrete of mix ratio 1:1.05:0.45:3 for
Portland cement, river sand, quarry dust and natural crushed aggregates respectively,
the amount of quarry dust was partially replaced with 0, 12.5, 25, 37.5 and 50% of
laterite material. This was aimed at evaluating the behaviour of the combined
material when natural crushed aggregates are used. In Figure 5.7, it can be seen that
slump of wet concrete was reducing with increasing amount of laterite in the mix.
Laterite material generally has a lot of fine material that demand for much water in
order to achieve a specified level of workability. This trend in workability was
confirmed by the compacting factor test results as shown in Figure 5.8.
The variation of compressive strength of concrete with the laterite content is shown
in Figure 5.9. The 28 days compressive strengths were 20.1 and 17.7 N/mm2 for 0
and 50% replacement levels, respectively. The results reveal that, compressive
strength was reducing with increasing amount of laterite in the concrete mix.
From the results above, it was not clear as to the optimum amount of laterite to
replace the quarry dust selected to account for the 30% of the total fine materials in
concrete. The above study was repeated with recycled concrete aggregates as coarse
aggregates. The quarry dust in the concrete containing 30% of quarry dust replacing
river sand was in turn replaced with 0, 20, 40 and 60% of laterite material. Figure
5.10 to 5.12 show the effect of laterite content on slump, compacting factor and
compressive strength respectively. Figure 5.10 shows that when recycled concrete
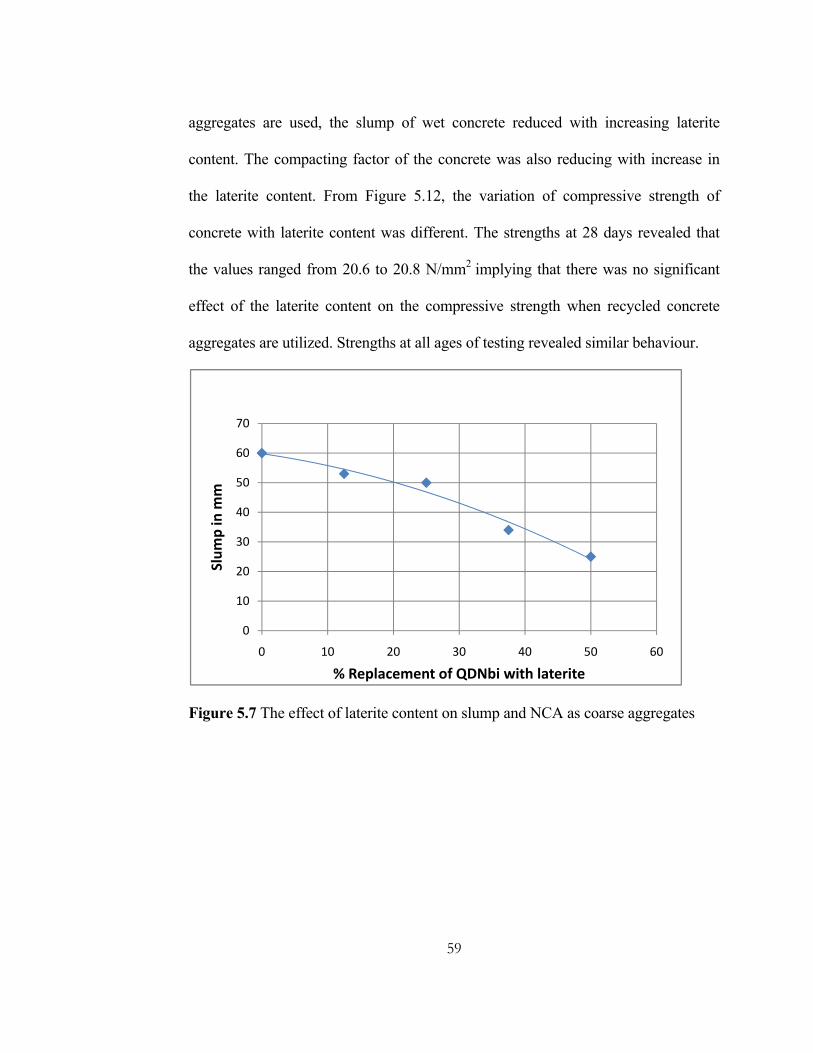
59
aggregates are used, the slump of wet concrete reduced with increasing laterite
content. The compacting factor of the concrete was also reducing with increase in
the laterite content. From Figure 5.12, the variation of compressive strength of
concrete with laterite content was different. The strengths at 28 days revealed that
the values ranged from 20.6 to 20.8 N/mm2 implying that there was no significant
effect of the laterite content on the compressive strength when recycled concrete
aggregates are utilized. Strengths at all ages of testing revealed similar behaviour.
Figure 5.7 The effect of laterite content on slump and NCA as coarse aggregates
0
10
20
30
40
50
60
70
0 10 20 30 40 50 60
Slum
p in m
m
% Replacement of QDNbi with laterite

60
Figure 5.8 Variation of compacting factors with laterite content and NCA as coarse aggregates
Figure 5.9 The relationship between compressive strength and laterite content and NCA as coarse aggregates
0.865
0.87
0.875
0.88
0.885
0.89
0.895
0 10 20 30 40 50 60
Compa
cting Factor
%Replacement of QDNbi with laterite
0
5
10
15
20
25
0 10 20 30 40 50 60
Compressive stren
gth (N/m
m2 )
% Replacement of QDNbi with laterite
7 days 28 days 90 days
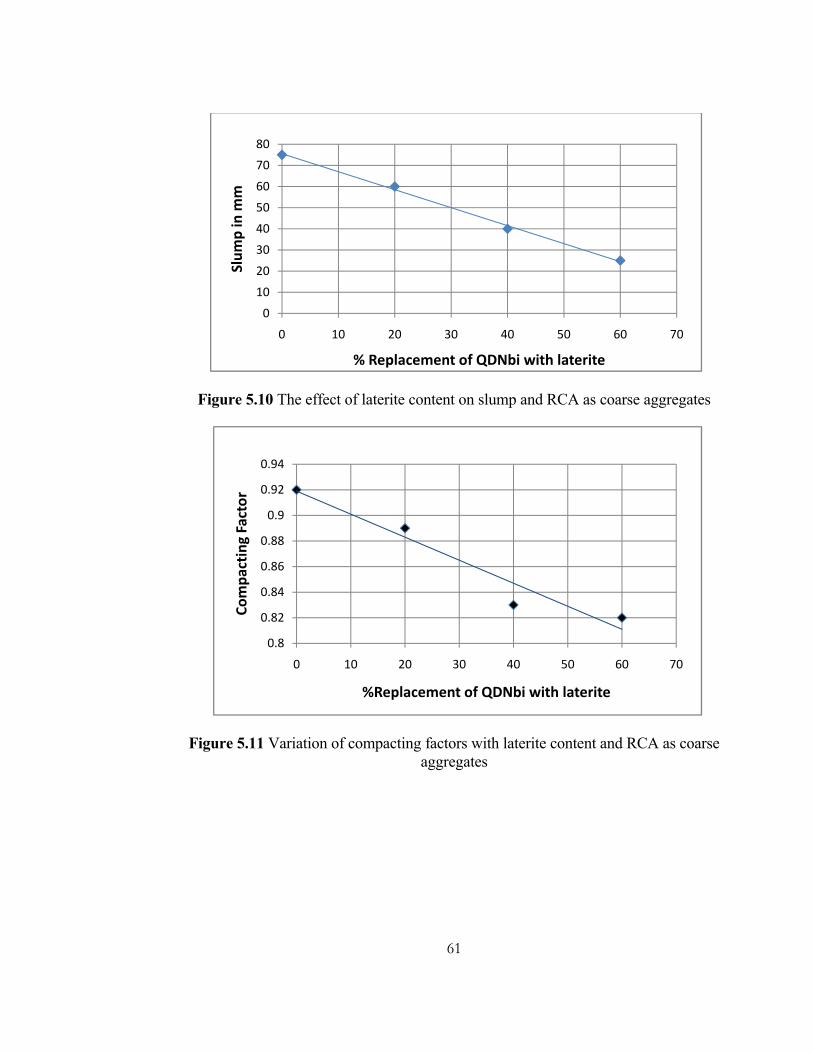
61
Figure 5.10 The effect of laterite content on slump and RCA as coarse aggregates
Figure 5.11 Variation of compacting factors with laterite content and RCA as coarse aggregates
0
10
20
30
40
50
60
70
80
0 10 20 30 40 50 60 70
Slum
p in m
m
% Replacement of QDNbi with laterite
0.8
0.82
0.84
0.86
0.88
0.9
0.92
0.94
0 10 20 30 40 50 60 70
Compa
cting Factor
%Replacement of QDNbi with laterite
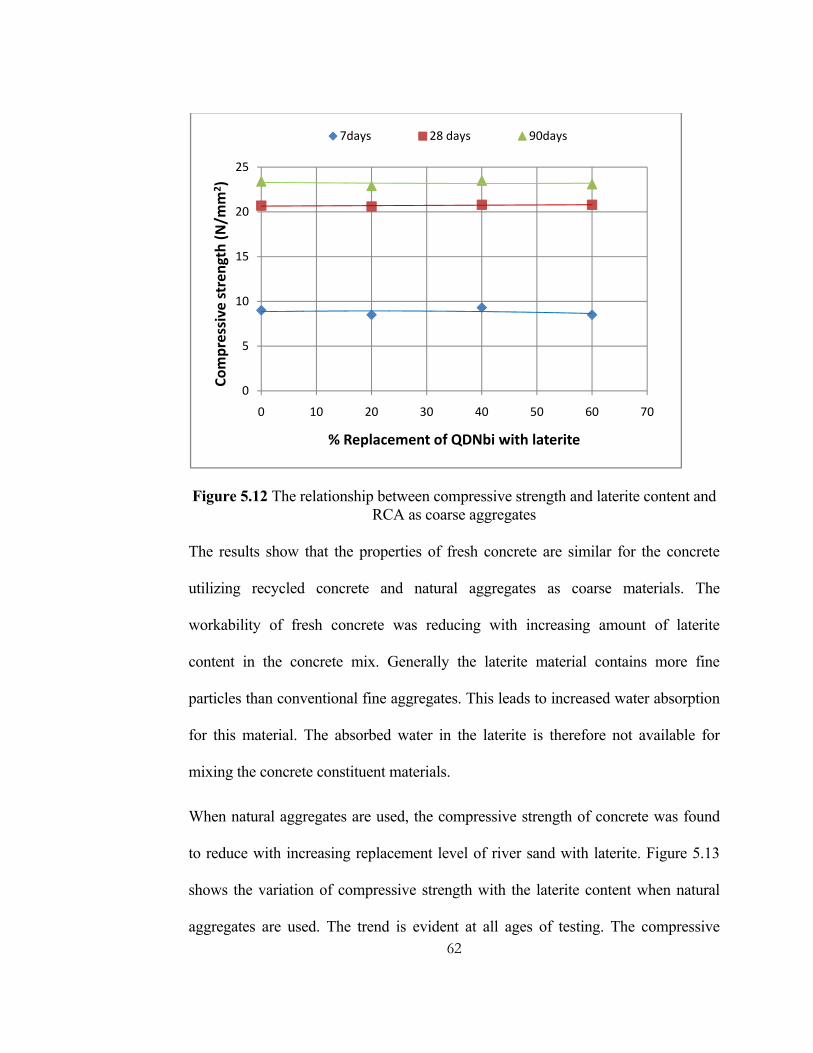
62
Figure 5.12 The relationship between compressive strength and laterite content and RCA as coarse aggregates
The results show that the properties of fresh concrete are similar for the concrete
utilizing recycled concrete and natural aggregates as coarse materials. The
workability of fresh concrete was reducing with increasing amount of laterite
content in the concrete mix. Generally the laterite material contains more fine
particles than conventional fine aggregates. This leads to increased water absorption
for this material. The absorbed water in the laterite is therefore not available for
mixing the concrete constituent materials.
When natural aggregates are used, the compressive strength of concrete was found
to reduce with increasing replacement level of river sand with laterite. Figure 5.13
shows the variation of compressive strength with the laterite content when natural
aggregates are used. The trend is evident at all ages of testing. The compressive
0
5
10
15
20
25
0 10 20 30 40 50 60 70
Compressive stren
gth (N/m
m2 )
% Replacement of QDNbi with laterite
7days 28 days 90days

63
strengths at 50% replacement level of river sand with laterite are about 85% the
values for conventional concrete. The aim of this study was to modify the quarry
dust with laterite while utilizing recycled concrete aggregates as coarse aggregates.
The results show that when recycled concrete aggregates are used, the strength of
concrete was not affected by the increase in the replacement level of quarry dust
accounting for 30% of fine material with the laterite. The recycled materials act
together to form a material that blend together to achieve the required strength.
However, the workability of fresh concrete reduces with increasing amount of
laterite content in the concrete.
Figure 5.13 The relationship between compressive strength and laterite content and NCA as coarse aggregates
0
5
10
15
20
25
0 10 20 30 40 50 60
Compressive stren
gth (N/m
m2 )
% Replacement of river sand with laterite
7days 28 days 90 days
64
5.3 Summary and conclusion
The results of studies on the properties of concrete that utilizes various combinations
of alternative and conventional material have been presented in this chapter. The
main aim was to determine the optimum combination of material that will result in
the best alternative concrete for construction of buildings. When natural aggregates
are used as coarse aggregates, 30% of river sand can be replaced with quarry dust
and still attain a compressive strength of 24 N/mm2 at 28 days. The slump of fresh
concrete at this replacement level is satisfactory for concrete placed and vibrated
with internal vibrator. However, much higher amount of replacement level of river
sand with quarry dust significantly affects the workability of the concrete. This has a
negative effect on the compressive strength of concrete.
Recycled concrete aggregate content in concrete has no significant effect of the
compressive strength. However, the workability of fresh concrete decreases with
increase in the amount of recycled aggregates. Hundred per cent (100%)
replacement of natural aggregates is therefore considered in subsequent studies. The
compressive strength of concrete utilizing river sand and recycled aggregates was 25
N/mm2 at 28 days.
The results revealed that when recycled concrete aggregate is used, alternative
concrete containing river sand, quarry dust and laterite in the ratio of 70:15:15
respectively has the best performance in terms of strength and workability
considerations. The compressive strength of the concrete at 28 days is 20.8N/mm2.

65
Although the materials physical properties of alternative aggregates differ from the
conventional material, alternative concrete made from such material, have adequate
engineering properties that meet the requirements for building construction.
66
CHAPTER SIX
6.0 STUDIES ON LATERIZED QUARRY DUST BLOCK MIXES
6.1 Introduction
This chapter evaluates the performance of laterized quarry dust masonry blocks. The
proposed block mix consist of quarry dust from natural crushed aggregates waste
(QDNbi), the quarry dust from stone dressing plant (QDNdar), laterite and Portland
cement as a stabilizer. The aim of the chapter is to arrive at the optimum
combination of the various materials that will result in the best masonry blocks to be
utilized in masonry wall panels for further investigation as presented in chapter
eight. The physical material properties for QDNbi, QDNdar and laterite are
presented in chapter four. The properties used to evaluate the performance of
masonry blocks were the water absorption and compressive strength of the blocks at
7, 28 and 90 days age respectively.
For masonry blocks to function satisfactory, the compressive strengths and water
absorption have to be within the acceptable limits of performance. Previous work by
Musiomi et al (2007) reported that 7% of cement content based on weight batching
can be used to stabilize laterized quarry dust and attain compressive strength of at
least 2.5 N/mm2. The water absorption of the blocks was satisfactory based on the
performance criteria specified in British standards.
67
6.2 Results and discussion
6.2.1 Optimum cement content
To determine the optimum cement content, laterized quarry dust mix was stabilized
with various amounts of cement content. Laterite and quarry dust combined were
mixed in the ratio of 1:1 with the ratio of QDNbi to QDNdar being maintained at
1:1. The stabilized quarry dust block mixes were then used to make machine pressed
blocks which were cured at room temperature for 7 days and left to dry in a shed.
The blocks were then tested for compressive strength on a Universal Testing
Machine after 7, 28 and 90 days. Some blocks were investigated for water
absorption qualities. Figure 6.1 shows the variation of water absorption with the
cement content of the mix. From the figure, the water absorption of blocks utilizing
laterized quarry dust reduced with increasing amount of cement content in the mix.
The water absorption of the blocks were found to range from 12 to 10.6% for the 4
and 13% cement content, respectively.
The effect of cement content on the compressive strength of alternative block is
shown in Figure 6.2. The figure shows that the compressive strength of blocks
increased with increase in the cement content in the mix. This was evident at all ages
of testing. When at least 3.65% of cement is used to stabilize laterized quarry dust, a
minimum compressive strength of 2 N/mm2 specified in BS5628-1 of 1992 can be
attained at 28 days. The cement content of 7% with water absorption of 12% and
compressive strength of 3.8 N/mm2 is proposed to be used in further investigation.

68
Figure 6.1 Variation of water absorption with cement content
Figure 6.2 The effect of cement content on compressive strength of blocks
This level of cement stabilization leads to masonry blocks with adequate
compressive strength without compromising on the water absorption quality of the
material. Study by Musiomi et al (2007) revealed that when 7% cement is used to
stabilize earth based masonry block, satisfactory performance in terms of water
0
2
4
6
8
10
12
14
0 2 4 6 8 10 12 14
% Absorption
% age cement content
0
1
2
3
4
5
6
7
8
0 2 4 6 8 10 12 14Compressive stren
gth in N/m
m2
% age cement content
7 days 28 days 90 days BS5628‐Min.
69
absorption and compressive strength can be achieved. Higher percentages of cement
content would yield better results but tend to be expensive because cement material
is expensive compared to the rest of the materials
Masonry blocks containing large amount of Portland cement content generally have
lower water absorption as compared to blocks with low amount of cement. The role
of cement in the block mix is to bind the materials together thus reducing the air
voids in the block fabric. Well bound materials have low water absorption as
compared to material that is less bound and can easily disintegrate. Increased cement
content leads to increased compressive strength of the blocks. This is due to the
binding effect of the cement in the mix. Previous research work has demonstrated
that increase in cement content in earth based material leads to higher compressive
strength (Alutu et al., 2006). This has been found to take place up to 13% cement
content in the mix. Much higher cement content in the mix has little effect on the
strength of the blocks. Advantage can therefore be taken of this fact to design
economical blocks since cement material is usually the most expensive material in
stabilized earth based blocks.
Cement content in block mix has influence on the density of the blocks. Figure 6.3
shows the effects of cement content on density of blocks. From the figure, increased
cement content leads to increased density of the block. Studies on earth based blocks
have found out that there is a relationship between the block density and the
compressive strength of the blocks (Montgomery, 2002). The presence of high

70
cement content in the mix reduces the air voids in the material leading to high
density.
Figure 6.3 The relationship between cement content and density of blocks
6.2.2 Optimum quarry dust wastes combination
Optimum quarry dust combination was determined by evaluating block mixes
containing various proportions of quarry waste from machine dressed blocks. In a
block mix containing Portland cement, QDNbi and laterite in the ratio of 1:8:8
respectively, QDNbi was partially replaced with 0, 25, 50, 75 and 100% of QDNdar.
Figures 6.4 and 6.5 show the effects of QDNdar content on the water absorption and
the compressive strength of blocks, respectively. In Figure 6.4, it is shown that the
water absorption of the blocks was increasing with increase in QDNdar content in
the mix. The range in water absorption was 10.1 to 12.5% for 0 and 100%
replacement level respectively. Figure 6.5 on the other hand shows that compressive
1750
1800
1850
1900
1950
2000
2050
2100
0 2 4 6 8 10 12 14
Den
sity in
kg/m
3
% age cement content
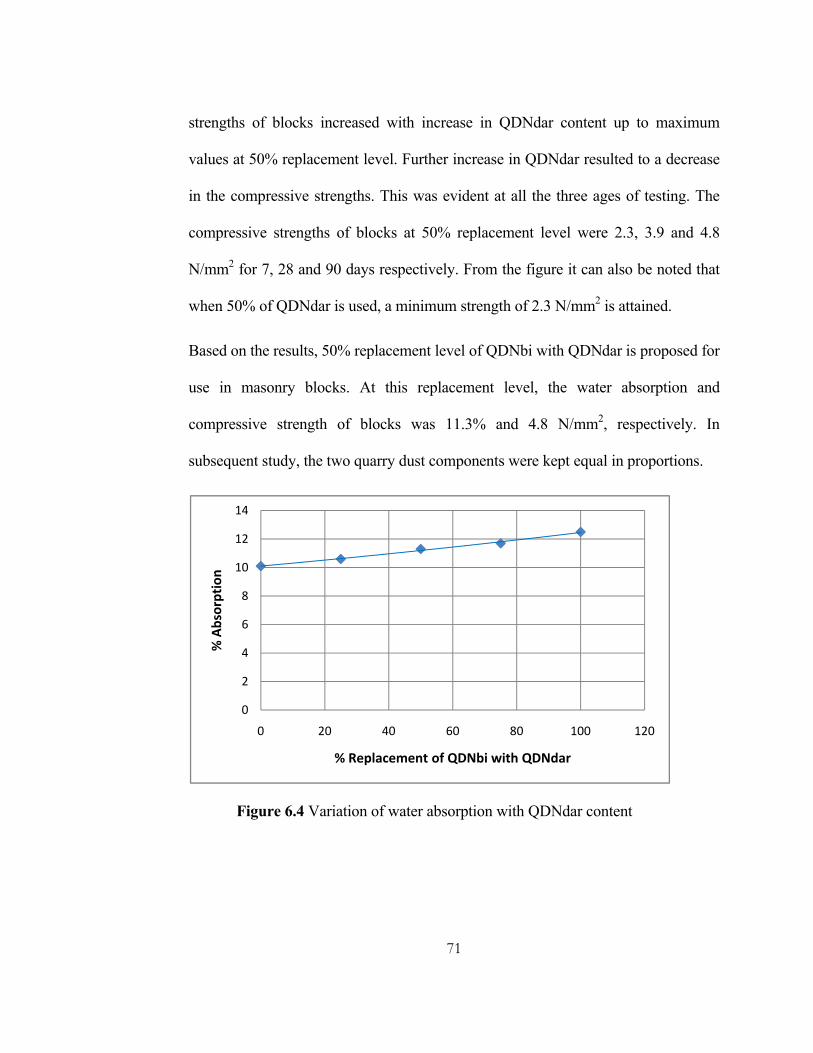
71
strengths of blocks increased with increase in QDNdar content up to maximum
values at 50% replacement level. Further increase in QDNdar resulted to a decrease
in the compressive strengths. This was evident at all the three ages of testing. The
compressive strengths of blocks at 50% replacement level were 2.3, 3.9 and 4.8
N/mm2 for 7, 28 and 90 days respectively. From the figure it can also be noted that
when 50% of QDNdar is used, a minimum strength of 2.3 N/mm2 is attained.
Based on the results, 50% replacement level of QDNbi with QDNdar is proposed for
use in masonry blocks. At this replacement level, the water absorption and
compressive strength of blocks was 11.3% and 4.8 N/mm2, respectively. In
subsequent study, the two quarry dust components were kept equal in proportions.
Figure 6.4 Variation of water absorption with QDNdar content
0
2
4
6
8
10
12
14
0 20 40 60 80 100 120
% Absorption
% Replacement of QDNbi with QDNdar
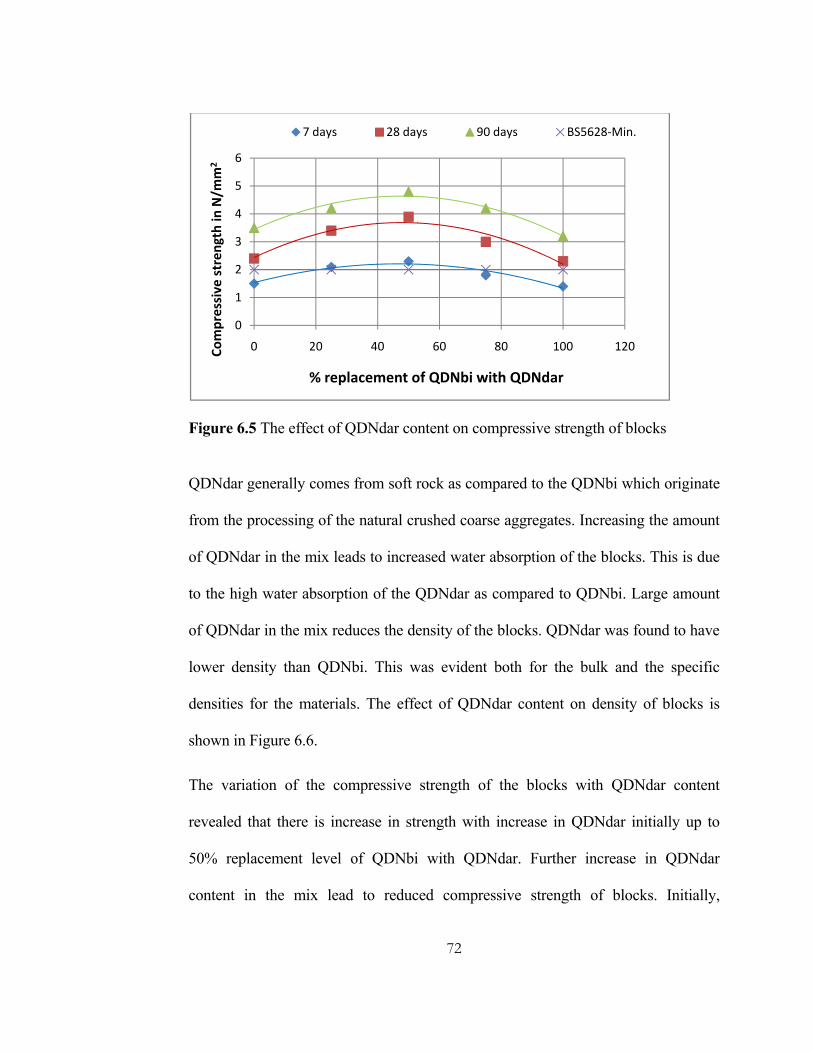
72
Figure 6.5 The effect of QDNdar content on compressive strength of blocks
QDNdar generally comes from soft rock as compared to the QDNbi which originate
from the processing of the natural crushed coarse aggregates. Increasing the amount
of QDNdar in the mix leads to increased water absorption of the blocks. This is due
to the high water absorption of the QDNdar as compared to QDNbi. Large amount
of QDNdar in the mix reduces the density of the blocks. QDNdar was found to have
lower density than QDNbi. This was evident both for the bulk and the specific
densities for the materials. The effect of QDNdar content on density of blocks is
shown in Figure 6.6.
The variation of the compressive strength of the blocks with QDNdar content
revealed that there is increase in strength with increase in QDNdar initially up to
50% replacement level of QDNbi with QDNdar. Further increase in QDNdar
content in the mix lead to reduced compressive strength of blocks. Initially,
0
1
2
3
4
5
6
0 20 40 60 80 100 120Compressive stren
gth in N/m
m2
% replacement of QDNbi with QDNdar
7 days 28 days 90 days BS5628‐Min.

73
introduction of QDNdar which contain fine material improves the particle interlock
leading to a more bound material. At higher QDNdar content, the softer material
dominates in the block mix leading to reduced compressive strength of the blocks.
Figure 6.6 Variation of the density of blocks with QDNdar content
6.2.3 Optimum laterite content
To determine the optimum laterite content, quarry dust material in block mix of
cement, QDNbi and QDNdar in the ratio of 1:8:8, respectively, was partially
replaced with 0, 25, 50, 75 and 100% of laterite. Figure 6.7 shows the effect of
laterite content on water absorption of the blocks. From the figure it can be seen that
the water absorption initially reduced with increase in laterite content to a minimum
value when 50% quarry dust was replaced with laterite. Further increase in laterite
content increased the water absorption of the blocks until a maximum value was
attained at 100% replacement level. A minimum absorption of 11.4% was attained
at 50% replacement by laterite. The highest water absorption of 14.8% was attained
1880
1900
1920
1940
1960
1980
2000
2020
2040
2060
0 20 40 60 80 100 120
Den
sity in
kg/m
3
% Replacement of QDNbi with QDNdar

74
when laterite is used alone without quarry dust. This value is very high compared to
the limits specified in British standards. The results show that when the materials are
combined, better absorption performance levels are attained as compared to that of
individual materials.
The variation of compressive strength of blocks with laterite content in the block
mix is shown in Figure 6.8. From the figure it can be seen that compressive strength
of blocks decreases with increase in the amount of laterite content in the mix. The
trend was evident at 7, 28 and 90 days age of testing. At 7 days, compressive
strength varied from 3.5 N/mm2 when 0% laterite was used to 0.8 N/mm2 when
100% laterite was used. The corresponding values at 28 days were 4.5 N/mm2 and
2.2 N/mm2, respectively. The figure also shows that when up to 50% of quarry dust
is replaced with laterite, a minimum compressive strength of 2.0 N/mm2 is attained
at the age of 7 days.
Figure 6.7 Variation of water absorption with laterite content
0
2
4
6
8
10
12
14
16
0 20 40 60 80 100 120
% Absorption
% Replacement of quarry dust with laterite
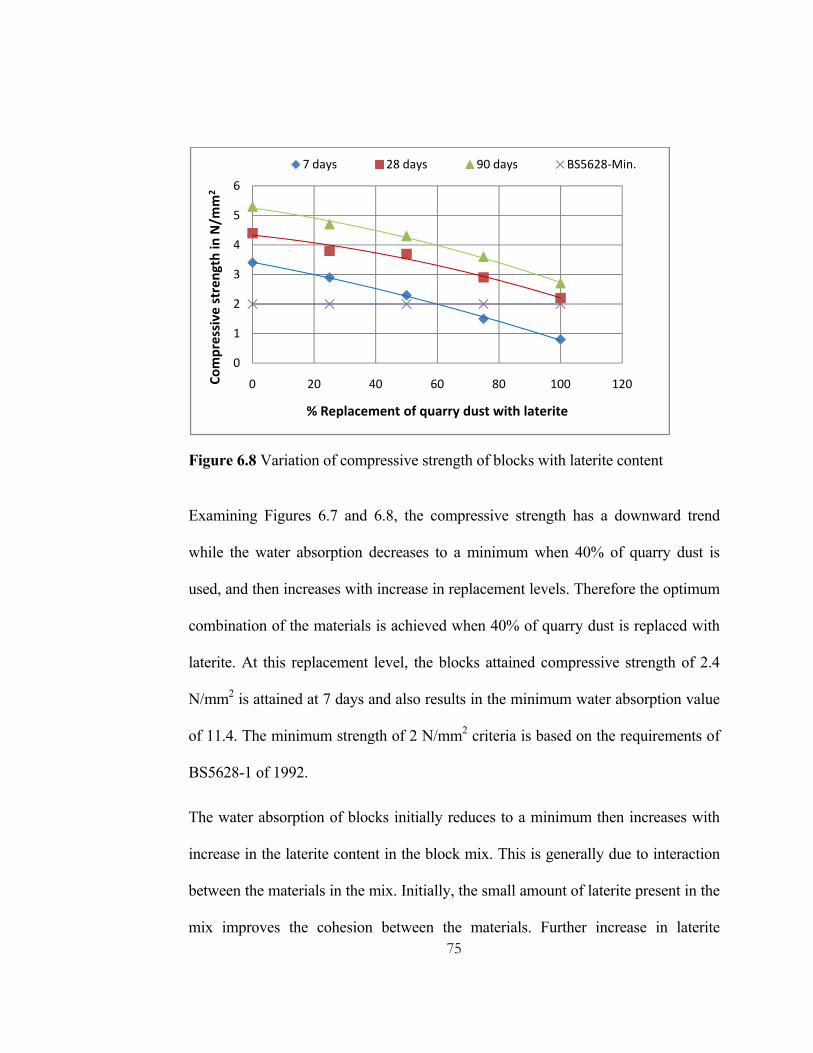
75
Figure 6.8 Variation of compressive strength of blocks with laterite content
Examining Figures 6.7 and 6.8, the compressive strength has a downward trend
while the water absorption decreases to a minimum when 40% of quarry dust is
used, and then increases with increase in replacement levels. Therefore the optimum
combination of the materials is achieved when 40% of quarry dust is replaced with
laterite. At this replacement level, the blocks attained compressive strength of 2.4
N/mm2 is attained at 7 days and also results in the minimum water absorption value
of 11.4. The minimum strength of 2 N/mm2 criteria is based on the requirements of
BS5628-1 of 1992.
The water absorption of blocks initially reduces to a minimum then increases with
increase in the laterite content in the block mix. This is generally due to interaction
between the materials in the mix. Initially, the small amount of laterite present in the
mix improves the cohesion between the materials. Further increase in laterite
0
1
2
3
4
5
6
0 20 40 60 80 100 120Compressive stren
gth in N/m
m2
% Replacement of quarry dust with laterite
7 days 28 days 90 days BS5628‐Min.
76
content has the effect of increasing the water absorption of the blocks as a result of
the high water absorption of the laterite material as compared to the quarry dust.
Laterite material if present in large amount leads to reduction in compressive
strength of blocks. Maximum compressive strength was attained when stabilized
quarry dust without laterite is used. Masonry blocks utilizing cement stabilized
quarry dust have been used in conventional masonry construction. Other precast
items made from cement stabilized quarry dust are paving slabs and hollow blocks
among others (ILO, 1990). The grading of quarry dust makes it to have better inter-
particle bond than the laterite. Laterite generally contains soft fine material that has
the effect of reducing the compressive strength of the blocks.
6.3 Summary and conclusion
The performance of alternative masonry blocks utilizing various combinations of
quarry dust and laterite material has been presented in this chapter. The optimum
combination of the material was determined in the study. The evaluation criteria for
the blocks were the compressive strength and water absorption of the blocks. The
results indicated that masonry blocks containing alternative material in the ratio of
1:1:2 for QDNbi, QDNdar and laterite, respectively have better performance in
terms of strength and water absorption. Seven per cent (7%) of cement stabilization
was found to yield compressive strength of at least 2 N/mm2 when tested after 7
days from the day of preparing the blocks. This level of stabilization was therefore
used in further studies.
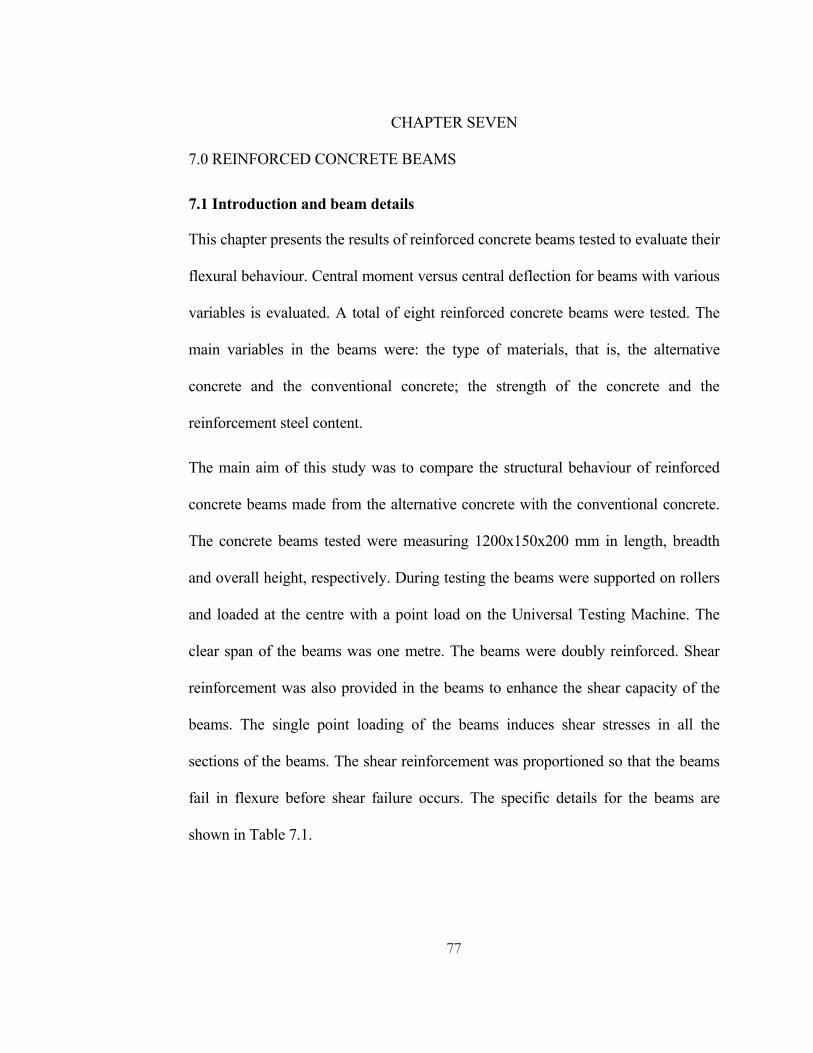
77
CHAPTER SEVEN
7.0 REINFORCED CONCRETE BEAMS
7.1 Introduction and beam details
This chapter presents the results of reinforced concrete beams tested to evaluate their
flexural behaviour. Central moment versus central deflection for beams with various
variables is evaluated. A total of eight reinforced concrete beams were tested. The
main variables in the beams were: the type of materials, that is, the alternative
concrete and the conventional concrete; the strength of the concrete and the
reinforcement steel content.
The main aim of this study was to compare the structural behaviour of reinforced
concrete beams made from the alternative concrete with the conventional concrete.
The concrete beams tested were measuring 1200x150x200 mm in length, breadth
and overall height, respectively. During testing the beams were supported on rollers
and loaded at the centre with a point load on the Universal Testing Machine. The
clear span of the beams was one metre. The beams were doubly reinforced. Shear
reinforcement was also provided in the beams to enhance the shear capacity of the
beams. The single point loading of the beams induces shear stresses in all the
sections of the beams. The shear reinforcement was proportioned so that the beams
fail in flexure before shear failure occurs. The specific details for the beams are
shown in Table 7.1.

78
Table 7.1 Beam details
Beam Material Concrete Mix
Compres-sive strength (N/mm2)
Bottom reinforcement
Rebars % age steel
ConvConc1-2-4 Convent-ional
1:2:4 18 2Y10 0.523
ConvConc1-1.5-3(8)
Convent-ional
1:1.5:3 23 2Y8 0.333
ConvConc1-1.5-3(10)
Convent-ional
1:1.5:3 23 2Y10 0.523
ConvConc1-1-2 Convent-ional
1:1:2 28 2Y10 0.523
AltConc1-2-4 Alternative 1:2:4 17 2Y10 0.523 AltConc1-1.5-3(8) Alternative 1:1.5:3 21 2Y8 0.333 AltConc1-1.5-3(10) Alternative 1:1.5:3 21 2Y10 0.523 AltConc1-1-2 Alternative 1:1:2 26 2Y10 0.523
7.2 Results and conclusion
7.2.1 Moment versus central deflection
Figure 7.1 shows the moment versus deflection curve for conventional concrete
beam reinforced with 2Y10 bars at the bottom. The span moment in the beam was
determined by applying statics at every applied load level. The compressive strength
of concrete in the beam is 23 N/mm2. From the figure, deflection in the beam
increased with moment until failure occurred when the applied moment reached
19.5 kNm. The cracking moment was much lower than the ultimate moment for the
beam. The figure also shows that the beam sustained the maximum moment from a
deflection of 10 to 25 mm.

79
Figure 7.1 Moment versus deflection of conventional concrete beam with mix ratio 1:1.5:3 reinforced with 2Y10
The variation of deflection with applied moment of alternative concrete beam with
mix ratio 1:1.5:3 is shown in Figure 7.2. The beam was reinforced with 2Y10 bars at
the bottom. The figure shows that deflection increased with increased moment
within the moment application range of 0-15 kNm. The initial primary or main
cracks formed at 15 kNm. The formation of cracks lead to a change in the gradient
of the curve, larger deflection being experienced for slight increase in applied
moment. The beam continued to resist higher moment in spite of the main cracks
further increasing in size. At an ultimate moment of 19.6 kNm, the beam deflection
increased at constant moment indicating that the steel reinforcement was yielding.
After undergoing rapid deflection, the beam failed as the tensile steel reinforcement
broke. The failure moment for the alternative concrete beam was comparable to
conventional beam containing similar reinforcement even though there was a slight
difference in the compressive strength of the concrete.
0
5
10
15
20
25
0 5 10 15 20 25 30
Mom
ent in kN
m
Deflection in mm
fc =23 N/mm2
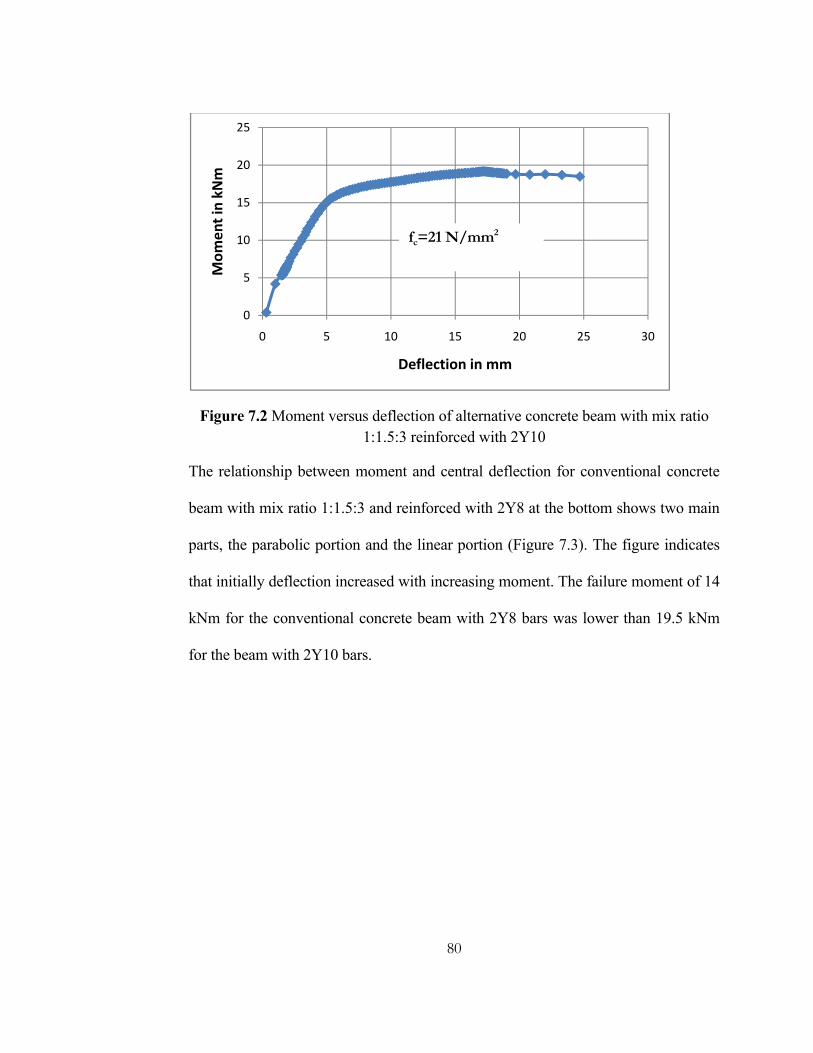
80
Figure 7.2 Moment versus deflection of alternative concrete beam with mix ratio 1:1.5:3 reinforced with 2Y10
The relationship between moment and central deflection for conventional concrete
beam with mix ratio 1:1.5:3 and reinforced with 2Y8 at the bottom shows two main
parts, the parabolic portion and the linear portion (Figure 7.3). The figure indicates
that initially deflection increased with increasing moment. The failure moment of 14
kNm for the conventional concrete beam with 2Y8 bars was lower than 19.5 kNm
for the beam with 2Y10 bars.
0
5
10
15
20
25
0 5 10 15 20 25 30
Mom
ent in kN
m
Deflection in mm
fc=21 N/mm2

81
Figure 7.3 Moment versus deflection of conventional concrete beam with mix ratio 1:1.5:3 reinforced with 2Y8
In Figure 7.4, moment versus deflection for alternative concrete beam of mix ratio
1:1.5:3 and reinforced with 2Y8 bars is presented. The figure shows that there is
increase in deflection with applied moment at an increasing rate thus resulting to a
parabolic shaped curve with a peak moment of 14 kNm. The failure moment of 14
kNm is equal to conventional concrete beam with the same reinforcement. At failure
the beam attained a deflection of 15mm which was comparable to the corresponding
conventional concrete beam. The compressive strengths for the alternative and
conventional concrete were 21 and 23 N/mm2 respectively.
0
2
4
6
8
10
12
14
16
‐5 0 5 10 15 20 25 30
Mom
ent in kN
m
Deflection in mm
fc=23 N/mm2
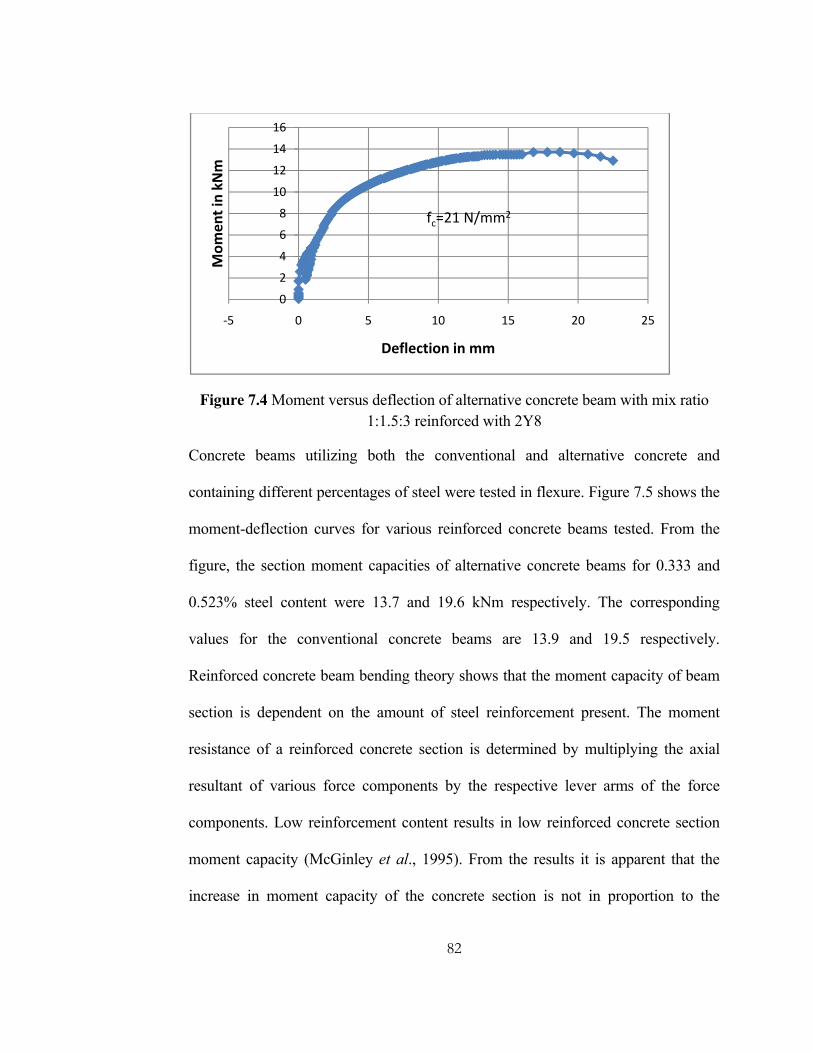
82
Figure 7.4 Moment versus deflection of alternative concrete beam with mix ratio 1:1.5:3 reinforced with 2Y8
Concrete beams utilizing both the conventional and alternative concrete and
containing different percentages of steel were tested in flexure. Figure 7.5 shows the
moment-deflection curves for various reinforced concrete beams tested. From the
figure, the section moment capacities of alternative concrete beams for 0.333 and
0.523% steel content were 13.7 and 19.6 kNm respectively. The corresponding
values for the conventional concrete beams are 13.9 and 19.5 respectively.
Reinforced concrete beam bending theory shows that the moment capacity of beam
section is dependent on the amount of steel reinforcement present. The moment
resistance of a reinforced concrete section is determined by multiplying the axial
resultant of various force components by the respective lever arms of the force
components. Low reinforcement content results in low reinforced concrete section
moment capacity (McGinley et al., 1995). From the results it is apparent that the
increase in moment capacity of the concrete section is not in proportion to the
0
2
4
6
8
10
12
14
16
‐5 0 5 10 15 20 25
Mom
ent in kN
m
Deflection in mm
fc=21 N/mm2

83
increase in the amount of steel content of the beams. This was observed in both the
conventional and alternative concrete beams. The figure also shows that, the
modulus elasticity of the alternative concrete beams at both levels of steel content is
lower as compared to the conventional concrete. However, the moment-deflection
curves for the beams are of the same order throughout the loading history. It was
evident that, up to 5 kNm applied moment, the beams have the same flexural
stiffness.
Figure 7.5 Moment-deflection curves for concrete beams of varying steel content
After the formation of first crack in the beams with low steel content the
characteristic curves for the different steel content starts to separate. The low steel
concrete beams deteriorating in flexural stiffness. At moments lower than the
cracking moment, the whole section of concrete and steel together contribute to the
0
5
10
15
20
25
‐5 0 5 10 15 20 25 30
Mom
ent i
n kN
m
Deflection in mm
ConvConc 1-1.5-3(10)
ConvConc 1-1.5-3(8)
AltConc 1-1.5-3(10)
AltConc 1-1.5-3(8)

84
flexural stiffness of reinforced concrete beams. Immediately the cracking moment is
attained, cracks start to form and the contribution of the concrete below the neutral
axis to flexural stiffness is reduced with the concrete between the cracks offering
some stiffness. The slight difference in the behaviour of beams utilizing alternative
and conventional concrete is due to the slight differences in the concrete
compressive strength.
The curve for conventional concrete beam with mix ratio 1:2:4 and reinforced with
2Y10 bars is shown in Figure 7.6. The figure shows that at low moment up to 8
kNm, the relationship between the applied moment and deflection is linear. At
higher load, the curve becomes parabolic with rapid increase of central deflection
with moment. The failure moment of this beam was 13 kNm. In spite of there being
the same amount of reinforcement in the beams, the capacity of this beam was lower
than that of the conventional concrete beam of mix ratio 1:1.5:3. The lower capacity
is due to lower concrete strength which result in reduced liver arm since a large
depth of concrete with lower strength is required to balance the tension in the
reinforcement steel (McGinley et al., 1995).

85
Figure 7.6 Moment versus deflection of conventional concrete beam with mix ratio 1:2:4 reinforced with 2Y10
Figure 7.7 shows the moment versus deflection curve for alternative concrete beam
of concrete with compressive strength of 17 N/mm2 and reinforced with 2Y10 bars.
The curve has three distinct sections; the initial linear part running up to 8 kNm, the
parabolic section ranging between 8 kNm to the maximum moment equal to
12 kNm and the linear horizontal section indicating the zone of plastic deformation.
The failure moment for this beam was 12 kNm, which is lower than the equivalent
conventional concrete beam as shown in Figure 7.8.
Conventional concrete beam of mix ratio 1:1:2 and reinforced with 2Y10 bars, on
the hand, produced a parabolic characteristic curve. The moment capacity of the
beam was 22 kNm which compares with the beam of mix ratio 1:1.5:3 shown in
Figure 7.1. The moment-deflection curve for reinforced concrete beam utilizing
conventional concrete of mix ratio 1:1:2 is shown in Figure 7.8. Within the range of
0
2
4
6
8
10
12
14
‐5 0 5 10 15 20
Mom
ent in kN
m
Deflection in mm
fc=18 N/mm2

86
strength studied, much stronger concrete has little effect on the capacity of beams
since failure of sections is controlled by the yielding of steel.
Figure 7.7 Moment versus deflection of alternative concrete beam with mix ratio 1:2:4 reinforced with 2Y10
Figure 7.8 Moment versus deflection of conventional concrete beam with mix ratio 1:1:2 reinforced with 2Y10
‐2
0
2
4
6
8
10
12
14
‐5 0 5 10 15 20 25
Mom
ent in kN
m
Deflection in mm
fc=17 N/mm2
‐5
0
5
10
15
20
25
‐5 0 5 10 15 20 25
Mom
ent in kN
m
Deflection in mm
fc=28 N/mm2
87
The characteristic curve for alternative concrete beam with 2Y10 bars shows that at
low load levels, there was an increase in central deflection with increasing applied
moment up to a moment of 18 kNm (Figure 7.9). At higher load levels, deflection of
the beam increased at constant moment of 21 kNm until failure occurred. The
ultimate moment for the beam is comparable to the conventional concrete of
compressive strength of 28N/mm2. Like the conventional concrete, the beams of
alternative concrete with compressive strength of 26 N/mm2 and 21 N/mm2 attained
ultimate moments that compared well. In the design of concrete beams, moment is
usually the governing criteria. In practice the beam is designed for bending then, the
other modes of failure such as shear and bond are prevented. This implies that
moment capacity of reinforced concrete beam is very critical (McGinley et al.,
1995).
Figure 7.9 Moment versus deflection of alternative concrete beam with mix ratio 1:1:2 reinforced with 2Y10
0
5
10
15
20
25
0 5 10 15 20 25
Mom
ent i
n kN
m
Deflection in mm
fc=26 N/mm2

88
Figure 7.10 shows the moment-deflection curve for reinforced concrete beams
utilizing conventional and alternative concrete of varying strengths and reinforced
with 2Y10 bars. Alternative concrete comprise of Portland cement, river sand and
laterized quarry dust as fine aggregates and recycled concrete aggregates as coarse
aggregates. In both conventional concrete and alternative concrete, various
combinations of the materials were used to arrive at different compressive strength
of concrete. In each category, three strength levels were considered. The three
strength levels for conventional concrete considered are 18, 23 and 28 N/mm2. The
corresponding values for alternative concrete are 17, 21 and 26 N/mm2.
From Figure 7.10, it is noted that when conventional concrete of compressive
strengths 18, 23 and 28 N/mm2 are used, the beam attains flexural capacities of 13,
19.5 and 22 kNm, respectively. Generally the beam flexural capacity increases with
the strength of concrete (McGinley et al., 1995). This is because, when a reinforced
concrete beam is loaded in flexure, the concrete in the compression zone takes
compressive stresses while the steel reinforcement resist the tension stresses. When
high strength concrete is used, less area of concrete is required to balance out the
tension in steel reinforcement and hence the depth to the neutral axis of the beam is
reduced. The effect of this is that the liver arm of the longitudinal forces increases
hence increasing the moment capacity of the beam (McGinley et al., 1995). From
the results, however, the increase in beam capacity is not proportional to the increase
in concrete compressive strength. The change in strength from 18 to 23 N/mm2
reflects a 28% increase in strength while the corresponding increase in moment

89
capacity of the beams is 13 to 19.5 kNm which reflects 50% increase in section
capacity. In addition, an increase in strength from 23 to 28 N/mm2 reflects a 22%
increase in strength while the corresponding change in section capacity from 19.5 to
22kNm reflects a 13% increase. The relationship between compressive strength of
concrete and the moment capacity of a beam section is therefore non-linear.
Figure 7.10 Moment-deflection curves for concrete beams of alternative and conventional concrete of varying strength
The non-linearity in relationship between the concrete compressive strength and the
moment capacity of the section is brought by the effects of other factors in the
structural behaviour of concrete beams under loading. It has been found that the
‐5
0
5
10
15
20
25
‐5 0 5 10 15 20 25 30
Mom
ent i
n kN
m
Deflection in mm
ConvConc 1-2-4
ConvConc 1-1.5-3(10)
ConvConc 1-1-2
AltConc 1-2-4
AltConc 1-1.5-3(10)
AltConc 1-1-2
fc=28fc=26
fc=23
fc=21
fc=18
fc=17
fc is concrete strength in N/mm2

90
transverse stresses in the compressive zone of beam have direct influence on the
compressive stresses that can be resisted by concrete (Kotsovos, 1982). The
presence of shear reinforcement in form of links magnifies these effects; introducing
confinement effects, hence increased transverse stresses which cause tri-axial state
of stress in the compression zone. The effects of tri-axial stresses in the compression
zone of concrete beam introduce non-linearity between the uniaxial compressive
strength of concrete and the actual compressive resistance of concrete in the beam.
The results also show that the modulus of elasticity increases with increase in the
compressive strength of concrete. Concrete beams are composite elements
consisting of concrete and steel reinforcement. The overall behaviour of the beam
under load depends on both the properties of concrete and steel reinforcement. Most
codes of practice relate the modulus of elasticity of concrete to the compressive
strength of concrete. Neville (1981) proposed an expression for modulus of
elasticity of concrete Ec taking the form,
Ec=k (fc) m (7.1)
where k is a factor which depends on the density of concrete, fc is the compressive
strength of concrete and m is constant equal to 0.33. The 1977 edition of the ACI
Building Code proposes the expression for Ec of the form
Ec=k (fc’) 0.5 (7.2)
where k is a factor and fc’ is the cylinder strength of the concrete.

91
Utilization of alternative concrete in beams gave the same trend in results as the
conventional concrete beams. The three strength cases considered were 17, 21 and
26 N/mm2. The respective beam capacities for the strength cases were 12, 19.5 and
21 kNm. The concrete strength values were generally lower than the corresponding
conventional concrete. Further, apart from the middle section capacity of 19.6 kNm,
the capacities of alternative concrete beams were lower than the corresponding
values for the conventional concrete beam. Like the conventional concrete beams,
the non-linearity relationship exists between the concrete compressive strength and
the section capacity of the beams. This effect is due to tri-axial state of stress that
occurs in the compressive zone of the beam enhancing the compressive stresses that
can be resisted by the concrete.
Like conventional concrete beams, the modulus of elasticity as can be shown on the
moment-deflection curve increases with concrete strength. The values of modulus of
elasticity of various strength of concrete are of the same order for the corresponding
alternative and conventional concrete.
7.2.2 Crack patterns
This section evaluates the cracking behaviour of various reinforced concrete beams
subjected to flexural stresses. In all cases flexural cracks formed first followed by
combined flexure-shear cracks at high loads close to failure load in few cases.
Cracking patterns for reinforced concrete beams is shown in Plate 7.1 and Appendix
C. The results show that, cracks started developing at the mid-span of the beam

92
during loading (1 in Plate 7.1). As the applied load was increased, more cracks
appeared towards the supports of the beams (2 and 3 in Plate 7.1). In some cases,
secondary cracks developed from the main cracks which extended towards the
neutral axis of the beam as the loading was further increased.
Plate 7.1 Beam AltConc1-1-2. Crack pattern at ultimate load,
Two levels of steel reinforcement content were investigated in this study. From the
results, it was seen that both the alternative and conventional concrete beams
reinforced with 2Y8 bars developed few but wide cracks as compared to beams with
2Y10 bars. Beams with lower steel content generally had few wider flexural cracks
than the beams with high steel content. In low reinforcement beams, signs of shear
cracks hence shear failure was not evident as it was the case with the high
reinforcement content beams. The presence of few but wide cracks in low
reinforcement content beams is due to the low flexural capacity of the beams. The
compression load path had adequate capacity in these beams leading to flexural
failure without any signs of crushing of concrete. The high flexural and shear

93
capacity ratio in low reinforcement content beams eliminated any possibility of
shear failure occurring before or at failure. The similarity of failure pattern in beams
was due to the fact that the respective concrete compressive strengths of alternative
and conventional concrete were within 10%.
Crack patterns for alternative and conventional concrete beams of concrete
compressive strengths 17 and 18 N/mm2 compare well. Both beams failed by
development of four main wide inclined flexural cracks which extended towards the
neutral axis of the beam. The shear cracks were absent in these beams which implies
that there was no possibility of shear failure in the beam. However, after failure
there were signs of concrete crushing in the compressive zone due to low strength of
concrete. These weaknesses in the compression load path lead to early pure flexural
failure. The failure mode of alternative and conventional concrete beams of mix
ratio 1:1.5:3 was different from beams of concrete mix 1:2:4. First, flexural cracks
formed followed by shear cracks at ultimate load. The development of shear cracks
was due to strong compression load path through the strong concrete. The high
flexural capacity of these beams lead to the shear capacity being exceeded at failure.
Alternative and conventional concrete beams of higher concrete compressive
strength failed by yielding of the steel reinforcement. There were no signs of shear
failure as no shear cracks appeared. In addition, there was no evidence of crushing
of concrete in the compression zone. Shear capacity of high strength concrete is
higher than low strength concrete beams.

94
7.3 Cost comparison
The production costs for one cubic metre of conventional and alternative concrete
mix of various ratios are shown in Table 7.2. The table also shows the combination
of ingredient materials in concrete. From the table, the costs of conventional and
alternative concrete of mix ratio 1:2:4 (Class 20) are KShs.7700 and 6314,
respectively. When high strength concrete of Class 25 is required, the costs are
KShs. 8650 and 7400 for conventional and alternative concrete, respectively.
Table 7.2 Cost of one cubic metre of conventional and alternative concrete mix
Materials Conventional Concrete Alternative Concrete
Mix ratios 1:2:4 1:1.5:3 1:2:4 1:1.5:3
Concrete grade Class 20 Class 25
Cement (kg/m3) 314 390 314 390
River sand (kg/m3) 627 585 439 410
QDNbi (kg/m3) - - 94 88
Laterite (kg/m3) - - 94 88
NCA (kg/m3) 1255 1171 - -
RCA (kg/m3) - - 1255 1171
Water/cement ratio 0.65 0.65 0.65 0.65
Water content
(kg/m3)
204 254 204 254
Compressive strength
(N/mm2)
18 23 17 21
Cost (KShs./m3) 7700 8650 6314 7400
95
It was assumed that the cost of labour for producing either conventional or
alternative concrete is the same; hence, it was excluded from the analysis. When the
costs of conventional and alternative concrete are compared, a saving of 18% is
achieved when alternative concrete of Class 20 is used. For higher strength concrete
of Class 25, the saving is only 14% because the proportion of cement required in the
mix increases substantially. Cement is the most expensive ingredient in concrete
mix.
7.4 Summary and conclusion
The results of flexural testing of concrete beams have been discussed in this chapter.
The results have shown that the ultimate capacity of alternative concrete beams
compare well with the conventional concrete beams. The ultimate moments of
beams made from alternative concrete of compressive strengths of 17, 21 and 26
N/mm2, and reinforced with 2Y10 bars, were 12.0, 19.6 and 21.0 kNm, respectively.
Generally, the ultimate moment capacities for alternative concrete beams were
within 5% of the corresponding conventional concrete beams with similar
compressive strength of concrete and containing equal amount of reinforcement.
Cracking pattern for alternative concrete beams was similar to conventional concrete
beams containing similar reinforcement content. Generally beams containing low
reinforcement content (2Y8) developed wide cracks than heavily reinforced beams.
In all the aspects considered, beams utilizing alternative concrete generally have
structural behaviour comparable to conventional concrete beams.

96
CHAPTER EIGHT
8.0 MASONRY WALL PANEL
8.1 Introduction and wall panel description
In this chapter, the results of the masonry wall panels tested in compression are
presented. A total of ten wall panels were tested in this study. Out of the ten walls
tested, four wall panels were made from the designed alternative blocks while the
other six were made from conventional blocks. In each category, some walls were
reinforced with hoop iron while others were not. Several sizes of the walls were also
considered to determine the effect of size of the wall panels on the structural
behaviour under compressive stress. The main variables investigated were the
compressive strength of mortar joint, the effect of reinforcement in bedding joints of
the walls, and the size of wall panels. These variables were compared for both
alternative and conventional block walls. The stress in the stress-strain curve is
given as a fraction of the maximum strength recorded for the wall panel concerned.
Table 8.1 shows the details of wall panels tested in this study.

97
Table 8.1 Wall panel details
H, Height of wall panel; B, Breadth of wall panel
8.2 Results and discussion
8.2.1 Compressive strength of wall panels
The walls were loaded in axial compression on a Universal Testing Machine. The
maximum load as obtained from stress-strain curves and confirmed by the values
Wall Material Size Mortar
ratio
reinforcement
H (mm) B
(mm)
ConvBL 1:3(R) Conventional 520 600 1:3 Reinforced
ConvBL 1:3 Conventional 520 600 1:3 None
ConvBL 1:3L Conventional 520 900 1:3 None
ConvBL 1:4 Conventional 520 600 1:4 None
ConvBL 1:3(R)x Conventional 620 760 1:3 Reinforced
ConvBL 1:3x Conventional 620 760 1:3 None
AltBL 1:3(R) Alternative 520 600 1:3 Reinforced
AltBL 1:3 Alternative 520 600 1:3 None
AltBL 1:3L Alternative 520 900 1:3 None
AltBL 1:4 Alternative 520 600 1:4 None

98
directly noted on the testing machine after failure of the walls are shown in Figure
8.1(a). In Figure 8.1(b), the normalized compressive strengths of walls are
presented. The normalized values were obtained by dividing the compressive
strength of wall panels with the compressive strength of masonry blocks used in
building up the wall panels. The compressive strength of conventional and
alternative blocks used in the study is 7.8 N/mm2 and 3.3 N/mm2, respectively. From
the figure, the highest strength occurred in plain conventional block wall containing
1:4 cement-sand jointing mortar while the lowest occurred in plain alternative block
wall with large dimensions and utilizing 1:3 mortar joint. The corresponding
compressive strength values for the two above extreme walls are 3.49 and 0.95
N/mm2, respectively. Reinforced conventional block wall utilizing 1:3 mortar had a
compressive strength of 3.25 N/mm2 which is slightly higher than the unreinforced
plain wall by 0.07 N/mm2. These values are lower than the wall with weaker mortar
joint. Similar trends were noted in alternative block wall panels. Reinforced
alternative block wall with 1:3 mortar joint attained a compressive strength of
1.37 N/mm2 as compared to 1.38 N/mm2 for the unreinforced wall. However, this
value is lower than that of unreinforced wall utilizing weaker mortar joint which had
a compressive strength of 1.63 N/mm2.
Conventional block walls utilizing standard size blocks as used in the construction
industry in Kenya were also evaluated. The walls had compressive strength lower
than the laboratory sized block walls of the same material and mortar joint.
Reinforced wall had a compressive strength of 2.94 N/mm2 as compared to the
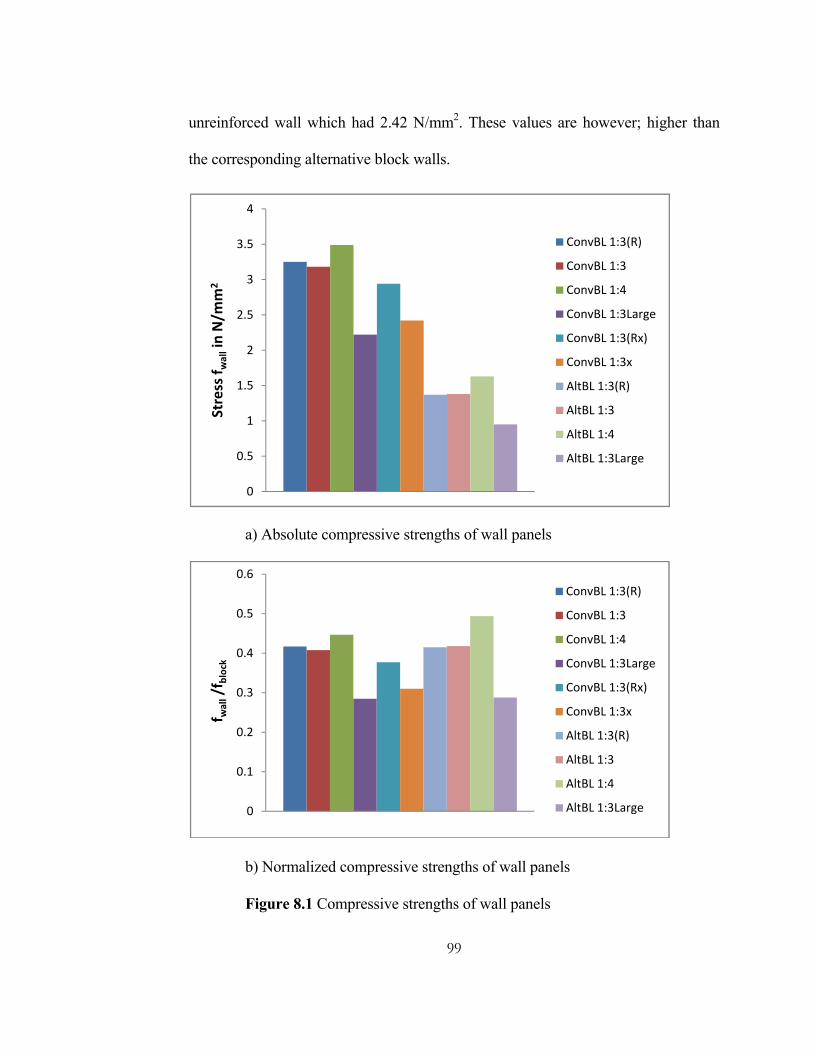
99
unreinforced wall which had 2.42 N/mm2. These values are however; higher than
the corresponding alternative block walls.
a) Absolute compressive strengths of wall panels
b) Normalized compressive strengths of wall panels
Figure 8.1 Compressive strengths of wall panels
0
0.5
1
1.5
2
2.5
3
3.5
4Stress f w
allin N/m
m2
ConvBL 1:3(R)
ConvBL 1:3
ConvBL 1:4
ConvBL 1:3Large
ConvBL 1:3(Rx)
ConvBL 1:3x
AltBL 1:3(R)
AltBL 1:3
AltBL 1:4
AltBL 1:3Large
0
0.1
0.2
0.3
0.4
0.5
0.6
f wall/f
block
ConvBL 1:3(R)
ConvBL 1:3
ConvBL 1:4
ConvBL 1:3Large
ConvBL 1:3(Rx)
ConvBL 1:3x
AltBL 1:3(R)
AltBL 1:3
AltBL 1:4
AltBL 1:3Large

100
The normalized compressive strength levels for the alternative and corresponding
conventional block wall panels were generally within 5%. The normalized strength
reported for conventional wall utilising 1:3 mortar joint was 0.417 as compared to
0.415 for the corresponding alternative wall panels with similar variables. The
normalized strength of alternative wall panel with the weaker mortar joint was
however higher than the corresponding conventional wall panel. This is because
alternative wall panel with weaker mortar joint condition has better load distribution
behaviour as compared to the conventional walls (Musiomi et al., 2007).
In this study, it was found that walls with weaker mortar joint were generally
stronger in compression than walls utilizing stronger mortar joint. This was evident
in both the conventional as well as alternative block walls. When weaker mortar is
used, the compressive strength of alternative wall is 18% higher than in stronger
mortar wall of the same material. In conventional walls, weaker mortar wall have
compressive strength only 10% higher. This indicates that the effects of the
compressive strength of mortar are greater in alternative block walls than it is in the
conventional walls. This greater mortar strength effect in alternative block walls is
due to greater load distribution that takes place in these walls during load
application. Previous work by Musiomi et al., (2007) reported that there is greater
load distribution in walls with weak mortar joint condition than strong mortar joint
when loaded in compression. The strength ratio obtained in this previous work was
1.2 which is comparable to the present study.
101
The compressive strengths of reinforced and unreinforced conventional block walls
were 3.25 and 3.18 N/mm2, respectively. The corresponding values for alternative
block walls were 1.37 and 1.38 N/mm2. As observed from the failure modes for the
walls, the presence of bedding joint reinforcement did not affect the strength of the
walls but had the effect of delaying the formation of the first crack in the walls.
Assessment of cracking patterns in walls with bedding joint reinforcement showed
that the subsequent cracks after the formation of first crack tend to be distributed
along the wall pending total collapse. The effect of bond between the reinforcement
and the mortar has been found to play a critical role on the structural behaviour of
masonry walls under axial compression (BSI, 1992).
8.2.2 Stress-strain characteristics of wall panels
The main aim of studying stress-strain characteristics of the wall panels was to
determine the behaviour of the walls to failure throughout the loading period. The
stresses were obtained by dividing the total load applied on the wall by the plan area
of the wall.
Figure 8.2 shows the stress-strain curve for reinforced conventional block wall
utilizing 1:3 mortar joint conditions. In Figures 8.4a and 8.4b, the stress-strain
curves for blocks and mortar joint in top and bottom course, respectively are shown.
In the top course, the strain in the blocks was compressive and it increased from 0 to
0.002. The strain in the mortar remained constant at 0.0 up to load ratio of 0.8.
Beyond this point, the tensile strain in the mortar started increasing to 0.0028 at total
failure. In the bottom course, the behaviour was different. The small strain in the
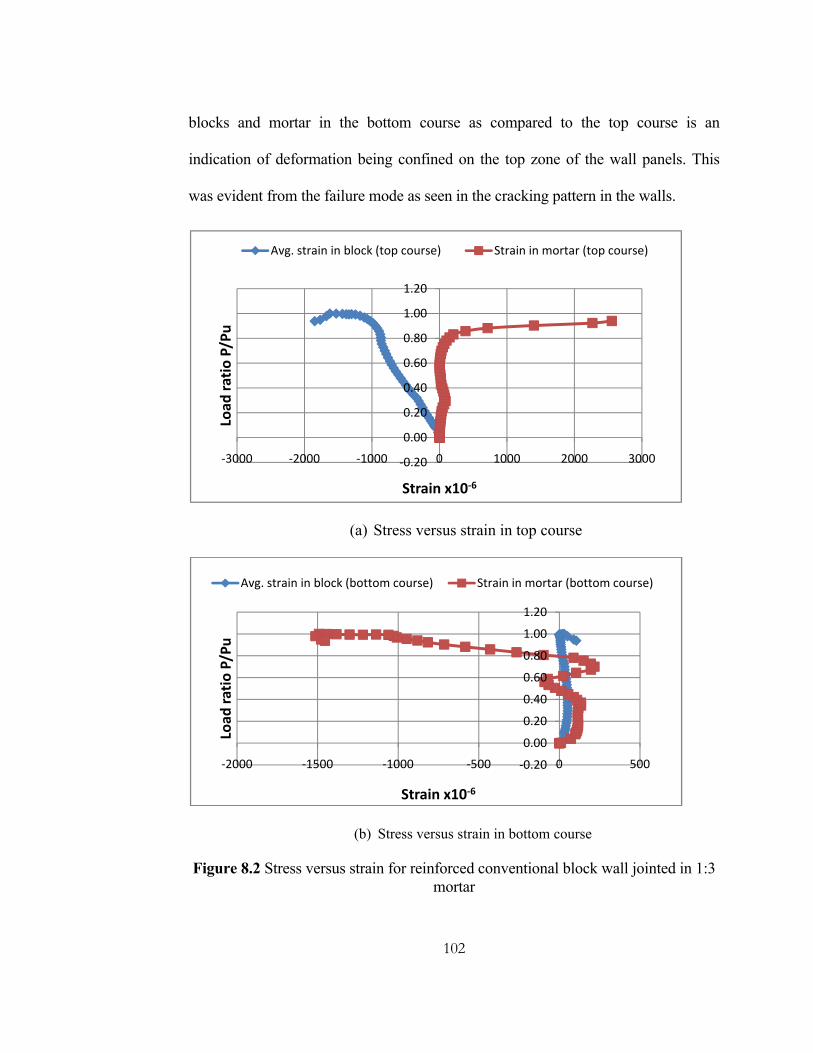
102
blocks and mortar in the bottom course as compared to the top course is an
indication of deformation being confined on the top zone of the wall panels. This
was evident from the failure mode as seen in the cracking pattern in the walls.
(a) Stress versus strain in top course
(b) Stress versus strain in bottom course
Figure 8.2 Stress versus strain for reinforced conventional block wall jointed in 1:3 mortar
‐0.20
0.00
0.20
0.40
0.60
0.80
1.00
1.20
‐3000 ‐2000 ‐1000 0 1000 2000 3000
Load
ratio P/Pu
Strain x10‐6
Avg. strain in block (top course) Strain in mortar (top course)
‐0.20
0.00
0.20
0.40
0.60
0.80
1.00
1.20
‐2000 ‐1500 ‐1000 ‐500 0 500
Load
ratio P/Pu
Strain x10‐6
Avg. strain in block (bottom course) Strain in mortar (bottom course)

103
The stress-strain characteristic curve for unreinforced conventional block wall panel
is shown in Figure 8.3. From Figure 8.6(a), the strains in block and mortar in the top
course were compressive and of the same order up to load level of 60%. At higher
stress levels, the strain in the mortar reduced gradually up to a value of 0.0 at stress
levels of 80%. Further increase in stress levels lead to development of tensile strains
in the mortar which continued to increase until failure. The compressive strains in
blocks on the other hand increased in magnitude until failure. Figure 8.3(b) shows
the stress-strain curve for the blocks and mortar for the bottom course in the wall.
The strain condition in both the blocks and mortar are compressive with the
magnitude in blocks being greater than mortar. At failure the strain in blocks and
mortar were 0.0013 and 0.0005, respectively. When Figures 8.4(b) and 8.5(b) are
compared, it is noted that the strain in the block in bottom course of the unreinforced
is generally greater than that of the reinforced wall. In the reinforced wall the
presence of reinforcement in the bedding joint lead to crushing of the blocks that are
confined in the upper courses of the wall. The strains in the bottom course of the
unreinforced conventional block wall were of the same order as those in the top
course. This was not the case for the reinforced wall which had strains in the top
course that were generally higher in magnitude than those in the bottom course.

104
(a) Stress versus strain in top course
(b) Stress versus strain in bottom course
Figure 8.3 Stress versus strain for unreinforced conventional block wall jointed in 1:3 mortar
The stress-strain curves for the wall utilizing alternative blocks and 1:3 mortar joint
with bedding joint reinforcement are shown in Figure 8.4. Figure 8.4(a) shows that
the strains in the top course were compressive throughout the loading period.
However, the strain in the mortar was higher than that of the blocks up to load level
‐0.20
0.00
0.20
0.40
0.60
0.80
1.00
1.20
‐1200 ‐1000 ‐800 ‐600 ‐400 ‐200 0 200 400
Load
ratio P/Pu
Strain x10‐6
Avg. strain in block (top course) Strain in mortar (top course)
‐0.20
0.00
0.20
0.40
0.60
0.80
1.00
1.20
‐1500 ‐1000 ‐500 0 500
Load
ratio P/Pu
Strain x10‐6
Avg. strain in block (bottom course) Strain in mortar (bottom course)

105
of 79%. Beyond this point, the strain in blocks increased until failure occurred at
strain of 0.0012. The failure strain in the mortar was 0.001 which is lower than the
strain in the blocks. Figure 8.4(b) shows the stress-strain curves for the block and
mortar in the bottom course. Below 40% load levels, the strain in the blocks was
tensile. At higher load, the strain was compressive and it increased in magnitude
until failure. On the other hand, strain in the mortar strain was compressive
throughout the loading period. At failure, the strains in the block and mortar were
0.0017 and 0.0004, respectively. This is an indication of the high load resisted by the
blocks at the lower parts of the wall. Failure strain in the blocks was generally
greater in the bottom course than the top course, which implies that there was better
load distribution in this type of construction. On the other hand, failure strain in the
mortar was lower in the bottom course than the top course. It has been proved that
the role of mortar in masonry is to distribute the stresses in the blocks (BSI, 1992).
Comparison of the conventional and alternative block walls shows that the strains in
the blocks for reinforced conventional block wall were 0.0019 and 0.0 for top and
bottom courses, respectively, while the corresponding values for reinforced
alternative block wall were 0.0012 and 0.0015. In conventional block wall, the
deformation was generally confined at the top level while alternative block wall
exhibited better load distribution and hence load sharing between the blocks as
indicated by the strain distribution at the top and bottom course.
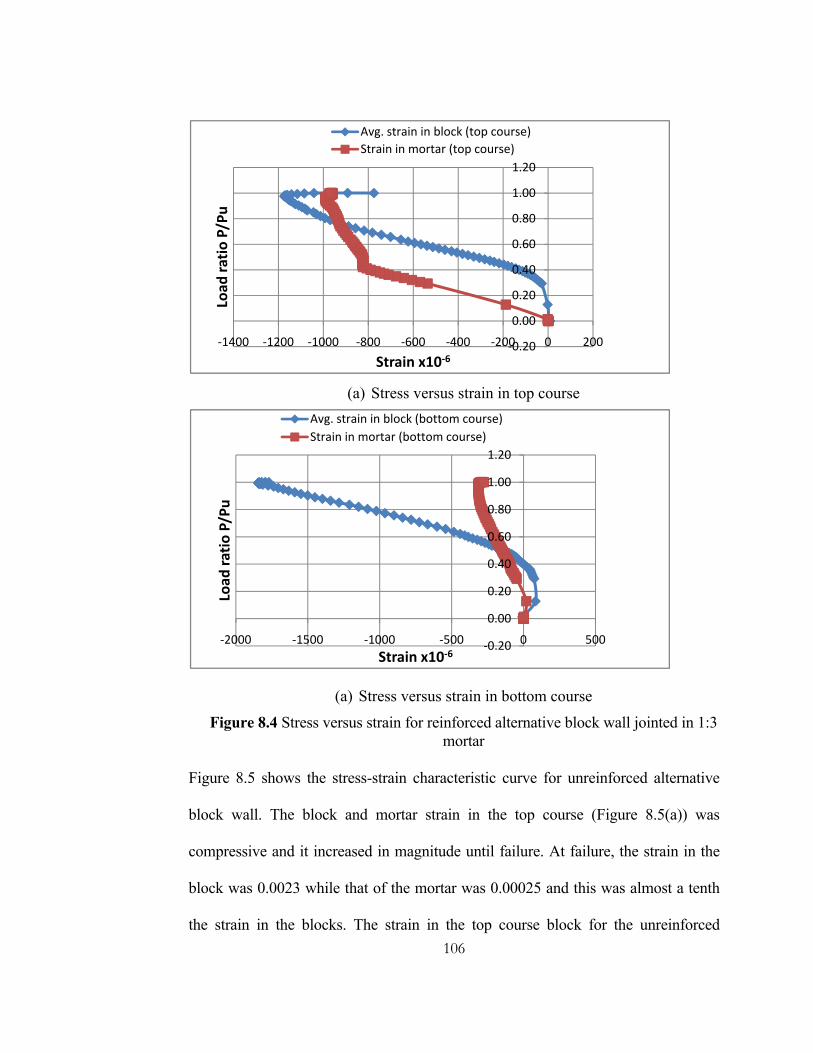
106
(a) Stress versus strain in top course
(a) Stress versus strain in bottom course
Figure 8.4 Stress versus strain for reinforced alternative block wall jointed in 1:3 mortar
Figure 8.5 shows the stress-strain characteristic curve for unreinforced alternative
block wall. The block and mortar strain in the top course (Figure 8.5(a)) was
compressive and it increased in magnitude until failure. At failure, the strain in the
block was 0.0023 while that of the mortar was 0.00025 and this was almost a tenth
the strain in the blocks. The strain in the top course block for the unreinforced
‐0.20
0.00
0.20
0.40
0.60
0.80
1.00
1.20
‐1400 ‐1200 ‐1000 ‐800 ‐600 ‐400 ‐200 0 200
Load
ratio P/Pu
Strain x10‐6
Avg. strain in block (top course)Strain in mortar (top course)
‐0.20
0.00
0.20
0.40
0.60
0.80
1.00
1.20
‐2000 ‐1500 ‐1000 ‐500 0 500
Load
ratio P/Pu
Strain x10‐6
Avg. strain in block (bottom course)Strain in mortar (bottom course)
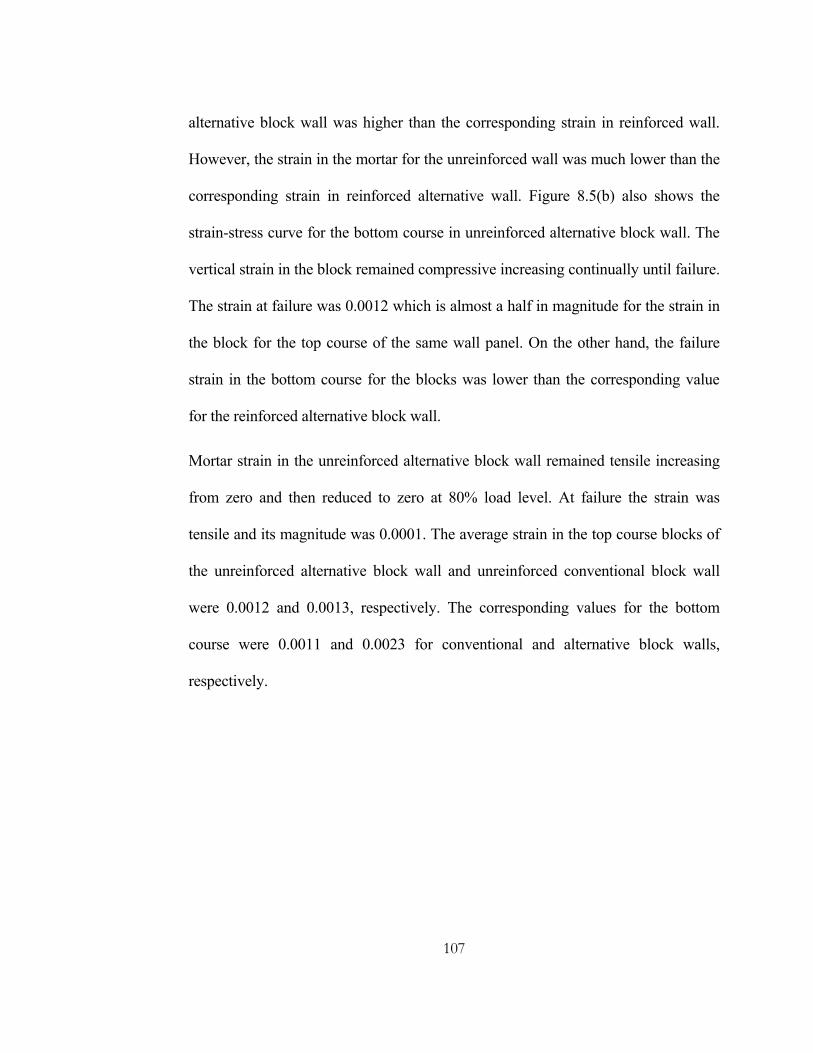
107
alternative block wall was higher than the corresponding strain in reinforced wall.
However, the strain in the mortar for the unreinforced wall was much lower than the
corresponding strain in reinforced alternative wall. Figure 8.5(b) also shows the
strain-stress curve for the bottom course in unreinforced alternative block wall. The
vertical strain in the block remained compressive increasing continually until failure.
The strain at failure was 0.0012 which is almost a half in magnitude for the strain in
the block for the top course of the same wall panel. On the other hand, the failure
strain in the bottom course for the blocks was lower than the corresponding value
for the reinforced alternative block wall.
Mortar strain in the unreinforced alternative block wall remained tensile increasing
from zero and then reduced to zero at 80% load level. At failure the strain was
tensile and its magnitude was 0.0001. The average strain in the top course blocks of
the unreinforced alternative block wall and unreinforced conventional block wall
were 0.0012 and 0.0013, respectively. The corresponding values for the bottom
course were 0.0011 and 0.0023 for conventional and alternative block walls,
respectively.
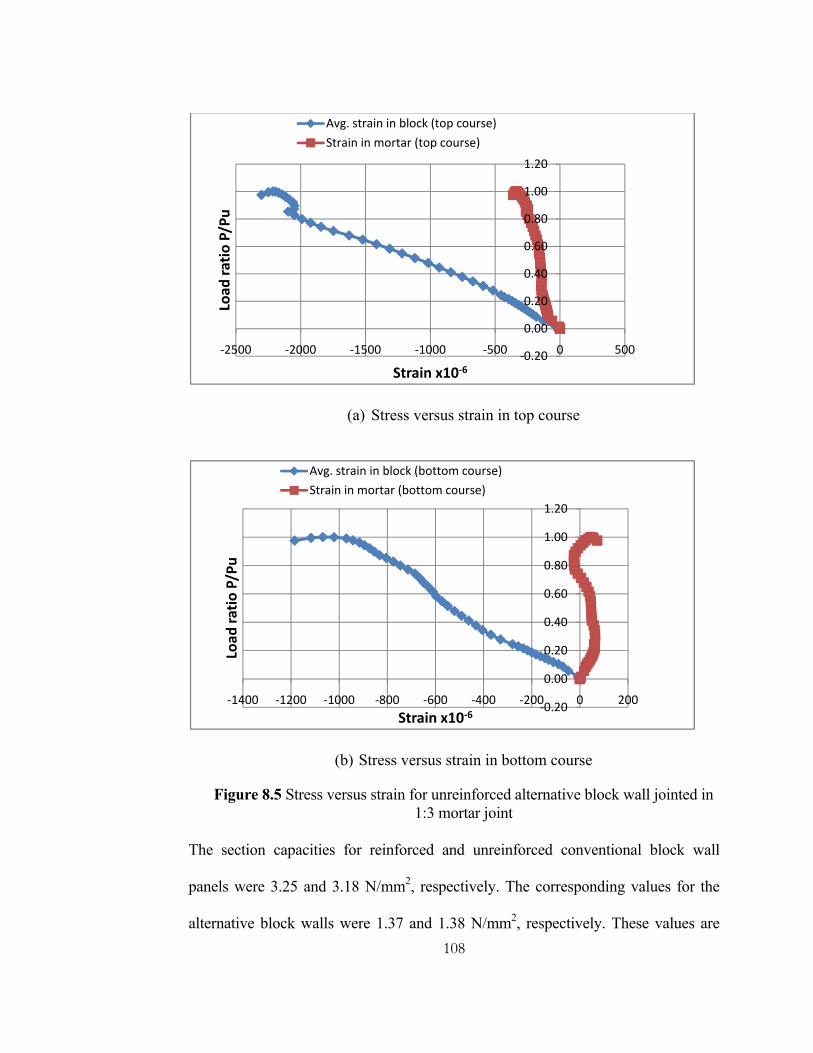
108
(a) Stress versus strain in top course
(b) Stress versus strain in bottom course
Figure 8.5 Stress versus strain for unreinforced alternative block wall jointed in 1:3 mortar joint
The section capacities for reinforced and unreinforced conventional block wall
panels were 3.25 and 3.18 N/mm2, respectively. The corresponding values for the
alternative block walls were 1.37 and 1.38 N/mm2, respectively. These values are
‐0.20
0.00
0.20
0.40
0.60
0.80
1.00
1.20
‐2500 ‐2000 ‐1500 ‐1000 ‐500 0 500
Load
ratio P/Pu
Strain x10‐6
Avg. strain in block (top course)
Strain in mortar (top course)
‐0.20
0.00
0.20
0.40
0.60
0.80
1.00
1.20
‐1400 ‐1200 ‐1000 ‐800 ‐600 ‐400 ‐200 0 200
Load
ratio P/Pu
Strain x10‐6
Avg. strain in block (bottom course)
Strain in mortar (bottom course)

109
close and they indicate that there is no effect of bedding joint reinforcement on the
strength of the masonry subjected to axial compression forces. This is because the
reinforcement is placed in the direction perpendicular to the direction of loading.
However, the presence of bedding joint reinforcement in the conventional block
wall panel, lead to high ultimate strain and fewer cracks as compared to the
unreinforced wall panel. In reinforced alternative block wall panel, the ultimate
strains were lower than those in the unreinforced wall. However, just like in
conventional block wall, few cracks formed in the wall.
The stress-strain characteristic curve for unreinforced conventional block wall with
1:4 mortar joint is shown in Figure 8.6. Figure 8.6(a) shows the characteristic curve
for the average strain in block and mortar for the top course. From the figure, the
average compressive strain in the block increased to a maximum of 0.00026 at load
level of 90% of the ultimate capacity of the wall panel. Further increase in stress
level lead to reduction in average strains in the blocks. At failure the final strain in
the block was compressive with a magnitude of 0.0002. This value is very low
compared to the corresponding value for unreinforced conventional block wall
utilizing 1:3 mortar joint conditions. The figure also shows that the vertical
compressive strain in mortar joint was increased to a maximum of 0.0003 at load
level of 50% of the ultimate load. At higher loads the strains in the mortar reduced
with increase in load. This continued until the strain changed to tensile. At failure of
the wall panel, the tensile strain in the mortar was 0.00022.

110
The stress versus strain for the bottom course is shown in Figure 8.6(b). From the
figure, both the average strain in the block and strain in the mortar were
compressive. At all load levels, the strains in the mortar were greater than the
average strains in the blocks. The ultimate strain for the block and the mortar were
0.0008 and 0.0006, respectively. The failure strains in the unreinforced conventional
block wall with 1:3 mortar joint were generally lower than the corresponding values
for the unreinforced conventional block wall with 1:3 mortar joint. In the top course,
the strains in the blocks for strong mortar joint wall were twice the value for the
weak mortar joint wall. In the bottom course, the strains for the stronger mortar joint
wall were three times greater than those of the weak mortar wall. However, the wall
with weaker mortar joints had higher axial compression capacity than the walls with
stronger mortar joint.
(a) Stress versus strain in top course
‐0.20
0.00
0.20
0.40
0.60
0.80
1.00
1.20
‐400 ‐300 ‐200 ‐100 0 100 200 300
Load
ratio P/Pu
Strain x10‐6
Avg. strain in blocks(top course)Strain in mortar(top course)

111
(b) Stress versus strain in bottom course Figure 8.6 Stress versus strain for unreinforced conventional block wall jointed
in 1:4 mortar joint
In Figure 8.7 the stress versus strain for unreinforced alternative block wall with 1:4
mortar joint is shown. The average strain in the blocks for the top course was
compressive while that of mortar joint was tensile. Below 20% load level the
average strain in the block was very low, and then it increased rapidly with increase
in load application until 80% load level. Generally, the average strain in the block
remained compressive. At failure, the ultimate compressive strain in the block was
0.0022. Below 30% load level, the mortar joint in the top course did not develop any
strains. Further increase in the load led to increase in strain until a maximum value
of 0.0004 tensile strains was attained. In the bottom course, average strains were
generally compressive apart from the block strains that were tensile for the low load
levels. The ultimate strains in the blocks and mortar joint were 0.0048 and 0.001,
respectively. The ultimate strains in both the top and bottom courses were generally
‐0.20
0.00
0.20
0.40
0.60
0.80
1.00
1.20
‐1000 ‐800 ‐600 ‐400 ‐200 0 200
Load
ratio P/Pu
Strain x10‐6
Avg. strain in block(bottom course)
Strain in mortar(bottom course)
112
greater in unreinforced alternative block wall than the conventional block wall
counterpart. The strain values were also higher than the values for the unreinforced
alternative block wall utilizing 1:3 mortar joint. Weaker mortar effect was more
pronounced in the alternative block wall than the conventional block wall. The
strength of the wall with weaker mortar joint was greater than the wall with stronger
mortar joint.
(a) Stress versus strain in top course
0.00
0.20
0.40
0.60
0.80
1.00
1.20
‐2500 ‐2000 ‐1500 ‐1000 ‐500 0 500
Load
P/Pu
Strain x10‐6
Avg. strain in block(top course)
Strain in mortar(top course)
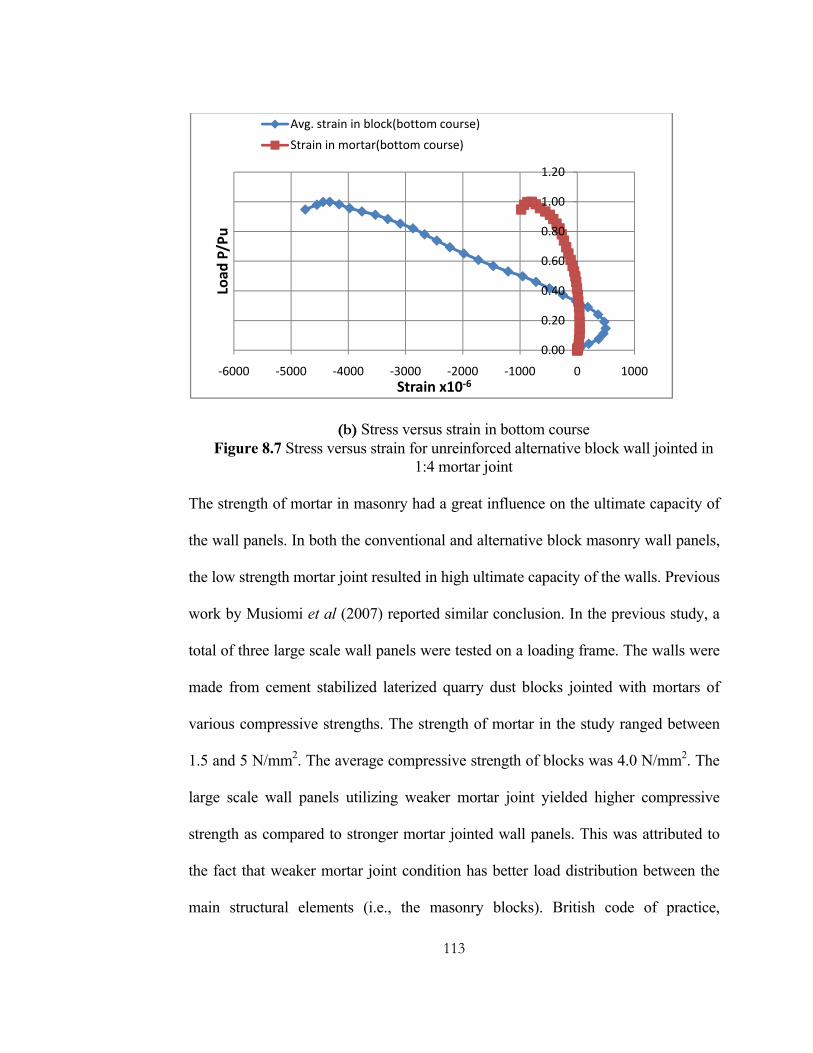
113
(b) Stress versus strain in bottom course Figure 8.7 Stress versus strain for unreinforced alternative block wall jointed in
1:4 mortar joint
The strength of mortar in masonry had a great influence on the ultimate capacity of
the wall panels. In both the conventional and alternative block masonry wall panels,
the low strength mortar joint resulted in high ultimate capacity of the walls. Previous
work by Musiomi et al (2007) reported similar conclusion. In the previous study, a
total of three large scale wall panels were tested on a loading frame. The walls were
made from cement stabilized laterized quarry dust blocks jointed with mortars of
various compressive strengths. The strength of mortar in the study ranged between
1.5 and 5 N/mm2. The average compressive strength of blocks was 4.0 N/mm2. The
large scale wall panels utilizing weaker mortar joint yielded higher compressive
strength as compared to stronger mortar jointed wall panels. This was attributed to
the fact that weaker mortar joint condition has better load distribution between the
main structural elements (i.e., the masonry blocks). British code of practice,
0.00
0.20
0.40
0.60
0.80
1.00
1.20
‐6000 ‐5000 ‐4000 ‐3000 ‐2000 ‐1000 0 1000
Load
P/Pu
Strain x10‐6
Avg. strain in block(bottom course)
Strain in mortar(bottom course)
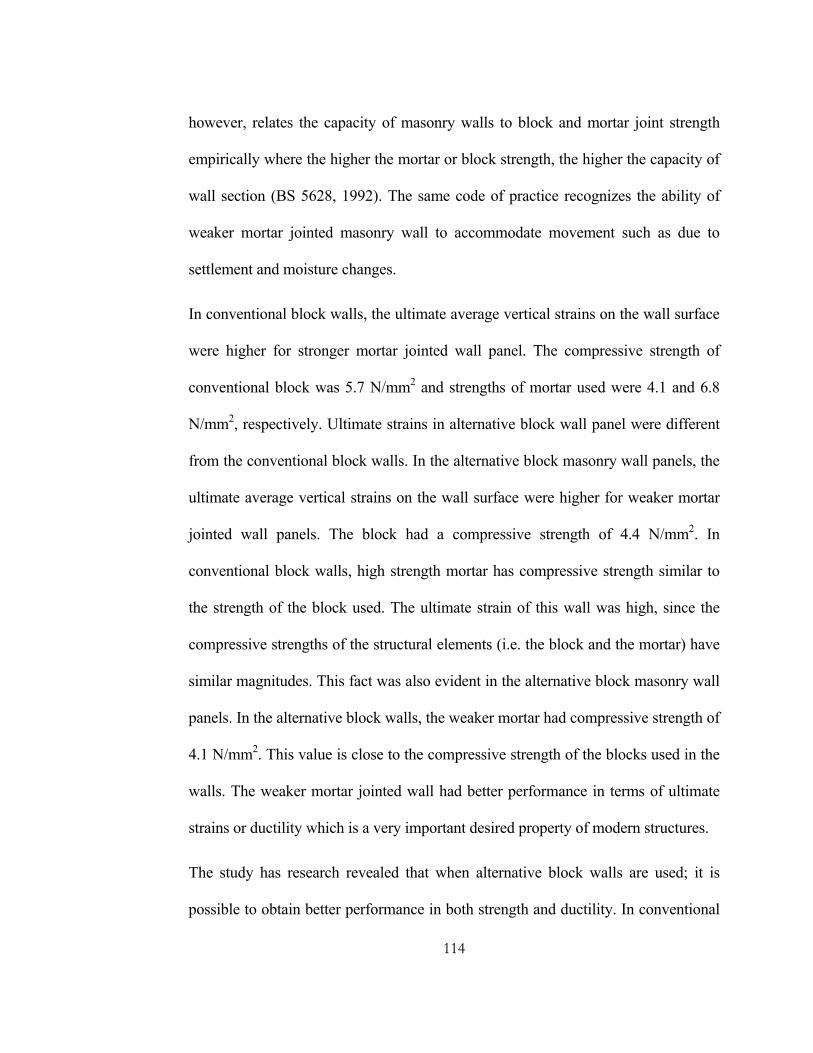
114
however, relates the capacity of masonry walls to block and mortar joint strength
empirically where the higher the mortar or block strength, the higher the capacity of
wall section (BS 5628, 1992). The same code of practice recognizes the ability of
weaker mortar jointed masonry wall to accommodate movement such as due to
settlement and moisture changes.
In conventional block walls, the ultimate average vertical strains on the wall surface
were higher for stronger mortar jointed wall panel. The compressive strength of
conventional block was 5.7 N/mm2 and strengths of mortar used were 4.1 and 6.8
N/mm2, respectively. Ultimate strains in alternative block wall panel were different
from the conventional block walls. In the alternative block masonry wall panels, the
ultimate average vertical strains on the wall surface were higher for weaker mortar
jointed wall panels. The block had a compressive strength of 4.4 N/mm2. In
conventional block walls, high strength mortar has compressive strength similar to
the strength of the block used. The ultimate strain of this wall was high, since the
compressive strengths of the structural elements (i.e. the block and the mortar) have
similar magnitudes. This fact was also evident in the alternative block masonry wall
panels. In the alternative block walls, the weaker mortar had compressive strength of
4.1 N/mm2. This value is close to the compressive strength of the blocks used in the
walls. The weaker mortar jointed wall had better performance in terms of ultimate
strains or ductility which is a very important desired property of modern structures.
The study has research revealed that when alternative block walls are used; it is
possible to obtain better performance in both strength and ductility. In conventional
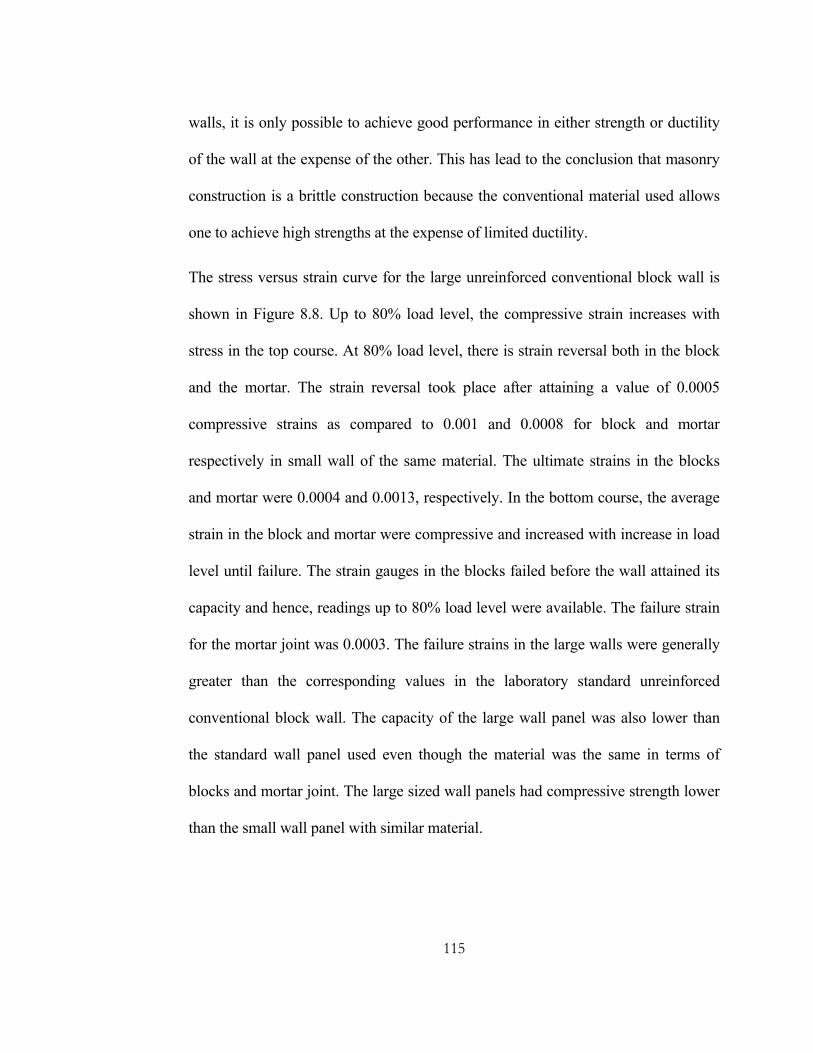
115
walls, it is only possible to achieve good performance in either strength or ductility
of the wall at the expense of the other. This has lead to the conclusion that masonry
construction is a brittle construction because the conventional material used allows
one to achieve high strengths at the expense of limited ductility.
The stress versus strain curve for the large unreinforced conventional block wall is
shown in Figure 8.8. Up to 80% load level, the compressive strain increases with
stress in the top course. At 80% load level, there is strain reversal both in the block
and the mortar. The strain reversal took place after attaining a value of 0.0005
compressive strains as compared to 0.001 and 0.0008 for block and mortar
respectively in small wall of the same material. The ultimate strains in the blocks
and mortar were 0.0004 and 0.0013, respectively. In the bottom course, the average
strain in the block and mortar were compressive and increased with increase in load
level until failure. The strain gauges in the blocks failed before the wall attained its
capacity and hence, readings up to 80% load level were available. The failure strain
for the mortar joint was 0.0003. The failure strains in the large walls were generally
greater than the corresponding values in the laboratory standard unreinforced
conventional block wall. The capacity of the large wall panel was also lower than
the standard wall panel used even though the material was the same in terms of
blocks and mortar joint. The large sized wall panels had compressive strength lower
than the small wall panel with similar material.
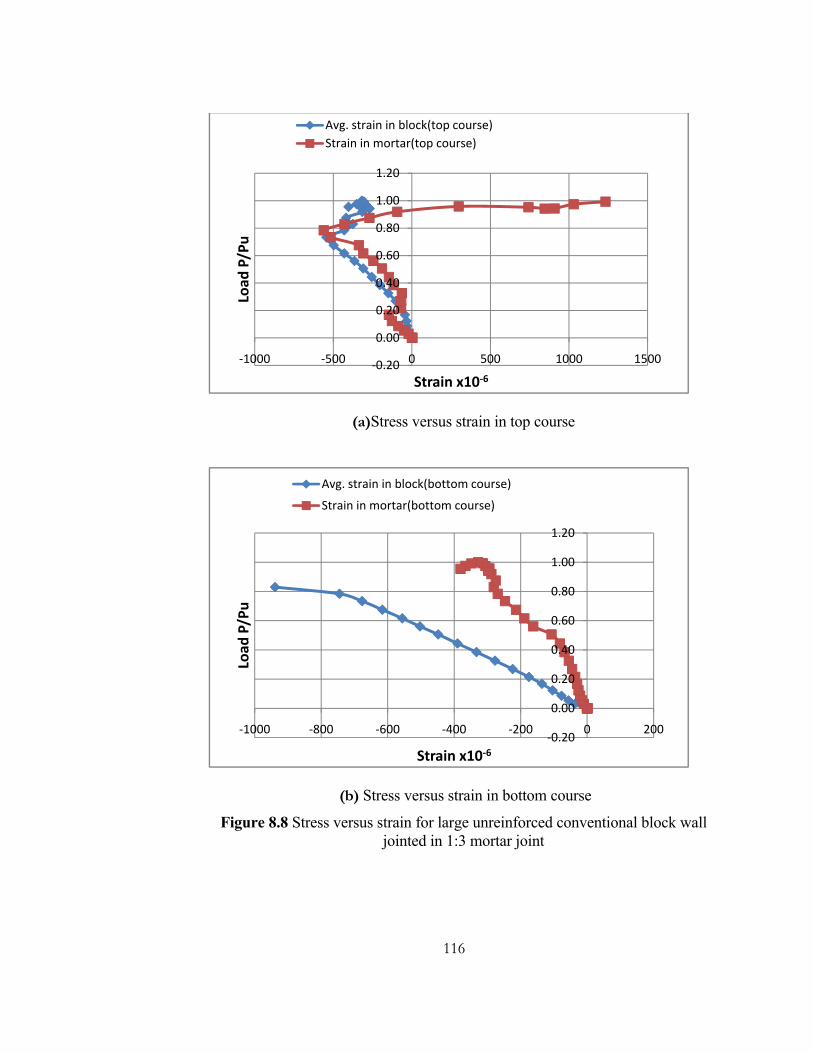
116
(a)Stress versus strain in top course
(b) Stress versus strain in bottom course
Figure 8.8 Stress versus strain for large unreinforced conventional block wall jointed in 1:3 mortar joint
‐0.20
0.00
0.20
0.40
0.60
0.80
1.00
1.20
‐1000 ‐500 0 500 1000 1500
Load
P/Pu
Strain x10‐6
Avg. strain in block(top course)Strain in mortar(top course)
‐0.20
0.00
0.20
0.40
0.60
0.80
1.00
1.20
‐1000 ‐800 ‐600 ‐400 ‐200 0 200
Load
P/Pu
Strain x10‐6
Avg. strain in block(bottom course)
Strain in mortar(bottom course)

117
Figure 8.9 shows the stress versus strain curve for large unreinforced alternative
block wall panel tested in axial compression. In this wall, the average strains at the
top and bottom courses were compressive. In the top course, the compressive strain
in the blocks increased with load until maximum strains at 60% load level were
attained. Further increase in the load led to reduction in the average block strains.
The failure strain in block at this level was 0.0008 compressive. The strains in
mortar at this level were low as compared to the block strains. The mortar joint
underwent strain reversal throughout the loading period with no strains at failure. In
the bottom course, the curves for the block and mortar assumed the similar shape.
The ultimate strains in the blocks and vertical mortar joint were 0.0026 and 0.0006,
respectively. However, the strain levels in the blocks were generally greater than
the mortar. As opposed to the conventional block walls, the strains in large
unreinforced alternative block wall panel were generally higher than the standard
laboratory wall panel size. The strains in blocks were 1.5 and 2.5 times higher for
the top and bottom courses, respectively, while the strains in the mortar joints were 2
times higher. Like the conventional block walls, the capacity of the large wall in
terms of stress was lower than that of the standard laboratory wall panel size used in
the study. The capacity ratio for the two alternative block walls was 0.7.

118
(a)Stress versus strain in top course
(b) Stress versus strain in bottom course
Figure 8.9 Stress versus strain for large unreinforced alternative block wall jointed in 1:3 mortar joint
‐0.20
0.00
0.20
0.40
0.60
0.80
1.00
1.20
‐3500 ‐3000 ‐2500 ‐2000 ‐1500 ‐1000 ‐500 0 500
Load
P/Pu
Strain x10‐6
Avg. strain in block(top course)
Strain in mortar(top course)
‐0.20
0.00
0.20
0.40
0.60
0.80
1.00
1.20
‐3000 ‐2500 ‐2000 ‐1500 ‐1000 ‐500 0 500
Load
P/Pu
Strain x10‐6
Avg. strain in block(bottom course)Strain in mortar(bottom course)
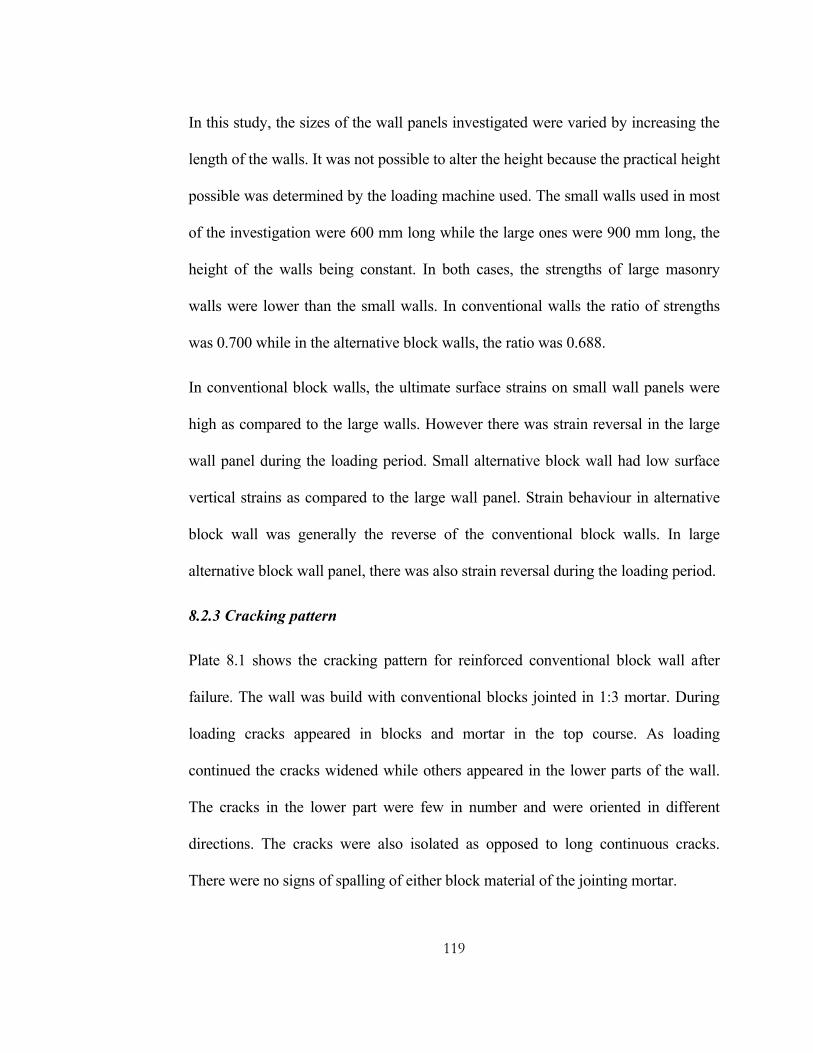
119
In this study, the sizes of the wall panels investigated were varied by increasing the
length of the walls. It was not possible to alter the height because the practical height
possible was determined by the loading machine used. The small walls used in most
of the investigation were 600 mm long while the large ones were 900 mm long, the
height of the walls being constant. In both cases, the strengths of large masonry
walls were lower than the small walls. In conventional walls the ratio of strengths
was 0.700 while in the alternative block walls, the ratio was 0.688.
In conventional block walls, the ultimate surface strains on small wall panels were
high as compared to the large walls. However there was strain reversal in the large
wall panel during the loading period. Small alternative block wall had low surface
vertical strains as compared to the large wall panel. Strain behaviour in alternative
block wall was generally the reverse of the conventional block walls. In large
alternative block wall panel, there was also strain reversal during the loading period.
8.2.3 Cracking pattern
Plate 8.1 shows the cracking pattern for reinforced conventional block wall after
failure. The wall was build with conventional blocks jointed in 1:3 mortar. During
loading cracks appeared in blocks and mortar in the top course. As loading
continued the cracks widened while others appeared in the lower parts of the wall.
The cracks in the lower part were few in number and were oriented in different
directions. The cracks were also isolated as opposed to long continuous cracks.
There were no signs of spalling of either block material of the jointing mortar.
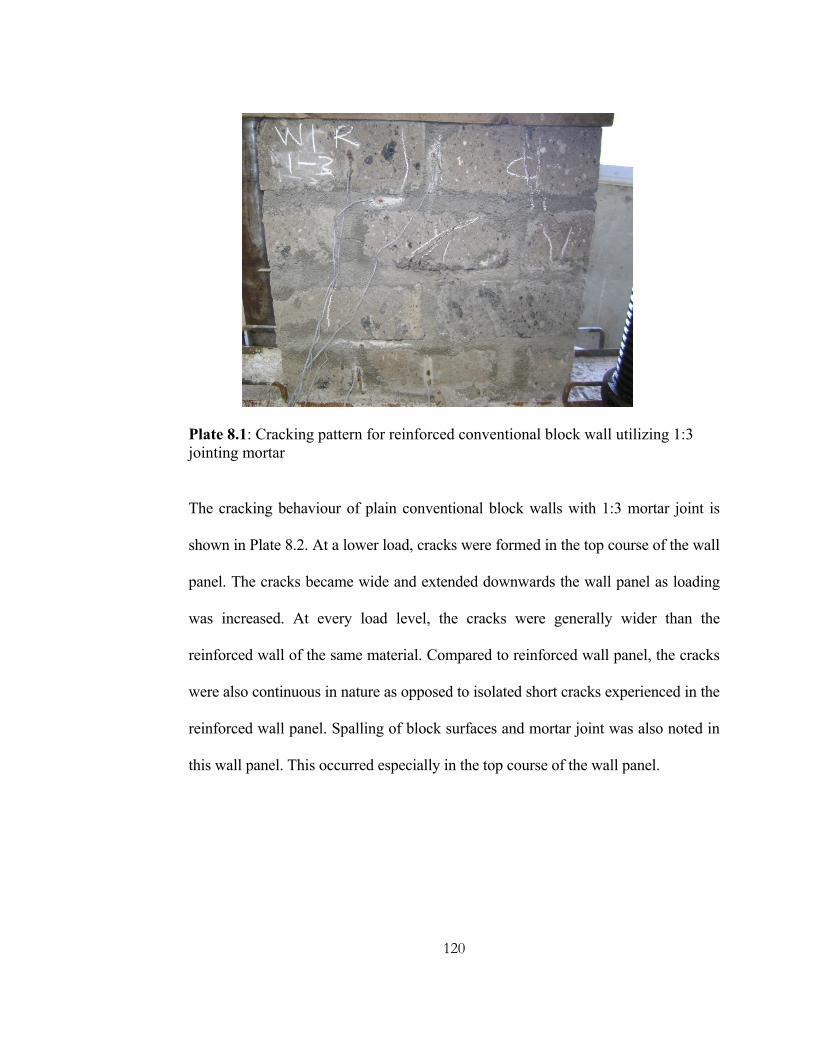
120
Plate 8.1: Cracking pattern for reinforced conventional block wall utilizing 1:3 jointing mortar
The cracking behaviour of plain conventional block walls with 1:3 mortar joint is
shown in Plate 8.2. At a lower load, cracks were formed in the top course of the wall
panel. The cracks became wide and extended downwards the wall panel as loading
was increased. At every load level, the cracks were generally wider than the
reinforced wall of the same material. Compared to reinforced wall panel, the cracks
were also continuous in nature as opposed to isolated short cracks experienced in the
reinforced wall panel. Spalling of block surfaces and mortar joint was also noted in
this wall panel. This occurred especially in the top course of the wall panel.
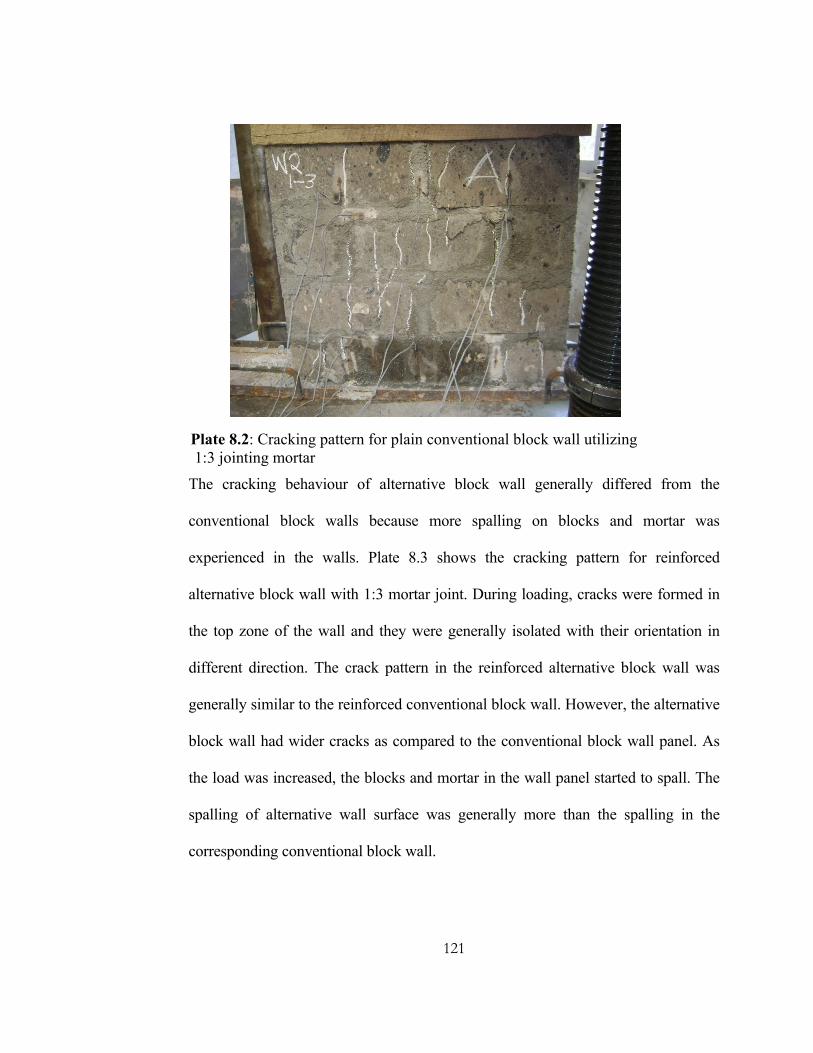
121
The cracking behaviour of alternative block wall generally differed from the
conventional block walls because more spalling on blocks and mortar was
experienced in the walls. Plate 8.3 shows the cracking pattern for reinforced
alternative block wall with 1:3 mortar joint. During loading, cracks were formed in
the top zone of the wall and they were generally isolated with their orientation in
different direction. The crack pattern in the reinforced alternative block wall was
generally similar to the reinforced conventional block wall. However, the alternative
block wall had wider cracks as compared to the conventional block wall panel. As
the load was increased, the blocks and mortar in the wall panel started to spall. The
spalling of alternative wall surface was generally more than the spalling in the
corresponding conventional block wall.
Plate 8.2: Cracking pattern for plain conventional block wall utilizing 1:3 jointing mortar

122
Plate 8.4 shows cracks formed in the unreinforced alternative block wall panel
subjected to axial compression. Examination of the wall panel revealed that the
cracking pattern of the wall was generally similar to the plain conventional block
wall. The cracks in the alternative block wall were, however, wide and vertical in
orientation. Continuous cracks formed in blocks and mortar running from the top to
the bottom of the wall panel. The cracks were generally wider than those formed in
reinforced alternative block wall.
Plate 8.3: Cracking pattern for reinforced alternative block wall utilizing 1:3 jointing mortar

123
The cracking pattern in masonry structures is very important because the ultimate
behaviour of the structures depends on the size and orientation of the cracks. In
conventional block walls, vertical cracks through the blocks and mortar were
formed. The cracks in stronger mortar jointed wall were concentrated at the top zone
which indicated lack of distributed deformation in the wall panel. Weaker mortar
jointed wall on the other hand, formed cracks that were distributed along the height
of the wall panel. Generally, the cracks that were formed in the weaker mortar
jointed walls were wider than the strong mortar jointed walls.
Compared to conventional wall panels, the cracking patterns in alternative block
wall panels were different. The stronger mortar jointed wall panel failed by
developing vertical cracks running through the blocks and mortar joints. There were
also signs of spalling of the blocks and mortar at ultimate load. The weaker mortar
Plate 8.4: Cracking pattern for plain alternative block wall utilizing 1:3 jointing mortar

124
jointed wall on the other hand failed by developing vertical cracks in the top zone of
the wall. In the middle and the bottom zones, inclined and discrete cracks formed in
different directions.
8.3 Cost comparison
In this study, the cost of the alternative block with optimum mix was compared with
that of the conventional natural stone blocks. The results of the cost comparison
studies are presented in Table 8.2. The cost of the conventional blocks is based on
the market price of the material obtained from Ndarugu River in Thika District. The
results show that the costs per block of alternative and conventional blocks are 23.50
and 40.00, respectively. Therefore, when used in construction, alternative masonry
blocks will result in a saving of 41%. The saving is substantial since masonry form
the main structural load bearing system in low rise residential houses.
Table 8.2 Cost of conventional and alternative blocks
Materials Alternative Block Conventional Block
Cement (kg/1000 blocks) 480 -
QDNbi (kg/1000 blocks) 2000 -
QDNdar (kg/1000 blocks) 2900 -
Laterite (kg/1000 blocks) 4700 -
Compressive strength
(N/mm2)
4.07 4.30
Cost (KShs./ 1000 blocks) 23,500 40,000
Cost (KShs./ block) 23.50 40.00

125
8.4 Summary and conclusion
In this chapter, the results of studies on wall panels utilizing conventional as well as
alternative blocks have been presented. The structural behaviour of alternative block
walls has also been compared with the conventional block walls. The effect of
mortar joint strength on the structural behaviour has also been evaluated. Other
variables such as the effect of bedding joint reinforcement, the size of walls have
also been discussed. From the results, it is noted that the effect of strength of the
mortar joint on the behaviour of walls is similar for both the alternative and
conventional block walls. Weaker mortar jointed walls generally had higher
compressive strength than the stronger mortar joint wall panels. In addition, the
effect of bedding joint reinforcement on behaviour of walls was found to be similar
for alternative and conventional wall panels. In both wall types, the effect of
bedding joint reinforcement delayed the formation of the first crack in the wall
panels and reduced final crack width at failure load of the walls. However, the
compressive strengths of conventional block walls were generally higher than the
alternative block walls.
Structural design seeks to achieve both strength and ductility in any system for
satisfactory performance. The results in this study revealed that when alternative
blocks are used, it is possible to achieve strength and ductility in wall panels at the
same time. In conventional masonry construction this is not possible and the
designer can only achieve one property at the expense of the other.
126
CHAPTER NINE
9.0 CONCLUSION
This study has examined the properties of alternative aggregates and filler materials
for production of alternative concrete and eco-blocks, respectively. The viability of
the alternative concrete and blocks in structural elements has also been evaluated.
The findings of this study clearly demonstrate the great potential of laterized quarry
dust concrete and cement stabilised laterized quarry dust blocks in construction.
Reinforced concrete beams and eco-masonry walls produced from the alternative
concrete and blocks, respectively, show great viability in sustainable building
construction. More specifically, the study determined that;
1. The main material physical properties of quarry dust, laterite and recycled
concrete aggregates are different from the conventional materials. All the
alternative aggregates and filler materials investigated fall outside the standard
gradation curves specified by both the British and American Standards. Their
silt content as well as water absorption was generally at least twice as great as
the conventional material.
2. Alternative concrete made from laterized quarry dust and a recycled concrete
aggregate has performance comparable to conventional concrete. The
compressive strength of the alternative as well as conventional concrete of
similar mix ratios were within 10%. The workability of fresh alternative
concrete was generally within the standard limits for concrete placed and
compacted by internal vibrator.
127
3. Alternative blocks made of blended laterite soil and quarry dust can attain
compressive strengths comparable to the conventional machine dressed stones.
Any strength is achievable with alternative materials by varying the cement
content. When stabilized with 13% of Portland cement, laterized quarry dust
blocks can attain compressive strength of 6 N/mm2 at 28 days. The
compressive strength and water absorption of the blocks when 7% of cement is
used satisfy the requirements of the Kenya Standards.
4. Alternative concrete beams have performance behavior similar to the
conventional concrete beams. The flexural capacity of reinforced concrete
beams utilizing alternative and conventional concrete beams with similar
reinforcement content and concrete compressive strength were within 5%.
5. Alternative block wall panels can achieve both strength and ductility while
conventional block wall panels can only achieve either strength or ductility at
the expense of the other. However, the normalized compressive strengths of
the alternative and conventional wall panels were within 5%.
128
CHAPTER TEN
10.0 RECOMMENDATIONS
This study attempted to ensure that important information on alternative building
materials was obtained. However, there are other aspects which were not evaluated
although they may affect the overall performance of the materials. Therefore, the
following recommendations are proposed.
1. Further studied should be carried out on concrete beams made from the
alternative concrete to determine the effects of shear, compression, bond and
deflection on performance of the structural elements. The present study
focused on the flexural behavior of beams. Despite the fact that flexural
behavior dominate in beams, other aspects such as shear, bond and deflection
affect the design and overall performance of the element in service.
2. There is need for further research on the performance of concrete slabs and
columns made from alternative concrete. Slabs and columns form key
structural elements in housing projects and hence, knowledge of their
structural behavior is required. In the present study, only concrete beams were
investigated.
3. The findings on masonry walls made from eco-blocks are based on uniaxial
compressive stresses in the walls. In real structures, a generalized tri-axial
stresses are likely to be induced especially where lateral forces are significant.
Further studies are therefore recommended to ascertain the behavior of wall
panel made from eco-blocks when subjected to multi-directional stresses.
129
REFERENCES
1) Adepegba, D. (1975) A comparative study of normal concrete with concrete
which contain laterite instead of sand. Building science, 10(2), pp. 443-552
2) Agevi, E. (1999) "Technology Dissemination in Kenya", Development
Alternatives Newsletter, Vol: 9 (11), 7-9.
3) Aleva, G.J.J.; (1994) Laterites. Concepts, Geology, Morphology and
Chemistry. 169 pp. ISRIC, Wageningen, The Netherlands, ISBN 90-6672-
053-0
4) Alutu, O. E. and Oghenejobo, A. E. (2006) Strength, durability and cost
effectiveness of cement-stabilised laterite hollow blocks. Journal of
engineering geology and hydrogeology. Vol 39 issue 1 pp.65-72
5) Arai, Noriaki (1986) Properties of sand as a construction material, Research
Report, JKUAT Kenya.
6) Ata, O., Olusola, K. O. and Aina, O. O. (2005) Factors affecting Poisson’s
ratio of laterized concrete. Jurnal Sains Dan Teknologi, EMAS, Jakarta,
15(2), pp. 77-84
7) Babu K.K.; Radhakrishnan. R and Nambiar, E.K.K. (1997) Compressive
Strength of Brick Masonry with Alternative – Aggregate Mortar. CE & CR
Journal, New Delhi, PP 25-29.
8) Balogun, L, A (1982) The use of lateritic soils in structural concrete.
Proceedings 1st National conference; Nigerian geotechnical association,
Lagos,Nigeria, 1982
130
9) Balogun, L, A. and Adepegba, D. (1982) Effect of varying sand content in
laterized concrete. International journal of cement composites and
lightweight concrere, 4(4), 1982, pp.235-241
10) Bardossy, G. and Aleva, G.J.J. (1990) Lateritic Bauxites. 624 pp.
Developments in Economic Geology 27, ELSEVIER, ISBN 0-444-98811-4
11) BS812; Part2 (1996) Methods of Sampling and Testing of Mineral
Aggregates, BSI, UK.
12) BS882 (1992) Aggregates from natural sources, BSI, UK.
13) BS 5628: Part 1 (2005) Structural use of unreinforced masonry, BSI, UK.
14) BS 5628: Part 2 (2005) Structural use of reinforced and prestressed
masonry, BSI, UK.
15) BS 5628: Part 3 (2005) Materials and components, design and
workmanship, BSI, UK.
16) Environmental Council of Concrete Organizations (1999) Recycling
concrete and masonry, Research Report.
17) Gooding, D. E. M., & Thomas, T. (1995) The Potential of Cement-
Stabilized Building Blocks as an Urban Building Material in Developing
Countries, ODA Report, UK.
18) Guillaud, Hubert, Joffroy, Thierry, and Odul, Pascal (1995)
Compressed earth blocks - Volume 2: Manual of design and construction,
GATE Germany.
19) Hansen, T.C. (1992) Recycling of Demolished Concrete and Masonry.
RILEM, Report No.6. Publisher E&FN Spon.
131
20) Hanson. (2001) Hanson Bricks [Web Page]. URL www.hanson-
brickseurope.
21) Ilangovan, R. and Nagamani, K. (2007) Strength and durability properties
of concrete containing quarry rock dust as fine aggregates.
22) Ilangovan, R. and Nagamani, K. (2006) Studies on Strength and Behavior
of Concrete by using Quarry Dust as Fine Aggregate. CE & CR Journal,
New Delhi, PP 40-42.
23) Ilangovan, R. and Nagamani, K. (2006) Application of quarry Rock dust
as fine aggregate in concrete construction. National Journal on construction
Management: NICMR, Pune, Dec, 2006, PP 5- 13.
24) International Labour Office (1987) Small-scale manufacture of stabilized
soil blocks, International Labour Office, Geneva.
25) International Labour Office (1990) Small-scale brick making,
International Labour Office, Geneva.
26) Karanja, P.H.K; Syagga, P.M; Muchiri, D.R. and Kitetu J.J. (2003)
Alternative blocks developed from low density polythene stabilized with
kitchen organic waste; Proceedings of the International Civil Engineering
Conference on Sustainable Development in the 21st Century, Nairobi, Kenya.
27) Keable, J (1996) Rammed earth structures: a code of practice, IT
Publications London, UK.
28) Kerali, A. G. (2001) Durability of Compressed and Cement-Stabilized
Building Blocks, University of Warwick, UK
132
29) Kumar, A. (1999) "Sustainable building technologies for mass
application", Development Alternatives Newsletter, Vol: 9 (11), 1,3,4.
30) Kioko, D (1996) An investigation into the suitability of crushed stone sand
in concrete production, University of Nairobi, Kenya
31) KS-02-95 (1984) Kenya Standard Specification for natural aggregates for
concrete, Kenya Bureau of Standards, Kenya.
32) Lasisi, F., osunade, J. A. and Adewale, A. O. (1983) Short-term studies on
the durability of laterite concrete and laterite-cement mortars, Building and
Environments, 25(4), pp.77-83
33) Limbachiya M.C., Koulouris A., Roberts J.J. and Fried A.N. (2004)
Performance of recycled aggregates concrete in RILEM international
symposium on Environment-Conscious Materials and systems for
sustainable development pg 127-136
34) Limbachiya, M. C., Koulouris, A., Roberts, J. J. and Fried, A. N. (2004)
Performance of recycled aggregate concrete. RILEM International
symposium on Environment-conscious materials and systems for sustainable
development, pp. 127-136
35) Mbumbia, L., Mertens de Wilmars, A., & Tirlocq, J. (2000) Performance
characteristics of lateritic soil bricks fired at low temperatures: a case study
of Cameroon, Construction and Building Materials, Vol: 14 121-
36) Miller, G. A., & Azad, S. (2000) Influence of soil type on stabilization with
cement kiln dust, Construction and Building Materials, Vol: 14 89-97.

133
37) Mulu, P; Mwatelah, J; Asano, E (1998) Properties of typical Kenyan
quarry dust as fine aggregate for concrete works, Final Research Report,
JICA.
38) Musiomi, T and Oyawa, W (2007) Comparative performance study of
large scale wall panels of eco-blocks with different mortars. Proceedings of
the Third JKUAT Scientific, Technological and Industrialization Conference.
39) Mustafa K. T. (1990) Environmental Guidelines for Sand and Gravel
Extraction Projects, UNEP publication No.20, pp. 12-14.
40) Nagaraj. T. S. and Zahida B. (1996) Efficient Utilization of rock dust and
pebbles as Aggregates in Portland Cement Concrete. The Indian Concrete
Journal, PP 53-56.
41) Narasimhan.C., Patil. B.T. and Sankar, H. S. (1999) Performance of
Concrete with Quarry Dust as Fine Aggregate – An Experimental Study. CE
& CR Journal, PP 19-24.
42) Neville, A and Brooks, J (1987) Concrete technology, Revised edition.
Longman Singapore Publishers Pte Ltd.
43) Neville, A (1981) Properties of concrete, Third edition. Longman Singapore
Publishers Pte Ltd.
44) Nisnevich M.; Sirotin.G. and Eshel. Y, (2003) ‘Light weight concrete
containing thermal power station and stone quarry waste,’ Magazine of
Concrete Research, PP313-320.
45) Nzioki, N. (2000) “Sustainable human settlements”, Kenya NGO Earth
summit 2002 Forum

134
46) Osunade, J. A. (1994) Effect of grain size ranges of laterite fine aggregate
on the shear and tensile strengths of laterized concrete. International journal
for housing science and its applications, 4(1) pp. 8-15
47) Osunade, J. A. (2002) Effect of replacement of lateritic soils with granite
fines on the compressive and tensile strength of laterized concrete, Buildings
and Environment. 37(6), pp.491-496
48) Oyawa, W.O (2004) “Eco-materials for sustainable development in
developing countries”, Structural Engineering International, Journal of the
International Association for Bridge and Structural Engineering (IABSE),
Vol. 14 (3), pp. 208-212.
49) Schellmann, W. (1983) Geochemical principles of lateritic nickel ore
formation. Proceedings of the 2. International Seminar on Lateritisation
Processes, São Paulo, 119-135
50) Venkatarama R. B. V, Richardson L. and Nanjunda R.K.S (2007)
Optimum soil grading for the soil-cement blocks. Journal of material in civil
engineering. Vol 19, issue 2 pp. 139-148
51) Udueyo, F.; Udeme, I. and Odim, O. (2006) Strength performance of
laterized concrete: Construction and Building Material: Volume 20, Issue
10, December 2006, Pp 1057-1062.
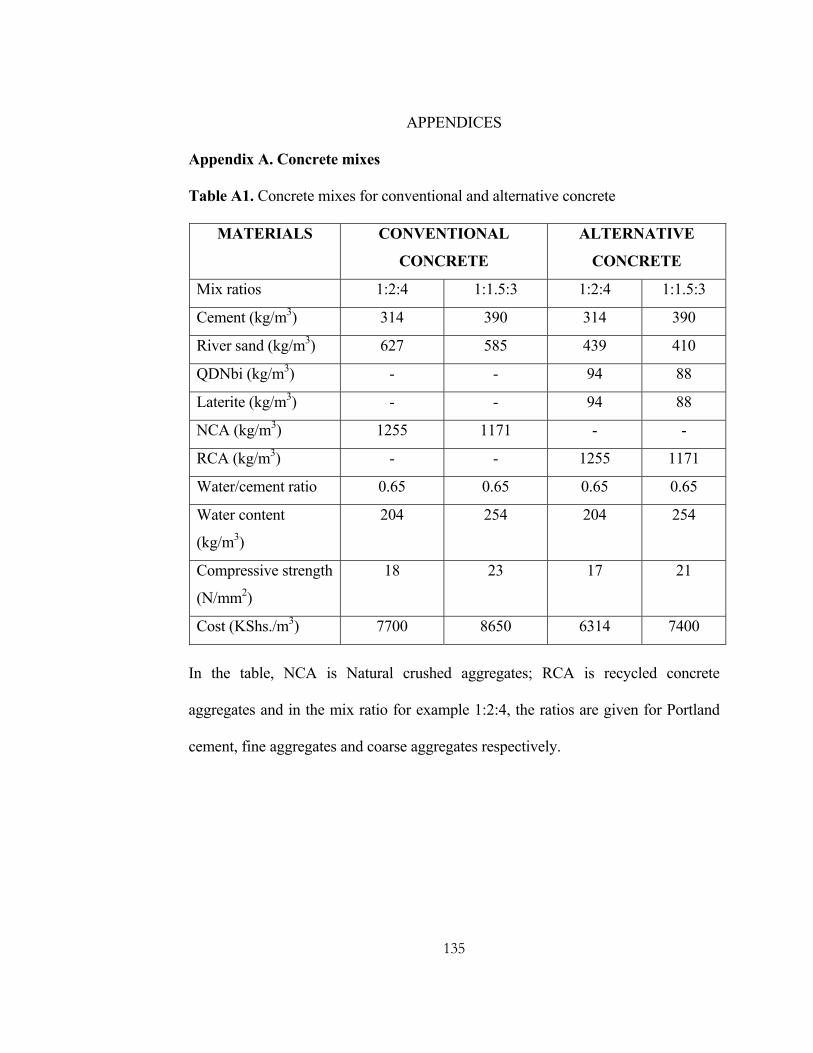
135
APPENDICES
Appendix A. Concrete mixes
Table A1. Concrete mixes for conventional and alternative concrete
MATERIALS CONVENTIONAL
CONCRETE
ALTERNATIVE
CONCRETE
Mix ratios 1:2:4 1:1.5:3 1:2:4 1:1.5:3
Cement (kg/m3) 314 390 314 390
River sand (kg/m3) 627 585 439 410
QDNbi (kg/m3) - - 94 88
Laterite (kg/m3) - - 94 88
NCA (kg/m3) 1255 1171 - -
RCA (kg/m3) - - 1255 1171
Water/cement ratio 0.65 0.65 0.65 0.65
Water content
(kg/m3)
204 254 204 254
Compressive strength
(N/mm2)
18 23 17 21
Cost (KShs./m3) 7700 8650 6314 7400
In the table, NCA is Natural crushed aggregates; RCA is recycled concrete
aggregates and in the mix ratio for example 1:2:4, the ratios are given for Portland
cement, fine aggregates and coarse aggregates respectively.

136
Appendix B. Masonry block mixes
Table B1. Block mixes for conventional and alternative blocks
MATERIALS ALTERNATIVE
BLOCK
CONVENTIONAL
BLOCK
Cement (kg/1000 blocks) 480 -
QDNbi (kg/1000 blocks) 2000 -
QDNdar (kg/1000 blocks) 2900 -
Laterite (kg/1000 blocks) 4700 -
Compressive strength
(N/mm2)
4.07 4.30
Cost (KShs./ 1000 blocks) 23,500 40,000
Cost (KShs./ block) 23.50 40.00
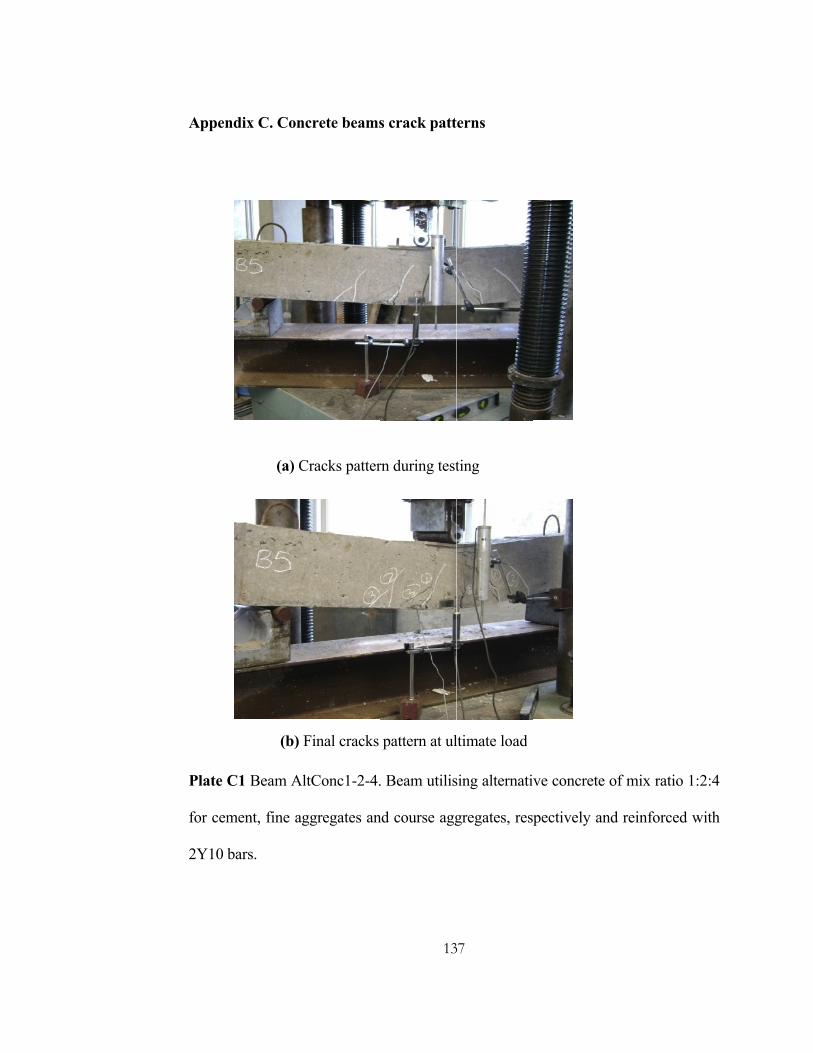
Appen
Plate C
for cem
2Y10 b
ndix C. Con
(a) C
(b) F
C1 Beam Al
ment, fine ag
bars.
ncrete beams
Cracks patter
Final cracks
ltConc1-2-4.
ggregates an
13
s crack patt
rn during test
pattern at ul
. Beam utilis
nd course agg
37
terns
ting
ltimate load
sing alternati
gregates, res
ive concrete
spectively an
of mix ratio
nd reinforced
1:2:4
d with
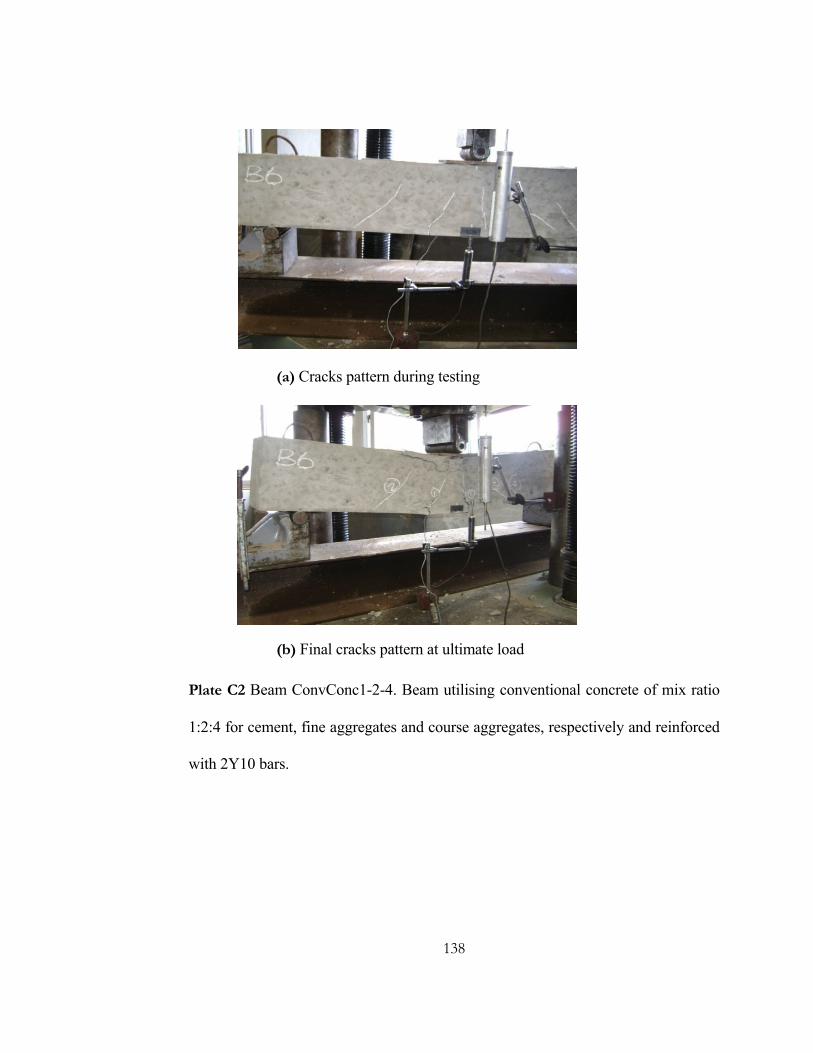
138
(a) Cracks pattern during testing
(b) Final cracks pattern at ultimate load
Plate C2 Beam ConvConc1-2-4. Beam utilising conventional concrete of mix ratio
1:2:4 for cement, fine aggregates and course aggregates, respectively and reinforced
with 2Y10 bars.
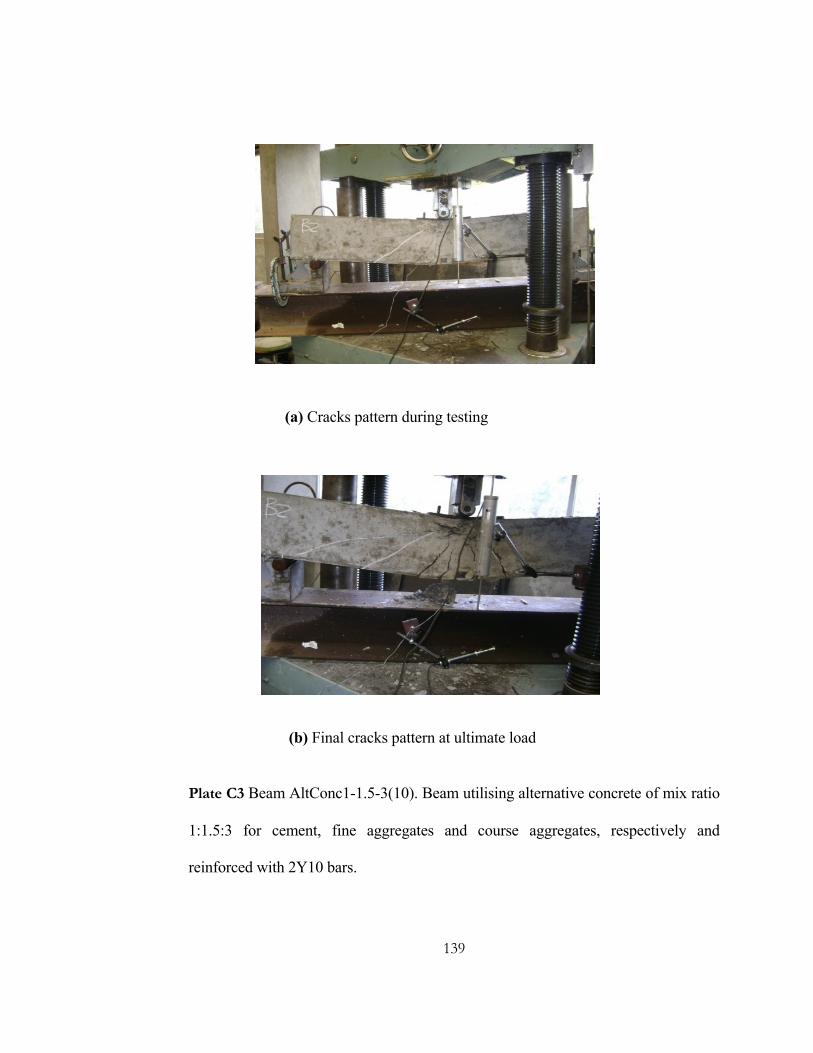
139
(a) Cracks pattern during testing
(b) Final cracks pattern at ultimate load
Plate C3 Beam AltConc1-1.5-3(10). Beam utilising alternative concrete of mix ratio
1:1.5:3 for cement, fine aggregates and course aggregates, respectively and
reinforced with 2Y10 bars.

140
(a) Cracks pattern during testing
(b) Final cracks pattern at ultimate load
Plate C4 Beam ConvConc1-1.5-3(10). Beam utilising conventional concrete of mix
ratio 1:1.5:3 for cement, fine aggregates and course aggregates, respectively and
reinforced with 2Y10 bars.
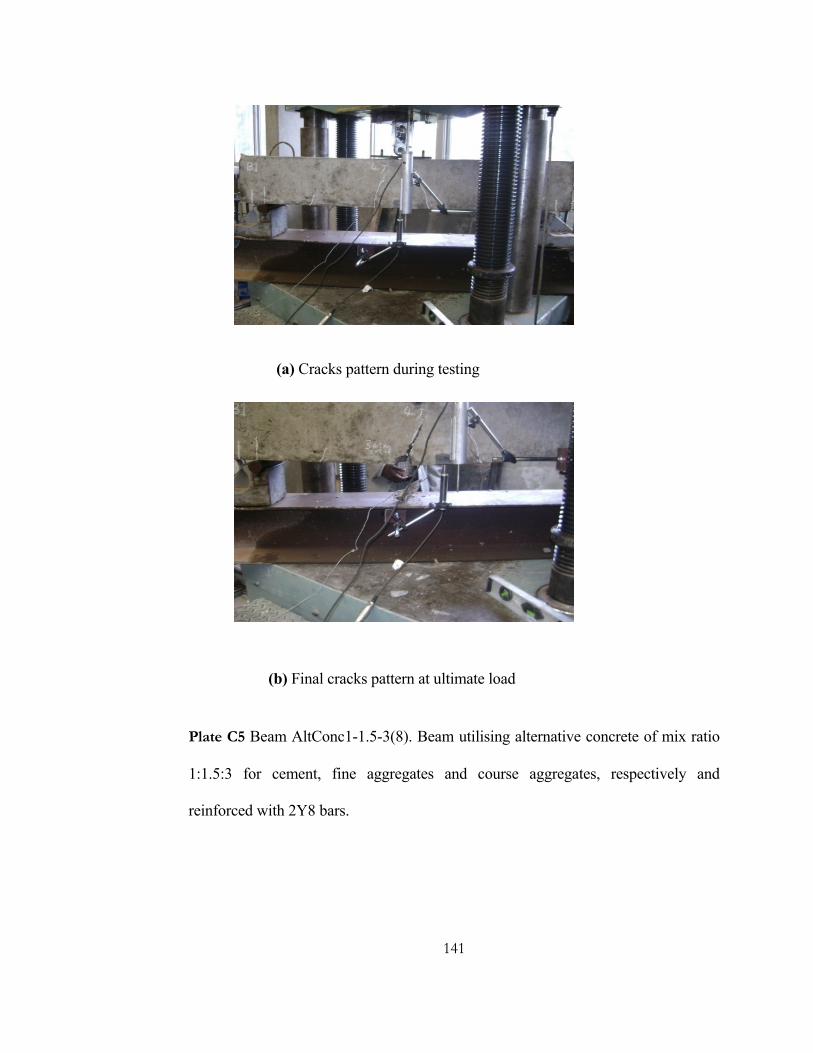
141
(a) Cracks pattern during testing
(b) Final cracks pattern at ultimate load
Plate C5 Beam AltConc1-1.5-3(8). Beam utilising alternative concrete of mix ratio
1:1.5:3 for cement, fine aggregates and course aggregates, respectively and
reinforced with 2Y8 bars.

142
(a) Cracks pattern during testing
(b) Final cracks pattern at ultimate load
Plate C6 Beam ConvConc1-1.5-3(8). Beam utilising conventional concrete of mix
ratio 1:1.5:3 for cement, fine aggregates and course aggregates, respectively and
reinforced with 2Y8 bars.

143
(a) Cracks pattern during testing
(b) Final cracks pattern at ultimate load
Plate C7 Beam AltConc1-1-2. Beam utilising alternative concrete of mix ratio 1:1:2
for cement, fine aggregates and course aggregates, respectively and reinforced with
2Y10 bars.

144
(a) Cracks pattern during testing
(b) Final cracks pattern at ultimate load
Plate C8 Beam ConvConc1-1-2. Beam utilising conventional concrete of mix ratio
1:1:2 for cement, fine aggregates and course aggregates, respectively and reinforced
with 2Y10 bars.

145

4

4

4


![RECYCLED CONSTRUCTION AND DEMOLITION MATERIALS IN … · Reference [27] conducted a research on using marble and andesite quarry wastes in asphalt pavements. Test results implied](https://img.pdfslide.net/doc/110x75/5e1c143dfbe234038045b91e/recycled-construction-and-demolition-materials-in-reference-27-conducted-a-research.jpg)