Embed Size (px)
Citation preview
Latin America Macroeconomic OutlookA Global Perspective
Macroeconomic Vulnerabilities in an Uncertain WorldOne Region Three Latin Americas
SePteMber 2014
ernesto talvi
Latin America Macroeconomic OutlookA Global Perspective
Macroeconomic Vulnerabilities in an Uncertain WorldOne Region Three Latin Americas
ErnEsto talvi
Nonresident Senior Fellow and Director
brookings Global-CereS economic and Social Policy in Latin America Initiative
sEptEmbEr 2014
brookings Global-CErEs Economic and social policy in latin america initiative (Espla)
brookings Global-CereS economic and Social Policy in Latin America Initiative
Latin America Macroeconomic Outlook A Global Perspective
Acknowledgements iii
executive Summary iv
I Growth Phases 2004-2014 boom and Cooling-Off in Latin America 1
II the Global Outlook and Its Implications for Latin America 6
box I What if tail risks Materialize 11
box II Why is Mexico Different 12
III Key Macroeconomic Challenges for Latin America 13
International Liquidity Vulnerability 14
Inflation Vulnerability 16
Fiscal Vulnerability 19
banking Vulnerability 22
box III Latin Americarsquos bank Soundness Under Stress 26
IV Overall Macroeconomic Vulnerability One region three Latin Americas 27
V Final thoughts and Policy Challenges 29
references 31
Appendix I external Factors Model for Latin America 33
Appendix II Public Debt Dynamics in Latin America 35
Appendix III A Simple Mortgage Model of Nonperforming Loans 38
C o n t E n t s
this report was written with the invaluable collaboration of my colleague Guillermo Vuletin fellow at the brookings Global-CereS economic amp Social Policy in Latin America Initiative (eSPLA) and the support and outstanding job of the very talented team of CereS research associatesmdashSantiago Garciacutea da rosa rafael Guntin and rafael Xaviermdashand research assistantsmdashFederico Ganz and Mercedes Cejas to all of them my deepest appreciation for their dedication their technical skills and for our insightful discussions during the preparation of this report
I would also like express my appreciation to Christina Golubski for her excellent editing and for overseeing the production of this report Last but not least Julia ruiz research assistant at eSPLA did a wonderful job in proofreading the final version of the report and also provided very valuable comments
ernesto talvi
aC k n o w l E d G E m E n t s
brookings Global-CereS economic and Social Policy in Latin America Initiative iii
Depending on the vantage point Latin America could be seen as either one two or three regions From a business cycle perspective it could be thought of as a single region From the ease of access to inter-national financial markets and multilateral financing perspective Latin America could be thought of as two different regions one with full access and the other with limited access From a macroeconom-ic vulnerability perspective the region should be thought of as three distinct regions with three very different sets of policy challenges In light of these complexities this report intends to characterize and understand both the similarities and the heteroge-neities among countries in the region
The Business Cycle
During the previous decade Latin America (LAC-7) displayed a period of uninterrupted growth with the sole exception of the post-Lehman crisis year1 Yet two very distinct growth phases immediately catch the eye between 2004 and 2011mdashexcluding the temporary interruption following the Lehman crisismdashLAC-7 countries grew at an average of 61 percent per year substantially above the historical average of 37 percent since the early 1990s However since 2012 growth rates cooled off significantly and now the region is expected to grow at a meager 2 percent in 2014 this pattern of expansion and deceleration was to a greater or lesser extent displayed by ev-ery country in the region with Venezuela Argentina and brazil experiencing the largest growth reversals and Mexico the smallest
What lies behind Latin Americarsquos cycle of boom and subsequently sharp deceleration the striking pat-tern of co-movement in the regionrsquos economic fluc-tuations points to the relevance of external factors this report develops an empirical model that focuses on the role of external factors in explaining output fluctuations in Latin America these factors include growth rates in advanced economies growth rates in China prices of the commodities that LAC-7 both produces and exports and the cost of international financing for emerging economies Containing very few external factors this model does surprisingly well in tracking LAC-7rsquos output performance and ac-counts for more than 65 percent of output fluctua-tions in the region It also can mimic both the boom and cooling-off periods with digital precision
The New Global Context
thus no attempt to assess the regionrsquos macroeco-nomic outlook can be made without first assessing the outlook for the key external drivers of Latin Amer-icarsquos business cycle Although global risks are not in short supply this report rules out the occurrence of extreme events the possibility that US interest rates might rise more sharply and abruptly than ex-pected the fragility of the recovery in the eurozone once again triggering concerns about the viability of the euro property prices collapsing in China and leading to financial distress and a severe decline in growth rates or geopolitical tensions leading to a sharp increase in oil prices and a world recession
E x E C u t i v E s u m m a ry
1 LAC-7 refers to the seven largest Latin American countries namely Argentina brazil Chile Colombia Mexico Peru and Venezuela which together account for 93 percent of the regionrsquos GDP Henceforth the terms LAC-7 ldquothe regionrdquo and Latin America will be used interchangeably
Latin America Macroeconomic Outlook A Global Perspective iv
the underlying assumption of this report on the global outlook is given by current market expecta-tions on growth in advanced economies and China commodity prices and US interest rates
First the US is expected to grow at an average rate of 27 percent in 2014-2018 close to its histori-cal average of 3 percent while eurozone growth is expected to be substantially below its historical av-erage In spite of the fact that current output is still significantly below what was predicted before the financial crisis monetary policy is highly stimulative and interest rates are close to zero the eurozone is not able to replicate its historical average growth rate and the US is merely able to do so these trends point to an underlying weakness that has led many experts to start talking about ldquosecular stagna-tionrdquo as the new normal
Second the outlook for China points toward a grad-ual deceleration in growth rates due to an unsus-tainable investment-led-credit-propelled model of growth that followed the collapse in export growth after the global crisis
third the outlook for growth in advanced econo-mies and China is consistent with an expected soft-ening in commodity prices that LAC-7 countries both produce and export and a gradual increase in US interest rates leading in turn to a gradual increase in the cost of international financing for emerging markets
What does this global outlook imply for Latin Amer-ica the projections of the empirical model devel-oped for this report are consistent with the marketrsquos consensus forecast of 33 percent average growth
rate for 2014-2018 close to the regionrsquos historical average since the 1990s close to estimates of po-tential output growth of 36 percent and substan-tially below the boom period of 2004-2011the latter holds true for every Latin American economy with the notable exception of Mexico
Implications of the New Global Context Growth and Macroeconomic Vulnerabilities
After a decade of high expectations about the re-gionrsquos future the new and less complacent global context indicates a return to mediocre growth rates this reduction in the cruising speed of the region has not been innocuous Mediocre growth rates are already generating increasing social discontent as evidenced by spontaneous protests that have recently exploded in many countries in the region these protests mostly convened through social media reflect the concerns of an emerging but still vulnerable middle class that not only fears for its economic well-being but is also dissatisfied with the quality of government services and personal securi-ty this malaise is also reflected in the dramatic drop in the popularity of outgoing presidents during the cooling-off period relative to the popularity of outgo-ing presidents during the boom period
the new and less complacent global context also implies significant macroeconomic challenges for some countries in the region but good news first According to the analysis of this report the tighten-ing of the regulation and supervision of the regionrsquos banking systems during the last decade appears to have paid off As a result banks in the region are in a strong position to endure deterioration in the
brookings Global-CereS economic and Social Policy in Latin America Initiative v
global context and more adverse economic condi-tions such as rising interest rates lower commod-ity prices depreciating currencies and lower growth rates ruling out extreme events the more adverse economic conditions are not expected to result in a banking crisis in any of the major countries in the region thus from a macroeconomic perspective this time the weak link does not appear to be the banking system
the picture is more heterogeneous and less rosy for the inflation and fiscal outlook and for the strength of the international liquidity position of countries in the region Assessing overall macroeconomic vul-nerability in these three macroeconomic dimensions divides the region into three prototypical clusters
the first groupmdashChile Colombia Peru and Mex-icomdashhas full access to international markets and strong macroeconomic fundamentalsmdashie a strong international liquidity and fiscal position and a posi-tive inflation outlook
the second groupmdashArgentina and Venezuelamdashhas limited access to international financial markets and weak macroeconomic fundamentals indicating a vulnerable international liquidity and fiscal posi-tion and a negative inflation outlook
Finally Brazil can be classified as a third and in-termediate case It has full access to international financial markets but displays vulnerabilities in some macroeconomic dimensionsmdashespecially on the fiscal frontmdashthat although quantitatively distinct to those of countries with weak macroeconomic fun-damentals is not exactly aligned with the group of countries with strong fundamentals
Interestingly the growth outlook of LAC-7 countries for the five-year period of 2014-2018 according to market consensus forecasts clusters these seven countries into the same three groups previously described the first group of countries with sound macroeconomic fundamentalsmdashChile Colombia Peru and Mexicomdashare expected to perform above the LAC-7 mean forecast while the second group of countries with weak macroeconomic fundamentalsmdashArgentina and Venezuelamdashare expected to perform substantially below the LAC-7 mean forecast the growth outlook for brazil which is part of the inter-mediate group with mixed fundamentals is also be-low the LAC-7 mean growth forecast but expected perform better than Argentina and Venezuela
Policy Challenges
From a macroeconomic vulnerability perspective these three distinct groups of countries face very different sets of policy challenges For the countries with strong macroeconomic fundamentals (Chile Colombia Mexico and Peru) the key challenge is to consolidate macroeconomic stability in more try-ing times Although the task will not be easy these countries are extremely well positioned in the years to come to be considered for graduation in macro policy management
For the countries with weak macroeconomic fun-damentals the challenges are humongous As the global context becomes less friendly Argentina ur-gently needs to restore confidence to stop capital outflows and the drain on international reserves and resuscitate its ailing economy In order to do so Ar-gentina will need to normalize its relations with inter-national creditors and multilateral organizations to
Latin America Macroeconomic Outlook A Global Perspective vi
remove itself from a position of technical default and restore normal access to credit markets eliminate exchange controls and controls on capital outflows unify the exchange rate market phase out a host of other distortions of the price system (especially public utilities) make the necessary corrections to public finances to restore solvency and put an end to inflationary financing of fiscal deficits If Argentina starts moving in this direction it could start to recov-er rather rapidly from its current situation there are plenty of examples in many countries in which these kinds of apparently insurmountable problems were resolved in a relatively short period of time
the challenges for Venezuela although qualitative-ly similar to those of Argentina are many orders of magnitude larger For starters Venezuela has three official exchange rates and a much larger fiscal deficit and it is in arrears with a host of creditors except with foreign bond holders More importantly restoring confidence in Venezuela will probably take much more than just moving towards more reason-able and credible macroeconomic policies since it is the decision-making process itselfmdashVenezuelarsquos institutions governance and system of checks and balancesmdashthat has broken down
For countries with mixed macroeconomic funda-mentals such as brazil the challenge is to react in a timely fashion to correct any incipient deterioration In the case of brazil this mostly involves avoiding a rapid rise in public debt that might eventually com-promise its credit rating and lead to higher financing costs and a shortening of debt maturities this in turn would feed back into an even more accelerated rise in public debt and a further weakening in the
international liquidity position If this vicious cycle is to be avoided brazil should react sooner rather than later
the shift to a less favorable global context also means that the region cannot count on favorable external tailwinds to grow at high rates Pro-growth reforms will be needed in every country in the re-gionmdashthose with strong and weak macroeconomic fundamentalsmdashto revitalize what otherwise will be a mediocre growth performance in the years to come Mexico has recently given new impetus to the re-form process Other countries in the region must now join the fray
Although the challenges ahead appear to be huge these are exactly the times for optimism With fa-vorable tailwinds facilitating very high growth rates in the region for close to a decade the incentive to pursue politically complex and politically debili-tating macroeconomic adjustments andor reforms was low After all most countries were doing well without them
In a more adverse global context with deteriorating macroeconomic fundamentals and mediocre growth ahead of us incentives for change might improve significantly In fact it is in bad times that politically complex decisions are usually made Whether we agree or not with the policies pursued major mac-roeconomic adjustments and reforms in countries of peripheral europe are a recent testimony to that as-sertion As a famous economist once wrote it is in bad times that ldquothe politically impossible becomes politically inevitablerdquo It remains to be seen if the new crop of leaders in the region is up to the task
brookings Global-CereS economic and Social Policy in Latin America Initiative vii
During the previous decade Latin America (LAC-7) displayed a period of uninterrupted growth with the sole exception of the post-Lehman crisis year2 Yet two very distinct growth phases immediately catch the eye (see Figure 1 panel a) between 2004 and 2011 and excluding the temporary interruption fol-lowing the Lehman crisis LAC-7 countries grew at an average of 61 percent per yearmdashsubstantially above the historical average of 37 percent since the early 1990s3 However since 2012 growth rates cooled off significantly and the region is expected to grow at a meager 2 percent in 2014 this pat-tern of expansion and deceleration was to a greater or lesser extent displayed by every country in the region with Venezuela Argentina and brazil experi-encing the largest growth reversals and Mexico the smallest (see Figure 1 panel b)
What lies behind Latin Americarsquos cycle of boom and subsequently sharp deceleration the first step in providing a meaningful answer to this question is to recognize the very high degree of co-movement in economic fluctuations displayed by LAC-7 countries which suggests that common factors must be play-ing a key role in driving this phenomenon (see Figure 2 panel a)4 Moreover this co-movement underlies the usefulness of carrying out the analysis from a regional perspective Although not every country will fit the regional pattern perfectly there is a sufficient degree of commonality for the regional analysis to become a useful abstraction As we shall see in the next sections of this report either by similarity or by contrast this abstraction serves as a benchmark to gauge the behavior of individual countries
i G r o w t h p ha s E s 2 0 0 4 - 2 0 1 4 b o o m a n d C o o l i n G - o f f i n l at i n a m E r i C a
2 LAC-7 refers to the seven largest Latin American countries namely Argentina brazil Chile Colombia Mexico Peru and Venezuela which together account for 93 percent of the regionrsquos GDP Henceforth the terms LAC-7 ldquothe regionrdquo and Latin America will be used interchangeably3 the average growth rate for LAC-7 is calculated using the simple average instead of a weighted average to avoid over-representing larger economies the goal is to assess the performance of the average Latin American country4 the high degree of co-movement in economic fluctuations among LAC-7 countries is strongly supported by a battery of statistical tests First the principal component analysis shows that a single principal component or underlying factor behind LAC-7 countriesrsquo growth rates explains about 45 percent of total variance If the second principal component is also included such variance explanation would increase up to 65 percent the fact that two components can explain 65 percent of total variance provides strong evidence that LAC-7 countries to a very large extent display a common pattern in growth performance A similar pattern emerges if pairwise correlations are calculated For example using the Spearman correlation test more than 80 percent of LAC-7 countriesrsquo growth rate correlations are statistically significantly different from zero at a 5 percent confidence level
Latin America Macroeconomic Outlook A Global Perspective 1
b Country Growth rates(Annual GDP Growth)
69
4347 49
27
6865
1116
41 44
25
54
17
0
1
2
3
4
5
6
7
8
Argentina Brazil Chile Colombia Mexico Peru Venezuela
b Country Growth Rates(Annual GDP growth)
2004-2011
2012-2014
Notes LAC-7 is the simple average of Argentina brazil Chile Colombia Mexico Peru and Venezuela which account for 93 percent of Latin Americarsquos GDP Data sources National statistics and Focuseconomics for 2014
brookings Global-CereS economic and Social Policy in Latin America Initiative 2
Figure 1 Growth Phases in Latin America 2004-2014
a regional Growth rates(LAC-7 annual GDP growth)
78
6268 67
45
-10
55 55
3930
20
-2
-1
0
1
2
3
4
5
6
7
8
9
2004 2005 2006 2007 2008 2009 2010 2011 2012 2013 2014
a Regional Growth Rates(LAC-7 annual GDP growth)
53 302004-2011 2012-2014
Figure 2 Latin Americarsquos business Cycle the role of external Factors
a Growth rate Co-movement(Quarterly real GDP year-over-year growth rate)
-20
-15
-10
-5
0
5
10
15
1991
1992
1993
1994
1995
1996
1997
1998
1999
2000
2001
2002
2003
2004
2005
2006
2007
2008
2009
2010
2011
2012
2013
2014
a Growth Rate Comovement(Quarterly real GDP year-over-year growth rate)
LAC-7 (FPC)
LAC-7
LAC-7 Individual Countries
b Observed and Predicted Growth rates in Latin America(LAC-7 real GDP annual growth rate)
-4
-2
0
2
4
6
8
1992
1993
1994
1995
1996
1997
1998
1999
2000
2001
2002
2003
2004
2005
2006
2007
2008
2009
2010
2011
2012
2013
b Observed and Predicted Latin America Growth Rates(LAC-7 real GDP annual growth rate)
Observed Predicted by External Factors Model
Lehmans BankruptcyDot-Com CrisisRussian Crisis
Notes LAC-7 is calculated using the simple average of Argentina brazil Chile Colombia Mexico Peru and Venezuela which account for 93 percent of Latin Americarsquos GDP the First Principal Component (FPC) for LAC-7 countries is estimated using each countryrsquos year-over-year growth rate In panel b predicted GDP growth corresponds to the external Factors Model prediction using the observed external factors from Q11991 to Q12014 For details of the LAC-7 external Factors Model methodology see Appendix IData sources National statistics IMF World economic Outlook bloomberg and own calculations
Latin America Macroeconomic Outlook A Global Perspective 3
the second step is to identify the prime suspect be-hind the high degree of commonality in economic fluctuations displayed by LAC-7 countries In the ear-ly 1990s a seminal paper by Calvo Leiderman and reinhart (1993) later expanded in various dimen-sions by Izquierdo romero and talvi (2008) points to the relevance of external factors in accounting for macroeconomic performance in the region
In this report we develop an empirical model that focuses on the role of external factors in explaining output fluctuations in Latin America5 these factors include growth rates in advanced economies growth rates in China prices of the commodities that LAC-7 both produces and exports and the cost of interna-tional financing for emerging economies6 Contain-ing very few external factors this model does sur-prisingly well in tracking LAC-7 output performance and accounts for more than 65 percent of output fluctuations in the region (see Figure 2 panel b)
to further understand the crucial role played by ex-ternal factors we look behind the scenes and display the dynamics of the key external drivers for the two relevant time periods During the expansion phase 2004-2011 global growth accelerated mostly due to a sharp acceleration in Chinarsquos growth relative to the preceding period of 1998-2003 (see Figure 3 panel a) Commodity prices rose both continuously and exponentially and almost quadrupled during the expansion phase (see Figure 3 panel b) the cost of international financing declined both continuously and significantly from an average of 131 percent in 1998-2003 to an average of 71 percent in 2004-2011 as a consequence of the decline in world inter-est rates and risk premiums for emerging markets (see Figure 3 panel c)
5 the model is an extension of Izquierdo romero and talvi (2008) and very closely follows its methodology See Appendix I for a detailed description of the empirical model6 As measured by JP Morganrsquos emerging Market bond Index Plus (eMbI+)
Figure 3 external Drivers of Output Fluctuations in Latin America 1998-2014
b Primary Commodity Prices(All commodities Avg 1998-2003 = 100)
33
40
33
00
05
10
15
20
25
30
35
40
45
1998-03 2004-11 2012-14
3a World Growth Rates(Annual GDP growth PPP weighted)
50
100
150
200
250
300
350
400
450
1998
2000
2002
2004
2006
2008
2010
2012
2014
3b Primary Commodity Prices(All commodities Avg1998-2003 = 100)
c International Financing Costs(eMbI+ yield)
0
5
10
15
20
25
1998
2000
2002
2004
2006
2008
2010
2012
2014
3c International Financing Costs
(EMBI+ yield)
Notes World refers to the Purchasing Power Parity weighted average of all countries as defined by the IMFrsquos World economic Outlook Primary Commodity Prices refers to the IMFrsquos all commodities index eMbI+ refers to JP Morganrsquos emerging Markets bond Index PlusData sources IMF World economic Outlook IMF Primary Commodity Prices bloomberg and Federal reserve
a World Growth rates(Annual GDP growth PPP weighted)
brookings Global-CereS economic and Social Policy in Latin America Initiative 4
In contrast during the cooling-off phase 2012-2014 global growth decelerated back to the 1998-2003 levels mainly due to a sharp deceleration in Chinarsquos growth rates which was barely compensated for by an anemic recovery in advanced economies follow-ing the financial crisis most notably in the eU (see Figure 3 panel a) Commodity prices also ceased to increase and actually declined slightly in 2012-2014 albeit still maintaining relatively high levels (see Figure 3 panel b) International financing costs for emerging economies continued to decline until the US Federal reserversquos tapering announcement in May 2013 when financing costs interrupted a decade-long decline and gradually started to edge
up although still remaining at historically low levels (see Figure 3 panel c) the combination of slower global growth commodity prices that still remained high but had ceased their skyrocketing rise and international financing costs that remained low but interrupted their marked decline are enough to ex-plain the sharp cooling-off in growth rates that the region experienced in 2012-20147
to summarize external factors played a crucial role in explaining economic performance in the region and no attempt to assess the regionrsquos macroeco-nomic outlook can be made without first assessing the outlook for the key external drivers
Latin America Macroeconomic Outlook A Global Perspective 5
7 See talvi and Munyo (2013) for an in-depth discussion on the changes in the external environment and the end of the boom period for Latin America
8 For a fascinating discussion on secular stagnation see teulings and baldwin (2014)
Global risks are not in short supply Concerns about the possibility that US interest rates might rise more sharply and abruptly than expected uneasiness about the fragility of the recovery in the eurozone and even the viability of the euro fears that property prices might collapse in China leading to financial distress and a severe decline in growth rates or that geopolitical tensions might trigger a sharp increase in oil prices and a world recession are all part of the everyday financial news landscape For the sake of this report however we rule out the occurrence of these extreme events Should any of them material-ize the impact on Latin America would be severe (see box I)
this reportrsquos underlying assumption on the global outlook is given by current market expectations on growth in advanced economies growth in China
commodity prices and US interest rates for the 2014-2018 five-year period
Let us begin with the outlook for advanced econo-mies In 2014-2018 the US is expected to grow close to its historical average while eurozone growth is expected to perform substantially below its historical average (see Figure 4 panels a and b) In spite of the fact that current output is still signifi-cantly below what was predicted before the finan-cial crisis monetary policy is highly stimulative and interest rates are close to zero the eurozone is not able to replicate its historical average growth rate and the US is merely able to do so these trends point to an underlying weakness that has led many experts to start talking about ldquosecular stagnationrdquo as the new normal8
i i t h E G l o ba l o u t l o o k a n d i t s i m p l i C at i o n s f o r l at i n a m E r i C a
brookings Global-CereS economic and Social Policy in Latin America Initiative 6
Figure 4 the Global Outlook 2014-2018
b economic Activity in europe(eA-17 annual GDP growth and forecasts)
00
05
10
15
20
25
30
35
40
2010
2011
2012
2013
2014
2015
2016
2017
2018
4a Economic Activity in the US(Annual GDP growth and forecasts)
Historical Average30
-10
-05
00
05
10
15
20
25
2010
2011
2012
2013
2014
2015
2016
2017
2018
4b Economic Activity in Europe
Historical Average23
c economic Activity in China(Annual GDP growth and forecasts)
0
2
4
6
8
10
12
2010
2011
2012
2013
2014
2015
2016
2017
2018
4c Economic Activity in China(Annual GDP growth and
forecasts)
Historical Average105
Notes Forecasts for US real GDP are obtained from the Congressional budget Office Forecasts for the euro area and China GDP are obtained from the IMFrsquos World economic Outlook Primary Commodity Prices refers to the IMFrsquos all commodities index eMbI+ refers to JP Morganrsquos emerging Markets bond Index Plus eMbI+ forecasts are based on US 10-year treasury yields forecasts by the Cleveland Federal reserve Survey of Professional Forecasters and own calculations Data sources Congressional budget Office IMF World economic Outlook IMF Primary Commodity Prices bloomberg Federal reserve and Cleveland Federal reserve Survey of Professional Forecasters
d Primary Commodity Prices(All commodities actual prices and forecasts Jan-04 = 100)
90
140
190
240
290
340
2004
2006
2008
2010
2012
2014
2016
2018
4d Primary Commodity Prices(All commodities and forecasts
Jan-04 = 100)
e International Financing Costs(eMbI+ yield and forecasts)
2016
2018
3
4
5
6
7
8
9
10
11
2004
2006
2008
2010
2012
2014
4e International Financing Costs
(EMBI+ yield and forecasts)
a economic Activity in the US(Annual GDP growth and forecasts)
Latin America Macroeconomic Outlook A Global Perspective 7
the outlook for China points toward a gradual de-celeration in growth rates (see Figure 4 panel c) the export-led supersonic growth rates displayed by China prior to the outbreak of the financial cri-sis in the US and europe in 20072008 gave way to an increasingly investment-led-credit-propelled growth Since 2008 investment rose from 42 per-cent to 50 percent of GDP and bank credit almost doubled from 130 percent to 233 percent of GDP Moreover the size of the shadow banking system multiplied by seven and now represents around 30 percent of the banking system the quality of invest-ment projects has been questionable as it led to overcapacity in the real estate sector and a surge in spending by local governments in ambitious but in many cases low-productivity infrastructure projects Such a policy of financing questionable investment projects cannot continue indefinitely without com-promising the health of the financial system even-tually this investment-led-credit-propelled growth model must come to an end leading sooner or later to a contraction in credit flows and in the best case scenario to the gradual deceleration in growth rates that markets currently expect9
the outlook for growth in advanced economies and China described above is consistent with an ex-pected softening in commodity prices (see Figure 4 panel d) and only a gradual increase in US interest rates leading in turn to a gradual increase in the cost of international financing for emerging markets (see Figure 4 panel e)
What does this global outlook imply for Latin Ameri-ca Plugging in these inputs into the empirical model developed in this report LAC-7 output is forecasted
to grow at an average rate of 32 percent for the period 2014-2018 this is consistent with the market consensus forecast of 33 percent for the same pe-riod (see Figure 5 and Figure 6 panel a) the region is thus expected to grow at a rate that is close to its historical average since the 1990s close to esti-mates of potential output growth of 36 percent and substantially below the boom period 2004-201110 the latter holds true for every Latin American econ-omy with the notable exception of Mexico (see Fig-ure 6 panel b and box II)
9 See CLAAF (2014) for an excellent discussion of the outlook for China and its implications for Latin America10 Potential output growth of 36 percent represents the mid-range estimation for the average of brazil Chile Colombia Mexico Peru and Venezuela based on calculations by Sosa tsounta and Kim (2013)
Figure 5 Forecast of economic Activity for Latin America
(LAC-7 real GDP annual index Dec-13 = 100)
Notes the Model Forecasts are those of the external Factors Model assuming external factors evolve according to market expectations For details of the external Factor Model see Appendix I the consensus forecast is calculated using Focuseconomics data and the consensus forecast spectrum is constructed using the standard deviation of individual forecastersrsquo data for each LAC-7 countryData sources Own calculations based on national statistics IMF World economic Outlook Cleveland Federal reserve Survey of Professional Forecasters and Focuseconomics
98
103
108
113
118
123
2013 2014 2015 2016 2017 2018
(LAC-7 real GDP last 4 quarters index Dec-2013 = 100)
Forecast Spectrum
Model Forecast
Consensus Forecast
Consensus Forecast
Model Forecast
Average Growth2014-2018 33 32
brookings Global-CereS economic and Social Policy in Latin America Initiative 8
Figure 6 Growth Forecasts for Latin America 2014-2018
a regional Growth rates(LAC-7 annual GDP growth)
b Country Growth rates(Annual GDP growth)
Note LAC-7 is the simple average of Argentina brazil Chile Colombia Mexico Peru and Venezuela which account for 93 percent of Latin Americarsquos GDPData sources National statistics and Focuseconomics for forecasts
78
6268 67
45
-10
55 55
3930
20
3136 39 40
-2
-1
0
1
2
3
4
5
6
7
8
920
04
2005
2006
2007
2008
2009
2010
2011
2012
2013
2014
2015
2016
2017
2018
a Regional Growth Rates(LAC-7 annual GDP growth)
53 332014-20182004-2011
69
4347 49
27
6865
20 22
4047
37
54
13
0
1
2
3
4
5
6
7
8
Argentina Brazil Chile Colombia Mexico Peru Venezuela
b Country Growth Rates(Annual GDP growth)
2004-2011
2014-2018
Latin America Macroeconomic Outlook A Global Perspective 9
In summary in a global context in which adverse ex-treme events are ruled out by design and although not as complacent as it was during 2004-2011 still relatively benevolent Latin Americarsquos growth rates are expected to be rather mediocre the return to lackluster growth rates after a decade of high growth and rising expectations has not been innocuous Me-diocre growth rates are already generating increas-ing social discontent as evidenced by spontaneous protests that exploded in many countries in the re-gion these protests mostly convened through so-cial media reflect the concerns of an emerging but still vulnerable middle class that not only fears for its economic well-being but is also dissatisfied with the quality of government services and personal se-curity
this malaise is also reflected in the drop in the popularity of outgoing presidents during the cool-ing-off period relative to the popularity of outgoing presidents during the boom period During the boom period Chilersquos Michelle bachelet brazilrsquos Lula da Silva Colombiarsquos Alvaro Uribe and Argentinarsquos Cristina Fernaacutendez de Kirchner ended their terms with approval ratings of 80 75 70 and 64 percent respectively In contrast during the cooling-off pe-riod Chilersquos Joseacute Pintildeera Colombiarsquos Juan Manuel Santos brazilrsquos Dilma rousseff and Argentinarsquos Cristina Fernaacutendez de Kirchner II finished or are finishing their terms with approval ratings between 24 and 40 percentage points below those of their predecessors during the bonanza (see table 1)11
table 1 Latin Americarsquos Presidential Approval ratings at the end of the term
(LAC-7 Countries)
ArgentinabrazilChileColombia
boom Period Presidents(2004-2011)
Cristina Fernaacutendez 64Luiz Inaacutecio Lula Da Silva 75Michelle bachelet 80Aacutelvaro Uribe 70
Cooling-Off Period Presidents(2012-2015)
Cristina Fernaacutendez 32Dilma rousseff 35Sebastiaacuten Pintildeera 50Juan Manuel Santos 46
Change
-32-40-30-24
Notes LAC-7 refers to Argentina brazil Chile Colombia Mexico Peru and Venezuela boom Period Presidents refers to presidents that ended their terms during 2004-2011 Cooling-Off Period Presidents refers to presidents that ended or will end their term during 2012-2015 Data sources National polls
11 See talvi and trinkunas (2013)
brookings Global-CereS economic and Social Policy in Latin America Initiative 10
box i what if tail risks materialize
In order to assess the impact of the materialization of one of the many possible tail risks on Latin Amer-ica we analyze the impact of a severe and permanent slowdown in Chinarsquos growth rate falling abruptly from its current levels of 75 percent to 4 percent
to simulate the impact on LAC-7 growth rates we make use of the external Factors Model of Output Fluc-tuations in Latin America described in Appendix I Figure bI1 shows the results of the simulation should a severe and permanent slowdown in China materialize Growth rates in Latin America would decline from an expected 35 percent (the model forecast in the absence of tail risks) to 23 percent for the period 2015-2018 with an output gap (with respect to the model forecast) of -52 percent in 2018 this is due mainly to the direct impact of Chinarsquos slowdown and the indirect impact of declining commodity prices
the reassessment of risk for Latin America could be significant if a severe slowdown in China material-izes this reassessment is not fully captured by the interactions in the external Factors Model thus for the purpose of simulating the joint impact of a severe slowdown in China together with a severe albeit temporary increase in risk we assume the previous slowdown in Chinarsquos growth rate together with an average increase of eMbI+ spreads by 500 bps in the first year that dissipates after two years Figure bI1 shows that the joint impact will result in a major slowdown in growth rates in Latin America to 17 percent for the 2015-2018 period with an output gap of -72 percent in 2018
Notes the Model Forecast is that of the external Factors Model assuming external factors evolve according to market expectations Chinarsquos Severe Slowdown represents a permanent shock to Chinarsquos growth rate slowing down from current levels to a 4 percent rate the combined shock corresponds to a combination of a China Severe Slowdown shock with a reassessment of risk that produces an average increase of eMbI+ spreads of 500 bps in the first year that dissipates after two years All shocks are assumed to materialize in 2015 Data sources Own calculations based on national statistics IMF World economic Outlook and Cleveland Federal reserve Survey of Professional Forecasters
Figure bI1 tail risks and economic Performance in Latin America
b Growth Level Forecasts 2015-2018(LAC-7 real annual GDP growth)
98
103
108
113
118
2013 2014 2015 2016 2017 2018
BIa Impact on Latin Americas Output Performance
China Severe Slowdown
China Severe Slowdown + Reassessment of Risk
Model Forecast
35
23
17
00
05
10
15
20
25
30
35
40
Model Forecast China Severe Slowdown China Severe Slowdown +Reassessment of Risk
BIb Impact on Latin Americas Growth Forecast 2015
Tail Risks
a Output Level Forecasts 2015-2018(LAC-7 real GDP last 4 quarters index Dec-2013 = 100)
Latin America Macroeconomic Outlook A Global Perspective 11
box ii why is mexico different
In contrast to the rest of the LAC-7 countries Mexico is very closely interconnected with the US econ-omy through trade foreign direct investment and remittances (see Figure bII1 panels a-c) As a con-sequence of that dependence Mexico suffered the greatest adverse impact in the aftermath of the US financial crisis Mexicorsquos economy contracted by 47 percent in 2009 while the rest of the LAC-7 econo-mies contracted by an average 03 percent Moreover Mexico is the smallest net commodity exporter among LAC-7 countries (see Figure bII1 panel d) and thus was bound to benefit to a lesser extent from the commodity price boom that was only temporarily interrupted by the Lehman crisis In fact for the whole boom period Mexico displayed the slowest growth rate among LAC-7 countries12
Notes FDI refers to gross inflows FDI data for brazil is for the year 2009 due to lack of data Venezuela is excluded from panel b due to lack of data of FDI inflows by origin Net Commodity exports is the difference between exports and imports of commoditiesData sources World bank World Integrated trade Solution World bank and national statistics
As the global context shifts towards higher growth in the US lower growth in China and lower commodity prices all the external factors that adversely affected Mexicorsquos economy in the aftermath of the Lehman crisis will start working in its favor As a result Mexico is the only LAC-7 country expected to perform better in the 2014-2018 period than during the boom period 2004-2011
Figure bII1 Mexicorsquos exposure to the United States
b Foreign Direct Investment from US( of total FDI 2012)
c remittances from US( of total remittances 2012)
789
423
318
178127 103
56
0
10
20
30
40
50
60
70
80
90
Mex
ico
Ven
ezue
la
Col
ombi
a
Per
u
Chi
le
Bra
zil
Arg
entin
a
a Exports of Goods to United States( of total exports 2013)
493
227
164 160 140
0
10
20
30
40
50
60
Mex
ico
Chi
le
Col
ombi
a
Bra
zil
Per
u
b Foreign Direct Investment from United States( of total FDI 2012)
982
389 353 324265
183 159
0102030405060708090
100
Mex
ico
Per
u
Ven
ezue
la
Col
ombi
a
Bra
zil
Arg
entin
a
Chi
le
Remittances from United States( of total remittances 2012)
d Net Commodity exports( of GDP 2013)
175
99 95
7257
3917
02468
101214161820
Ven
ezue
la
Per
u
Col
ombi
a
Chi
le
Arg
entin
a
Bra
zil
Mex
ico
b Net Commodity Exports( of GDP 2013)
a exports of Goods to US( of total exports of goods)
12 this holds true even without considering the 2009 contraction
brookings Global-CereS economic and Social Policy in Latin America Initiative 12
even in a less complacent but still relatively benevo-lent global context some countries in the region face significant macroeconomic challenges Others how-ever display a surprisingly strong macroeconomic position revealing an important heterogeneity that we intend to both characterize and understand be-low
to characterize this heterogeneity we separate the countries in the region in two categories that will prove to be extremely useful as an analytical device countries with (i) full access and (ii) limited
access to international capital markets and multilat-eral financing the first group is composed of bra-zil Chile Colombia Mexico and Peru (henceforth LAC-5) International financing costs in US dollars for this group of countries varies between a low of 38 percent for Chile and a high of 46 percent for brazil the second group is composed of Argentina and Venezuela with significantly and consistently higher international financing costs in US dollars of 9 percent and 12 percent respectively (see Figure 7 panels a and b)
i i i k E y m aC r o E C o n o m i C C ha l l E n G E s f o r l at i n a m E r i C a
Figure 7 International Financing Costs for Latin America
b Current Sovereign bond Yields(eMbI yields avg Jul-14)
Notes eMbI refers to JP Morganrsquos emerging Markets bond Index Full Access countries are defined as those with normal access to international financial markets and multilateral financing Limited Access countries are defined as those with virtually no access to international financial markets and multilateral financingData source bloomberg
Argentina
Brazil | Colombia | Peru | Mexico | Chile
Venezuela
0
2
4
6
8
10
12
14
16
18
20
Jan-
10
Jul-1
0
Jan-
11
Jul-1
1
Jan-
12
Jul-1
2
Jan-
13
Jul-1
3
Jan-
14
Jul-1
4
7a Evolution of Sovereign Bond Yields
Limited Access
Full Access
38 40 40 4046
91
118
0
2
4
6
8
10
12
14
Chi
le
Mex
ico
Per
u
Col
ombi
a
Bra
zil
Arg
entin
a
Ven
ezue
la
7b Current Sovereign Bond Yields
Limited AccessFull Access
a evolution of Sovereign bond Yields(Daily eMbI yields)
Latin America Macroeconomic Outlook A Global Perspective 13
With this characterization in mind we will assess the vulnerability of macroeconomic fundamentals in four dimensions (i) international liquidity (ii) infla-tion (iii) public finances and (iv) banking
International Liquidity Vulnerability
Since the beginning of the cooling-off period in mid-2011 there has been a sharp contrast in the be-
havior of international reserves between countries with full access and those with limited access to international financial markets While international reserves have continued to rise albeit at a slower pace in LAC-5 countries they have declined very significantly in Argentina and Venezuela (see Figure 8 panels a and b)
Figure 8 Cooling-Off Phase and International reserves in Latin America(International reserves millions of US$)
b Countries with Limited Accessto International Financial Markets
Argentina Venezuela
Note LAC-5 refers to the sum of the stock of international reserves of brazil Chile Colombia Mexico and PeruData sources National statistics
LAC-
500000
550000
600000
650000
700000
750000
Jan-
11
Jul-1
1
Jan-
12
Jul-1
2
Jan-
13
Jul-1
3
Jan-
14
5Ja
n-12
Jul-1
2
Jan-
13
Jul-1
3
Jan-
14
20000
25000
30000
35000
40000
45000
50000
55000
Jan-
11
Jul-1
1
Argentina
a Countries with Full Accessto International Financial Markets
LAC-5
17000
19000
21000
23000
25000
27000
29000
31000
33000
Jan-
11
Jul-1
1
Jan-
12
Jul-1
2
Jan-
13
Jul-1
3
Jan-
14
Venezuela
Given the recent pattern of behavior of international reserves we assess the strength of the internation-al liquidity position for both these groups of coun-tries Doing so is a particularly important piece of the puzzle in identifying macroeconomic vulnerabili-ties recurrent episodes of international financial turbulence have often resulted in sharp reversals of capital flows to emerging economies and in se-
rious disruptions in capital markets that prevented the normal rollover of maturing debt A strong liquid-ity position is an effective cushion to weather these episodes and prevent financial distress
to evaluate the strength of the international liquid-ity position of every LAC-7 country we compute an International Liquidity ratio (ILr) using a modified
brookings Global-CereS economic and Social Policy in Latin America Initiative 14
version of the Guidotti-Greenspan rule13 the ILr is defined as the ratio of short-term debt obligations of the public sectormdashboth domestic and external and including the stock of central bank sterilization in-strumentsmdashand short-term external debt obligations of the corporate non-financial private sector due in the next 12 months to international reserves14 An additional modification was made however We added to the international reserves of each country the already agreed ex-ante contingent credit lines and potential credit lines that could be negotiated in times of international financial turmoil with multilat-eral or regional financial institutions15 An ILr below 1 indicates a strong international liquidity position enough to cover debt repayments due in the next
year An ILr above 1 indicates a weak international liquidity position with reserves and credit lines fall-ing short of upcoming debt obligations16
Figure 9 shows computations of the ILr What emerges is that the group of LAC-5 countries with full access to international financial markets and ac-cess to multilateral financing are safely below the critical threshold of 1 and have a strong liquidity positionmdashwith the only exception of brazil which is slightly below the critical level In contrast the group of countries with limited access to international finan-cial markets has an ILR that is significantly above the critical level of 1 and has a weak liquidity position17
13 See Greenspan (1999) and Guidotti (2000) 14 See Izquierdo and talvi (2009) and talvi Munyo and Peacuterez (2012) for a detailed discussion on these liquidity measures15 For LAC-5 countries includes already negotiated contingent credit lines with the International Monetary Fund (IMF) the Inter-American Development bank CAF-Development bank of Latin America and the Latin America reserve Fund as well as the possibility of access to the IMFrsquos Flexible Credit Line up to a maximum of 1000 percent of quota16 According to the empirical literature variants of this indicator are a robust predictor of financial crises in that greater short-term exposure is associated with a larger probability of a large reversal in capital flows and a larger output contraction Moreover the probability of a crisis increases exponentially when the ratio of short-term debt to international reserves exceeds the threshold of 100 percent See for example rodrik and Velasco (1999)17 Forced rollover of certain types of public debtmdashtypically holdings of government bonds by domestic banks and pension fundsmdashcould significantly decrease these ratios Forced rollover however should be considered a policy measure and therefore should not be included in the computation of the ILr
Figure 9 International Liquidity ratio(ILr Dec-13)
Notes the ILr is calculated as the ratio of short-term domestic and external principal payments of the public sector and short-term external principal payments of the non-financial private sector due in the next 12 months to the sum of international reserves and potential credit lines from multilateral organizations A value below (above) 1 denotes a strong (weak) international liquidity positionData sources Own calculations based on national statistics IMF IADb CAF and FLAr
17
15
11
08
05 05
02
00
02
04
06
08
10
12
14
16
18
Argentina Venezuela Brazil Mexico Chile Colombia Peru
(ILR Dec-13 )
WeakPosition
StrongPosition
Latin America Macroeconomic Outlook A Global Perspective 15
In other words a heterogeneous picture arises in which some countries have very weak international liquidity positions (eg Argentina and Venezuela) while some others have extraordinarily strong li-quidity positions (eg Chile Colombia Mexico and Peru) to face a prolonged disruption in international capital markets
Inflation Vulnerability
Since the beginning of the cooling-off period in mid-2011 there has also been a sharp contrast in the behavior of inflation between countries with full ac-
cess and limited access to international financial markets While inflation has remained relatively stable and in single digits in the LAC-5 countries since the beginning of the cooling-off periodmdashalbeit not always within the target range specified by the central banksmdashit accelerated significantly in both Argentina and Venezuela reaching extremely high levels (see Figure 10 panels a and b) In fact cur-rent inflation rates range from a low of 29 percent in Colombia to a high of 64 percent in brazil in the first group while they hover around 40 percent in Argentina and 60 percent in Venezuela
Figure 10 Inflation in Latin America(CPI year-over-year change)
b Countries with Limited Accessto International Financial Markets
Argentina Venezuela
43
0
2
4
6
8
10
12
Jan-
11
Jul-1
1
Jan-
12
Jul-1
2
Jan-
13
Jul-1
3
Jan-
14
LAC -5
391
0
10
20
30
40
50
Jan-
11
Jul-1
1
Jan-
12
Jul-1
2
Jan-
13
Jul-1
3
Jan-
14Argentina
a Countries with Full Accessto International Financial Markets
LAC-5583
0
10
20
30
40
50
60
Jan-
11
Jul-1
1
Jan-
12
Jul-1
2
Jan-
13
Jul-1
3
Jan-
14
Venezuela
Notes LAC-5 is the simple average of brazil Chile Colombia Mexico and Peru Dashed lines are the median of LAC-5 central banks upper and lower bound for inflation targetersData sources National statistics and private sector estimations for Argentina
brookings Global-CereS economic and Social Policy in Latin America Initiative 16
It is worth mentioning that the group of LAC-5 coun-tries with low inflation and full access to internation-al financing have inflation targeting regimes while countries with very high inflation and limited access to international financing have monetary arrange-
ments characterized by multiple exchange rates and capital and exchange rate controls both in Argen-tina and Venezuela the gap between the official ex-change rate to the US dollar and the ldquoblack marketrdquo exchange rate is very significant (see Figure 11)
Figure 11 Multiple exchange rate regimes in Latin America(Official and black market exchange rates vis-agrave-vis the US dollar)
b Venezuela
Notes Argentinarsquos black market exchange rate refers to the ldquobluerdquo exchange rate Venezuelarsquos official exchange rate refers to the CONCeXData sources National statistics for official exchange rates Ambito Financiero for Argentinarsquos black market exchange rate and Liberal Venezolano for Venezuelarsquos black market exchange rate
Black Market
Official
0
2
4
6
8
10
12
14
Jan-
11
Apr
-11
Jul-1
1
Oct
-11
Jan-
12
Apr
-12
Jul-1
2
Oct
-12
Jan-
13
Apr
-13
Jul-1
3
Oct
-13
Jan-
14
Apr
-14
Jul-1
4
a Argentina(Official and black market exchange rates vis-agrave-
vis the US dollar)
Jul-14 Premium 50
Black Market
Official
0
10
20
30
40
50
60
70
80
90
100
Jan-
11
Apr
-11
Jul-1
1
Oct
-11
Jan-
12
Apr
-12
Jul-1
2
Oct
-12
Jan-
13
Apr
-13
Jul-1
3
Oct
-13
Jan-
14
Apr
-14
b Venezuela(Official and black market exchange rates vis-agrave-
vis the US dollar)
Jul-14 Premium 1021
a Argentina
In order to assess the inflation outlook we consider that a country has a positive outlook for inflation if it is expected to remain or fall below 4 percent in the next three years Conversely a country has a nega-tive outlook for inflation if it is expected to remain or rise above 4 percent in the next three years18
With the prior definition in mind and in order to eval-uate the inflation outlook for every LAC-7 country in a way that is comparable across countries and indi-cators we develop an Inflation Vulnerability Indica-tor (IVr) the IVr is defined as the ratio of projected inflation at the end of 2016 to a 4 percent inflation threshold An IVr below 1 indicates a positive infla-
tion outlook Conversely an IVr above 1 indicates a negative inflation outlook meaning that in the ab-sence of policy measures inflation is expected to remain high
Figure 12 panels a-c show inflation forecasts and the computations of the IVr For LAC-5 countries with full access to international financial markets inflation is on average expected to gradually de-cline below the 4 percent threshold in the next three years As a result LAC-5 countriesrsquo IVr is expected to remain below 1 with the exception of brazil which misses the mark by a relatively small margin
18 Four percent inflation represents the median of the upper target ranges set by the central banks in countries with inflation targeting regimes and single-digit inflation
Latin America Macroeconomic Outlook A Global Perspective 17
Figure 12 Inflation Outlook for Latin America(CPI year-over-year change)
b Inflation Forecast in Countries with Limited Accessto International Financial Markets
Argentina Venezuela
c Inflation Vulnerability ratio(IVr quadratic scale May-14)
0
2
4
6
8
10
12
Jan-
11
Jul-1
1
Jan-
12
Jul-1
2
Jan-
13
Jul-1
3
Jan-
14
Jul-1
4
Jan-
15
Jul-1
5
Jan-
16
Jul-1
6
LAC - 5
ForecastsObserved
0
5
10
15
20
25
30
35
40
45
50
Jan-
11
Jul-1
1
Jan-
12
Jul-1
2
Jan-
13
Jul-1
3
Jan-
14
Jul-1
4
Jan-
15
Jul-1
5
Jan-
16
Jul-1
6
Argentina
ForecastsObserved
0
10
20
30
40
50
60
Jan-
11
Jul-1
1
Jan-
12
Jul-1
2
Jan-
13
Jul-1
3
Jan-
14
Jul-1
4
Jan-
15
Jul-1
5
Jan-
16
Jul-1
6
Venezuela
ForecastsObserved
Notes LAC-5 is the simple average of brazil Chile Colombia Mexico and Peru Dashed lines in panels a and b depict the 4 percent inflation threshold IVr is defined as the ratio of projected inflation at the end of 2016 to a 4 percent inflation threshold A value below (above) 1 denotes a positive (negative) inflation outlookData sources National statistics and private sector estimations for Argentina Forecasts are obtained from Focuseconomics and econviews for Argentina
NegativeOutlook
PositiveOutlook
107
70
14
08 08 08 06
00
03
10
23
40
63
90
123
Venezuela Argentina Brazil Mexico Colombia Chile Peru
a Inflation Forecast in Countries with Full Access to International
Financial Markets
LAC-5
brookings Global-CereS economic and Social Policy in Latin America Initiative 18
In contrast in Argentina and Venezuela with limited access to international financial markets inflation is expected to remain high and well above the 4 per-cent threshold in the next three years As a result the IVr for Argentina and Venezuela is expected to be significantly above the critical level of 1
In other words once again a heterogeneous picture arises in which some countries have a very negative inflation outlook (eg Argentina and Venezuela) and face the need to make substantial policy adjust-ments while some others have an extraordinarily strong and sustained track record of very low and relatively stable inflation rates (eg Chile Colom-bia Mexico and Peru)
Fiscal Vulnerability
How vulnerable are fiscal positions in Latin Ameri-ca to the new and less complacent global context to begin to answer this question we compute the public debt dynamics for LAC-7 countries over the next 15 years for a given trajectory of primary fiscal deficits real interest rates growth rates and the real exchange rate
before presenting the public debt dynamics compu-tations one important conceptual clarification is in order For the computations of the public debt dy-namics we use gross public debt as percent of GDP as the relevant concept We acknowledge this is a contentious issue However using net public debt (by subtracting the stock of international reserves held by the central bank from gross public debt) would in
our view result in double counting Our reasoning is that interest rates on sovereign debt implicitly take into account the countryrsquos international reserve po-sition International reserves are a source of liquidity and could be used in periods of international financial turbulence to pay both interest andor amortizations coming due even if capital markets are temporarily closed to issuers by reducing default risk the stock of international liquidity affects the interest rate at which lenders are willing to provide financing to the public sector therefore it would be misleading to use net debt and at the same time to use market interest ratesmdashthat already incorporate the level of international reservesmdashto compute the debt dynam-ics to do so would de facto imply double counting the effect of international reserves If net rather than gross debt were to be considered in the computa-tion of debt dynamics then interest rates should be higher in order to account for the higher risk associ-ated with having no international reserves
Figure 13 shows the public debt dynamics computa-tions19 For the group of LAC-5 countries with full ac-cess to international financial markets public debt remains on average relatively stable In contrast Ar-gentina and Venezuela with limited access to inter-national financial markets display non-convergent public debt dynamics in spite of making heavy use of inflation tax revenues In fact while we estimate inflation tax revenues in excess of 5 percent of GDP per year for Venezuela and 25 percent of GDP for Argentina they actually hover around 02-03 per-cent of GDP for LAC-5 countries20
19 See Appendix II for details20 Inflation tax revenues are calculated as where π is the inflation rate and m is the monetary base in percent of GDP
Latin America Macroeconomic Outlook A Global Perspective 19
Figure 13 Debt Dynamics in Latin America
Notes LAC-5 is the simple average of brazil Chile Colombia Mexico and Peru Public Debt corresponds to Non-Financial Public Sector Gross Debt in percent of GDP Dashed lines depict the upper and lower bound projections For details on debt dynamics computations see Appendix IIData sources Own calculations based on national statistics and IMF World economic Outlook
0
5
10
15
20
25
30
35
40
45
50
2005
2007
2009
2011
2013
2015
2017
2019
2021
2023
2025
2027
LAC -5
33
Observed
42
Projections
0
10
20
30
40
50
60
70
80
90
2005
2007
2009
2011
2013
2015
2017
2019
2021
2023
2025
2027
Argentina
33
83ProjectionsObserved
0
20
40
60
80
100
120
140
160
180
200
2005
2007
2009
2011
2013
2015
2017
2019
2021
2023
2025
2027
Venezuela
50
184ProjectionsObserved
b Countries with Limited Access to International Financing
Argentina Venezuela
a Countries with Full Access to International Financial Markets
LAC-5
brookings Global-CereS economic and Social Policy in Latin America Initiative 20
to assess the strength of the fiscal position we will define fiscal vulnerability in a very precise way For the purposes of this report we consider a fiscally vul-nerable position as one in which public debt remains or rises above 50 percent of GDP over the next 15 years assuming inflation tax revenues are low and equal to 03 percent of GDP for every country2122
With the prior definition of fiscal vulnerability in mind and once again to evaluate the strength of the fis-cal position for every LAC-7 country in a way that is comparable across countries and indicators we de-velop a Fiscal Vulnerability ratio (FVr) the FVr is defined as the ratio of projected debt to GDP over 15 years (assuming identical inflation tax revenues for
every country) to a 50 percent debt to GDP thresh-old An FVr below 1 indicates a strong fiscal posi-tion Conversely an FVr above 1 indicates a weak fiscal position meaning that in the absence of fiscal policy measures public debt is expected to remain or to rise above 50 percent over the next 15 years
Figure 14 shows the computations of the FVr For LAC-5 countries with full access to international fi-nancial markets public debt remains comfortably below the 50 percent of GDP threshold over the next 15 years As a result LAC-5 countriesrsquo FVr is safely below the critical threshold of 1 with the notable ex-ception of brazil
21 The 50 percent debt-to-GDP threshold is based on IMF World Economic and Financial Surveys (2003) The survey finds empirical evidence that ldquothe response of primary surpluses weakens as the debt-to-GDP ratio rises in emerging market economies and this response stops altogether when debt exceeds 50 percent of GDPrdquo suggesting that the conduct of fiscal policy is not consistent with ensuring debt sustainability22 Inflation tax revenues of 03 percent of GDP are based on the revenues generated by LAC-5 countries with low and relatively stable inflation rates
Figure 14 Fiscal Vulnerability ratio(FVr quadratic scale Dec-2013)
Notes the FVr is defined as the ratio of projected debt to GDP in 15 years (assuming identical inflation tax revenues for every country) to a 50 percent debt to GDP threshold A value below (above) 1 denotes a strong (weak) fiscal position Perursquos FVr is truncated at zero since debt dynamics computations indicate that gross debt will reach 0 percent of GDP in 10 yearsData sources Own calculations based on national statistics and IMF World economic Outlook
74
27 25
10
0503
0000
03
10
23
40
63
90
Venezuela Argentina Brazil Mexico Colombia Chile Peru
StrongPosition
WeakPosition
Latin America Macroeconomic Outlook A Global Perspective 21
In contrast Argentina and Venezuela with limited access to international financial markets display non-convergent public debt dynamics with pub-lic debt expected to rise well above 50 percent of GDP over the next 15 years As a result the FVr for Argentina and Venezuela is significantly above the critical level of 1
In other words a heterogeneous picture arises in which some countries present very vulnerable fis-cal positions (eg Argentina and Venezuela) facing the need to make substantial policy adjustments to stabilize the dynamics of public debt while some others have extraordinarily strong fiscal positions (eg Chile Colombia and Peru) In the latter case countries could decide to either (i) continue to re-duce public debt and further strengthen their finan-cial position (ii) use fiscal margins to increase public spending in productivity enhancing projects andor (iii) carry out countercyclical policies if necessary
Banking Vulnerability
the indicators of bank solvency in LAC-7 countries are picture perfect After a string of banking crises debt restructurings and financial distress that the re-gion went throughmdashin the aftermath of the russianLtCM 1998 crisis the burst of the dot-com bubble in early 2001 and Argentinarsquos default in 2002 which resulted in a significant and prolonged reassess-ment of risk for emerging as well as for US cor-porate high-yield bond marketsmdashthe health of the financial system has improved very significantly due to many factors
First total public and private debt in percent of GDP for LAC-5 countries with full access to international financing is no higher than it was in 2001 and if any-thing is substantially lower in Argentina (see Figure 15 panel a) though higher than in 2001 Venezu-elarsquos total debt is the second-lowest in the region Second liability dollarization in LAC-5 countries has greatly diminished from an average of 54 percent of total debt in 2001 to 34 percent currentlymdashmaking balance sheets more resilient to abrupt exchange rate depreciation (see Figure 15 panel b) An even more pronounced de-dollarization of total debt has been observed in Argentina and although to a lesser extent de-dollarization also occurred in Venezuela
More specifically on the banking system and ac-cording to the IMF Financial Soundness Indicators nonperforming loans (NPL) are currently very lowmdashranging from a low of 07 percent in Venezuela to a high of 37 percent in Peru (see Figure 16 panel a) Loan loss provisions (LLP) are currently well above NPL and bank capital is at more than adequate lev-els in every case in excess of the basel III recom-mendations (see Figure 16 panels b and c)23 this is true for LAC-5 countries as well as for Argentina and Venezuela
brookings Global-CereS economic and Social Policy in Latin America Initiative 22
23 the basel III accord recommends that banks maintain a Capital to risk-Weighted Assets ratio of at least 8 percent See International regulatory Framework for banks (2010-2011)
Figure 15 Indebtedness and Currency Composition in Latin America
a total Debt( GDP)
b Dollarization( total debt)
Notes LAC-5 is the simple average of brazil Chile Colombia Mexico and Peru total debt is the sum of public and private debt Public debt includes domestic and external liabilities Private debt includes domestic credit to the private sector and the non-financial private sectorrsquos foreign liabilities Dollarization is defined as the ratio of total debt denominated in foreign currency to total debt Argentinarsquos total debt and dollarization figures are for the year 2000 to avoid distortions due to the bank run in 2001Data sources Own calculations based on national statistics World bank World Development Indicators and IMF World economic Outlook
94 95
52
98
7276
0
20
40
60
80
100
a Total Debt( GDP)
2001 2013LAC-5
2000 2013Argentina
2001 2013Venezuela
Limited AccessFull Access
54
92
51
34
51
41
0
10
20
30
40
50
60
70
80
90
100
b Dollarization( total debt)
2001 2013LAC-5
2000 2013Argentina
2001 2013Venezuela
Limited AccessFull Access
Latin America Macroeconomic Outlook A Global Perspective 23
Figure 16 bank Solvency Indicators for Latin America
30
19
07
00
05
10
15
20
25
30
35
LAC-5 Argentina Venezuela
a Nonperforming Loans(Nonperforming loans to total gross loans
Mar -2014)
a Nonperforming Loans(Nonperforming loans to total
gross loans Mar-14)
b Loan Loss Provisions(Loan loss provisions to total gross loans
Mar-14)
41
27 28
00
05
10
15
20
25
30
35
40
45
LAC-5 Argentina Venezuela
b Loan Loss Provisions(Loan loss provisions to total gross loans
Mar-2014)
c Capitalization(regulatory capital to risk-weighted assets
Mar-14)
Notes LAC-5 is the simple average of brazil Chile Colombia Mexico and Peru the basel III accord recommends that banks maintain a Capital to risk-Weighted Assets ratio of at least 8 percent In panel c Venezuela data refer to 2013Data sources IMF Financial Soundness Indicators basel Committee on banking Supervision and national statistics for Venezuela
152
133
156
0
2
4
6
8
10
12
14
16
LAC-5 Argentina Venezuela
c Capitalization(Regulatory Capital to Risk-Weighted Assets
Mar-2014)
Basel III Requirement
However the current picture of the banking system might give us a misleading picture of banking vulner-ability given that as previously mentioned a less fa-vorable global context and more adverse economic conditions are expected ie higher interest rates lower commodity prices exchange rate depreciation and lower growth rates
In order to assess the banking outlook we develop a banking Vulnerability ratio (bVr) defined as fol-lows the bVr is the ratio of projected nonperform-ing loans to maximum nonperforming loans
Maximum NPL is defined as the level at which LLP and bank capital are completely exhausted to es-timate projected NPL in a scenario with rising in-terest rates lower commodity prices depreciating currencies and lower growth rates we constructed a simple mortgage model and calibrated it for each of the LAC-7 countries Assuming that an average
individual borrows 25 percent of hisher permanent income in a 15-year mortgage loan we compute the indebtedness that such an individual would take if heshe assumes that the high growth rates low in-terest rates and the appreciated real exchange rates prevailing during the boom period 2004-2011 were to last for the entire duration of the loan We then compare the level of indebtedness of the latter to that of an individual with perfect foresight of future economic conditions ie a boom period followed by a cooling-off period Such a comparison gives us a simple yet instructive estimate of NPL that may develop as a consequence of an unexpected ad-verse change in economic prospects namely higher interest rates lower growth rates and a more depre-ciated currency than anticipated when the loan was originally agreed upon24
A bVr below 1 indicates a sound banking system meaning that the maximum NPL is larger than the es-
24 See Appendix III for details to estimate NPL we assume a uniform distribution between informed individuals who perfectly anticipate the change in economic conditions during the cooling-off period relative to the boom period and uninformed individuals who do not Since informed individuals can perfectly foresee the change in economic conditions they do not take on debt that exceeds 25 percent of their permanent income and consequently do not have to default Uninformed individuals are assumed to default on that part of the debt that exceeds the maximum debt acceptable when economic conditions change Maximum acceptable debt is given by the level of debt that generates a monthly mortgage payment equal to 25 percent of annual permanent income
brookings Global-CereS economic and Social Policy in Latin America Initiative 24
timated NPL and that current levels of LLP and bank capital are adequate to withstand the expected in-crease in NPL Conversely a ratio above 1 indicates a fragile banking system implying that the maximum NPL is smaller than the estimated NPL and that cur-rent levels of LLP and bank capital are insufficient to withstand the expected increase in NPL
Figure 17 shows the bVr for every LAC-7 country Surprisingly the bVr is below 1 for each and every country in the region both for the group of coun-tries with full access to international markets low inflation and a strong international liquidity and fis-cal position as well as for Argentina and Venezuela countries with limited access to international finan-cial markets high inflation and a weak international liquidity and fiscal position the salient feature of the banking vulnerability analysis is that every coun-
try in the region appears to be resilient to a less fa-vorable global context in which extreme events are ruled out but worsening domestic economic condi-tions are expected (see box III for an analysis of the regionrsquos banking vulnerability under more stressful conditions)
In summary the tightening of the regulation and su-pervision of the regionrsquos banking systems observed during the last decade appears to have paid off25 As a result banks in the region are in a strong position to endure deterioration in the global context and in domestic economic conditions ruling out extreme events more adverse economic conditions are not expected to result in a banking crisis in any of the major countries in the region thus from a macro-economic perspective this time around the weak link does not appear to be the banking system
25 See Jaacutecome Nier and Imam (2012)
Figure 17 banking Vulnerability ratio(bVr Mar-14)
Notes the bVr is defined as the ratio of projected nonperforming loans to maximum nonperforming loans Maximum nonperforming loans is defined as the level at which bank capital and loan loss provisions are completely exhausted For details on projected nonperforming loans see Appendix III A value of bVr below (above) 1 denotes a sound (fragile) banking systemData sources Own calculations based on the IMF Financial Soundness Indicators and national statistics for Venezuela
08
0606
05
03 0302
00
02
04
06
08
10
Venezuela Chile Brazil Peru Argentina Colombia Mexico
Banking Vulnerability Ratio(BVR Mar-2014)
Sound System
Fragile System
Latin America Macroeconomic Outlook A Global Perspective 25
box iii latin americarsquos bank soundness under stress
Can Latin American banks withstand severe stress In order to answer this question we make use of the banking Vulnerability ratio (see Section III for a description) to estimate how nonperforming loans behave in a typical systemic banking crisis in emerging markets we use the results reported by Laeven and Valencia (2012) who document every banking crisis since 1970 the paper defines a systemic bank-ing crisis as an episode in which the following two conditions are met (i) Significant financial distress is imposed on the banking system (including bank runs bank losses and liquidations) and (ii) policy inter-ventions in response to financial turbulence are enacted by the government
Peak nonperforming loans stand at 20 percent of total loans in the median emerging market systemic banking crisis since 199426 Should a banking crisis materialize and nonperforming loans skyrocket to 20 percent the representative bank existing loan loss provisions and bank capital in LAC-5 and Argentina would be enough to weather the storm (see Figure bIII1) the only exception is Venezuela Due to its significant leveragemdashas measured by the ratio of gross loans to bank capitalmdashthe highest in the region a median banking crisis in Venezuela would exhaust loan loss provisions and bank capital27
26 Out of the total sample of emerging countries in Laeven and Valencia (2012) we consider a sample of 37 emerging market countries equivalent to the one considered in talvi Munyo and Perez (2012) this sample covers more than 88 percent of the GDP of all emerging countries27 Venezuelarsquos previous banking crisis in 1994 was even worse than the median with nonperforming loans reaching 24 percent of total loans
Figure bIII1 Latin Americarsquos banking Vulnerability ratio Under Stress(bVr Mar-14)
Notes LAC-5 is the simple average of brazil Chile Colombia Mexico and Peru the bVr is defined as the ratio of historical peak nonperforming loans to maximum nonperforming loans Historical peak nonperforming loans refer to the median of peak nonperforming loans for every emerging market banking crisis since 1994 Maximum nonperforming loans is defined as the level at which bank capital and loan loss provisions are completely exhausted A value of bVrbelow (above) 1 denotes a sound (fragile) banking system Data sources Own calculations based on Laeven and Valencia (2012) IMF Financial Soundness Indicators and national statistics for Venezuela
10
07
17
00
02
04
06
08
10
12
14
16
18
LAC-5 Argentina Venezuela
Latin Americas Banking Vulnerability Ratio Under Stress
(BVR Mar-2014)
FragileSystem
SoundSystem
brookings Global-CereS economic and Social Policy in Latin America Initiative 26
In order to assess overall macroeconomic vulner-ability under a less complacent global context and more adverse domestic economic conditions we map together the three vulnerability indicators in which a subset of countries in the region show a weak flank namely the ILr the IVr and the FVr (see Figure 18)
When assessing overall macroeconomic vulnerabili-ty the region clusters into 3 groups28 the first group is composed of Chile Colombia Peru and Mexicomdashcountries with full access to international markets and strong macroeconomic fundamentals and so a strong international liquidity and fiscal position and a positive inflation outlook the second group is composed of Argentina and Venezuelamdashcountries with limited access to international financial markets and weak macroeconomic fundamentals and so a vulnerable international liquidity and fiscal position and a negative inflation outlook Finally the third and intermediate group composed of brazil with full access to international financial markets but displaying vulnerabilities in some macroeconomic dimensionsmdashespecially on the fiscal frontmdashthat al-though quantitatively distinct from those of countries with weak macroeconomic fundamentals is not ex-actly aligned with the group of countries with strong fundamentals
Interestingly the growth outlook of LAC-7 countries for the five-year period of 2014-2018 according to
i v o v E r a l l m aC r o E C o n o m i C v u l n E r a b i l i t y o n E r E G i o n t h r E E l at i n a m E r i C a s
Figure 18 One region three Latin Americas
a International Liquidity ratio(ILr Dec-13)
b Inflation Vulnerability ratio(IVr quadratic scale May-14)
c Fiscal Vulnerability ratio(FVr quadratic scale Dec-13)
Notes the ILr is calculated as the ratio of short-term domestic and external principal payments of the public sector and short-term external principal payments of the non-financial private sector due in the next 12 months to the sum of international reserves and potential credit lines from multilateral organizations IVr is defined as the ratio of projected inflation at the end of 2016 to a 4 percent inflation threshold the FVr is defined as the ratio of projected debt to GDP in 15 years (assuming identical inflation tax revenues for every country) to a 50 percent debt to GDP thresholdData Sources Own calculation based on national statistics IMF Focuseconomics and econviews
28 A formal cluster analysis was performed using data of the ILr IVr and FVr for LAC-7 countries Using agglomerative hierarchical clustering three country groups emerge a first group composed of Argentina and Venezuela a second group composed of Chile Colombia Mexico and Peru and a third group composed of brazil
Latin America Macroeconomic Outlook A Global Perspective 27
17
15
11
08
05 05
02
00020406081012141618
Argentina Venezuela Brazil Mexico Chile Colombia Peru
a International Liquidity Ratio(ILR)
StrongPosition
WeakPosition
Cluster I Cluster IIICluster II
NegativeOutlookPositiveOutlook
107
70
1408 08 08 06
00
03
10
23
40
63
90
123
Venezuela Argentina Brazil Mexico Colombia Chile Peru
b
74
27 25
1005 03
0000
03
10
23
40
63
90
Venezuela Argentina Brazil Mexico Colombia Chile Peru
c
StrongPosition
WeakPosition
market consensus forecasts clusters these seven countries into the same three groups previously described the first group of countries with sound macroeconomic fundamentalsmdashChile Colombia Peru and Mexicomdashare expected to perform above the LAC-7 mean forecast while the second group of countries with weak macroeconomic fundamen-
talsmdashArgentina and Venezuelamdashare expected to perform substantially below the LAC-7 mean fore-cast the growth outlook for brazil which is part of the intermediate group with mixed fundamentals is also below the LAC-7 mean growth forecast but ex-pected perform better than Argentina and Venezu-ela (see Figure 19)
Figure 19 the Growth Outlook for Latin America 2014-2018(Annual GDP growth forecasts 2014-2018 average)
Note LAC-7 is the simple average of Argentina brazil Chile Colombia Mexico Peru and VenezuelaData source Focuseconomics
13
2022
3740
47
54
0
1
2
3
4
5
6
Ven
ezue
la
Arg
entin
a
Bra
zil
Mex
ico
Chi
le
Col
ombi
a
Per
u
Figure 19 The Growth Outlook for Latin America 2014-2018
Cluster I Cluster II Cluster III
LAC-7 33
brookings Global-CereS economic and Social Policy in Latin America Initiative 28
In the years to come Latin America will be facing a less favorable external environment and more ad-verse economic conditions than it did in the previ-ous decade Higher interest rates lower commodity prices weaker currencies and slower growth rates will be the norm rather than the exception
Such a significant shift in the regionrsquos outlook to-gether with the social discontent that has emerged as a result will pose very significant macroeconomic challenges for policymakers the magnitude of these challenges will depend on whether the countries be-long to the cluster of those with strong mixed or weak macroeconomic fundamentals
For the countries with strong macroeconomic funda-mentals (Chile Colombia Mexico and Peru) the key challenge is to consolidate macroeconomic stability in more trying times Although the task will not be easy these countries are extremely well positioned in the years to come to be considered for graduation in macro policy management29
For the countries with weak macroeconomic fun-damentals the challenges are humongous As the global context becomes less friendly Argentina ur-gently needs to restore confidence to stop capital outflows and the drain on international reserves and resuscitate its ailing economy In order to do so Ar-gentina will need to normalize its relations with inter-national creditors and multilateral organizations to remove itself from a position of technical default and restore normal access to credit markets eliminate
exchange controls and controls on capital outflows unify the exchange rate market phase out a host of other distortions of the price system (especially public utilities) make the necessary corrections to public finances to restore solvency and put an end to inflationary financing of fiscal deficits If Argentina starts moving in this direction it could start to recov-er rather rapidly from its current situation there are plenty of examples in many countries in which these kinds of apparently insurmountable problems were resolved in a relatively short period of time
the challenges for Venezuela although qualitative-ly similar to those of Argentina are many orders of magnitude larger For starters Venezuela has three official exchange rates and a much larger fiscal defi-cit and it is in arrears with a host of creditors ex-cept with foreign bond holders30 More importantly restoring confidence in Venezuela will probably take much more than just moving towards more reason-able and credible macroeconomic policies since it is the decision-making process itselfmdashVenezuelarsquos institutions governance and system of checks and balancesmdashthat has broken down
For the countries with mixed macroeconomic fun-damentals such as brazil the challenge is to react in a timely fashion to correct any incipient deterio-ration In the case of brazil this reaction mostly in-volves avoiding a rapid rise in public debt that might eventually compromise its credit ratings and lead to higher financing costs and a shortening of debt
v f i na l t h o u G h t s a n d p o l i C y C ha l l E n G E s
29 For a very interesting discussion on the graduation of various Latin American countries in the conduct of fiscal policy over the business cycle see Frankel Veacutegh and Vuletin (2013)30 See Hausmann and Santos (2014) for a recent and fascinating discussion on Venezuela
Latin America Macroeconomic Outlook A Global Perspective 29
maturities that would feed back to an even more ac-celerated rise in public debt and further weakening in the international liquidity position If this vicious cycle is to be avoided brazil should react sooner rather than later
the shift to a less favorable global context also means that the region cannot count on favorable external tailwinds to grow at high rates Pro-growth reforms will be needed in every country in the re-gion those with strong and weak macroeconomic fundamentals to revitalize what otherwise will be a mediocre growth performance in the years to come Mexico has recently given new impetus to the re-form process Other countries in the region must now join the fray
Although the challenges ahead appear to be huge these are exactly the times for optimism With favor-
able tailwinds facilitating very high growth rates in the region for close to a decade the incentive to pursue politically complex and politically debilitating macroeconomic adjustments andor reforms is low After all most countries were doing well without ma-jor reforms In a more adverse global context with deteriorating macroeconomic fundamentals andor mediocre growth ahead of us incentives in favor of action might change significantly In fact it is in bad times that politically complex decisions are usually made31 Whether we agree or not with the policies the ongoing macroeconomic adjustment and reform processes in the countries of peripheral europe are a recent testimony to that assertion As a famous economist once wrote it is in bad times that ldquothe po-litically impossible becomes politically inevitablerdquo It remains to be seen if the new crop of leaders in the region is up to the task32
31 this issue has been thoroughly studied in the academic literature For a useful survey see tommasi and Velasco (1996)32 See talvi (2014)
brookings Global-CereS economic and Social Policy in Latin America Initiative 30
basel Committee on banking Supervision 2010-2011 ldquoBasel III A Global Regulatory Framework for More Resilient Banks and Banking Systemsrdquo basel bank for International Settlements
Calvo G A Izquierdo and e talvi 2003 ldquoSudden Stops the Real Exchange Rate and Fiscal Sustainability Argentinarsquos Lessonsrdquo Nber Working Paper Cambridge Mass National bureau of economic research
Calvo G L Leiderman and C reinhart 1993 ldquoCapital Inflows and Real Exchange Rate Appreciation in Latin America The Role of External Factorsrdquo IMF Staff Papers 40(1) 108-151 Washington International Monetary Fund
CLAAF 2014 ldquoEnter the Dragon Risks from China to Latin Americardquo Statement 31 httpwwwclaaforgdocuments31-statementpdf
Frankel J C Veacutegh and G Vuletin 2013 ldquoOn Graduation from Fiscal Procyclicalityrdquo Journal of Development economics Vol 100(1) pages 32-47
Greenspan A 1999ldquoCurrency Reserves and Debtrdquo Speech at World bank Conference on recent trends in reserves Management Washington
Guidotti P 2000 ldquoOn Debt Management and Collective Action Clausesrdquo In reforming the International Monetary and Financial System edited by Kenen P and A Swoboda Washington International Monetary Fund
Hausmann r and M A Santos 2014 ldquoShould Venezuela Defaultrdquo Project Syndicate httpwwwproject-syndicateorgcommentaryricardo-hausmann-and-miguel-angel-santos-pillory-the-maduro-government-for-defaulting-on-30-million-citizens--but-not-on-wall-street
Izquierdo A r romero and e talvi 2008 ldquoBooms and Busts in Latin America The Role of External Factorsrdquo IADb research Department Working Paper 631 Washington Inter-American Development bank
Izquierdo A and e talvi 2009 ldquoPolicy Trade-Offs for Unprecedented Times Confronting the Global Crisis in Latin America and the Caribbeanrdquo Monograph IDb research Department
Jaacutecome L and e Nier and P Imam 2012 ldquoBuilding Blocks for Effective Macroprudential Policies in Latin America Institutional Considerationsrdquo IMF Working Papers 12183 Washington International Monetary Fund
r E f E r E n C E s
Latin America Macroeconomic Outlook A Global Perspective 31
Laeven L amp F Valencia 2012 ldquoSystemic Banking Crises Database An Updaterdquo IMF Working Papers 12163 Washington International Monetary Fund
Luumltkepohl H and M Kratzig 2004 ldquoApplied Time Series Econometricsrdquo Cambridge University Press New York United States
rodrik D and A Velasco 1999 ldquoShort-Term Capital Flowsrdquo Nber Working Paper Cambridge Mass National bureau of economic research
Sosa S e tsounta and HS Kim 2013 ldquoIs the Growth Momentum in Latin America Sustainablerdquo IMF Working Paper No 13109 Washington International Monetary Fund
talvi e I Munyo and D Perez 2012 ldquoLatin America Macroeconomic Outlook A Global Perspectiverdquo bbrookings-CereS Macroeconomic report the brookings Global-CereS economic amp Social Policy in Latin America Initiative (eSPLA) Washington brookings Institution httpwwwbrookingseduresearchreports201210latin-america-macroeconomic
talvi e and I Munyo 2013 ldquoLatin America Macroeconomic Outlook A Global Perspective Are the Golden Years for Latin America Overrdquo the brookings Global-CereS economic amp Social Policy in Latin America Initiative (eSPLA) Washington brookings Institution httpwwwbrookingseduresearchreports201306latin-america-macroeconomic-outlook-talvi-munyo
talvi e and H trinkunas 2013 ldquoThe Upcoming Electoral Cycle in Latin America in the Midst of Social Unrest What Lies Aheadrdquo the brookings Global-CereS economic amp Social Policy in Latin America Initiative (eSPLA) httpwwwbrookingsedublogsup-frontposts20131028-electoral-cycle-latin-america-talvi-trinkunas
talvi e 2014 Latin Americas Decade of Delopmentless Growth in K Dervis and H Kharas (editors) the Growth Convergence and Divergence Debate forthcoming
teulings C r baldwin 2014 ldquoSecular Stagnation Facts Causes and Curesrdquo VoxeUorg book CePr Press httpwwwvoxeuorgcontentsecular-stagnation-facts-causes-and-cures
tommasi M amp A Velasco 1996 ldquoWhere Are We in the Political Economy of Reformrdquo Journal of economic Policy reform taylor amp Francis Journals vol 1(2) pages 187-238
World economic and Financial Surveys 2003ldquoWorld Economic Outlook Public Debt in Emerging Marketsrdquo IMF Staff Survey Washington International Monetary Fund
brookings Global-CereS economic and Social Policy in Latin America Initiative 32
this appendix presents the technical details of the empirical model developed in this report to explore the role of external factors in accounting for Latin Americarsquos growth performance to that end a Vec-tor error Correction Model (VeCM) specification was developed using the same methodology as in Izqui-erdo romero and talvi (2008) the variables includ-ed in the model were the following Latin Americarsquos GDP (GDP_LAC7) as well as a set of external vari-ables including the GDP of G-7 countries (GDP_G7) and China (GDP_China) LAC-7rsquos average terms of trade (TOT) and international financial conditions measured by the eMbI+ spreads (EMBI)
After checking that the five variables are non-sta-tionary the existence of one cointegration relation and one lagged term (using the DickeyndashFuller test Johansen Cointegration test and Lag Length Stan-dard test respectively) the model can be specified and estimated as follows
ΔΥt = c + αβʹΥt-1 + ΓΔΥt-1 + εt
Where Υt = [GDP_LAC7 GDP_G7 GDP_China TOT EMBI ] is a 5x1 vector α is a 5x1 vector that con-tains the error-correction-adjustment coefficients β is a 5x1 vector that contains the error correction terms Γ is a 5x5 matrix that contains the short-run- dynamics coefficients and ε is a 5x1 error term vec-tor
Following Izquierdo romero and talvi (2008) it is assumed that LAC-7 growth rate doesnrsquot affect ex-ternal factors In order to nullify the effects of LAC-7 growth rate on external factors restrictions in long- and short-run interactions were imposed
Given the technical difficulties involved in the effi-cient estimation of the VeCM with restrictions both in error correction coefficients and short-term pa-rameters the Luumltkepohl and Kratzig (2004) method-ology was followed In a first stage the cointegrat-ing vector (including restrictions in α as indicated above) was estimated and in a second stage the short-run parameters were estimated by feasible generalized least squares imposing both exclu-sion restrictions in α and Γ and using the values obtained for β in the first stage treating the first-stage estimator of β as fixed in the second-stage estimation can be justified on the grounds that the convergence of cointegrating parameters is faster than that of short-term parameters
It is important to notice that for the purpose of shocking the model variables the exogeneity or-der assumed in the Cholesky Decomposition is as follows GDP_G7 GDP_CHINA tOt eMbI and GDP_LAC7 Latin Americarsquos GDP being the least exogenous variable
a p p E n d i x i E x t E r na l faC to r s m o d E l f o r l at i n a m E r i C a
Latin America Macroeconomic Outlook A Global Perspective 33
the data that was used in the model estimations has a quarterly frequency ranging from 1991Q1 through 2014Q1 Variables were constructed as follows
Latin Americarsquos GDP (GDP_LAC7) Calculated as the log of the simple average of seasonally adjusted real GDP indices of each of the LAC-7 countries Sources National statistics
G-7 economic performance (GDP_G7) Calculated using the log of the weighted average of the sea-sonally adjusted real GDP of G7 countries Sources National statistics
Chinarsquos economic performance (GDP_China) Cal-culated using the log of seasonally adjusted real GDP of China Sources National statistics
Latin Americarsquos terms of trade (TOT) Calculated us-ing the log of the simple average of the terms of trade index of LAC-7 countries Sources National statistics except for Venezuela for which terms of trade are computed based on export price data from national statistics and import prices from Interna-tional Financial Statistics of the IMF
International financial conditions (EMBI) It is Measured by JP Morgan eMbI+ spreads Source Bloomberg
data
brookings Global-CereS economic and Social Policy in Latin America Initiative 34
this appendix presents the technical details of the debt dynamics computations presented in Section III below there is a detailed description of data sources and assumptions for each of the variables used in the analysis table AII1 presents a set of selected parameters
Definitions
Initial Debt Stock ratio of non-financial public debt to GDP as of December 2013 (in the Argentin-ean case the ratio corresponds to September 2013) Sources National statistics and IMF World Econom-ic Outlook Argentinarsquos public debt does not include untendered debt
Dollarization ratio of foreign currency denominat-ed public debt to total public debt Sources National statistics and IMF World Economic Outlook
Interest Rates Domestic currency annual real in-terest rate is defined as the domestic currency yield on 10-year bonds issued in domestic currency de-flated by the expected average annual domestic in-flation rate for the 10-year period (2014-2024) Aver-age expected domestic inflation for the 2014-2024 is calculated based on Focuseconomics consensus forecast for the period 2014-2018 Inflation is as-sumed to remain at the 2018 level thereafter For Ar-gentina forecasts by econviews were used instead of Focuseconomics
Foreign currency annual real interest rate is defined as the 10-year eMbI yield deflated by the average US expected inflation rate for the 10-year period (2014-2024) Average expected US inflation for the 2014-2024 is calculated based on Cleveland Fed forecasts
real average interest rate is the average of domes-tic and foreign currency interest rates weighted by the percent of debt denominated in domestic and foreign currency respectively
Sources Nominal interest rates are based on own calculations using data from national statistics Bloomberg and IMF Article IV Consultation Reports Expected inflation rates are calculated using Fo-cusEconomics projections with the exception of Ar-gentina for which Econviews is used Cleveland Fed data is used for the US annual expected inflation rates
Real GDP Growth Annual growth rate of GDP in constant local currency Sources National statis-tics
Primary Surplus ratio of fiscal revenues minus primary fiscal expenditure of the non-financial public sector to GDP Sources National statistics and IMF World Economic Outlook
a p p E n d i x i i p u b l i C d E b t dy na m i C s i n l at i n a m E r i C a
Latin America Macroeconomic Outlook A Global Perspective 35
Real Exchange Rate Depreciation Annual bilater-al real exchange rate depreciation vis-agrave-vis the US dollar Sources Own calculations based on national statistics
Inflation Tax Defined as where π is the expected average domestic annual inflation rate for the period 2014-2024 and m is the ratio of mon-etary base to GDP as of December 2013 Sources Own calculations based on national statistics
Assumptions
Domestic and foreign currency interest rates in countries with full access to international financing increase linearly during the five-year period 2014-2018 as a result of a gradual increase in the 10-year US treasury bonds yield which according to mar-ket projections will reach 45 percent in 2017 they are assumed to remain constant thereafter
Foreign currency nominal interest rates in Argentina and Venezuela are assumed to reach 800 and 900 basis points spread in 2018 with respect to the 10-year US treasury bonds yield respectively Do-mestic currency nominal interest rates for Argentina and Venezuela are assumed to be equal to foreign currency nominal interest rates plus a risk premium equivalent to the average spread between domes-tic and foreign currency yields on brazilrsquos 10-year bonds
Initial domestic and foreign currency denominated debt stocks pay a fixed interest rate during the en-tire period 2014-2028 equivalent to the implicit inter-est rate on total public debt in 2013 calculated as the ratio of interest payments to public debt stock in 2013
Potential growth rate is assumed to be equal to the historical growth rate calculated as the average real annual growth rate for the period 1992-2012
Fiscal revenues for the 2014-2028 period are cal-culated assuming an elasticity of revenues to GDP equal to 1
Primary expenditures real annual growth rate is as-sumed to be equal to potential GDP growth for the period 2014-2028
real annual depreciation rate is calculated as the depreciation rate necessary to balance the current account deficit the current account deficit adjust-ment is assumed to be uniformly distributed during the 2014-2018 period this calculation follows the same methodology as in Calvo Izquierdo and talvi (2003)
Amortization Schedule of the Initial Debt Stock For the years in which data was available the reported amortization schedule for the non-financial public debt was used For those years in which there was no information on the amortization schedule it is as-sumed that the remaining portion of the original debt is uniformly amortized through 2028
New debt issued from 2014 onwards two amortiza-tion schedules are assumed First all new debt is amortized within a year and second all new debt matures after 2028 the true amortization sched-ule will lie somewhere in between the two extreme scenarios Interest rates paid on new debt are the projected market interest rate for each period as de-fined above
π1 + π bull m
brookings Global-CereS economic and Social Policy in Latin America Initiative 36
Variable
Definition
reference
ArgentinabrazilChileColombiaMexicoPeruVenezuela
Debt Stock
In of GDP
2013
328 657 117 318 358 192 498
real AvgInterest rate
Weightedaverage real interest rate
2013
103 66 21 24 29 31 136
Potential real Growth rate
real annual GDP growth rate
Avg 1992-2012
37 31 52 37 27 52 27
Primary Surplus
In of GDP
2013
-07 19 00 18 -04 18 -64
Dollarization
Foreign currency denominated
debt in of total debt
2013
542 117 62 234 285 521 607
Inflation Tax revenues
In of GDP
2013
24 03 02 01 02 03 73
Notes See Appendix text for details of debt dynamics computationsData sources National statistics IMF World economic Outlook and bloomberg
table AII1 Debt Dynamics Selected Initial Parameters
Latin America Macroeconomic Outlook A Global Perspective 37
this appendix presents the technical details of the simple mortgage model used to estimate the pro-jected nonperforming loans (NLP) as a percentage of total loans in the banking sector of LAC-7 coun-tries
the model assumes the representative individu-al gets a 15-year variable interest rate mortgage equivalent to 25 percent of his permanent income the 15-year period can be divided into two sub-pe-riods the first 4 years characterized by high income growth and low borrowing costs (boom period) and the remaining 11 years characterized by low income growth and high borrowing costs (cooling-off peri-od)
For each country the boom period growth rate was calculated as the 2004-2011 average GDP growth and the cooling-off period growth rate was calcu-lated using the 2012-2018 average the boom pe-riod interest rate was calculated as the 2010-2013 average real eMbI yields while for the cooling-off period an upward trajectory of the eMbI yields was assumed (for detailed assumptions on interest rates see Appendix II)
In order to estimate the projected NPL we contrast two types of individuals Uninformed individuals who assume boom conditions will endure for the 15-year lifetime of the loan and informed individuals
with perfect foresight regarding lower future income growth and higher future borrowing costs Since maximum tolerable debt levels depend on perma-nent income and given that both a reduction in the income growth rate and an increase in borrowing costs reduce permanent income the uninformed in-dividuals will take a larger loan (loan1) than informed individuals (loan2) since the uninformed individuals overestimate permanent income
Considering that the mortgage payment cannot ex-ceed the 25 percent of permanent income threshold under the projected conditions loan2 is the maximum tolerable indebtedness since it perfectly internal-izes the dynamics of all the relevant variables Any excess of debt with respect to loan2 would be de-faulted Hence the NPL ratio to actual indebtedness for the uninformed individuals is calculated as
In order to calculate aggregate NPL a uniform dis-tribution is assumed between informed individuals who perfectly anticipate the change in economic conditions during the cooling-off period relative to the boom period and uninformed individuals who do not NPL for each country is then calculated as the average of NPL of uninformed individuals and 0 percent for informed individuals
a p p E n d i x i i i a s i m p l E m o rtG aG E m o d E l o f n o n p E r f o r m i n G l oa n s
loan1 - loan2
loan1
loan1 - loan2
loan1
brookings Global-CereS economic and Social Policy in Latin America Initiative 38
1775 Massachusetts Avenue NWWashington DC 20036202-797-6000wwwbrookingseduglobal
CeresAntonio Costa 347611300 MontevideoUruguay+598 26287644wwwceres-uyorg
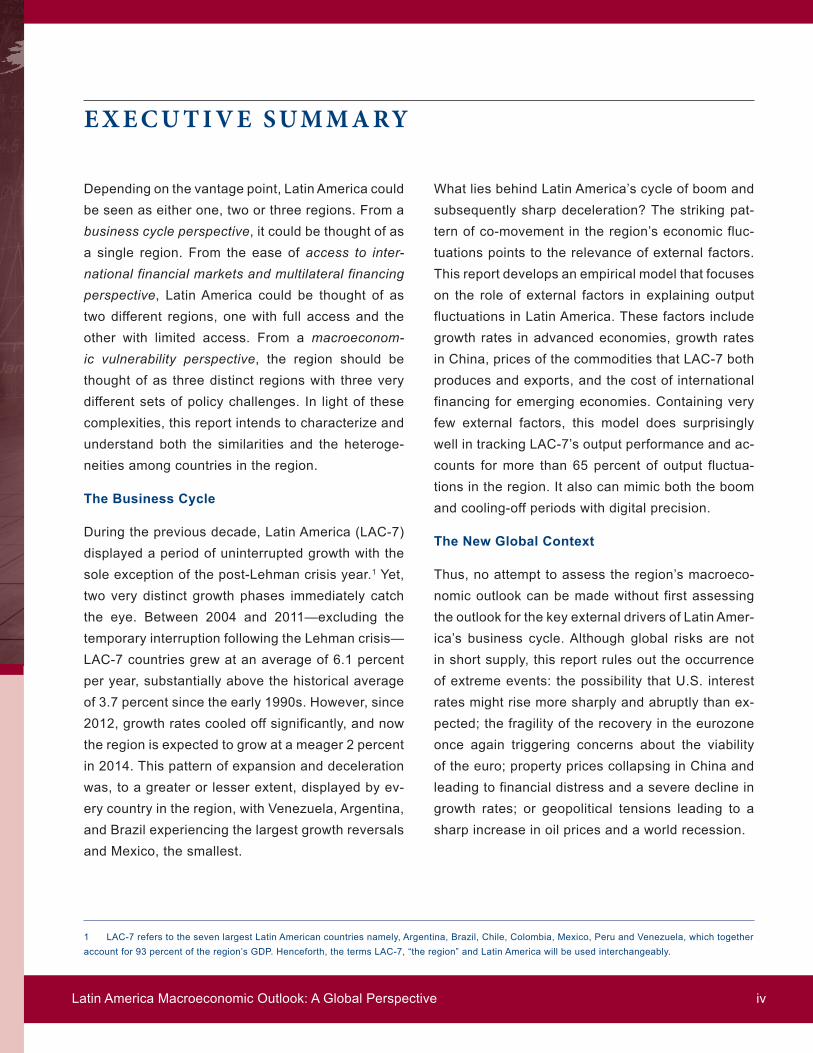
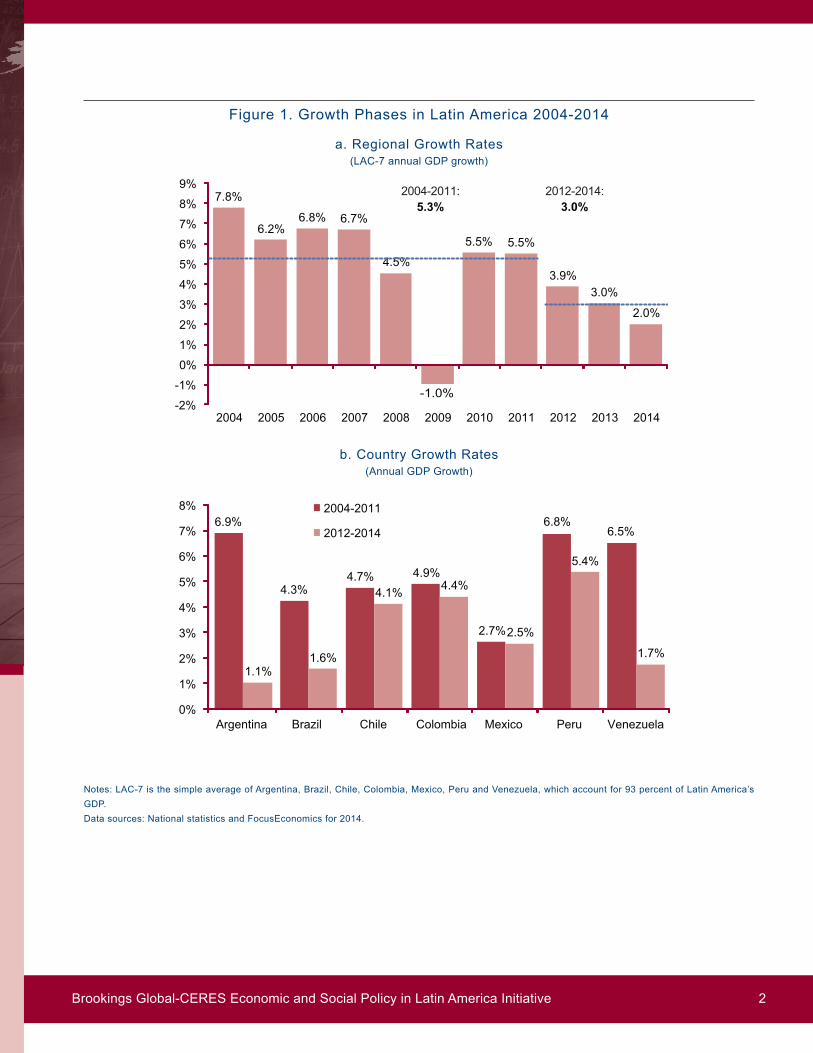
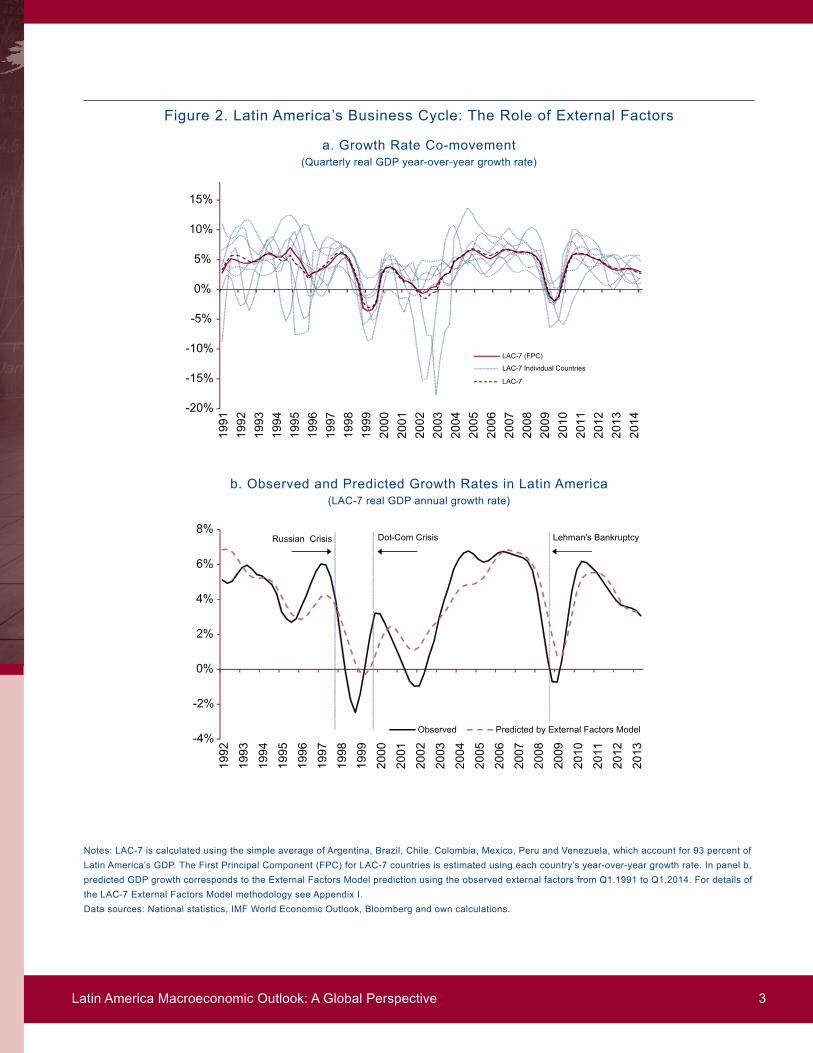
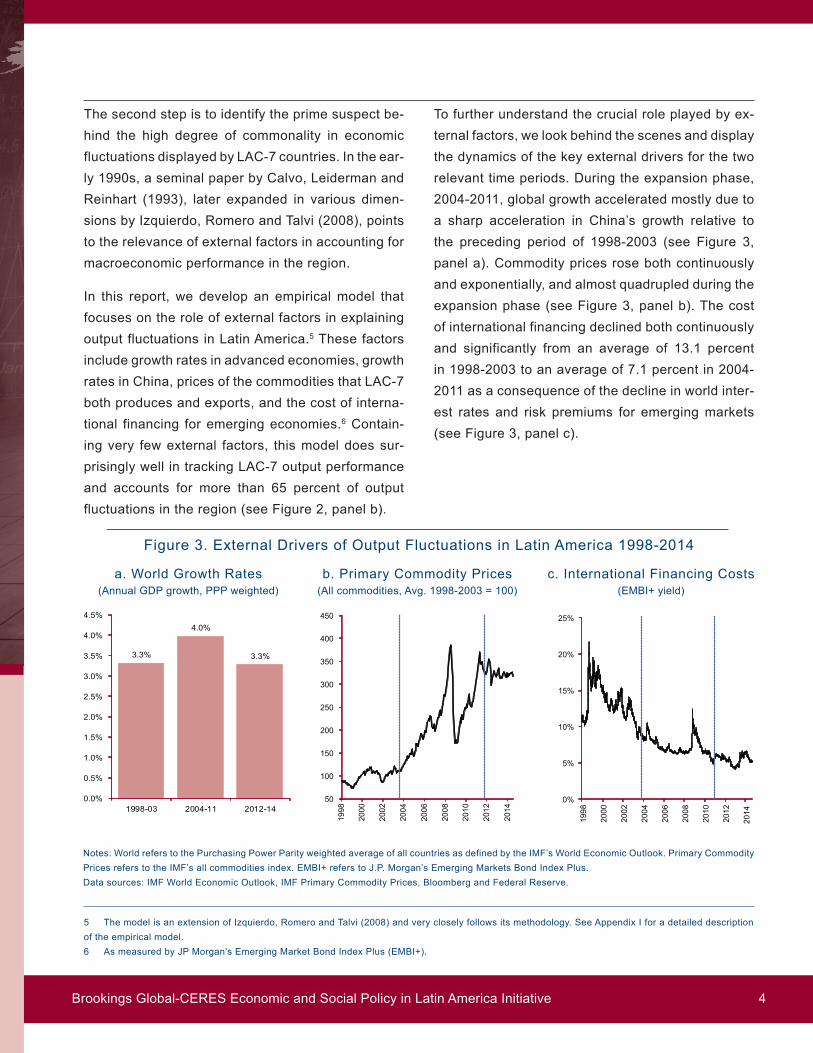
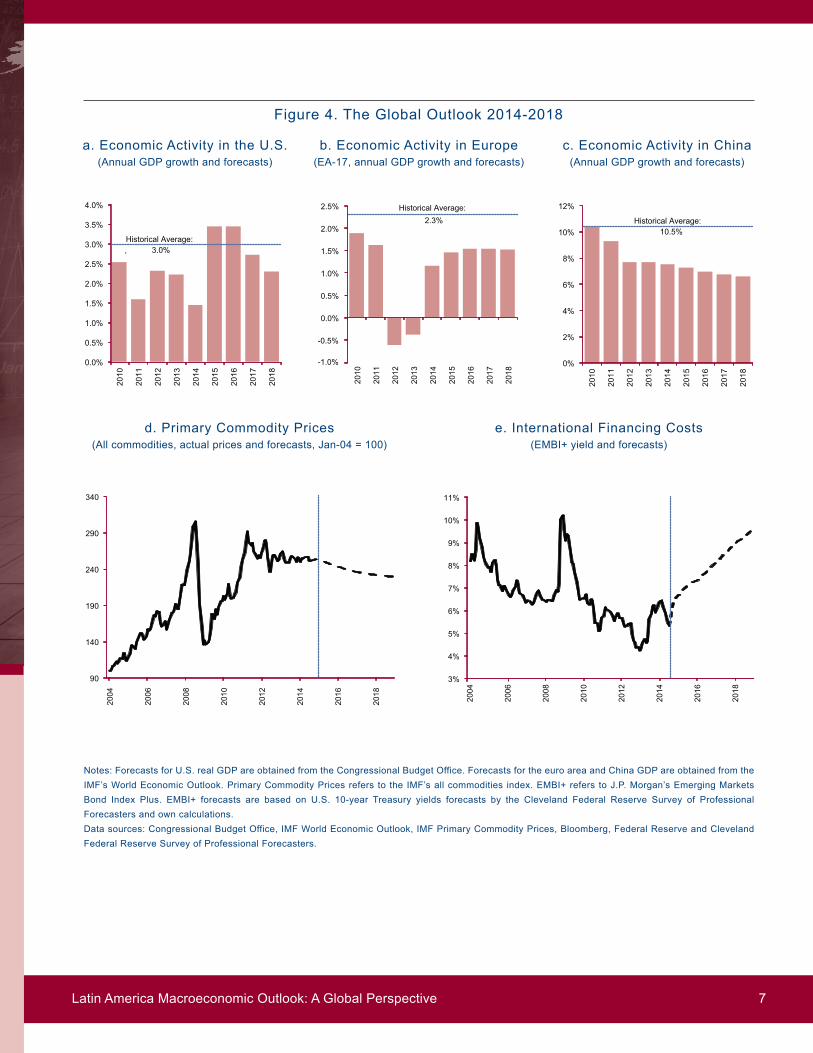
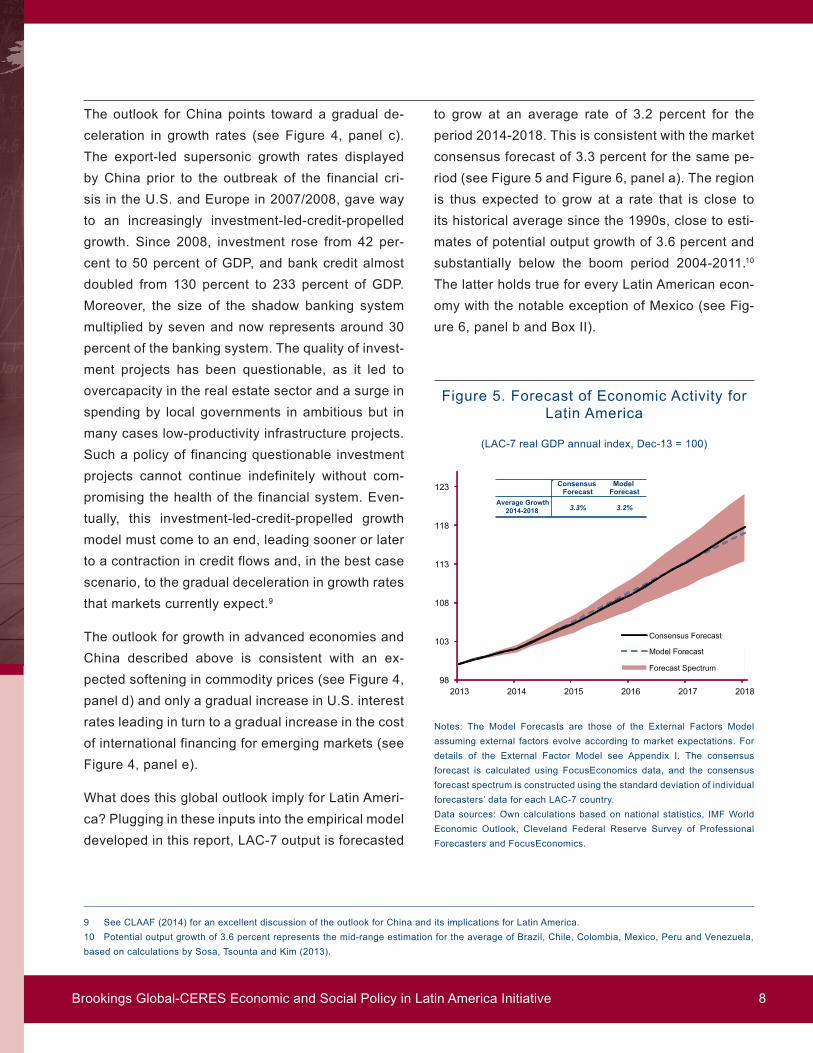
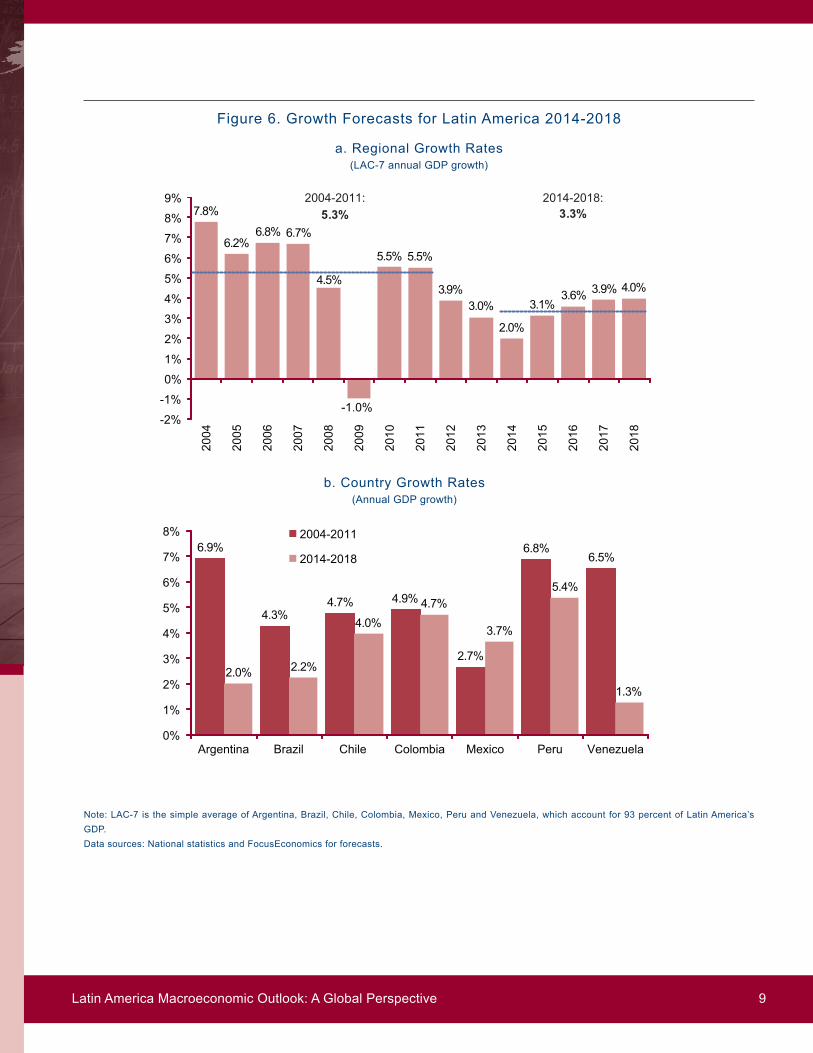
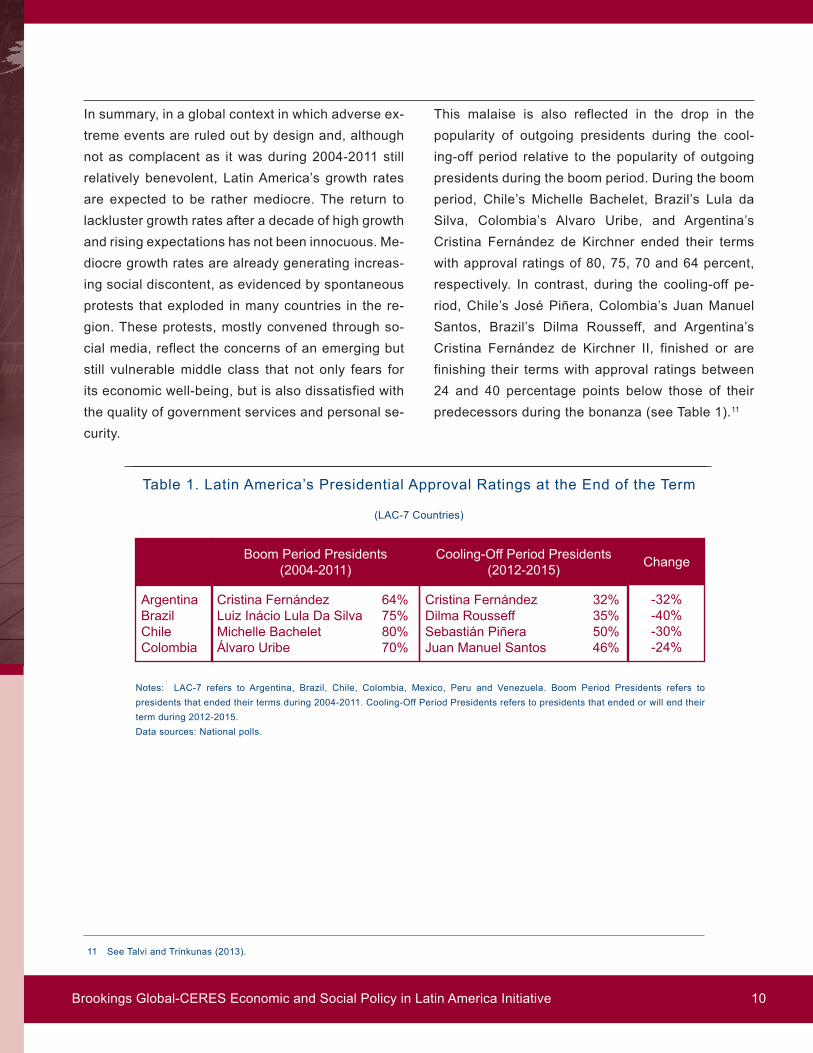
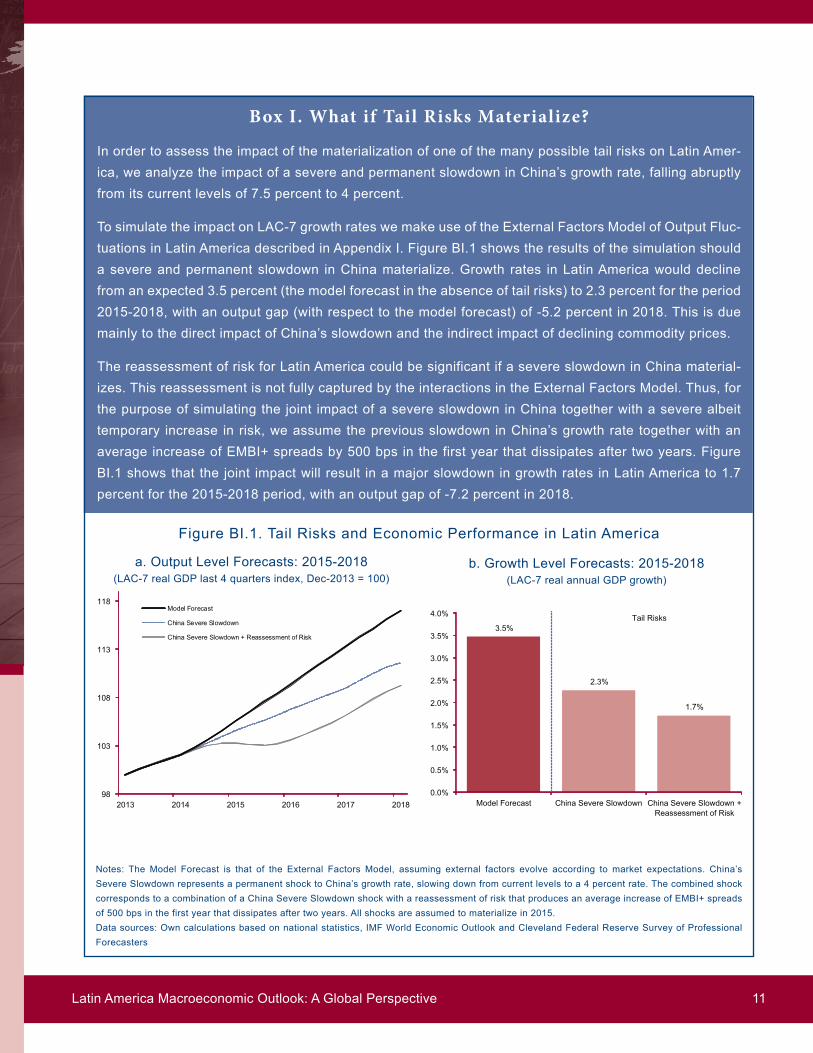
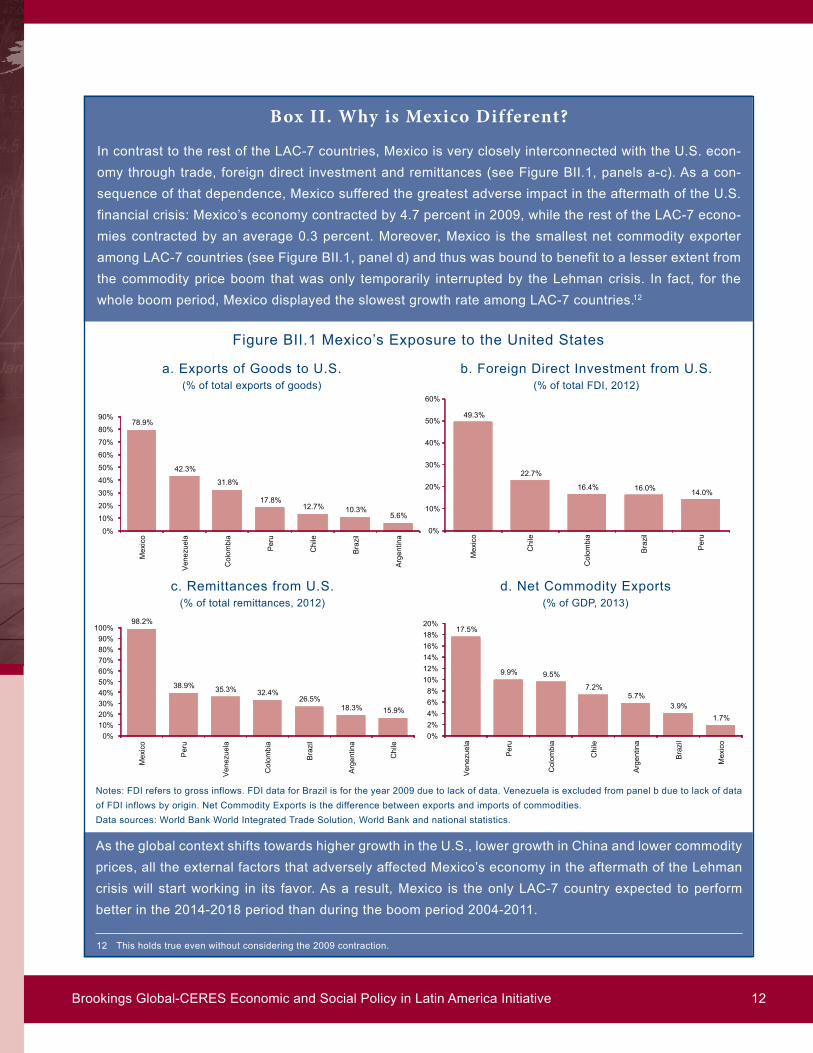
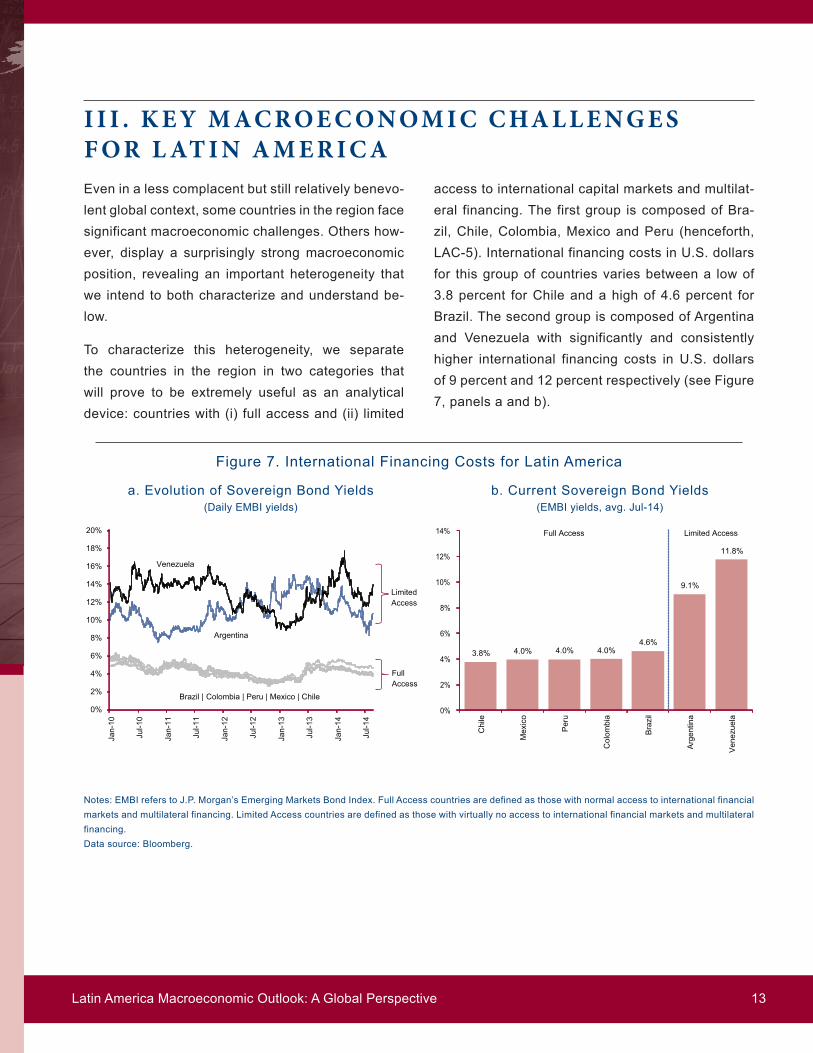
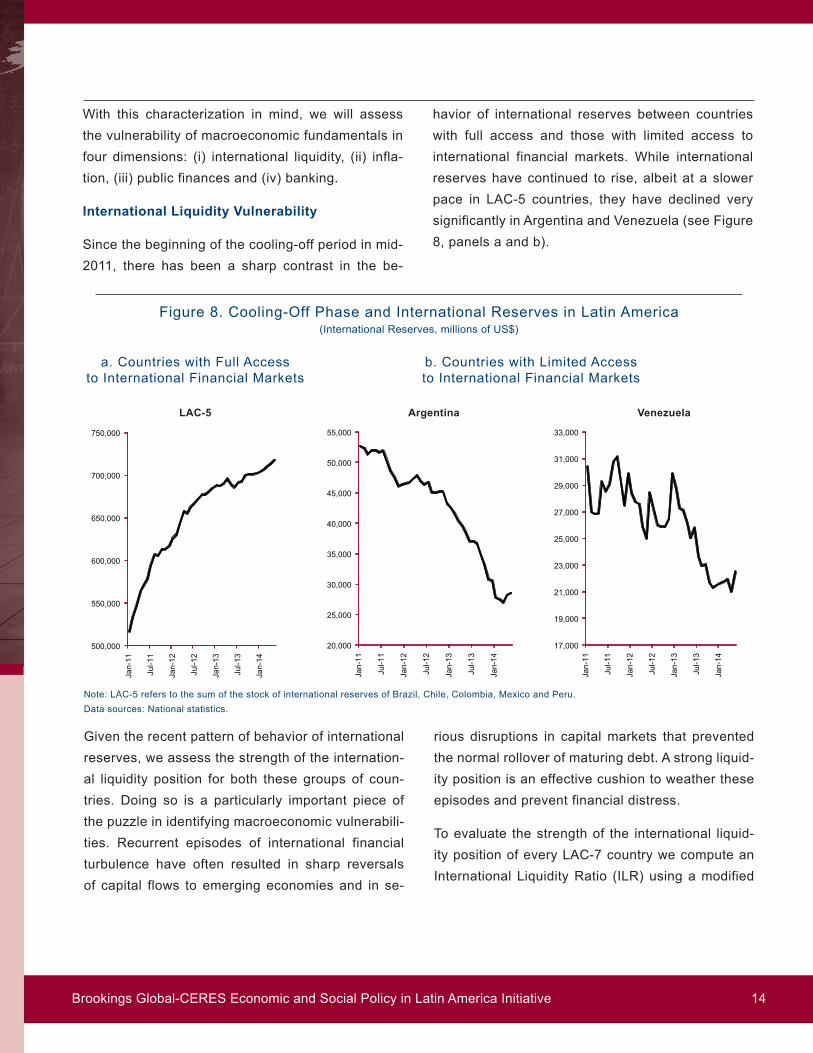
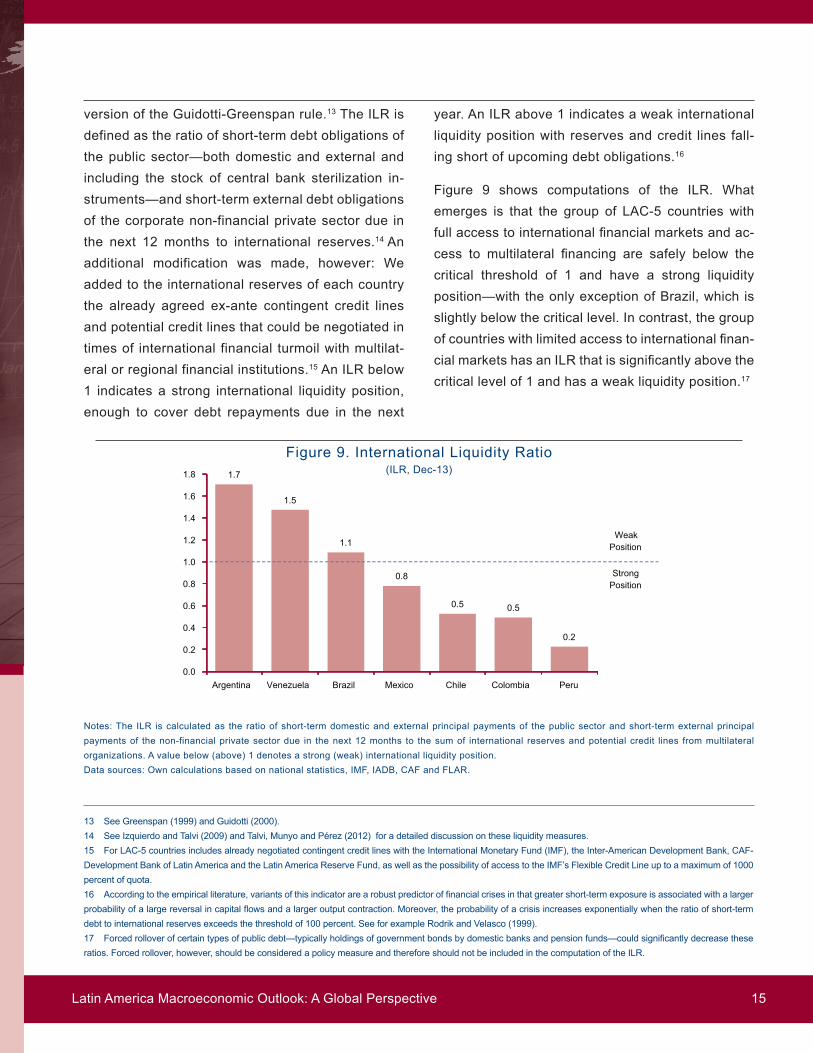
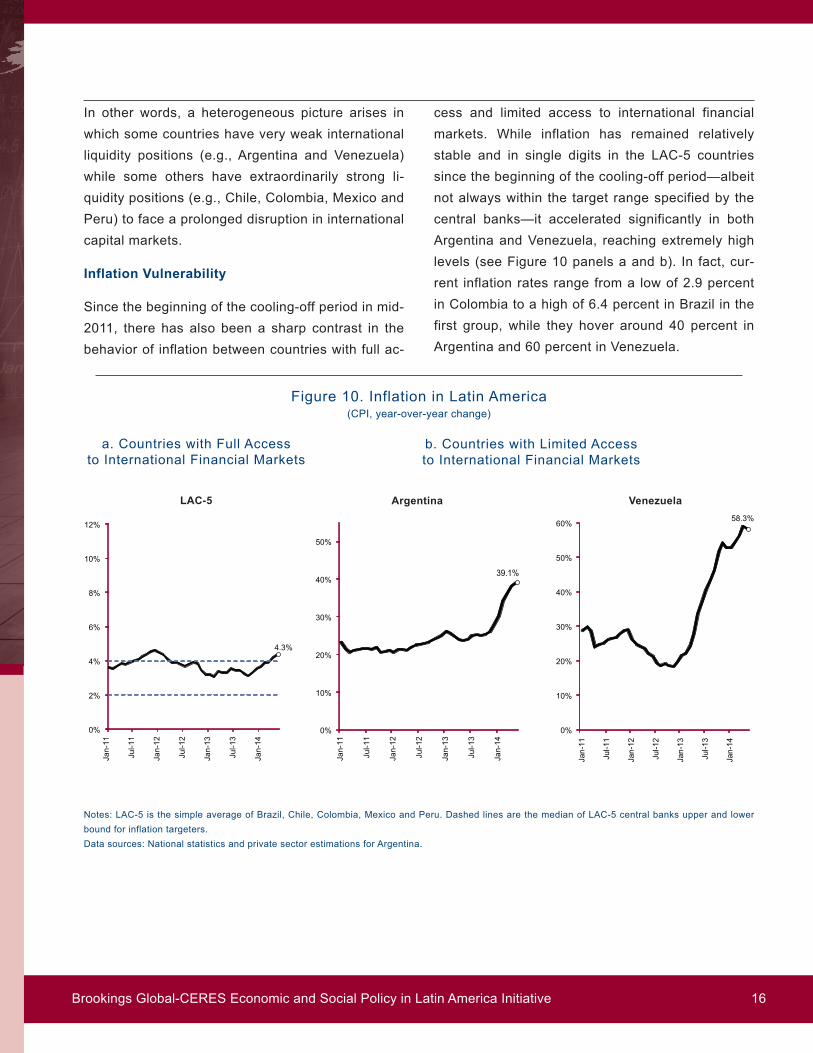
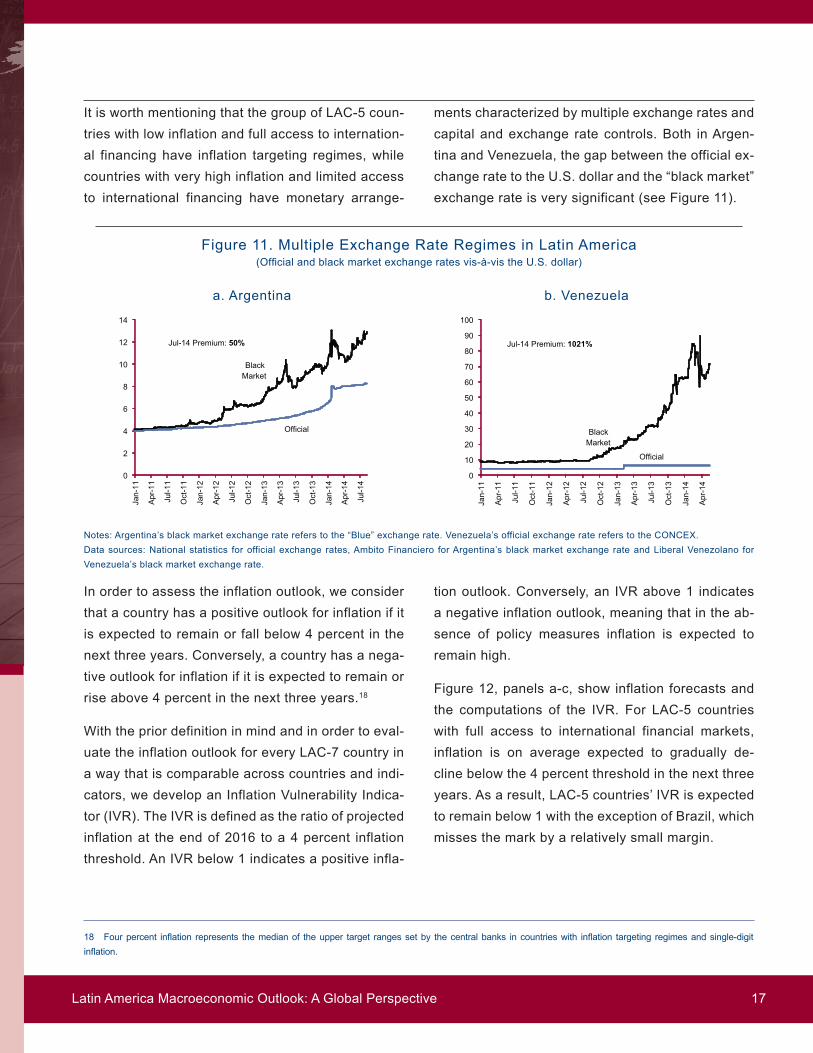
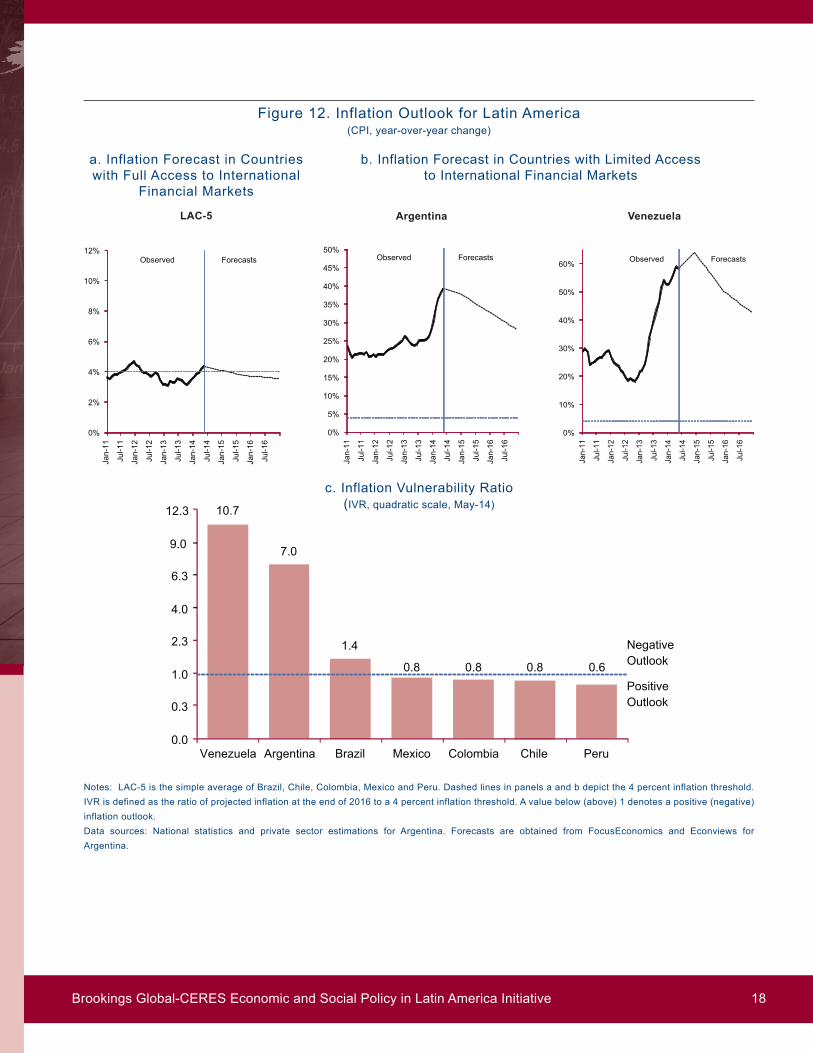
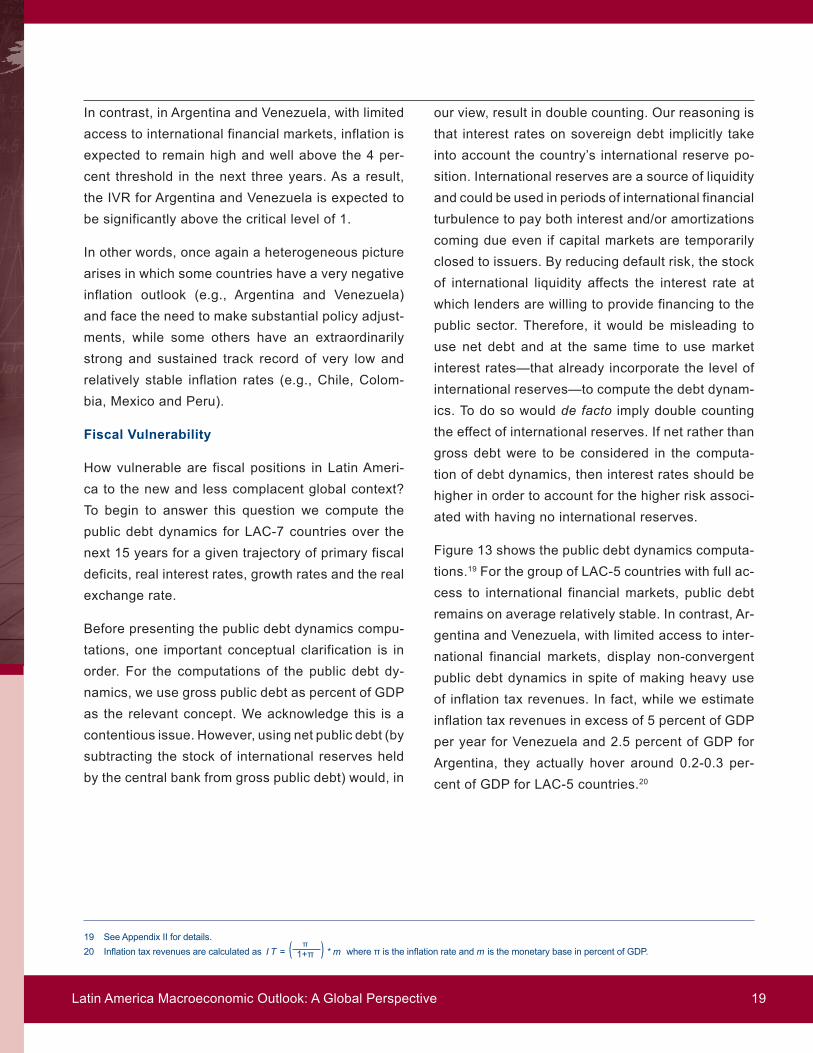
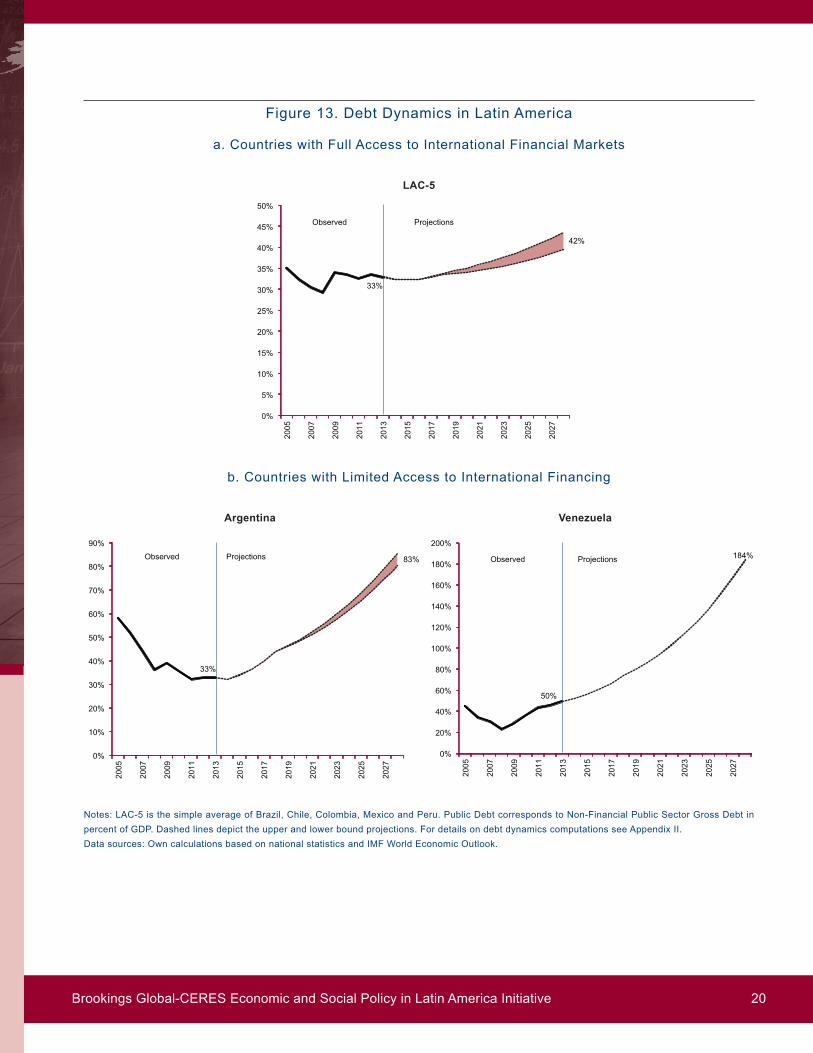
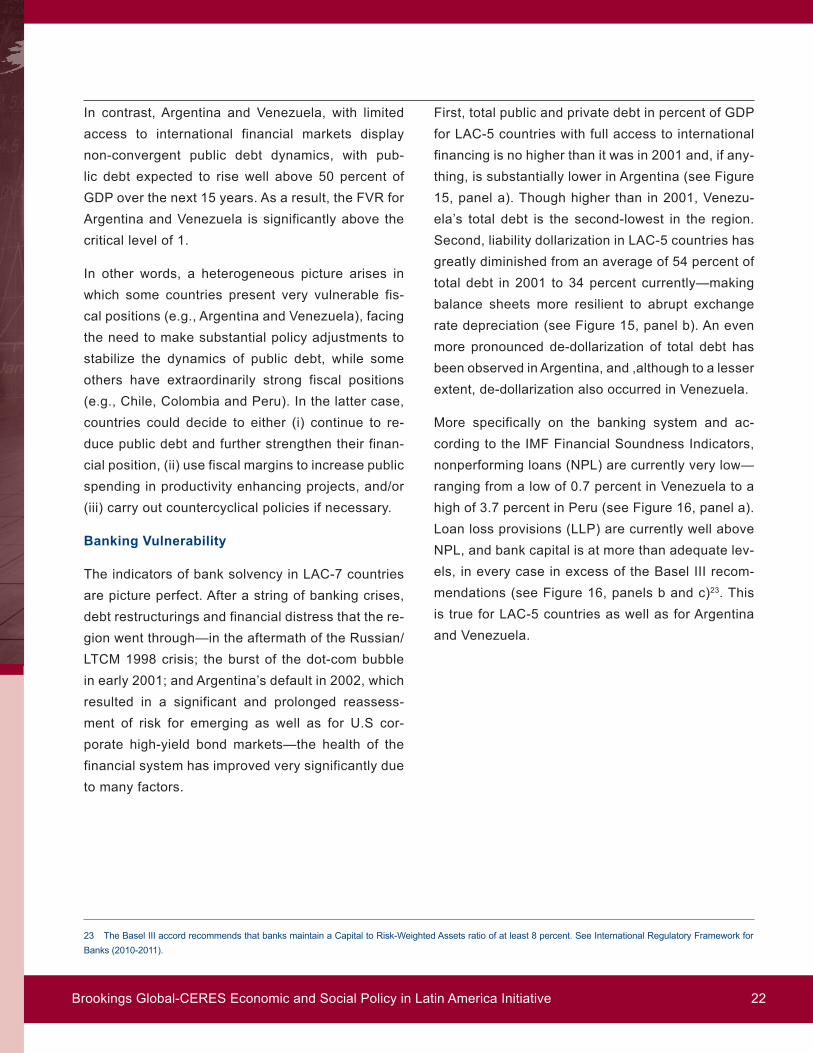
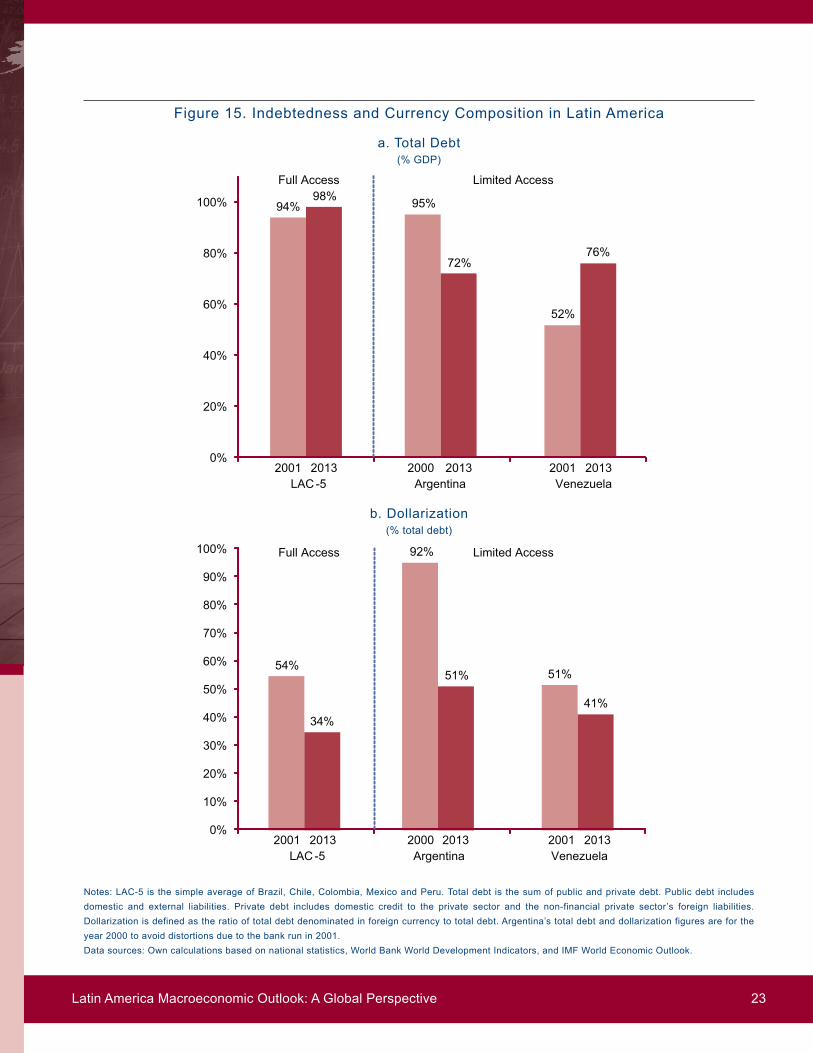
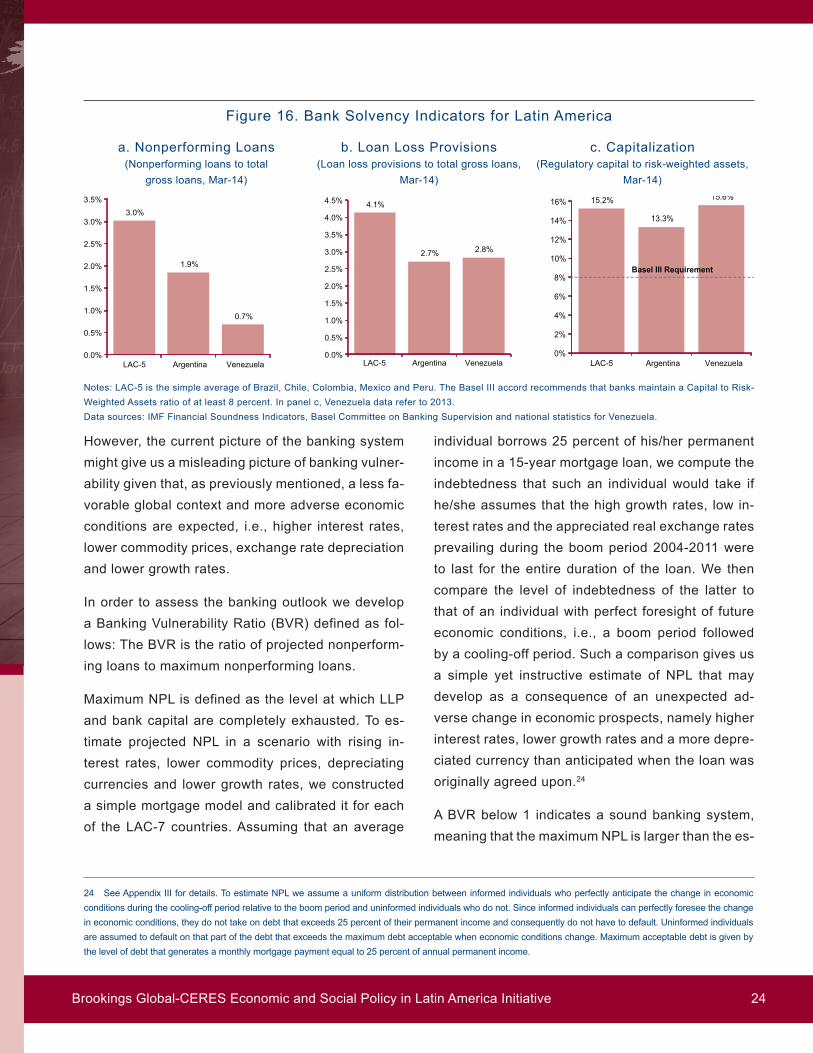
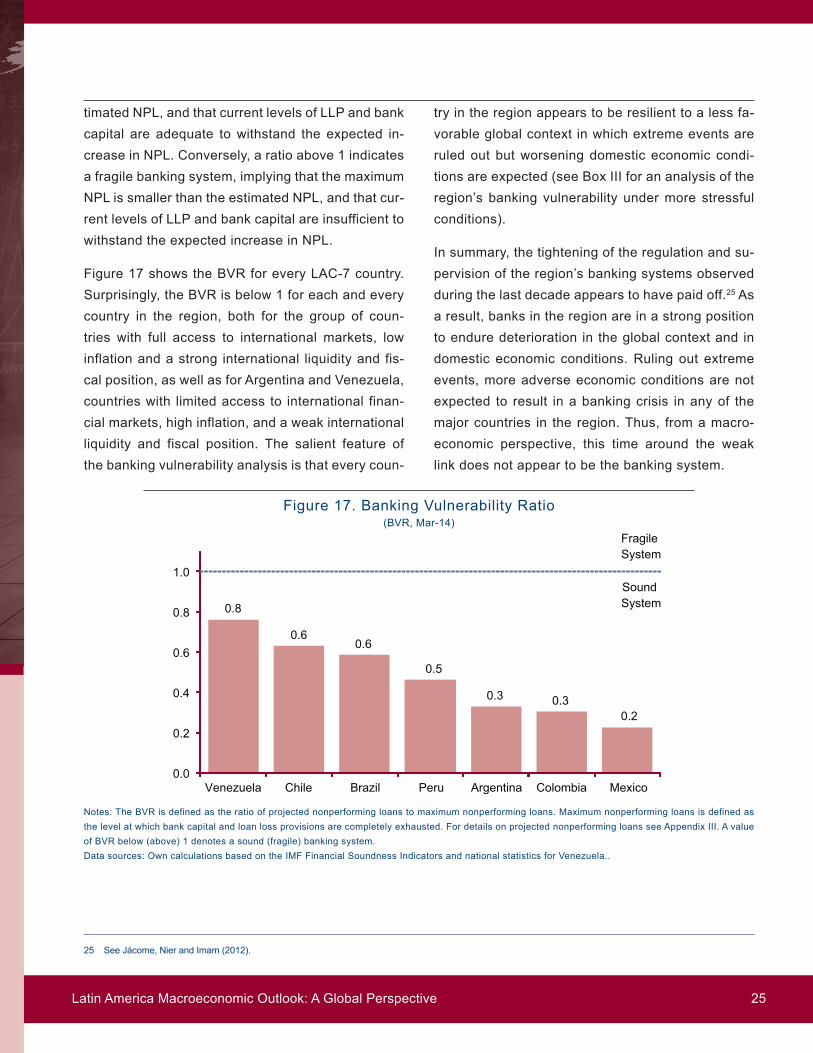
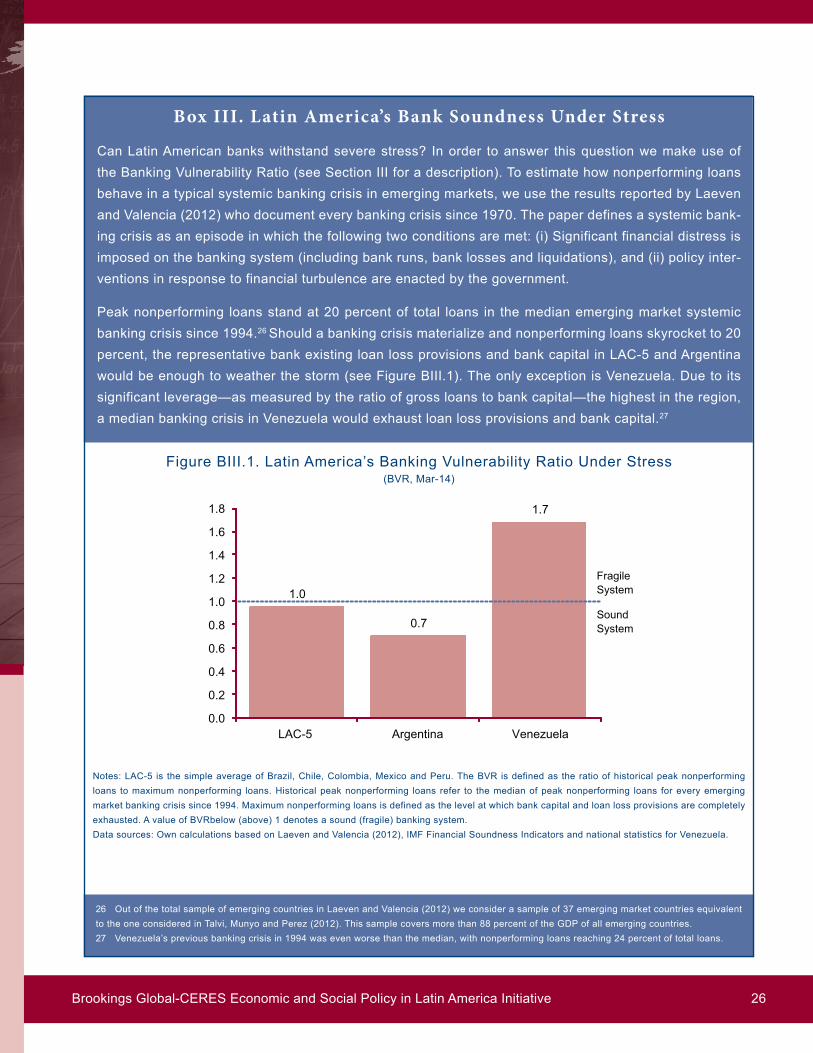
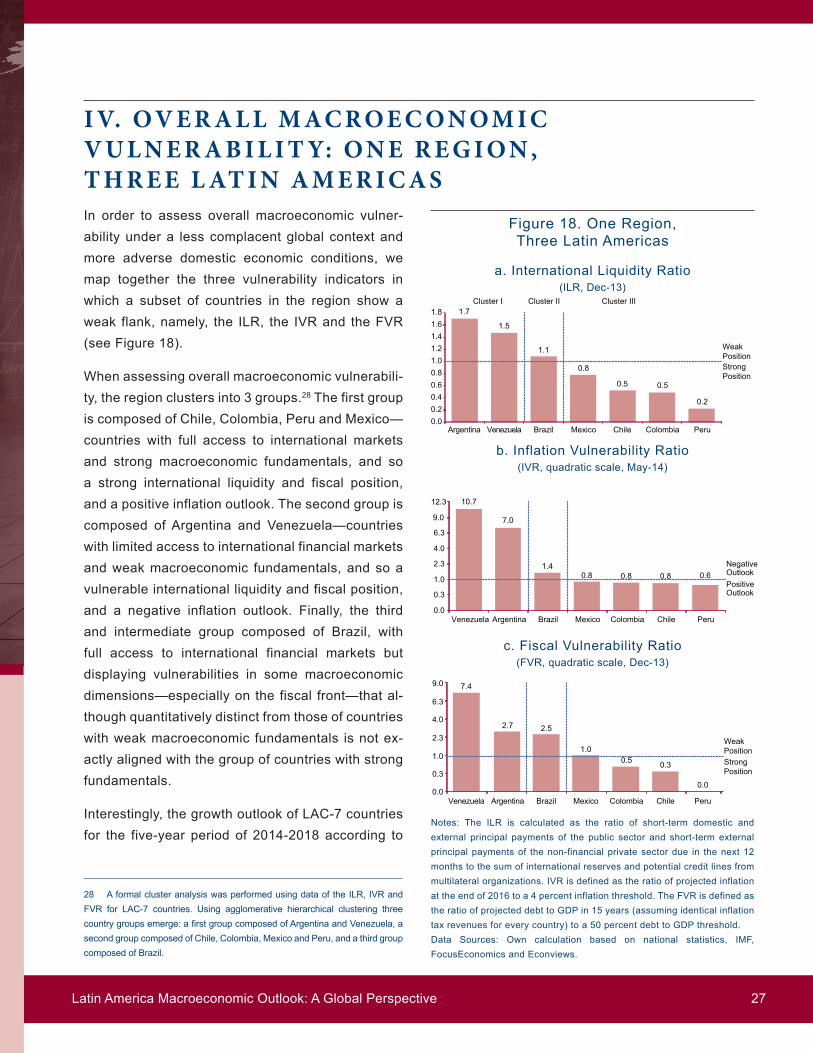
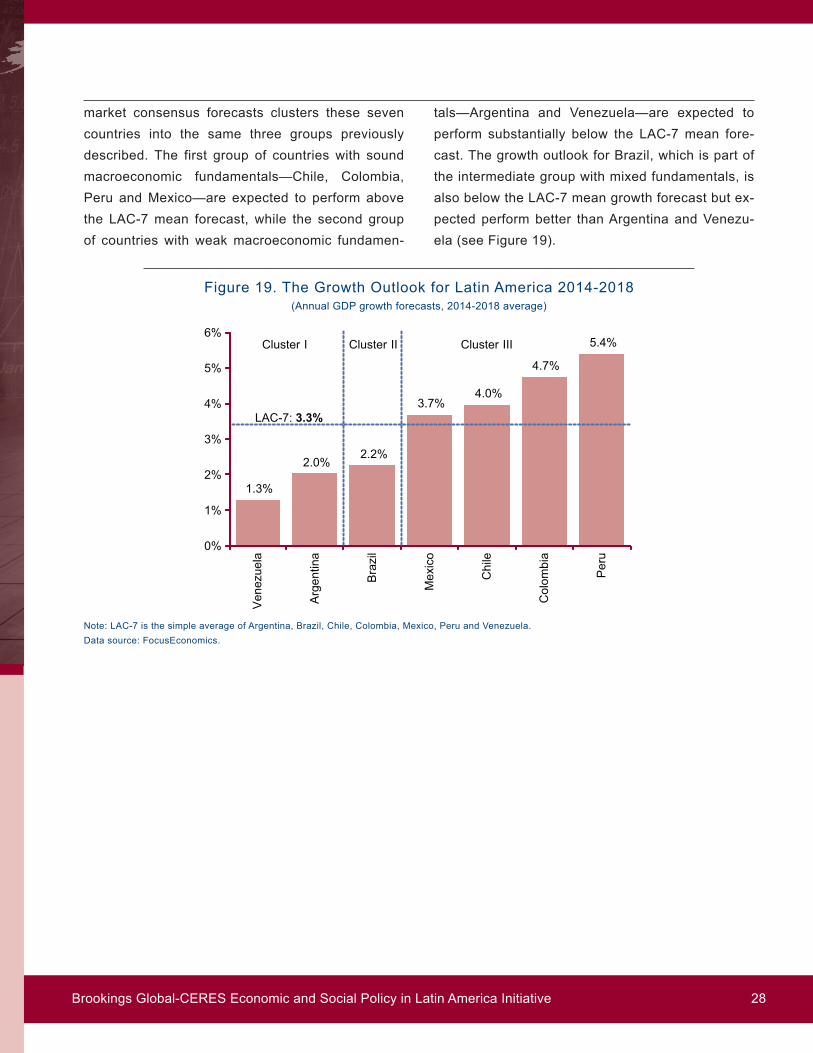
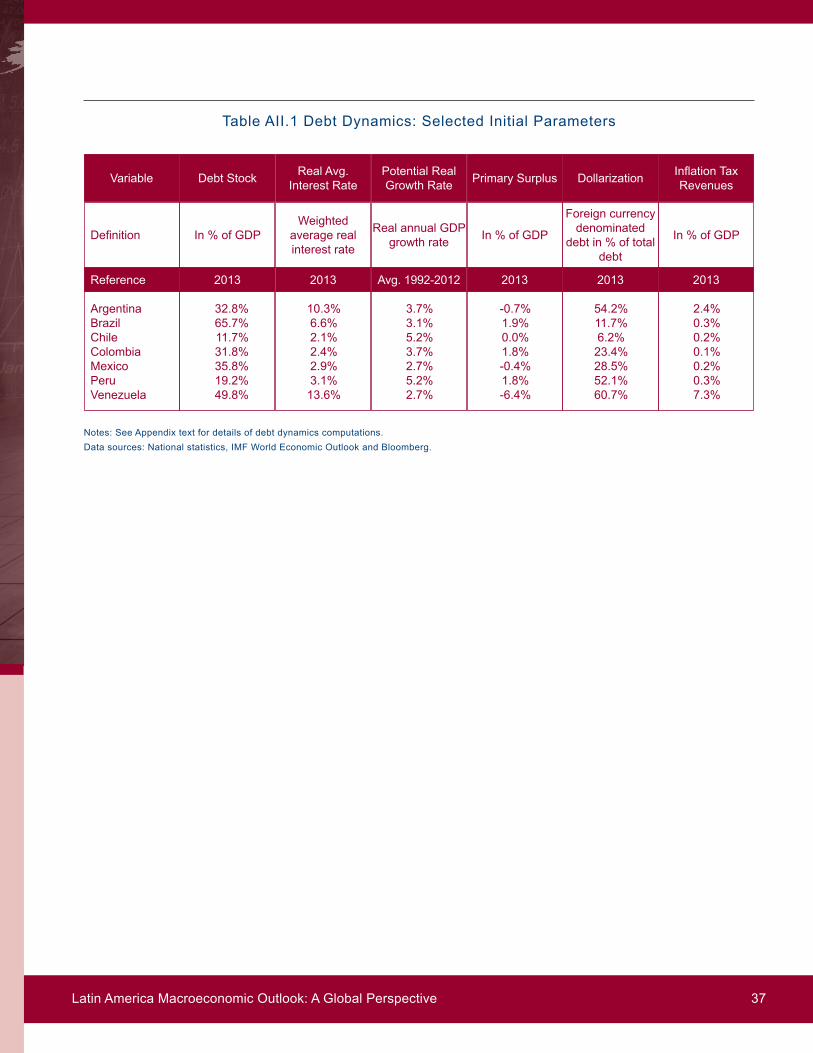
1775 Massachusetts Avenue NWWashington DC 20036202-797-6000wwwbrookingseduglobal
CeresAntonio Costa 347611300 MontevideoUruguay+598 26287644wwwceres-uyorg