Embed Size (px)
Citation preview
Jon Laughner, PESC, November 14, [email protected]; 724‐774‐3003
Where are we going?
1. Shale’s Economic Drivers and Implications
2. Act 133. Utilization
2

The Bigger Picture
4
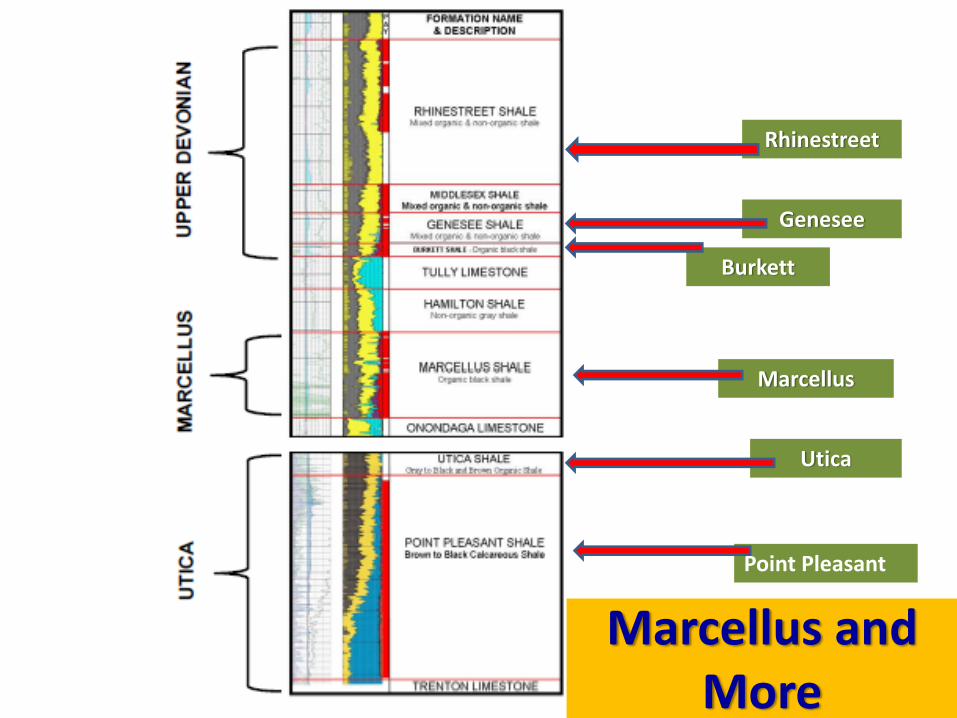
Marcellus and More
Rhinestreet
Genesee
Burkett
Marcellus
Utica
Point Pleasant
Baker Hughes 11‐5‐12
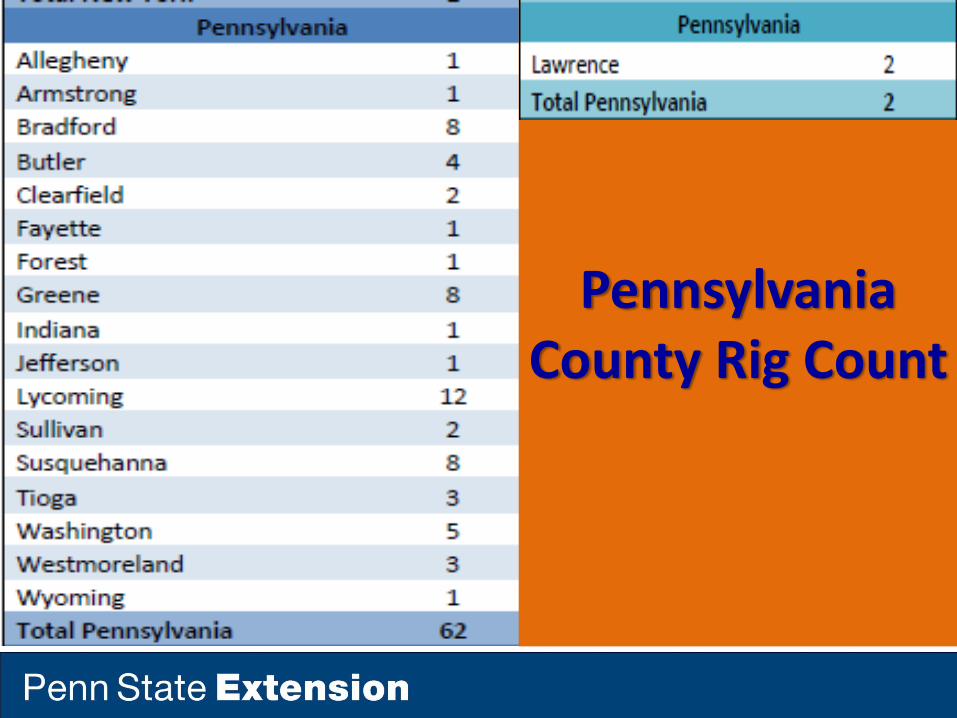
Pennsylvania County Rig Count
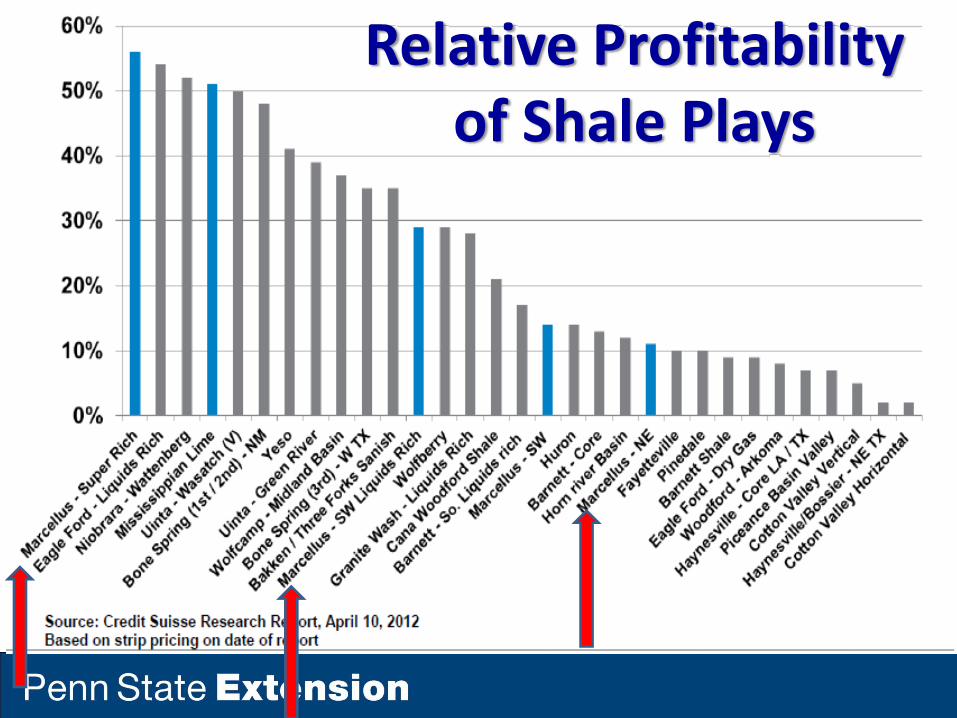
Relative Profitability of Shale Plays
0
20
40
60
80
100
120
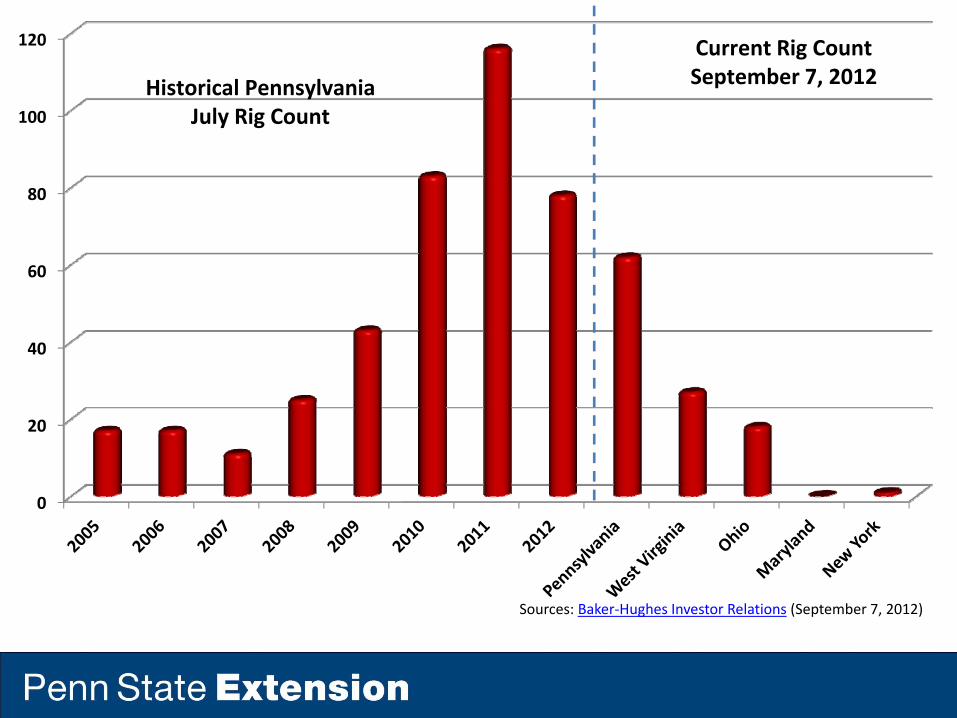
Historical Pennsylvania July Rig Count
Current Rig CountSeptember 7, 2012
Sources: Baker‐Hughes Investor Relations (September 7, 2012)

U.S. Natural Gas Supply, 1990‐2035
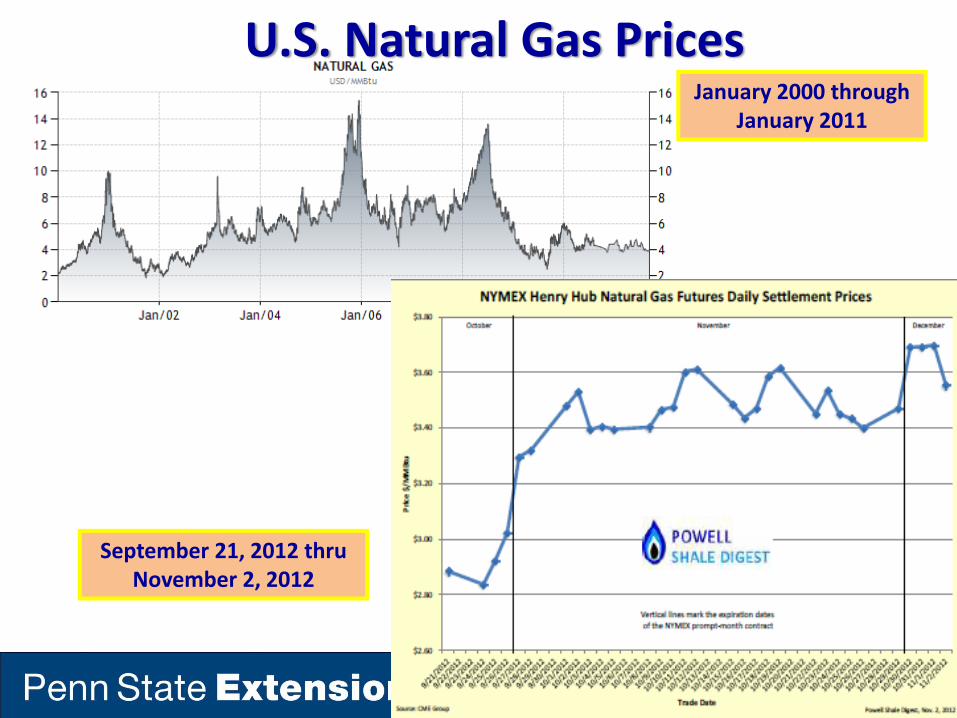
U.S. Natural Gas Prices
September 21, 2012 thru November 2, 2012
January 2000 through January 2011
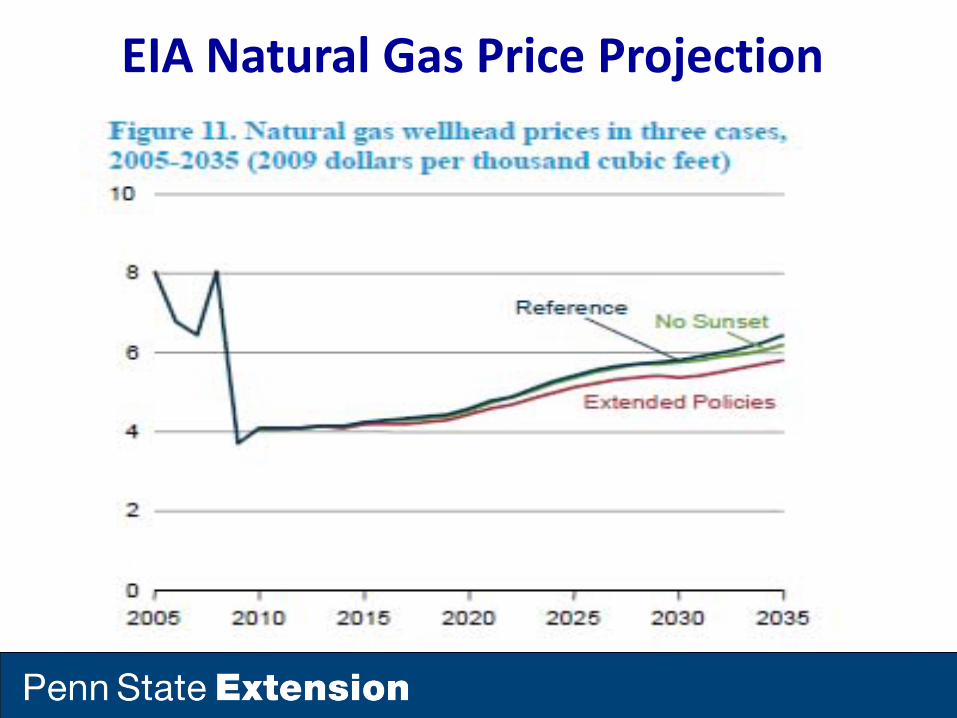
EIA Natural Gas Price Projection

Baker Hughes 8‐27‐12

0
25
50
75
100
125
1980 1985 1990 1995 2000 2005 2010 2015 2020 2025 2030 2035
Renewables grow rapidly, but under current policies fossil fuels still provide 78% of U.S. energy use in 2035
Richard Newell, December 16, 2010
U.S. primary energy consumptionquadrillion Btu per year
Coal
Oil and other liquid fuels
Natural gas
ProjectionsHistory
Nuclear
Liquid biofuels
Renewables (excluding liquid biofuels)
Source: EIA, Annual Energy Outlook 2011
37%
25%
21%
9%
7%
1%
33%
24%
21%
10%
8%
3%
Shares of total U.S. energy
2009
2010
2010
, 2nd
2011
, Secon
d Half
2012
, First H
alf
2011
, First H
alf

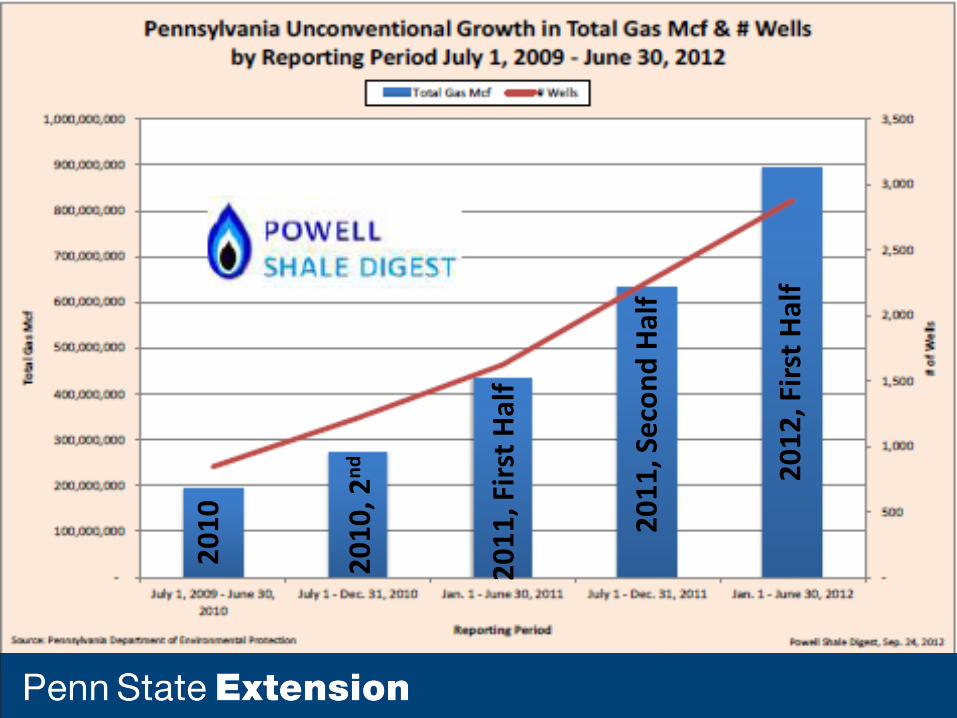
PA Unconventional Wells DrilledQuarterly Comparison 2011‐2012
Wells Drilled by Quarter:
Q3 2012 Q2 2012 Q1 2012 Q4 2011 Q3 2011 Q2 2011 Q12011
243 380 418 534 551 400 488
PA DEP, Shale Digest‐11‐5‐12
20112012
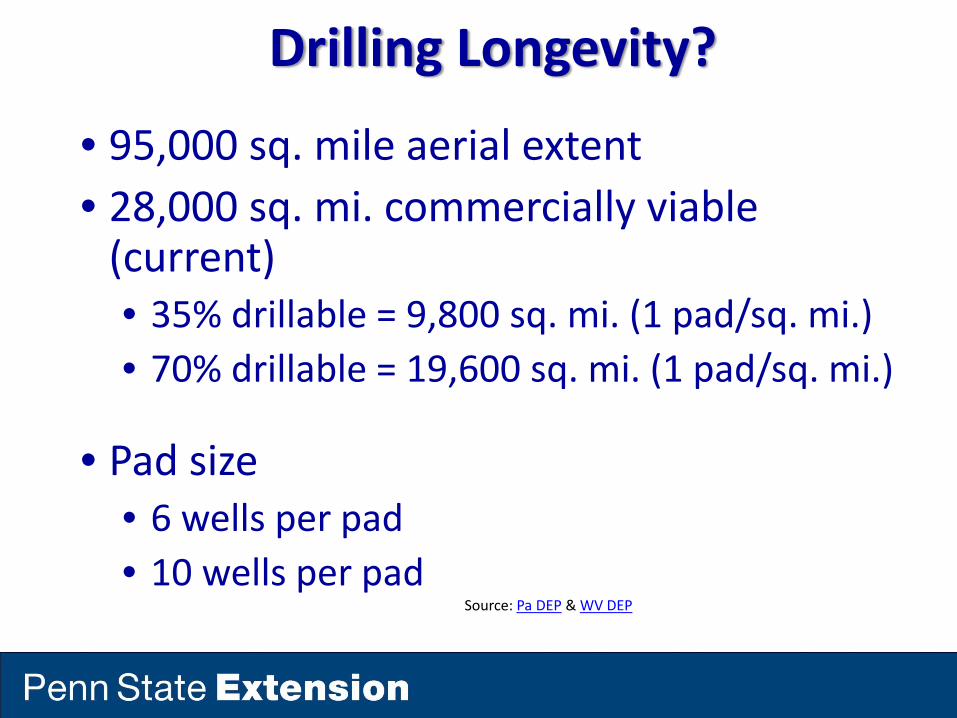
Drilling Longevity?
• 95,000 sq. mile aerial extent• 28,000 sq. mi. commercially viable (current)• 35% drillable = 9,800 sq. mi. (1 pad/sq. mi.)• 70% drillable = 19,600 sq. mi. (1 pad/sq. mi.)
• Pad size• 6 wells per pad• 10 wells per pad
Source: Pa DEP & WV DEP

How Much Drilling?• Total Wells
• 58,800 – 90,800 total wells (35% drillable)• 117,600 – 196,000 total wells (70% drillable)
The above example is provided as an illustration of scale, not as a forecast of future activity
• Current Activity• 5,800 Unconventional wells in PA• 1,700 Marcellus wells in WV (est.)• 140 Utica wells in OH
Source: Pa DEP & WV DEP
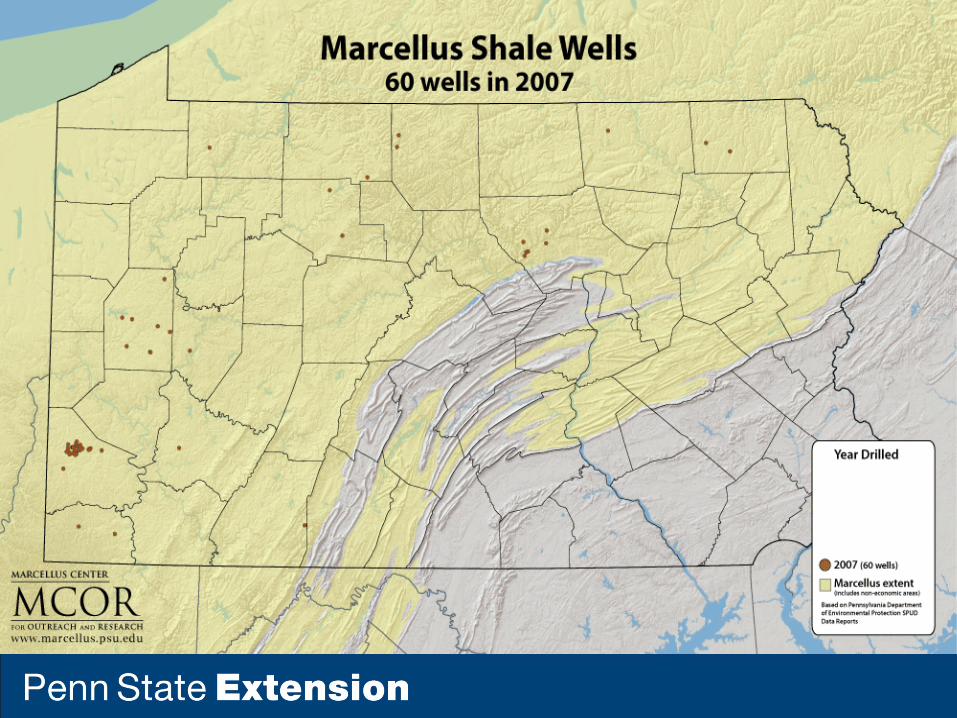
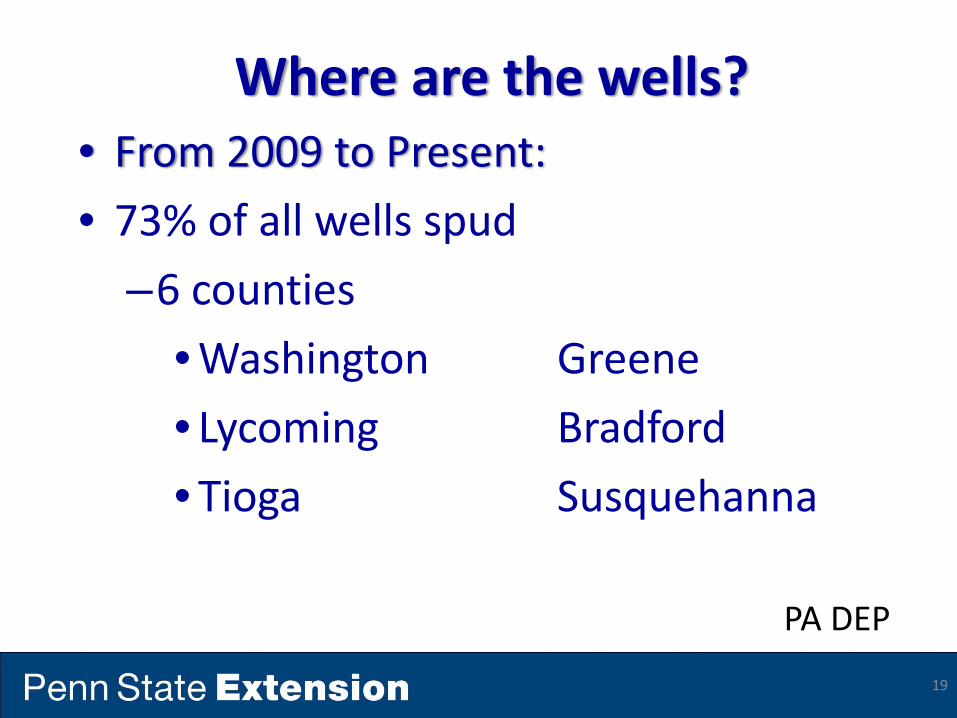
Where are the wells?• From 2009 to Present:• 73% of all wells spud
–6 counties•Washington Greene• Lycoming Bradford• Tioga Susquehanna
19
PA DEP

• Methane• Water• Gases
– Nitrogen, helium, some limited acidic gases like hydrogen sulfide
• Heavy gaseous hydrocarbons– Ethane Natural– Propane Gas– Butane Liquids
What comes out of a gas well?
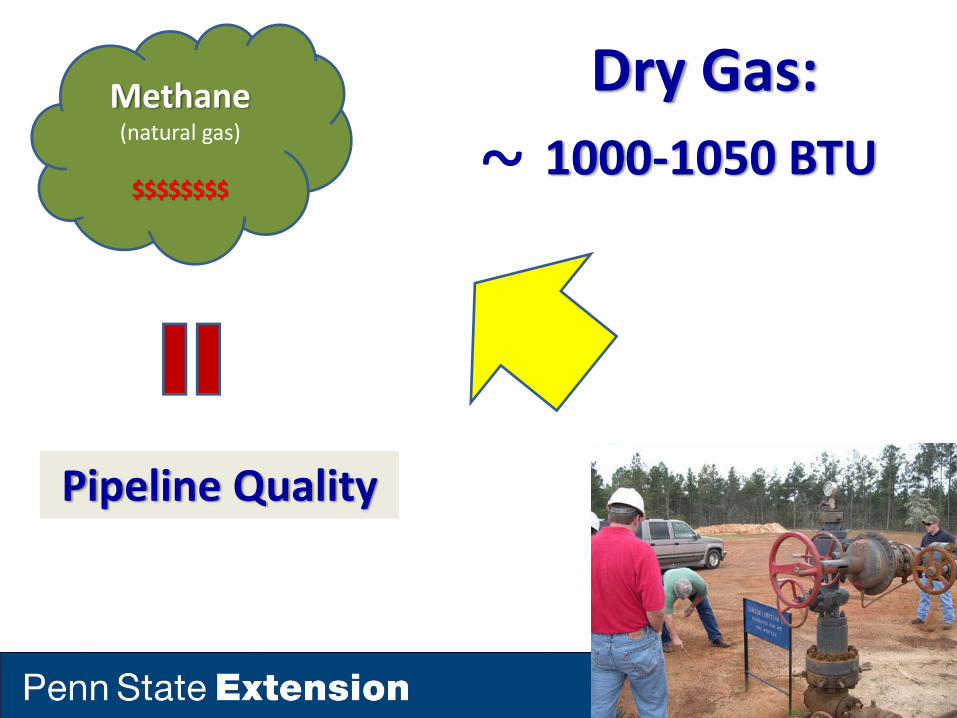
Dry Gas:Methane(natural gas)
$$$$$$$$ ~ 1000‐1050 BTU
Pipeline Quality
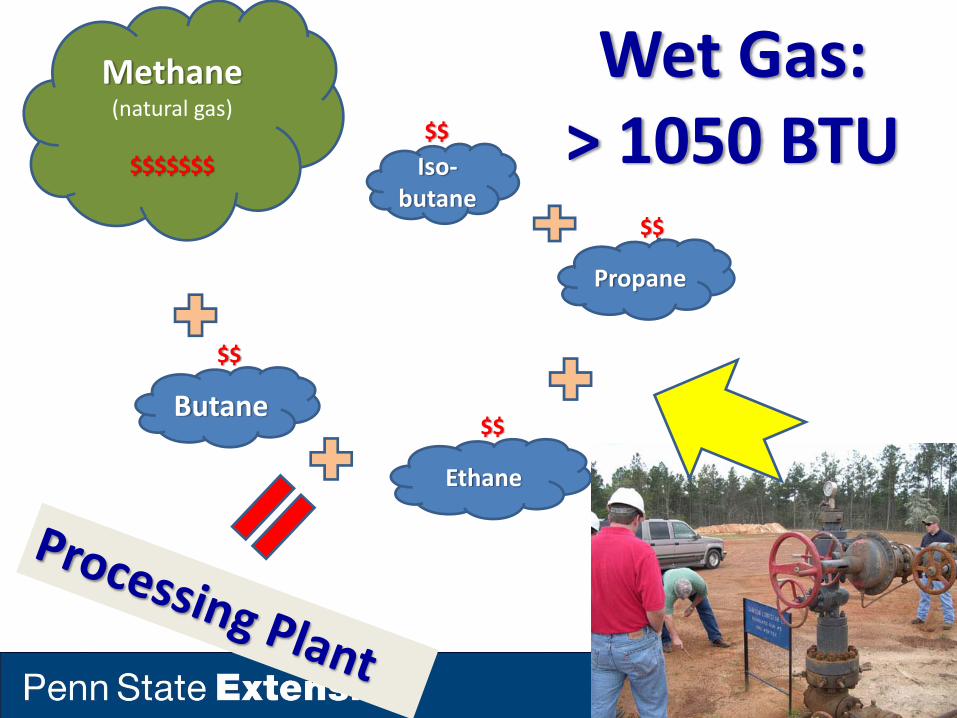
Wet Gas:> 1050 BTU
Methane(natural gas)
$$$$$$$
Propane
Butane
Ethane
Iso‐butane
$$
$$
$$
$$

Best Gas, Oil & Condensate Wells
• 19 of 25 top wells were in Susquehanna Co.• 28 wells produced oil
–1 well produced more than 8,500 barrels–3 wells produced more than 3,700 barrels
• 348 wells produced condensate–33 wells produced more than 5,000 barrels–135 wells produced 1,000‐5,000 barrels
Source: PA Department of Environmental Protection
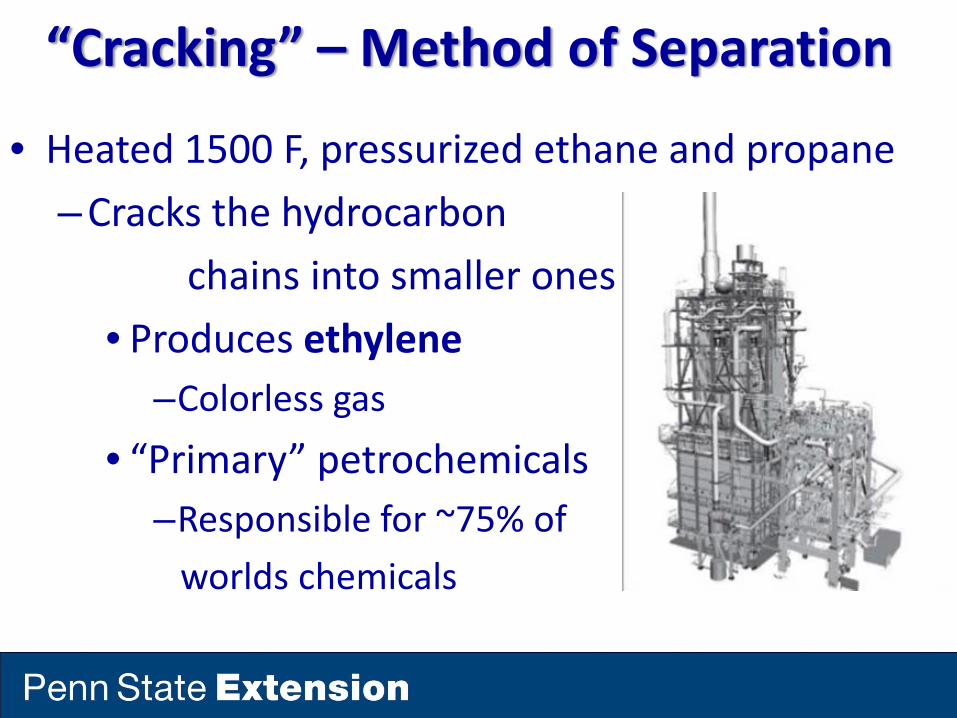
“Cracking” – Method of Separation
• Heated 1500 F, pressurized ethane and propane–Cracks the hydrocarbon
chains into smaller ones• Produces ethylene
–Colorless gas• “Primary” petrochemicals
–Responsible for ~75% of worlds chemicals
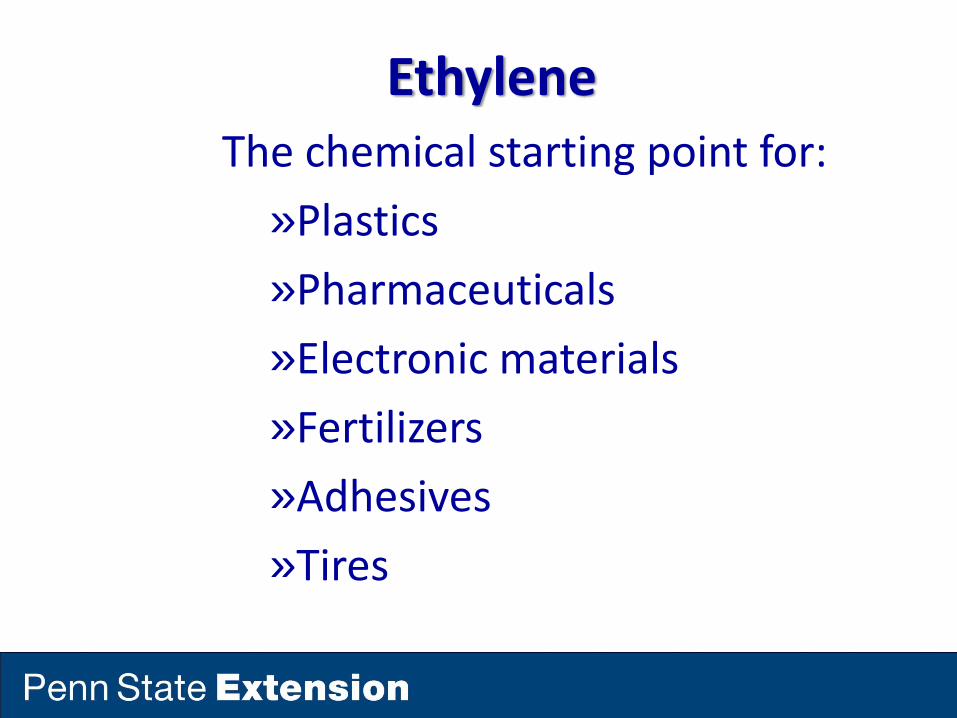
EthyleneThe chemical starting point for:
»Plastics»Pharmaceuticals»Electronic materials»Fertilizers»Adhesives»Tires
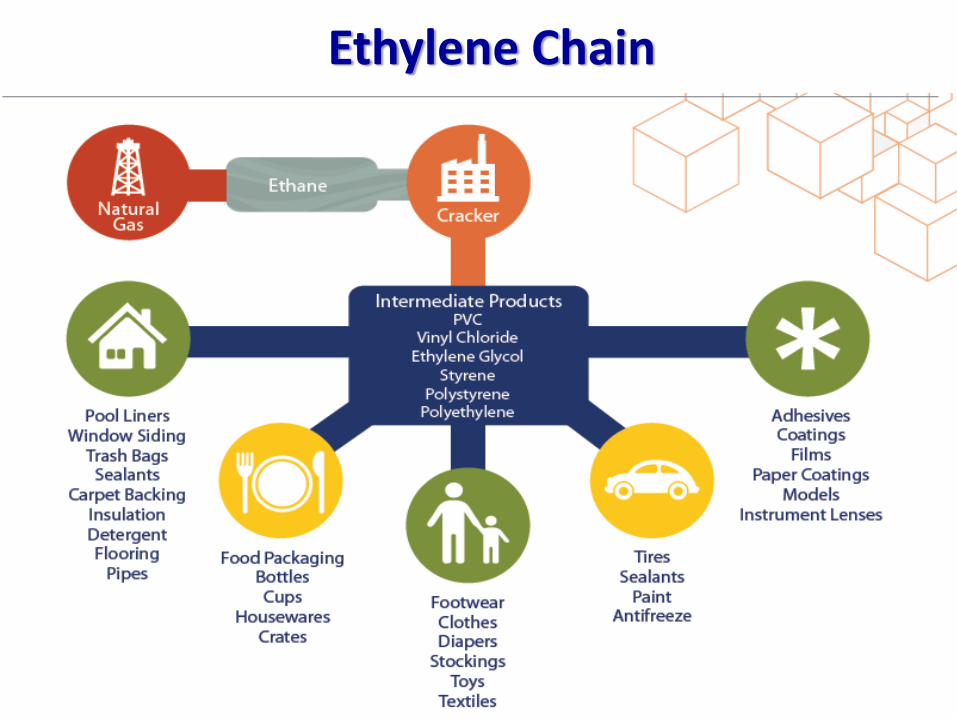
Ethylene Chain
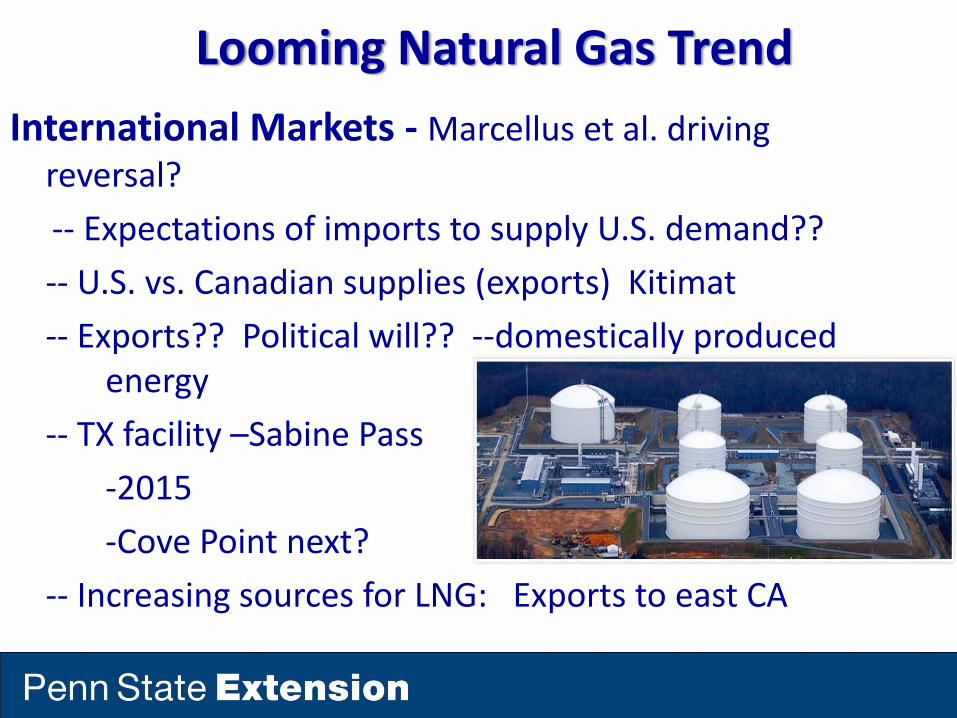
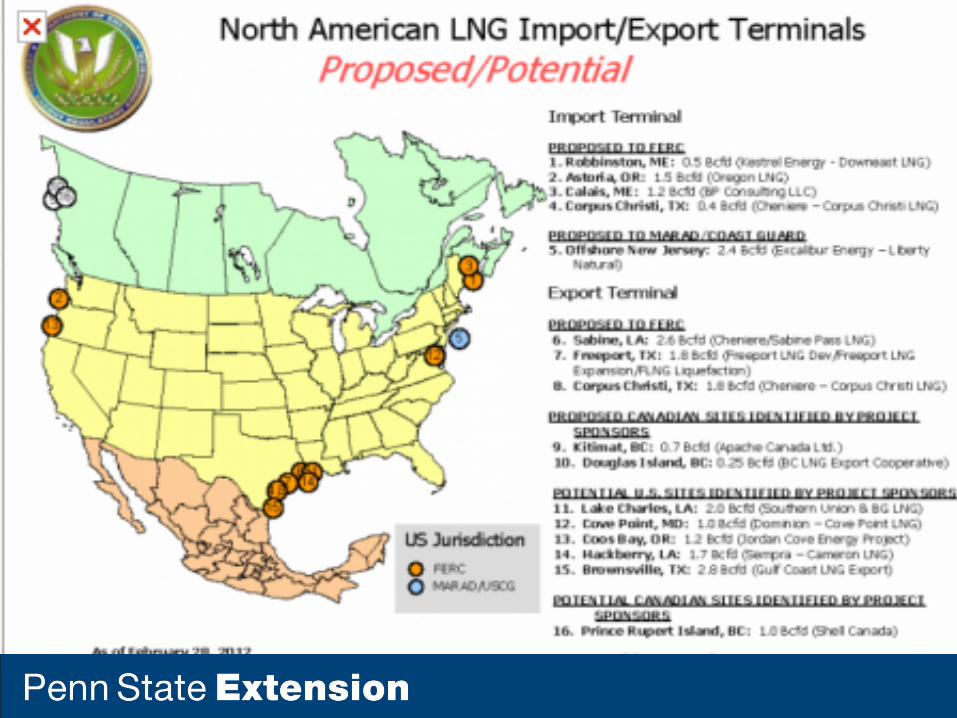
Looming Natural Gas TrendInternational Markets ‐Marcellus et al. driving reversal?‐‐ Expectations of imports to supply U.S. demand??‐‐ U.S. vs. Canadian supplies (exports) Kitimat‐‐ Exports?? Political will?? ‐‐domestically produced
energy‐‐ TX facility –Sabine Pass
‐2015‐Cove Point next?
‐‐ Increasing sources for LNG: Exports to east CA

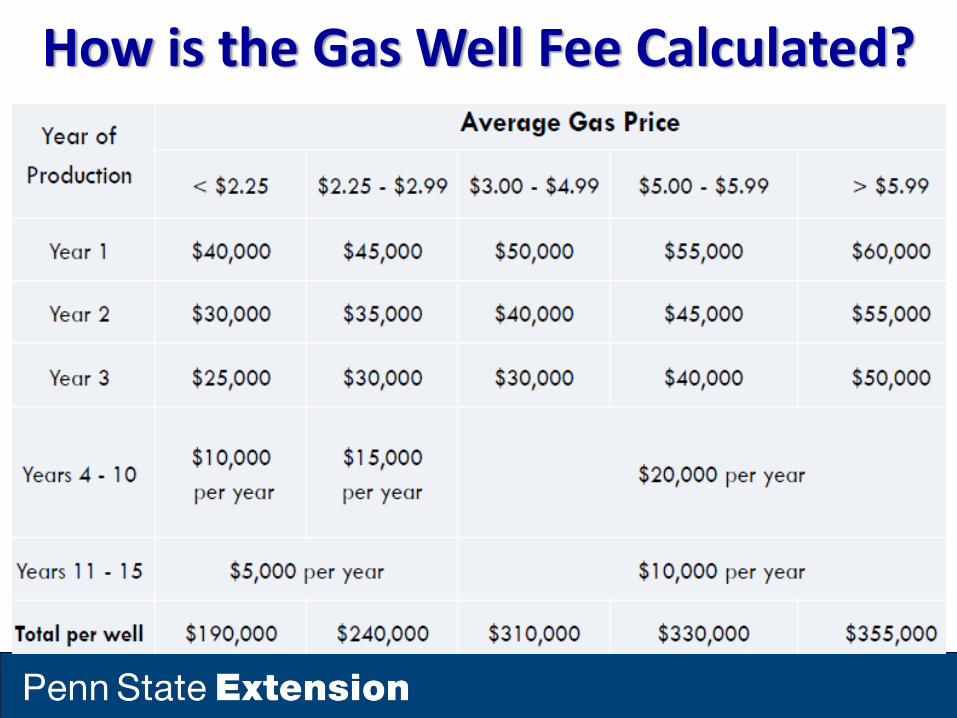
How is the Gas Well Fee Calculated?
Act 13 County/Local Government Impact Fee Disbursement
• Final Adjusted Amounts November 2, 2012– Initial amounts posted October 15, 2012– 36 pages
• http://www.puc.state.pa.us/NaturalGas/pdf/MarcellusShale/Act13‐County_Muncipality_Payments2011.pdf
• Road, bridge, and infrastructure
• Water, storm water and sewer
• Emergency preparedness and safety
• Environmental programs • Tax reductions • Affordable housing
• Records management and IT
• Social services • Judicial services • Planning initiatives • Career and technical centers
• Capital reserve fund
How can Act 13 funds be used?

How Will the Fees be Distributed?
• Collected by the PUC• “Off the Top”
– Selected State Agencies• Ex.: DEP, PEMA, State Fire Commissioner
• The Remaining?–60% to impacted local governments–40% for statewide initiatives
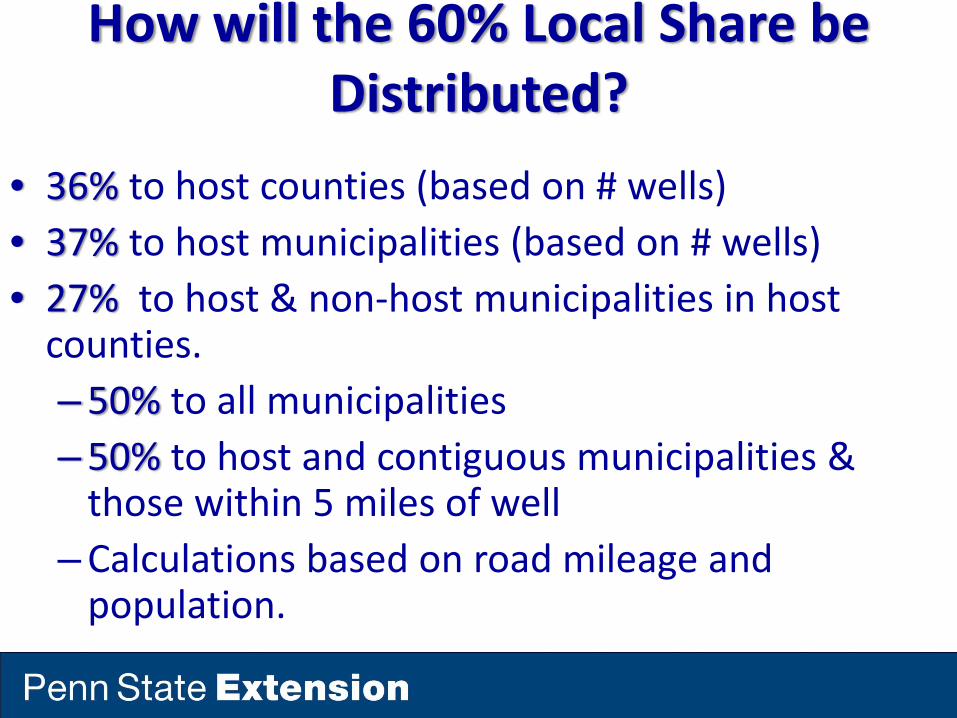
How will the 60% Local Share be Distributed?
• 36% to host counties (based on # wells)• 37% to host municipalities (based on # wells)• 27% to host & non‐host municipalities in host counties.–50% to all municipalities–50% to host and contiguous municipalities & those within 5 miles of well
–Calculations based on road mileage and population.
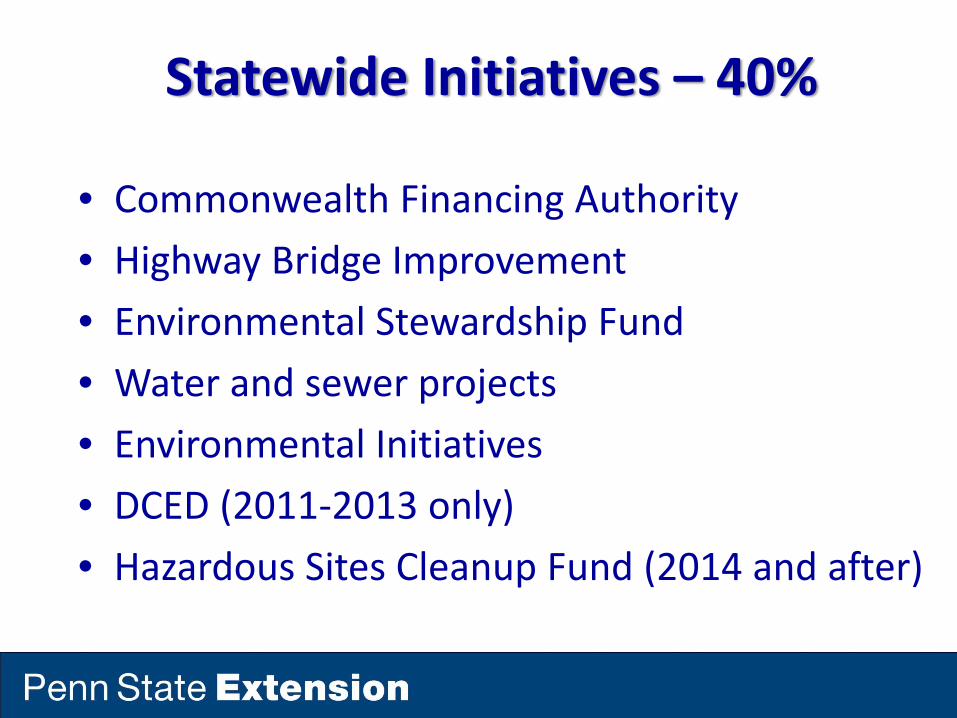
Statewide Initiatives – 40%
• Commonwealth Financing Authority• Highway Bridge Improvement• Environmental Stewardship Fund• Water and sewer projects• Environmental Initiatives• DCED (2011‐2013 only)• Hazardous Sites Cleanup Fund (2014 and after)

Statewide Initiatives – 40% (continued)
• Natural Gas Energy Development Program–For buying or converting vehicle fleets to natural gas
–Municipalities and authorities are eligible
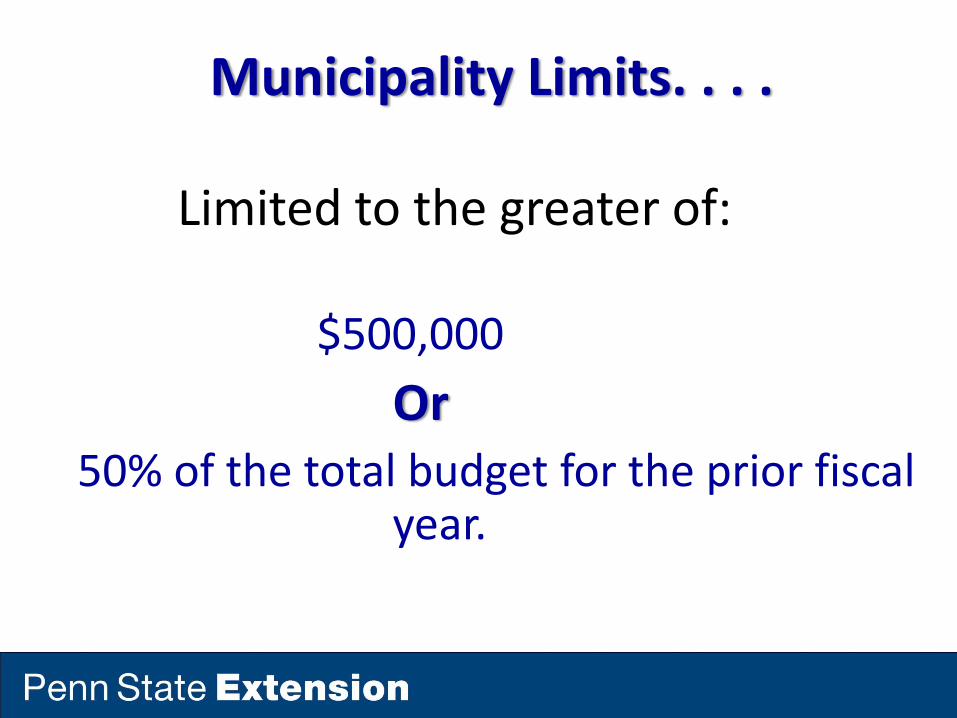
Municipality Limits. . . .
Limited to the greater of:
$500,000Or
50% of the total budget for the prior fiscal year.
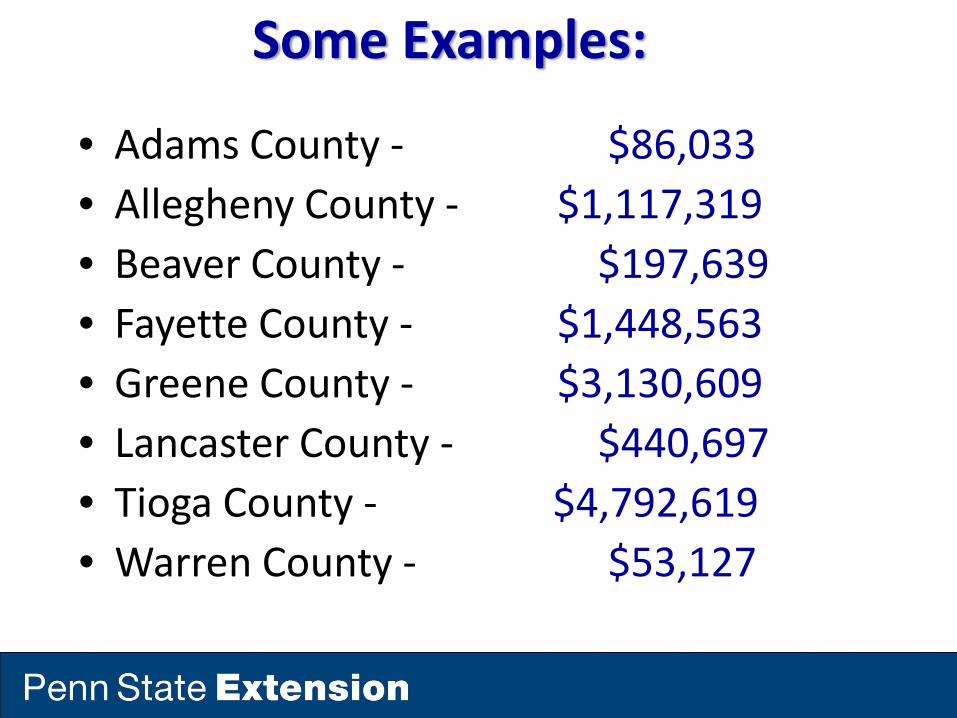
Some Examples:
• Adams County ‐ $86,033• Allegheny County ‐ $1,117,319• Beaver County ‐ $197,639• Fayette County ‐ $1,448,563• Greene County ‐ $3,130,609• Lancaster County ‐ $440,697• Tioga County ‐ $4,792,619• Warren County ‐ $53,127
Natural Gas Utilization Opportunities
A. IndustrialB. TransportationC. Power Generation

A. Industrial
• 50% of all energy consumed– 66% from natural gas and liquid fuels
• Top consumers– Chemical (including fertilizer) – 22%– Iron and steel manufacturing – 15%– Nonmetallic minerals production (including cement) – 6%
• Compressed natural gas (CNG) and liquefied natural gas (LNG) vehicles represent a significant potential to directly displace petroleum.
• Pennsylvania Turnpike Proposal–“create a clean natural gas corridor by placing CNG dispensers at fueling stations on the Pennsylvania Turnpike.”
B. Transportation

• CNG Fueling Stations–Home Base– Local governments
• Trash• Fleets
–Bus–Light‐duty trucks
• Compressed Natural Gas (CNG)
• Liquefied Natural Gas (LNG)
• Gas to Liquids (GTL)• Co‐fueling
–Diesel/Natural Gas– Electric/Natural Gas
B. Transportation
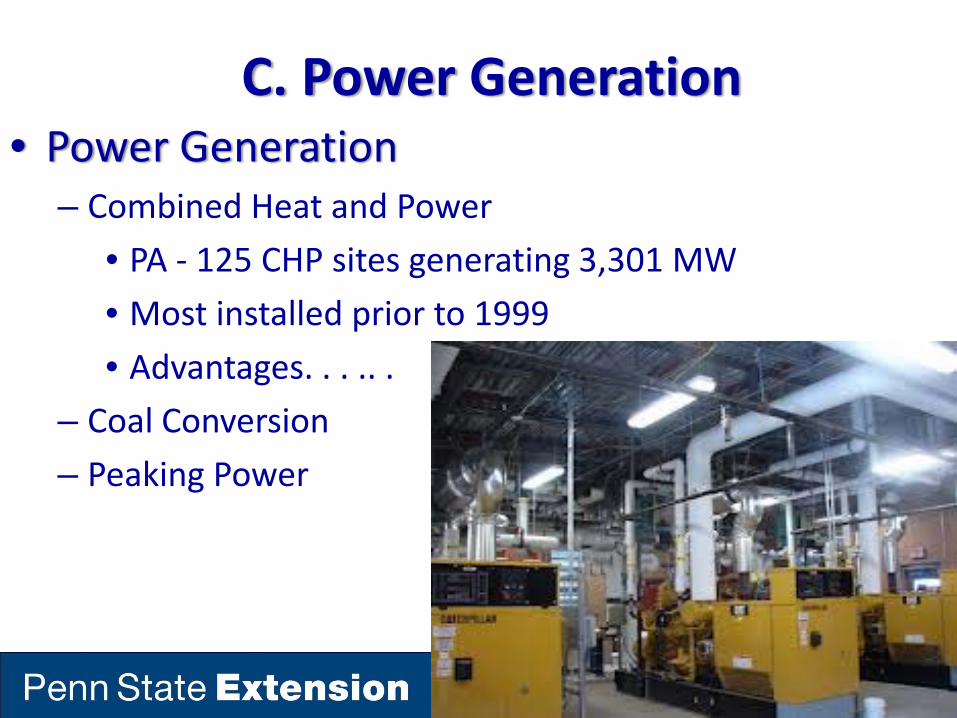
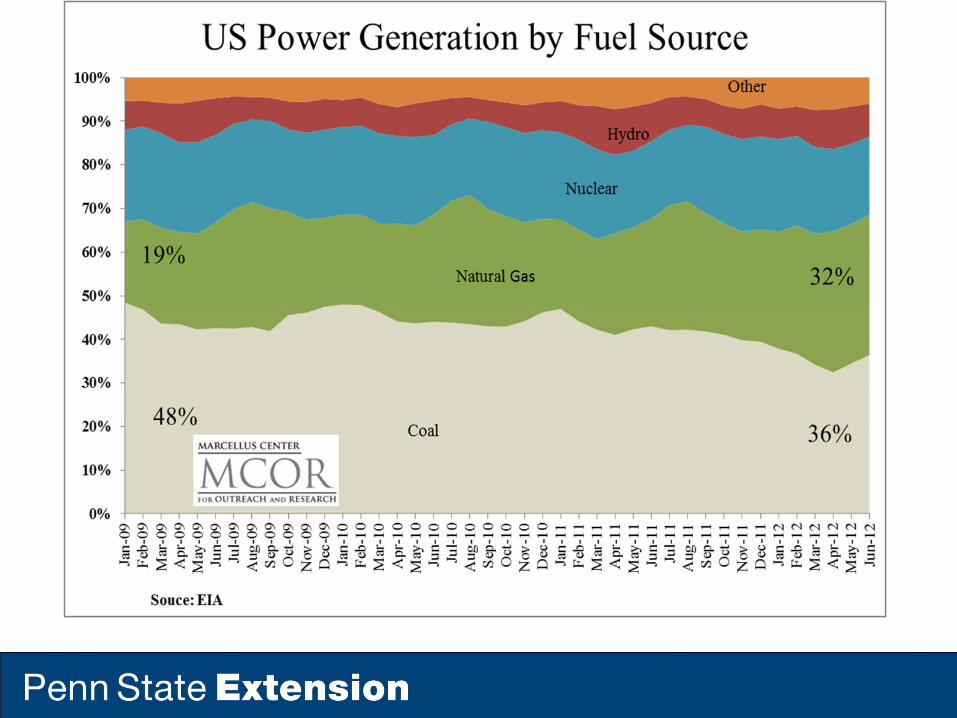
C. Power Generation• Power Generation
– Combined Heat and Power• PA ‐ 125 CHP sites generating 3,301 MW• Most installed prior to 1999• Advantages. . . .. .
– Coal Conversion– Peaking Power

Web Resources
• www.naturalgas.psu.edu• www.marcellus.psu.edu• www.msetc.org• PA DEP Bureau of Oil and
Gas Management
47© Penn State Extension, 2011

Thank you.