Embed Size (px)
Citation preview

Monoterpene production and regulation in
Lavenders
(Lavandula angustifolia
and
Lavandula x intermedia)
by
Astrid Boeckelmann
A THESIS SUBMITTED IN PARTIAL FULFILLMENT OF THE REQUIREMENTS FOR
THE DEGREE OF
MASTER OF SCIENCE
in
The College of Graduate Studies
Interdisciplinary Graduate Studies
UNIVERSITY OF BRITISH COLUMBIA
(Okanagan)
July 2008
© Astrid Boeckelmann, 2008

ii
ABSTRACT
Lavenders (Lavandula) are widely grown for their essential oils, which have extensive
applications in cosmetics, hygiene products and alternative medicine. The therapeutic and
olfactory properties of lavender essential oils are attributed to monoterpenes, a class of low
molecular weight (C10) isoprenoids. Oil composition in these plants is primarily determined by
plant genotype, but can also be influenced by developmental and environmental factors.
In order to define some of the mechanisms that control monoterpene abundance in
lavenders, I measured the abundance of quality-defining monoterpenes in several L.
angustifolia and L. x intermedia cultivars grown in the Okanagan. Data obtained confirmed
that essential oil yield, as well as the abundance of camphor, borneol, linalool, and limonene
was species-specific. L. angustifolia cultivars contained high amounts of linalool but yielded
little oil, whereas L. x intermedia cultivars were rich in camphor and total oil. Monoterpene
abundance changed during flower development, and differed between vegetative and
reproductive tissues indicating differential regulation of the biosynthetic pathways, or
specialized ecological functions. The abundance of linalool correlated with the transcription of
the linalool synthase gene, suggesting that linalool production is in part regulated
transcriptionally. However, the degree of correlation between linalool abundance and linalool
synthase transcription differed between L. angustifolia and L. x intermedia, suggesting
additional, and differing mechanisms that control linalool abundance in these species. In
addition, monoterpene abundances were subject to loss during storage and suboptimal
detection, two factors that must be considered in future analyses. Results obtained in this study
provide insight into the regulation of monoterpene production in lavenders, and build the basis
for future research aimed at improving essential oil production in these plants.

iii
TABLE OF CONTENTS
ABSTRACT ............................................................................................................................... II
TABLE OF CONTENTS ......................................................................................................... III
LIST OF FIGURES ................................................................................................................ VII
LIST OF TABLES ................................................................................................................. VIII
LIST OF ABBREVIATIONS .................................................................................................. IX
ACKNOWLEDGEMENTS ...................................................................................................... X
1. INTRODUCTION ............................................................................................................... 1
1.1. The genus Lavandula ............................................................................................ 1
1.2. Lavender: Medicinal and commercial application ............................................ 2
1.3. Lavender essential oil ........................................................................................... 2
1.4. Terpene biosynthesis ............................................................................................ 3
1.4.1. Isoprene biosynthesis .................................................................................. 4
1.4.2. Biosynthesis of higher terpenes (condensation of IPP and DMAPP) ......... 5
1.4.3. Monoterpene biosynthesis ........................................................................... 6
1.5. Monoterpene storage and secretion .................................................................... 8
1.5.1. Compartmentalization within glandular trichomes ..................................... 9
1.6. Regulation of monoterpene biosynthesis .......................................................... 10
1.6.1. Environmental regulation of monoterpene production ............................. 10
1.6.2. Developmental regulation of monoterpene production............................. 11
1.6.3. Regulation of monoterpene production through gene expression............. 11
1.7. Monoterpene abundance and regulation in lavender ..................................... 12
2. MATERIALS AND METHODS ..................................................................................... 22
2.1. Chemicals and reagents ...................................................................................... 22
2.2. Bacteria and plasmids ........................................................................................ 22
iv
2.3. Plant material ...................................................................................................... 22
2.4. Plant harvest........................................................................................................ 23
2.5. Essential oil analysis ........................................................................................... 23
2.5.1. Essential oil extraction .............................................................................. 24
2.5.2. Gas Chromatography / Mass Spectrometry (GC/MS) analysis of essential
oil .............................................................................................................. 24
2.5.3. Monoterpene identification ....................................................................... 25
2.5.4. Monoterpene quantitation ......................................................................... 25
2.5.4.1. Relative monoterpene abundance ............................................................. 25
2.5.4.2. Absolute monoterpene abundance ............................................................ 25
2.5.4.3. Total oil abundance ................................................................................... 26
2.5.5. Accuracy of monoterpene quantitation ..................................................... 26
2.5.5.1. Limit of detection and quantitation ........................................................... 26
2.5.5.2. Detection efficiency .................................................................................. 26
2.5.5.3. Monoterpene stability................................................................................ 27
2.5.6. Limitations of monoterpene quantitation .................................................. 27
2.6. Statistical analysis ............................................................................................... 28
2.7. Isolation and reverse transcription of messenger RNA .................................. 28
2.8. Polymerase Chain Reaction (PCR) ................................................................... 29
2.8.1. Gradient PCR ............................................................................................ 29
2.8.2. Reverse Transcriptase PCR (RT-PCR) ..................................................... 29
2.8.3. Semi-quantitative PCR .............................................................................. 30
2.8.4. Real-Time PCR ......................................................................................... 30
2.9. Isolation and amplification of monoterpene synthase genes .......................... 31
2.10. Agarose gel electrophoresis ................................................................................ 31
2.11. Purification of DNA fragments.......................................................................... 32
2.11.1. Column purification .................................................................................. 32
2.11.2. Purification of DNA by agarose gel electrophoresis ................................. 32
2.12. Ligation ................................................................................................................ 32

v
2.13. Transformation of E. coli DH5α/DH10B .......................................................... 33
2.13.1. Transformation by heatshock .................................................................... 33
2.13.2. Transformation by electroporation ............................................................ 33
2.14. Preparation of electro-competent DH10B ........................................................ 33
2.15. Transformation analysis .................................................................................... 34
2.15.1. Colony PCR .............................................................................................. 34
2.15.2. Restriction analysis ................................................................................... 34
2.16. Plasmid purification ........................................................................................... 34
2.16.1. Spin column purification ........................................................................... 34
2.16.2. Purification by alkaline lysis ..................................................................... 35
2.17. General restriction digest ................................................................................... 35
2.18. Restriction digest of monoterpene-synthase vector plasmids ......................... 35
2.19. Sequence analysis ................................................................................................ 35
2.20. SDS-Polyacrylamide-gel-electrophoresis (SDS-PAGE) .................................. 36
2.20.1. Preparation of SDS-polyacrylamide gels .................................................. 36
2.20.2. Sample preparation for SDS-gel electrophoresis ...................................... 36
2.20.3. SDS-Gel-electrophoresis ........................................................................... 36
2.20.4. Coomassie™ staining ................................................................................ 36
2.21. Cloning and expression of linalool synthase ..................................................... 37
2.22. Heterologous gene expression of linalool synthase .......................................... 37
2.23. Heterologous protein expression of linalool synthase ..................................... 38
2.24. Protein purification ............................................................................................ 38
2.24.1. Purification of total cell protein ................................................................ 38
2.24.2. Purification of soluble protein ................................................................... 38
2.24.3. Purification of inclusion-bodies ................................................................ 39
2.25. In vitro functional assay ..................................................................................... 39

vi
3. RESULTS .......................................................................................................................... 47
3.1. Analysis of essential oil from different lavender varieties .............................. 47
3.2. Monoterpene abundance during lavender development ................................ 48
3.2.1. Relative abundance of monoterpenes in Grosso and Munstead flowers ... 48
3.2.2. Monoterpene abundance in lavender leaves ............................................. 49
3.2.3. Total oil yield of Grosso and Munstead tissue .......................................... 49
3.2.4. Absolute abundance of monoterpenes in Grosso and Munstead .............. 50
3.3. Isolation of a putative linalool synthase from L. x intermedia ........................ 50
3.4. Heterologous expression and functional analysis of a putative L. x intermedia
LIS ........................................................................................................................ 51
3.5. Correlation of linalool abundance and LIS gene expression .......................... 52
4. DISCUSSION .................................................................................................................... 65
4.1. Monoterpene abundance is species-specific ..................................................... 65
4.2. Camphor abundance as an indication of the camphor biosynthetic
pathway ................................................................................................................ 67
4.3. An ecological view of the tissue-specific expression of monoterpenes ........... 68
4.4. Isolation of a putative linalool synthase from L. x intermedia ........................ 69
4.5. LIS transcription correlates with linalool abundance during flower
ontogeny ............................................................................................................... 70
4.6. Conclusion and future prospects ....................................................................... 71
5. REFERENCES .................................................................................................................. 76

vii
LIST OF FIGURES
Figure 1: Subgenus, sections, species and cultivars within the genus Lavandula ..................... 14
Figure 2: Biosynthesis of IPP and DMAPP via the mevalonate pathway and the mevalonate-
independent (DXP) pathway....................................................................................................... 16
Figure 3: Terpene biosynthesis. ................................................................................................. 18
Figure 4: Selection of monoterpenes generated from geranyl diphosphate (GPP). ................... 19
Figure 5: Glandular trichomes. .................................................................................................. 20
Figure 6: Likens-Nickerson apparatus equipped with a standard condenser used for steam
distillation solvent extraction.. .................................................................................................... 44
Figure 7: Vector map of pAB007. ............................................................................................. 45
Figure 8: Vector map for pAB040. ............................................................................................ 46
Figure 9: Amino acid sequence alignment of L. angustifolia LIS and a putative LIS (pAB007)
isolated from L. x intermedia cv. Grosso flowers. ...................................................................... 60
Figure 10: Heterologous expression of putative L. x intermedia LIS. ....................................... 61
Figure 11: Comparison of linalool concentration and LIS transcription during Munstead
development. ............................................................................................................................... 63
Figure 12: Comparison of linalool concentration and Lxi-LIS transcription during Grosso
development. ............................................................................................................................... 64
Figure 13: Putative camphor biosynthetic pathway. .................................................................. 74
Figure 14: Neighbour-joining phylogenetic tree of selected linalool synthases.. ...................... 75

viii
LIST OF TABLES
Table 1: Major mono- and sesquiterpenes in English lavender, Lavandin and Spike lavender 15
Table 2: Supplier and genotype of bacterial hosts ..................................................................... 41
Table 3: Developmental stages of Lavandula x intermedia cv. Grosso .................................... 42
Table 4: Developmental stages of Lavandula angustifolia cv. Munstead ................................. 43
Table 5: Monoterpene content (%) and estimated amount of total oil (mg/g fresh weight)
extracted from Lavandula angustifolia cultivars grown in the Okanagan, 2007.. ..................... 54
Table 6: Monoterpene content (%) and estimated amount of total oil (mg/g fresh weight)
extracted from Lavandula x intermedia cultivars grown in the Okanagan, 2007. ..................... 55
Table 7: Comparison of the monoterpene percentage in L. angustifolia and L. x intermedia
cultivars. ..................................................................................................................................... 55
Table 8: Monoterpene content (%) during lavender development. ........................................... 56
Table 9: Monoterpene content (ng/gfWT) in L. x intermedia cv. Grosso and L. angustifolia cv.
Munstead during development. .................................................................................................. 58
Table 10: In vitro functional expression assay........................................................................... 62

ix
LIST OF ABBREVIATIONS
Aa Amino acid
BDH Bornyl dehydrogenase
Bp Base pair
BPP Bornyl diphosphate
BPPH Bornyl diphosphate hydrolase
BPPS Bornyl diphosphate synthase
carb50
50ug/ml carbenicillin
cDNA Complementary DNA
cv. Cultivar
DMAPP Dimethyl-allyl diphosphate
DXP Deoxy-xylulose-phosphate
EI mode Electro ionization mode
GC/MS Tandem Gas chromatography mass spectrometry
GPP Geranyl diphosphate
IPP Isopentyl diphosphate
IPTG Isopropyl β-D-1-thiogalactopyranoside
ISO International organization for standardization
LIS Linalool synthase
Lxi-LIS Lavandula x intermedia LIS
MEP Methyl-erythriol phosphate
mg/gfWT mg per gram fresh weight
mRNA Messenger RNA
MTS Monoterpene synthase
MVA Mevalonic acid
n.d. Non-detected
n/a Not available
ORF Open reading frame
PCR Polymerase chain reaction
RT-PCR Reverse-Transcriptase PCR
SDSE Steam distillation solvent extraction
SDS-gel Sodium dodecyl sulfate gel
SE Standard error
TPS Terpenoid synthase
U Unit- amount of the enzyme that catalyzes the conversion of 1
micro mole of substrate per minute
x
ACKNOWLEDGEMENTS
Special thanks to…
…My Supervisor, Dr. Soheil S. Mahmoud, for providing me with the opportunity to do
this research project as well as his ongoing advice and support.
…My committee members, Dr. Louise Nelson and Dr. Bruce Mathieson, as well as Dr.
Susan Murch for their patient advice and all the time they invested on commenting and
improving my thesis.
…Dr. Karen E. Hodges and Dr. David Jack, for being fabulous mentors, always having
an open door and an open ear, and a piece of wisdom to share.
…Alex Lane, Letitia Falk and Dr. Kamal Biswas, for being such great lab partners.
…Lori Mcaleese, for keeping the lavenders alive.
…The ‘Grad Gang’, for solidary rants, celebratory car bombs and late-night chocolate-
covered coffee beans. I don’t know what I would have done without you!
… UBC Okanagan, Natural Sciences and Engineering Research Council of Canada
(NSERC), Investment Agriculture Foundation of British Columbia (In partnership with
Government of Canada and Province of British Columbia), Canada Foundation for
Innovation, British Columbia Knowledge Development Fund and Western Economic
Diversification Canada for financial support.

1
1. INTRODUCTION
Lavender has been known and cultivated for centuries. The first written accounts can be
traced back to Dioscrides in about AD 65 (Upson and Andrews, 2004), while reports on its
application go as far back as to Egyptian times where lavender flowers were used in the
mummification process (Chu and Kemper, 2001). The name of the genus Lavandula and its
common name lavender is generally believed to be derived from Latin, lavare, to wash.
However, since no written evidence exists to corroborate the use of lavender products in
Roman or Greek bathing, it is rather likely that Lavandula and lavender arose from the Latin
‘livere’, ‘to be livid or bluish’ in reference to the flower colour (Upson and Andrews, 2004).
1.1. The genus Lavandula
Lavandula, along with representatives of other genera like common sage (Salvia sp.),
mint (Mentha sp.) and thyme (Thymus sp.), is a member of the Lamiaceae family. The genus
consists of 25-35 sub-species, which display a diverse morphology. Lavenders are defined and
distinguished from all other Lamiaceae by the morphology of their flower. Their characteristic
compact terminal flower spike is borne on a long peduncle (flower stalk). The flower spike
consists of cymes, a branching determinate inflorescence with a flower at the end of each
branch, either in an opposite decussate or alternate spiral arrangement, which are subtended by
bracts (Lis-Balchin, 2002). In habit, lavenders vary from woody shrubs up to a meter in height,
to perennial woody-based shrubs or annual herbs. The leaves can be entirely or deeply
dissected and are often absent in some Arabian species (Lis-Balchin, 2002).
According to morphological characteristics, the genus Lavandula is subdivided into
three subgenera: Lavandula, Fabricia and Sabaudia. Each subgenus is further diversified into
sections, which dissociate into numerous species. For example, Lavandula encompasses the
sections Lavandula, Dentatae and Stoechas; L. angustifolia, L. latifolia and L. lanata represent
different species and Munstead is a L. angustifolia cultivar (Figure 1). It is important to note
that there are also intra-and intersectional hybrids, which arise from the natural or artificial
crossing of two different species. Lavandin (Lavandula x intermedia) is derived from a cross of
L. latifolia x L. angustifolia. It is extensively cultivated and one of the most prominent

2
lavenders worldwide (Upson and Andrews, 2004). Grosso is a well known representative of
this hybrid species (for complete reviews on lavender taxonomy refer to Lis-Balchin, 2002 and
Upson and Andrews, 2004).
1.2. Lavender: Medicinal and commercial application
Lavender has a long-standing history as a medical remedy. Lavender extracts have
traditionally been prescribed to treat infertility, infection, anxiety and fever, and have been
used as antidepressants, antispasmodics, antiflatulent agents, antiemetic remedies and diuretics
(Chu and Kemper, 2001). In recent years, lavender essential oil has gained a strong reputation
in aromatherapy and as a holistic relaxant to treat stress, anxiety, depression, fatigue or
insomnia (Chu and Kemper, 2001). Studies suggest that lavender aroma during recesses
prevents deterioration of work performance (Sakamoto et al., 2005) and might improve
memory and cognition in Alzheimer’s patients (Adsersen et al., 2005). There has been
increasing interest in perillyl alcohol, a monoterpene found in trace amounts in L. angustifolia
(Perrucci et al., 1994), due to its chemopreventative and chemotherapeutic properties (Schulz
et al., 1994, Hohl, 1996, Peffley and Gayen, 2003).
Next to its use as medicine, lavender is valued for its strong and pleasant fragrance. In
Victorian times lavender was known as an aphrodisiac; in the Medieval and Renaissance
periods it was used for the storage of laundry and to disguise objectionable odours (Chu and
Kemper, 2001). Nowadays, we commonly find lavender in a wide variety of perfumes and
soaps with the lavender-based perfumery/cosmetic industry growing worldwide.
1.3. Lavender essential oil
The medicinal and olfactory properties of lavender oil are mainly attributed to
monoterpenes, a class of volatile organic compounds that constitute lavender essential oil and
give lavender its characteristic aroma. Forty to fifty different monoterpenes can generally be
identified in lavender essential oil, with linalool, linalool acetate, 1,8-cineol, ß-ocimene
(usually both cis- and trans-), terpinene-4-ol and camphor as the major constituents (Kreis and
Mosandl, 1992, Flores et al., 2005).

3
The proportional composition of these compounds determines the quality of the
essential oil. High quality oil used in perfumery generally contains high percentages of linalool
and linalool acetate, while the oil fragrance deteriorates with increasing camphor ratios (Adam
2004). The quality of medicinally-utilized oil on the other hand is determined by the proportion
of monoterpenes with the desired biological activity. For instance, linalool acetate and linalool,
found in high amounts in L. angustifolia, have sedative, and local anesthetic effects. 1,8-
cineole, comprising over 50% of the essential oil of L. dentate, acts as a spasmolytic, local
anesthetic and antibacterial agent. Camphor, found in high concentrations in L. latifolia, α-
terpineol and terpenen-4-ol have antibacterial properties. Alpha-pinene, 1,8-cineole, β-pinene
and p-cymene have antifungal activity, while caryophyllene oxide, a sesquiterpene found in L.
latifolia and L. angustifolia, has anti-inflammatory effects (Chu and Kemper, 2001). As
exemplified for camphor proportions in lavender oil, oil classified as low quality for
perfumery, might be regarded as high quality oil when used medicinally.
The composition of an essential oil greatly depends on the species it is derived from
(Cavanagh and Wilkinson, 2002). As an example, the oil composition of three of the most
common lavenders, Lavandula angustifolia (formerly L. officinalis, English lavender), L.
latifolia (Spike lavender) and L. x intermedia (Lavandin) is given in Table 1.
Some of the finest oils are extracted from L. angustifolia, which has the highest ratio of
linalool to camphor. However, this species is small and difficult to propagate and hence low in
overall oil yield. Lavandin displays a less favourable linalool to camphor composition, but
plants are hardier and produce greater amounts of oil per acre even in cold climates like the UK
(Interactive European Network for Industrial Crops and their Applications (IENICA)
September 27, 2002). The choice of lavender variety is therefore a function of required oil
yield, required quality (higher quality oils for pure essential oils, fragrances and medical
application, lower quality oils for soaps and detergents) and the growth environment.
1.4. Terpene biosynthesis
Linalool and camphor are chemically characterized as monoterpenes. Monoterpenes,
the main constituents of lavender essential oil, belong to a large and diverse group of chemical
compounds termed ‘terpenes’. Terpenes are naturally occurring organic hydrocarbons, also
known as isoprenoids or terpenoids after oxidation or rearrangement of the carbon skeleton.

4
All terpenes are derived from the condensation of the 5-carbon unit isopentenyl diphosphate
(IPP) and its isomer dimethylallyl diphosphate (DMAPP). Depending on the number of
isoprene units linked together, terpenes are classified by size into hemiterpenes (C5),
monoterpenes (C10), sesqui- (C15), di- (C20), sester-, tri-, and tetraterpenes (C25, C30, C40,
respectively).
1.4.1. Isoprene biosynthesis
Until recently, it was assumed that IPP and DMAPP were exclusively synthesized from
mevalonate in the cytosol via the so called mevalonate or MVA pathway. In the first step of
this pathway, three molecules of acetyl-coenzyme (Co)A couple to yield 3-hydroxy-3-
methylglutaryl CoA (HMG-CoA), which is subsequently reduced by the enzyme HMG-CoA
reductase (HMGR) to yield mevalonic acid (MVA). In the next two steps, mevalonate kinase
and mevalonate 5-phosphate kinase phosphorylate MVA to form mevalonate 5-diphosphate,
which is subsequently decarboxylated to yield IPP (Figure 2) (Liu et al., 2005). Flux through
this pathway is regulated by the activity of HMGR in mammals and fungi (Chappell et al.,
1995). Studies investigating the regulatory role of HMGR in plants generally produced
controversial results. Overexpression of Hamster HMGR in tobacco plants for instance
favoured the accumulation of total sterols, while levels of other isoprenoids such as carotenoids
or the phytol chain of chlorophyll remained relatively unaltered in the transgenic plants
(Chappell et al., 1995). This controversy was later rationalized by the discovery of a novel
mevalonate independent pathway for IPP synthesis in plants (Rodriguez-Concepcion and
Boronat, 2002) and bacteria (Rohmer et al., 1993). This new pathway, commonly referred to as
DXP or MEP pathway, begins with a transketolase type condensation of pyruvate and
glyceraldehyde-3-phosphate to 1-deoxy-D-xylulose 5-phosphate (DOXP), catalyzed by DOXP
synthase (DXPS). DOXP is reduced by DX reductoisomerase (DXR) to 2-C-Methyl-D-
erythritol 4-phosphate (MEP). MEP synthesis is followed by formation of the cytidine 5-
diphosphate derivative, phosphorylation and cyclization to 2- C-methylerythritol-2,4-
cyclodiphosphate (MECP). MECP is then converted to 1-hydroxy-2 methyl-2-(E)- butenyl 4-
diphosphate (HMBPP) by HMBPP synthase. Isopentenyl diphosphate and DMAPP are
produced as final products (Figure 2) (Liu et al., 2005). In higher plants, this pathway is
localized to plastids where it is the main source for precursors of hemiterpenes, monoterpenes,

5
diterpenes and carotenoids. Precursors for sterols, sesquiterpenes and ubiquinones on the other
hand, are mainly derived from the mevalonate route operating in the cytoplasm and
mitochondria (Lichtenthaler, 1999).
Transgenic manipulation of the DXP pathway in E. coli and plants suggested that
metabolic flux through this pathway is regulated by DXPS, DXR and HMBPP reductase.
Overexpression or suppression of DXPS in Arabidopsis and tomato led to the respective
increase or decrease in isoprenoid production (Estevez et al., 2001, Rodriguez-Concepcion et
al., 2001). Hence, DXPS is one of the limiting steps in the production of plastidal IPP.
Similarly, ectopic expression of DXR in peppermint caused an increase in the production of
monoterpenes by 40%-60% (Mahmoud and Croteau, 2001). Finally, overexpression of
HMBPP reductase, which catalyzes the simultaneous synthesis of IPP and DMAPP in the last
step of the MEP pathway, triggered increased production of isoprenoids in tomato and
Arabidopsis (Botella-Pavia et al., 2004).
Information on the regulation of the crosstalk between the MVA- and DXP pathways is
sparse (Bouvier et al., 2005, Eisenreich et al., 2004, Rodriguez-Concepcion et al., 2004).
However, it has been shown that exchange of metabolites between these two pathways is
possible (Bick and Lange, 2003, Laule et al., 2003, Schuhr et al., 2003, Dudareva et al., 2005,
Hampel et al., 2005, Hemmerlin et al., Cusidó et al., 2007). McCaskill et al. (1995) and Laule
et al. (2003) demonstrated that intermediates generated in the DXP pathway compensate for
reduced flux through the mevalonate pathway (McCaskill and Croteau, 1995, Laule et al.,
2003), and overexpression of HMGR in spike lavender increased the abundance of sterols as
well as mono- and sesquiterpenes. The abundance of carotenoids or chlorophylls, however,
remained unaffected (Munoz-Bertomeu et al., 2007). Thus, monoterpenes (as well as
hemiterpenes, diterpenes and carotenoids) are not necessarily or exclusively produced through
the DXP pathway. However, the nature of this metabolite exchange and its regulation has yet
to be established.
1.4.2. Biosynthesis of higher terpenes (condensation of IPP and DMAPP)
In the second part of terpene synthesis, IPP and DMAPP, derived from either the
MVA- or DXP pathway, are condensed to yield geranyl diphosphate (GPP), farnesyl
diphosphate (FPP) or geranylgeranyl diphosphate (GGPP). The initial step involves the

6
isomeration of IPP to DMAPP by IPP isomerase. DMAPP is the more reactive compound, i.e.
its allylic phosphate group is an excellent leaving group that yields a carbonium ion. Through
the catalytic action of GPP synthase (a prenyltransferase), the carbonium ion then acts as an
alkylating agent in the reaction with IPP, giving GPP. In plastids, GPP is converted either to
monoterpenes or utilized for the production of GGPP via three condensation steps by GGPP
synthase and the addition of two IPP molecules to one molecule of GPP (Figure 3). In the
cytosol, GPP is utilized to produce FPP through the condensation of one molecule of GPP with
one molecule of IPP by FPP synthase. FPP is the precursor for sesquiterpenes (Figure 3) in the
cytosol. Higher terpenes are synthesized by a continuation of this chain extension process,
either through the addition of IPP to GGPP to yield sesterterpenes (C25) (in plastids) or through
condensation of two FPP, or two GGPP to generate triterpenes (C30) in the cytosol, or to
generate tetraterpenes (C40) in plastids (for review see Liu et al., 2005).
A wide array of terpenoids found in essential oils, turpentines and plant resins are
produced by the cyclization of GPP, FPP or GGPP, and subsequent transformation of these
parent skeletons by a series of redox isomeration and conjugation reactions. The plethora of
different monoterpenes results from the derivatization of GPP and the rearrangement of the
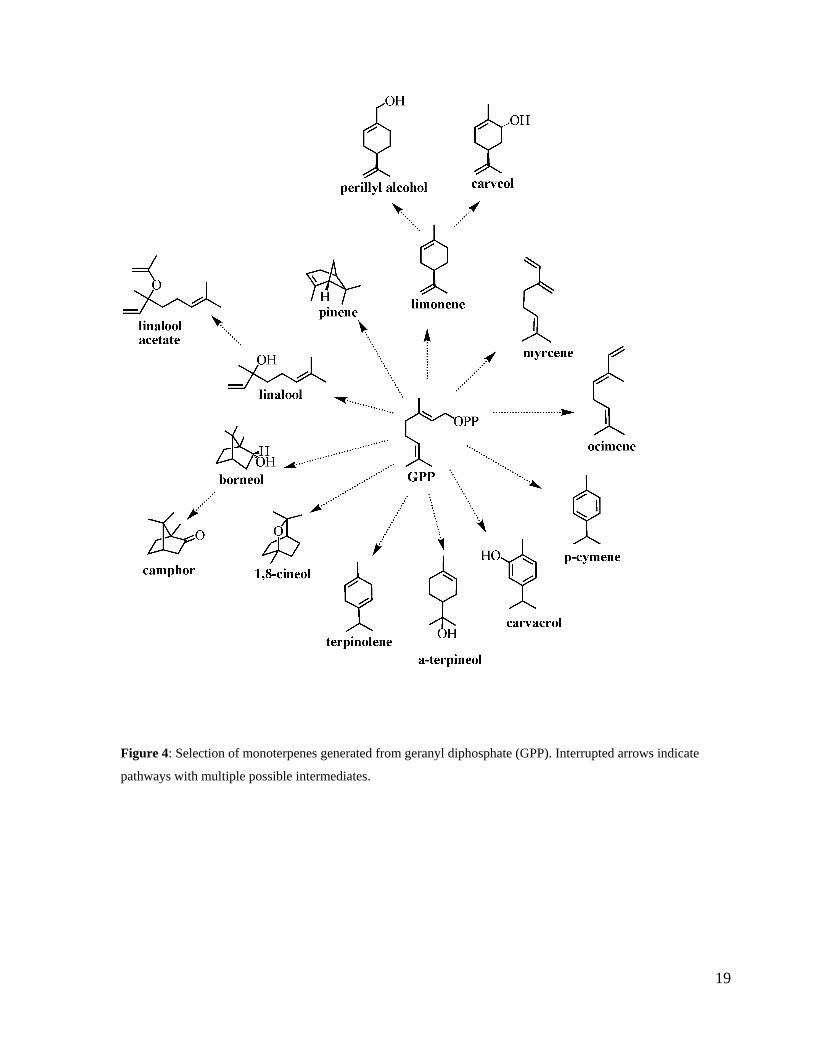
primary monoterpene skeletons (Figure 4). Since monoterpenes represent the major
constituents of lavender essential oil, only monoterpene synthesis will be explained in detail
here.
1.4.3. Monoterpene biosynthesis
Monoterpenes are derived from GPP by the activity of various monoterpene synthases
(sometimes called cyclases). In the initial step GPP is ionized and isomerized to linalyl
diphosphate (LPP) which is subsequently ionized and cyclized to yield the α-terpinyl cation
(McGarvey and Croteau, 1995). The different monoterpene skeletons are derived from the
latter highly reactive intermediate by further modification through specialized monoterpene
synthases, cytochrome P450 hydroxylases, dehydroxygenases, reductases, glycosyl
transferases or alkyl transferases.
Monoterpene synthases have been isolated and cloned from a number of plants
including mint, lemon, snapdragon, sage, and Arabidopsis and even gymnosperms like grand
fir (Alonso et al., 1992, Colby et al., 1993, Wise et al., 1998, Bohlmann et al., 1999, Bohlmann

7
et al., 2000, Lucker et al., 2002, Dudareva et al., 2003). An unusual feature shared by most
monoterpene synthases is that these enzymes produce multiple products. For example,
limonene synthase produces primarily limonene but also generates smaller amounts of myrcene
and α- and β-pinene (McGarvey and Croteau, 1995). This product diversity indicates a
common evolutionary origin for plant terpene synthases. In fact, all monoterpene synthases
share similar properties, i.e. a native molecular mass ranging between 50-100kDa (either
monomeric or dimeric), a requirement for a divalent metal ion as cofactor for catalysis (usually
Mg2+
or Mn2+
for angiosperms, K+, Mn
2+, Fe
2+ for gymnosperms), a pI near 5.0 and a pH
optimum within a unit of neutrality (Bohlmann et al., 1998b). Monoterpene synthases are
operationally soluble, but are found to be associated with plastids in vivo (Bohlmann et al.,
1997). Sequence analysis of different terpene synthases from various plants revealed conserved
sequence and structural characteristics, including amino acid sequence homology, conserved
sequence motifs, equal intron number and position and similar exon size (Bohlmann et al.,
1998b). A study by Bohlmann et al. (1998) on 33 selected monoterpene synthases from
different plant species (angiosperms and gymnosperms) indicated four conserved amino acid
motifs, i.e. the RRx8WD motif, LQLYEASFLL motif, DDxxD and
(N,D)D(L,I,V)X(S,T)XXXE motifs. The RRx8WD motif is essential for the enzymatic activity
of many monoterpene synthases (Williams et al., 1998) while the LQLYEASFLL motif is
thought to be part of the active site (McGeady and Croteau, 1995, Wise et al., 1998). The
DDxxD and (N,D)D(L,I,V)X(S,T)XXXE motifs are responsible for the enzymatic activity and
coordination of divalent cations and thus responsible for substrate binding and ionization,
respectively (Whittington et al., 2002, Christianson, 2006). Phylogenetic analysis discerned
that terpenoid synthases (TPS) are categorized into six gene subfamilies (designated TPSa-
TPSf). TPSa is constituted by sesquiterpene and diterpene synthases from angiosperms, TPSd
is comprised of 11 gymnosperm monoterpene, sesqui- and diterpene synthases. TPSc, TPSe
and TPSf are represented by single angiosperm terpene synthases, i.e. the diterpene synthases
copalyl diphosphate synthase and kaurene synthase and the angiosperm linalool synthase,
respectively. Many monoterpene synthases, including identified monoterpene synthases from
Lamiaceae belong to the TPSb family (Bohlmann et al., 1998b, Trapp and Croteau, 2001).

8
1.5. Monoterpene storage and secretion
Where large amounts of hydrophobic terpenoids are produced and accumulated,
specialized secretion structures are usually required. For instance, conifers have developed a
species-specific system of cellular blisters and highly specialized ducts for the storage of resin,
a mixture of volatile and non-volatile terpenes (McGarvey and Croteau, 1995). Terpenes are
sometimes produced and stored in ‘traumatic resin ducts’ near the site of an injury or simply
sequestered in proximity to the wound (McGarvey and Croteau, 1995). In angiosperms,
monoterpene biosynthesis is often restricted to specific tissues at their site of utilization. Many
flower fragrances, for instance, result from volatile terpenes, which occur in the form of minute
droplets in the cytoplasm of the epidermal and neighbouring mesophyll cells of the sepals
(Pichersky et al., 1994, McGarvey and Croteau, 1995).
In Lamiaceae, essential oil production and secretion are localized to specialized
glandular trichomes (Figure 5) (Fahn, 1988, Lis-Balchin, 2002). Glandular trichomes are
modified epidermal hairs that cover leaves, stems and parts of the flower. Two forms of
glandular trichomes can be observed. The smaller, capitate glandular trichome consists of a
basal cell, a short stalk and a one to two cell head (Fahn, 1988). Peltate glandular trichomes on
the other hand are more complex. They are composed of eight secretory cells (disc cells), a
stalk cell and a basal cell, anchoring the trichome in the epidermis (Figure 5) (Fahn, 1988). The
outer surface of either gland is covered with a toughened cuticle usually completely covering
the trichome. The essential oil accumulates in the subcuticular spaces that are formed by
separation of the cuticle from the apical walls of the secretory cells. The exact secretion
mechanism is still unclear, however, secretion of essential oil constituents is assumed to be
achieved via diffusion of volatiles through the cuticle or by rupture of the cuticle (Fahn, 1988).
The quantity of monoterpenes produced is generally related to the age and size of the
gland or by the density of glands per area of tissue. In peppermint, monoterpene synthesis and
accumulation are controlled by the development of the oil glands during the growth season.
Monoterpene abundance increases steadily as the glands increase in size, i.e. as glands pass
through the one-, two-, four-, and eight-celled stages of their development (Turner et al.,
2000a). Monoterpene abundance also increases during the season. Consistent with findings that
the total number of peltate glands steadily increases during vegetative growth- the first leaves

9
produced in a season had 2,000 glands each; leaves of similar
size, but 10 nodes younger (later
in the season), had up to 17,000 glands per leaf (Colson et al., 1993)- essential oil abundance
increased as the number of oil glands increased.
1.5.1. Compartmentalization within glandular trichomes
The ultrastractural features of mint trichomes strongly suggest that monoterpene
synthesis is compartmentalized to specialized leucoplasts within glandular trichomes. Mature
secretory cells of peltate glandular trichomes are characterized by enlarged leucoplasts
surrounded by an extensive smooth endoplasmatic reticulum. These leucoplasts lack
chloroplasts, grana and starch grains- a feature that renders these cells photosynthetically
inactive (Turner et al., 2000a), but supports their function as the site of terpene synthesis. In
contrast, glandular stalk cells develop distinctive plastids, numerous microbodies and abundant
mitochondria and are likely to supply carbon substrate to the secretory cells (Turner et al.,
2000a).
The compartmentalization of monoterpene biosynthesis to gland leucoplasts was further
supported by the discovery of the plastidal DXP pathway and the localization of key terpene
synthases to plastids. GPP synthase, an enzyme important in the early steps of monoterpene
synthesis, is expressed as a preprotein bearing an N-terminal plastidal targeting sequence
(Colby et al., 1993) and was directly localized to the leucoplasts of secretory gland cells by
immunogold labelling (Turner et al., 1999). In addition, recent immunological studies
demonstrated that four monoterpene synthases involved in menthol biosynthesis of peppermint
are exclusively localized to secretory cells of glandular trichomes. However, enzymes involved
in monoterpene biosynthesis are not exclusively found in leucoplasts. Localization of enzymes
of the menthol biosynthetic pathway in mint showed that although synthases involved in early
committed steps (GPP synthase) were localized to leucoplasts, enzymes catalyzing steps
further downstream in the pathway were associated with the endoplasmic reticulum (ER)
(limonene-6-hydroxylase), localized in the cytoplasm (pulegone reductase) or in mitochondria
(isopiperitenol dehydrogenase) (Turner and Croteau, 2004). These findings were explained in a
model proposed by Turner et al. (2004), in which primary monoterpenes, e.g. limonene, are
synthesized in plastids, followed by their transport to the ER for further modification (Turner et
al., 2000a, Turner and Croteau, 2004).

10
1.6. Regulation of monoterpene biosynthesis
1.6.1. Environmental regulation of monoterpene production
Secondary metabolites, like monoterpenes, hold a variety of ecological functions and
are therefore regulated by their environment. Flowers produce the most diverse and the largest
quantities of monoterpenoids just before the flower buds open, i.e. when the flower is ready for
pollination. The released volatiles are suggested to serve or aid as pollinator attractants
(Raguso and Pichersky, 1999). Terpenes also function as pathogen deterrents. For instance,
fungal infection of castor bean seedlings resulted in increased levels of casbene, an antifungal
and antibiotic diterpene of castor bean (Dudley et al., 1986). Indirect defence of plants against
herbivores often involves the induced emission of volatile terpenoids possibly to attract natural
enemies of the herbivores. Infestation of Lotus japonicus by two-spotted spider mites induced
the emission of (E)-β-ocimene (Arimura et al., 2004a, Arimura et al., 2004b). Similarly,
feeding forest tent caterpillars induced local and systemic diurnal emissions of (-)-germacrene
D, along with (E)-β-ocimene, linalool, and (E,E)-α-farnesene from leaves of hybrid poplar
(Arimura et al., 2004a).
Monoterpenes have also been shown to act as a protectant against high temperature
stress (Velikova et al., 2006) and their emission is regulated by the level of irradiation in some
plant species (Staudt and Seufert, 1995). In peppermint, a close relative of lavender, plant
growth and oil yield were affected by photoperiod: short days resulted in decumbent plants,
small leaves and many stolons, while long days, high photon flux density and high night
temperatures favoured erect plants, large leaves and flowers, and highest essential oil yields
(Clark and Menary, 1980b). Light intensity, day length and ambient temperature also
influenced essential oil composition. Long days, high photon flux and cool nights favoured the
accumulation of the more oxidized monoterpenes 1,8-cineol and menthone, while short days in
combination with long warm nights led to an increase in the more reduced monoterpene
menthofuran in peppermint (Clark and Menary, 1980a, Clark and Menary, 1980b).

11
1.6.2. Developmental regulation of monoterpene production
The monoterpene profile of a plant also changes during different stages of plant
development. Dudareva et al. (2003) showed that the emission of β-ocimene and myrcene from
snapdragon flowers was controlled by the developmental state: monoterpene emission was
nearly undetectable in unopened and 1-day-old flowers, while emission increased strongly on
the second day after anthesis and peaked 5-7 days after anthesis (Dudareva et al., 2003). In
peppermint, monoterpene abundance is linked to the developmental stage of a leaf.
Monoterpene abundance is comparably low in newly emerging leaves, but increases rapidly as
the leaf expands. Monoterpene biosynthesis peaks between twelve and twenty days after leaf
emergence, and then rapidly declines as full leaf expansion is reached (Turner et al., 2000b).
Similarly, the total monoterpene content of peppermint leaves increases rapidly between days
12 and 20, levels off as full expansion is reached, and then remains stable for the remainder of
the leaf life (Turner et al., 1999).
1.6.3. Regulation of monoterpene production through gene expression
To ensure that monoterpenes and their derivatives are available at all possible times,
environmental conditions and developmental stages and thus can improve or grant the plant’s
survival, monoterpene biosynthesis and emission must be under strict regulation. Studies by
Dudareva et al. (1996, 2003) showed that the abundance of mRNA, protein and enzymatic
activity of β-ocimene synthase in snapdragon and S-linalool synthase expression in Clarkia
breweri flowers were highly correlated with the emission levels of the corresponding
monoterpene (Dudareva et al., 1996, Dudareva et al., 2003).
The close correlation of monoterpene synthase transcription, de novo monoterpene
biosynthesis and monoterpene emission suggests that monoterpene production is regulated at
the level of gene transcription (Dudareva et al., 1996, McConkey et al., 2000). In support of
this hypothesis, Mahmoud and Croteau (2003) demonstrated that overexpression and
cosuppression of the gene for menthofuran synthase, the enzyme catalyzing the oxidation of
pulegone, resulted in the respective increase or decrease in the production of menthofuran in
peppermint (Mahmoud and Croteau, 2001, Mahmoud and Croteau, 2003). On the other hand,
overexpression of limonene synthase in peppermint leaves failed to increase the abundance of

12
the limonene synthase transcript and protein in oil glands. Accordingly, peppermint oil
composition and yield were unaffected (Mahmoud et al., 2004). This lack of effect was
reasoned to be due to the insufficient activity of the utilized promoter (CaMV 35S promoter) at
the site of monoterpene synthesis (oil glands) and a potential lethal effect of strong ectopic
expression of monoterpenes in leaf tissue (Mahmoud et al., 2004). Alternatively, these results
may indicate that the production of some monoterpenes is controlled by other unknown
mechanisms, or by the combination of transcriptional and other regulatory mechanisms.
1.7. Monoterpene abundance and regulation in lavender
The growing popularity of aromatherapy and alternative medicine has caused
increasing interest and growing demand for lavender oil, triggering the development of new
cultivation areas worldwide. The Okanagan valley (British Columbia) has become an
important locale for small-scale, tourist-oriented lavender farming, which focuses on the
marketing of ‘value-added oil’ for cosmetics, alternative medicine and aromatherapy.
Commercial distribution of lavender oil, especially for medicinal application, requires
that oil quality adheres to highest standards, and regional variation in oil composition has to be
kept to a minimum or at least has to be accounted for. Empirical data showed that monoterpene
composition is highly variable among different lavender species as well as in different areas of
cultivation (Lis-Balchin, 2002). To account for this variability, lavender oil from various
species has been standardized by the International Organisation for Standardization (ISO) (Lis-
Balchin, 2002). So far, little is known about the factors that cause variation in lavender
essential oil or control the monoterpene profile and monoterpene abundance in lavender.
Current knowledge stems mostly from empirical observations, gathered over decades of
lavender farming, or is inferred from studies in related Lamiaceae species such as mint and
sage. Lavender oil from France is considered superior to lavender oil cultivated elsewhere.
(Lis-Balchin, 2002). At the species level, ‘English lavender’ (Lavandula angustifolia) is
generally considered to produce the highest quality oil, characterized by negligible amounts of
camphor and high levels of linalool but low overall oil yield. In comparison, Lavandula x
intermedia, produces large amounts of low quality oil, marked by high camphor content (Lis-
Balchin, 2002). However, which of these two factors- growth region or species- is the
overriding factor that determines the monoterpene composition of lavender oil is unclear.

13
I hypothesized that the abundance of linalool and camphor is predetermined by
the lavender species. To test this hypothesis, I determined the essential oil/monoterpene
profile of several L. angustifolia and L. x intermedia cultivars grown in the Okanagan. The
abundance of four major monoterpenes in various cultivars was compared between two
lavender species cultivated under similar conditions as well as to internationally standardised
lavender oil derived from these species.
Numerous studies have shown that monoterpene abundance and profile change
throughout plant life. It was suggested that changes in monoterpene abundance are caused by
the biological changes throughout plant development and/or due to differing climatic, edaphic
or ecological conditions. I hypothesized that monoterpene abundance in lavender is
developmentally regulated. To test this hypothesis, I measured monoterpene abundance
throughout the development of vegetative and reproductive tissue and compared monoterpene
accumulation (or loss) in two representative cultivars of L. angustifolia and L. x intermedia.
The mechanisms that regulate monoterpene abundance are largely unknown. In some
cases a striking correlation between monoterpene content and monoterpene synthase
expression has led to the idea that monoterpene abundance is controlled by monoterpene
synthase expression. Therefore, I hypothesised that monoterpene abundance is regulated at
the level of gene transcription, i.e. that monoterpene abundance correlates with the
transcription of the respective monoterpene synthase. To test this hypothesis, I compared the
transcription level of a previously reported linalool synthase from L. angustifolia as well as a
putative linalool synthase from L. x intermedia to the abundance of linalool measured
throughout the development of the respective lavender species.
Together, these results allowed the classification of Okanagan lavender oil and
provided a basic understanding of monoterpene regulation in lavender. Increased knowledge of
the distribution of monoterpenes between lavender species, tissues and during development
will aid to limit essential oil variation and facilitate essential oil production by allowing
growers to synchronize lavender harvest to the developmental state with the most favourable
monoterpene profile or by regulating monoterpene synthase expression through genetic
engineering.

14
CultivarSpeciesSectionSubgenusGenus
Lavandula
Lavandula
Dentatae
Lavandula
L. latifolia
L. angustifolia
Munstead
L. x intermedia
Grosso
L. lanata
StoechasFabricia
Sabaudia
Figure 1: Subgenus, sections, species and cultivars within the genus Lavandula

15
Content (%) of major terpenes in lavender oil
English lavender Lavandin Spike lavender
Camphor 0.5-1% 4-11% 10-20%
Caryophylene 3-12% n.d. n.d.
1,8-Cineole 1-2% 5-10% 20-30%
Linalool 30-49% 30-40% 40-50%
Linalool acetate 30-45% 20-30% <1%
Ocimene 2.5-6% n.d. n.d.
Pinene (α and β) n.d. n.d. 1-3%
Table 1: Major mono- and sesquiterpenes in English lavender, Lavandin and Spike lavender (Lis-Balchin, 2002)

16
Figure 2: Biosynthesis of IPP and DMAPP via the mevalonate pathway (left) and the mevalonate-independent
(DXP) pathway (right). The indicated enzymes are: AACT, acetyl-CoA/acetyl-CoA C-acetyl-thiolase; HMGS, 3-
hydroxy-3-methylglutaryl-CoA synthase; HMGR, 3-hydroxy-3-methylglutaryl-CoA reductase; MVA kinase,
mevalonate kinase; MVAP kinase, phosphomevalonate kinase; MVAPP decarboxylase, mevalonate-5-
diphosphate decarboxylase; DXPS, 1-deoxyxylulose-5-phosphate synthase; DXR, 1-deoxyxylulose-5-phosphate
reductoisomerase; MEP cytidyl transferase, 2-C-methylerythritol-4-phosphate cytidyltransferase; CDP-ME
kinase, 4-(cytidine-5'-diphospho)-2-C-methylerythritol kinase; MECP synthase, 2-C-methylerythritol-2,4-
cyclodiphosphate synthase; HMPPP synthase, 1-hydroxy-2-methyl-E-butenyl-4-diphosphate synthase; HMBPP
reductase, 1-hydroxy-2-methyl-E-butenyl-4-diphosphate reductase and IPP isomerase (IPPI). The pathway may
give rise to IPP and DMAPP independently of the interconversion catalyzed by IPPI. A transfer of IPP/DMAPP
between cytosol and plastid is possible but, as of yet, unproven.

17

18
Figure 3: Terpene biosynthesis. GPP is synthesized by the condensation of one molecule of IPP and one molecule
of DMAPP catalyzed by GPP synthase. FPP is the condensation product of GPP and one molecule of IPP, while
GGPP is produced through the condensation of one molecule of GPP and two molecules of IPP. Monoterpenes are
derived from the derivatization and rearrangement of GPP, while FPP and GGPP are the precursors to sesqui- and
triterpenes and di- and tetraterpenes.
19
Figure 4: Selection of monoterpenes generated from geranyl diphosphate (GPP). Interrupted arrows indicate
pathways with multiple possible intermediates.

20
Figure 5: Glandular trichomes. Upper panel: Scanning electron microscope (SEM) image of glandular trichomes
on lavender leaves at 100x magnification. Middle panel: scanning electron microscope (SEM) image of a
glandular trichome at 500x magnification. Lower panel: Schematic of a peltate glandular trichome from
peppermint (Fahn, 1979) (Fahn, 1979, Turner and Croteau, 2004). SEM images courtesy of Michael Weis,
Electron Microscopy & Digital Imaging, Pacific Agri-Food Research Centre, Agriculture and Agri-Food Canada,
Summerland, BC
21

22
2. MATERIALS AND METHODS
2.1. Chemicals and reagents
All chemical and reagents used were of analytical purity grade. Unless otherwise stated,
biochemical reagents and organic solvents were obtained from Sigma-Aldrich (Canada) and
Fisher Scientific (Canada). Restriction enzymes, T4-DNA ligase, DNA-polymerases,
desoxynucleotide-tri-phosphates (dNTPs) and corresponding buffer solutions were purchased
from Invitrogen (Canada), Fermentas Life Sciences (Canada), Novagene (Canada), Qiagen
(Mississauga, Canada) or New England Biolabs (Ipswich, USA).
2.2. Bacteria and plasmids
The suppliers and genotypes of bacterial strains used in this study are listed in Table 2.
Plasmids used were pCR®8/GW/TOPO (Invitrogen, Canada) for cloning of PCR fragments
and pET32a (Novagen, Canada) for heterologous protein expression.
2.3. Plant material
L. angustifolia and L. x intermedia plants (L. angustifolia cv. Bowles, Hidcote,
Lavender Lady, Mailette, Munstead, Premier, Royal Velvet, Royal Purple; L. x intermedia, cv.
Grosso, Hidcote Giant, Super) were grown under natural conditions at a field site at the
University of British Columbia Campus (Kelowna, BC, Canada). The site was located at
approximately 49° 57' N latitude, 119° 24' W longitude and an elevation of approximately 450
m. According to recommendations by local growers, the site was prepared with top soil mixed
with 10% steer manure, and approximately 5g of bone meal per plant as initial fertilization.
The site was overlaid with heavy duty, black landscape fabric before lavenders were planted.
Individual plants were spaced 1 m apart, watered every two days for 10 min and fertilised
biannually (March, October) with Miracle-Gro all purpose fertilizer (15:30:15 N:P:K ratios,
The Scotts Company, Marysville, OH, USA).

23
2.4. Plant harvest
At the time of harvest, plants were 2 years of age. Flowers and leaves were sampled
from mid June to mid September during the flowering season. For comparative essential oil
analysis, entire flower spikes of L. angustifolia and L. x intermedia were harvested when
approximately 30% of the individual flowers per spike were in bloom. Tissue samples from 3
individual plants were combined and frozen at -80ºC immediately after harvest.
Grosso and Munstead flowers at different stages of development were selected
according to spike size (length of the spike in cm), colour (green or violet) and number of
flowers post anthesis per flower spike. Seven different stages were distinguished as described
in Table 3 and 4. Leaves of three developmental stages were distinguished according to size of
the leaf blade and position of the leaf. The youngest leaves were collected from the first node
below the flower spike; leaf blades were no larger than 2 cm. Intermediate aged leaves
included fully expanded leaves (4-5 cm) collected from the 6th
-8th
node of the flower stalk
(peduncle), while fully expanded leaves, sampled from the body of the lavender (from woody
plant parts) and a clearly distinguishable darker colour, represented developmentally oldest
leaves. For essential oil extraction, tissues from three individual plants were combined and
frozen at -80C immediately after harvest. For RNA extraction, tissues from three individual
plants were combined and shock frozen in liquid nitrogen immediately after sampling to
prevent RNA degradation, and stored at -80ºC.
2.5. Essential oil analysis
This study was initially designed to determine which cultivars had high camphor content, and
with the intent to further analyse camphor biosynthesis in high camphor expressing varieties at
the molecular level. For this purpose, essential oil was extracted from twelve lavender
cultivars, and the method was adjusted to measure the relative camphor content (%) in these
oils. However, during the course of the project the objectives were expanded to determine also
the absolute amount of camphor as well as relative and absolute abundances of limonene,
linalool, linalool acetate and borneol, in order to allow inferences about the biosynthesis of
these compounds, their relationship and their correlation to the expression of isolated

24
monoterpene synthases. The method for essential oil analysis was tested for the accuracy in
measuring these additional compounds; however, due to time constraints, the method was not
further optimized for the quantification of compounds for which the method was suboptimal.
2.5.1. Essential oil extraction
Essential oil was extracted from frozen lavender leaves and flowers by simultaneous
steam distillation solvent extraction (SDSE) using a Likens-Nickerson type apparatus equipped
with a standard condenser (Figure 6) as described previously (Mahmoud and Croteau, 2001,
Mahmoud and Croteau, 2002). The procedure was optimized for the extraction of
monoterpenes from lavender tissue, i.e. the optimal solvent and solvent volume were
determined prior to sample extraction. For optimal extraction, frozen tissue of 3-4 individual
plants was pooled and crushed manually to ensure sample homogeneity. Five to ten grams of
the pooled sample were heated to reflux in flask A (Figure 6) with 90 ml of distilled water and
1 mg of menthol as internal standard. The organic phase, consisting of 15 ml of pentane was
heated in flask B (Figure 6). The volatile monoterpenes which were released from the boiling
sample, mixed and solubilized in the pentane vapor. The vapor was cooled and condensed in a
condenser which was kept at zero degrees by ethylene glycol. Both water and pentane were
heated for 45 min after reflux had begun. The pentane layer was collected and stored at -20°C
until Gas Chromatography/Mass Spectrometry (GC/MS) analysis. The essential oil extraction
was repeated twice for each pooled sample.
2.5.2. Gas Chromatography / Mass Spectrometry (GC/MS) analysis of essential oil
Distillation extracts were diluted 1:100 with pentane for flower samples or used
undiluted for less concentrated leaf extracts and analyzed by GC/MS. GC analysis was
performed using a Varian GC 3800 gas chromatograph equipped with polyethyleneglycol ester
capillary column (30 m x 0.25 mm i.d., 0.25 µm film thickness, ECTM
1000, Alltech, Deerfield,
IL). One µl of each sample was loaded onto the column in split mode (20:1). The temperature
programming was initiated at 40°C for 3 min, increased to 170°C at 7°C/min, and to 230°C at
30°/min. The injector temperature was held at 250°C; helium was used as a carrier gas at a
flow rate of 1 ml/min. Response peaks above a cut off minimal response of 500 counts were
recorded and the peak area was integrated. GC eluates were analyzed in a Saturn 2200 Ion Trap

25
mass detector operating in EI mode at 70 eV. Mass spectra were recorded within 40-650 (m/z)
full scan mode. Each sample was analyzed twice. Monoterpene content was reported as the
average of two extractions multiplied by two analytical replicas of each pooled tissue sample.
2.5.3. Monoterpene identification
Individual monoterpenes were identified by comparing their retention times to the
retention time of pure authentic standard whenever possible. In addition, each compound was
analyzed in an ion trap mass spectrometer. The sample mass spectrum was compared to
standards cataloged by the National Institute of Standards and Technology (NIST) and a
specialized essential oil library (library for the identification of essential oil components by
GC-‘quadrupole’-MS, R.P. Adams). Mass spectrum comparison served as a secondary
confirmation for compounds with known retention times or as a primary identifier for
compounds for which authentic standards could not be obtained and thus retention times were
missing.
2.5.4. Monoterpene quantitation
2.5.4.1. Relative monoterpene abundance
The relative amount (percentage) of each monoterpene was estimated by dividing the
peak area of the compound of interest by the sum of all peaks detected (Peak area compound of
interest/Sum of all peak areas x 100 = % compound of interest in sample). Relative
monoterpene amounts were averaged for two extraction- and three instrumental replicas.
2.5.4.2. Absolute monoterpene abundance
The absolute abundances (as ng/µl) were calculated based on a four point calibration
curve, using a mixture of authentic standards diluted to 0.5 ng/µl, 5 ng/µl, 50 ng/µl, and 500
ng/µl each. A simple linear regression by the least squares showed that the compound peak
response was linear over the selected concentration range, with correlation coefficients of
r2=0.99 (limonene), r
2=0.99 (camphor), r
2=0.98 (linalool), r
2=0.98 (linalool acetate) and
r2=0.99 (borneol). Measured abundances in each extract were normalized to the amount of
tissue initially extracted (monoterpene/gfWT). Absolute monoterpene amounts were averaged
for two extraction- and three instrumental replicas.

26
2.5.4.3. Total oil abundance
Total essential oil concentration (as mg/gfWT) was calculated by integrating the area of
all compound peaks in the sample and correlating the sum of peak areas to the peak area of the
internal standard (menthol at 1 mg), assuming a unit response for all compounds. The total
essential oil concentration was normalized to the amount of tissue in the extraction (Sum of
peak area x 1 mg/area of menthol peak / gfWT = mg of essential oil per gfWT).
For the sake of practicality, calculation of total oil abundance disregarded any loss of
menthol standard during the extraction process and assumed equal peak responses among all
compounds, i.e. assumed that all compounds produced equal peaks at equal concentrations.
However, in practice, the peak response differed among compounds. Therefore, total essential
oil amounts represent merely a relative estimate of the actual essential oil content.
2.5.5. Accuracy of monoterpene quantitation
The accuracy of monoterpene quantitation was tested based on four parameters, i.e.
limit of detection, limit of quantitation, detection efficiency of monoterpenes across the
working concentration range, and monoterpene stability.
2.5.5.1. Limit of detection and quantitation
The limit of detection (LOD) - the lowest concentration level that can be determined to
be statistically different from a blank - was established for borneol, camphor, limonene,
linalool and linalool acetate using serial dilutions of authentic standards (0.01 ng/µl to 1000
ng/µl in increments of one order of magnitude). The lower limit of detection for borneol,
camphor, linalool and limonene was 0.01 ng/µl, with a signal to noise ratio of ~4:1. The lower
limit of quantitation (LOQ)- the level at which the signal to noise ratio was ~10:1 and
quantitative results could be obtained- was 1 ng/µl for these four compounds. For unknown
reasons, the limit of detection for linalool acetate was substantially higher (0.5 ng/µl), as was
the limit of quantitation (5 ng/µl) for this compound.
2.5.5.2. Detection efficiency
Detection efficiency was based on the monoterpene recovery, i.e. the proportion of
monoterpene that could be detected in a sample of known concentration. Monoterpene

27
recovery was measured for a mixture of borneol, camphor, limonene, linalool and linalool
acetate at five different working concentrations (0.5, 5, 50, 500 and 5000 ng/µl). Recovery of
borneol, camphor, limonene and linalool was most accurate at initial concentrations between
0.5-500 ng/µl (recovery of 77%-108%). Highest recoveries (98%-108%) were obtained at an
initial concentration of 50 ng/µl, while monoterpene recovery for concentrations higher than
500 ng/µl was lowest (≤ 50%), a fact that can be explained by poor peak resolution and peak
trailing at high concentrations. Linalool acetate recovery was considerably lower, especially at
lower concentrations (58%-60% at an initial concentration of 0.5-50 ng/µl). Accurate
quantitation of this compound could only be achieved at 500 ng/µl (96% recovery).
2.5.5.3. Monoterpene stability
The monoterpene stability, i.e. the duration over which the monoterpene abundance in a
sample extract was constant, was measured for (standard) mixtures of borneol, camphor,
limonene, linalool and linalool acetate at five different working concentrations (0.5, 5, 50, 500
ng/µl), spanning the concentration range for which accurate quantitation of these compounds
was obtained. The mixture was stored at -20ºC, and monoterpene abundance was measured at
six different times within a 24 day period. Measurements were normalized to the amount of
monoterpene detected in the non-stored mixtures to account for changes in monoterpene
recovery due to concentration dependent detection efficiency (as demonstrated above). Within
24 days, borneol, camphor, limonene and linalool decreased by up to 34% depending on the
initial concentration, while linalool acetate decreased by an average of 51%. Highest
monoterpene recovery and least loss (0%-12%) were obtained at an initial concentration of 5
ng/µl, except for linalool acetate which could not be detected at this concentration.
2.5.6. Limitations of monoterpene quantitation
Based on the detection efficiency and recovery during storage, accurate quantitation
was achieved at a sample concentration between 5 ng/µl-500 ng/µl for borneol, camphor,
limonene and linalool, and 500 ng/µl for linalool acetate. A 100-fold dilution of the extraction
sample moved the in-sample concentration of most of the observed monoterpenes into the
anticipated concentration range. However, the concentration of monoterpenes in lavender
extracts ranged from 0.5-1500 ng/µl (and thus exceeded the target range); thus, optimal

28
quantitation at this dilution could only be maintained for borneol, camphor, limonene and
linalool, while quantitation of linalool acetate was unreliable. Accordingly, linalool acetate was
omitted from further analysis.
2.6. Statistical analysis
Statistical analysis was done using the SPSS 7.0 software package at an α=0.05 level.
The average percentages (averages of two extractions times two analytical replicas of each
pooled tissue samples) of borneol, camphor, linalool and limonene in eight L. angustifolia
cultivars (n=8) were compared to the average abundances of these monoterpenes in three L. x
intermedia cultivars (n=3). Monoterpene percentage measured in the 11 different cultivars was
the dependent variable; lavender species was determined as the independent variable (L.
angustifolia or L. x intermedia). The data set was tested for normality using the Shapiro-Wilk
Goodness of Fit test. All monoterpene abundances were non-normally distributed. The
measured monoterpene percentages were therefore converted to a ranked dataset and analyzed
using the non-parametric equivalent to ANOVA, i.e. the Kruskal-Wallis test. The test tested the
null hypothesis that mean ranks of borneol, camphor, linalool and limonene percentages did
not substantially differ between L. angustifolia and L. x intermedia cultivars.
The Spearman Rho correlation coefficient was determined to test the relationship
between transcript- and monoterpene abundance. Therefore, average transcript abundance was
compared to average linalool abundance (ng/gfWT).
2.7. Isolation and reverse transcription of messenger RNA
Total RNA was isolated from L. x intermedia cv. Grosso or L. angustifolia cv.
Munstead tissue (leaves, flowers of different developmental stage) using the RNeasy Plant
Mini Kit (Qiagen, Mississauga, Canada) according to the manufacturer’s instructions.
Messenger RNA was reverse transcribed into first strand cDNA with Superscript II reverse
transcriptase and a commercial oligo-dT primer.
29
2.8. Polymerase Chain Reaction (PCR)
A basic PCR reaction generally contained 0.2 mM of each adenosine-, thymidine-,
guanidine- and cytosine desoxytriphosphate (dNTP), 1.5 mM MgCl2, 1 µM forward primer, 1
µM reverse primer, 1-20 µl (approximately 0.5ng-1µg) of DNA template (a single colony for
colony-PCR), 1-2.5 U Taq DNA polymerase, buffered with 20 mM Tris-HCL, 50 mM KCl (1
x Taq buffer) in a 50 µl aqueous solution. The PCR cycle was initiated at 95°C for 3 min to
completely denature the template, followed by denaturation at 94°C for 30 sec, annealing at
58°C for 1 min and extension at 72°C for 1 min for every 1000 base pairs. The denaturation-,
annealing-, extension cycle was repeated 30 times, and finalized with a final extension at 72°C
for 7 min. Samples were stored at 4°C until further use.
2.8.1. Gradient PCR
To determine the optimal annealing temperature for the amplification of selected
monoterpene synthase cDNAs identical reaction samples (composed as described for a general
PCR reaction) were amplified using different annealing temperatures as determined by the
gradient setting of the thermocycler. The annealing temperature at which the highest
abundance of single product was obtained was chosen as the optimal annealing temperature.
2.8.2. Reverse Transcriptase PCR (RT-PCR)
Reverse transcriptase PCR is a procedure by which messenger RNA is reverse
transcribed into a stable complementary DNA (cDNA). The procedure consists of two
consecutive steps: i) isolation of total RNA from tissue ii) reverse transcription of the mRNA
into single strand copy cDNA, using Oligo(dT) primers that are targeted against the mRNA-
specific poly-A-tail. In subsequent PCR, a gene of interest is amplified from this pool of single
stranded copies of the transcript using gene specific primers.
Total RNA was isolated as described above. mRNA was reverse transcribed using
SuperScriptTM
II RT reverse transcriptase (Invitrogen) according to the supplier’s
recommendations. In short, 1 µl of 100 µM Oligo(dT)12-18, 1 µg of total RNA and 1μl of
dNTP Mix (10 mM each) were mixed with sterile, distilled water to a final volume of 12 μl.

30
The mixture was heated to 65°C for 5 min and quickly chilled on ice before adding 5 x First-
Strand Buffer and 4 μl of 0.1M DTT. The tube was incubated for 2 min at 42ºC. One microlitre
(200 units) of SuperScript™ II RT and distilled water (to a 20 μl final volume) were added and
mixed by pipetting. The reaction mixture was incubated at 42°C for 50 min and the reaction
was finally inactivated by heating at 70°C for 15 min. The cDNA product was directly used as
template for amplification in PCR, assuming equal amounts of initial template and final
product (assuming that 1 µg of total RNA will produce 1 µg of cDNA).
2.8.3. Semi-quantitative PCR
Quantities of L. angustifolia linalool synthase (LIS) and L x intermedia (Lxi-LIS) mRNA were
estimated by semi quantitative reverse transcriptase PCR. Therefore, 1 µg of total RNA was
reverse transcribed into cDNA as described above. Five microlitres (5µg) of the first strand
cDNA were used as template in a subsequent PCR reaction. LIS and Lxi-LIS cDNAs were
amplified using gene specific primers: 5'- ATGTCGATCAATATCAACATGCC -3' (LIS
forward), 5'- TCATGCGTACGGCTCGAACAGC -3' (LIS reverse). To ensure that equal
amounts of RNA were used throughout samples and that RT reactions were equally
effective, a
control PCR was simultaneously performed with primers against L. angustifolia β-actin (5'-
AGGCCAATCGTGAGAAGATG-3' (actin forward) and 5'-
AAGGATTGCATGAGGGAGTG-3' (actin reverse)). The temperature programming was set to
2 min at 94°C, followed by 35 cycles beginning at 94°C for 30 sec, annealing at 64°C (LIS and
actin primers) for 45 sec and elongation at 72°C for 2 min. The abundance of PCR products
was compared visually after agarose-gel-electrophoresis.
2.8.4. Real-Time PCR
Transcript abundance was estimated by Real-Time PCR using the relative
quantification system for Applied Biosystems 7300/7500 Real-Time PCR system and Qiagen
QuantiTect SYBR Green PCR kit (Qiagen, Mississauga, Canada). First strand cDNA (250ng)
was mixed with 2 x SYBR green master mix and 0.3 µM forward and reverse primer as
recommended by the supplier (Qiagen, Mississauga, Canada)), in a total volume of 25 µl. LIS
and Lxi-LIS transcription was measured using primers 5'-
ATGTCGATCAATATCAACATGCC -3' (LIS forward), 5'-

31
TCATGCGTACGGCTCGAACAGC -3' (LIS reverse). The PCR reaction was activated at
95ºC for 15 min, followed by forty cycles of denaturation at 94ºC for 15 sec, annealing at 64ºC
for 30 sec and extension at 72ºC for 2 min. The reaction was terminated by a final extension
for 5 min at 72ºC. A melting curve analysis (5 min at 58ºC) of the PCR product(s) was
performed subsequently to verify product specificity and identity.
LIS and actin transcript abundances were measured in three replicate samples for each
tissue. LIS transcript numbers were calculated based on a five point calibration curve generated
for a 191 bp portion of L. angustifolia β-actin (primers as above). LIS/Lxi-LIS transcription was
expressed as a percentage of the abundance of actin transcript in each tissue.
2.9. Isolation and amplification of monoterpene synthase genes
A linalool synthase gene, endogenous to L. x intermedia, were identified and isolated
using ‘homologous’ PCR (hPCR). Therefore, primers were designed homologous against the
full length mRNA sequences of two previously identified linalool synthases (LIS) derived from
either L. angustifolia (accession ABB73045, 5'- ATGTCGATCAATATCAACATGCC -3'
(LIS forward), 5'- TCATGCGTACGGCTCGAACAGC -3' (LIS reverse)) or L. latifolia
(accession ABD77417, 5’-ATGTCTATCATTAGCATGCATGTGG-3’ (LIS forward),
5’-TTAGGGATATGGCTCGAACATCAGG-3’ (LIS reverse)). The hPCR reaction contained
5 µl of 10 x High Fidelity PCR buffer, 0.2 mM of each dNTP, 2 mM MgSO4, 0.2 μM of
forward and reverse primer, 2 µl of first strand cDNA (50ng), 1U Platinum® Taq High Fidelity
and autoclaved, distilled water to 50 μl. The PCR temperature programming was initiated with
2 min at 94°C, followed by 30 cycles of 94°C for 30 sec, annealing at 64°C and elongation at
72°C for 1 min per 1000 base pairs.
2.10. Agarose gel electrophoresis
Solutions containing DNA fragments (PCR reaction, DNA digest reaction, see 2.18) were
applied to a 1.0% agarose gel containing 10 µl of SYBR® Safe per 100 ml of 1% agarose and
electrophoresed at 100V for approximately 1 hour. DNA fragments were visualized by UV
illumination (365 nm). The size of each DNA band was estimated by comparison with a
standard 1 Kb DNA ladder (Invitrogen).

32
2.11. Purification of DNA fragments
2.11.1. Column purification
To remove enzymes, primers, nucleotides and other impurities which might interfere
with subsequent cloning steps, PCR samples were purified using the QIAquick PCR
Purification Kit. Purified PCR fragments were eluted from the column with 50 µl of deionised
water; final yield of the purified PCR fragments was estimated by agarose gel electrophoresis.
2.11.2. Purification of DNA by agarose gel electrophoresis
DNA fragments were purified from the agarose using the QIAquick gel extraction kit
(Qiagen) according to the supplier’s instructions. In principle, the DNA band of interest was
excised from the agarose gel, dissolved in 3 volumes (w/v) of buffer QG at 50°C. This solution
was mixed with 1 volume (w/v) of isopropanol and applied to the QIAquick column. After
binding of the DNA to the silica matrix, traces of agarose were removed with 0.5 ml of buffer
QG and washing with 0.75 ml of buffer PE. The DNA was eluted from the column with 50 µl
of dH2O and stored at -20°C until used further.
2.12. Ligation
Vector and insert DNA (PCR fragment or restriction fragment) were mixed in a ratio of
1:5 (vector: insert) and incubated with 10% (v/v) of 10 x T4 ligase buffer and 5% (v/v) T4
ligase in an aqueous solution at 4°C overnight. This ligation mixture was incubated for 5 min
at room temperature (pCR®8/GW/TOPO vector backbone) or 30 min to over night at 16ºC
(pET32a vector backbone). After incubation, ligation samples were used directly in subsequent
transformation reactions.

33
2.13. Transformation of E. coli DH5α/DH10B
2.13.1. Transformation by heatshock
Twenty microliters of either E. coli Top10, BL21 (DE3) or Origami (DE3) chemically
competent cells (Invitrogen, Novagen) were mixed with an aliquot of above ligation reaction or
purified plasmid DNA and incubated on ice for 5 min. Cells were heatshocked for 45 sec at
42ºC, iced for an additional 2 min and subcultured in 80-250 µl of SOC medium (2% (w/v)
Bacto-trypton, 0.5% (w/v) Bacto-yeast extract, 0.05% NaCl, 2.5 mM KCl, 20 mM glucose, pH
7) at 37ºC for 1 hour. Ten to fifty microliters of the bacterial culture were spread on LB-agar
(Luria Bertani-broth (5% (w/v) NaCl, 5% (w/v) yeast extract, 10% (w/v) Bacto tryptone, 1.2%
(w/v) agar-agar) plates containing the appropriate selective antibiotic (100 mg/l of ampicillin
or 25 mg/ml of spectinomycin). Plates were incubated overnight at 37ºC, and single colonies
were selected for colony analysis.
2.13.2. Transformation by electroporation
One hundred microliters of electro-competent DH10B E. coli cells were mixed with 5-
10 µl of the ligation reaction solution (or isolated plasmid) and transferred to a chilled
electroporation cuvette. The mixture was subjected to an electric pulse of 2.5 kV (capacitance
at 25 µF and 200 Ohm), and immediately mixed with 80-250 µl of SOC medium. The
transformation reaction was incubated for 1 h at 37ºC and 5-10 µl were plated on LB plates
containing the appropriate antibiotic (100 mg/l of ampicillin or 25 mg/ml of spectinomycin) for
selection. Plates were incubated over night at 37ºC, and single colonies were selected for
colony analysis.
2.14. Preparation of electro-competent DH10B
DH10B cells were grown in 100 ml of liquid LB medium until OD600= 0.4-0.6. Cells
were harvested by centrifugation at 4ºC and resuspended in 50 ml of cold water. Cells were
washed once in 50 ml of cold water, harvested and resuspended in cold, 10% glycerol. Cells

34
were harvested one last time, resuspended in 3 ml of cold 10% glycerol and stored as 80 µl
aliquots at -80ºC.
2.15. Transformation analysis
2.15.1. Colony PCR
Positive transformation of E. coli cells was determined by hotstart/colony PCR as described
by Sambrook and Russell (2001). Therefore, a number of colonies grown on the LB plates
were picked with a sterile tip and directly dipped into a solution containing 2.5 µl of 10x Taq-
buffer, 1 µl of 10 mM dNTPs, 1 µl of 10 µM forward primer, 1 µl of 10 µM reverse primer, 1
µl of Taq polymerase (Promega) and 18.5 µl of sterile water. Cell lysis was efficiently
accomplished by the initial step of the PCR (5 min at 95ºC). PCR was run as outlined for a
general PCR reaction. Additionally, picked colonies were also dipped into culture medium (5
ml of LB, 100 mg/l of carbenicillin) and incubated at 37°C overnight for amplification of
transformants. Positive transformants were identified by analysing the PCR samples by agarose
gel electrophoresis. Those transformants with a positive insertion (DNA band with desired size
detected on agarose gel) were selected to be sequenced.
2.15.2. Restriction analysis
Positive transformation was confirmed after isolating the plasmid and digesting it with a set
of restriction enzymes (as described below). Restriction fragments were separated by agarose
gel electrophoresis and the restriction fragment pattern was compared to the expected pattern.
2.16. Plasmid purification
2.16.1. Spin column purification
Plasmid DNA was purified from overnight cultures using the QIAprep spin miniprep
kit (Qiagen) as described by the manufacturer or by alkaline lysis. Plasmids purified by this
procedure are generally free of interfering salts and impurities and were thus used for
subsequent sequencing reactions.

35
2.16.2. Purification by alkaline lysis
For purification by alkaline lysis, bacterial cells were collected from 1.5 ml of
overnight culture by centrifugation. Cells were resuspended in 300 µl of TENS (0.1 N NaOH,
0.2% SDS, 10 mM Tris pH 7.5, 1 mM EDTA, 0.25ug/µl RNase), which caused cell lysis. Cell
debris and chromosomal DNA were precipitated by addition of 150 µl of 3 M sodium acetate,
pH 5.2, and removed from the solution by centrifugation. Ninety-five percent ethanol was then
used to precipitate the plasmid DNA from the supernatant, the supernatant was removed, and
the DNA was resuspended in water. Since alkaline lysis may introduce nicks in the plasmid
DNA, these preparations were only used for cloning or restriction analysis.
2.17. General restriction digest
Three to five micrograms of purified plasmid DNA were digested in a reaction
containing the appropriate concentration of restriction enzyme buffer (as recommended by the
supplier), plus 20-60 U of restriction enzyme in a 20 µl aqueous reaction.
2.18. Restriction digest of monoterpene-synthase vector plasmids
A general restriction digest contained 1-5 µg of the plasmid (pAB003, pAB007, pET32a or
corresponding progeny plasmids), 20-60 U of EcoRI and 10% (v/v) of 10x EcoRI buffer (100
mM Tris-HCl, 50 mM NaCl, 10 mM MgCl2, 0.025% Triton X-100, pH 7.5 @ 25°C) in an
aqueous solution. Digests were carried out overnight at 37°C; the digested plasmid was
purified by agarose gel electrophoresis and stored at -20°C until further use.
2.19. Sequence analysis
Purified plasmid DNA or PCR fragments were sequenced by a commercial sequencing
service (Plant Biotech Institute, Saskatoon or Fragment Analysis and DNA Sequencing
Services (FADSS) at UBC Okanagan, Kelowna). The sequences of putative LIS gene and
translation thereof were compared to the L. angustifolia and L. latifolia LIS gene/protein using
the vector NTI sequencing package (Invitrogen).

36
2.20. SDS-Polyacrylamide-gel-electrophoresis (SDS-PAGE)
2.20.1. Preparation of SDS-polyacrylamide gels
SDS-polyacrylamide gels (SDS gels) were prepared according to Laemmli (Laemmli, 1970).
For 12% SDS gels, the separating gel contained 0.375 M Tris/HCl pH 8.8, 12% (v/v)
acrylamide/bisacrylamide and 0.1% (v/v) SDS in an aqueous solution, as well as 0.05% (w/v)
ammonium persulphate and 0.1% (v/v) tetramethylethylenediamine (TEMED) as cross linking
agents. The separation gel was overlaid with the stacking gel consisting of 0.125 M Tris/HCl
pH 6.8, 3.9% (v/v) acrylamide/bisacrylamide, 0.1% (v/v) SDS, 0.05% (w/v) ammonium
persulphate, 0.1% (v/v) TEMED and prepared in a procedure analogous to the stacking gel.
2.20.2. Sample preparation for SDS-gel electrophoresis
Protein solutions were diluted with equal volumes of 4 x SDS sample buffer (200 mM
Tris pH 6.8, 40% (v/v) glycerol, 8% (v/v) SDS, 10% (v/v) dithiotreithol, 0.5% (w/v)
bromphenolblue), denatured at 96°C for 5-10 min and separated by SDS-gel electrophoresis.
2.20.3. SDS-Gel-electrophoresis
Twenty to 30 µl of protein sample were loaded onto 12% SDS-gels, buffered with 1.5%
Tris, 0.3% glycine, 1% SDS and run at a constant current of 25 mA for approximately 1.5 h.
2.20.4. Coomassie™ staining
After SDS-gel-electrophoresis, proteins were simultaneously fixed within the gel and stained in
a solution containing 45% methanol, 0.45% Coomassie™ Brilliant Blue R-250 (CBB) and
10% glacial acetic acid for a minimum of 3 h. The gels were destained for 1-3 h with a solution
of 30% methanol, 10% glacial acetic acid, which removed the CBB stain from the
polyacrylamide background and left only protein bands stained.

37
2.21. Cloning and expression of linalool synthase
A putative Lxi-LIS cDNA was amplified by RT-PCR from L. x intermedia tissue as
described above. The success of the PCR reaction was tested by agarose-gel-electrophoresis.
Therefore, an aliquot of the PCR reaction sample was run on a 1% agarose gel. PCR reactions
generally generated a single product of the expected size (1700bp for LIS), which was purified
using Qiagen PCR purification columns as described by the supplier. The purified single PCR
fragment of Lxi-LIS was subcloned into pCR®8/GW/TOPO vector (Invitrogen) (a vector for
the amplification of the introduced gene, necessary for subsequent gene sequencing), utilizing
the Taq-generated TA overhangs for facilitated cloning (Figure 7). Vector constructs were
transferred into E. coli DH5α cells for amplification. Six different positive clones were
sequenced; a single clone with complete ORF (pAB007) was selected for sequence analysis
and protein expression (Figure 7).
2.22. Heterologous gene expression of linalool synthase
The putative full length LIS sequence (including the plastid targeting signal (PTS)) was
excised from pAB007 with EcoRI and cloned ‘in frame’ into the pET32a expression vector
(Figure 8). The pET expression vector allows for highly efficient heterologous expression of
terpene synthases (van Schie et al., 2006) and simultaneously introduces an N-terminal poly-
histidine tag that aids subsequent protein purification. The construct was transformed into E.
coli DH10B competent cells. Eighteen clones were selected and sequenced to ensure
directional insertion of the LIS gene into the vector backbone. One clone (termed pAB040)
(Figure 8), positive for in-frame LIS insertion was selected and transformed into the E. coli
BL21(DE3) which allow for highly efficient expression of recombinant proteins. The same
clone was also inserted into the E.coli Origami (DE3) host, an E.coli K-12 derivative with
mutations in the thioredoxin reductase and glutathione reductase genes. These mutations
enhance disulfide bond formation in the cytoplasm, and thus facilitate correct protein folding
and expression.

38
2.23. Heterologous protein expression of linalool synthase
For protein expression three clones of pAB040 (termed pAB051, 052 and 053) were
selected for the inoculation of 15 ml of LB plus 50 µg/ml of carbenecillin. Cultures were
grown at 37ºC overnight, diluted 1:40 in 15 ml of LB-carb50
and grown to an OD600=0.4-0.8.
Each culture was split in half, one half was supplemented with 1 mM IPTG (Isopropyl β-D-1-
thiogalactopyranoside) which induces the expression of the recombinant protein; the other half
was left untreated and thus functioned as a control. Induced and non-induced cultures were
grown for an additional 12-16 h at room temperature, before cells were harvested by
centrifugation at 5000 g at 4ºC for 15 min and frozen at -80ºC. The total cell protein, soluble
and insoluble protein fraction was harvested from this cell preparation as described below.
2.24. Protein purification
2.24.1. Purification of total cell protein
Protein expression was tested by SDS-PAGE analysis of cell extracts followed by
staining with Coomassie blue, which in many cases reveals the target protein as a unique band
when run adjacent to a non-induced extract. Therefore total cell protein was isolated from
induced and non-induced E. coli preparations of pAB051, -052 and -053. A 1-ml aliquot of the
induced and non-induced culture was taken and centrifuged at 10,000 x g for 1 min. The cell
pellet was resuspended in 100 μl of 1 x phosphate-buffered saline (PBS). Subsequently, the
sample was supplemented with 100 μl of 2 x Sample Buffer (200 mM DTT, 4% SDS, 100 mM
Tris-HCl, pH 6.8, 0.25% bromophenol blue, 20% glycerol) and sonicated with a microtip
(Branson Sonifier 450) at the following settings: power level between 2–3, at 20–30% duty for
8–10 bursts. The sample was then heated for 3 min at 80°C to denature the proteins and then
stored at -20°C until SDS-PAGE analysis.
2.24.2. Purification of soluble protein
For the isolation of soluble protein, cells were harvested from liquid culture by
centrifugation at 6,500 x g for 5 min. the supernatant was decanted and the pellet was drained

39
of all liquid. Cells were then resuspended in 200 µl of BugBuster solution (Novagen), a protein
extraction reagent that causes the gentle disruption of the cell wall of E. coli, resulting in the
liberation of soluble protein. The cell suspension was incubated on a shaking platform or
rotating mixer at a slow setting for 10 min at room temperature. Insoluble cell debris was
removed by centrifugation at 16,000 x g for 20 min at 4°C. The pellet was saved for inclusion
body purification as described below. The supernatant was mixed with an equal volume of 4 x
SDS sample buffer (400 mM DTT, 8% SDS, 200 mM Tris-HCl, pH 6.8, 0.5% bromophenol
blue, 40% glycerol), heated for 3 min at 85ºC and stored at -20ºC until SDS-PAGE analysis.
2.24.3. Purification of inclusion-bodies
For the isolation of insoluble protein, i.e. purification of inclusion bodies, cells were
harvested from liquid culture by centrifugation at 6,500 x g for 5 min. the supernatant was
decanted and the pellet was drained of all liquid. Cells were then resuspended in 200 µl of
BugBuster solution. The cell suspension was incubated as described above. The pellet was
resuspended in 200 µl of BugBuster reagent and shaken vigorously to obtain an even
suspension. An additional 6 volumes of 1:10 diluted BugBuster reagent (in deionised water)
were added to the suspension and mixed vigorously for 1 min. The suspension was centrifuged
at 16,000 x g for 15 min at 4°C to collect the inclusion bodies and the supernatant was
removed with a pipette. The inclusion bodies were then resuspended in 500 µl of 1:10 diluted
BugBuster, mixed vigorously, and centrifuged as before. This wash step was repeated two
more times. The final pellet of purified inclusion bodies was resuspended in 100 µl of 1% SDS
and mixed vigorously to solubilise the protein. A 100-µl aliquot of the resulting (insoluble)
protein fraction was mixed with three volumes of 4 x SDS sample buffer (see above), heated to
85ºC for 3 min and analysed by SDS-PAGE.
2.25. In vitro functional assay
The functionality of the recombinant LIS protein was tested in an in vitro assay adapted
from assays reported previously (Bohlmann et al., 1997, Faldt et al., 2003, Landmann et al.,
2007, Peters et al., 2000). Therefore, protein expression was induced as described above, and
cells were harvested from the induced and non-induced cultures by centrifugation at 5000 x g

40
for 15 min at 4ºC. The cell pellet was resuspended in 500 µl of assay buffer (25 mM Tris-HCL
pH 7, 5% glycerol, 1 mM DTT, 1 mM MnCl2, 1 mg/ml of BSA) and disrupted by sonication
using a microtip at 15% output at three 30 sec bursts. Cell debris was removed from the sample
by centrifugation at 10,000 x g at 4ºC for 20 min. The clean supernatant was transferred to a
glass vial and supplemented with 50 µM geranyl diphosphate (GPP), mixed and overlaid with
500 µl of diethyl-ether in a sealed tube. The solution was incubated at 30ºC for 1 h to allow the
recombinant protein to react with the substrate (GPP). The reaction was terminated by vigorous
mixing and samples were centrifuged to separate phases. One hundred nanograms of menthol
was added as internal standard, before the upper solvent phase was collected. The extraction
was repeated once with 500 µl of diethyl-ether. Extracts were pooled and 2 µl were analyzed
by GC/MS in split-less mode.

41
Host Supplier Genotype
Escherichia coli
(E.coli) Top10
Invitrogen, Canada F- mcrA (mrr-hsdRMS-mcrBC)
80lacZ M15 lacX74 recA1 ara 139
(ara-leu)7697 galU galK rpsL (StrR) endA1
nupG
E. coli DH5α n/a F-, φ80dlacZΔM15, Δ(lacZYA-argF)U169,
deoR, recA1, endA1, hsdR17(rk-, mk
+), phoA,
supE44, λ-, thi-1, gyrA96, relA1
E. coli DH10B n/a F- mcrA (mrr-hsdRMS-mcrBC)
80lacZ M15 lacX74 recA1 endA1
ara 139 (ara, leu)7697 galU galK - rpsL
(StrR) nupG
E. coli BL21 (DE3) Novagen, Canada F– ompT hsdSB (rB
– mB
–) gal dcm (DE3)
E. coli Origami
(DE3)
Novagen, Canada F- ompT hsdSB(rB
- mB
-) gal dcm lacY1 ahpC
(DE3) gor522:: Tn10 trxB (KanR, Tet
R)
Table 2: Supplier and genotype of bacterial hosts

Developmental stages of L. x intermedia cv. Grosso
Flower Leaf
Bud I Bud II Bud III Anthesis 30% 70% Bloomed out Young Inter-
mediate Old
≤1 cm 1-2 cm,
green
3-4 cm,
violet
5-8 cm, violet, unopened
flowers
30% of flowers on spike
opened
70% of flowers on spike
opened
All flowers
senescent 2 cm
4.5 cm,
green
5 cm, blue
green
Table 3: Developmental stages of Lavandula x intermedia cv. Grosso based on flower/leaf size and colour

Developmental stages of L. angustifolia cv. Munstead
Flower Leaf
Bud I Bud II Bud III Anthesis 30% 70% Bloomed out Young Inter-
mediate Old
≤1 cm 1-2 cm,
green
3-4 cm,
violet
4-5 cm, violet, unopened
flowers
30% of flowers on
spike opened
70% of flowers on spike
opened
All flowers
senescent 2 cm 3 cm, green
4 cm, blue
green
Table 4: Developmental stages of Lavandula angustifolia cv. Munstead based on flower/leaf size and colour.

44
Chiller/
Circulator
filled with
ethylene
glycol
Condenser
Flask B
Flask A
Figure 6: Likens-Nickerson apparatus equipped with a standard condenser used for steam distillation solvent
extraction.

45
Figure 7: Vector map of pAB007. pAB007 was generated by cloning the Lxi-LIS PCR amplification product into
pCR®8/GW/TOPO. SpnR: spectinomycin resistance, Spn: spectinomycin, pUC origin: E. coli plasmid cloning
vector origin of replication, EcoRI: Restriction site, E.coli RI, PTS: plastid targeting signal.
pAB007
4504 bp
putativ e L. x intermedia LIS
SpnR
Spn promoter
pUC origin
putativ e PTS- truncated
EcoRI (1)
EcoRI (1706)

46
Figure 8: Vector map for pAB040. pAB040 is a vector for the heterologous expression of a putative Lxi-LIS in
E.coli. The vector was created by cloning the EcoRI excision product from pAB007 into pET32a. T7: T7 RNA
polymerase promoter; Trx Tag: thioredoxin tag; His tag: histidine tag, S tag: S-peptide tag; EcoRI: Restriction
site, E.coli RI; T7T: T7 terminator, f1 ori: filamentous bacteriophage f1 origin of replication; Amp R: ampicillin
resistance, Lac: lactose operon repressor; PTS: plastid targeting signal.
pAB040 (pET-LIS)
7 613 bp
Amp R
Lac
putativ e L. x intermedia LIS
f1 Ori
His Tag
S Tag His Tag
T7
T7T
Trx Tagtruncated PTS
EcoRI (1)
EcoRI (5901)

47
3. RESULTS
3.1. Analysis of essential oil from different lavender varieties
The lavender species L. angustifolia and L. x intermedia are comprised of 50-plus
cultivars, each equipped with specialized characteristics that allow their cultivation in distinct
climates and confer each variety with a characteristic monoterpene profile. I measured the
relative abundance of four major monoterpenes (borneol, camphor, limonene, linalool) in
flowers of eleven commercially important lavender cultivars (L. angustifolia cvs. Royal
Velvet, Royal Purple, Bowles, Munstead, Lavender Lady, Mailette, Hidcote, Premier and L. x
intermedia cvs. Grosso, Super and Hidcote Giant) and compared the abundance of these
compounds between L. angustifolia and L. x intermedia.
Linalool levels in L. angustifolia and L. x intermedia cultivars ranged from 12.4% to
34% (Table 5 and 6), with no significant difference between the two species (p-value 0.863,
Table 7). Limonene abundance ranged from 2.8% and 6.1% in L. angustifolia cultivars (Table
5) and from 2.5% to 4.9% in L. x intermedia cultivars (Table 6). Statistical analysis showed
that limonene percentages in L. angustifolia were significantly higher than in L. x intermedia
cultivars (p-value <0.001, Table 7). Camphor as well as borneol were detected in traces in L.
angustifolia varieties (Table 5), but accumulated to 5.1-13.1% (camphor) and 3.7-7.4%
(borneol) in L. x intermedia cultivars (Table 6) a difference that was statistically significant (p-
value <0.001, Table 7). The total amount of essential oil ranged between 37.8 mg/gfWT to 99
mg/gfWT for all L. angustifolia cultivars except Mailette which generated the highest oil yield
for this species at 91.8- 143.3 mg/gfWT (Tables 5 and 6). In L. x intermedia cultivars, total oil
accumulated to 116.8-202.8 mg/gfWT and was thus significantly higher (p-value <0.001,
Table 7) than for L. angustifolia lavenders. In comparison to ISO standards, Okanagan grown
lavender displayed a slightly different aroma profile. Borneol levels in L. x intermedia cultivars
were generally higher than previously reported (ISO 8902, 2002), as were camphor levels in
the L. x intermedia cultivars Hidcote Giant and Grosso (Table 6). Limonene abundances were
higher than the ISO standard (ISO 3515, 1897) in all L. angustifolia cultivars tested, while
linalool amounts were lower than standardized in all L. angustifolia and L. x intermedia

48
cultivars except for the L. angustifolia cvs. Munstead, Royal Velvet and Mailette (Tables 5 and
6).
3.2. Monoterpene abundance during lavender development
Recent studies have indicated that monoterpene abundance is subject to developmental
regulation (Turner et al., 1999, Turner et al., 2000b, Dudareva et al., 2003). To test this
hypothesis in lavender, I measured the amount of borneol, camphor, limonene, and linalool
throughout the ontogeny of flowers and leaves. To account for potential species-specific
effects, monoterpene abundance was measured throughout the development of two
representative cultivars, namely L. angustifolia cv. Munstead and L. x intermedia cv. Grosso.
Monoterpene abundance was measured as a proportion of the total essential oil extracted
(relative abundance) to highlight the relationship between all monoterpenes contained in the
essential oil, as well as the absolute content (absolute abundance) to allow inferences about the
biosynthetic rate of the selected monoterpenes.
3.2.1. Relative abundance of monoterpenes in Grosso and Munstead flowers
Monoterpene abundance changed drastically throughout the ontogeny of both lavender
species. One of the predominant developmental trends in flower tissue was the increase in
linalool abundance. While both Grosso and Munstead flower buds (Bud I) contained little
linalool (4.6% and 1.9%, respectively), linalool abundance increased gradually over time and
peaked when approximately 70% of the flower spike was in bloom (Grosso 30.4%, Munstead
30%) (Table 8).
Camphor levels followed a reciprocal trend in Grosso flowers. Camphor accumulated
to 18.9% in youngest buds and decreased to 10.7% at the 30% stage. For the remainder of the
flower life, camphor levels remained constant at ~10% (Table 8). Borneol, the suspected
camphor precursor (Croteau and Karp, 1976, Croteau and Karp, 1979a, Croteau and Karp,
1979b, Dudareva et al., 2003) amounted to 3.6% in Grosso buds; a level that was maintained
throughout Grosso flower development with only a slight increase to 4% as the flower reached
maturity (Table 8). Camphor was practically absent in Munstead flowers, and borneol
remained low, fluctuating between 0.5% and 1.8% (Table 8). Limonene, a likely precursor to
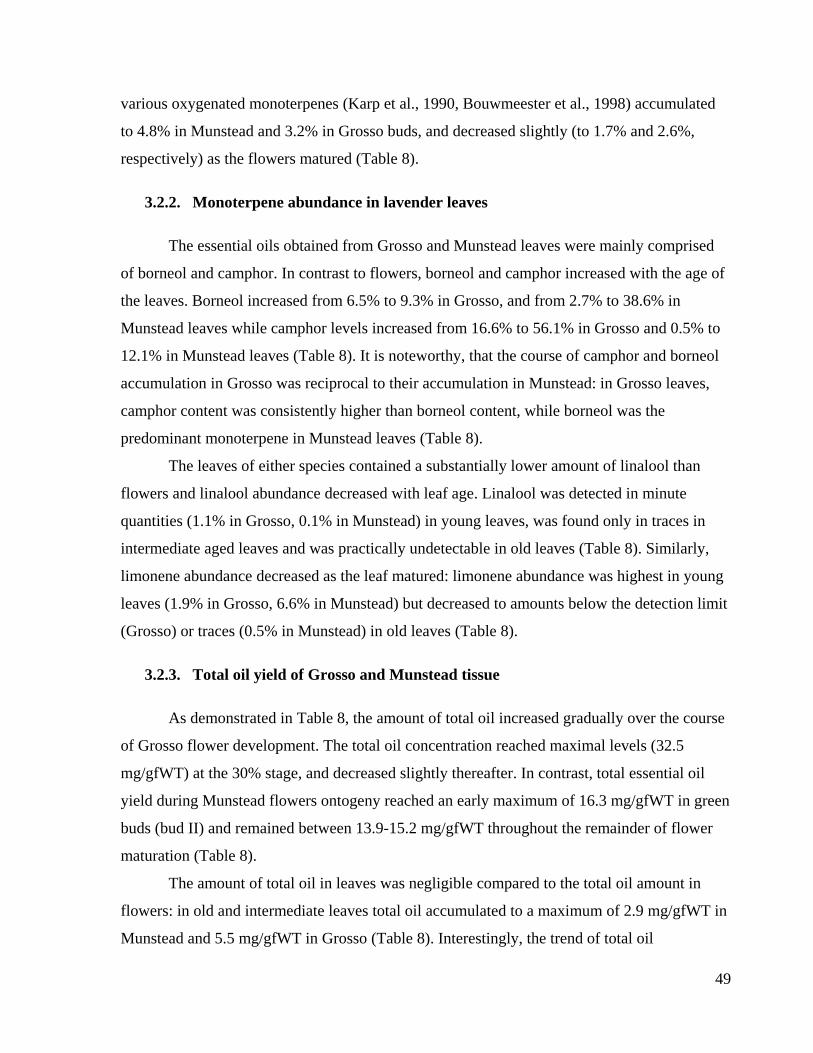
49
various oxygenated monoterpenes (Karp et al., 1990, Bouwmeester et al., 1998) accumulated
to 4.8% in Munstead and 3.2% in Grosso buds, and decreased slightly (to 1.7% and 2.6%,
respectively) as the flowers matured (Table 8).
3.2.2. Monoterpene abundance in lavender leaves
The essential oils obtained from Grosso and Munstead leaves were mainly comprised
of borneol and camphor. In contrast to flowers, borneol and camphor increased with the age of
the leaves. Borneol increased from 6.5% to 9.3% in Grosso, and from 2.7% to 38.6% in
Munstead leaves while camphor levels increased from 16.6% to 56.1% in Grosso and 0.5% to
12.1% in Munstead leaves (Table 8). It is noteworthy, that the course of camphor and borneol
accumulation in Grosso was reciprocal to their accumulation in Munstead: in Grosso leaves,
camphor content was consistently higher than borneol content, while borneol was the
predominant monoterpene in Munstead leaves (Table 8).
The leaves of either species contained a substantially lower amount of linalool than
flowers and linalool abundance decreased with leaf age. Linalool was detected in minute
quantities (1.1% in Grosso, 0.1% in Munstead) in young leaves, was found only in traces in
intermediate aged leaves and was practically undetectable in old leaves (Table 8). Similarly,
limonene abundance decreased as the leaf matured: limonene abundance was highest in young
leaves (1.9% in Grosso, 6.6% in Munstead) but decreased to amounts below the detection limit
(Grosso) or traces (0.5% in Munstead) in old leaves (Table 8).
3.2.3. Total oil yield of Grosso and Munstead tissue
As demonstrated in Table 8, the amount of total oil increased gradually over the course
of Grosso flower development. The total oil concentration reached maximal levels (32.5
mg/gfWT) at the 30% stage, and decreased slightly thereafter. In contrast, total essential oil
yield during Munstead flowers ontogeny reached an early maximum of 16.3 mg/gfWT in green
buds (bud II) and remained between 13.9-15.2 mg/gfWT throughout the remainder of flower
maturation (Table 8).
The amount of total oil in leaves was negligible compared to the total oil amount in
flowers: in old and intermediate leaves total oil accumulated to a maximum of 2.9 mg/gfWT in
Munstead and 5.5 mg/gfWT in Grosso (Table 8). Interestingly, the trend of total oil

50
accumulation in leaves was opposite to the trend in flowers. In leaves total oil decreased with
age, while total oil in flowers increased with maturation (Table 8).
3.2.4. Absolute abundance of monoterpenes in Grosso and Munstead
Similar to the pattern observed for the relative abundances, linalool was the
predominant monoterpene in both Munstead and Grosso flowers (Table 9). Its concentration
rose continuously from youngest buds to mature flowers, and was effectively absent from
vegetative tissue (Table 9). The concentrations of limonene and borneol followed similar
trends. Both compounds decreased continuously during Munstead flower development (Table
9). In contrast, limonene and borneol amounts during Grosso development followed a bell
shaped distribution with peak concentrations when 30% of the flower was in bloom (Table 9).
Camphor was detected in trace amounts in Munstead flowers, in contrast to camphor levels in
Grosso flowers which- averaging between 50.3-102.3 ng/gfWT at all stages of flower
development- were comparably high (Table 9).
In Munstead and Grosso leaves, linalool and limonene concentrations were low
(continuously below 10 ng/gfWT for linalool and below 37.8 ng/gfWT for limonene), and both
monoterpenes decreased as the leaf matured (Table 9). In Munstead leaves, camphor
concentrations increased as the tissue aged but were always lower than borneol concentrations.
In contrast, borneol amounts fluctuated between 26.4 ng/gfWT and 42.4 ng/gfWT (Table 9). In
Grosso leaves, borneol decreased gradually as the leaf matured and remained consistently
below camphor amounts. Camphor amounts on the other hand did correlate less with the
developmental state of the leaf, and fluctuated between 10.9 ng/gfWT and 37.4 ng/gfWT
(Table 9).
3.3. Isolation of a putative linalool synthase from L. x intermedia
Using Reverse Transcriptase PCR (RT-PCR) and primers against a published L.
angustifolia LIS, I isolated a 1700 bp sequence from L. x intermedia flowers, a continuous
open reading frame (ORF) of 1639 bp. The 1639 bp ORF coded for a protein with 593 amino
acids (aa) (Figure 9), and a predicted molecular weight of 69 kDa. Blast search as well as
sequence alignment of this sequence revealed highest sequence identity (87.8%) and amino

51
acid identity (90.6%) to L. angustifolia LIS (Figure 9) suggesting that the isolated sequence
represents a L. x intermedia LIS homolog (Lxi-LIS). Four monoterpene synthase characteristic
motifs, RRx8WD, LQLYEASFLL, DDxxD and (N,D)D(L,I,V)X(S,T)XXXE, were completely
conserved in the L. x intermedia sequence (Figure 9). Similar to other published LIS
sequences, the ORF contains a 53 aa N-terminal extension upstream of the RRx8WD motif.
The first 25 aa of this extension are highly similar to a targeting signal found in L. angustifolia
LIS, while the remaining 28 aa show weak similarity to the N-terminus of L. latifolia LIS
(Figure 9). This N-terminal sequence contained comparatively many serine and alanine
residues and few acidic amino acids, a feature that is often found in signal peptides, which
target proteins to plastids where they are processed to their active mature forms by truncation
of the N-terminal peptides (Keegstra et al., 1989, von Heijne et al., 1989). It is likely that the
N-terminal extension of this newly isolated gene also functions as a signaling sequence and is
therefore referred to as a plastid targeting signal (PTS) from here on.
3.4. Heterologous expression and functional analysis of a putative L. x
intermedia LIS
The sequence of the isolated ORF, including the sequence encoding for a 25 aa portion
of the putative signal peptide was cloned and expressed in bacteria. The protein expression
levels of three identical expression clones (pAB051, pAB052 and pAB053) were compared to
a control that did not contain the isolated sequence (empty pET32a), and to protein
preparations of pAB051 and pAB053 which did not express the protein (non-induced samples).
As shown by SDS-PAGE, two clones (pAB051 and pAB053) expressed high levels of a 69 kD
protein, which was absent from the non-induced controls (Figure 10). However, the major
portion of the recombinant protein was trapped in insoluble inclusion bodies, and only a minute
sub-fraction was soluble (Figure 10). Even the transfer of the expression vector into E. coli
Origami cells, an exclusive host strain that promotes disulfide bond formation and thus
increases protein solubility (Prinz et al., 1997) failed to improve protein solubility (data not
shown).
The soluble fraction of the recombinant protein was tested for monoterpene synthase
activity, i.e. its ability to convert geranyl diphosphate to linalool in vitro. To account for the
low solubility, the in vitro assay was scaled up in an attempt to increase the recovery of soluble

52
Lxi-LIS in the assay. Table 10 summarizes the product profiles of the two Lxi-LIS-expression
clones (pAB051, pAB053) in comparison to three negative controls, i.e. protein preparations of
non-induced pAB051 and pAB053, and an induced sample of the empty pET32a expression
vector. The overall extraction efficiency was estimated based on the recovery of an internal
standard (menthol) added to the assay after incubation and prior to extraction. In general, 60-
70% of the internal standard was recovered during two rounds of ether extraction (Table 10).
Extractions of pET32a were particularly efficient with 99% recovery, while the recovery rate
for the pAB051-induced sample was only 10%, indicating a failure in the extraction procedure
(Table 10). Apart from menthol, only myrcene and linalool could be detected in the ether
extracts. Myrcene concentration fluctuated between 0.4 ng/µl and 4 ng/µl, with higher
concentrations in non-induced controls. Linalool was produced at low levels in the pAB053-
induced sample, but was also found in the pAB051-non-induced control as well as the pET32a
control (Table 10). To account for differences in recovery across samples, the data set was
mathematically normalized to 100% recovery. Normalization emphasized slightly elevated
linalool amounts in the pAB053 induced sample, as compared to the controls (Table 10). This
suggests de novo production of linalool, and thus indicates that the recombinant protein
comprises LIS functionality. However, the measured linalool amounts were below the limit of
quantitation for linalool (1 ng/µl) and thus remain questionable.
3.5. Correlation of linalool abundance and LIS gene expression
The abundances of LIS from Munstead as well as the abundance of the sequence
isolated from L. x intermedia (putative LIS homologue, Lxi-LIS) were compared to linalool
concentrations in the respective cultivar throughout development. Transcription analysis was
limited to flower tissue, since no LIS could be detected in leaves.
The quantitative changes of LIS and Lxi-LIS transcripts during Munstead and Grosso
flower development, in comparison to linalool abundance are depicted in Figures 11 and 12,
respectively. LIS and Lxi-LIS expression closely paralleled linalool concentration throughout
Munstead and Grosso development (Figures 11 and 12). In both cultivars, linalool as well LIS /
Lxi-LIS transcript numbers increased as the flower matured. In Munstead flowers LIS
transcription decreased in the final stages of ontogeny (i.e. bloomed out flowers), while the
abundance of linalool remained high (Figure 11). In contrast, linalool levels and Lxi-LIS

53
abundance decreased in tandem in maturing Grosso flowers (Figure 12). A correlation
coefficient of 0.58 (Munstead) and 0.81 (Grosso) indicated the correlation between transcript
abundance and product concentration.

Monoterpene content (%) in Lavandula angustifolia cultivars
Compound Royal
Velvet
Royal
Purple Munstead
Lavender
Lady Bowles Premier Hidcote Mailette
ISO
3515
1987
Borneol 1.1
(1-1.4)
1.1
(1-1.2)
0.7
(0.6-0.7)
1.2
(1.2-1.3)
0.3
(0.2-0.5)
0.9
(0.8-1.1)
1.8
(1.6-2.1)
2.3
(2.3-2.4) n/a
Camphor n.d. n.d. n.d. n.d. n.d. n.d. n.d. 0.4 0-0.5
Limonene 5.7
(5.5-5.9)
5.2
(4.9-5.4)
5.8
(5.6-6.0)
5.7
(5.6-5.9)
3.1
(2.8-3.4)
5.8
(5.6-6.1)
5.9
(5.6-6.0)
5.7
(5.6-5.8) 0-0.5
Linalool 29.4
(27.5-30.6)
18.2
(17.2-19.6)
26.9
(25.5-29.6)
22.6
(21.3-23.3)
21.2
(18.9-23.1)
13.8
(12.4-15.3)
15.1
(13.8-16.1)
33.8
(33.6-34) 25-38
Estimated
total oil
(mg/gfWT)
71.8
(63.2-78.1)
55.2
(47.6-59.5)
62.0
(50.3-68.6)
68.1
(50.2-99.9)
43.3
(37.8-53.5)
57.1
(53-60.5)
52.2
(44.9-57.8)
117.5
(91.8-143.3) n/a
Table 5: Monoterpene content (%) and estimated amount of total oil (mg/g fresh weight) extracted from flowers of Lavandula angustifolia cultivars grown in the
Okanagan, 2007. Relative amounts of selected monoterpenes were measured in essential oil extracts by GC/MS. Monoterpene content is reported as the average
of two extractions times two analytical replicas of each pooled tissue sample. The measurement ranges, i.e. minimum and maximum measures, are reported in
brackets. n.d.: none detected. n/a: non-available. mg/gfWT: mg per gram fresh weight. ISO 3515 1987: International Standardization Organization, file 3515,
year 1987.

55
Monoterpene content (%) in L. x intermedia
Compound Hidcote Giant Grosso Super ISO 8902
2002
Borneol 4.8
(4.4-5.1)
3.7
(3.4-4.1)
7.4
(7.3-7.4) 1.5-3
Camphor 21.5
(11.3-13.1)
10.2
(9.7-10.7)
5.2
(5.1-5.4) 6-8
Limonene 2.5
(2.5-2.6)
4.0
(4.0-4.1)
4.9
(4.8-4.9) n/a
Linalool 16.9
(16.3-17.6)
23.2
(22.9-23.5)
21.5
(20.5-22.5) 25-35
Estimated total oil
(mg/gfWT)
162.7
(147.3-180.8)
182.9
(168.1-202.8)
126.5
(116.8-136.2) n/a
Table 6: Monoterpene content (%) and estimated amount of total oil (mg/g fresh weight) extracted from flowers
of Lavandula x intermedia cultivars grown in the Okanagan, 2007. Relative amounts of selected monoterpenes
were measured in essential oil extracts by GC/MS. Monoterpene content is reported as the average of two
extractions times two analytical replicas of each pooled tissue sample. The measurement ranges, i.e. minimum and
maximum measures, are reported in brackets. n.d.: none detected. n/a: non-available. mg/gfWT: mg per gram
fresh weight. ISO 8902 2002: International Standardization Organization, file 8902, year 2002.
Borneol Camphor Limonene Linalool Total oil
p-value <0.001 <0.001 <0.001 0.863 <0.001
Table 7: Comparison of the monoterpene percentage in L. angustifolia and L. x intermedia cultivars. The average
percentages (averages of two extractions times two analytical replicas of each pooled tissue sample) of borneol,
camphor, linalool and limonene in eight L. angustifolia cultivars (n=8) were compared to the average percentage
of these monoterpenes in three L. x intermedia cultivars (n=3) using the non-parametric Kruskall-Wallis test. P-
values indicate the probability that the percentage of the indicated monoterpene is equal between L. angustifolia
and L. x intermedia cultivars. P-values below α=0.05 are significant.

56
Table 8: Monoterpene content (%) during lavender development. Mean relative abundance of borneol, camphor,
linalool, limonene and total oil in L. x intermedia cv. Grosso (upper panel) and L. angustifolia cv. Munstead
(lower panel), as measured during the 2007 flowering season. The range of measurements (minimum – maximum)
over two extraction and three analytical replications (six samples) is given in brackets.

Monoterpene content (%) in L. x intermedia cv. Grosso and L. angustifolia cv. Munstead during development
Flower Leaf
Bud I Bud II Bud III Anthesis 30% 70%
Bloomed
out Young
Inter-
mediate Old
L. x
in
term
edia
cv
. G
ross
o
Borneol 3.6
(3.1-4.1)
3.5
(3-4.9)
3.0
(2.6-3.5)
2.9
(2.3-3.9)
4.2
(3.4-5.3)
4.5
(3.7-5)
4.0
(3.4-5.1)
6.5
(4.5-9.4)
9.3
(2.9-15.3)
9.3
(7.6-11.7)
Camphor
18.9
(15.2-
22.2)
17.4
(15.4-21.1)
13.2
(10.6-15.3)
10.6
(9.3-13.6)
10.7
(8.9-13.1)
11.5
(10.7-12.5)
10.7
(9.6-12.6)
16.6
(10.2-32.6)
23.6
(6-41.7)
56.1
(46.9-65.0)
Limonene 3.2
(2.6-4.2)
3.2
(2.6-4.1)
2.8
(2.1-3.8)
2.9
(1.9-4)
2.4
(1.8-4.5)
2.4
(1.7-4.2)
2.6
(1.9-4.2)
1.9
(0-3.3)
0.1
(0-2.8) n.d.
Linalool 4.6
(3.6-5.3)
9.8
(7.3-10.9)
15.1
(11.1-17.2)
20.3
(15.1-23.5)
28.1
(21.3-33.3)
30.4
(20.6-37.1)
29.8
(21.7-37.6)
1.1
(0-1.7)
0.3
(0-1.7) n.d.
Estimated
total oil
(mg/gfWT)
12.2
(11.6-13)
12.1
(11-13.4)
14.7
(12.4-20.4)
15.7
(14.8-16.8)
32.5
(27.2-35.5)
17.9
(15.7-20.3)
23.5
(20.8-25.4)
5.5
(4.3-8.3)
1.9
(0.9-4)
1.3
(0.9-1.6)
L. a
ng
ust
ifoli
a c
v.
Mu
nst
ead
Borneol 1.0
(0-1.9)
0.5
(0-1.3)
1.2
(0.9-1.5)
1.8
(1-2.3)
0.6
(0-1.1)
0.9
(0.8-1)
0.7
(0.6-0.8)
2.7
(0-8.2)
23.7
(26.7-30.3)
38.6
(29.4-43.5)
Camphor n.d. n.d. n.d. (0-0.3 n.d. n.d. (0-0.2) 0.5
(0.4-0.6)
8.2
(7.4-8.9)
12.1
(10-13.8)
Limonene 4.8
(0-7.5)
2.5
(0-6.8)
4.2
(3.8-4.9)
3.0
(1.9-3.7)
2.6
(1.9-3.1)
2.3
(2.1-2.5)
1.7
(0.9-2.1)
6.5
(5.7-7.4)
1.2
(0-2.4)
0.4
(0-1.1)
Linalool 1.9
(1.3-3)
4.5
(0-10.7)
17.0
(15.4-19.8)
16.8
(10.4-20)
17.5
(8.9-24.7)
30.0
(28.2-31.6)
27.7
(4.7-40.8)
0.1
(0-0.2) n.d.
0.2
(0-0.6)
Estimated
total oil
(mg/gfWT)
15
(12.5-
21.3)
16.3
(12.8-25.7)
14.4
(12.7-15.7)
13.9
(9.7-20.8)
17.5
(12.9-20.6)
15.2
(13.8-16.7)
15.3
(12.9-18.7)
2.9
(1.9-3.8)
0.8
(0.8-0.9)
0.7
(0.6-0.8)

58
Table 9: Monoterpene content (ng/gfWT) in L. x intermedia cv. Grosso and L. angustifolia cv. Munstead
during development. Absolute concentration of borneol, camphor, linalool, limonene and total oil was
measured in Grosso and Munstead during the 2007 flowering season. The range of measurements over two
extraction and three analytical replications (six samples) is given in brackets.

Monoterpene content (ng/gfWT) in L. x intermedia cv. Grosso and L. angustifolia cv. Munstead during development
Flower Leaf
Bud I Bud II Bud III Anthesis 30% 70% Bloomed
out Young
Inter-
mediate Old
L. x
in
term
edia
cv
. G
ross
o Borneol
12.3
(6.3-
21.1)
10.9
(5.6-27.3)
11.9
(5-34.2)
14.4
(0.3-34.9)
35
(1.2-90)
16.5
(5.3-44.7)
22.8
(9-62.9)
13.3
(0.6-23)
4.0
(1.5-8.6)
3.8
(1.7-9.4)
Camphor
74.8
(43.3-
119.6)
63.1
(32.1-141)
59
(24.7-152.4)
58
(0-125.9)
102.3
(2.8-242.6)
50.3
(18.7-124)
73
(33.9-
183.1)
37.4
(1.0-65.6)
11
(3.3-30.4)
26.5
(12.5-
59.8)
Limonene
8.3
(3.7-
16.5)
8.8
(2.8-29.9)
14
(3.1-48.8)
23
(0-58.9)
46.3
(0.9-140.7)
16.1
(1.8-55)
25.5
(4.8-98.8)
6.5
(0-10.3)
1.5
(0.5-5.4)
2.1
(1.3-3.6)
Linalool
93.9
(34.5-
298)
212.6
(51.6-756.2)
436.8
(74.9-
1617.1)
844.5
(0-2204.9)
1699.2
(25.1-
5220.5)
756.9
(110.8-2770.1)
1073.8
(211.9-
4050.4)
7.4
(0-13.5)
1.0
(0-5.2) n.d.
L. an
gu
stif
oli
a c
v.
Mu
nst
ead
Borneol
27.8
(10.2-
68.2)
22.5
(18.3-28.2)
13.6
(11.5-15.3)
23.1
(17.1-27.9)
14.7
(6.6-21.3)
9.7
(8.9-10.8)
9.2
(5.5-15.4)
42.4
(33.9-
53.1)
26.4
(21.6-32)
31.8
(27-34)
Camphor 2.1
(0-6.9) n.d.
0.5
(0-2.8)
2.6
(0-4.6)
2.6
(0-4.6)
2.9
(2.5-3.2)
4.1
(3.4-4.6)
2.8
(2.1-3.5)
8.8
(7.8-9.9)
12.6
(11.6-
13.8)
Limonene
156.9
(84.7-
301.3)
134
(111.9-
159.4)
65.2
(48.5-81.3)
52.3
(37.4-70.4)
64
(32.6-104.6)
42.6
(38.1-47.7)
35.7
(14.1-
61.3)
37.8
(22.2-
54.7)
1.5
(0.7-2.6)
1.2
(0.8-1.6)
Linalool
114.5
(42.7-
248)
531.4
(489.1-
559.8)
573.5
(453.6-
707.6)
639
(452.3-
912)
1206.3
(642.5-
2033.3)
1148.8
(1068.9-
1273.1)
1575.8
(1022.6-
2336)
2.3
(2-2.6)
0.8
(0.6-1)
1.4
(0-4.7)

1 100
L. latifolia LIS (1) MSIISMHVGILNRPAAYNHLRNLDRRASKPRHVSSTAAATRLRVSCATQLEIKSVDETRRSGNYNPTAWDFNYIQSLDNQYKKERYSTRHAELTVQVKKL
L. angustifolia LIS (1) --------------------------------MSININMPAAAVLRPFRCSQLHVDETRRSGNYRPSAWDSNYIQSLNSQYKEKKCLTRLEGLIEQVKEL
putative L.x intermedia LIS (1) ---VTCSLQQIDEQCFFIMPTLYKKAGSEFALMSININMPAAAVLRPFRCSQLHVDVTRRSGNYRPSTWDSNYIQSLNSQYKEKRCLTRLEGLIEQVKEL
Consensus (1) IS L I F K AS MSININMPAAAVLRPFRCSQLHVDETRRSGNYRPSAWDSNYIQSLNSQYKEKRCLTRLEGLIEQVKEL
101 200
L. latifolia LIS (101) LEEEMEAVQKLELIEDLKNLGISYPFKDNIQQILNQIYNEHKCCHNSEVEEKDLYFTALRFRLLRQQGFEVSQEVFDHFKNEKGTDFKPNLADDTKGLLQ
L. angustifolia LIS (69) KGTKMEAVQQLELIDDSQNLGLSYYFQDKIKHILNLIYNDHKYFYDSEAEGMDLYFTALGFRLFRQHGFKVSQEVFDRFKNENGTYFK---HDDTKGLLQ
putative L.x intermedia LIS( 98) KGAKMEAVQQLELIDDSQNLGLSYYFQDKIKHILNLIYNDHRFFYDSEAEGMDLYFTALGFRLFRQHGFKVSQEVFDRFKNENGTYFK---HGDTKGLLQ
Consensus (101) KG KMEAVQQLELIDDSQNLGLSYYFQDKIKHILNLIYNDHKFFYDSEAEGMDLYFTALGFRLFRQHGFKVSQEVFDRFKNENGTYFK HDDTKGLLQ
201 300
L. latifolia LIS (201) LYEASFLLREAEDTLESARQFSTKLLQKKVDENGDDKIEDNLLLWIRRSLELPLHWRVQRLEARGFLDAYVRRPDMNPIVFELAKLDFNITQATQQEELK
L. angustifolia LIS (166) LYEASFLVREGEETLEQAREFATKSLQRKLDEDGDG-IDANIESWIRHSLEIPLHWRAQRLEARWFLDAYARRPDMNPVIFELAKLNFNIVQATQQEELK
putative L.x intermedia LIS(195) LYEASFLVREGEETLEQARQFATKSLQRKLDEDGDG-IDGNLKSWIRHSLEIPLHWRAQRLEARWFLDAYARRPDMNPLIFELAKLNFNIVQATQQEELK
Consensus (201) LYEASFLVREGEETLEQARQFATKSLQRKLDEDGDG IDANL SWIRHSLEIPLHWRAQRLEARWFLDAYARRPDMNPIIFELAKLNFNIVQATQQEELK
301 400
L. latifolia LIS (301) DLSRWWNSTGLAEKLPFARDRVVESYFWAMGTFEPHQYGYQRELVAKIIALATVVDDVYDVYGTLEELELFTDAIRRWDRESIDQLPYYMQLCFLTVNNF
L. angustifolia LIS (265) ALSRWWSSLGLAEKLPFVRDRLVESYFWAIPLFEPHQYGYQRKVATKIITLITSLDDVYDIYGTLDELQLFTNLFERWDNASIGRLPEYLQLFYFAIHNF
putative L.x intermedia LIS(294) DLSRWWSSLGLAEKFPFVRDRLVESYFWAVPLFEPHQHGYQRKVATKIITLITSLDDVYDIYGTLDELQLFTDLLERWDNASIGRLPEYLQLFYFVIHNF
Consensus (301) DLSRWWSSLGLAEKLPFVRDRLVESYFWAIPLFEPHQYGYQRKVATKIITLITSLDDVYDIYGTLDELQLFTDLIERWDNASIGRLPEYLQLFYF IHNF
401 500
L. latifolia LIS (401) VFELAHDVLKDKSFNCLPHLQRSWLDLAEAYLVEAKWYHSRYTPSLEEYLNIARVSVTCPTIVSQMYFALPIPIGKPVIEIMYKYHDILYLSGMLLRLTD
L. angustifolia LIS (365) VSEVAYDILKEKGFTSIVYLQRSWVDLLKGYLKEAKWYNSGYTPSLEEYFDNAFMTIGAPPVLSQAYFTLGSSMEKPIIESMYEYDNILRVSGMLVRLPD
putative L.x intermedia LIS(394) ISEVAYDVLKEKGFTSIVYLQRSWVDLLKGYLKEAKWYNSGYRPRLEEYFDNAFMTIGAPSVISQAYFTLGSSMEKPIIESMYEYDNILRVSGMLVRLPD
Consensus (401) VSEVAYDVLKEKGFTSIVYLQRSWVDLLKGYLKEAKWYNSGYTPSLEEYFDNAFMTIGAPSVISQAYFTLGSSMEKPIIESMYEYDNILRVSGMLVRLPD
501 600
L. latifolia LIS (501) DLGTASFELKRGDVPKAVQCYMKERNVPENEAREHVKFLIREASKQMNTAMAT-DCPFTEDFAVAAANLGRVANFVYVDGDGFGVQHSKIYEQIGTLMFE
L. angustifolia LIS (465) DLGTSSFEMERGDVPKSVQLYMKETNATEEEAVEHVRFLNREAWKKMNTAEAAGDSPLVSDVVAVAANLGRAAQFMYFDGDG---NQSSLQQWIVSMLFE
putative L.x intermedia LIS(494) DLGTSSFEMKRGDVPKSVQLYMKETNATEEEAVEHVRLLNREAWKKMNTAEAAGDSPLVSDVVAVAANLGRAAQFMYFDGDG---NQSSLQQWIVSMLFE
Consensus (501) DLGTSSFEMKRGDVPKSVQLYMKETNATEEEAVEHVRFLNREAWKKMNTAEAAGDSPLVSDVVAVAANLGRAAQFMYFDGDG NQSSLQQWIVSMLFE
601
L. latifolia LIS (600) PYP
L. angustifolia LIS (562) PYA
putative L.x intermedia LIS(591) PYA
Consensus (601) PYA
Figure 9: Amino acid sequence alignment of L. angustifolia LIS and a putative LIS (pAB007) isolated from L. x intermedia cv. Grosso flowers. Yellow indicates
identical aa, green denotes conservative aa changes. Conserved sequence motifs are underlined; the sequence highlighted in red indicates the putative plastid targeting
signal.

61
Figure 10: Heterologous expression of putative L. x intermedia LIS. The putative LIS was expressed in E. coli
(clones pAB051 and pAB053); the soluble and insoluble protein fractions were isolated and compared to the
protein extract from non-induced, i.e. non-expressing clones.

62
In vitro functional expression assay of Lxi-LIS
pAB051
Induced
pAB051
non-induced
pAB053
induced
pAB053
non-induced
pET32a
induced
Mo
no
terp
ene
syn
thes
is
Recovery
(%) 9.78 62.89 65.05 69.62 98.86
Myrcene
(ng/µl) 0.43 3.99 0.67 2.25 0.70
Linalool
(ng/µl) n.d. 0.25 0.14 n.d. 0.13
Norm
ali
zed
Mo
no
terp
ene
syn
thes
is
Recovery
(%) 100 100 100 100 100
Myrcene
(ng/µl) 4.42 6.34 1.03 3.23 0.71
Linalool
(ng/µl) n.d. 0.40 0.21 n.d. 0.13
Table 10: In vitro functional expression assay. A heterologously expressed, putative Lxi-LIS was tested for its
ability to convert GPP to linalool or other monoterpenes. Reaction products were extracted from the in vitro assay
and analysed by GC/MS. Monoterpene concentrations were measured in a 2 µl extract and compared to
background monoterpene levels measured in non-induced intra-clonal (non-induced) or induced inter-clonal
(pET32a induced) controls. Extraction recovery was calculated based on the recovery of 100 µg of menthol added
to the assay. Normalization adjusted the monoterpene abundance to a hypothetical recovery of 100%.
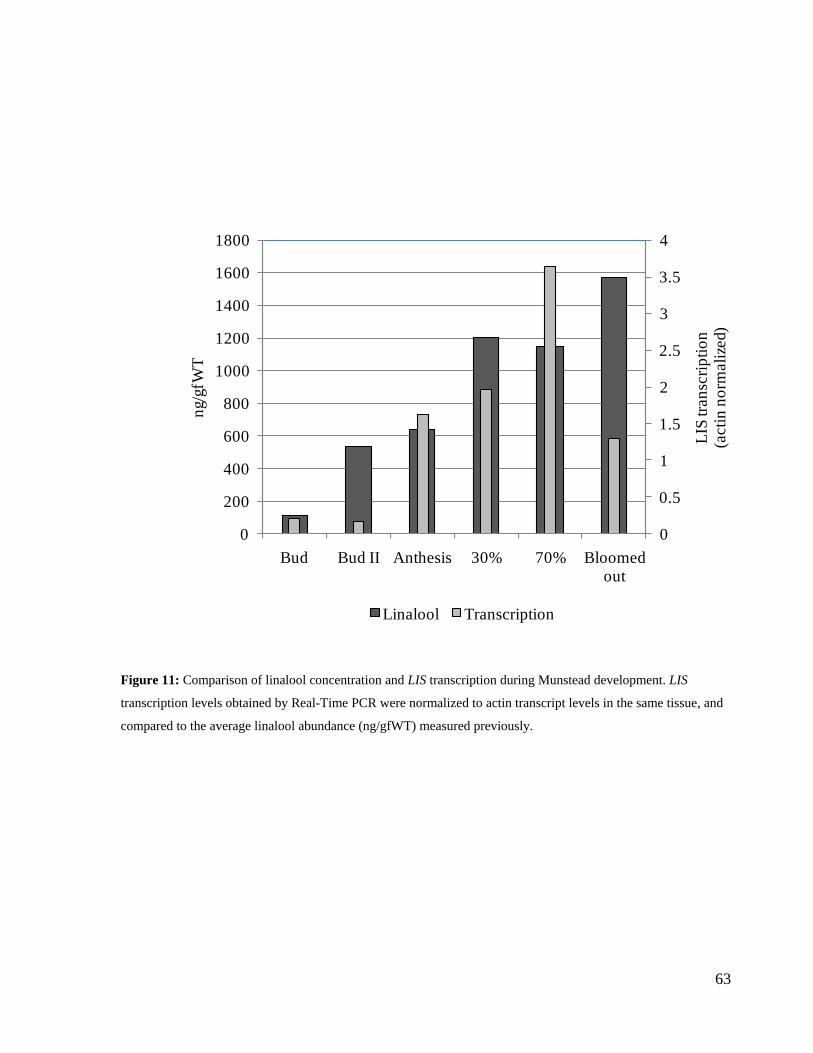
63
0
0.5
1
1.5
2
2.5
3
3.5
4
0
200
400
600
800
1000
1200
1400
1600
1800
Bud Bud II Anthesis 30% 70% Bloomed out
LIS
tra
nsc
rip
tio
n(a
cti
n n
orm
ali
zed)
ng/g
fWT
Linalool Transcription
Figure 11: Comparison of linalool concentration and LIS transcription during Munstead development. LIS
transcription levels obtained by Real-Time PCR were normalized to actin transcript levels in the same tissue, and
compared to the average linalool abundance (ng/gfWT) measured previously.

64
0
20
40
60
80
100
120
140
0
200
400
600
800
1000
1200
1400
1600
1800
Bud Bud II Anthesis 30% 70% Bloomed out
Lxi-
LIS
tran
scri
pti
on
(acti
n n
orm
ali
zed)
ng/g
fWT
Linalool Transcription
Figure 12: Comparison of linalool concentration and Lxi-LIS transcription during Grosso development. Lxi-LIS
transcription levels obtained by Real-Time PCR were normalized to actin transcript levels in the same tissue, and
compared to the average linalool abundance (ng/gfWT) measured previously.

65
4. DISCUSSION
Lavender essential oil is a complex mixture of monoterpenes (and to a lesser extent
sesquiterpenes), which give the plant its characteristic aroma. Linalool is one of the most
abundant monoterpenes found in lavender oil and the ratio between linalool and camphor
determines oil quality. High linalool concentrations combined with trace amounts of camphor
are associated with high quality oil, extracted from L. angustifolia. In contrast, elevated
camphor quantities characterize low quality oil from L. x intermedia. It is widely assumed that
the production of linalool and camphor are regulated genetically, and that the difference in
camphor levels in L. angustifolia and L. x intermedia is due to the distinct genetic background
of these species. Monoterpene production is also influenced by climate and varies throughout
the development of the plant (Clark and Menary, 1980a, Clark and Menary, 1980b, Hussein et
al., 1996, Turner et al., 2000a, Turner et al., 2000b, Dudareva et al., 2003, reviewed in
Sangwan et al., 2001). This study was designed to determine the abundance of major
monoterpenes in lavender cultivars grown under the special climatic conditions in the
Okanagan. Under constant climatic conditions, the differences in monoterpene abundance
between the lavender species L. angustifolia and L. x intermedia and throughout tissue
development were determined. Measurements of monoterpene abundance were limited to
linalool and camphor, as the major quality determining monoterpenes as well as
biosynthetically related compounds, i.e. borneol, the putative camphor precursor, and
limonene, a precursor for a wide variety of oxygenated monoterpenes (Karp et al., 1990)).
Linalool acetate, the product of linalool acetylation and a major monoterpene in most
lavenders, was omitted from the analysis, since linalool acetate detection was suboptimal and
thus unreliable. Together, the abundances of linalool, camphor, borneol and limonene allowed
inferences about the regulation and the biosynthetic pathways of these monoterpenes and thus
set the study into a broader, more comprehensive context.
4.1. Monoterpene abundance is species-specific
For the last century, lavender has been mainly cultivated in France, Spain and Britain.
French lavender is traditionally considered to produce highest quality oils, as determined by a

66
high abundance of linalool and low levels of camphor. The Okanagan Valley of British
Columbia is a fairly new region for lavender cultivation, characterized by a unique mix of hot,
arid summers and cold winters. Given these particular environmental conditions, it seemed
likely that lavender grown in the Okanagan would display unique essential oil characteristics.
Indeed, phytochemical analysis showed that the abundances of camphor and linalool in
Okanagan grown lavender differed slightly from the expected range framed by ISO (L.
angustifolia ISO 3515, L. x intermedia cv. Grosso ISO 8902). Linalool levels were generally
slightly lower than the expected range in all cultivars, while camphor abundances were within
the expected range in L. angustifolia but slightly higher than the standard in L. x intermedia
cultivars.
Comparison of the monoterpene content of multiple L. angustifolia and L. x intermedia
cultivars at the species level demonstrated that both species accumulated similar amounts of
linalool. In contrast, the proportion of camphor as well as the total oil yield was higher in all L.
x intermedia cultivars, which indicated that camphor abundance and total oil yield were
defined by the genetic background of the species and were likely genetically predetermined.
The higher oil yield of L. x intermedia cultivars may be a consequence of the higher
overall productivity of L. x intermedia cultivars. L. x intermedia, a L. angustifolia- L. latifolia
hybrid, is highly prolific, in contrast to the smaller growth of L. angustifolia plants. This strong
and vigorous growth that often exceeds the growth characteristics of the parent species is a
well described phenomenon in hybrid species, known as hybrid vigor or heterosis. Heterosis
might affect essential oil yield either through a simple increase in tissue mass or through an
increase in the biosynthetic capacity of the plant caused by changes in the genetic background
of the hybrid. Hybridization usually affects a large number of genes or gene combinations,
making it difficult to assign the difference in essential oil yield to a single changed gene.
However, it can be speculated that elevated oil levels in L. x intermedia are related to an
increase in the activity of regulatory enzymes that control the availability of common
precursors. For example, up regulation of enzymes that determine the flux through the DXP-or
MVA pathway may increase the availability of the monoterpene precursor GPP. Alternatively,
elevated oil yield in L. x intermedia might be due to an increase in storage capacity, i.e. an
increase in the density of essential oil glands. One argument in support of this hypothesis was
the higher essential oil yield in young leaves as compared to old leaves, a pattern that closely

67
resembled essential oil accumulation in mint leaves (Mentha sp.) (Turner et al., 2000b). The
accumulation of essential oil in young mint leaves was explained by the steady increase of the
total number of peltate glands as the season progressed. Leaves produced early in the season
(i.e. old leaves at the time of harvest) had fewer glands per leaf than leaves produced later in
the season (young leaves at time of harvest), even though the overall size of the leaf blade was
comparable (Colson et al., 1993). It is conceivable that essential oil/monoterpene accumulation
in lavender is correlated with the population dynamics of peltate oil glands in a similar fashion.
However, further analyses are required to measure trichome numbers on lavender tissue and
define the effect of trichome density on essential oil yield.
4.2. Camphor abundance as an indication of the camphor biosynthetic pathway
One observation in this study was that borneol and camphor were differentially
abundant in L. x intermedia and L. angustifolia as well as in leaves and flowers. Leaves
generally contained these two compounds in abundance, while camphor and borneol were
lower in flower tissue. Interestingly, higher camphor abundance in L. x intermedia cv. Grosso
was generally accompanied by low borneol abundance, while this pattern was reversed in
Munstead.
Studies in sage (Salvia officinalis) showed that camphor and borneol are
biosynthetically related. In sage, camphor is synthesized from geranyl diphosphate in a three
step process (Figure 13). After the initial conversion of GPP to bornyl diphosphate (BPP) by
bornyl-diphosphate synthase (BPPS), BPP is hydrolysed to borneol by bornyl-diphosphate
hydrolase (BPPH). The pathway is completed by a terminal oxidation of borneol to camphor
by borneol dehydrogenase (BDH) (Figure 13) (Croteau et al., 1978, Croteau and Karp, 1979a,
Croteau and Karp, 1979b, Dehal and Croteau, 1987, Wise et al., 1998). In theory, the presence
or absence of these three enzymes determines the abundance of the intermediates and the end
product. When all three enzymes are expressed, GPP will be converted mainly into camphor,
which will accumulate as the end product. If either BPPH or BDH is inactive or absent, bornyl-
diphosphate or borneol will accumulate instead while camphor abundance will remain low.
Assuming an analogous pathway in lavender, the observed distribution of borneol and
camphor in Munstead and Grosso tissue was likely caused by the differential expression or
activity of BPPH and BDH in these two species. In Grosso, BPPH and BDH might both have

68
been highly active, catalyzing the production of borneol followed by its conversion into
camphor. Thus, camphor accumulated and camphor levels were consistently higher than
borneol concentrations in L. x intermedia. In Munstead however, camphor was effectively
absent from flowers, and remained low in leaves as compared to Grosso leaves, while borneol
exceeded camphor concentrations in both tissues. This implies that although both BPPH and
BDH were expressed, BDH expression/activity in Munstead was lower than in Grosso causing
the accumulation of borneol rather than camphor.
4.3. An ecological view of the tissue-specific expression of monoterpenes
The analysis of lavender essential oil demonstrated that the abundances of linalool and
camphor were significantly different between vegetative and reproductive tissues. Camphor
abundance in leaves was much higher than in flowers, irrespective of lavender species, while
linalool concentrations were significantly higher in flowers than in leaves. This tissue specific
abundance may be explained through the distinct ecological function of linalool and camphor
in vegetative and reproductive tissue. In vegetative tissues, monoterpenes act in direct and
indirect defense against herbivores and as a protection against plant pathogens (reviewed in
Dudareva and Pichersky, 2000). Camphor is known to encompass insecticidal and anti-
microbial activity, and may thus play a role in the defense of lavender pathogens, primarily
affecting vegetative tissue. In flowers on the other hand, monoterpenes likely serve as volatile
cues to attract insects and other pollinators (Knudsen et al., 1993, Dobson, 1994, Dudareva and
Pichersky, 2000). Linalool, which is the predominant monoterpene of lavender flowers, is
present in the floral fragrance of diverse plant families and is attractive to a broad spectrum of
pollinators. It has been shown that linalool emission is often synchronized with pollinator
activity. For instance, emission of linalool from Clarkia breweri (Gray) Greene (Onagraceae)
flowers evolved to suit pollination by nocturnal moths, while linalool emission in its
evolutionary progenitor sibling species C. concinna (Fischer & Meyer) Greene, matched the
diurnal activity pattern of their pollinating bees (MacSwain et al., 1973, Raguso and Pichersky,
1995, Raguso and Pichersky, 1999). Interestingly, studies also showed that linalool emission
and flower scent were markedly reduced soon after pollination (Dudareva and Pichersky,
2000), an observation that might reason the slight decrease in the average linalool abundance in
mature lavender flowers. The practical absence of linalool from leaves is explained by the

69
hypothesis that fragrance compounds active in pollinator attraction are emitted exclusively
from flowers, since volatiles emitted from both leaves and flowers would be unreliable to
orientate foraging pollinators to the flowers at close range (Pellmyr et al., 1987). The cause of
the tissue-specific distribution of camphor and linalool is so far speculative. Nevertheless, a
better understanding of the (tissue-specific) distribution of monoterpenes that deter predators or
allure pollinators is of particular interest for agriculture. For instance, monoterpenes
functioning as natural protectants may be utilized for ecological pest control and thus reduce
the need for chemical pesticides. Natural pollinator attractants on the other hand may enhance
the success rate of fertilization and improve both crop yield and quality.
4.4. Isolation of a putative linalool synthase from L. x intermedia
Linalool synthase (LIS), the monoterpene synthase catalyzing the production of
linalool, has been isolated from a number of different plants including the two L. x intermedia
parental species L. angustifolia and L. latifolia. During the course of this study a cDNA clone
from L. x intermedia (cv. Grosso) was isolated, which showed highest similarity to L.
angustifolia LIS. The similarity between the L. angustifolia LIS and the L. x. intermedia clone
suggested that this sequence functions as a LIS homolog, and was therefore termed Lxi-LIS.
Sequence comparison of the newly isolated Lxi-LIS sequence to other monoterpene synthases,
placed the former gene into the TPS-b class of monoterpene synthases (Figure 14), together
with other LIS representatives of the Lamiaceae family. Amino acid analysis showed that this
putative LIS encompassed an N-terminal extension with comparatively many serine and
alanine residues and few acidic amino acids. This feature is often found in signal peptides,
which direct proteins to plastids where they are processed to their active mature forms by
truncation of the N-terminal peptides (Keegstra et al., 1989, von Heijne et al., 1989). A plastid
signal sequence (PTS) was an expected feature for a putative linalool synthase, since these
enzymes are often localized to leucoplasts of oil glands (Turner et al., 1999). With 53 amino
acids, the length of the PTS of this putative LIS was consistent with plastid targeting signals of
other monoterpene synthases that usually contain 50–70 amino acids (Bohlmann et al., 1998a).
In comparison to the signal peptide of the previously isolated L. angustifolia LIS, the PTS of
this new putative Lxi-LIS was 28 aa longer and shared a number of similar amino acids with a
different LIS-PTS from L. latifolia. The similarity between the putative Lxi-LIS, the L.

70
angustifolia LIS and the L. latifolia LIS sequence was not unexpected. L. x intermedia is the
result of a cross between L. angustifolia and L. latifolia. Thus, the L. x intermedia Lxi-LIS gene
may be the result of gene shuffling, featuring a novel LIS with the L. latifolia signal peptide
and a L. angustifolia coding sequence.
Despite the close similarity to other linalool synthases, evidence of the functionality of
the isolated LIS is so far inconclusive. Recombinant expression of the cDNA clone was highly
successful; however, the recombinant protein was insoluble, which likely inhibited enzyme
function in the subsequent in vitro assay. Protein insolubility is a common problem
encountered in the bacterial expression of monoterpene synthases, likely caused by an
extended plastid targeting signal peptide (Bohlmann et al., 1998a). For instance, Landmann et
al (2007) noticed that short signaling peptides up to 35 bp did not diminish the solubility of the
heterologous expressed L. angustifolia LIS (Landmann et al., 2007). However, the longer
signal peptides (between 50-70 bp in length) of an L. angustifolia limonene synthase caused
insoluble protein aggregates in vitro (Landmann et al., 2007). On the other hand, Williams et
al. (1998) demonstrated that the partial removal of this preprotein yielded a functional,
recombinant limonene synthase (Williams et al., 1998). The 65 amino acid extension of the
putative L. x intermedia LIS homolog likely caused the insolubility of the recombinant protein
and thus inhibited protein function. Deletion of the entire signal peptide however, should
improve future attempts to express the recombinant L. x intermedia LIS protein and prove its
functionality.
4.5. LIS transcription correlates with linalool abundance during flower
ontogeny
A comparison between LIS (and Lxi-LIS) transcription and linalool accumulation during
lavender flower ontogeny showed that the abundance of LIS and Lxi-LIS messages was closely
correlated with linalool concentration in both Munstead and Grosso throughout flower
development. In Grosso, Lxi-LIS gene transcription paralleled linalool concentration at all
stages of development, similar to previous studies in Clarkia breweri (Pichersky et al., 1994,
Dudareva et al., 1996), which demonstrated a correlation between the transcription, enzyme
activity and emission of LIS and linalool. The high correlation coefficient of 0.81 suggests a
direct relationship between LIS mRNA abundance and linalool production, supporting the

71
current hypotheses that the production of some monoterpenes is regulated at the level of
transcription.
In Munstead flowers, LIS transcription decreased towards the end of flower
development while linalool levels remained high, suggesting that LIS transcription preceded
linalool production and that linalool was stored beyond the time of peak linalool synthesis.
This pattern was similar to findings by Raguso et al. (1999), who showed that LIS mRNA in C.
breweri accumulated during the final days of bud maturation and preceded the peak emission
of linalool by two days (Raguso and Pichersky, 1999). However, a low correlation coefficient
of 0.58 between transcript abundance and linalool concentration suggest that other regulatory
mechanisms (e.g. posttranscriptional or posttranslational regulation) influence linalool
abundance in Munstead. Further investigations are required to determine the exact nature of the
regulatory mechanisms that control linalool abundance in Munstead and determine possible
differences in the regulation of linalool synthesis in L. angustifolia and L. x intermedia.
4.6. Conclusion and future prospects
The current study aimed to determine the monoterpene profile of lavender grown in the
Okanagan and define regulatory factors that control monoterpene abundance in lavender.
Therefore, three hypotheses were tested, i.e. (i) monoterpene abundance and essential oil yield
are specific to the lavender species; (ii) monoterpene abundance and essential oil yield are
regulated developmentally, and (iii) monoterpene abundance is regulated at the level of gene
expression.
The initial comparison of oil from various lavender cultivars showed that ‘English
Lavender’ (Lavandula angustifolia) oils were high in linalool, but low in camphor content and
were characterized by overall low oil yield. In contrast, cultivars of the hybrid species
Lavandula x intermedia, produced large amounts of oil, marked by a high abundance of
linalool as well as high camphor content. Thus, these results confirmed the empirical paradigm
that monoterpene composition and yield of lavender oil are specific to lavender species the
essential oil is derived from.
Monitoring monoterpene abundance and essential oil production throughout lavender
ontogeny demonstrated that monoterpene abundances changed with the developmental stage of
the lavender tissue, and markedly differed between flowers and leaves. Flowers produced the

72
bulk of the essential oil with highest levels of linalool at the stage when 30%-70% of the
flower spike was in bloom. In contrast, leaves produced little oil which was characterized by
high abundances of camphor and borneol.
The molecular basis for the differential distribution of monoterpenes throughout
ontogeny is unclear. Based on presented data, there is a strong indication for a direct
relationship between the abundance of LIS transcript and linalool abundance, suggesting that
linalool production is regulated through gene transcription. However, other, unknown
regulatory factors are likely to influence linalool abundance and further investigations are
necessary to determine the exact nature of monoterpene regulation in lavender.
Taking these results together, this study can guide local lavender farming in adjusting
lavender harvest to times when the most oil, with the desired monoterpene profile is produced.
On more general terms, knowing the factors that control monoterpene abundance and regulate
essential oil quality are valuable for the broad field of today’s flower and scent industry. For
decades the flower industry has put every effort into improving flower colour, longevity,
shape, size and disease resistance, paying scant attention to the flower’s most emblematic
attribute: its scent. In recent years, the importance of flower scent has experienced a major
comeback and scented versions of ornamental plants are more and more requested. Linalool is
a major scent determinant in numerous ornamentals, and contributes to the aroma and flavour
of many fruits. The mechanism by which linalool abundance is regulated in different tissues or
throughout development is still unclear. However, results presented here suggested that linalool
abundance is in part regulated through the transcription of LIS. Together with the isolation of a
putative LIS gene from L. x intermedia cv. Grosso this may form the basis for the genetic
modification of L. x intermedia to artificially increase or stabilize linalool abundance.
Lastly, throughout this study lavender has proven to be valuable as a new and unique
model system for the investigation of volatile plant secondary metabolites. Monoterpene
synthesis and regulation have been studied in numerous Lamiaceae, e.g. mint, sage and thyme.
Blooming of these species is traditionally undesirable and repressed due to their use as herbs,
thus limiting the current knowledge about monoterpenes and monoterpene synthases to their
function and regulation in vegetative tissue. Lavender on the other hand can be used to provide
insight into the regulation of volatiles specific to flowers. Monoterpene research in lavender

73
may thus aid to increase our understanding of scent regulation in general and lead to ways to
enhance scent in flowers or to engineer plants that produce novel scents.

Figure 13: Putative camphor biosynthetic pathway. PP: -diphosphate; BPPS: Bornyl-diphosphate synthase, BPPH: Bornyl-diphosphate hydrolase, BDH: Borneol
dehydrogenase
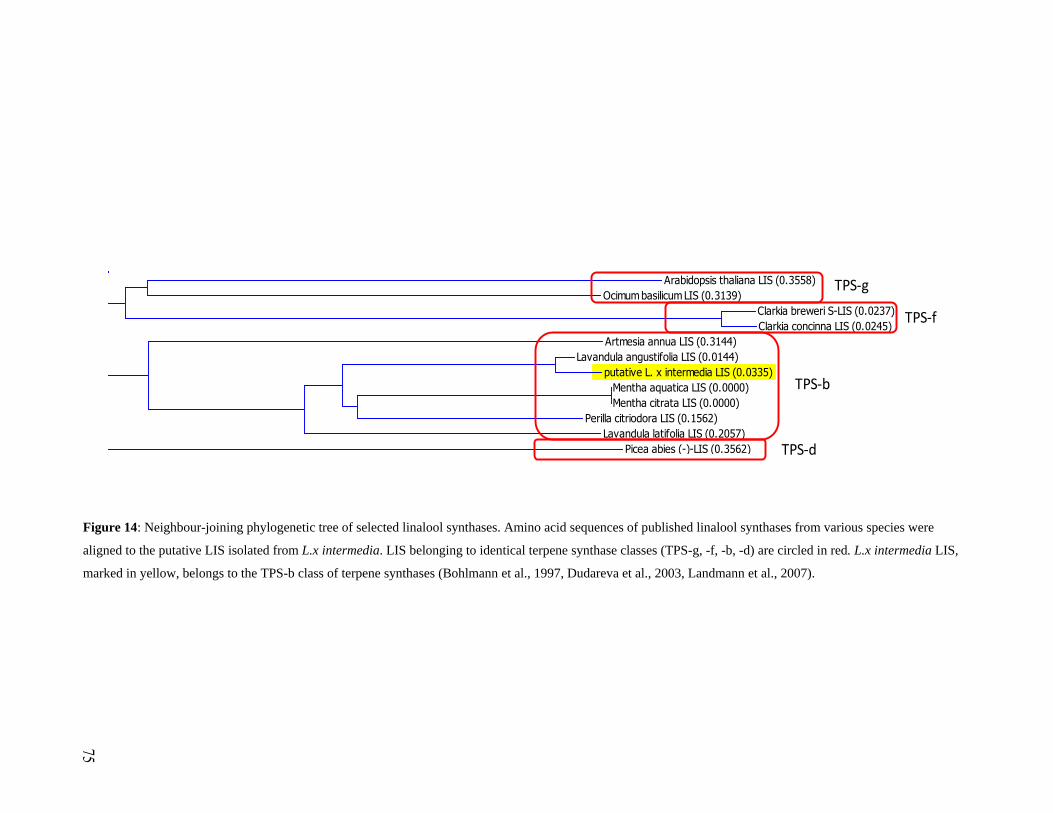
Figure 14: Neighbour-joining phylogenetic tree of selected linalool synthases. Amino acid sequences of published linalool synthases from various species were
aligned to the putative LIS isolated from L.x intermedia. LIS belonging to identical terpene synthase classes (TPS-g, -f, -b, -d) are circled in red. L.x intermedia LIS,
marked in yellow, belongs to the TPS-b class of terpene synthases (Bohlmann et al., 1997, Dudareva et al., 2003, Landmann et al., 2007).
Arabidopsis thaliana LIS (0.3558)
Ocimum basilicum LIS (0.3139)
Clarkia breweri S-LIS (0.0237)
Clarkia concinna LIS (0.0245)
Artmesia annua LIS (0.3144)
Lavandula angustifolia LIS (0.0144)
putative L. x intermedia LIS (0.0335)
Mentha aquatica LIS (0.0000)
Mentha citrata LIS (0.0000)
Perilla citriodora LIS (0.1562)
Lavandula latifolia LIS (0.2057)
Picea abies (-)-LIS (0.3562)
TPS-g
TPS-f
TPS-b
TPS-d

76
5. REFERENCES
Adam, K.L. (2006). Lavender production, products, markets, and entertainment farms.
Retrieved November 5, 2006, from http://attra.ncat.org/attra-pub/lavender.html
Adsersen, A., B. Gauguin, L. Gudiksen and A.K. Jager (2005). Screening of plants used in
Danish folk medicine to treat memory dysfunction for acetylcholinesterase inhibitory
activity. Journal of Ethnopharmacology 104:418-422
Alonso, W.R., J.I. Rajaonarivony, J. Gershenzon and R. Croteau (1992). Purification of 4S-
limonene synthase, a monoterpene cyclase from the glandular trichomes of peppermint
(Mentha x piperita) and spearmint (Mentha spicata). Journal of Biological Chemistry
267:7582-7587.
Arimura, G., D.P. Huber and J. Bohlmann (2004a). Forest tent caterpillars (Malacosoma
disstria) induce local and systemic diurnal emissions of terpenoid volatiles in hybrid
poplar (Populus trichocarpa x deltoides): CDNA cloning, functional characterization, and
patterns of gene expression of (-)-germacrene D synthase, PtdTPS1. The Plant Journal: For
Cell and Molecular Biology 37:603-616.
Arimura, G., R. Ozawa, S. Kugimiya, J. Takabayashi and J. Bohlmann (2004b). Herbivore-
induced defence response in a model legume. Two-spotted spider mites induce emission of
(E)-beta-ocimene and transcript accumulation of (E)-beta-ocimene synthase in Lotus
japonicus. Plant Physiology 135:1976-1983.
Bick, J.A. and B.M. Lange (2003). Metabolic cross talk between cytosolic and plastidial
pathways of isoprenoid biosynthesis: Unidirectional transport of intermediates across the
chloroplast envelope membrane. Archives of Biochemistry and Biophysics 415:146-154.
Bohlmann, J., M. Phillips, V. Ramachandiran, S. Katoh and R. Croteau (1999). cDNA cloning,
characterization, and functional expression of four new monoterpene synthase members of
the tpsd gene family from grand fir (Abies grandis). Archives of Biochemistry and
Biophysics 368:232–243.

77
Bohlmann, J., C.L. Steele and R. Croteau (1997). Monoterpene synthases from grand fir (Abies
grandis). cDNA isolation, characterization, and functional expression of myrcene
synthase, (-)-(4S)-limonene synthase, and (-)-(1S,5S)-pinene synthase. Journal of
Biological Chemistry 272:21784-21792.
Bohlmann, J., J. Crock, R. Jetter and R. Croteau (1998a). Terpenoid-based defences in
conifers: CDNA cloning, characterization, and functional expression of wound-inducible
(E)-alpha-bisabolene synthase from grand fir (Abies grandis). Proceedings of the National
Academy of Sciences of the United States of America 95:6756-6761.
Bohlmann, J., G. Meyer-Gauen and R. Croteau (1998b). Plant terpenoid synthases: Molecular
biology and phylogenetic analysis. Proceedings of the National Academy of Sciences of
the United States of America 95:4126-4133.
Bohlmann, J., D. Martin, N.J. Oldham and J. Gershenzon (2000). Terpenoid secondary
metabolism in Arabidopsis thaliana: CDNA cloning, characterization, and functional
expression of a myrcene/(E)-beta-ocimene synthase. Archives of Biochemistry and
Biophysics 375:261-269.
Botella-Pavia, P., O. Besumbes, M.A. Phillips, L. Carretero-Paulet, A. Boronat and M.
Rodriguez-Concepcion (2004). Regulation of carotenoid biosynthesis in plants: Evidence
for a key role of hydroxymethylbutenyl diphosphate reductase in controlling the supply of
plastidial isoprenoid precursors. The Plant Journal : For Cell and Molecular Biology
40:188-199.
Bouvier, F., A. Rahier and B. Camara (2005). Biogenesis, molecular regulation and function of
plant isoprenoids. Progress in Lipid Research 44:357-429.
Bouwmeester, H.J., J. Gershenzon, M.C.J.M. Konings and R. Croteau (1998). Biosynthesis of
the monoterpenes limonene and carvone in the fruit of caraway: I. demonstration of
enzyme activities and their changes with development. Plant Physiology 117:901-912
Cavanagh, H.M. and J.M. Wilkinson (2002). Biological activities of lavender essential oil.
Phytotherapy Research 16:301-308.
Chappell, J., F. Wolf, J. Proulx, R. Cuellar and C. Saunders (1995). Is the reaction catalyzed by
3-hydroxy-3-methylglutaryl coenzyme A reductase a rate-limiting step for isoprenoid
biosynthesis in plants? Plant Physiology 109:1337-1343.

78
Christianson, D.W. (2006). Structural biology and chemistry of the terpenoid cyclases.
Chemical Reviews 106:3412-3442.
Chu, C.J. and K.J. Kemper (2001). Lavender (lavandula ssp.). Retrieved July 24, 2008 from
http://www.longwoodherbal.org/lavender/lavender.pdf.
Clark, R.J. and R.C. Menary (1980a). Environmental effects on peppermint (Mentha piperita
L.). II. Effects of temperature on photosynthesis, photorespiration and dark respiration in
peppermint with reference to oil composition. Australian Journal of Plant Physiology
7:693-697.
Clark, R.J. and R.C. Menary (1980b). Environmental effects on peppermint (Mentha piperita
L.). I. Effect of day length, photon flux density, night temperature and day temperature on
the yield and composition of peppermint oil. Australian Journal of Plant Physiology 7:685-
692.
Colby, S.M., W.R. Alonso, E.J. Katahira, D.J. McGarvey and R. Croteau (1993). 4S-limonene
synthase from the oil glands of spearmint (Mentha spicata). cDNA isolation,
characterization, and bacterial expression of the catalytically active monoterpene cyclase.
Journal of Biological Chemistry 268:23016-23024.
Colson, M., R. Pupier and A. Perrin (1993). Biomathematical study of the number of peltate
glands on Mentha x piperita leaves. Canadian Journal of Botany 71:1202-1211.
Croteau, R. and F. Karp (1976). Enzymatic synthesis of camphor from neryl pyrophosphate by
a soluble preparation from sage (Salvia officinalis). Biochemical and Biophysical
Research Communications 72:440-447.
Croteau, R., C.L. Hooper and M. Felton (1978). Biosynthesis of monoterpenes. partial
purification and characterization of a bicyclic monoterpenol dehydrogenase from sage
(Salvia officinalis). Archives of Biochemistry and Biophysics 188:182-193.
Croteau, R. and F. Karp (1979a). Biosynthesis of monoterpenes: Hydrolysis of bornyl
pyrophosphate, an essential step in camphor biosynthesis, and hydrolysis of geranyl
pyrophosphate, the acyclic precursor of camphor, by enzymes from sage (Salvia
officinalis). Archives of Biochemistry and Biophysics 198:523-532.

79
Croteau, R. and F. Karp (1979b). Biosynthesis of monoterpenes: Preliminary characterization
of bornyl pyrophosphate synthetase from sage (Salvia officinalis) and demonstration that
geranyl pyrophosphate is the preferred substrate for cyclization. Archives of Biochemistry
and Biophysics 198:512-522.
Cusidó, R.M., J. Palazón, M. Bonfill, O. Expósito, E. Moyano and M.T. Piñol (2007). Source
of isopentenyl diphosphate for taxol and baccatin III biosynthesis in cell cultures of Taxus
baccata. Biochemical Engineering Journal 33:159-167.
Dehal, S.S. and R. Croteau (1987). Metabolism of monoterpenes: Specificity of the
dehydrogenases responsible for the biosynthesis of camphor, 3-thujone, and 3-isothujone.
Archives of Biochemistry and Biophysics 258:287-291.
Dobson, H.E.M. (1994). Floral volatiles in insect biology. Insect-Plant Interactions 5:47–81.
Dudareva, N., L. Cseke, V.M. Blanc and E. Pichersky (1996). Evolution of floral scent in
clarkia: Novel patterns of S-linalool synthase gene expression in the C. breweri flower.
The Plant Cell 8:1137-1148.
Dudareva, N. and E. Pichersky (2000). Biochemical and molecular genetic aspects of floral
scents. Plant Physiology 122:627-633.
Dudareva, N., D. Martin, C.M. Kish, N. Kolosova, N. Gorenstein, J. Faldt, B. Miller and J.
Bohlmann (2003). (E)-beta-ocimene and myrcene synthase genes of floral scent
biosynthesis in snapdragon: Function and expression of three terpene synthase genes of a
new terpene synthase subfamily. The Plant Cell 15:1227-1241.
Dudareva, N., S. Andersson, I. Orlova, N. Gatto, M. Reichelt, D. Rhodes, W. Boland and J.
Gershenzon (2005). The nonmevalonate pathway supports both monoterpene and
sesquiterpene formation in snapdragon flowers. Proceedings of the National Academy of
Sciences of the United States of America 102:933-938.
Dudley, M.W., M.T. Dueber and C.A. West (1986). Biosynthesis of the macrocyclic diterpene
casbene in castor bean Ricinus communis L.) seedlings. Plant Physiology 81:335-342.
Eisenreich, W., A. Bacher, D. Arigoni and F. Rohdich (2004). Biosynthesis of isoprenoids via
the non-mevalonate pathway. Cellular and Molecular Life Sciences 61:1401-1426.

80
Estevez, J.M., A. Cantero, A. Reindl, S. Reichler and P. Leon (2001). 1-deoxy-D-xylulose-5-
phosphate synthase, a limiting enzyme for plastidic isoprenoid biosynthesis in plants.
Journal of Biological Chemistry 276:22901-22909.
Fahn, A. (1979). Secretory Tissues in Plants. London Academic Press, London, New York.
Fahn, A. (1988). Secretory tissues in vascular plants. New Phytologist 108:229-257.
Faldt, J., D. Martin, B. Miller, S. Rawat and J. Bohlmann (2003). Traumatic resin defence in
Norway spruce (Picea abies): Methyl jasmonate-induced terpene synthase gene
expression, and cDNA cloning and functional characterization of (+)-3-carene synthase.
Plant Molecular Biology 51:119-133.
Flores, G., G.P. Blanch, Ruiz del Castillo, M.L. and M. Herraiz (2005). Enantiomeric
composition studies in Lavandula species using supercritical fluids. Journal of Separation
Science 28:2333-2338.
Hampel, D., A. Mosandl and M. Wust (2005). Biosynthesis of mono- and sesquiterpenes in
carrot roots and leaves (Daucus carota L.): Metabolic cross talk of cytosolic mevalonate
and plastidial methylerythritol phosphate pathways. Phytochemistry 66:305-311.
Hemmerlin, A., J.F. Hoeffler, O. Meyer, D. Tritsch, I.A. Kagan, C. Grosdemange-Billiard, M.
Rohmer and T.J. Bach (2003). Cross-talk between the cytosolic mevalonate and the
plastidial methylerythritol phosphate pathways in tobacco bright yellow-2 cells. The
Journal of Biological Chemistry 278:26666-26676.
Hohl, R.J. (1996). Monoterpenes as regulators of malignant cell proliferation. Advances in
Experimental Medicine and Biology 401:137-146.
Hussein, M., E. El-Saeid and S. El-Sherbeny (1996). Yield and quality of lavender in relation
to foliar application of sulphur and phosphorus. Egyptian Journal of Horticulture 23:167-
178.
Interactive European Network for Industrial Crops and their Applications (IENICA) (2002).
Lavender. Retrieved July 24, 2008 from http://www.ienica.net/crops/lavender.htm.
ISO 3515: 2002: Oil of Lavender ( Lavandula angustifolia Mill.). 2002.

81
ISO 8902:1999: Oil of Lavandin Grosso [Lavandula angustifolia Miller X Lavandula latifolia
(L.f.) Medikus], French type. 1999.
Karp, F., C.A. Mihaliak, J.L. Harris and R. Croteau (1990). Monoterpene biosynthesis:
Specificity of the hydroxylations of (-)-limonene by enzyme preparations from peppermint
(Mentha piperita), spearmint (Mentha spicata), and perilla (Perilla frutescens) leaves.
Archives of Biochemistry and Biophysics 276:219-226.
Keegstra, K., L.J. Olsen and S.M. Theg (1989). Chloroplastic precursors and their transport
across the envelope membranes. Annual Review of Plant Physiology and Plant Molecular
Biology 40:471-501.
Knudsen, J., L. Tollsten and L. Bergstrom (1993). Floral scents—a checklist of volatile
compounds isolated by head-space techniques. Phytochemistry 33:253-280.
Kreis, P. and A. Mosandl (1992). Chiral compounds of essential oils. Part XI. Simultaneous
stereoanalysis of lavandula oil constituents. Flavour and Fragrance Journal 7:187-193.
Laemmli, U.K. (1970). Cleavage of structural proteins during the assembly of the head of
bacteriophage T4. Nature 227:680-685.
Landmann, C., B. Fink, M. Festner, M. Dregus, K.H. Engel and W. Schwab (2007). Cloning
and functional characterization of three terpene synthases from lavender (Lavandula
angustifolia). Archives of Biochemistry and Biophysics 465:417-429.
Laule, O., A. Furholz, H.S. Chang, T. Zhu, X. Wang, P.B. Heifetz, W. Gruissem and M. Lange
(2003). Crosstalk between cytosolic and plastidial pathways of isoprenoid biosynthesis in
Arabidopsis thaliana. Proceedings of the National Academy of Sciences of the United
States of America 100:6866-6871.
Lichtenthaler, H.K. (1999). The 1-deoxy-D-xylulose-5-phosphate pathway of isoprenoid
biosynthesis in plants. Annual Review of Plant Physiology and Plant Molecular Biology
50:47-65.
Lis-Balchin, M. (2002). Lavender: The Genus Lavandula. (1st ed.). Taylor and Francis Inc.,
New York, NY.

82
Liu, Y., H. Wang, H. Ye and G. Li (2005). Advances in the plant isoprenoid biosynthesis
pathway and its metabolic engineering. Journal of Integrative Plant Biology 47:769-782.
Lucker, J., M.K. El Tamer, W. Schwab, F.W. Verstappen, L.H. van der Plas, H.J.
Bouwmeester and H.A. Verhoeven (2002). Monoterpene biosynthesis in lemon (Citrus
limon). cDNA isolation and functional analysis of four monoterpene synthases. European
Journal of Biochemistry 269:3160-3171.
MacSwain, J.W., P. Raven and R. Thorp (1973). Comparative behaviour of bees and
Onagraceae. IV. Clarkia bees of the western united states. University of California
Publications in Entomology 70:1-80.
Mahmoud, S.S. and R.B. Croteau (2001). Metabolic engineering of essential oil yield and
composition in mint by altering expression of deoxyxylulose phosphate reductoisomerase
and menthofuran synthase. Proceedings of the National Academy of Sciences of the
United States of America 98:8915-8920.
Mahmoud, S.S. and R.B. Croteau (2002). Strategies for transgenic manipulation of
monoterpene biosynthesis in plants. Trends in Plant Science 7:366-373.
Mahmoud, S.S. and R.B. Croteau (2003). Menthofuran regulates essential oil biosynthesis in
peppermint by controlling a downstream monoterpene reductase. Proceedings of the
National Academy of Sciences of the United States of America 100:14481-14486.
Mahmoud, S.S., M. Williams and R. Croteau (2004). Cosuppression of limonene-3-
hydroxylase in peppermint promotes accumulation of limonene in the essential oil.
Phytochemistry 65:547-554.
McCaskill, D. and R. Croteau (1995). Isoprenoid synthesis in peppermint (Mentha x piperita):
Development of a model system for measuring flux of intermediates through the
mevalonic acid pathway in plants. Biochemical Society Transactions 23:290S.
McConkey, M.E., J. Gershenzon and R.B. Croteau (2000). Developmental regulation of
monoterpene biosynthesis in the glandular trichomes of peppermint. Plant Physiology
122:215-224.
McGarvey, D.J. and R. Croteau (1995). Terpenoid metabolism. The Plant Cell 7:1015-1026.

83
McGeady, P. and R. Croteau (1995). Isolation and characterization of an active-site peptide
from a monoterpene cyclase labelled with a mechanism-based inhibitor. Archives of
Biochemistry and Biophysics 317:149-155.
Munoz-Bertomeu, J., E. Sales, R. Ros, I. Arrillaga and J. Segura (2007). Up-regulation of an
N-terminal truncated 3-hydroxy-3-methylglutaryl CoA reductase enhances production of
essential oils and sterols in transgenic Lavandula latifolia. Plant Biotechnology Journal
5:746-758.
Peffley, D.M. and A.K. Gayen (2003). Plant-derived monoterpenes suppress hamster kidney
cell 3-hydroxy-3-methylglutaryl coenzyme a reductase synthesis at the post-transcriptional
level. The Journal of Nutrition 133:38-44.
Pellmyr, O., G. Bergstrom and I. Groth (1987). Floral fragrances in Actaea, using differential
chromatograms to discern between floral and vegetative volatiles. Phytochemistry
26:1603-1606.
Perrucci, S., F. Mancianti, P.L. Cioni, G. Flamini, I. Morelli and G. Macchioni (1994). In vitro
antifungal activity of essential oils against some isolates of Microsporum canis and
Microsporum gypseum. Planta Medica 60:184-187.
Peters, R.J., J.E. Flory, R. Jetter, M.M. Ravn, H.J. Lee, R.M. Coates and R.B. Croteau (2000).
Abietadiene synthase from grand fir (Abies grandis): Characterization and mechanism of
action of the "pseudomature" recombinant enzyme. Biochemistry 39:15592-15602.
Pichersky, E., R.A. Raguso, E. Lewinsohn and R. Croteau (1994). Floral scent production in
Clarkia (Onagraceae) (I. localization and developmental modulation of monoterpene
emission and linalool synthase activity). Plant Physiology 106:1533-1540.
Prinz, W.A., F. Aslund, A. Holmgren and J. Beckwith (1997). The role of the thioredoxin and
glutaredoxin pathways in reducing protein disulfide bonds in the Escherichia coli
cytoplasm. The Journal of Biological Chemistry 272:15661-15667.
Raguso, R.A. and E. Pichersky (1999). New perspectives in pollination biology: Floral
fragrances. A day in the life of a linalool molecule: Chemical communication in a plant-
pollinator system. Part 1: Linalool biosynthesis in flowering plants. Plant Species Biology
14:95-120.

84
Raguso, R.A. and E. Pichersky (1995). Floral volatiles from Clarkia breweri and C. concinna
(Onagraceae): Recent evolution of floral scent and moth pollination. Plant Systematics
and Evolution 194:55-67.
Rodriguez-Concepcion, M., O. Fores, J.F. Martinez-Garcia, V. Gonzalez, M.A. Phillips, A.
Ferrer and A. Boronat (2004). Distinct light-mediated pathways regulate the biosynthesis
and exchange of isoprenoid precursors during Arabidopsis seedling development. Plant
Cell 16:144-156.
Rodriguez-Concepcion, M., I. Ahumada, E. Diez-Juez, S. Sauret-Gueto, L.M. Lois, F. Gallego,
L. Carretero-Paulet, N. Campos and A. Boronat (2001). 1-deoxy-D-xylulose 5-phosphate
reductoisomerase and plastid isoprenoid biosynthesis during tomato fruit ripening. The
Plant Journal: For Cell and Molecular Biology 27:213-222.
Rodriguez-Concepcion, M. and A. Boronat (2002). Elucidation of the methylerythritol
phosphate pathway for isoprenoid biosynthesis in bacteria and plastids. A metabolic
milestone achieved through genomics. Plant Physiology 130:1079-1089.
Rohmer, M., M. Knani, P. Simonin, B. Sutter and H. Sahm (1993). Isoprenoid biosynthesis in
bacteria: A novel pathway for the early steps leading to isopentenyl diphosphate. The
Biochemical Journal 295:517-524.
Sakamoto, R., K. Minoura, A. Usui, Y. Ishizuka and S. Kanba (2005). Effectiveness of aroma
on work efficiency: Lavender aroma during recesses prevents deterioration of work
performance. Chemical Senses 30:683-691.
Sambrook, J. and D.W. Russell. 2001. Molecular Cloning: A Laboratory Manual. (3rd
ed.).
Cold Spring Harbor Laboratory Press, Cold Spring Harbor, New York.
Sangwan, N.S., A.H.A. Farooqi, F. Shabih and R.S. Sangwan (2001). Regulation of essential
oil production in plants. Plant Growth Regulation 34:3-21.
Schuhr, C.A., T. Radykewicz, S. Sagner, C. Latzel, M.H. Zenk, D. Arigoni, A. Bacher, F.
Rohdich and W. Eisenreich (2003). Quantitative assessment of crosstalk between the two
isoprenoid biosynthesis pathways in plants by NMR spectroscopy. Phytochemistry
Reviews 2:3-16.

85
Schulz, S., F. Buhling and S. Ansorge (1994). Prenylated proteins and lymphocyte
proliferation: Inhibition by d-limonene related monoterpenes. European Journal of
Immunology 24:301-307.
Staudt, M. and G. Seufert (1995). Light-dependent emission of monoterpenes by holm oak
(Quercus ilex L.). Naturwissenschaften 82:89-92.
Trapp, S.C. and R.B. Croteau (2001). Genomic organization of plant terpene synthases and
molecular evolutionary implications. Genetics 158:811-832.
Turner, G., J. Gershenzon, E.E. Nielson, J.E. Froehlich and R. Croteau (1999). Limonene
synthase, the enzyme responsible for monoterpene biosynthesis in peppermint, is localized
to leucoplasts of oil gland secretory cells. Plant Physiology 120:879-886.
Turner, G.W., J. Gershenzon and R.B. Croteau (2000a). Development of peltate glandular
trichomes of peppermint. Plant Physiology 124:665-680.
Turner, G.W., J. Gershenzon and R.B. Croteau (2000b). Distribution of peltate glandular
trichomes on developing leaves of peppermint. Plant Physiology 124:655-664.
Turner, G.W. and R. Croteau (2004). Organization of monoterpene biosynthesis in Mentha.
Immunocytochemical localizations of geranyl diphosphate synthase, limonene-6-
hydroxylase, isopiperitenol dehydrogenase, and pulegone reductase. Plant Physiology
136:4215-4227.
Upson, T. and S. Andrews (2004). The genus Lavandula. (1st ed.). Timber Press, Inc., USA.
van Schie, C.C., M.A. Haring and R.C. Schuurink (2006). Regulation of terpenoid and
benzenoid production in flowers. Current Opinion in Plant Biology 9:203-208.
Velikova, V., F. Loreto, T. Tsonev, F. Brilli and A. Edreva (2006). Isoprene prevents the
negative consequences of high temperature stress in Platanus orientalis leaves. Functional
Plant Biology 33:1-10.

86
von Heijne, G., J. Steppuhn and R.G. Herrmann (1989). Domain structure of mitochondrial and
chloroplast targeting peptides. Federation of European Biochemical Societies Journal
180:535-545.
Whittington, D.A., M.L. Wise, M. Urbansky, R.M. Coates, R.B. Croteau and D.W.
Christianson (2002). Bornyl diphosphate synthase: Structure and strategy for carbocation
manipulation by a terpenoid cyclase. Proceedings of the National Academy of Sciences of
the United States of America 99:15375-15380.
Williams, D.C., D.J. McGarvey, E.J. Katahira and R. Croteau (1998). Truncation of limonene
synthase preprotein provides a fully active 'pseudomature' form of this monoterpene
cyclase and reveals the function of the amino-terminal arginine pair. Biochemistry
37:12213-12220.
Wise, M.L., T.J. Savage, E. Katahira and R. Croteau (1998). Monoterpene synthases from
common sage (Salvia officinalis). cDNA isolation, characterization, and functional
expression of (+)-sabinene synthase, 1,8-cineole synthase, and (+)-bornyl diphosphate
synthase. Journal of Biological Chemistry 273:14891-14899.