Embed Size (px)
Citation preview
INSIDE647 Vaccination Coverage Among Children in
Kindergarten — United States, 2011–12 School Year 653 Tattoo-Associated Nontuberculous Mycobacterial
Skin Infections — Multiple States, 2011–2012657 QuickStats
Continuing Education examination available at http://www.cdc.gov/mmwr/cme/conted_info.html#weekly.
Lead Poisoning in Pregnant Women Who Used Ayurvedic Medications from India — New York City, 2011–2012
Lead poisoning still occurs in the United States despite exten-sive prevention efforts and strict regulations. Exposure to lead can damage the brain, kidneys, and nervous and reproductive systems. Fetal exposure to lead can adversely affect neurode-velopment, decrease fetal growth, and increase the risk for premature birth and miscarriage (1). During 2011–2012, the New York City Department of Health and Mental Hygiene (DOHMH) investigated six cases of lead poisoning associated with the use of 10 oral Ayurvedic medications made in India. All six cases were in foreign-born pregnant women assessed for lead exposure risk by health-care providers during prenatal visits, as required by New York state law. Their blood lead levels (BLLs) ranged from 16 to 64 µg/dL. Lead concentrations of the medications were as high as 2.4%; several medications also contained mercury or arsenic, which also can have adverse health effects. DOHMH distributed information about the medications to health-care providers, product manufacturers, and government agencies in the United States and abroad, via postal and electronic mail. DOHMH also ordered a local business selling contaminated products to cease sales. Health-care providers should ask patients, especially foreign-born or pregnant patients, about any use of foreign health products, supplements, and remedies such as Ayurvedic medications. Public health professionals should consider these types of products when investigating heavy metal exposures and raise awareness among health-care providers and the public regard-ing the health risks posed by such products.
The six patients in this report all were asymptomatic pregnant women whose health-care providers assessed them to be at risk for lead exposure. New York state law requires assessment of patients for risk of lead exposure during the first prenatal visit and testing of those determined to be at risk; CDC also recommends routine testing of pregnant women from at-risk populations (e.g., recent immigrants and women who use traditional remedies) (1). The New York State Department of Health forwards all blood lead test results from New York City residents to DOHMH,
which conducts follow-up interviews and case investigations for adults identified with BLLs ≥10 µg/dL. Identification and removal of the lead source is the main priority. Women in the second half of pregnancy with BLLs 45–69 µg/dL are considered for chelation therapy. Pregnant women with BLLs ≥70 µg/dL are considered for chelation regardless of trimester. Pregnant women with lead encephalopathy should receive chelation regardless of trimester (1).
During 2004–2012, through case investigations and agency sweeps of local stores triggered by investigations or published reports, DOHMH identified 22 oral medications, supple-ments, or remedies containing high levels of heavy metals (Table). Twenty of the 22 products were brought into the United States (one product lacked country of origin informa-tion). DOHMH identified 10 of these 22 products during investigations of the six pregnant women with lead poisoning described in this report.
Case Reports Patient 1. In January 2011, a woman born in India, aged
30 years, had a BLL of 64 µg/dL during week 27 of pregnancy. The woman took 1–2 capsules daily for 4 months of Pregnita, an Ayurvedic medication manufactured and purchased in India. She had obtained Pregnita from a practitioner in India
U.S. Department of Health and Human ServicesCenters for Disease Control and Prevention
Morbidity and Mortality Weekly ReportWeekly / Vol. 61 / No. 33 August 24, 2012

Morbidity and Mortality Weekly Report
642 MMWR / August 24, 2012 / Vol. 61 / No. 33
The MMWR series of publications is published by the Office of Surveillance, Epidemiology, and Laboratory Services, Centers for Disease Control and Prevention (CDC), U.S. Department of Health and Human Services, Atlanta, GA 30333.Suggested citation: Centers for Disease Control and Prevention. [Article title]. MMWR 2012;61:[inclusive page numbers].
Centers for Disease Control and PreventionThomas R. Frieden, MD, MPH, Director
Harold W. Jaffe, MD, MA, Associate Director for ScienceJames W. Stephens, PhD, Director, Office of Science Quality
Stephen B. Thacker, MD, MSc, Deputy Director for Surveillance, Epidemiology, and Laboratory ServicesStephanie Zaza, MD, MPH, Director, Epidemiology and Analysis Program Office
MMWR Editorial and Production StaffRonald L. Moolenaar, MD, MPH, Editor, MMWR Series
John S. Moran, MD, MPH, Deputy Editor, MMWR SeriesTeresa F. Rutledge, Managing Editor, MMWR Series
Douglas W. Weatherwax, Lead Technical Writer-EditorDonald G. Meadows, MA, Jude C. Rutledge, Writer-Editors
Martha F. Boyd, Lead Visual Information Specialist
Maureen A. Leahy, Julia C. Martinroe, Stephen R. Spriggs, Terraye M. Starr
Visual Information SpecialistsQuang M. Doan, MBA, Phyllis H. King
Information Technology Specialists
MMWR Editorial BoardWilliam L. Roper, MD, MPH, Chapel Hill, NC, Chairman
Matthew L. Boulton, MD, MPH, Ann Arbor, MIVirginia A. Caine, MD, Indianapolis, IN
Jonathan E. Fielding, MD, MPH, MBA, Los Angeles, CADavid W. Fleming, MD, Seattle, WA
William E. Halperin, MD, DrPH, MPH, Newark, NJKing K. Holmes, MD, PhD, Seattle, WADeborah Holtzman, PhD, Atlanta, GATimothy F. Jones, MD, Nashville, TN
Dennis G. Maki, MD, Madison, WIPatricia Quinlisk, MD, MPH, Des Moines, IA
Patrick L. Remington, MD, MPH, Madison, WIJohn V. Rullan, MD, MPH, San Juan, PR
William Schaffner, MD, Nashville, TNDixie E. Snider, MD, MPH, Atlanta, GA
John W. Ward, MD, Atlanta, GA
who prescribed it for pregnancy-related nausea and vomiting. Testing found Pregnita contained 1.2% lead. Based on her reported use, the woman had consumed approximately 9–18 mg of lead daily, or 1.1–2.2 g of lead over the 4 months. The woman was hospitalized and received chelation therapy with calcium disodium ethylenediaminetetraacetic acid. Her BLL decreased to 36 µg/dL 5 days after chelation and to 20 µg/dL 3 months later (2 weeks after delivering). Her newborn’s BLL was 23 µg/dL at 3 days after birth.
Patient 2. In May 2011, a woman born in Colombia, aged 36 years, had a BLL of 16 µg/dL reported during week 5 of pregnancy. She had used two Ayurvedic medications manu-factured in India for skin problems (1 tablet of each daily) approximately 1–2 months before pregnancy and sporadically used the medications during the first month of pregnancy. She reported purchasing the medications, which were made in India, in New York City. Vatvidhwansan Ras (Figure) contained 2% lead, 1.5% mercury and 130 parts per million (ppm) arsenic. Kankayan Bati (Gulma) contained 12 ppm lead, 35 ppm mercury, and 9.5 ppm arsenic. Although difficult to ascertain exposure, if the woman ingested 1 tablet daily of each pill for 3 months, she would have consumed approximately 3 mg of lead daily, or 270 mg of lead during the entire period. In July, after discontinuing use, her BLL decreased to 10 µg/dL. In November, 3 months before delivery, her BLL was 1 µg/dL. The newborn’s BLL was not measured.
Patient 3. In June 2011, a woman born in India, aged 24 years, had a BLL of 49 µg/dL reported during week 15 of
pregnancy. She ingested two tablets of the Ayurvedic prenatal medication Garbhapal Ras daily to “keep her pregnancy and fetus healthy.” She started use at approximately week 9 of pregnancy and continued for about 6 weeks. Her father, an Ayurvedic practitioner in India, prescribed and mailed the medication to her in an unlabeled container. Garbhapal Ras was found to contain 2.2% lead. Based on her reported use, the woman had consumed approximately 7 mg of lead daily or 300 mg of lead over the 6-week period. The product also was found to contain 1.9% mercury and 410 ppm arsenic. Seven weeks later, after discontinuing use, the woman’s BLL decreased to 26 µg/dL. Her newborn’s BLL was 7 µg/dL at birth.
Patient 4. In August 2011, a woman born in India, aged 35 years, had a BLL of 42 µg/dL reported during week 8 of pregnancy. She had a history of miscarriages and used four Ayurvedic medications approximately 2 months before pregnancy to promote fertility. She ceased use upon learning she was pregnant. She had obtained the medications while in India from an Ayurvedic practitioner. One of the medica-tions, Ovarin (Figure), was found to contain as much as 1.2% lead, 1,000 ppm arsenic, and 1.8% mercury, and the woman reported ingesting 1–2 capsules of Ovarin daily. Based on her reported use, the woman had consumed approximately 6–12 mg of lead daily, or 360–720 mg of lead during the 2 months. She miscarried at approximately 11 weeks’ gestation.
Patient 5. In January 2012, a woman born in India, aged 33 years, had a BLL of 52 µg/dL reported during week 10 of pregnancy. She began using five different Ayurvedic

Morbidity and Mortality Weekly Report
MMWR / August 24, 2012 / Vol. 61 / No. 33 643
Yukt) was found to contain 5.2% arsenic and 120 ppm lead. Pigmento was found to contain 2.9% mercury, 27 ppm arsenic, and 7.3 ppm lead. Based on her reported use, the woman had consumed approximately 12–24 mg of lead daily, or 1.4–2.9 g of lead during the 4 months. She miscarried during week 12 of pregnancy.
Patient 6. In May 2012, a woman born in India, aged 35 years, had a BLL of 24 µg/dL reported during week 22 of pregnancy. In January, she had begun using six medications to increase her chances of “having a male baby.” She obtained the medications from her mother-in-law, who visited an Ayurvedic
medications to improve fertility and one to improve skin complexion about 7 months before her pregnancy. She used each product once or twice daily for approximately 4 months. An Ayurvedic practitioner had provided her with the medica-tions during a previous visit to India. Elevated levels of lead, mercury, or arsenic were found in five of the six medications. Ovarin was found to contain 2.4% lead, 7% mercury, and 100 ppm arsenic. Garbha Dharak Yog was found to contain 10% mercury, 140 ppm arsenic, and 110 ppm lead. Laxmana Louh was found to contain 180 ppm lead, 120 ppm mercury, and 12 ppm arsenic. Garbha Chintamani Ras (Vrihat) (Swarna
See table footnotes on page 644.
TABLE. Ayurvedic medications and other health remedies that have been identified with high heavy metal content — New York City Department of Health and Mental Hygiene, 2004–2012
Product Manufacturer
Country where
manufactured
Country where
purchasedUsage reported
or labeled Heavy metal contentRasa
shastra*
Calabash Chalk (Nzu) Unknown Unknown United States
Morning sickness 10 ppm As6.6 ppm Pb
NA
Emperor’s Tea Pill (concentrated)† Lanzhou Traditional Herbs
China United States
Natural balance 5,400 ppm Pb3,200 ppm Hg
NA
Garbha Chintamani Ras (Vrihat) (Swarna Yukt)§
Baidyanath India India Reproductive health 52,000 ppm As120 ppm Pb
Yes
Garbha Dharak Yog§ Vyas Pharmaceuticals India India Reproductive health 100,000 ppm Hg140 ppm As110 ppm Pb
Yes
Garbhapal Ras§ Unknown India India To keep pregnancy and fetus healthy
22,000 ppm Pb19,000 ppm Hg
410 ppm As
Yes
Garbhapal Ras§ Shri Vishwamitra Ayurved Pharmaceuticals
India India To have a male baby 15,000 ppm Pb4,400 ppm Hg
81 ppm As
Yes
Hepatico Extract (concentrated)¶ Lanzhou Traditional Herbs
China United States
Promote a healthy liver and maintain regularity
5,900 ppm Pb5,100 ppm Hg
NA
Jambrulin Unjha Ayurvedic Pharmacy
India United States
Diabetes 24,300 ppm Pb35 ppm Hg
Yes
Kankayan Bati (Gulma)§ Baidyanath India United States
Skin problems 12 ppm Pb35 ppm Hg9.5 ppm As
No
Lakshmivilash Ras (Nardiya) Baidyanath India United States
Chronic fever, cold, and cough
260 ppm Pb14,100 ppm Hg
42 ppm As
Yes
Laxmana Louh§ Vyas Pharmaceuticals India India Reproductive health 180 ppm Pb120 ppm Hg
12 ppm As
Yes
Maha Sudarshan Arya Aushadhi Pharmaceutical Works
India United States
Flu and body ache 41 ppm Pb2,190 ppm Hg
11 ppm As
No

Morbidity and Mortality Weekly Report
644 MMWR / August 24, 2012 / Vol. 61 / No. 33
practitioner in India on her behalf. She took the medication 1–3 times a day until she discontinued use in June. One of the medications, Garbhapal Ras, was found to contain 1.5% lead, 0.44% mercury, and 81 ppm arsenic. Based on her reported use, the woman had consumed approximately 2–7 mg of lead daily, or 300–1,000 mg over the 5 months. Her BLL decreased to 11 µg/dL 5 weeks after discontinuing the medications. The woman had not yet delivered as of August 20.
Reported by
Paromita Hore, PhD, Munerah Ahmed, MPH, Jacqueline Ehrlich, MD, Celia Ng, MSN, Lourdes Steffen, Slavenka Sedlar, MA, Phyllis Curry-Johnson, EdD, Nathan Graber, MD, Deborah Nagin, MS,
Nancy Clark, MA, Bur of Environmental Disease Prevention, New York City Dept of Health and Mental Hygiene. Robert Saper, MD, Boston Univ, Massachusetts. Marissa Scalia Sucosky, MPH, Div of Emergency and Environmental Health Svcs, National Center for Environmental Health, CDC. Corresponding contributor: Paromita Hore, [email protected], 347-396-4177.
Editorial Note
Foreign-born pregnant women might be at increased risk for lead poisoning. Reasons include use of certain foreign products and increased bone stores of lead from past exposures. The body’s demand for calcium increases during pregnancy to sup-port fetal bone development, which might release these bone
TABLE. (Continued) Ayurvedic medications and other health remedies that have been identified with high heavy metal content — New York City Department of Health and Mental Hygiene, 2004–2012
Product Manufacturer
Country where
manufactured
Country where
purchasedUsage reported
or labeled Heavy metal contentRasa
shastra*
Mahashakti Rasayan Vyas Pharmaceuticals India India Weakness 9,400 ppm Pb70,000 ppm Hg
1,700 ppm As
Yes
Mahayogaraj Guggulu (enriched with silver)
Baidyanath India United States
Rheumatic pain 47,000 ppm Pb4,800 ppm Hg4,300 ppm As
Yes
Ovarin§ Ban Labs Ltd. India India Facilitate ovulation Reproductive health
24,000 ppm Pb70,000 ppm Hg
1,000 ppm As
Yes
Pigmento§ Charak Pharma Pvt. Ltd.
India India Improve skin complexion
29,000 ppm Hg 27 ppm As
7.3 ppm Pb
Yes
Pregnita§ Ajmera Pharmaceuticals
India India Pregnancy-related nausea and vomiting
12,000 ppm Pb Yes
Sorin Research Drugs & Pharmaceuticals
India India Eczema 46,707 ppm Pb Yes
Tierra Santa Unknown Mexico United States
Cleanse stomach for pregnancy
13 ppm Pb11 ppm As
NA
Vasant Kusumakar Ras (with Gold and Pearl)
Dabur India India Diabetes and weakness 29 ppm Pb31,000 ppm Hg
Yes
Vatvidhwansan Ras§ Baidyanath India United States
Skin problems 20,000 ppm Pb15,000 ppm Hg
130 ppm As
Yes
Vita Breath American Herbal Laboratories
United States
United States
Incontinence and to test the “strength of meridians”
1,100 ppm Pb NA
Abbreviations: Pb = lead; Hg = mercury; As = arsenic; NA = not applicable (product is not Ayurvedic).* Rasa shastra is the ancient practice of deliberately combining herbs with “bhasmas” (elaborately prepared metal, mineral, and gem compounds perceived to be safe)
to enhance therapeutic benefit. Ayurvedic medications are divided into two major categories: herbal only and rasa shastra. Source: Saper RB, Phillips RS, Sehgal A, et al. Lead, mercury, and arsenic in US- and Indian-manufactured Ayurvedic medicines sold via the Internet. JAMA 2008;300:915–23.
† Lot no. 010705, expiration date: July 2010.§ The 10 products associated with the six cases described in this report.¶ Lot no. 040804, expiration date: August 2009; lot no. 100105, expiration date: January 2010; lot no. 110604, expiration date: June 2009.

Morbidity and Mortality Weekly Report
MMWR / August 24, 2012 / Vol. 61 / No. 33 645
stores. In 2011, of the 205 New York City women reported to DOHMH with BLLs ≥10 µg/dL, 118 (58%) were pregnant, and 98 (83%) of the pregnant women were foreign-born (New York City Department of Health and Mental Hygiene, unpublished data, 2011). More than 70% of pregnant women with elevated BLLs interviewed by DOHMH in 2011 reported using foreign traditional or familiar products from their ancestral countries, such as cosmetics, medications, remedies, food, and pottery, suggesting that health-care providers should question pregnant women about their use of such products.
Pregnant women present a unique concern, because lead exposure can adversely affect the health of both mother and child. Fetal lead exposure increases the risks for low birth weight, developmental delay, reduced intelligence, and behav-ioral problems (1). Pregnant women exposed to lead might be at increased risk for gestational hypertension and spontaneous abortion (1). Exposure to other heavy metals, such as arsenic and mercury, also can have adverse health effects. Two of the six patients miscarried before 20 weeks’ gestation. Both patients were taking Ayurvedic medications to promote fertility, and it is unknown whether underlying reproductive problems or heavy metal exposures contributed to the miscarriages.
Numerous cases of heavy metal poisonings associated with the use of foreign medications, supplements, traditional
* Information available at http://www.fda.gov/forconsumers/consumerupdates/ucm269384.htm.
† Information available at http://www.fda.gov/downloads/forconsumers/consumerupdates/ucm050819.pdf.
remedies, or other health products have been documented (2–5). In one study, 20% of South Asian herbal medications purchased in Boston-area stores contained heavy metals (6). Heavy metals might not be listed as ingredients and might only be identified by testing. Some heavy metal inclusion might result from incidental contamination during production (e.g., the use of contaminated raw ingredients or poor manufacturing equipment), whereas other inclusion might be intentional for perceived therapeutic benefits.
The cases of lead poisoning described in this report were associated with the use of Ayurvedic medications. Ayurveda is a millennia-old medical system closely connected to traditional culture and religion in India (7,8). According to a national survey, an estimated 214,000 adults in the United States visited an Ayurvedic practitioner in 2007, an increase of 39% since 2002 (8). Most Ayurvedic medications are marketed either as dietary supplements or for drug uses not approved by the Food and Drug Administration (FDA). None of the nine medications with labeling information that were used by the patients in this report has been the subject of an FDA import alert.* However, in a 2008 update, FDA urged consumers to use caution with Ayurvedic products.† Although not all Ayurvedic medications include heavy metals intentionally, all six patients in this report used “rasa shastra” medications. Rasa shastra is a type of Ayurvedic medication that is intentionally prepared with metal, mineral, or gem compounds (9). These compounds, called “bhasmas,” sometimes are indicated on product labels.
What is already known on this topic?
Foreign-born populations, including pregnant women, might have increased risk for lead poisoning because of their use of foreign medications or dietary supplements containing high levels of lead. Numerous cases of heavy metal poisonings associated with the use of health products made or brought from abroad have been documented.
What is added by this report?
During 2011–2012, six pregnant women with elevated blood lead levels were identified in New York City as a result of required prenatal screening. All six were foreign-born users of oral Ayurvedic medications made in India. The products used contained up to 2.4% lead, and several contained mercury and arsenic, which also can have adverse health effects.
What are the implications for public health practice?
Products containing lead and other heavy metals are available to consumers through travel abroad or other channels in which regulation is limited or unenforceable. When lead poisoning is suspected, public health workers and health-care providers should consider as potential risk factors the use of foreign medications, dietary supplements, or traditional remedies, especially among foreign-born persons and, importantly, among pregnant women. Health-care providers should advise patients to stop using foreign products that might contain heavy metals and consider testing patients for exposure to lead or other heavy metals if use is reported.
FIGURE. Two of 10 Ayurvedic medications associated with lead poisoning in six pregnant women — New York City Department of Health and Mental Hygiene, 2011–2012
Photos / New York City Department of Health and Mental Hygiene

Morbidity and Mortality Weekly Report
646 MMWR / August 24, 2012 / Vol. 61 / No. 33
DOHMH visits local stores to assess availability of products identified through case investigations and published reports or to collect and test products that are suspect. Stores selling con-taminated products, such as the local business that sold medi-cations to patient 2, are prohibited from any further sales of identified products and are ordered to return remaining stock to distributors. DOHMH also alerts local health-care providers through its Health Alert Network and notifies manufacturers. DOHMH reports contaminated products to the FDA dietary supplements adverse event reporting website§ and appropriate foreign authorities. Reporting to FDA is important to system-atically gather data and understand the scope of the problem. Information regarding these products is forwarded to FDA global offices to encourage collaborative efforts to improve product safety in the United States and abroad.
The cases of lead poisoning among the six pregnant women underscore the importance of risk assessment for lead exposure and blood lead testing in at-risk populations. Health-care providers should 1) be aware that users might not readily disclose use of health products; 2) ask patients about their use of prescription and nonprescription medications and supple-ments, including Ayurvedic medications and other traditional remedies; 3) advise patients to stop using suspect products; and 4) consider testing patients for exposure to lead or other heavy metals if use is reported. Public health workers and health-care providers should consider the use of foreign supplements, medications, traditional remedies, or other health products as potential risk factors when investigating lead and other heavy
metal poisonings, especially in foreign-born populations, and particularly among pregnant women. Risk assessments and testing conducted during prenatal visits are critical to identi-fying and intervening in heavy metal poisoning cases. Public health measures, such as blood lead testing and surveillance in the United States and elsewhere, are necessary to assess the extent of lead exposure and develop appropriate interventions.
References 1. CDC. Guidelines for the identification and management of lead exposure
in pregnant and lactating women. Atlanta, GA: US Department of Health and Human Services, CDC; 2010. Available at http://www.cdc.gov/nceh/lead/publications/leadandpregnancy2010.pdf. Accessed August 20, 2012.
2. CDC. Lead poisoning associated with Ayurvedic medications—five states, 2000–2003. MMWR 2004;53:582–4.
3. Ernst E. Toxic heavy metals and undeclared drugs in Asian herbal medicines. Trends Pharmacol Sci 2002;23:136–9.
4. Baer RD, Ackerman A. Toxic Mexican folk remedies for the treatment of empacho: the case of azarcon, greta, and albayalde. J Ethnopharmacol 1988;24:31–9.
5. Al Khayat A, Menon NS, Alidini MR. Acute lead encephalopathy in early infancy—clinical presentation and outcome. Ann Trop Paediatr 1997;17:39–44.
6. Saper RB, Kales SN, Paquin J, et al. Heavy metal content of Ayurvedic herbal medicine products. JAMA 2004;292:2868–73.
7. World Health Organization. WHO traditional medicine strategy 2002–2005. Geneva, Switzerland: World Health Organization; 2002. Available at http://apps.who.int/medicinedocs/pdf/s2297e/s2297e.pdf. Accessed August 20, 2012.
8. Barnes PM, Bloom B, Nahin RL. Complementary and alternative medicine use among adults and children: United States 2007. Natl Health Stat Report 2008(12)
9. Saper RB, Phillips RS, Sehgal A, et al. Lead, mercury, and arsenic in US- and Indian-manufactured Ayurvedic medicines sold via the Internet. JAMA 2008;300:915–23.
§ Available at http://www.fda.gov/safety/medwatch/howtoreport/default.htm.

Morbidity and Mortality Weekly Report
MMWR / August 24, 2012 / Vol. 61 / No. 33 647
In 2011, CDC reported 17 outbreaks of measles and 222 measles cases, most of which were imported cases in unvac-cinated persons. This was the highest number of measles cases in any year in the United States since 1996 and highlights the importance of monitoring measles vaccination coverage at the local level (1). To identify areas of undervaccination for measles and other vaccine-preventable diseases, state and local health departments monitor compliance with school immunization requirements using annual school vaccination assessment reports, supported as a CDC immunization funding objec-tive for the 64 grantees, including the 50 states, the District of Columbia (DC), five cities, and eight other reporting areas. CDC also monitors progress toward meeting Healthy People 2020 objectives (2) for the vaccination of children entering kindergarten. This report summarizes vaccination coverage, exemption rates, and reporting methods from the 2011–12 school year kindergarten vaccination assessments submitted by 56 grantees, including 49 states, DC, one city, and five other reporting areas. Median coverage with 2 doses of measles, mumps, and rubella (MMR) vaccine was 94.8% among 47 reporting states and DC. Total exemption rates, including medical, religious, and philosophic exemptions, among 49 reporting states and DC, ranged from <0.1% to 7.0% (median: 1.5%). Although statewide levels of vaccination coverage are at or very near target levels, locally low vaccination coverage for extremely transmissible diseases such as measles remains a threat to health. Monitoring MMR vaccination coverage at the local and state level will continue to be critical as long as the risk for measles importation and outbreaks exist.
Healthy People 2020 objectives include maintaining vac-cination coverage among children in kindergarten (objective IID-10) and increasing the number of states (including DC) collecting kindergarten vaccination coverage data in accordance with CDC minimum standards (objective IID-19) (2).* The coverage target is ≥95% vaccination coverage for the follow-ing vaccines: MMR; diphtheria, tetanus toxoid, and acellular
Vaccination Coverage Among Children in Kindergarten — United States, 2011–12 School Year
pertussis (DTaP)†; poliovirus; hepatitis B (HepB); and varicella. The reporting target is 50 states and DC collecting kinder-garten vaccination coverage data in accordance with CDC minimum standards.
Vaccination coverage among children entering school is assessed annually by federal immunization grantees. Generally, at the start of the school year, health department or school personnel conduct a vaccination coverage survey or census of enrolled students to determine compliance with school requirements established to protect children from vaccine-preventable diseases. Children receiving an exemption to school requirements are included as enrolled students. Results of the school-level reviews are reported to the grantee health department, which then reports aggregated totals to CDC; not all states reported both vaccination coverage levels and exemption rates. All 54 grantees reporting vaccination coverage by vaccine assessed public schools, and all but North Dakota, Oklahoma, and Palau included private schools in their assess-ments (Table 1). Surveys were completed by census (36 grantees) or a sample (20 grantees). For grantees surveying <95% of the population of enrolled kindergarten students, data were weighted based on the estimated size of the popula-tion of children in kindergarten. Survey methods varied across grantees; however, 20 of the grantees targeted by the Healthy People 2020 objective collected data in accordance with CDC minimum standards.
Vaccination status of kindergarteners was considered up-to-date if they had received all of the vaccine doses required for school entry in their state or area. All reporting grantees required 2 doses of MMR vaccine and 3 or 4 doses of poliovi-rus vaccine. School entry requirements for other vaccinations varied by grantee: 52 grantees required 4 or 5 doses of DTaP vaccine, 50 grantees required 3 doses of HepB vaccine, and 13 grantees required 1 dose and 37 grantees required 2 doses of varicella vaccine.§ The types of exemptions and the process for obtaining exemptions varied by grantee (3). All reporting
* States are asked to use comparable methods to allow comparison and to ensure that the information collected is accurate. The methodology must include these standards: meeting all age-appropriate recommendations of the Advisory Committee on Immunization Practices, including 2 doses of varicella; census or CDC-recommended sampling methodology; validation of data collected by school administrators through subsampling a percentage of schools; data collection by trained personnel; data on vaccination history from a health-care provider; and data collected by December 31 of each year.
† DTaP vaccination coverage might include some diphtheria and tetanus toxoids and pertussis vaccine (DTP) or diphtheria and tetanus toxoids (DT) vaccinations if administered in another country or if the vaccination provider continued to use these vaccines after 2000.
§ One state (South Dakota) assessed vaccination coverage for 3 doses of HepB vaccine, but HepB vaccination is not a requirement for school entry. One state (Nevada) assessed vaccination coverage for 2 doses of varicella vaccine, but the number of doses required varied by school district.

Morbidity and Mortality Weekly Report
648 MMWR / August 24, 2012 / Vol. 61 / No. 33
TABLE 1. Estimated vaccination coverage among children enrolled in kindergarten, by state/area, type of survey conducted, and vaccine — United States, 2011–12 school year
State/AreaTotal kindergarten
population*Total
surveyed%
surveyed†
Type of survey
conducted§MMR¶
(%)DTaP/DT**
(%)Polio(%)
Hepatitis B(%)
Varicella
1 dose(%)
2 doses(%)
Alabama 73,190 73,190 100.0 Census 93.6 93.6 93.6 —†† 93.2 —††
Alaska 10,286 750 7.3 Nonrandom cluster 95.5 96.0 97.4 97.1 —§§ 93.6Arizona 88,293 85,514 96.9 Census 94.7 94.9 94.9 96.3 96.9 —††
Arkansas 38,754 35,720 92.2 Census 94.9 84.1 84.3 98.1 —§§ 95.4California 542,544 529,400 97.6 Census 93.2 93.0 93.2 95.7 96.1 —††
Colorado 70,142 318 0.5 SRS 86.8 85.5 87.4 93.1 —§§ 84.0Connecticut 45,695 45,695 100.0 Census 97.4 97.8 97.7 98.0 —§§ 97.1Delaware 11,327 833 7.4 2-stage cluster 96.9 96.9 96.9 96.9 —§§ 96.9District of Columbia 6,854 6,854 100.0 Census 94.0 91.1¶¶ 93.0 96.6 —§§ 93.5Florida 225,532 225,532 100.0 Census 92.6 92.6 92.6 92.6 —§§ 92.6Georgia 143,065 2,685 1.9 2-stage cluster 96.6 96.7 96.7 96.7 —§§ 96.6Hawaii 19,443 1,506 7.7 2-stage cluster 94.4 93.3¶¶ 93.7 94.9 95.7 —††
Idaho 22,762 22,762 100.0 Census 89.2 89.0¶¶ 89.6 92.3 —§§ 85.8Illinois 163,311 163,311 100.0 Census 97.3 96.4 96.2 —†† 98.0 —††
Indiana 83,416 56,342 67.5 Census 93.3 90.2¶¶ 90.4 93.2 —§§ 91.9Iowa 40,978 40,978 100.0 Census 91.1 91.1 91.1 91.1 —§§ 91.1Kansas 38,402 20,255 52.7 Mixed design 88.2 88.0¶¶ 96.9 95.8 —§§ 85.9Kentucky 58,185 53,441 91.8 Census 92.0 93.7 95.0 93.3 75.7 —††
Louisiana 69,013 69,013 100.0 Census 98.1 98.9 99.6 99.3 —§§ 97.2Maine 13,829 13,415 97.0 Census 93.0 96.6 96.1 —†† 94.9 —††
Maryland 72,957 49,024 67.2 Census 98.7 99.6 99.7 99.6 99.7 —††
Massachusetts 79,551 77,535 97.5 Census 94.2 92.5¶¶ 93.3 97.8 —§§ 92.7Michigan 124,962 124,962 100.0 Census 95.0 95.6 95.9 96.8 —§§ 93.2Minnesota 71,213 70,649 99.2 Census 95.7 95.5¶¶ 95.8 97.5 —§§ 94.9Mississippi 44,912 44,912 100.0 Census 99.2 99.2¶¶ 99.2 99.2 —§§ 99.2Missouri 75,240 3,523 4.7 2-stage cluster 96.8 97.1 97.2 96.0 —§§ 95.1Montana 12,128 12,128 100.0 Census 95.0 94.8 95.7 —†† —§§ —††
Nebraska 26,715 25,794 96.6 Census 99.0 99.7*** 99.5 99.3 —§§ 96.8Nevada 36,557 1,915 5.2 2-stage cluster 95.3 97.2 98.3 97.8 —§§ 90.3New Hampshire 13,022 13,022 100.0 Census —††† —††† —††† —††† —††† —†††
New Jersey 118,669 114,666 96.6 Census —††† —††† —††† —††† —††† —†††
New Mexico 29,159 587 2.0 2-stage cluster 95.7 96.9 97.6 97.3 —§§ 94.2New York State 236,016 236,016 100.0 Census 96.9 97.9*** 98.4 98.2 98.4 —††
North Carolina 128,854 122,892 95.4 Census 97.2 97.0 97.3 98.0 98.1 —††
North Dakota 8,412 487 5.8 Convenience§§§ 90.6 91.2 90.6 91.4 —§§ 88.9Ohio Unknown¶¶¶ 138,075 NA Convenience 96.1 95.9**** 96.2**** 99.0**** —§§ 95.4****Oklahoma 52,987 48,191 90.9 Census§§§ 95.0 94.6¶¶ 94.6 97.7 97.8 —††
Oregon 45,855 45,855 100.0 Census 94.0 93.7¶¶ 94.0 94.6 95.0 —††
Pennsylvania 148,042 146,502 99.0 Census 86.9 91.1** 95.5 94.4 —§§ 85.1Rhode Island 12,552 1,745 13.9 2-stage cluster 91.7 93.4¶¶ 92.6 93.1 —§§ 91.3South Carolina 59,307 6,340 10.7 1-stage cluster 94.5 96.5 96.7 96.6 97.1 —††
South Dakota 12,127 12,127 100.0 Census 97.4 97.5 97.2 95.4 —§§ 95.5Tennessee 83,950 83,878 99.9 Census 97.3 97.3 97.3 97.3 —§§ 97.3Texas 388,178 388,178 100.0 Census 99.3 99.3¶¶ 99.3 99.7 —§§ 99.2
Houston, TX Unknown 3,100 NA 2-stage cluster 99.5 97.7¶¶**** 99.5**** 99.9**** —§§ —††
Utah 53,800 53,800 100.0 Census 98.0 97.7 98.1 99.1 99.5 —††
Vermont 6,548 6,548 100.0 Census 92.9 92.7 92.7 95.6 —§§ 90.3Virginia 101,121 4,394 4.3 2-stage cluster 93.0 98.6 93.0 92.7 —§§ 90.6Washington 85,134 75,870 89.1 Census 91.8 90.9¶¶ 91.0 93.0 —§§ 90.4West Virginia 22,449 21,299 94.9 Convenience 92.0 92.6 92.6 93.3 —§§ 88.9Wisconsin 70,672 1,630 2.3 2-stage cluster 93.1 87.7 96.9 96.2 —§§ 91.0Wyoming NA NA NA Not conducted —§§ —§§ —§§ —§§ —§§ —§§
Median†††† 94.8 95.2 95.9 96.6 97.0 93.2
American Samoa NA NA NA Not conducted —§§ —§§ —§§ —§§ —§§ —§§
Guam 2,702 1,243 46.0 2-stage cluster 83.6 94.3 89.3 83.1 —†† —††
Marshall Islands NA NA NA Not conducted —§§ —§§ —§§ —§§ —§§ —§§
Micronesia NA NA NA Not conducted —§§ —§§ —§§ —§§ —§§ —§§
N. Mariana Islands 962 962 100.0 Census 84.0§§§§ 90.0§§§§ 84.0§§§§ 94.9§§§§ —§§ 73.5Palau 234 230 98.3 Census§§§ 96.5 98.7 98.7 99.6 —†† —††
Puerto Rico 41,379 1,062 2.6 2-stage cluster 96.6 94.2¶¶ 96.3 99.2 —§§ 87.8U.S. Virgin Islands 1,604 402 25.1 2-stage cluster 81.7 78.1 62.5 84.0 —§§ 78.2
See table footnotes on page 649.

Morbidity and Mortality Weekly Report
MMWR / August 24, 2012 / Vol. 61 / No. 33 649
grantees allowed medical exemptions, 47 allowed religious exemptions, and 20 allowed philosophic exemptions; two grantees (Mississippi and West Virginia) did not allow exemp-tions for religious or philosophic reasons. Exemption data reported to CDC were nonspecific; exemptions for one vac-cine, a required vaccine dose, or for all required vaccines were not differentiated by type of exemption. Vaccination and/or exemption status might not have been reported as final for each surveyed child because some children might have been in the process of obtaining required vaccines and final vaccination and/or exemption status might have been updated after the survey was completed.
Overall, among grantees in the 47 states and DC that reported 2011–12 school vaccination coverage, median MMR vaccination coverage was 94.8%, with a range of 86.8% in Colorado to 99.3% in Texas; four jurisdictions of these grantees reported <90% MMR coverage (Table 1). Median coverage with 2 doses of varicella vaccine among 33 grantees reporting was 93.2%, with a range of 84.0% in Colorado to 99.2% in Mississippi and Texas. The median coverage levels for DTaP, poliovirus, and HepB vaccines all were at or above the Healthy People 2020 target of 95%.
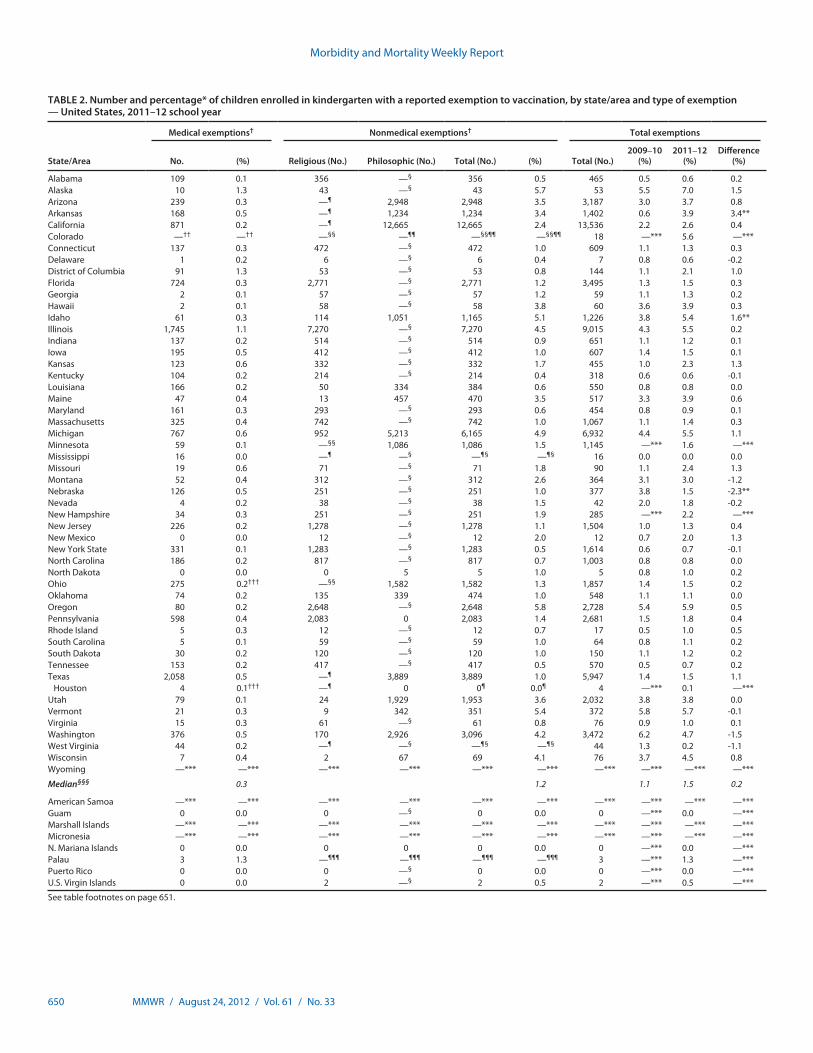
Overall, among the grantees in the 49 states and DC that reported exemptions for the 2011–12 school year, 10 reported <1%, and nine reported >4% total exemption rates (Figure), with a range of <0.1% in Mississippi to 7.0% in Alaska (Table 2). An estimated 89,133 exemptions were reported, for a total estimated population of 4,124,185 kindergarten children. The median total exemption level was 1.5%, a median increase of 0.2 percentage points compared with the 2009–10 school year. The largest increase in exemption levels was reported by Arkansas, with an increase of 3.4 percentage points; the largest decrease was reported by Nebraska, with a
decrease of 2.3 percentage points. Where reported separately, the median medical exemption level was 0.3 %, with a range of 0.0% in New Mexico and North Dakota to 1.3% in DC. Where allowed and reported separately, the median nonmedical exemption level was 1.2 %, with a range of 0.04% in Delaware and Kentucky to 5.8% in Oregon.
Reported by
Stacie M. Greby, DVM, Karen G. Wooten, MA, Cynthia L. Knighton, Bob Avey, Shannon Stokley, MPH, Immunization Services Div, National Center for Immunization and Respiratory Diseases, CDC. Corresponding contributor: Stacie M. Greby, [email protected], 404-639-6069.
TABLE 1. (Continued) Estimated vaccination coverage among children enrolled in kindergarten, by state/area, type of survey conducted, and vaccine — United States, 2011–12 school year
Abbreviation: NA = not available. * The reported number of enrolled children is an estimate. † The proportion of eligible children for whom vaccination data were collected. § Sample designs varied by state/area. Census means that all schools and all children within schools were included in the assessment. SRS means a simple random sample design was
used. Mixed design means a census was conducted among public schools, and a 2-stage cluster sample was conducted among private schools. 1-stage or 2-stage cluster sample means that schools were randomly selected, and all children in the selected schools were assessed (1-stage) or a random sample of children within the schools were selected (2-stage). Convenient sample means that the selection process is unspecified.
¶ Measles, mumps, and rubella. ** Diphtheria and tetanus toxoids and acellular pertussis vaccine. DTaP vaccination coverage might include some DTP (diphtheria and tetanus toxoids and pertussis vaccine) or DT (diphtheria
and tetanus toxoids) vaccinations if administered in another country or vaccination provider continued to use after 2000. Pertussis vaccine is not required in Pennsylvania; the estimate for Pennsylvania represents DT only.
†† Vaccine not required for school entry. §§ Coverage levels for 1 dose of varicella are not presented when coverage for 2 doses of varicella were reported. ¶¶ Reported estimate is for 5 doses of DTaP. *** Reported estimate is for 3 doses of DTaP. ††† Did not report antigen-specific information. §§§ Represents public school children only. ¶¶¶ Number of children enrolled in private school is unknown. **** Estimates are based on total children surveyed because total children enrolled is unknown. †††† The center of the estimates in the distribution. The median is based on estimates for 49 states and the District of Columbia. §§§§ Estimates are based on Advisory Committee on Immunization Practices requirements rather than state/jurisdiction requirements; otherwise, 100% of children met state estimates.
FIGURE. Estimated percentage of children enrolled in kindergarten who have been exempted from receiving one or more vaccines* — United States, 2011–12 school year
>4% 2%–4% 1%–2% <1% Data not available
* Exemptions might not reflect a child’s vaccination status. Children with an exemption who did not receive any vaccines are indistinguishable from those who have an exemption but are up-to-date for one or more vaccines.
Morbidity and Mortality Weekly Report
650 MMWR / August 24, 2012 / Vol. 61 / No. 33
TABLE 2. Number and percentage* of children enrolled in kindergarten with a reported exemption to vaccination, by state/area and type of exemption — United States, 2011–12 school year
State/Area
Medical exemptions† Nonmedical exemptions† Total exemptions
No. (%) Religious (No.) Philosophic (No.) Total (No.) (%) Total (No.)2009–10
(%)2011–12
(%)Difference
(%)
Alabama 109 0.1 356 —§ 356 0.5 465 0.5 0.6 0.2Alaska 10 1.3 43 —§ 43 5.7 53 5.5 7.0 1.5Arizona 239 0.3 —¶ 2,948 2,948 3.5 3,187 3.0 3.7 0.8Arkansas 168 0.5 —¶ 1,234 1,234 3.4 1,402 0.6 3.9 3.4**California 871 0.2 —¶ 12,665 12,665 2.4 13,536 2.2 2.6 0.4Colorado —†† —†† —§§ —¶¶ —§§¶¶ —§§¶¶ 18 —*** 5.6 —***Connecticut 137 0.3 472 —§ 472 1.0 609 1.1 1.3 0.3Delaware 1 0.2 6 —§ 6 0.4 7 0.8 0.6 -0.2District of Columbia 91 1.3 53 —§ 53 0.8 144 1.1 2.1 1.0Florida 724 0.3 2,771 —§ 2,771 1.2 3,495 1.3 1.5 0.3Georgia 2 0.1 57 —§ 57 1.2 59 1.1 1.3 0.2Hawaii 2 0.1 58 —§ 58 3.8 60 3.6 3.9 0.3Idaho 61 0.3 114 1,051 1,165 5.1 1,226 3.8 5.4 1.6**Illinois 1,745 1.1 7,270 —§ 7,270 4.5 9,015 4.3 5.5 0.2Indiana 137 0.2 514 —§ 514 0.9 651 1.1 1.2 0.1Iowa 195 0.5 412 —§ 412 1.0 607 1.4 1.5 0.1Kansas 123 0.6 332 —§ 332 1.7 455 1.0 2.3 1.3Kentucky 104 0.2 214 —§ 214 0.4 318 0.6 0.6 -0.1Louisiana 166 0.2 50 334 384 0.6 550 0.8 0.8 0.0Maine 47 0.4 13 457 470 3.5 517 3.3 3.9 0.6Maryland 161 0.3 293 —§ 293 0.6 454 0.8 0.9 0.1Massachusetts 325 0.4 742 —§ 742 1.0 1,067 1.1 1.4 0.3Michigan 767 0.6 952 5,213 6,165 4.9 6,932 4.4 5.5 1.1Minnesota 59 0.1 —§§ 1,086 1,086 1.5 1,145 —*** 1.6 —***Mississippi 16 0.0 —¶ —§ —¶§ —¶§ 16 0.0 0.0 0.0Missouri 19 0.6 71 —§ 71 1.8 90 1.1 2.4 1.3Montana 52 0.4 312 —§ 312 2.6 364 3.1 3.0 -1.2Nebraska 126 0.5 251 —§ 251 1.0 377 3.8 1.5 -2.3**Nevada 4 0.2 38 —§ 38 1.5 42 2.0 1.8 -0.2New Hampshire 34 0.3 251 —§ 251 1.9 285 —*** 2.2 —***New Jersey 226 0.2 1,278 —§ 1,278 1.1 1,504 1.0 1.3 0.4New Mexico 0 0.0 12 —§ 12 2.0 12 0.7 2.0 1.3New York State 331 0.1 1,283 —§ 1,283 0.5 1,614 0.6 0.7 -0.1North Carolina 186 0.2 817 —§ 817 0.7 1,003 0.8 0.8 0.0North Dakota 0 0.0 0 5 5 1.0 5 0.8 1.0 0.2Ohio 275 0.2††† —§§ 1,582 1,582 1.3 1,857 1.4 1.5 0.2Oklahoma 74 0.2 135 339 474 1.0 548 1.1 1.1 0.0Oregon 80 0.2 2,648 —§ 2,648 5.8 2,728 5.4 5.9 0.5Pennsylvania 598 0.4 2,083 0 2,083 1.4 2,681 1.5 1.8 0.4Rhode Island 5 0.3 12 —§ 12 0.7 17 0.5 1.0 0.5South Carolina 5 0.1 59 —§ 59 1.0 64 0.8 1.1 0.2South Dakota 30 0.2 120 —§ 120 1.0 150 1.1 1.2 0.2Tennessee 153 0.2 417 —§ 417 0.5 570 0.5 0.7 0.2Texas 2,058 0.5 —¶ 3,889 3,889 1.0 5,947 1.4 1.5 1.1
Houston 4 0.1††† —¶ 0 0¶ 0.0¶ 4 —*** 0.1 —***Utah 79 0.1 24 1,929 1,953 3.6 2,032 3.8 3.8 0.0Vermont 21 0.3 9 342 351 5.4 372 5.8 5.7 -0.1Virginia 15 0.3 61 —§ 61 0.8 76 0.9 1.0 0.1Washington 376 0.5 170 2,926 3,096 4.2 3,472 6.2 4.7 -1.5West Virginia 44 0.2 —¶ —§ —¶§ —¶§ 44 1.3 0.2 -1.1Wisconsin 7 0.4 2 67 69 4.1 76 3.7 4.5 0.8Wyoming —*** —*** —*** —*** —*** —*** —*** —*** —*** —***
Median§§§ 0.3 1.2 1.1 1.5 0.2
American Samoa —*** —*** —*** —*** —*** —*** —*** —*** —*** —***Guam 0 0.0 0 —§ 0 0.0 0 —*** 0.0 —***Marshall Islands —*** —*** —*** —*** —*** —*** —*** —*** —*** —***Micronesia —*** —*** —*** —*** —*** —*** —*** —*** —*** —***N. Mariana Islands 0 0.0 0 0 0 0.0 0 —*** 0.0 —***Palau 3 1.3 —¶¶¶ —¶¶¶ —¶¶¶ —¶¶¶ 3 —*** 1.3 —***Puerto Rico 0 0.0 0 —§ 0 0.0 0 —*** 0.0 —***U.S. Virgin Islands 0 0.0 2 —§ 2 0.5 2 —*** 0.5 —***
See table footnotes on page 651.

Morbidity and Mortality Weekly Report
MMWR / August 24, 2012 / Vol. 61 / No. 33 651
Editorial Note
Sustaining high vaccination coverage among school children is vital to prevent outbreaks and avoid reestablishment of diseases that have been eliminated in the United States. The median MMR and 2-dose varicella vaccination coverage levels for children entering kindergarten for the 2011–12 school year were below the Healthy People 2020 target of ≥95%. The high number of measles cases reported in Europe in 2011 contrib-uted to record numbers of imported cases in the United States (1). Among the U.S. measles cases in persons aged 16 months through 19 years reported in 2011, 76% were in persons not vaccinated for a nonmedical reason (1). Achieving high MMR vaccination coverage rates early in life, including >90% 1-dose coverage at age 12–15 months and >95% 2-dose coverage among school-aged children, is essential to maintain measles elimination in the United States (4). Although median MMR vaccination coverage among children entering kindergarten was close to the ≥95% target, MMR vaccination coverage and exemptions aggregated at national or state levels can mask sub-stantial vulnerability at the local level. Since exemptions cluster geographically (5,6), there might be smaller areas and schools where low levels of immunization could sustain ongoing measles transmission after importation from other countries.
Exemption levels continue to be low overall; however, these low levels are aggregated at the state level before they are reported to CDC. The reported exemptions could be for one or more required vaccines. It is unlikely that children with an exemption were completely unvaccinated. The 2005–2006 birth cohort matriculated into the school system during the 2011–12 school year, and their vaccination coverage was mea-sured using data from the 2006–2009 National Immunization Surveys, which indicate that <1% of children had not received any vaccines (7). A study of school children with nonmedical exemptions found that 75% of these children had received at least one vaccine previously (8). The process of requesting an exemption might be related to exemption levels, with easier
What is already known on this topic?
Outbreaks of some vaccine-preventable diseases can occur despite generally high levels of vaccination coverage. To ensure that children entering school are protected from vaccine-preventable disease, kindergarten vaccination assessments are performed annually. These assessments monitor state and local levels of vaccination coverage and compliance with state vaccination requirements.
What is added by this report?
In 47 states and the District of Columbia, median vaccination coverage for three vaccines (diphtheria and tetanus toxoids and acellular pertussis; poliovirus; and hepatitis B) met the Healthy People 2020 target of ≥95%. However, median coverage for measles, mumps, and rubella vaccine and varicella vaccine were <95%. Exemption levels were low overall, but clusters of unvacci-nated children might exist at the school or community level.
What are the implications for public health practice?
Although statewide levels of vaccination coverage are at or very near target levels, locally low vaccination coverage for extremely transmissible diseases such as measles remains a threat to public health. CDC will continue to support and build capacity to assist grantees in identification of local areas with low vaccination coverage or high exemption rates for further intervention.
standards for exemption being associated with higher levels of exemption (3).
Immunization Information Systems (IISs) used by 55 of the 64 grantees might be able to assist with tracking vaccina-tions, which can improve vaccination coverage (9), and might reduce the reporting burden on parents at school enrollment. Building links between education and public health depart-ments through the use of the local IIS, where acceptable, can ease reporting burdens at the school level and provide state and local public health departments with an accessible tool to monitor vaccination coverage at the school level. In 2010, 52 grantees allowed schools to view records in their IIS, and 18 grantees allowed schools to update information in their IIS (CDC, unpublished data, 2012).
TABLE 2. (Continued) Number and percentage* of children enrolled in kindergarten with a reported exemption to vaccination, by state/area and type of exemption — United States, 2011–12 school year
* All estimates of percentages of children with exemptions are weighted to the number of enrolled children unless otherwise noted. Number of exemptions are unweighted counts. † Medical and nonmedical exemptions might not be mutually exclusive. Some children might have both medical and nonmedical exemptions. § Exemptions because of philosophic reasons are not allowed. ¶ Exemptions because of religious reasons are not allowed. ** Rate differences between 2009–10 school year and 2010–11 school year are greater than 1.5 percentage points. †† Exemptions because of medical reasons are allowed but are not reported separately from other exemptions. §§ Exemptions because of religious reasons are allowed but are not reported separately from other exemptions. ¶¶ Exemption because of philosophic reasons are allowed but are not reported separately from other exemptions. *** Did not report exemptions to CDC. ††† Estimates are based on total children surveyed because total children enrolled is unknown. §§§ The median is based on estimates for 49 states and District of Columbia. ¶¶¶ Exemptions are allowed but not tracked.

Morbidity and Mortality Weekly Report
652 MMWR / August 24, 2012 / Vol. 61 / No. 33
The findings in this report are subject to at least three limita-tions. First, these data are cross-sectional and generally collected at the start of the school year, although some states might collect later in the school year. Reports might not be updated as a child obtains the required vaccines or exemptions later in the school year. Vaccination and exemption status might not have been reported for every child. By grantee, the propor-tion of children not classified as either vaccinated or exempt for each individual vaccine was estimated to range from 0% to 29.1%. Second, the vaccines required and survey methods varied by state, although efforts to improve standardization are in progress. Finally, changes in school vaccination assess-ment reporting over time limit the ability to compare national trends over time.
In 2011, CDC conducted a study to determine best practices in monitoring school vaccination coverage and exemptions among kindergarteners to help meet the Healthy People 2020 target of 51 grantees collecting kindergarten vaccination cover-age in accordance with CDC minimum standards. Best prac-tices included using systematic and standardized approaches to data collection and ensuring communication and partnership between schools and public health systems (CDC, unpublished data, 2012). The annual school vaccination assessment takes place at the local level and might involve school personnel at the time when they are busiest, at the start of a school year. Minimizing the burden on school staff, improving the ease of reporting vaccination coverage and exemption levels, and providing feedback to schools on their vaccination coverage and exemptions levels might help improve school vaccination coverage. Additionally, capturing school vaccination cover-age in the local IIS can help ensure a timely response after an imported case of measles, allowing quick identification of those who are not fully vaccinated and need protection. Continued evaluation and understanding of the limitations of the school vaccination assessment reporting system will help identify and address existing limitations and improve the usefulness of the
system. Moreover, the ability to compare school vaccination rates across jurisdictions and over time will permit more effec-tive program improvement efforts.
Assessing vaccination coverage compliance with local requirements and exemption levels as children enter kindergar-ten is essential for identifying and addressing areas of under-vaccination and reducing outbreaks of vaccine-preventable disease and accompanying morbidity and mortality (9). This report identifies some concerns at the state and national levels that should be investigated at the local level to ensure that the appropriate population protection for measles is maintained at each school to protect school children, their families, and the community.
References 1. CDC. Measles—United States, 2011. MMWR 2012;61:253–7. 2. US Department of Health and Human Services. Healthy people 2020:
immunization and infectious diseases. Washington, DC: US Department of Health and Human Services; 2010. Available at http://www.healthypeople.gov/2020/topicsobjectives2020/overview.aspx?topicId=23. Accessed August 14, 2012.
3. Rota JS, Salmon DA, Rodewald LE, Chen RT, Hibbs BF, Gangarosa EJ. Processes for obtaining nonmedical exemptions to state immunization laws. Am J Public Health 2001;91:645–8.
4. Gay N. The theory of measles elimination: implications for the design of elimination strategies. J Infect Dis 2004;189(Suppl 1):S27–35.
5. Sugerman D, Barskey AE, Delea MG, et al. Measles outbreak in a highly vaccinated population, San Diego, 2008: role of the intentionally undervaccinated. Pediatrics 2010;125:747–55.
6. Omer SB, Enger KS, Moulton LH, Halsey NA, Stokley S, Salmon DA. Geographic clustering of nonmedical exemptions to school immunization requirements and associations with geographic clustering of pertussis. Am J Epidemiol 2008;168:1389–96.
7. CDC. National, state, and local area vaccination coverage among children aged 19–35 months—United States, 2009. MMWR 2010;59:1171–7.
8. Salmon DA, Moulton LH, Omer SB, DeHart MP, Stokley S, Halsey NA. Factors associated with refusal of childhood vaccines among parents of school-aged children. Arch Pediatr Adolesc Med 2005;159:470–6.
9. CDC. Guide to community preventive services: vaccinations to prevent diseases—universally recommended vaccinations. Atlanta, GA: US Department of Health and Human Services, CDC; 2011. Available at http://www.thecommunityguide.org/vaccines/universally/index.html. Accessed August 14, 2012.

Morbidity and Mortality Weekly Report
MMWR / August 24, 2012 / Vol. 61 / No. 33 653
Permanent tattoos have become increasingly common, with 21% of adults in the United States reporting having at least one tattoo (1). On rare occasions, outbreaks of nontubercu-lous mycobacterial (NTM) skin infections have been reported after tattooing (2,3). In January 2012, public health officials in New York received reports of Mycobacterium chelonae skin infections in 14 New York residents who received tattoos dur-ing September–December 2011. All infections were associated with use of the same nationally distributed, prediluted gray ink manufactured by company A. CDC disseminated an Epi-X public health alert to identify additional tattoo-associated NTM skin infections; previously identified cases were reported from three states (Washington, Iowa, and Colorado). Public health investigations by CDC, state and local health depart-ments, and the Food and Drug Administration (FDA) found NTM contamination in tattoo inks used in two of five identi-fied clusters. All infected persons were exposed to one of four different brands of ink. NTM contamination of inks can occur during the manufacturing process as a result of using contaminated ingredients or poor manufacturing practices, or when inks are diluted with nonsterile water by tattoo artists. No specific FDA regulatory requirement explicitly provides that tattoo inks must be sterile. However, CDC recommends that ink manufacturers ensure ink is sterile and that tattoo artists avoid contamination of ink through dilution with nonsterile water. Consumers also should be aware of the health risks associated with getting an intradermal tattoo.
On January 4, 2012, the Monroe County (New York) Department of Public Health began an outbreak investigation after receiving a report of a person with a persistent papular rash beginning 1 week after being tattooed by an artist in October 2011; M. chelonae was isolated from a skin biopsy. Since May 2011, the artist had been using company A predi-luted gray ink. Using a list of customers provided by the artist, a total of 19 infections were identified, including 14 confirmed with M. chelonae.
All infected persons had been tattooed with company A prediluted gray ink. The tattoo artist said he had not diluted the ink before use, and a review of his practices did not reveal other potential sources of contamination. M. chelonae was isolated from tissue specimens, and from one opened and one
unopened bottle of company A prediluted gray ink. Pulsed-field gel electrophoresis (PFGE) patterns of 11 available patient isolates and an unopened bottle of company A prediluted gray ink were indistinguishable; the M. chelonae isolate from the opened ink bottle showed ≥95% genetic relatedness to the other isolates. Water and environmental samples collected at the manufacturing company and tattoo parlor were negative for M. chelonae.
Company A prediluted gray ink was a nationally distributed product. To identify additional tattoo-related NTM infections not limited to exposure to any particular brand of ink, case finding was initiated February 15, 2012, through Epi-X using the following case definitions: 1) a possible case was defined as persistent inflammatory reaction (i.e., redness, swelling, or nodules) localized within the margins of a new tattoo on a person between May 1, 2011, and February 10, 2012; 2) a probable case was defined as a possible case with evidence of an NTM infection by histopathology or clinical response to treatment; 3) a confirmed case was defined as a possible case with NTM cultured from a wound or skin biopsy. The New York cluster included 14 confirmed and four probable cases, and one possible case. An investigation by Public Health – Seattle & King County, Washington, identified five confirmed and 26 possible cases. Confirmed cases also were reported from Iowa (two) and Colorado (one) (Table). Among 22 confirmed cases, 63.6% involved men, and the median age of persons in the 22 cases was 33.5 years (range: 20–48 years).
Cases identified in Washington were associated with two clusters, and the initial two cases from patients with recent tattoos were reported by clinicians to local public health authorities. The first, Washington cluster 1, had three con-firmed Mycobacterium abscessus cases and 24 possible cases in persons tattooed with black ink from company B. Water and environmental samples collected from company B did not grow NTM, but the company reported receiving complaints of unusually long-lasting skin reactions in clients tattooed with company B black ink from 35 customers in 19 states between August 2011 and March 2012. Customer identifiers were not available to CDC for follow-up. Two M. abscessus clinical isolates from Washington cluster 1 were indistinguishable by PFGE, but NTM was not recovered from samples of brand B ink. The second Washington cluster had two confirmed cases of M. chelonae and two possible cases associated with company C gray ink. One clinical isolate from Washington
Tattoo-Associated Nontuberculous Mycobacterial Skin Infections — Multiple States, 2011–2012
On August 22, this report was posted as an MMWR Early Release on the MMWR website (http://www.cdc.gov/mmwr).

Morbidity and Mortality Weekly Report
654 MMWR / August 24, 2012 / Vol. 61 / No. 33
cluster 2 was available for testing. A sample from an opened bottle of company C gray ink grew M. chelonae, which was unrelated to the Washington cluster 2 clinical isolate and was unrelated to New York isolates, based on PFGE patterns. Reviews of tattoo practices at the parlors associated with the clusters did not reveal other potential sources of contamination.
The Iowa Department of Public Health reported two con-firmed M. chelonae cases. Patients were tattooed with black ink from company C. PFGE testing showed that two clinical isolates from Iowa and the clinical isolate from Washington cluster 2 were indistinguishable from each other, but unrelated to New York isolates. Ink and environmental samples were not available for testing.
The Colorado Department of Public Health and Environment reported one confirmed case of M. chelonae infection. PFGE testing showed that this strain was unrelated to any of the clinical and ink isolates identified in other clusters. Artists at the Colorado tattoo parlor reported using distilled or reverse osmosis water to dilute company D black ink. Although used for tattooing, the ink was labeled as a drawing ink, and specified as not indicated for tattooing. The artist rinsed needles with distilled or reverse osmosis water when switching colors of ink on the same client. An unopened bottle of company D black drawing ink, reverse osmosis water samples, and environmental samples were tested, but NTM were not recovered.
In March and April 2012, FDA conducted inspections of company A and company B ink manufacturing sites. Ingredients used in the manufacture of tattoo inks at those sites included a wide range of pigments, carrier solutions, and diluents, including distilled water in some formulations. Samples of unopened ink bottles, ink ingredients, environ-mental samples, distilled water, and tap water were tested at CDC and did not yield NTM.
Reported by
Brenden Bedard, MPH, Byron Kennedy, MD, Monroe County Dept of Public Health; Vincent Escuyer, PhD, Kara Mitchell, PhD, Wadsworth Center, Mycobacteriology Laboratory, New York
State Dept of Health. Jeffrey S. Duchin, MD, Public Health – Seattle & King County, Washington; Paul Pottinger, MD, Stanley Hurst, MD, Univ of Washington. Ken Sharp, MPA, Timothy Wickham, MPH, Iowa Dept of Public Health. Sarah Jackson, MPH, Wendy Bamberg, MD, Colorado Dept of Public Health and Environment. Pamela LeBlanc, MPH, Coordinated Outbreak Response and Evaluation Network; Linda M. Katz, MD, Office of Colors and Cosmetics, Center for Food Safety and Applied Nutrition, Food and Drug Administration. Taranisia MacCannell, PhD, Judith Noble-Wang, PhD, Heather O’Connell, PhD, Alexander Kallen, MD, Bette Jensen, MMSc, Div of Healthcare Quality Promotion, National Center for Emerging and Zoonotic Infectious Diseases; Duc B. Nguyen, MD, Michael H. Kinzer, MD, EIS officers, CDC. Corresponding contributors: Duc B. Nguyen, [email protected], 404-639-0027; Michael H. Kinzer, [email protected], 206-263-8169.
Editorial Note
This report describes cases of tattoo-associated NTM skin infections in four states. The use of ink contaminated before distribution or just before tattooing likely led to infections in each of the reported clusters. In the New York cluster, NTM isolates from clinical specimens, and unopened containers of company A prediluted gray ink were indistinguishable. In Washington cluster 2 and the Iowa cluster, intrinsic contamina-tion of company C gray ink was indicated by indistinguishable M. chelonae clinical isolates from infected tattoo lesions, with no other common exposure except the brand of ink used for tattooing. NTM isolates matching cases were not cultured from any other brand of ink; however, whether the ink samples tested were from the same batches of inks used in the cases could not be determined.
The frequency of NTM skin and soft tissue infections occurring subsequent to tattooing is not known, but these events have been reported previously, and dilution of inks with nonsterile water during tattooing was implicated (3–6). Tattoo-associated NTM infections can range from mild inflammation (e.g., rash, papules, or nodules) to severe abscesses requiring
TABLE. Characteristics of nontuberculous mycobacteria (NTM) tattoo-associated skin infection clusters — multiple states, 2011–2012
State
No. of casesMycobacterium species
identified
Tattoo ink supplier and type
NoteConfirmed Probable Possible Company Ink
New York 14 4 1 M. chelonae A Prediluted gray Clinical and company A ink isolates indistinguishable
Washington 3 0 24 M. abscessus B Black No NTM isolated from company B inkWashington 2 0 2 M. chelonae C Gray Clinical and company C ink isolates unrelatedIowa 2 0 0 M. chelonae C Black Available clinical isolates from Iowa cluster and
Washington cluster 2 were indistinguishable Colorado 1 0 0 M. chelonae D Black Clinical isolate was unrelated to New York or
Washington isolates, no NTM isolated from ink

Morbidity and Mortality Weekly Report
MMWR / August 24, 2012 / Vol. 61 / No. 33 655
extensive and multiple surgical debridements. NTM infections are difficult to treat and can require a minimum of 4 months of treatment with a combination of two or more antibiotics. Physicians who encounter persistent papular rashes or nodules localized to newly tattooed areas should consider the possibility of an NTM infection.
Contamination of tattoo inks can occur during the manu-facturing process and might persist if steps are not taken to eliminate harmful microbial contaminants in the finished product. A cross-sectional laboratory survey in 2010 of 58 unopened ink bottles from different manufacturers identified intrinsic contamination with a variety of organisms in 10% of these inks (7), but did not test for the presence of NTMs.
Many NTM species (e.g., M. abscessus and M. chelonae) are found in water, so the addition of nonsterile water to ink during its manufacture or at its point of use could lead to contamination with NTM (3–5), and potentially result in infections. In addition, a common misconception is that distilled and reverse osmosis water are sterile (8), leading to the mistaken assumption that these products are acceptable for diluting tattoo inks. Dilution of inks with nonsterile water or other ingredients at the point of use might lead to product contamination. Dilution of ink also will dilute preservatives, if present, and make them less effective.
Under the Federal Food, Drug, and Cosmetic Act, tattoo inks are considered to be cosmetics, and the pigments used in the inks are color additives requiring premarket approval (9). No specific FDA regulatory requirement explicitly provides that tattoo inks must be sterile. However, intradermal introduction of nonsterile substances, such as tattoo ink, can pose a health risk and is a public health concern.
The practice of tattooing may be regulated by local jurisdic-tions (9). Such regulations generally have required blood-borne pathogens training and the use of hygienic practice during tat-tooing. A few local jurisdictions, such as Los Angeles County (10), have issued requirements that sterile water be used in tattoo ink dilution.
The findings in this report are subject to at least the following limitation. Because on-site investigations took place months after cases were reported, potentially contaminated batches and ingredients, such as distilled water and pigments, were not available for testing. Similarly, water sources used for the manufacture of inks or for ink dilution when patients were tattooed were not available.
Because tattoo inks are injected intradermally, CDC recom-mends that ink manufacturers be held to higher product safety standards, which should include production of sterile inks. In addition, tattoo artists should 1) avoid using products not intended for use in tattooing; 2) avoid ink dilution before tat-tooing, and if dilution is needed, use only sterile water; 3) avoid use of nonsterile water to rinse equipment (e.g., needles) dur-ing tattoo placement; and 4) follow aseptic techniques during tattooing (e.g., hand hygiene and use of disposable gloves). To reduce their risk for infection, consumers should 1) use tattoo parlors registered by local jurisdictions; 2) request inks that are manufactured specifically for tattoos; 3) ensure that tattoo artists follow appropriate hygienic practices; 4) be aware of the potential for infection following tattooing, and seek medical advice if persistent skin problems occur; and 5) notify the tat-too artist and FDA’s MedWatch program* if they experience an adverse event.
References 1. Braverman S. One in five U.S. adults now has a tattoo: yet over two in
five without a tattoo say adults with tattoos are less attractive. New York, NY: Harris Interactive; 2012. Available at http://www.harrisinteractive.com/vault/harris%20poll%2022%20-tattoos_2.23.12.pdf. Accessed February 23, 2012.
2. Drage LA, Ecker PM, Orenstein R, Phillips PK, Edson RS. An outbreak of Mycobacterium chelonae infections in tattoos. J Am Acad Dermatol 2010;62:501–6.
3. Kluger N, Muller C, Gral N. Atypical mycobacteria infection following tattooing: review of an outbreak in 8 patients in a French tattoo parlor. Arch Dermatol 2008;144:941–2.
4. Lollis BD, Kent RS. Cluster of nontuberculous mycobacteria skin infections from tattoos. US Air Force School of Aerospace Medicine: San Antonio, Texas; 2010. Available at http://airforcemedicine.afms.mil/idc/groups/public/documents/afms/ctb_139146.pdf. Accessed August 16, 2012.
5. Binić, I, Janković A, Ljubenović M, Gligorijević J, Jančić S, Janković D. Mycobacterium chelonae infection due to black tattoo ink dilution. Am J Clin Dermatol 2011;12:404–6.
* Additional information available at http://www.fda.gov/safety/medwatch/howtoreport/default.htm.
What is already known on this topic?
Outbreaks of tattoo-associated nontuberculous mycobacterial (NTM) skin infections are reported infrequently. Dilution of tattoo inks with nonsterile water during tattooing has been implicated as a potential source of infection.
What is added by this report?
Investigations of 22 cases of tattoo-associated NTM skin infections in four states that occurred during 2011–2012 found contamination of ink with NTM before use. NTM contamination can occur during the manufacturing process as a result of using contaminated ingredients or as a result of dilution with nonsterile water by the tattoo artist before use.
What are the implications for public health practice?
This report highlights the risk for tattoo-associated NTM skin infections resulting from use of contaminated inks or nonsterile water for ink dilution. To prevent infection, CDC recommends that only sterile ink products and sterile water should be used and appropriate hygienic practices should be followed when tattooing.

Morbidity and Mortality Weekly Report
656 MMWR / August 24, 2012 / Vol. 61 / No. 33
6. Rodriguez-Blanco I, Fernández LC, Suárez-Peñaranda JM, Pérez del Molino ML, Esteban J, Almagro M. Mycobacterium chelonae infection associated with tattoos. Acta Derm Venereol 2011;91:61–2.
7. Høgsberg T, Saunte DM, Frimodt-Møller N, Serup J. Microbial status and product labelling of 58 original tattoo inks. J Eur Acad Dermatol Venereol 2011;doi:10.1111/j.1468-3083.2011.04359.x.
8. Wallace RJ Jr, Brown BA, Griffith DE. Nosocomial outbreaks/pseudo-outbreaks caused by nontuberculous mycobacteria. Annu Rev Microbiol 1998;52:453–90.
9. Food and Drug Administration. Tattoos & permanent makeup. Silver Spring, MD: US Department of Health and Human Services, Food and Drug Administration; 2010. Available at http://www.fda.gov/cosmetics/productandingredientsafety/productinformation/ucm108530.htm. Accessed August 7, 2012.
10. County of Los Angeles. Los Angeles County Code: department regulations—body art. Baldwin Park, CA: County of Los Angeles, Department of Public Health; 1999. Available at http://admin.publichealth.lacounty.gov/eh/docs/balacregulations.pdf. Accessed August 17, 2012.

Morbidity and Mortality Weekly Report
MMWR / August 24, 2012 / Vol. 61 / No. 33 657
* Per 10,000 population. Hospitalization for pneumonia is defined as a first-listed diagnosis on the medical record of 480-486, as coded according to the International Classification of Diseases, Ninth Revision, Clinical Modification. Rates were calculated using U.S. Census Bureau 2000-based postcensal civilian population estimates.
From 2000 to 2010, the hospitalization rate for pneumonia decreased by 20% for the total population. The rate decreased 30% among those aged 65–74 years, 31% among those aged 75–84 years, and 33% among those aged ≥85 years. Throughout the period, the rate of hospitalization for the <65 years age group was substantially lower than the rate for any other age group.
Source: National Hospital Discharge Survey, 2000–2010. Available at http://www.cdc.gov/nchs/nhds.htm.
Reported by: Monica Wolford, MA, [email protected], 301-458-4346; Karishma Anand, MPH, Maria Owings, PhD.
<65 yrs 65–74 yrs75–84 yrs≥85 yrsAll ages
0
100
200
300
400
500
600
2000 2001 2002 2003 2004 2005 2006 2007 2008 2009 2010
Hos
pita
lizat
ions
per
10,
000
popu
latio
n
Year
QuickStats
FROM THE NATIONAL CENTER FOR HEALTH STATISTICS
Rate* of Hospitalization for Pneumonia, by Age Group — National Hospital Discharge Survey, United States, 2000–2010


U.S. Government Printing Office: 2012-523-043/02026 Region IV ISSN: 0149-2195
The Morbidity and Mortality Weekly Report (MMWR) Series is prepared by the Centers for Disease Control and Prevention (CDC) and is available free of charge in electronic format. To receive an electronic copy each week, visit MMWR’s free subscription page at http://www.cdc.gov/mmwr/mmwrsubscribe.html. Paper copy subscriptions are available through the Superintendent of Documents, U.S. Government Printing Office, Washington, DC 20402; telephone 202-512-1800.
Data presented by the Notifiable Disease Data Team and 122 Cities Mortality Data Team in the weekly MMWR are provisional, based on weekly reports to CDC by state health departments. Address all inquiries about the MMWR Series, including material to be considered for publication, to Editor, MMWR Series, Mailstop E-90, CDC, 1600 Clifton Rd., N.E., Atlanta, GA 30333 or to [email protected].
All material in the MMWR Series is in the public domain and may be used and reprinted without permission; citation as to source, however, is appreciated.
Use of trade names and commercial sources is for identification only and does not imply endorsement by the U.S. Department of Health and Human Services.
References to non-CDC sites on the Internet are provided as a service to MMWR readers and do not constitute or imply endorsement of these organizations or their programs by CDC or the U.S. Department of Health and Human Services. CDC is not responsible for the content of these sites. URL addresses listed in MMWR were current as of the date of publication.
Morbidity and Mortality Weekly Report


![Detecting Carbon Monoxide Poisoning Detecting Carbon ...2].pdf · Detecting Carbon Monoxide Poisoning Detecting Carbon Monoxide Poisoning. Detecting Carbon Monoxide Poisoning C arbon](https://img.pdfslide.net/doc/110x75/5f551747b859172cd56bb119/detecting-carbon-monoxide-poisoning-detecting-carbon-2pdf-detecting-carbon.jpg)