Embed Size (px)
Citation preview

Leading a Strong Resurgence
HITA
CH
I Annual R
epo
rt 2010
Annual Report 2010Year ended March 31, 2010

Contents
Cautionary StatementCertain statements found in this document may constitute “forward-looking statements” as defined in the U.S. Private Securities Litigation Reform Act of 1995. Such “forward-looking statements” reflect management’s current views with respect to certain future events and financial performance and include any statement that does not directly relate to any historical or current fact. Words such as “anticipate,” “believe,” “expect,” “estimate,” “forecast,” “intend,” “plan,” “project” and similar expressions which indicate future events and trends may identify “forward-looking statements.” Such statements are based on currently available information and are subject to various risks and uncertainties that could cause actual results to differ materially from those projected or implied in the “forward-looking statements” and from historical trends. Certain “forward-looking statements” are based upon current assumptions of future events which may not prove to be accurate. Undue reliance should not be placed on “forward-looking statements,” as such statements speak only as of the date of this document.
Factors that could cause actual results to differ materially from those projected or implied in any “forward-looking statement” and from historical trends include, but are not limited to:• economicconditions,includingconsumerspendingandplantandequipmentinvestmentsinHitachi’smajor
markets, particularly Japan, Asia, the United States and Europe, as well as levels of demand in the major industrialsectorswhichHitachiserves,including,withoutlimitation,theinformation,electronics,automotive,construction and financial sectors;
• exchangeratefluctuationsfortheyenandothercurrenciesinwhichHitachimakessignificantsalesorinwhichHitachi’sassetsandliabilitiesaredenominated,particularlyagainsttheU.S.dollarandtheeuro;
• uncertaintyastoHitachi’sabilitytoaccess,oraccessonfavorableterms,liquidityorlong-termfinancing;• uncertaintyastogeneralmarketpricelevelsforequitysecuritiesinJapan,declinesinwhichmayrequire
Hitachitowritedownequitysecuritiesthatitholds;• thepotentialforsignificantlossesonHitachi’sinvestmentsinequitymethodaffiliates;• increased commoditization of information technology products and digital media-related products and
intensifying price competition for such products, particularly in the Components & Devices and the Digital Media & Consumer Products segments;
• uncertaintyastoHitachi’sabilitytocontinuetodevelopandmarketproductsthatincorporatenewtechnologyon a timely and cost-effective basis and to achieve market acceptance for such products;
• rapidtechnologicalinnovation;• thepossibilityofcostfluctuationsduringthelifetimeoforcancellationoflong-termcontracts,forwhich
Hitachiusesthepercentage-of-completionmethodtorecognizerevenuefromsales;• fluctuationsinthepriceofrawmaterialsincluding,withoutlimitation,petroleumandothermaterials,such
as copper, steel, aluminum and synthetic resins and shortages of materials, parts and components;• fluctuationsinproductdemandandindustrycapacity;• uncertaintyastoHitachi’sabilitytoimplementmeasurestoreducethepotentialnegativeimpactoffluctuations
in product demand, exchange rates and/or price of raw materials and shortages of materials, parts and components;
• uncertaintyastoHitachi’sabilitytoachievetheanticipatedbenefitsof itsstrategytostrengthen itsSocialInnovation Business;
• uncertainty as to the success of restructuring efforts to improve management efficiency by divesting or otherwise exiting underperforming businesses and to strengthen competitiveness and other cost reduction measures;
• generalsocio-economicandpoliticalconditionsandtheregulatoryandtradeenvironmentofHitachi’smajormarkets, particularly Japan, Asia, the United States and Europe, including, without limitation, direct or indirect restrictions by other nations on imports, or differences in commercial and business customs including, without limitation, contract terms and conditions and labor relations;
• uncertaintyastothesuccessofalliancesuponwhichHitachidepends,someofwhichHitachimaynotcontrol, with other corporations in the design and development of certain key products;
• uncertaintyastoHitachi’saccessto,orabilitytoprotect,certainintellectualpropertyrights,particularlythose related to electronics and data processing technologies;
• uncertaintyastotheoutcomeoflitigation,regulatoryinvestigationsandotherlegalproceedingsofwhichtheCompany,itssubsidiariesoritsequitymethodaffiliateshavebecomeormaybecomeparties;
• thepossibilityofincurringexpensesresultingfromanydefectsinproductsorservicesofHitachi;• thepossibilityofdisruptionofHitachi’soperationsinJapanbyearthquakesorothernaturaldisasters;• uncertaintyastoHitachi’sabilitytomaintaintheintegrityofitsinformationsystems,aswellasHitachi’s
ability to protect its confidential information and that of its customers;• uncertaintyastotheaccuracyofkeyassumptionsHitachiusestovaluateitssignificantemployeebenefit
related costs; and• uncertaintyastoHitachi’sabilitytoattractandretainskilledpersonnel.
Thefactorslistedabovearenotall-inclusiveandareinadditiontootherfactorscontainedinHitachi’speriodicfilingswiththeU.S.SecuritiesandExchangeCommissionandinothermaterialspublishedbyHitachi.
2 To Our Shareholders
10 Financial Highlights
12 The Business of Hitachi
14 Review of Operations14 Information & Telecommunication Systems
16 Power Systems18 Social Infrastructure & Industrial Systems20 Electronic Systems & Equipment22 Construction Machinery24 High Functional Materials & Components26 Automotive Systems28 Components & Devices30 Digital Media & Consumer Products32 Financial Services33 Others
34 Research and Development
35 Intellectual Property
36 Corporate Social Responsibility
38 Corporate Governance
40 Board of Directors
41 Executive Officers
43 Financial Section
126 Five-Year Summary
127 Corporate Data
Hitachi, Ltd. Annual Report 2010

In f isca l 2010, Hi tach i wi l l mark a century in bus iness.
Over the next 100 years, we p lan to deepen our focus on the Socia l Innovat ion Bus iness,
which is suppor ted by socia l in f rast ructure and in format ion in f rast ructure technolog ies—
foundat ion technolog ies of the Hi tach i Group.
Focus ing our deve lopment on three key themes—global , fus ion and the env i ronment—
we wi l l grow Hi tach i as a wor ld leader
in the Socia l Innovat ion Bus iness.
S o c i a l i n f r a s t r u c t u r e
I n f o r m a t i o n i n f r a s t r u c t u r e
1Hitachi, Ltd. Annual Report 2010 1Hitachi, Ltd. Annual Report 2010

Fiscal 2010 will see Hitachi celebrate 100 years of business. We have positioned this year as
a turning point, for moving from “defense” to “offense.” At present, the world is facing a
number of escalating problems, including environmental problems such as global warming,
and concerns about resource and energy depletion. Safe and secure social infrastructure
with a small environmental impact is desperately needed to address these problems. In this
context, Hitachi has the wind at its back. As we take our first steps in a new century, we
believe we will witness the arrival of an era in which social infrastructure businesses and
technologies—where our origins lie—will make a major contribution. We are developing our
Social Innovation Business, which supplies advanced social infrastructure linked by information
technology (IT), a unique strength of ours, around the world to become a global leading Social
Innovation Company. In this way, we will meet the expectations of our stakeholders.
Takashi KawamuraChairman
Hiroaki NakanishiPresident
To our ShareholderS
2 Hitachi, Ltd. Annual Report 2010

We viewed fiscal 2009 as a year for the Hitachi
Group to make a fresh start. True to this positioning,
we pushed through business structure reforms in the
automotive systems, consumer and other busi-
nesses, and cut fixed expenses and procurement
costs. We also conducted public tender offers for five
publicly listed companies—Hitachi Information
Systems, Ltd., Hitachi Software Engineering Co.,
Ltd., Hitachi Systems & Services, Ltd., Hitachi Plant
Technologies, Ltd., and Hitachi Maxell, Ltd.—turning
them into wholly owned subsidiaries of Hitachi. The
aim of these moves was to strengthen our Social
Innovation Business. Moreover, we raised funds by
issuing new shares and convertible bonds with the
aims of strengthening our financial position and
providing funds for capital expenditures and strategic
investments to develop the Social Innovation Busi-
ness globally.
Fiscal 2009 saw the economic environment
improve as a whole from the second half of the
year. China, in particular, achieved a high rate of
economic growth, due in part to effective govern-
ment measures. Other Asian economies also expe-
rienced modest recoveries due mainly to exports to
China and government economic stimulus mea-
sures. The U.S. and European economies were
supported by massive quantitative easing and
government spending programs, enabling them to
see a moderate recovery in the latter half of 2009 as
well. Rebounding exports to emerging nations
aided this recovery.
Under these conditions, Hitachi posted consoli-
dated revenues in fiscal 2009 of ¥8,968.5 billion,
down 10% year over year. However, operating
income rose 59%, to ¥202.1 billion, a large
improvement resulting from fixed cost cutting and
the benefits of business structure reforms. On the
other hand, in income taxes, we incurred a one-off
charge of ¥67.0 billion, mainly due to the writing off
of deferred tax assets associated with making five
publicly listed companies wholly owned subsidiar-
ies. Due to this and other factors, we posted a net
loss attributable to Hitachi, Ltd. of ¥106.9 billion.
In terms of our financial position, total Hitachi,
Ltd. stockholders’ equity at March 31, 2010 was
¥1,284.6 billion due to the public offering to raise
capital. Total Hitachi, Ltd. stockholders’ equity ratio
improved 3.2 points from March 31, 2009 to 14.4%.
The debt-to-equity ratio (interest-bearing debt/
(noncontrolling interests + total Hitachi, Ltd. stock-
holders’ equity)) improved by 0.25 points from
March 31, 2009 to 1.04 at March 31, 2010. We
decided to suspend cash dividends applicable to
fiscal 2009 in light of our business performance.
As we said earlier, we viewed fiscal 2009 as a
year for making a fresh start. We feel that we made
strong progress implementing strategies that focus
more on the Social Innovation Business. Regret-
tably, however, our performance was not what
shareholders expected. We will therefore do our
utmost to improve our operating results in fiscal
2010 and thereafter.
Fiscal 2009 Results
Fiscal 2012 Mid-term Management Plan
Recently, we announced a new mid-term manage-
ment plan for the period through to fiscal 2012 as a
blueprint for moving from “defense” to “offense”
from fiscal 2010. Under this new plan, we will exe-
cute three management strategies aimed at achiev-
ing “Growth Driven by Social Innovation Business”
and a “Solid Financial Base.” First of all, our priority
is to leverage Hitachi’s strengths to promote a
global growth strategy. In order to give impetus to
this growth strategy, our second main initiative calls
on us to focus business resources on the Social
Innovation Business. Over the next 3 years, we plan
to allocate ¥1.6 trillion of the ¥2.6 trillion budgeted
to the Social Innovation Business. This includes
capital expenditures, strategic investments and
R&D expenses. The third initiative is to strengthen
the business structure to stabilize profitability. Here
we will cut costs, entrench our in-house company
system and take other steps.
In terms of management targets for fiscal 2012,
we are targeting revenues of ¥10,500 billion, an
operating income ratio of over 5%, net income
3Hitachi, Ltd. Annual Report 2010
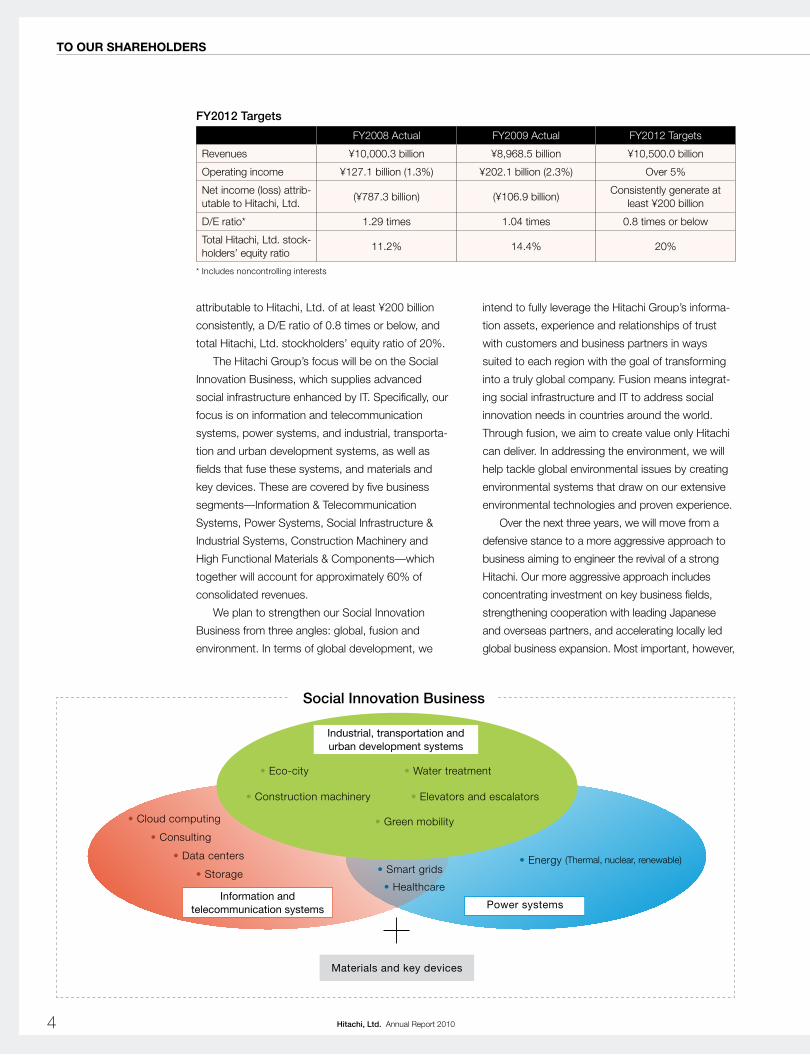
attributable to Hitachi, Ltd. of at least ¥200 billion
consistently, a D/E ratio of 0.8 times or below, and
total Hitachi, Ltd. stockholders’ equity ratio of 20%.
The Hitachi Group’s focus will be on the Social
Innovation Business, which supplies advanced
social infrastructure enhanced by IT. Specifically, our
focus is on information and telecommunication
systems, power systems, and industrial, transporta-
tion and urban development systems, as well as
fields that fuse these systems, and materials and
key devices. These are covered by five business
segments—Information & Telecommunication
Systems, Power Systems, Social Infrastructure &
Industrial Systems, Construction Machinery and
High Functional Materials & Components—which
together will account for approximately 60% of
consolidated revenues.
We plan to strengthen our Social Innovation
Business from three angles: global, fusion and
environment. In terms of global development, we
intend to fully leverage the Hitachi Group’s informa-
tion assets, experience and relationships of trust
with customers and business partners in ways
suited to each region with the goal of transforming
into a truly global company. Fusion means integrat-
ing social infrastructure and IT to address social
innovation needs in countries around the world.
Through fusion, we aim to create value only Hitachi
can deliver. In addressing the environment, we will
help tackle global environmental issues by creating
environmental systems that draw on our extensive
environmental technologies and proven experience.
Over the next three years, we will move from a
defensive stance to a more aggressive approach to
business aiming to engineer the revival of a strong
Hitachi. Our more aggressive approach includes
concentrating investment on key business fields,
strengthening cooperation with leading Japanese
and overseas partners, and accelerating locally led
global business expansion. Most important, however,
To our ShareholderS
FY2008 Actual FY2009 Actual FY2012 Targets
Revenues ¥10,000.3 billion ¥8,968.5 billion ¥10,500.0 billion
Operating income ¥127.1 billion (1.3%) ¥202.1 billion (2.3%) Over 5%
Net income (loss) attrib-utable to Hitachi, Ltd.
(¥787.3 billion) (¥106.9 billion)Consistently generate at
least ¥200 billion
D/E ratio* 1.29 times 1.04 times 0.8 times or below
Total Hitachi, Ltd. stock-holders’ equity ratio
11.2% 14.4% 20%
FY2012 Targets
* Includes noncontrolling interests
• Eco-city
• Cloud computing
• Consulting
• Data centers
• Storage
• Water treatment
• Construction machinery • Elevators and escalators
• Green mobility
• Energy (Thermal, nuclear, renewable)• Smart grids
• Healthcare
Social Innovation Business
Materials and key devices
Industrial, transportation and urban development systems
Information and telecommunication systems Power systems
4 Hitachi, Ltd. Annual Report 2010
Overseas revenue ratio
41%
is for each and every Hitachi Group employee to
embrace the pioneering venture spirit of a century
ago, and mirror the Company’s aggressive stance.
We are convinced we can execute our plans. At the
same time, we will continue to implement defensive
measures, including pursuing ongoing efforts to
strengthen our cost competitiveness and reinforce
our financial position, while continuing to realign our
business portfolio. These defensive measures will
help to create a more stable high profit base and an
even stronger Hitachi beyond that.
1. Global Growth Strategy
Our global growth strategy constitutes our growth
engine. The first part of this strategy is to promote
and expand global localization. To identify customers
needs around the world in a timely manner, whether
in Japan, other industrialized countries or emerging
markets, and develop business quickly it is impor-
tant to have a locally led project control function. We
plan to strengthen this function comprehensively.
We will rigorously develop a more market-centric
approach through leadership by local companies,
and grasp local values, standards and risks via local
leadership to promote business there.
The second part of our global growth strategy is
to expand business opportunities in collaboration
with global partners. Through partnerships centered
on government institutions of China, India and
Singapore in the fast-growing Asian belt zone, we
will expand and unearth business opportunities
related to social innovation projects.
The third aspect of our global growth strategy is
to expand new businesses that leverage Hitachi’s
strengths. Taking full advantage of our accumu-
lated technologies, experience and know-how in
the Social Innovation Business, we will develop
new businesses as a group and globally. These
new businesses include eco-cities, water and
sewage operation and management, eco-data
centers, and energy-saving systems for LNG plants.
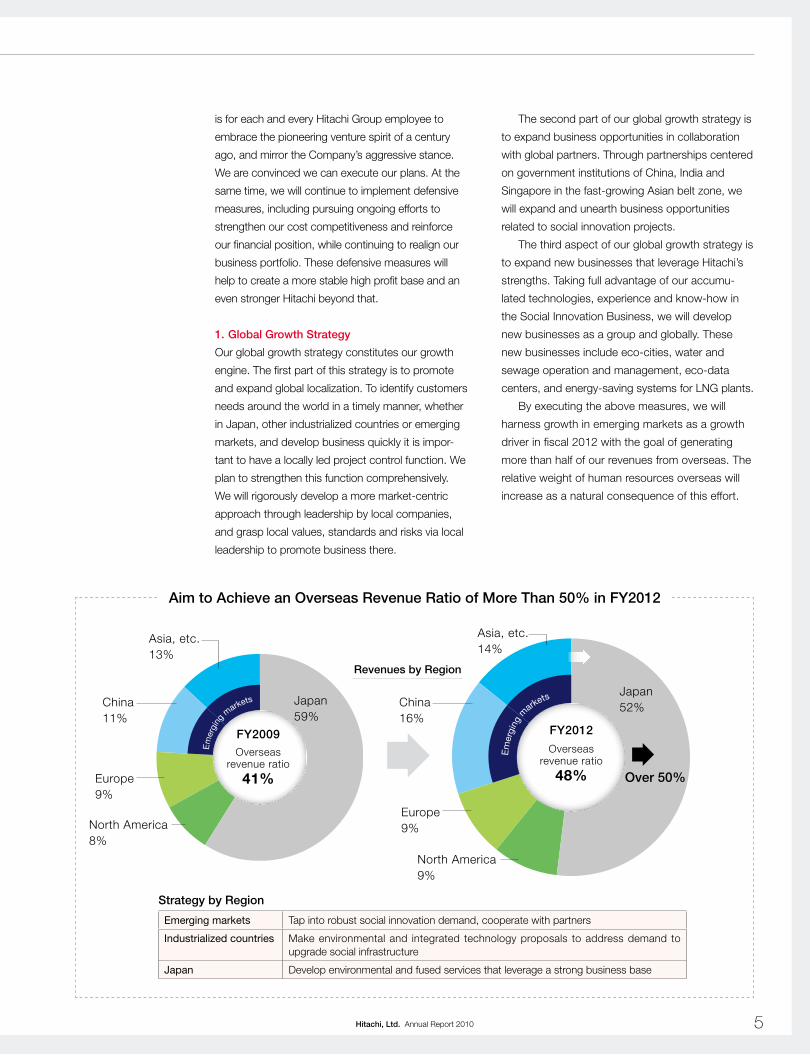
By executing the above measures, we will
harness growth in emerging markets as a growth
driver in fiscal 2012 with the goal of generating
more than half of our revenues from overseas. The
relative weight of human resources overseas will
increase as a natural consequence of this effort.
Aim to Achieve an Overseas Revenue Ratio of More Than 50% in FY2012
Japan59%
Japan52%
Asia, etc.13%
China11%
China16%
Europe9%
Europe9%North America
8%
North America9%
FY2009 FY2012
Overseas revenue ratio
48% Over 50%
Revenues by Region
Asia, etc.14%
Strategy by Region
Emerging markets Tap into robust social innovation demand, cooperate with partners
Industrialized countries Make environmental and integrated technology proposals to address demand to upgrade social infrastructure
Japan Develop environmental and fused services that leverage a strong business base
E
mer
ging
m
arkets
Em
ergi
ng
markets
5Hitachi, Ltd. Annual Report 2010

To our ShareholderS
• Initiatives in China
Hitachi was the first Japanese company to start
doing business in China in earnest in 1981 when
we established a joint venture to manufacture TVs
there. Since then, we have steadily expanded busi-
ness using the catchphrase, “The Most Trusted
Partner in China,” and today, we generate revenues
of approximately ¥1 trillion there. We expect high
growth in Chinese business going forward and are
already highly competitive in the Chinese market.
Our strategy is to strengthen the competitiveness
of individual businesses such as construction
machinery, elevators and escalators, and ATMs.
We will also leverage environmental and energy-
saving technologies refined in Japan, to meet the
demands of Chinese society by helping to solve
environmental problems.
Furthermore, with the cooperation of the
National Development and Reform Commission, we
will focus on creating eco-cities, an area that
includes smart grids and water treatment systems.
The new business models we develop in China
will be utilized in social innovation projects in
the Asian belt zone that extends from the Middle
East to India and Southeast Asia. For instance, we
will package our environmental systems model,
progressively utilize existing local production and
maintenance systems, and implement other initia-
tives based on businesses in China to contribute to
social innovation projects in the Asian belt zone.
• Initiatives in Europe
In Europe, authorities are imposing stricter environ-
mental regulations at the same time as existing
social infrastructure ages. This is generating greater
demand for renewing social infrastructure. In the
thermal power plant business, Hitachi acquired a
local German company in 2003 and since 2006 has
strengthened locally led operations targeting Europe
and Africa through Hitachi Power Europe GmbH.
We are combining local management and staff with
Japanese manufacturing expertise, quality and
project management techniques to establish an
even more stable base in the region.
Our railway business in the U.K. is another busi-
ness with a growing presence in Europe. We started
this business 10 years ago with just one representa-
tive. Today, through promotional work by local staff
and engineering capabilities underpinned by Japa-
nese technology and experience, we are advancing
steadily in delivering high-speed railcars and devel-
oping other businesses. Going forward, we will
strengthen locally led operations and channel more
resources into the business, so that we address
robust demand to upgrade social infrastructure.
• Initiatives in North America
We do business in storage solutions globally and
command a global top share in the enterprise
sector. This is the result of harnessing outstanding
Japanese development capabilities and the market-
ing capabilities of Silicon Valley-based Hitachi Data
Systems, which already serves as a control center
targeting world markets.
Combining distinctive solutions, centered on our
strong storage products, and a proven 10-year
consulting track record in the U.S., we will develop
our information and telecommunication systems
business globally.
• Initiatives in Japan
Japan remains an important base market. We have
built up advanced technologies and an extensive
track record with our customers in Japan, as well as
top-class market shares that testify to the trust we
have earned here. We will strengthen our operations
from this base going forward. In the information and
telecommunication systems business, we will strive
to expand cloud computing and other high-value-
added services businesses. In nuclear power, we will
continue to make steady progress with projects
currently under construction and win more orders. In
the smart grid business, which fuses information
and power systems, we aim to achieve high growth
based on Hitachi’s strengths. While the Japanese
market is generally said to be experiencing slowing
growth, we believe that there are opportunities to
expand business by making creative proposals that
accurately address changes in society and markets.
2. Focusing Business Resources on the Social
Innovation Business
We have continued to reshape our business portfo-
lio to move away from high volatility businesses
whose products are becoming commodities and
strengthen the Social Innovation Business. Making
6 Hitachi, Ltd. Annual Report 2010

the five publicly listed companies wholly owned
subsidiaries, as mentioned earlier, was one move to
this end. Reviewing and optimizing a business
portfolio is something management should do
constantly, and we will therefore continue to
restructure our operations going forward.
While optimizing our portfolio, in order to achieve
growth we plan to allocate ¥1 trillion, or 70%, of the
¥1.4 trillion budgeted for capital expenditures and
strategic investments between fiscal 2010 and fiscal
2012 to the Social Innovation Business. We will
invest in areas where growth is expected such as
eco-data centers, highly efficient thermal power and
nuclear power systems, and establishing rolling stock
manufacturing and maintenance facilities in the U.K.
Besides the ¥1 trillion earmarked for investments, we
will actively utilize M&As and other means to
strengthen key businesses.
Research and development is the wellspring of
growth for the Social Innovation Business. Of the
¥1.2 trillion we plan to invest in R&D over the next 3
years, we will allocate ¥0.6 trillion, or 50%, for tech-
nologies, products and systems related to the three
themes mentioned earlier: global, fusion and
environment. In specific terms, we will invest to
expand and enhance R&D functions at global bases,
and to develop information platforms for social infra-
structure corresponding to the Social Innovation
Business. This includes storage systems in North
America and smart grids in China. In the environment
field, in addition to electronics research in areas such
as new power devices, inverters and lithium-ion
batteries, we will invest to strengthen analysis tech-
nologies that form the basis of development.
In this way, we will concentrate ¥1.6 trillion of the
¥2.6 trillion in management resources budgeted for
the next 3 years in the Social Innovation Business,
namely information and telecommunication systems,
social infrastructure and industrial systems, and high
functional materials and components to drive our
growth and medium-term expansion.
3. Strengthening the Business Structure to
Stabilize Profitability
We are taking steps to improve underperforming
businesses so as to stabilize earnings. In our flat-
panel TV business, we have ceased producing
panels in-house and switched to using OEM and
Concentrate Investment on the Social Innovation Business
FY2009
¥600 billion(Total for FY2010 to FY2012)
180
0
100
200
300
400
(Billion yen)
122% 220
FY2012
R&D Investment
FY2009
¥1 trillion(Total for FY2010 to FY2012)
230
0
100
200
300
400
(Billion yen)
350
152%
FY2012
Capex and Strategic Investments
Information & Telecommunication Systems
Power Systems
Social Infrastructure &Industrial Systems
Construction Machinery
High Functional Materials &Components
7Hitachi, Ltd. Annual Report 2010

To our ShareholderS
production outsourcing of TV sets overseas. This
has created a low-risk flat-panel TV business
model. In automotive systems, we are rigorously
implementing structural reforms and developing and
producing parts for eco-vehicles. In HDD operations,
progress with business structure reforms has
produced positive earnings for the past two fiscal
years since fiscal 2008. All in all, we have man-
aged to limit the downside risks of underperform-
ing businesses.
Cost cutting will remain an ongoing theme for
us. In terms of reducing procurement costs, we
plan to expand centralized purchasing from 25% of
total procurements at present to 35% in fiscal 2012.
We also plan to expand global procurement,
increasing overseas procurement from 25% at
present to 50% of total procurements in fiscal 2012.
In addition, we will continue to lower the fixed cost
ratio, reduce indirect materials costs and expand
shared services, with the overarching aim of
strengthening our cost competitiveness to prevail
against global competition.
In terms of improving profitability, in addition to
increasing operating income by expanding strong
products and services, we plan to utilize the con-
solidated tax filing system. In this way, we aim to
establish an earnings structure that can consis-
tently generate net income attributable to Hitachi,
Ltd. of at least ¥200 billion. Furthermore, in order
to strengthen our financial position, we will increase
net income attributable to Hitachi, Ltd. to reinforce
total Hitachi, Ltd. stockholders’ equity. By reducing
total assets, continuously generating positive free
cash flows and lowering interest-bearing debt, we
aim to achieve a debt-to-equity ratio of 0.8 times or
below, and a total Hitachi, Ltd. stockholders’ equity
ratio of 20%.
As a framework for supporting actions to
strengthen our business structure in this way, we
have adopted an in-house company system with
the goal of strengthening individual businesses.
Under this system, each in-house company is
assigned an internal rating and delegated authority
in accordance with it. This delegation of authority is
intended to facilitate speedy, autonomous manage-
ment. In-house company performance evaluations
are based on FIV*, operating income and cash
flows, and are reflected in the remuneration of
in-house company executives. Moreover, we hold
Hitachi IR Days to provide an opportunity for our
main in-house companies to explain their business
strategies to investors and discharge their account-
ability responsibilities.
Corporate, which supports the in-house compa-
nies, will upgrade the management platform that
spans the group and the world, including the IT
platform, manufacturing and procurement. In doing
so, Corporate will take the lead in improving in-
house companies’ competitiveness. Corporate will
also spearhead efforts to accelerate synergies in
in-house corporate marketing, R&D and engineer-
ing divisions, working actively to promote and coor-
dinate businesses that cut across the Hitachi Group
and in-house companies.
* FIV (Future Inspiration Value) is Hitachi’s unique economic value-added evaluation index in which the cost of capital is deducted from the after-tax operating profit.
4. FY2012 Targets
We will strive to improve Hitachi Group earnings as
a whole, with the Social Innovation Business posi-
tioned as a driver of higher profitability in our mid-
term management plan. For fiscal 2012, we have
set revenues of ¥10,500 billion and an operating
income ratio of over 5% as management targets.
We aim to generate approximately 60% of our
revenues from the five business segments that form
the Social Innovation Business, with an operating
income ratio of 7%, to drive the growth of the entire
Hitachi Group.
In order to strengthen our financial position,
rather than focus only on operating income, we aim
to create a structure that can steadily raise net
income attributable to Hitachi, Ltd. Moving forward,
we will improve net other deductions by reducing
business structural reform expenses. And as a
result of making five publicly listed companies
wholly owned subsidiaries, we will reduce outflows
attributable to noncontrolling interests. In these and
other ways, we aim to consistently generate net
income attributable to Hitachi, Ltd. of at least ¥200
billion by fiscal 2012.
8 Hitachi, Ltd. Annual Report 2010
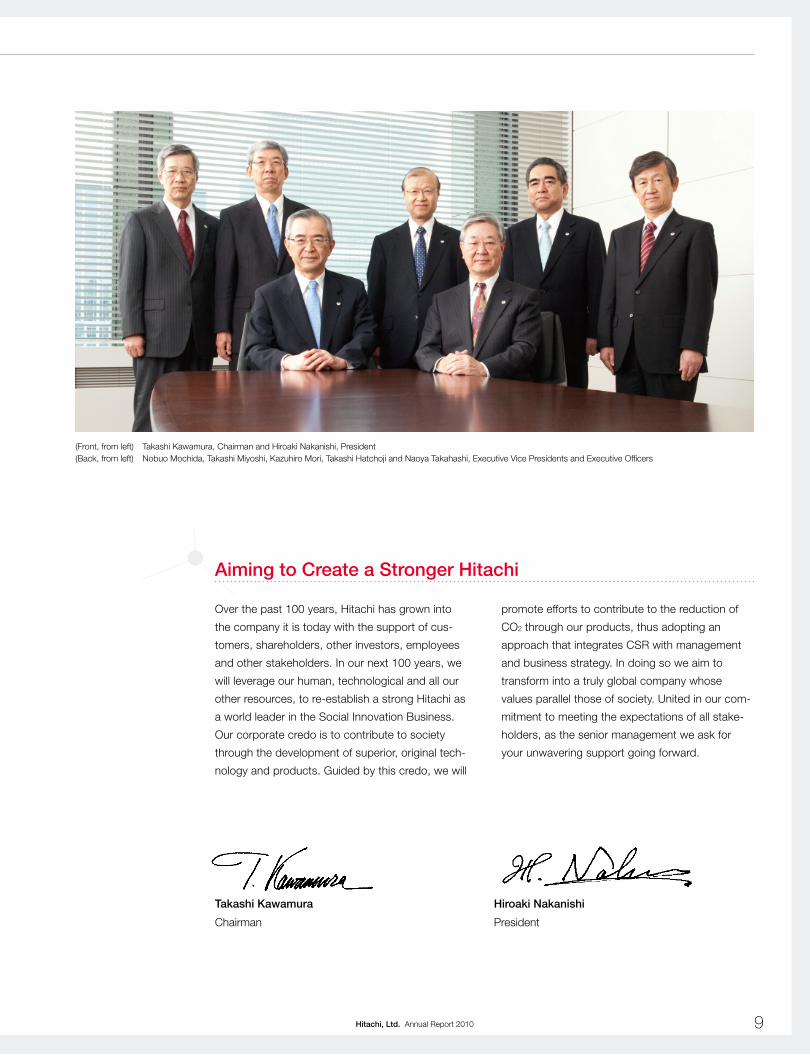
Aiming to Create a Stronger Hitachi
Over the past 100 years, Hitachi has grown into
the company it is today with the support of cus-
tomers, shareholders, other investors, employees
and other stakeholders. In our next 100 years, we
will leverage our human, technological and all our
other resources, to re-establish a strong Hitachi as
a world leader in the Social Innovation Business.
Our corporate credo is to contribute to society
through the development of superior, original tech-
nology and products. Guided by this credo, we will
promote efforts to contribute to the reduction of
CO2 through our products, thus adopting an
approach that integrates CSR with management
and business strategy. In doing so we aim to
transform into a truly global company whose
values parallel those of society. United in our com-
mitment to meeting the expectations of all stake-
holders, as the senior management we ask for
your unwavering support going forward.
(Front, from left) Takashi Kawamura, Chairman and Hiroaki Nakanishi, President (Back, from left) Nobuo Mochida, Takashi Miyoshi, Kazuhiro Mori, Takashi Hatchoji and Naoya Takahashi, Executive Vice Presidents and Executive Officers
Takashi Kawamura
Chairman
Hiroaki Nakanishi
President
9Hitachi, Ltd. Annual Report 2010

Hitachi, Ltd. and SubsidiariesYears ended March 31, 2010, 2009 and 2008
Financial highlighTS
n Revenues and Share of Revenues by Segment (Year ended March 31, 2010)
Segment information
Information & Telecommunication Systems
Social Infrastructure & Industrial Systems
Construction Machinery
Automotive Systems
Components & Devices
Digital Media & Consumer Products
Others
Power Systems
Electronic Systems & Equipment
High Functional Materials & Components
Financial Services
Eliminations & Corporate items
Millions of yenMillions of
U.S. dollars
2010 2009 2008 2010
For the year: Revenues . . . . . . . . . . . . . . . . . . . . . . . . . . . . . . . . . . . . . . . . . ¥8,968,546 ¥10,000,369 ¥11,226,735 $96,436 Operating income . . . . . . . . . . . . . . . . . . . . . . . . . . . . . . . . . . . 202,159 127,146 345,516 2,174 Net loss attributable to Hitachi, Ltd. . . . . . . . . . . . . . . . . . . . . . (106,961) (787,337) (58,125) (1,150) Cash dividends declared . . . . . . . . . . . . . . . . . . . . . . . . . . . . . – 9,971 19,947 – Capital investment (Property, plant and equipment) . . . . . . . . . . 546,326 788,466 969,087 5,874 Depreciation (Property, plant and equipment) . . . . . . . . . . . . . . 441,697 478,759 541,470 4,749 R&D expenditures . . . . . . . . . . . . . . . . . . . . . . . . . . . . . . . . . . 372,470 416,517 428,171 4,005
At year-end: Total assets . . . . . . . . . . . . . . . . . . . . . . . . . . . . . . . . . . . . . . . ¥8,951,762 ¥ 9,403,709 ¥10,530,847 $96,256 Total Hitachi, Ltd. stockholders’ equity . . . . . . . . . . . . . . . . . . . 1,284,658 1,049,951 2,170,612 13,814 Number of employees . . . . . . . . . . . . . . . . . . . . . . . . . . . . . . . 359,746 361,796 347,810 –
Yen U.S. dollars
Per share data: Net loss attributable to Hitachi, Ltd. stockholders: Basic . . . . . . . . . . . . . . . . . . . . . . . . . . . . . . . . . . . . . . . . . . ¥ (29.20) ¥(236.86) ¥ (17.48) $(0.31) Diluted . . . . . . . . . . . . . . . . . . . . . . . . . . . . . . . . . . . . . . . . . (29.20) (236.87) (17.77) (0.31) Net loss attributable to Hitachi, Ltd. stockholders per ADS (representing 10 shares): Basic . . . . . . . . . . . . . . . . . . . . . . . . . . . . . . . . . . . . . . . . . . (292) (2,369) (175) (3.14) Diluted . . . . . . . . . . . . . . . . . . . . . . . . . . . . . . . . . . . . . . . . . (292) (2,369) (178) (3.14) Cash dividends declared . . . . . . . . . . . . . . . . . . . . . . . . . . . . . – 3.0 6.0 – Cash dividends declared per ADS (representing 10 shares) . . . – 30 60 – Total Hitachi, Ltd. stockholders’ equity . . . . . . . . . . . . . . . . . . . ¥287.13 315.86 652.95 3.09
(Billions of yen)
2010
8%4%
9%
7%
6%
12%
6%
10%
12%
9%
17% ¥1,705
¥1,250
¥583
¥638
¥929
¥763
(¥1,207)
¥882
¥998
¥1,249
¥754
¥419
¥8,968 billion
10 Hitachi, Ltd. Annual Report 2010

n Supplemental Geographic Information (Years ended March 31, 2010, 2009 and 2008)
Millions of yenMillions of
U.S. dollars2010 2009 2008 2010
(unaudited)revenuesJapan Outside customer sales . . . . . . . . . . . . . . . . . ¥ 6,006,775 ¥ 6,683,143 ¥ 7,436,999 $ 64,589
Intersegment transactions . . . . . . . . . . . . . . . 1,011,215 1,302,509 1,459,260 10,873Total . . . . . . . . . . . . . . . . . . . . . . . . . . . . . . . 7,017,990 7,985,652 8,896,259 75,462
asia Outside customer sales . . . . . . . . . . . . . . . . . 1,389,095 1,542,526 1,771,600 14,936Intersegment transactions . . . . . . . . . . . . . . . 499,947 591,611 637,719 5,376Total . . . . . . . . . . . . . . . . . . . . . . . . . . . . . . . 1,889,042 2,134,137 2,409,319 20,312
north america Outside customer sales . . . . . . . . . . . . . . . . . 670,897 852,100 962,267 7,214Intersegment transactions . . . . . . . . . . . . . . . 104,698 121,325 123,841 1,126Total . . . . . . . . . . . . . . . . . . . . . . . . . . . . . . . 775,595 973,425 1,086,108 8,340
europe Outside customer sales . . . . . . . . . . . . . . . . . 717,300 738,662 826,188 7,713Intersegment transactions . . . . . . . . . . . . . . . 33,648 51,318 60,650 362Total . . . . . . . . . . . . . . . . . . . . . . . . . . . . . . . 750,948 789,980 886,838 8,075
other areas Outside customer sales . . . . . . . . . . . . . . . . . 184,479 183,938 229,681 1,984Intersegment transactions . . . . . . . . . . . . . . . 3,090 8,367 39,841 33Total . . . . . . . . . . . . . . . . . . . . . . . . . . . . . . . 187,569 192,305 269,522 2,017Subtotal . . . . . . . . . . . . . . . . . . . . . . . . . . . . . 10,621,144 12,075,499 13,548,046 114,206Eliminations & Corporate items . . . . . . . . . . . (1,652,598) (2,075,130) (2,321,311) (17,770)Total . . . . . . . . . . . . . . . . . . . . . . . . . . . . . . . 8,968,546 10,000,369 11,226,735 96,436
geographical profit (loss)Japan . . . . . . . . . . . . . . . . . . . . . . . . . . . . . . . . . . . . . . . . . . . . . . ¥ 149,429 ¥ 74,370 ¥ 299,632 $ 1,607 asia . . . . . . . . . . . . . . . . . . . . . . . . . . . . . . . . . . . . . . . . . . . . . . . 89,399 76,742 33,020 961north america . . . . . . . . . . . . . . . . . . . . . . . . . . . . . . . . . . . . . . . 4,835 7,182 23,087 52europe . . . . . . . . . . . . . . . . . . . . . . . . . . . . . . . . . . . . . . . . . . . . . 11,784 (17,129) 21,575 127other areas . . . . . . . . . . . . . . . . . . . . . . . . . . . . . . . . . . . . . . . . . 6,273 9,434 13,394 67
Subtotal . . . . . . . . . . . . . . . . . . . . . . . . . . . . . 261,720 150,599 390,708 2,814Eliminations & Corporate items . . . . . . . . . . . (59,561) (23,453) (45,192) (640)Total . . . . . . . . . . . . . . . . . . . . . . . . . . . . . . . 202,159 127,146 345,516 2,174
n Revenues by Geographic Area
Millions of yenMillions of
U.S. dollars2010 2009 2008 2010
(unaudited)Japan revenues . . . . . . . . . . . . . . . . . . . . . . . . . . . ¥5,313,790 ¥ 5,861,448 ¥ 6,484,496 $57,138
Percentage of Total Revenues (%) . . . . . . . . . 59 59 58outside Japan asia . . . . . . . . . . . . . . . . . . . . . . . . . . . . . . . 1,699,071 1,911,290 2,167,171 18,269
Percentage of Total Revenues (%) . . . . . . . . . 19 19 19north america . . . . . . . . . . . . . . . . . . . . . . . 729,698 899,550 1,023,713 7,846Percentage of Total Revenues (%) . . . . . . . . . 8 9 9europe . . . . . . . . . . . . . . . . . . . . . . . . . . . . . 824,697 904,425 1,073,877 8,868Percentage of Total Revenues (%) . . . . . . . . . 9 9 10other areas . . . . . . . . . . . . . . . . . . . . . . . . . 401,290 423,656 477,478 4,315Percentage of Total Revenues (%) . . . . . . . . . 5 4 4Subtotal . . . . . . . . . . . . . . . . . . . . . . . . . . . . 3,654,756 4,138,921 4,742,239 39,298Percentage of Total Revenues (%) . . . . . . . . . 41 41 42Total . . . . . . . . . . . . . . . . . . . . . . . . . . . . . . . 8,968,546 10,000,369 11,226,735 96,436
Notes: 1. Operating income and supplemental geographic information are disclosed in accordance with financial reporting principles and practices generally accepted in Japan. 2. The consolidated figures in this annual report are expressed in yen and, solely for the convenience of the reader, have been translated into United States dollars at the rate of ¥93=U.S.$1, the approximate
exchange rate prevailing on the Tokyo Foreign Exchange Market as of March 31, 2010. See note 3 of the accompanying notes to consolidated financial statements. 3. In order to be consistent with financial reporting principles and practices generally accepted in Japan, operating income (loss) is presented as total revenues less cost of sales and selling, general and
administrative expenses. The Company believes that this is useful to investors in comparing the Company’s financial results with those of other Japanese companies. Under accounting principles generally accepted in the United States of America, restructuring charges, net gain or loss on sale and disposal of rental assets and other property and impairment losses are included as part of operating income (loss). See the consolidated statements of operations and notes 19, 20 and 21 to the consolidated financial statements. The restructuring charges mainly represent special termination benefits incurred with the reorganization of our business structures, and as the result of the Company and its subsidiaries reviewing and reshaping the business portfolio.
4. Share of revenues for each segment is calculated based on amounts before the elimination of inter-segment transactions. 5. Revenues, segment profit (loss), capital investment, depreciation, and assets include “Eliminations & Corporate items.” R&D expenditures include Corporate items. Number of employees includes Corporate. 6. The Company has changed the number of employees to exclude temporary employees starting from the year ended March 31, 2010. Figures for prior years have been restated to reflect the current
year presentation.
11Hitachi, Ltd. Annual Report 2010
Main Products and Services
Information &
Telecommunication Systems• Systems Integration • Outsourcing Services • Software • Disk Array Subsystems• Servers • Mainframes• Telecommunications Equipment • ATMs
Power Systems • Thermal Power Generation Systems• Nuclear Power Generation Systems• Hydroelectric Power Generation Systems• Wind Power Generation Systems
Social Infrastructure &
Industrial Systems• Industrial Machinery and Plants• Elevators• Escalators• Railway Vehicles and Systems
Electronic Systems & Equipment • Semiconductor and LCDs Manufacturing Equipment • Electronic Parts Manufacturing System• Test and Measurement Equipment• Medical Electronics Equipment• Power Tools
Construction Machinery • Hydraulic Excavators• Wheel Loaders• Mining Dump Trucks
High Functional Materials &
Components• Wires and Cables • Copper Products• Semiconductor and Display Related Materials • Circuit Boards and Materials• Specialty Steels • Magnetic Materials and Components• High Grade Casting Components and Materials
Automotive Systems • Engine Management Systems• Electric Powertrain Systems• Drive Control Systems• Car Information Systems
Components & Devices • Hard Disk Drives• LCDs• Information Storage Media• Batteries
Digital Media & Consumer Products • Optical Disk Drives • Flat-Panel TVs• LCD Projectors • Mobile Phones• Room Air Conditioners • Refrigerators• Washing Machines • Air-Conditioning Equipment
Financial Services • Leasing• Loan Guarantees
Others • General Trading• Logistics• Property Management
Information & Telecommunication Systems
Electronic Devices
Power & Industrial Systems
Digital Media & Consumer Products
High Functional Materials & Components
Logistics, Services & Others
Financial Services
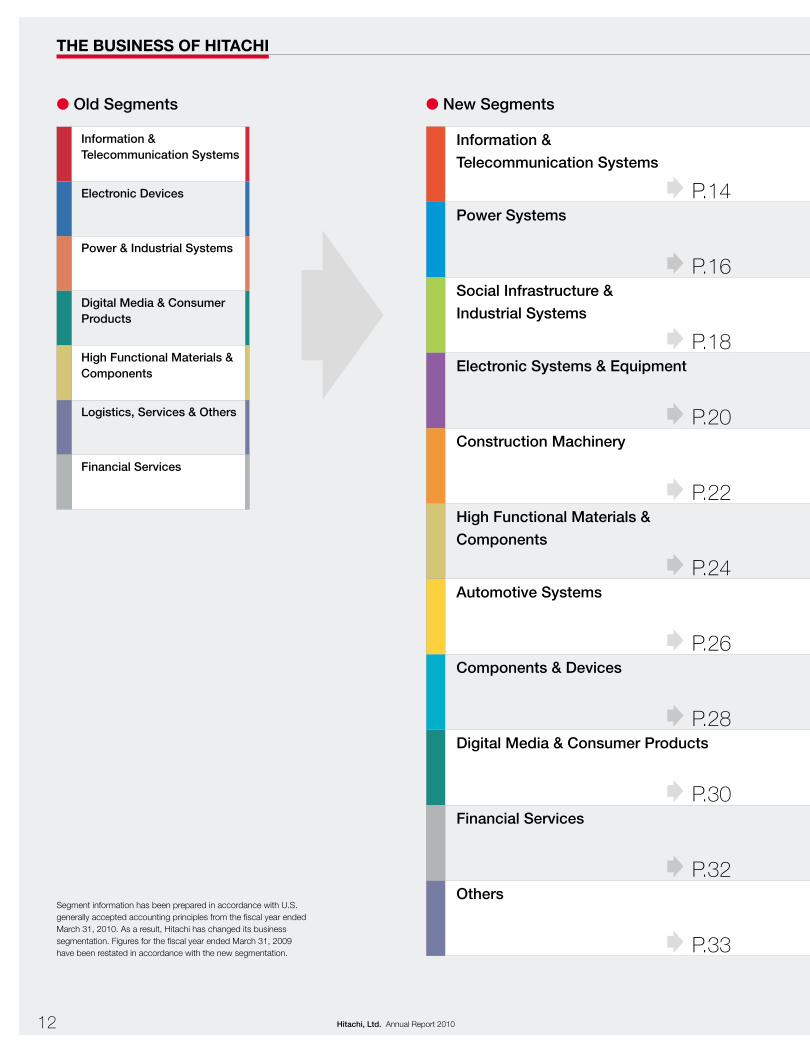
The BuSineSS oF hiTachi
l New Segmentsl Old Segments
P.14
P.16
P.18
P.20
P.22
P.24
P.26
P.28
P.30
P.32
P.33
Segment information has been prepared in accordance with U.S. generally accepted accounting principles from the fiscal year ended March 31, 2010. As a result, Hitachi has changed its business segmentation. Figures for the fiscal year ended March 31, 2009 have been restated in accordance with the new segmentation.
12 Hitachi, Ltd. Annual Report 2010

Main Products and Services
Information &
Telecommunication Systems• Systems Integration • Outsourcing Services • Software • Disk Array Subsystems• Servers • Mainframes• Telecommunications Equipment • ATMs
Power Systems • Thermal Power Generation Systems• Nuclear Power Generation Systems• Hydroelectric Power Generation Systems• Wind Power Generation Systems
Social Infrastructure &
Industrial Systems• Industrial Machinery and Plants• Elevators• Escalators• Railway Vehicles and Systems
Electronic Systems & Equipment • Semiconductor and LCDs Manufacturing Equipment • Electronic Parts Manufacturing System• Test and Measurement Equipment• Medical Electronics Equipment• Power Tools
Construction Machinery • Hydraulic Excavators• Wheel Loaders• Mining Dump Trucks
High Functional Materials &
Components• Wires and Cables • Copper Products• Semiconductor and Display Related Materials • Circuit Boards and Materials• Specialty Steels • Magnetic Materials and Components• High Grade Casting Components and Materials
Automotive Systems • Engine Management Systems• Electric Powertrain Systems• Drive Control Systems• Car Information Systems
Components & Devices • Hard Disk Drives• LCDs• Information Storage Media• Batteries
Digital Media & Consumer Products • Optical Disk Drives • Flat-Panel TVs• LCD Projectors • Mobile Phones• Room Air Conditioners • Refrigerators• Washing Machines • Air-Conditioning Equipment
Financial Services • Leasing• Loan Guarantees
Others • General Trading• Logistics• Property Management
Disk Array Subsystems
Class 395 High-Speed Trains for the UK
Device Characterization System
Hydraulic Excavators
NEOMAX®
Neodymium-based Sintered Magnets
Motor for Hybrid Electric Vehicles
Lithium-Ion Batteries for Plug-in Hybrid Electric Vehicles
Room Air-Conditioner
Multifunctional IC Card
Distribution Center
Gas Turbine
13Hitachi, Ltd. Annual Report 2010

review oF operaTionS
Information & Telecommunication Systems
l Software and ServicesIn software and services, sales were lower year
over year.
Software sales decreased from the previous
fiscal year due to lower sales of platform software
for mainframes and middleware such as system
operation management software.
Services also recorded lower year-over-year
sales, the result of lower sales in system integration,
as well as in outsourcing and consulting.
Earnings declined year over year despite higher
software earnings resulting in part from cost reduc-
tions and other factors. The main reason was lower
earnings in services stemming from lower revenues.
Segment revenues declined 12%, to ¥1,705.5 billion (U.S.$18,340 million), reflecting lower revenues in both software and services, and hardware due to the impact of constrained IT investment resulting from the economic downturn.
Segment profit decreased 32%, to ¥94.5 billion (U.S.$1,017 million) due to the lower revenues and other factors.
l hardwareSector sales declined year over year.
Storage product sales declined year over year
due to the impact of lower sales of enterprise prod-
ucts, which outweighed solid sales of midrange
products. Server sales also declined on account of
decreases in UNIX servers and blade servers. PC
operations also posted lower sales due principally
to the impact of falling prices. Telecommunications
networks saw sales decline year over year as com-
panies kept a tight rein on IT investment. ATM sales
declined with a decrease in units shipped in Japan.
Earnings in hardware operations dropped from
the previous fiscal year mainly because of lower
sales of storage products, servers and telecommu-
nications networks.
Share of Revenues
17%
Millions of yenMillions of
U.S. dollars
FY2009 FY2008 FY2009
Revenues . . . . . . . . . . . . . . . . . . . . . . . . . . . . . . . . . . . . . . . . . . . . . . . . . . ¥1,705,587 ¥1,945,351 $18,340Segment profit . . . . . . . . . . . . . . . . . . . . . . . . . . . . . . . . . . . . . . . . . . . . . . . 94,592 138,452 1,017Capital investment (Property, plant and equipment) . . . . . . . . . . . . . . . . . . . 24,258 30,167 261Depreciation (Property, plant and equipment) . . . . . . . . . . . . . . . . . . . . . . . . 37,724 40,253 406R&D expenditures . . . . . . . . . . . . . . . . . . . . . . . . . . . . . . . . . . . . . . . . . . . . 82,264 94,049 885Assets . . . . . . . . . . . . . . . . . . . . . . . . . . . . . . . . . . . . . . . . . . . . . . . . . . . . . 1,261,016 1,468,481 13,559Number of employees . . . . . . . . . . . . . . . . . . . . . . . . . . . . . . . . . . . . . . . . . 68,409 67,828 –
14 Hitachi, Ltd. Annual Report 2010

Data Center (Unification Control Center)Hitachi’s unification control center monitors IT equip-ment, server room temperature and humidity, room access and the status of other facilities around the clock in a single, central location. The center also supports the stable operation of data centers, which play an important role as a platform for the provision of the Hitachi Cloud Solution service, Harmonious Cloud.
Disk Array SubsystemsHitachi’s large disk array subsystems command the top global market share* in the growing storage products market. These systems are widely employed by financial institutions, govern-ment organizations and in other fields where high reliability and performance are critical.
* According to internal data
Finger Vein Authentication SystemsFinger vein authentication systems are in commercial use in a wide range of fields. Because they are resistant to forgery and spoofing, these biometric authentication systems are used in ATMs, for room access manage-ment and to authenticate PC users, among other appli-cations. Their outstanding ease-of-use, small profile, which allows them to be used anywhere, and high authentication accuracy mean that they are expected to be used in an even wider range of fields going forward.
15Hitachi, Ltd. Annual Report 2010

l Thermal power generation SystemsSales rose year over year on the back of strong
sales of highly efficient coal-fired power generation
systems, mainly overseas, including European EPC
(Engineering, Procurement and Construction)
projects, and boiler orders from South Africa.
Earnings improved substantially from the previ-
ous fiscal year because of the higher sales, as
well as better project management, which
involved using enhanced process management
tools and increasing the number of employees.
These measures also helped to reduce the
unprofitable projects.
l nuclear power generation SystemsSales increased due to healthy demand for the
construction of new plants and preventative mainte-
nance of existing facilities in Japan.
Earnings rose year over year in line with higher
sales.
review oF operaTionS
Power Systems
Segment revenues increased 2%, to ¥882.1 billion (U.S.$9,485 million) year over year. This reflected higher sales of thermal power generation systems and nuclear power gen-eration systems, as well as of wind power and other renew-able energy-related systems.
Segment profit soared 6.3 times, to ¥22.0 billion (U.S.$237 million), the result of higher revenues and better project management.
Share of Revenues
9%
Millions of yenMillions of
U.S. dollars
FY2009 FY2008 FY2009
Revenues . . . . . . . . . . . . . . . . . . . . . . . . . . . . . . . . . . . . . . . . . . . . . . . . . . ¥ 882,135 ¥ 862,389 $ 9,485Segment profit . . . . . . . . . . . . . . . . . . . . . . . . . . . . . . . . . . . . . . . . . . . . . . . 22,075 3,485 237Capital investment (Property, plant and equipment) . . . . . . . . . . . . . . . . . . . 31,149 28,959 335Depreciation (Property, plant and equipment) . . . . . . . . . . . . . . . . . . . . . . . . 22,096 20,708 238R&D expenditures . . . . . . . . . . . . . . . . . . . . . . . . . . . . . . . . . . . . . . . . . . . . 17,629 15,318 190Assets . . . . . . . . . . . . . . . . . . . . . . . . . . . . . . . . . . . . . . . . . . . . . . . . . . . . . 1,067,072 1,026,637 11,474Number of employees . . . . . . . . . . . . . . . . . . . . . . . . . . . . . . . . . . . . . . . . . 15,977 15,611 –
16 Hitachi, Ltd. Annual Report 2010

H-80 80MW-class Gas TurbineHitachi developed the H-80 80MW-class gas turbine with the world’s largest generating capacity*1 for a two-axle, heavy duty-type gas turbine. We plan to expand our gas turbine business centered on a lineup of 80MW, 30MW and 16MW gas turbines.
*1 As of June 22, 2010
Construction of the Ohma Nuclear Power Station for Electric Power Development Co., Ltd.Hitachi is currently constructing a number of advanced boiling water reactors (ABWR), nuclear power plants, which have an out-standing safety, reliability, operational and economic profile. One such plant is the Ohma Nuclear Power Station being built for Electric Power Development Co., Ltd. that is expected to come online in November 2014.
2MW-class Downwind-type Wind TurbinesHitachi is expanding orders of 2MW-class wind turbines developed with Fuji Heavy Industries Ltd. These turbines boast the world’s largest generating capacity*2 for down-wind turbines. Hitachi is actively developing wind power generation systems that combine control systems and storage battery technologies, thereby contributing to the creation of a low-carbon society.
*2 As of June 22, 2010
17Hitachi, Ltd. Annual Report 2010
l Social infrastructure and industrial Systems
Revenues declined year over year, although the
railway systems business recorded growth
primarily in overseas projects. The overall decline
reflected lower sales of industrial equipment for the
manufacturing industry due to the impact of con-
strained capital investment stemming from the
economic recession.
Earnings improved year over year. This improve-
ment was due to fewer unprofitable projects owing
to better project management, a tight focus on profit-
ability with orders, and progress with cost cutting.
l urban planning and development Systems
Revenues declined year over year despite some
growth in sales in the elevator and escalator
business in China. The overall decline reflected
lower sales in the security and other building
solutions businesses and elevator and escalator
business in Japan due to restrained capital
expenditures in the market.
Earnings declined year over year, the result of
lower sales in the building solutions business and
elevator and escalator business in Japan, which
outweighed the solid performance in the elevator
and escalator business in China.
review oF operaTionS
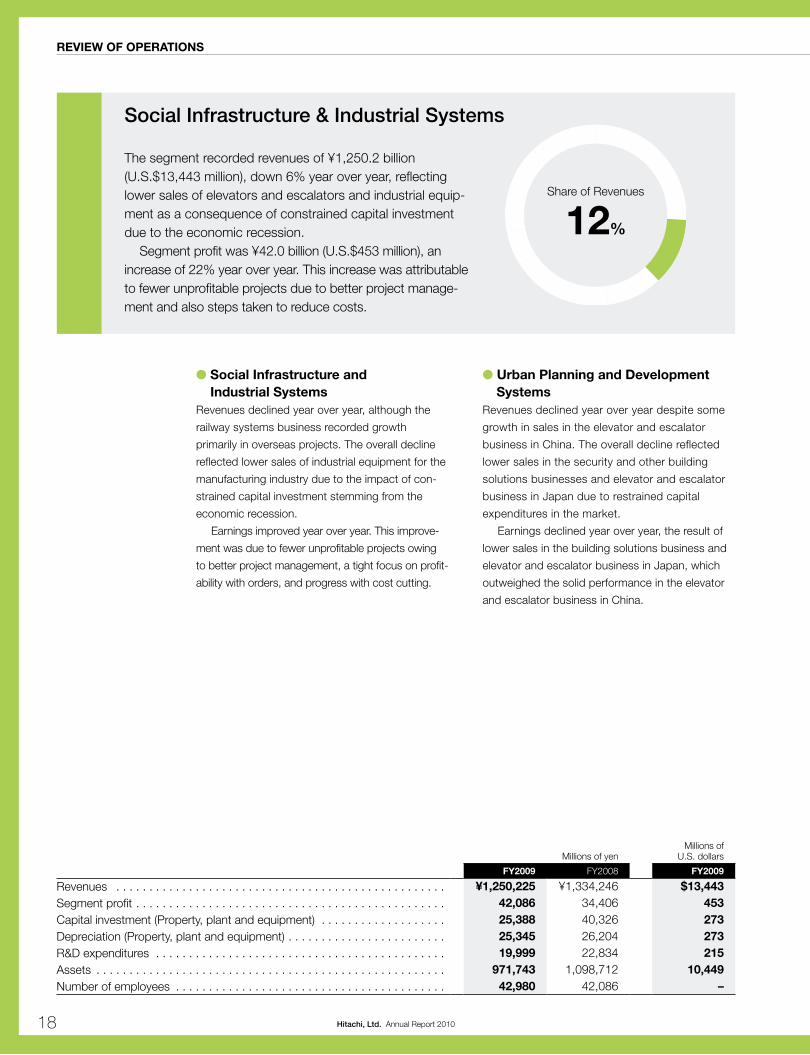
Social Infrastructure & Industrial Systems
The segment recorded revenues of ¥1,250.2 billion (U.S.$13,443 million), down 6% year over year, reflecting lower sales of elevators and escalators and industrial equip-ment as a consequence of constrained capital investment due to the economic recession.
Segment profit was ¥42.0 billion (U.S.$453 million), an increase of 22% year over year. This increase was attributable to fewer unprofitable projects due to better project manage-ment and also steps taken to reduce costs.
Share of Revenues
12%
Millions of yenMillions of
U.S. dollars
FY2009 FY2008 FY2009
Revenues . . . . . . . . . . . . . . . . . . . . . . . . . . . . . . . . . . . . . . . . . . . . . . . . . . ¥1,250,225 ¥1,334,246 $13,443Segment profit . . . . . . . . . . . . . . . . . . . . . . . . . . . . . . . . . . . . . . . . . . . . . . . 42,086 34,406 453Capital investment (Property, plant and equipment) . . . . . . . . . . . . . . . . . . . 25,388 40,326 273Depreciation (Property, plant and equipment) . . . . . . . . . . . . . . . . . . . . . . . . 25,345 26,204 273R&D expenditures . . . . . . . . . . . . . . . . . . . . . . . . . . . . . . . . . . . . . . . . . . . . 19,999 22,834 215Assets . . . . . . . . . . . . . . . . . . . . . . . . . . . . . . . . . . . . . . . . . . . . . . . . . . . . . 971,743 1,098,712 10,449Number of employees . . . . . . . . . . . . . . . . . . . . . . . . . . . . . . . . . . . . . . . . . 42,980 42,086 –
18 Hitachi, Ltd. Annual Report 2010
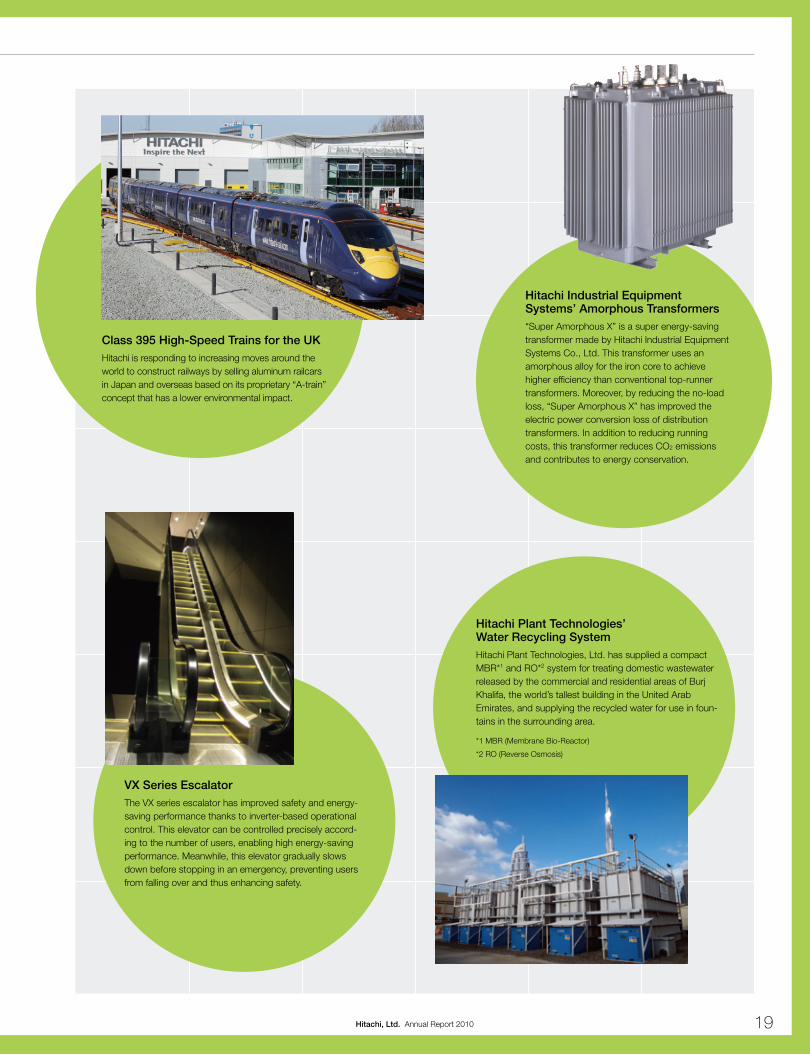
Hitachi Industrial Equipment Systems’ Amorphous Transformers“Super Amorphous X” is a super energy-saving transformer made by Hitachi Industrial Equipment Systems Co., Ltd. This transformer uses an amorphous alloy for the iron core to achieve higher efficiency than conventional top-runner transformers. Moreover, by reducing the no-load loss, “Super Amorphous X” has improved the electric power conversion loss of distribution transformers. In addition to reducing running costs, this transformer reduces CO2 emissions and contributes to energy conservation.
Hitachi Plant Technologies’ Water Recycling SystemHitachi Plant Technologies, Ltd. has supplied a compact MBR*1 and RO*2 system for treating domestic wastewater released by the commercial and residential areas of Burj Khalifa, the world’s tallest building in the United Arab Emirates, and supplying the recycled water for use in foun-tains in the surrounding area.
*1 MBR (Membrane Bio-Reactor)
*2 RO (Reverse Osmosis)
VX Series EscalatorThe VX series escalator has improved safety and energy-saving performance thanks to inverter-based operational control. This elevator can be controlled precisely accord-ing to the number of users, enabling high energy-saving performance. Meanwhile, this elevator gradually slows down before stopping in an emergency, preventing users from falling over and thus enhancing safety.
Class 395 High-Speed Trains for the UKHitachi is responding to increasing moves around the world to construct railways by selling aluminum railcars in Japan and overseas based on its proprietary “A-train” concept that has a lower environmental impact.
19Hitachi, Ltd. Annual Report 2010

l hitachi high-Technologies corporationRevenues declined year on year due to a number of
factors. One was constrained capital expenditures
in LCD-related manufacturing equipment, chip
mounters and other equipment due to the economic
recession. Other factors were lower demand for
information systems and semiconductor devices,
and decreased sales of industrial materials and
electronic materials as a whole.
Earnings declined year over year because of
much lower sales of LCD-related manufacturing
equipment, chip mounters, silicon wafers and other
products as a result of constrained capital expendi-
tures by customers. However, progress was made
with business structure reforms such as cutting
fixed expenses.
l hitachi Medical corporationSales declined year over year due to a sharp drop
in sales of Magnetic Resonance Imaging (MRI)
systems and ultrasound systems for medical
diagnosis in North America and Europe, reflecting
worsening economic conditions and the yen’s
appreciation. On the other hand, the company
recorded strong sales of the same systems in
Japan as well as X-ray Computed Tomography
(CT) systems and X-ray systems.
Earnings declined year over year due to the lower
sales, which resulted from more intense price com-
petition in MRI systems and ultrasound systems for
medical diagnosis in North America and Europe and
the impact of the yen’s appreciation.
l hitachi Kokusai electric inc.Sales declined year on year, with the impact of
constrained capital expenditures in the first half of
the fiscal year weighing heavily on the top line. On a
brighter note, there was a recovery in semiconduc-
tor manufacturing equipment in the second half of
the fiscal year as major semiconductor manufactur-
ers resumed capital investment.
The company recorded a smaller loss than in
the previous fiscal year despite lower sales, due
to progress with business process reforms such
as design standardization and reducing distribu-
tion costs, and with cutting fixed expenses.
l hitachi Koki co., ltd.Sales declined year over year due to lower sales in
Japan, the U.S. and Eastern Europe and the impact
of the yen’s appreciation. This decline came despite
progress strengthening sales channels in all regions.
Earnings declined year over year mainly due to
the drop in sales.
review oF operaTionS
Share of Revenues
10%
Millions of yenMillions of
U.S. dollars
FY2009 FY2008 FY2009
Revenues . . . . . . . . . . . . . . . . . . . . . . . . . . . . . . . . . . . . . . . . . . . . . . . . . . ¥998,632 ¥983,821 $10,738Segment profit (loss) . . . . . . . . . . . . . . . . . . . . . . . . . . . . . . . . . . . . . . . . . . (5,218) 25,755 (56)Capital investment (Property, plant and equipment) . . . . . . . . . . . . . . . . . . . 10,342 12,034 111Depreciation (Property, plant and equipment) . . . . . . . . . . . . . . . . . . . . . . . . 16,146 12,405 174R&D expenditures . . . . . . . . . . . . . . . . . . . . . . . . . . . . . . . . . . . . . . . . . . . . 44,115 30,866 474Assets . . . . . . . . . . . . . . . . . . . . . . . . . . . . . . . . . . . . . . . . . . . . . . . . . . . . . 820,700 829,126 8,825Number of employees . . . . . . . . . . . . . . . . . . . . . . . . . . . . . . . . . . . . . . . . . 24,576 25,051 –
Segment revenues were ¥998.6 billion (U.S.$10,738 million), up 2% year over year. The increase mainly related to the con-solidation of Hitachi Kokusai Electric Inc. and Hitachi Koki Co., Ltd.
Segment loss was ¥5.2 billion (U.S.$56 million), which was ¥30.9 billion worse than the profit recorded in the previous fiscal year. Although earnings improved at Hitachi Kokusai Electric, earnings deteriorated at Hitachi High-Technologies Corporation, Hitachi Medical Corporation and Hitachi Koki.
Electronic Systems & Equipment
20 Hitachi, Ltd. Annual Report 2010

Hitachi High-Technologies’ Device Characterization SystemThis Hitachi High-Technologies’ system uses an Electron Beam Absorbed Current (EBAC) to create a visual image of interconnect failure locations in semiconductor devices. By quickly pinpointing pattern disconnections, high-resistivity problems and shorts, this system helps analyze problems in semicon-ductors with increasingly fine design lines.
Hitachi Medical’s “HI VISION Preirus” Digital Diagnostic Ultrasound SystemHitachi Medical’s “HI VISION Preirus” digital diagnostic ultrasound system boasts an unrivaled design, high image quality, high performance, higher operability and other features, meeting the needs of customers at the medical frontline.
Hitachi Kokusai Electric’s “QUIXACE” Batch Thermal Process System“QUIXACE,” a batch thermal process system, has high throughput and outstanding film deposition characteris-tics, and is used by major semiconductor manufactur-ers around the world. Furthermore, with world-class technologies based on knowhow accumulated over many years in the field of film deposition for semicon-ductor manufacturing, Hitachi Kokusai Electric supports the fast-paced multilayering of semiconductors.
Hitachi Koki’s Cordless Impact DriverHitachi Koki’s cordless impact driver is widely used for tightening screws in the house construction and other fields. A high-efficiency brushless motor and lithium-ion battery combine to yield forceful tighten-ing strength and extended operating time. This high-performance power tool also has outstanding maneuverability. Available in different color variations, this easy-to-use and sleekly designed tool has won high acclaim from users.
21Hitachi, Ltd. Annual Report 2010

l hitachi construction Machinery co., ltd.
Despite much higher sales in China, sales as a
whole dropped sharply from the previous fiscal year
amid generally soft demand around the world,
particularly in Japan, the U.S. and industrialized
nations in Europe. From the fourth quarter, however,
there were signs that the global market had bot-
tomed out, as economic stimulus measures in
various countries and regions promoted a recovery
in demand for hydraulic excavators in emerging
nations such as China.
Although the company worked to reduce pro-
curement costs and fixed expenses, earnings fell
sharply year over year due to lower sales and the
impact of foreign currency fluctuations.
In March 2010 Hitachi Construction Machinery
raised its equity interest in Telco Construction
Equipment Co., Ltd. to make it a consolidated
subsidiary in the Indian market, where further
growth in construction machinery demand is fore-
cast due to stepped up infrastructure building.
review oF operaTionS
Construction Machinery
The segment reported a 19% decline in revenues year over year, to ¥583.6 billion (U.S.$6,276 million) due to soft global demand for construction machinery. However, a bright spot was sharply higher sales of hydraulic excavators in China due to infrastructure building, which was part of the government’s stimulus package.
Segment profit fell 66% year over year, to ¥17.6 billion (U.S.$190 million) due mainly to the lower revenues.
Share of Revenues
6%
Millions of yenMillions of
U.S. dollars
FY2009 FY2008 FY2009
Revenues . . . . . . . . . . . . . . . . . . . . . . . . . . . . . . . . . . . . . . . . . . . . . . . . . . ¥583,636 ¥724,689 $6,276Segment profit . . . . . . . . . . . . . . . . . . . . . . . . . . . . . . . . . . . . . . . . . . . . . . . 17,649 51,337 190Capital investment (Property, plant and equipment) . . . . . . . . . . . . . . . . . . . 32,851 66,748 353Depreciation (Property, plant and equipment) . . . . . . . . . . . . . . . . . . . . . . . . 39,152 35,978 421R&D expenditures . . . . . . . . . . . . . . . . . . . . . . . . . . . . . . . . . . . . . . . . . . . . 15,451 15,141 166Assets . . . . . . . . . . . . . . . . . . . . . . . . . . . . . . . . . . . . . . . . . . . . . . . . . . . . . 914,780 840,693 9,836Number of employees . . . . . . . . . . . . . . . . . . . . . . . . . . . . . . . . . . . . . . . . . 19,063 16,890 –
22 Hitachi, Ltd. Annual Report 2010

Hitachi Construction Machinery’s Ultra-large Hydraulic Excavators and Large Dump Trucks for Mining OperationsIn addition to a powerful excavation ability, Hitachi Construction Machinery’s ultra-large hydraulic excava-tors are easy to operate and comfortable to ride in. Furthermore, their outstanding durability has helped significantly in reducing running costs.
Hitachi Construction Machinery’s large dump trucks employ an AC drive system featuring an Hitachi-made Insulated Gate Bipolar Transistor (IGBT) inverter system that is based on the inverter technology used in Shinkansen (bullet) trains. This enables reduced mainte-nance costs and realizes smooth and speedy gear changes as well as powerful electric braking.
Hitachi Construction Machinery’s Wheel LoadersHitachi Construction Machinery’s wheel loaders boast powerful operation, outstand-ing power performance and easy operability. By fitting different attachments to suit the nature of the work, the company’s wheel loaders are used in work situations ranging from civil engineering and livestock raising to landscaping and agriculture.
Hitachi Construction Machinery’s Hydraulic ExcavatorsHitachi Construction Machinery’s well-known hydraulic excavators are not only highly durable and reliable, but are also energy efficient and easy to operate thanks to the combination of electronic control with the hydraulic system. Hitachi Construction Machinery supplies a range of products to suit frontline customer needs, from mini excavators to ultra-large ones.
23Hitachi, Ltd. Annual Report 2010

l hitachi cable, ltd.Sales declined year over year.
In wires and cables, sales fell year over year on
account of lower sales of industrial and electric
power cables resulting from a drop in private-sector
capital investment. However, there were signs of a
recovery in magnet wires for hybrid electric vehicles.
In information and telecommunications networking,
sales declined from the previous fiscal year, the
result of a drop-off in optical submarine cables from
the third quarter. Sales in sophisticated materials
were down year over year, because of lackluster
sales of devices used in LEDs and auto parts,
although there were signs of a pickup in sales of
compound semiconductors for electronic devices.
Earnings improved from the previous fiscal year
due to improved profitability from the fourth quarter,
even though wires and cables, and sophisticated
materials recorded losses.
l hitachi chemical co., ltd.Sales declined year over year.
Sales of electronic related products decreased
from the previous fiscal year, despite higher sales of
anisotropic conductive films for displays, epoxy
molding compounds and carbon anode materials
for lithium-ion batteries. The lower sales reflected
drops in slurry for chemical mechanical planariza-
tion, die bonding materials and multilayer printed
wiring boards. In advanced performance products,
sales dropped year over year due to a harsh
environment for sales of carbon products, ceramics
and interior and exterior plastic molded products
for automobiles.
Earnings rose sharply, primarily as a result of
cost reductions.
l hitachi Metals, ltd.Sales declined year over year.
High-grade metal products and materials posted
a year-over-year decline, mainly in materials for
molds and metal tools and other automotive-related
products, although sales have begun to recover. In
electronics and IT devices, sales also declined due
to lower sales of rare earth magnets and ferrite
magnets. In high-grade functional components and
equipment, sales declined year over year because of
decreased sales of aluminum wheels, casting com-
ponents, and other automotive-related components.
Earnings declined year over year mainly because
of lower sales.
review oF operaTionS
High Functional Materials & Components
Segment revenues declined 20% year over year, to ¥1,249.3 billion (U.S.$13,434 million), due mainly to the impact of lower demand in the automotive and electronics markets.
Segment profit increased 76% year over year, to ¥44.4 billion (U.S.$478 million), reflecting much improved profit-ability at Hitachi Chemical Co., Ltd. due principally to cost reductions.
Share of Revenues
12%
Millions of yenMillions of
U.S. dollars
FY2009 FY2008 FY2009
Revenues . . . . . . . . . . . . . . . . . . . . . . . . . . . . . . . . . . . . . . . . . . . . . . . . . . ¥1,249,327 ¥1,561,045 $13,434Segment profit . . . . . . . . . . . . . . . . . . . . . . . . . . . . . . . . . . . . . . . . . . . . . . . 44,412 25,257 478Capital investment (Property, plant and equipment) . . . . . . . . . . . . . . . . . . . 49,728 104,319 535Depreciation (Property, plant and equipment) . . . . . . . . . . . . . . . . . . . . . . . . 78,542 81,884 845R&D expenditures . . . . . . . . . . . . . . . . . . . . . . . . . . . . . . . . . . . . . . . . . . . . 44,843 50,973 482Assets . . . . . . . . . . . . . . . . . . . . . . . . . . . . . . . . . . . . . . . . . . . . . . . . . . . . . 1,264,372 1,232,271 13,595Number of employees . . . . . . . . . . . . . . . . . . . . . . . . . . . . . . . . . . . . . . . . . 47,342 49,408 –
24 Hitachi, Ltd. Annual Report 2010

Hitachi Metals NEOMAX® Neodymium-based Sintered MagnetsHitachi Metals led the world by developing and mass producing neodymium-based sintered magnets*.
These magnets are used in air-conditioner compressor motors, hybrid vehicle drive motors, HDD head drive motors and other motors, con-tributing to smaller sizes and higher efficiency.
* Developed by Sumitomo Special Metals Co., Ltd., which merged with Hitachi Metals in April 2007.
Hitachi Chemical’s Carbon Anode Materials for Lithium-ion BatteriesHitachi Chemical’s carbon anode materials for lithium-ion batteries help to make possible large capacity lithium-ion batteries with outstanding discharge characteristics on load. These artificial graphite globular electrodes have many fine holes in the molecules. They are ideal for use in cold climates because they demonstrate high discharge and charge efficiency even at low temperatures.
Hitachi Cable’s Rolled Copper Foil for Next-Generation Lithium-ion BatteriesHitachi Cable developed a rolled copper foil for next-generation lithium-ion batteries. Through surface treating of the high-strength, high- temperature-resistant zirconium-doped copper alloy foil to improve contact characteristics with the negative-electrode active material, Hitachi Cable extended the battery life. Looking ahead, in addi-tion to consumer electronics applications, demand is expected for use in automobiles.
25Hitachi, Ltd. Annual Report 2010

Sales declined year over year on account of sluggish
demand worldwide through the first half of fiscal
2009. On the other hand, recovering demand in
North America in the fiscal year’s second half, expan-
sion in the Chinese market and economic stimulus
programs by governments around the world sup-
ported an upturn in sales of some vehicle types,
notably eco-vehicles and small and mid-sized cars,
which led a recovery in sales of braking and other
drive control system-related components and engine
management systems.
Earnings improved substantially from the previ-
ous fiscal year despite the drop in revenues. One
reason for this improvement was a reduction in
fixed expenses resulting from business structure
reforms, which included rightsizing the workforce
and realigning and integrating production and
sales bases following a review of the product port-
folio. Another contributing factor was business
structure reforms at Clarion Co., Ltd. in car infor-
mation systems.
review oF operaTionS
Automotive Systems
Segment revenues decreased 6%, to ¥638.8 billion (U.S.$6,869 million), reflecting the negative impact of sluggish demand worldwide through the first half of fiscal 2009. How-ever, the second half of fiscal 2009 saw demand increase in line with recovering new vehicle sales.
Segment loss was ¥5.4 billion (U.S.$59 million), a ¥55.0 billion improvement year over year despite the decline in rev-enues. The improvement resulted from the benefits of business structure reforms.
Share of Revenues
6%
Millions of yenMillions of
U.S. dollars
FY2009 FY2008 FY2009
Revenues . . . . . . . . . . . . . . . . . . . . . . . . . . . . . . . . . . . . . . . . . . . . . . . . . . ¥638,828 ¥681,750 $6,869Segment loss . . . . . . . . . . . . . . . . . . . . . . . . . . . . . . . . . . . . . . . . . . . . . . . (5,486) (60,507) (59)Capital investment (Property, plant and equipment) . . . . . . . . . . . . . . . . . . . 15,215 39,635 164Depreciation (Property, plant and equipment) . . . . . . . . . . . . . . . . . . . . . . . . 35,916 38,754 386R&D expenditures . . . . . . . . . . . . . . . . . . . . . . . . . . . . . . . . . . . . . . . . . . . . 38,410 63,136 413Assets . . . . . . . . . . . . . . . . . . . . . . . . . . . . . . . . . . . . . . . . . . . . . . . . . . . . . 459,183 450,966 4,937Number of employees . . . . . . . . . . . . . . . . . . . . . . . . . . . . . . . . . . . . . . . . . 24,602 26,839 –
26 Hitachi, Ltd. Annual Report 2010
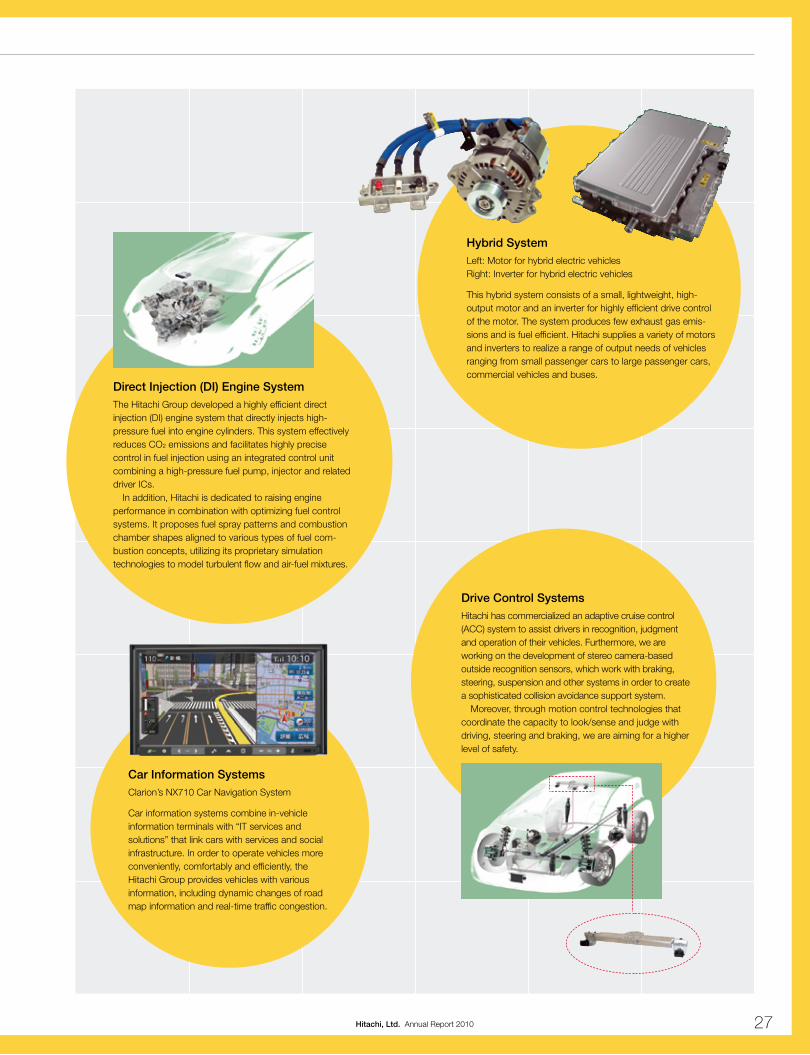
Drive Control SystemsHitachi has commercialized an adaptive cruise control (ACC) system to assist drivers in recognition, judgment and operation of their vehicles. Furthermore, we are working on the development of stereo camera-based outside recognition sensors, which work with braking, steering, suspension and other systems in order to create a sophisticated collision avoidance support system.
Moreover, through motion control technologies that coordinate the capacity to look/sense and judge with driving, steering and braking, we are aiming for a higher level of safety.
Hybrid SystemLeft: Motor for hybrid electric vehicles Right: Inverter for hybrid electric vehicles
This hybrid system consists of a small, lightweight, high-output motor and an inverter for highly efficient drive control of the motor. The system produces few exhaust gas emis-sions and is fuel efficient. Hitachi supplies a variety of motors and inverters to realize a range of output needs of vehicles ranging from small passenger cars to large passenger cars, commercial vehicles and buses.
Direct Injection (DI) Engine SystemThe Hitachi Group developed a highly efficient direct injection (DI) engine system that directly injects high-pressure fuel into engine cylinders. This system effectively reduces CO2 emissions and facilitates highly precise control in fuel injection using an integrated control unit combining a high-pressure fuel pump, injector and related driver ICs.
In addition, Hitachi is dedicated to raising engine performance in combination with optimizing fuel control systems. It proposes fuel spray patterns and combustion chamber shapes aligned to various types of fuel com-bustion concepts, utilizing its proprietary simulation technologies to model turbulent flow and air-fuel mixtures.
Car Information SystemsClarion’s NX710 Car Navigation System
Car information systems combine in-vehicle information terminals with “IT services and solutions” that link cars with services and social infrastructure. In order to operate vehicles more conveniently, comfortably and efficiently, the Hitachi Group provides vehicles with various information, including dynamic changes of road map information and real-time traffic congestion.
27Hitachi, Ltd. Annual Report 2010

l hard disk drives (hitachi global Storage Technologies (hitachi gST))
Sales declined year over year, despite higher sales
in the fourth quarter (October to December 2009)
on the back of a market recovery. The overall
decline was attributable to the economic malaise
and constrained IT investment in the first three
quarters (from January to September 2009).
Hitachi GST recorded positive earnings for the
second consecutive year, although earnings
declined due to the drop in sales year over year.
Note: Hitachi GST has a December 31 fiscal year-end, meaning fiscal 2009 for this company was the period from January through December 2009.
l Battery Systems (hitachi Maxell, ltd. and hitachi vehicle energy, ltd.)
Sales declined year on year due to lower sales
volumes of mainly computer tapes, optical discs
and prismatic lithium-ion rechargeable batteries at
Hitachi Maxell.
Earnings at Hitachi Vehicle Energy worsened in
line with higher development expenses. Hitachi
Maxell, meanwhile, returned to profitability thanks to
improved earnings in optical components and func-
tional materials. Battery systems as a whole recorded
a narrower loss than the previous fiscal year.
l displaysSales decreased year over year on account of lower
sales of small and medium-sized displays for mobile
phones and portable game consoles.
Display operations posted a wider loss than in
the previous fiscal year, as the impact of lower sales
outweighed progress with cost cutting.
review oF operaTionS
Components & Devices
Segment revenues declined 23% year over year, to ¥754.8 billion (U.S.$8,117 million), the result of lower sales of hard disk drives (HDDs), small and medium-sized displays, and at Hitachi Maxell, Ltd.
Segment profit declined 80%, to ¥1.1 billion (U.S.$12 million) due to lower sales from HDDs and small and medium-sized displays.
Share of Revenues
7%
Millions of yenMillions of
U.S. dollars
FY2009 FY2008 FY2009
Revenues . . . . . . . . . . . . . . . . . . . . . . . . . . . . . . . . . . . . . . . . . . . . . . . . . . ¥754,889 ¥978,297 $8,117Segment profit . . . . . . . . . . . . . . . . . . . . . . . . . . . . . . . . . . . . . . . . . . . . . . . 1,149 5,799 12Capital investment (Property, plant and equipment) . . . . . . . . . . . . . . . . . . . 39,038 62,698 420Depreciation (Property, plant and equipment) . . . . . . . . . . . . . . . . . . . . . . . . 62,935 77,244 677R&D expenditures . . . . . . . . . . . . . . . . . . . . . . . . . . . . . . . . . . . . . . . . . . . . 69,160 78,968 744Assets . . . . . . . . . . . . . . . . . . . . . . . . . . . . . . . . . . . . . . . . . . . . . . . . . . . . . 585,999 640,824 6,301Number of employees . . . . . . . . . . . . . . . . . . . . . . . . . . . . . . . . . . . . . . . . . 51,304 50,085 –
28 Hitachi, Ltd. Annual Report 2010

Hitachi Vehicle Energy’s Lithium-Ion Batteries for Plug-in Hybrid Electric VehiclesIn January 2010, Hitachi Vehicle Energy announced the devel-opment of lithium-ion batteries for plug-in hybrid electric vehi-cles. Besides battery cells themselves, Hitachi Vehicle Energy provides optimum solutions in the form of battery systems that also incorporate electric control.
Hitachi Displays’ 3.4-inch IPS LCDs for Mobile PhonesHitachi Displays, Ltd. has earned high marks from a wide range of customers for high picture quality and high definition IPS LCDs used in mobile phones, digital single lens reflex cameras, and other applications.
2.5-inch Hard Disk Drive by Hitachi Global Storage TechnologiesHitachi Global Storage Technologies draws on its technological capabilities to provide highly reliable HDDs for use in a wide range of applications, including notebook and desktop PCs and servers.
Hitachi Maxell’s Prismatic Lithium-Ion Rechargeable Batteries for Mobile Phones and Other ApplicationsHitachi Maxell is working to expand sales of highly safe, large-capacity lithium-ion batteries that draw on its proprietary technologies accumulated over many years, including dispersion technology and electrode coating technology in magnetic tapes.
29Hitachi, Ltd. Annual Report 2010

l digital MediaSales fell year over year. Besides a reduction of
overseas sales channels and lower prices for flat-
panel TVs, this reflected a drop in the number of
newly introduced mobile phone models, and lower
sales of optical storage, even though the latter
increased on a U.S. dollar basis following a recovery
in PC demand, due to the impact of the yen’s
appreciation.
The sector narrowed the loss from the previous
fiscal year. The flat-panel TV business saw earnings
improve sharply as a result of procuring plasma
panels from outside the Hitachi Group, and increas-
ing overseas OEM (Original Equipment Manufacturer)
procurement. Higher sales of optical disc drive-
related products on the back of recovering PC
demand also led to higher earnings.
l comprehensive air conditioning and home appliances
Sales declined year over year of air conditioners in
Japan due to the impact of the economic reces-
sion, although the eco-points program in Japan
sparked strong sales growth for refrigerators, mainly
large models; demand was also strong for washing
machines and all-electric housing-related products.
Overall sales declined overseas as sales of room
air-conditioners and commercial air conditioners fell
because of the impact of the economic recession.
Earnings rose as a whole year over year on the
back of growth in large home appliances in Japan,
reflecting the impact of the eco-points program.
The overall increase came despite sluggish sales
of commercial air conditioners in Japan and lower
overseas sales of room air-conditioners because of
lackluster economic conditions in Europe.
review oF operaTionS
Digital Media & Consumer Products
The segment recorded a 16% decrease in revenues, to ¥929.2 billion (U.S.$9,992 million). In addition to a reduction of over-seas sales channels and lower prices for flat-panel TVs, the overall decrease was due to lower sales of air conditioners.
Segment loss was ¥7.2 billion (U.S.$77 million), which was a ¥103.3 billion improvement year over year. The improvement was attributable to business structure reforms in flat-panel TVs, and improved earnings from optical disc drives.
Share of Revenues
9%
Millions of yenMillions of
U.S. dollars
FY2009 FY2008 FY2009
Revenues . . . . . . . . . . . . . . . . . . . . . . . . . . . . . . . . . . . . . . . . . . . . . . . . . . ¥929,258 ¥1,103,860 $9,992Segment loss . . . . . . . . . . . . . . . . . . . . . . . . . . . . . . . . . . . . . . . . . . . . . . . (7,206) (110,548) (77)Capital investment (Property, plant and equipment) . . . . . . . . . . . . . . . . . . . 14,728 27,990 158Depreciation (Property, plant and equipment) . . . . . . . . . . . . . . . . . . . . . . . . 23,803 36,886 256R&D expenditures . . . . . . . . . . . . . . . . . . . . . . . . . . . . . . . . . . . . . . . . . . . . 18,775 22,939 202Assets . . . . . . . . . . . . . . . . . . . . . . . . . . . . . . . . . . . . . . . . . . . . . . . . . . . . . 521,591 570,935 5,609Number of employees . . . . . . . . . . . . . . . . . . . . . . . . . . . . . . . . . . . . . . . . . 26,491 29,649 –
30 Hitachi, Ltd. Annual Report 2010

Hitachi Appliances’ Room Air ConditionersHitachi’s room air conditioners employ sterile stainless steel to control dirt and mold inside air conditioners. They are also designed with smaller widths to take up less space. Stylish and classy design also blends in with home interiors.
Hitachi Consumer Electronics’ LCD Projectors (CP-A200)The CP-A200 is an ultra-short-throw LCD projector that enables images to be displayed on a large screen at short throwing distances. The projector is ideal for presentations in cramped spaces and classrooms. High bright-ness means that projected images are easily viewed even in bright environments.
Hitachi-LG Data Storage’s Optical Disc DrivesHitachi-LG Data Storage Co., Ltd. leverages Hitachi’s sophisticated development capabilities and LG Electronics Inc.’s outstanding mass production technologies to supply world-class optical disc drives that are sold around the globe.
31Hitachi, Ltd. Annual Report 2010

Financial Services
l hitachi capital corporationVolume declined year on year.
Volume rose in the agricultural equipment &
medical sector due to active efforts to participate in
a support fund in the agricultural equipment field.
However, volume declined in corporate business
due to lower capital investment by corporations.
The consumer business recorded volume on a par
with the previous fiscal year, with growth in Internet-
based business and home loans negated by lower
automobile loans. Overseas business, meanwhile,
saw lower volume due to the impact of worsening
economic conditions.
Earnings rose year over year, primarily the result
of cost cutting, including reducing business operat-
ing expenses and financial expenses.
The segment reported a 5% year-over-year increase in rev-enues, to ¥419.6 billion (U.S.$4,512 million), primarily due to recording large cancellation penalty receipts, despite lower transaction volumes.
Segment profit increased 28%, to ¥8.5 billion (U.S.$92 million), reflecting cost cutting and other factors.
review oF operaTionS
Hitachi Capital’s Multifunctional IC CardHitachi Capital Corporation provides IC card solutions according to the needs of companies and employees, including employee identification cards.
Share of Revenues
4%
Millions of yenMillions of
U.S. dollars
FY2009 FY2008 FY2009
Revenues . . . . . . . . . . . . . . . . . . . . . . . . . . . . . . . . . . . . . . . . . . . . . . . . . . ¥ 419,650 ¥ 401,317 $ 4,512Segment profit . . . . . . . . . . . . . . . . . . . . . . . . . . . . . . . . . . . . . . . . . . . . . . . 8,518 6,660 92Capital investment (Property, plant and equipment) . . . . . . . . . . . . . . . . . . . 295,611 361,444 3,179Depreciation (Property, plant and equipment) . . . . . . . . . . . . . . . . . . . . . . . . 65,224 69,594 701R&D expenditures . . . . . . . . . . . . . . . . . . . . . . . . . . . . . . . . . . . . . . . . . . . . 128 295 1Assets . . . . . . . . . . . . . . . . . . . . . . . . . . . . . . . . . . . . . . . . . . . . . . . . . . . . . 1,789,409 1,914,863 19,241Number of employees . . . . . . . . . . . . . . . . . . . . . . . . . . . . . . . . . . . . . . . . . 3,429 3,539 –
32 Hitachi, Ltd. Annual Report 2010

Others
l hitachi Transport System, ltd.Sales decreased year over year.
In the domestic logistics business, despite much
lower volume from existing customers, sales were on
a par with the previous fiscal year, due to strong
growth in new contracts for third party logistics in
fields such as retailing, information and telecommuni-
cations, and lifestyle-related areas, including the
addition, through a transfer, of a distribution subsid-
iary of Uchida Yoko Co., Ltd. Sales in the global
logistics business were down year over year.
Although the company worked to strengthen its
business bases in North America, Europe, China and
elsewhere in Asia, handled volume declined due to
the impact of the global economic weakness.
Earnings dropped year over year due to the lower
sales, although the company implemented measures
to improve transport efficiency, conduct efficient
distribution activities and cut operating expenses.
The segment recorded an 8% fall in revenues year over year, to ¥763.6 billion (U.S.$8,211 million), due to lower revenues at Hitachi Transport System, Ltd. and in other services busi-nesses on account of soft demand.
Segment profit dropped 21% year over year, to ¥19.4 billion (U.S.$209 million), due to lower revenues and other factors.
review oF operaTionS
Hitachi Transport System’s Keihin Distribution Center Boasts Extensive SecurityHitachi Transport System’s Keihin Distribution Center in Tokyo boasts enhanced security features as a core base for the provision of third-party logistics solutions and information and telecommunication solution services in the Keihin area. Primarily handling customers’ computer and medical equip-ment, the six-story center has a total floor area of approxi-mately 29,500 m2 on a site of approximately 9,800 m2 and uses room access control, a networked surveillance system and other security measures to provide customers with safe and secure distribution services.
Share of Revenues
8%
Millions of yenMillions of
U.S. dollars
FY2009 FY2008 FY2009
Revenues . . . . . . . . . . . . . . . . . . . . . . . . . . . . . . . . . . . . . . . . . . . . . . . . . . ¥ 763,665 ¥ 830,834 $ 8,211Segment profit . . . . . . . . . . . . . . . . . . . . . . . . . . . . . . . . . . . . . . . . . . . . . . . 19,423 24,515 209Capital investment (Property, plant and equipment) . . . . . . . . . . . . . . . . . . . 25,202 37,794 271Depreciation (Property, plant and equipment) . . . . . . . . . . . . . . . . . . . . . . . . 32,840 36,653 353R&D expenditures . . . . . . . . . . . . . . . . . . . . . . . . . . . . . . . . . . . . . . . . . . . . 4,692 4,508 50Assets . . . . . . . . . . . . . . . . . . . . . . . . . . . . . . . . . . . . . . . . . . . . . . . . . . . . . 1,374,882 1,612,556 14,784Number of employees . . . . . . . . . . . . . . . . . . . . . . . . . . . . . . . . . . . . . . . . . 32,538 31,629 –
33Hitachi, Ltd. Annual Report 2010
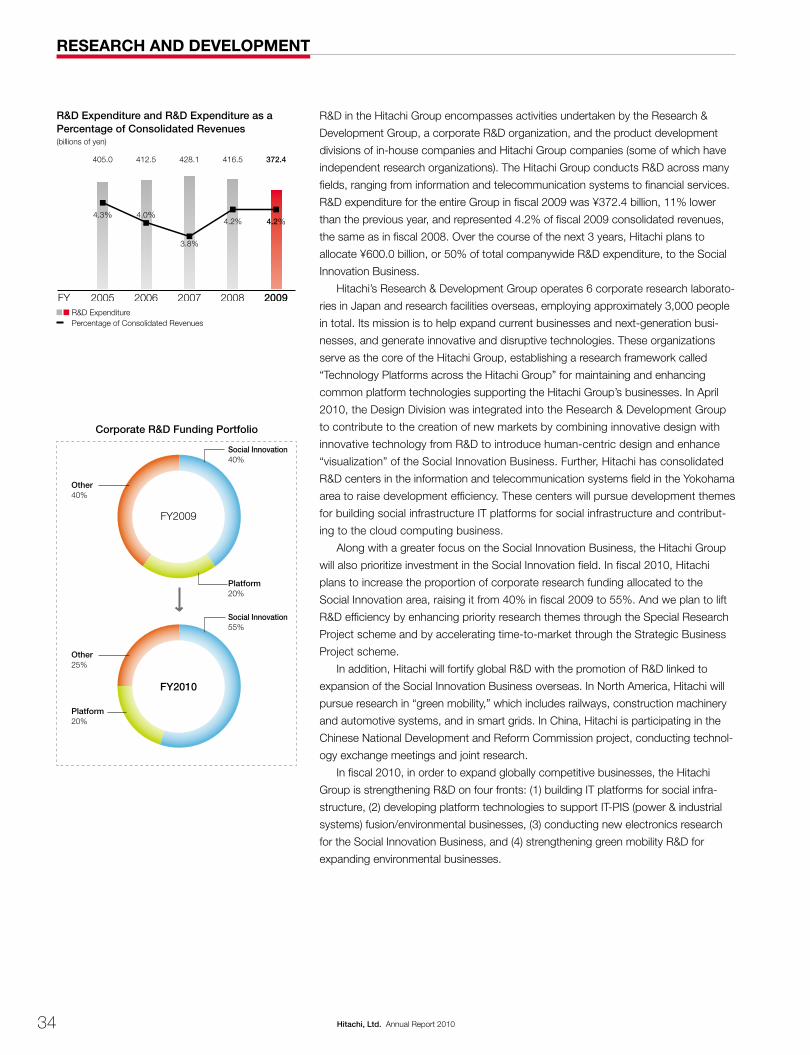
日本
その他
基盤
社会イノベーション
日本
その他
新興国
欧米
ReseaRch and development
R&D in the Hitachi Group encompasses activities undertaken by the Research &
Development Group, a corporate R&D organization, and the product development
divisions of in-house companies and Hitachi Group companies (some of which have
independent research organizations). The Hitachi Group conducts R&D across many
fields, ranging from information and telecommunication systems to financial services.
R&D expenditure for the entire Group in fiscal 2009 was ¥372.4 billion, 11% lower
than the previous year, and represented 4.2% of fiscal 2009 consolidated revenues,
the same as in fiscal 2008. Over the course of the next 3 years, Hitachi plans to
allocate ¥600.0 billion, or 50% of total companywide R&D expenditure, to the Social
Innovation Business.
Hitachi’s Research & Development Group operates 6 corporate research laborato-
ries in Japan and research facilities overseas, employing approximately 3,000 people
in total. Its mission is to help expand current businesses and next-generation busi-
nesses, and generate innovative and disruptive technologies. These organizations
serve as the core of the Hitachi Group, establishing a research framework called
“Technology Platforms across the Hitachi Group” for maintaining and enhancing
common platform technologies supporting the Hitachi Group’s businesses. In April
2010, the Design Division was integrated into the Research & Development Group
to contribute to the creation of new markets by combining innovative design with
innovative technology from R&D to introduce human-centric design and enhance
“visualization” of the Social Innovation Business. Further, Hitachi has consolidated
R&D centers in the information and telecommunication systems field in the Yokohama
area to raise development efficiency. These centers will pursue development themes
for building social infrastructure IT platforms for social infrastructure and contribut-
ing to the cloud computing business.
Along with a greater focus on the Social Innovation Business, the Hitachi Group
will also prioritize investment in the Social Innovation field. In fiscal 2010, Hitachi
plans to increase the proportion of corporate research funding allocated to the
Social Innovation area, raising it from 40% in fiscal 2009 to 55%. And we plan to lift
R&D efficiency by enhancing priority research themes through the Special Research
Project scheme and by accelerating time-to-market through the Strategic Business
Project scheme.
In addition, Hitachi will fortify global R&D with the promotion of R&D linked to
expansion of the Social Innovation Business overseas. In North America, Hitachi will
pursue research in “green mobility,” which includes railways, construction machinery
and automotive systems, and in smart grids. In China, Hitachi is participating in the
Chinese National Development and Reform Commission project, conducting technol-
ogy exchange meetings and joint research.
In fiscal 2010, in order to expand globally competitive businesses, the Hitachi
Group is strengthening R&D on four fronts: (1) building IT platforms for social infra-
structure, (2) developing platform technologies to support IT-PIS (power & industrial
systems) fusion/environmental businesses, (3) conducting new electronics research
for the Social Innovation Business, and (4) strengthening green mobility R&D for
expanding environmental businesses.
R&D Expenditure and R&D Expenditure as a Percentage of Consolidated Revenues(billions of yen)
2005FY 2006 2007 2008 2009
405.0 412.5 428.1 416.5 372.4
4.3% 4.0%
3.8%
4.2% 4.2%
R&D Expenditure Percentage of Consolidated Revenues
Other 40%
Other 25%
Platform20%
Platform20%
Social Innovation40%
Social Innovation55%
Corporate R&D Funding Portfolio
FY2010
FY2009
34 Hitachi, Ltd. Annual Report 2010
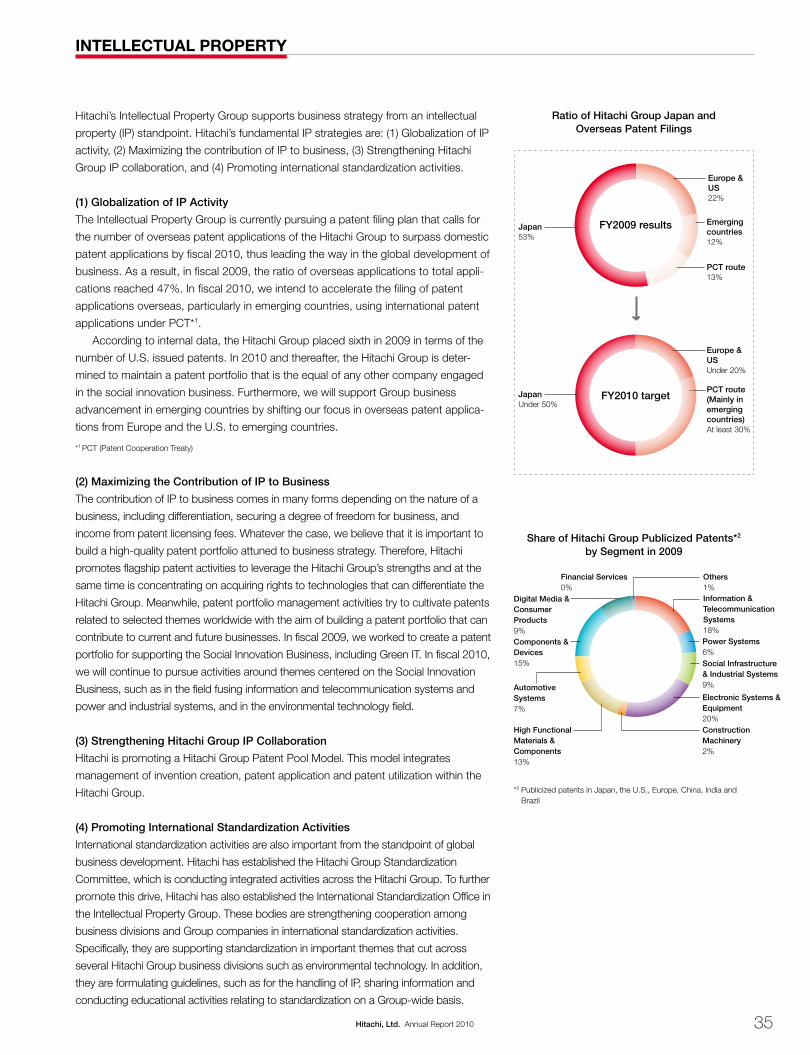
日本
PCT ルート
新興国
欧米
日本
PCT ルート主体
欧米
物流
金融
デジタル
コンポ
オート
高機能
建設
電子
社会産業
電力
情報
Intellectual pRopeRty
Hitachi’s Intellectual Property Group supports business strategy from an intellectual
property (IP) standpoint. Hitachi’s fundamental IP strategies are: (1) Globalization of IP
activity, (2) Maximizing the contribution of IP to business, (3) Strengthening Hitachi
Group IP collaboration, and (4) Promoting international standardization activities.
(1) Globalization of IP Activity
The Intellectual Property Group is currently pursuing a patent filing plan that calls for
the number of overseas patent applications of the Hitachi Group to surpass domestic
patent applications by fiscal 2010, thus leading the way in the global development of
business. As a result, in fiscal 2009, the ratio of overseas applications to total appli-
cations reached 47%. In fiscal 2010, we intend to accelerate the filing of patent
applications overseas, particularly in emerging countries, using international patent
applications under PCT*1.
According to internal data, the Hitachi Group placed sixth in 2009 in terms of the
number of U.S. issued patents. In 2010 and thereafter, the Hitachi Group is deter-
mined to maintain a patent portfolio that is the equal of any other company engaged
in the social innovation business. Furthermore, we will support Group business
advancement in emerging countries by shifting our focus in overseas patent applica-
tions from Europe and the U.S. to emerging countries.
*1 PCT (Patent Cooperation Treaty)
(2) Maximizing the Contribution of IP to Business
The contribution of IP to business comes in many forms depending on the nature of a
business, including differentiation, securing a degree of freedom for business, and
income from patent licensing fees. Whatever the case, we believe that it is important to
build a high-quality patent portfolio attuned to business strategy. Therefore, Hitachi
promotes flagship patent activities to leverage the Hitachi Group’s strengths and at the
same time is concentrating on acquiring rights to technologies that can differentiate the
Hitachi Group. Meanwhile, patent portfolio management activities try to cultivate patents
related to selected themes worldwide with the aim of building a patent portfolio that can
contribute to current and future businesses. In fiscal 2009, we worked to create a patent
portfolio for supporting the Social Innovation Business, including Green IT. In fiscal 2010,
we will continue to pursue activities around themes centered on the Social Innovation
Business, such as in the field fusing information and telecommunication systems and
power and industrial systems, and in the environmental technology field.
(3) Strengthening Hitachi Group IP Collaboration
Hitachi is promoting a Hitachi Group Patent Pool Model. This model integrates
management of invention creation, patent application and patent utilization within the
Hitachi Group.
(4) Promoting International Standardization Activities
International standardization activities are also important from the standpoint of global
business development. Hitachi has established the Hitachi Group Standardization
Committee, which is conducting integrated activities across the Hitachi Group. To further
promote this drive, Hitachi has also established the International Standardization Office in
the Intellectual Property Group. These bodies are strengthening cooperation among
business divisions and Group companies in international standardization activities.
Specifically, they are supporting standardization in important themes that cut across
several Hitachi Group business divisions such as environmental technology. In addition,
they are formulating guidelines, such as for the handling of IP, sharing information and
conducting educational activities relating to standardization on a Group-wide basis.
Japan53%
JapanUnder 50%
Emerging countries12%
PCT route13%
Europe & US22%
Europe & USUnder 20%
PCT route (Mainly in emerging countries)At least 30%
Ratio of Hitachi Group Japan and Overseas Patent Filings
FY2010 target
FY2009 results
Share of Hitachi Group Publicized Patents*2 by Segment in 2009
Information & Telecommunication Systems18%Power Systems6%Social Infrastructure & Industrial Systems9%
Electronic Systems & Equipment20%Construction Machinery2%
High Functional Materials & Components13%
Automotive Systems7%
Components & Devices15%
Digital Media & Consumer Products9%
Financial Services0%
Others1%
*2 Publicized patents in Japan, the U.S., Europe, China, India and Brazil
35Hitachi, Ltd. Annual Report 2010

The Hitachi Group’s Approach to CSROur corporate credo is to contribute to society through the development of superior,
original technology and products, and we have long cherished Hitachi’s founding
spirit encapsulated by the words “Harmony,” “Sincerity” and “Pioneering spirit.”
As defined by the Hitachi Group, CSR means promoting activities that increase
social, economic, environmental and human value. This requires a clear commitment
from top management and ongoing efforts to strengthen corporate governance,
based on a culture of compliance and high ethical values.
Our vision and mission is to harness the Hitachi Group’s collective knowledge and
technologies to address fundamental issues affecting the global community with the
aim of providing a safer and more pleasant life for all. To realize this philosophy and
mission and fulfill society’s expectations, we formulated the CSR Policy of the Hitachi
Group in March 2005 as a common policy platform to support the global CSR pro-
motion framework of the Hitachi Group.
CSR Medium-Term Plan—Formulation of Five-Year CSR Roadmap
The Hitachi Group established the Three-Year CSR Roadmap, a medium-term plan
for CSR, in fiscal 2006. Based on the roadmap, we reviewed various activities from
the standpoint of global society. We involved stakeholders, for example, in the CSR
activity decision-making process, and participated in and developed activities as part
of international initiatives. In fiscal 2009, we were selected as a component of the
Dow Jones Sustainability World Index (DJSI World), a leading global socially respon-
sible investment fund index, and we were awarded with SAM Silver Class status in
The Sustainability Yearbook 2010, which is published by Sustainability Asset
Management (SAM) and PricewaterhouseCoopers, providing a certain degree of
recognition for our past activities.
We have now formulated a Five-Year CSR Roadmap, beginning in fiscal 2010.
Aiming to transform into a truly global company, we will work diligently on many
fronts, including further strengthening the group management base, quantitatively
assessing our CSR activities, and enhancing corporate transparency.
The Hitachi Group believes corporate social responsibility (CSR) is founded on the understanding and actions of
each individual employee. A common CSR Policy of the Hitachi Group has been instituted since March 2005 to
support practical implementation of this approach across the Hitachi Group. With the aim of being an advanced
global enterprise in this field, we have also established the Five-Year CSR Roadmap as a medium-term CSR action
plan and are actively promoting CSR activities.
coRpoRate socIal ResponsIbIlIty
CSR Policy of the Hitachi Group
1. Commitment to Corporate Social Responsibility (CSR)
2. Contribution to Society through Our Business
3. Disclosure of Information and Stakeholder Engagement
4. Corporate Ethics and Human Rights
5. Environmental Conservation
6. Corporate Citizenship Activities
7. Working Environment
8. Responsible Partnership with Business Partners (Adopted March 2005)
Five-Year CSR Roadmap
April 2014April 2012 April 2013April 2011April 2010
Reinforce Group governance and globalize operations and activities
Integrate management strategies with CSR and instill CSR principles in operations
Collaborate with key stakeholders to resolve global social issues
Demonstrate leadership as a social innovation enterprise Becoming a
truly global corporation,
realizing “One Hitachi”
36 Hitachi, Ltd. Annual Report 2010
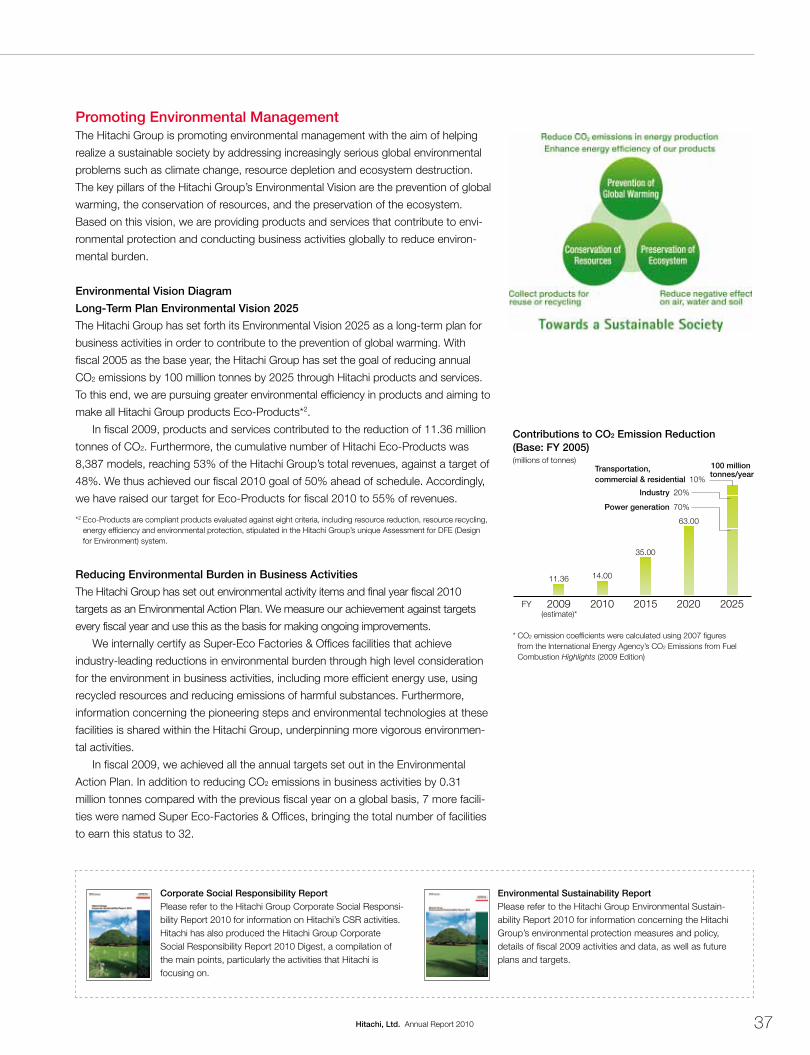
Promoting Environmental ManagementThe Hitachi Group is promoting environmental management with the aim of helping
realize a sustainable society by addressing increasingly serious global environmental
problems such as climate change, resource depletion and ecosystem destruction.
The key pillars of the Hitachi Group’s Environmental Vision are the prevention of global
warming, the conservation of resources, and the preservation of the ecosystem.
Based on this vision, we are providing products and services that contribute to envi-
ronmental protection and conducting business activities globally to reduce environ-
mental burden.
Environmental Vision Diagram
Long-Term Plan Environmental Vision 2025
The Hitachi Group has set forth its Environmental Vision 2025 as a long-term plan for
business activities in order to contribute to the prevention of global warming. With
fiscal 2005 as the base year, the Hitachi Group has set the goal of reducing annual
CO2 emissions by 100 million tonnes by 2025 through Hitachi products and services.
To this end, we are pursuing greater environmental efficiency in products and aiming to
make all Hitachi Group products Eco-Products*2.
In fiscal 2009, products and services contributed to the reduction of 11.36 million
tonnes of CO2. Furthermore, the cumulative number of Hitachi Eco- Products was
8,387 models, reaching 53% of the Hitachi Group’s total revenues, against a target of
48%. We thus achieved our fiscal 2010 goal of 50% ahead of schedule. Accordingly,
we have raised our target for Eco-Products for fiscal 2010 to 55% of revenues.
*2 Eco-Products are compliant products evaluated against eight criteria, including resource reduction, resource recycling, energy efficiency and environmental protection, stipulated in the Hitachi Group’s unique Assessment for DFE (Design for Environment) system.
Reducing Environmental Burden in Business Activities
The Hitachi Group has set out environmental activity items and final year fiscal 2010
targets as an Environmental Action Plan. We measure our achievement against targets
every fiscal year and use this as the basis for making ongoing improvements.
We internally certify as Super-Eco Factories & Offices facilities that achieve
industry-leading reductions in environmental burden through high level consideration
for the environment in business activities, including more efficient energy use, using
recycled resources and reducing emissions of harmful substances. Furthermore,
information concerning the pioneering steps and environmental technologies at these
facilities is shared within the Hitachi Group, underpinning more vigorous environmen-
tal activities.
In fiscal 2009, we achieved all the annual targets set out in the Environmental
Action Plan. In addition to reducing CO2 emissions in business activities by 0.31
million tonnes compared with the previous fiscal year on a global basis, 7 more facili-
ties were named Super Eco-Factories & Offices, bringing the total number of facilities
to earn this status to 32.
* CO2 emission coefficients were calculated using 2007 figures from the International Energy Agency’s CO2 Emissions from Fuel Combustion Highlights (2009 Edition)
Contributions to CO2 Emission Reduction (Base: FY 2005)(millions of tonnes)
2009FY 2010 2015 2020 2025
11.36 14.00
35.00
63.00
100 million tonnes/year
(estimate)*
Transportation, commercial & residential 10%
Industry 20%
Power generation 70%
Corporate Social Responsibility ReportPlease refer to the Hitachi Group Corporate Social Responsi-bility Report 2010 for information on Hitachi’s CSR activities. Hitachi has also produced the Hitachi Group Corporate Social Responsibility Report 2010 Digest, a compilation of the main points, particularly the activities that Hitachi is focusing on.
Environmental Sustainability ReportPlease refer to the Hitachi Group Environmental Sustain-ability Report 2010 for information concerning the Hitachi Group’s environmental protection measures and policy, details of fiscal 2009 activities and data, as well as future plans and targets.
37Hitachi, Ltd. Annual Report 2010

Corporate GovernanceHitachi, Ltd. (the “Company”) and its 10 publicly owned group companies have adopted the Committee System under the Companies Act of Japan (the “Companies Act”). By demarcating responsibilities for management oversight and those for the execution of business operations, Hitachi is working to create a framework for quick business operation, while making manage-ment highly transparent by having outside directors on the Board of Directors. Some of Hitachi’s directors and executive officers serve concurrently as directors and committee members at group companies. In addition, Hitachi is strengthening integrated man-agement of the group, improving management oversight of group companies and executing business strategies formulated to enable the Hitachi Group to demonstrate its collective strengths. The goal is higher corporate value.
Board of Directors and Executive OfficersThe Board of Directors determines basic management policies and supervises executive officers in the performance of their duties while entrusting to executive officers considerable authority to make decisions with respect to Hitachi’s business affairs. As of June 29, 2010, the Board of Directors was made up of 12 direc-tors, five of whom are from outside Hitachi. Three directors serve concurrently as executive officers. The Board Director (Chair) does not concurrently serve as an executive officer.
Within the Board of Directors, there are three statutory committees—the Nominating Committee, Audit Committee and Compensation Committee—with outside directors accounting for the majority of members of each committee. The Board of Directors met on 12 separate occasions during the fiscal year ended March 31, 2010, and the attendance rate of directors at those meetings was 95%. Full-time staff, who do not take orders from executive officers, have been assigned to assist the activities of the Board of Directors and these committees.
(1) Nominating CommitteeThe Nominating Committee has the authority to decide on the particulars of proposals submitted to the General Meeting of Shareholders for the appointment and dismissal of directors. The Nominating Committee consists of four directors, three of whom are outside directors.
The Nominating Committee met 6 times during the fiscal year ended March 31, 2010.
(2) Audit CommitteeThe Audit Committee audits the performance of directors and executive officers and has the authority to decide on proposals submitted to the General Meeting of Shareholders for the appoint-ment and dismissal of accounting auditors. The Audit Committee consists of five directors: three outside directors and two other directors who are full-time Audit Committee members.
The Audit Committee met 12 times during the fiscal year ended March 31, 2010.
(3) Compensation CommitteeThe Compensation Committee has the authority to determine remu-neration policies for directors and executive officers and remunera-tion for individuals based on them. The Compensation Committee consists of four directors, three of whom are outside directors.
The Compensation Committee met 5 times during the fiscal year ended March 31, 2010.
Executive officers execute Hitachi’s business affairs and decide on matters pertaining to the same in accordance with the division of duties stipulated by resolutions of the Board of Directors.
coRpoRate GoveRnance
Compensation for Directors and Executive Officers
PositionTotal Compensation
(¥ million)
Total Amount by Compensation Type (¥ million) Number of Eligible Directors and
Executive OfficersMonthly SalaryYear-end Allowance and
Performance-Linked Component
Directors (Excluding outside directors) 159 152 6 6
Outside directors 87 82 4 5
Executive officers 1,076 1,028 47 28
Total 1,322 1,264 57 39
Notes: 1. The number of directors indicated excludes the four directors who serve concurrently as executive officers. 2. The compensation to directors includes the monthly salary of one director, who retired due to expiration of his term of office at the close of the 140th ordinary general meeting of shareholders
held on June 23, 2009, for his term of office of this year. 3. The compensation to executive officers includes the monthly salary of one executive officer, who retired on June 23, 2009, for his term of office of this year. 4. In addition to the above, as a year-end allowance and performance-linked component for the previous fiscal year, in June 2009 the Company paid a year-end allowance of ¥20 million to 6
directors (excluding outside directors), a year-end allowance of ¥4 million to 5 outside directors and a performance-linked component of ¥37 million to 25 executive officers. 5. Regarding payments due to the abolition of retirement allowances, the Company makes payments when eligible directors or executive officers retire. As of March 31, 2010, the Company
had set aside retirement allowance reserves of ¥107 million for 3 directors (excluding outside directors), ¥9 million for 5 outside directors, and ¥914 million for 22 executive officers.
Directors or executive officers who received total compensation of at least ¥100 million and amounts are as follows:
Name Company PositionTotal Compensation
(¥ million)
Total Amount by Compensation Type (¥ million)
Monthly SalaryYear-end Allowance and
Performance-Linked Component
Takashi Kawamura Hitachi, Ltd. Executive officer (Note) 134 134 —
Note: Mr. Kawamura concurrently serves as a director, but does not receive compensation in this capacity.
38 Hitachi, Ltd. Annual Report 2010
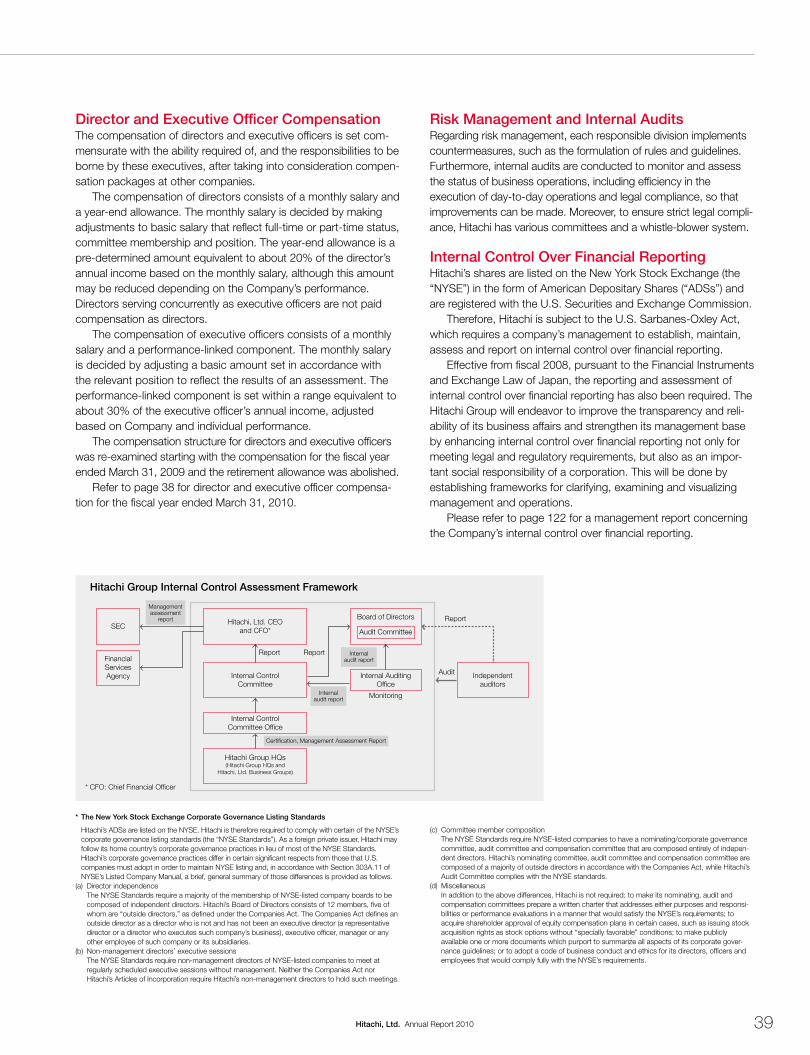
Director and Executive Officer CompensationThe compensation of directors and executive officers is set com-mensurate with the ability required of, and the responsibilities to be borne by these executives, after taking into consideration compen-sation packages at other companies.
The compensation of directors consists of a monthly salary and a year-end allowance. The monthly salary is decided by making adjustments to basic salary that reflect full-time or part-time status, committee membership and position. The year-end allowance is a pre-determined amount equivalent to about 20% of the director’s annual income based on the monthly salary, although this amount may be reduced depending on the Company’s performance. Directors serving concurrently as executive officers are not paid compensation as directors.
The compensation of executive officers consists of a monthly salary and a performance-linked component. The monthly salary is decided by adjusting a basic amount set in accordance with the relevant position to reflect the results of an assessment. The performance-linked component is set within a range equivalent to about 30% of the executive officer’s annual income, adjusted based on Company and individual performance.
The compensation structure for directors and executive officers was re-examined starting with the compensation for the fiscal year ended March 31, 2009 and the retirement allowance was abolished.
Refer to page 38 for director and executive officer compensa-tion for the fiscal year ended March 31, 2010.
Risk Management and Internal AuditsRegarding risk management, each responsible division implements countermeasures, such as the formulation of rules and guidelines. Furthermore, internal audits are conducted to monitor and assess the status of business operations, including efficiency in the execution of day-to-day operations and legal compliance, so that improvements can be made. Moreover, to ensure strict legal compli-ance, Hitachi has various committees and a whistle-blower system.
Internal Control Over Financial ReportingHitachi’s shares are listed on the New York Stock Exchange (the “NYSE”) in the form of American Depositary Shares (“ADSs”) and are registered with the U.S. Securities and Exchange Commission.
Therefore, Hitachi is subject to the U.S. Sarbanes-Oxley Act, which requires a company’s management to establish, maintain, assess and report on internal control over financial reporting.
Effective from fiscal 2008, pursuant to the Financial Instruments and Exchange Law of Japan, the reporting and assessment of internal control over financial reporting has also been required. The Hitachi Group will endeavor to improve the transparency and reli-ability of its business affairs and strengthen its management base by enhancing internal control over financial reporting not only for meeting legal and regulatory requirements, but also as an impor-tant social responsibility of a corporation. This will be done by establishing frameworks for clarifying, examining and visualizing management and operations.
Please refer to page 122 for a management report concerning the Company’s internal control over financial reporting.
* The New York Stock Exchange Corporate Governance Listing Standards
Hitachi’s ADSs are listed on the NYSE. Hitachi is therefore required to comply with certain of the NYSE’s corporate governance listing standards (the “NYSE Standards”). As a foreign private issuer, Hitachi may follow its home country’s corporate governance practices in lieu of most of the NYSE Standards. Hitachi’s corporate governance practices differ in certain significant respects from those that U.S. companies must adopt in order to maintain NYSE listing and, in accordance with Section 303A.11 of NYSE’s Listed Company Manual, a brief, general summary of those differences is provided as follows.
(a) Director independence The NYSE Standards require a majority of the membership of NYSE-listed company boards to be
composed of independent directors. Hitachi’s Board of Directors consists of 12 members, five of whom are “outside directors,” as defined under the Companies Act. The Companies Act defines an outside director as a director who is not and has not been an executive director (a representative director or a director who executes such company’s business), executive officer, manager or any other employee of such company or its subsidiaries.
(b) Non-management directors’ executive sessions The NYSE Standards require non-management directors of NYSE-listed companies to meet at
regularly scheduled executive sessions without management. Neither the Companies Act nor Hitachi’s Articles of Incorporation require Hitachi’s non-management directors to hold such meetings.
Hitachi Group Internal Control Assessment Framework
SEC
Financial Services Agency
Hitachi, Ltd. CEO and CFO*
Internal Control Committee
Internal Control Committee Office
Hitachi Group HQs(Hitachi Group HQs and
Hitachi, Ltd. Business Groups)
Board of Directors
Audit Committee
Internal Auditing Office
Independent auditors
Managementassessment
report
Internal audit report
Internal audit report
Report Report
Certification, Management Assessment Report
Report
Audit
Monitoring
* CFO: Chief Financial Officer
(c) Committee member composition The NYSE Standards require NYSE-listed companies to have a nominating/corporate governance
committee, audit committee and compensation committee that are composed entirely of indepen-dent directors. Hitachi’s nominating committee, audit committee and compensation committee are composed of a majority of outside directors in accordance with the Companies Act, while Hitachi’s Audit Committee complies with the NYSE standards.
(d) Miscellaneous In addition to the above differences, Hitachi is not required: to make its nominating, audit and
compensation committees prepare a written charter that addresses either purposes and responsi-bilities or performance evaluations in a manner that would satisfy the NYSE’s requirements; to acquire shareholder approval of equity compensation plans in certain cases, such as issuing stock acquisition rights as stock options without “specially favorable” conditions; to make publicly available one or more documents which purport to summarize all aspects of its corporate gover-nance guidelines; or to adopt a code of business conduct and ethics for its directors, officers and employees that would comply fully with the NYSE’s requirements.
39Hitachi, Ltd. Annual Report 2010

(As of July 1, 2010)
Board Director (Chair) Tadamichi Sakiyama
Directors Yoshie Ota Outside Director
Mitsuo Ohashi Outside Director, Advisor, Showa Denko K.K.
Akihiko Nomiyama Outside Director, Honorary Executive Consultant, JX Holdings, Inc.
Kenji Miyahara Outside Director, Honorary Adviser, Sumitomo Corporation
Tohru Motobayashi Outside Director, Attorney at law, Partner, Ihara and Motobayashi
Isao Ono Chairman of the Board, Hitachi Software Engineering Co., Ltd.
Takashi Kawamura* Representative Executive Officer and Chairman
Masaharu Sumikawa Chairman of the Board, Hitachi Plant Technologies, Ltd.
Hiroaki Nakanishi* Representative Executive Officer and President
Michiharu Nakamura
Takashi Miyoshi* Representative Executive Officer, Executive Vice President and Executive Officer
* Denotes directors who serve concurrently as executive officers.
Each committee is composed of the following members (Chairman underlined) Nominating Committee: Takashi Kawamura, Yoshie Ota, Mitsuo Ohashi, Tohru Motobayashi Audit Committee: Tadamichi Sakiyama, Yoshie Ota, Akihiko Nomiyama, Kenji Miyahara, Michiharu Nakamura Compensation Committee: Hiroaki Nakanishi, Akihiko Nomiyama, Kenji Miyahara, Tohru Motobayashi
Tadamichi Sakiyama
Takashi MiyoshiMichiharu Nakamura
Tohru Motobayashi
Yoshie Ota Mitsuo Ohashi Akihiko Nomiyama Kenji Miyahara
Takashi Kawamura Masaharu SumikawaIsao Ono
boaRd of dIRectoRs
Hiroaki Nakanishi
40 Hitachi, Ltd. Annual Report 2010

(As of July 1, 2010)
Representative Executive Officer and ChairmanTakashi Kawamura General Manager of Supervisory Office for Management Reforms
Representative Executive Officer and PresidentHiroaki Nakanishi Power Systems Business, Industrial & Social Infrastructure Systems Business
and Automotive Systems Business, General Manager of Supervisory Office for Overseas Plant Construction Business
Representative Executive Officers, Executive Vice Presidents and Executive Officers
Naoya Takahashi Information & Telecommunication Business, Information & Control Systems Business, Research & Development and Information Technology, General Manager of Supervisory Office for Business Coordination, Hitachi Group Chief Technology Officer, Hitachi Group Chief Innovation Officer, Hitachi Group Chief Information Security Officer and General Manager of Smart City Business Management Division
Takashi Hatchoji Urban Planning and Development Systems Business, Defense Systems Business, Corporate Planning, Environmental Strategies, Human Capital, Legal & Corporate Communications, Corporate Brand and Corporate Auditing, General Manager of Supervisory Office for Business Infrastructure, Hitachi Group Chief Environmental Strategy Officer, General Manager of Supervisory Office for Product Environmental Information
Takashi Miyoshi Management Reforms, Finance, Corporate Pension System, Business Development and Consumer Business, Deputy General Manager of Supervisory Office for Management Reforms and General Manager of Strategy & Project Office
Nobuo Mochida Corporate Planning, High Functional Materials & Components and Production Engineering, General Manager of Corporate Quality Assurance Division and Supervisory Office for MONOZUKURI, Deputy General Manager of Supervisory Office for Business Infrastructure, Chairman of the Board of Hitachi Metals, Ltd.
Kazuhiro Mori Motor Power Systems, Battery Systems Business, Sales Operations, Hitachi Group Global Business, Procurement, Medical Systems Business and Business Incubation, General Manager of Supervisory Office for Sales and Promotion and Corporate Export Regulation Division
Senior Vice Presidents and Executive OfficersTadahiko Ishigaki Chief Executive for the Americas
Stephen Gomersall Chief Executive for Europe
Yoshito Tsunoda President & CEO of Battery Systems Company, General Manager of Motor Power Systems Division, President and Chief Executive Officer of Hitachi Maxell, Ltd.
Junzo Nakajima President & CEO of Information & Telecommunication Systems Company
Representative Executive Officer, Senior Vice President and Executive Officer
Toyoaki Nakamura Corporate Pension System, General Manager of Finance & Accounting Group
Vice Presidents and Executive OfficersShigeru Azuhata Environmental Strategies, General Manager of Research &
Development Group and Medical Systems Business Division, Deputy General Manager of Supervisory Office for Business Coordination and Water Environment Solutions Division
Hitoshi Isa Chief Executive Officer of Thermal Power Systems, Power Systems Company
Shinjiro Iwata Chief Executive Officer of Service & Global Business, Information & Telecommunication Systems Company
Makoto Ebata Procurement
Osamu Ohno General Manager of Corporate Information Technology Group, Chief Innovation Officer of Power Systems Company
Kenji Ohno General Manager of Human Capital Group
Nobuyuki Ohno Chief Executive and Chief Innovation Officer for China
Masahiro Kitano Quality Assurance and Production Engineering, General Manager of Environmental Strategy Office, Deputy General Manager of Supervisory Office for Product Environmental Information, General Manager of MONOZUKURI Group and MONOZUKURI Engineering Division
Ryuichi Kitayama Deputy General Manager of Corporate Marketing Group, General Manager of Domestic Marketing Division and Customer Satisfaction Promotion Center
Toshiaki Kuzuoka Corporate Auditing, General Manager of Legal and Communications Group, Legal Division, Compliance Division and Centennial Project Division
Takao Koyama General Manager of Kansai Area Operation, Deputy General Manager of Corporate Marketing Group
Yutaka Saito President & CEO of Information & Control Systems Company, Deputy General Manager of Smart City Business Management Division
Kaichiro Sakuma Chief Executive Officer of Platform Business, Information & Telecommunication Systems Company
Gaku Suzuki President & CEO of Industrial & Social Infrastructure Systems Company, General Manager of Intercity Express Programme Division
Hideaki Takahashi President & CEO of Urban Planning and Development Systems Company
Koji Tanaka President & CEO of Power Systems Company, Deputy General Manager of Smart City Business Management Division, General Manager of Renewable Energy & Smart Grid Division, Power Systems Company
Masahide Tanigaki Corporate Export Regulation, General Manager of Corporate Marketing Group and International Marketing Division, Deputy General Manager of Supervisory Office for Sales and Promotion
Akira Maru Chief Executive Officer of Nuclear Systems, General Manager of Nuclear System Division, Power Systems Company
Yoshihiko Mogami Chief Executive Officer of System Solutions Business, Information & Telecommunication Systems Company
Takashi Miyoshi
Toyoaki NakamuraJunzo NakajimaYoshito TsunodaTadahiko Ishigaki
Hiroaki Nakanishi
Takashi Hatchoji
Stephen Gomersall
Nobuo Mochida Kazuhiro MoriNaoya Takahashi
Takashi Kawamura
executIve offIceRs
41Hitachi, Ltd. Annual Report 2010

We w i l l g ro w a s a w o r l d l e a d e r
i n t h e S o c i a l I n n o v a t i o n B u s i n e s s .
42 Hitachi, Ltd. Annual Report 2010
43Hitachi, Ltd. Annual Report 2010
Financial Section
44 Consolidated Balance Sheets
46 Consolidated Statements of Operations
47 Consolidated Statements of Equity
50 Consolidated Statements of Cash Flows
51 Notes to Consolidated Financial Statements
122 Management’s Report on Internal Control Over Financial Reporting
123 Report of Independent Registered Public Accounting Firm
126 Five-Year Summary
CONtENtS

44 Hitachi, Ltd. Annual Report 2010
Consolidated Balance SheetsHitachi, Ltd. and Subsidiaries March 31, 2010 and 2009
AssetsMillions of yen
Thousands of U.S. dollars (note 3)
2010 2009 2010
Current assets:
Cash and cash equivalents . . . . . . . . . . . . . . . . . . . . . . . . . . . . . . . . . . . . . ¥ 577,584 ¥ 807,926 $ 6,210,581
Short-term investments (note 4) . . . . . . . . . . . . . . . . . . . . . . . . . . . . . . . . . . 53,575 8,654 576,075
Trade receivables, net of allowance for doubtful receivables of ¥43,470 million ($467,419 thousand) for 2010 and ¥46,486 million for 2009:
Notes (notes 7 and 18) . . . . . . . . . . . . . . . . . . . . . . . . . . . . . . . . . . . . . . . 104,353 105,218 1,122,075
Accounts (note 7) . . . . . . . . . . . . . . . . . . . . . . . . . . . . . . . . . . . . . . . . . . . 2,138,139 2,028,060 22,990,742
Investments in leases (notes 6 and 7) . . . . . . . . . . . . . . . . . . . . . . . . . . . . . . 194,108 170,340 2,087,183
Inventories (note 5) . . . . . . . . . . . . . . . . . . . . . . . . . . . . . . . . . . . . . . . . . . . . 1,222,077 1,456,271 13,140,613
Prepaid expenses and other current assets (note 9) . . . . . . . . . . . . . . . . . . . 485,361 488,930 5,218,935
Total current assets . . . . . . . . . . . . . . . . . . . . . . . . . . . . . . . . . . . . . . . . 4,775,197 5,065,399 51,346,204
Investments and advances, including affiliated companies (note 4) . . . . . . . . . 712,993 693,487 7,666,591
Property, plant and equipment (note 6):
Land . . . . . . . . . . . . . . . . . . . . . . . . . . . . . . . . . . . . . . . . . . . . . . . . . . . . . . 471,123 464,935 5,065,839
Buildings . . . . . . . . . . . . . . . . . . . . . . . . . . . . . . . . . . . . . . . . . . . . . . . . . . . 1,931,104 1,915,992 20,764,559
Machinery and equipment . . . . . . . . . . . . . . . . . . . . . . . . . . . . . . . . . . . . . . 5,554,953 5,640,623 59,730,678
Construction in progress . . . . . . . . . . . . . . . . . . . . . . . . . . . . . . . . . . . . . . . 62,717 86,842 674,376
8,019,897 8,108,392 86,235,452
Less accumulated depreciation . . . . . . . . . . . . . . . . . . . . . . . . . . . . . . . . . . 5,800,093 5,714,446 62,366,592
Net property, plant and equipment . . . . . . . . . . . . . . . . . . . . . . . . . . . . 2,219,804 2,393,946 23,868,860
Intangible assets:
Goodwill (note 8) . . . . . . . . . . . . . . . . . . . . . . . . . . . . . . . . . . . . . . . . . . . . . 190,254 134,430 2,045,742
Other intangible assets (note 8) . . . . . . . . . . . . . . . . . . . . . . . . . . . . . . . . . . 315,094 320,665 3,388,108
Total intangible assets . . . . . . . . . . . . . . . . . . . . . . . . . . . . . . . . . . . . . . 505,348 455,095 5,433,850
Other assets (notes 6, 9 and 11) . . . . . . . . . . . . . . . . . . . . . . . . . . . . . . . . . . . 738,420 795,782 7,940,000
Total assets . . . . . . . . . . . . . . . . . . . . . . . . . . . . . . . . . . . . . . . . . . . . . . ¥8,951,762 ¥9,403,709 $96,255,505
See accompanying notes to consolidated financial statements.

45Hitachi, Ltd. Annual Report 2010
Liabilities and EquityMillions of yen
Thousands of U.S. dollars (note 3)
2010 2009 2010
Current liabilities:
Short-term debt (note 10) . . . . . . . . . . . . . . . . . . . . . . . . . . . . . . . . . . . . . . ¥ 451,451 ¥ 998,822 $ 4,854,312
Current portion of long-term debt (notes 6 and 10) . . . . . . . . . . . . . . . . . . . 303,730 531,635 3,265,914
Trade payables:
Notes . . . . . . . . . . . . . . . . . . . . . . . . . . . . . . . . . . . . . . . . . . . . . . . . . . . . 25,737 39,811 276,742
Accounts . . . . . . . . . . . . . . . . . . . . . . . . . . . . . . . . . . . . . . . . . . . . . . . . . 1,229,546 1,138,770 13,220,925
Accrued expenses (notes 11 and 18) . . . . . . . . . . . . . . . . . . . . . . . . . . . . . . 919,849 878,454 9,890,849
Income taxes (note 9) . . . . . . . . . . . . . . . . . . . . . . . . . . . . . . . . . . . . . . . . . . 50,446 24,689 542,430
Advances received . . . . . . . . . . . . . . . . . . . . . . . . . . . . . . . . . . . . . . . . . . . . 385,199 386,519 4,141,925
Other current liabilities (note 9) . . . . . . . . . . . . . . . . . . . . . . . . . . . . . . . . . . . 565,245 623,204 6,077,903
Total current liabilities . . . . . . . . . . . . . . . . . . . . . . . . . . . . . . . . . . . . . . 3,931,203 4,621,904 42,271,000
Long-term debt (notes 6 and 10) . . . . . . . . . . . . . . . . . . . . . . . . . . . . . . . . . . . 1,611,962 1,289,652 17,332,925
Retirement and severance benefits (note 11) . . . . . . . . . . . . . . . . . . . . . . . . . . 905,183 1,049,597 9,733,150
Other liabilities (note 9) . . . . . . . . . . . . . . . . . . . . . . . . . . . . . . . . . . . . . . . . . . . 235,569 263,204 2,533,000
Total liabilities . . . . . . . . . . . . . . . . . . . . . . . . . . . . . . . . . . . . . . . . . . . . 6,683,917 7,224,357 71,870,075
Equity:
Common stock 4,518,132,365 and 3,368,126,056 shares issued as of March 31, 2010 and 2009, respectively (notes 10 and 12) . . . . . . . . . . . 408,810 282,033 4,395,807
Capital surplus (notes 12 and 13) . . . . . . . . . . . . . . . . . . . . . . . . . . . . . . . . . 620,577 560,066 6,672,871
Legal reserve and retained earnings (note 14) . . . . . . . . . . . . . . . . . . . . . . . 713,479 820,440 7,671,817
Accumulated other comprehensive loss (note 16) . . . . . . . . . . . . . . . . . . . . (432,057) (586,351) (4,645,774)
Treasury stock, at cost (note 15) . . . . . . . . . . . . . . . . . . . . . . . . . . . . . . . . . (26,151) (26,237) (281,194)
Total Hitachi, Ltd. stockholders’ equity . . . . . . . . . . . . . . . . . . . . . . . . . 1,284,658 1,049,951 13,813,527
Noncontrolling interests . . . . . . . . . . . . . . . . . . . . . . . . . . . . . . . . . . . . 983,187 1,129,401 10,571,903
Total equity . . . . . . . . . . . . . . . . . . . . . . . . . . . . . . . . . . . . . . . . . . . . . . 2,267,845 2,179,352 24,385,430
Commitments and contingencies (note 18)
Total liabilities and equity . . . . . . . . . . . . . . . . . . . . . . . . . . . . . . . . . . . . ¥8,951,762 ¥9,403,709 $96,255,505
See accompanying notes to consolidated financial statements.

46 Hitachi, Ltd. Annual Report 2010
Consolidated Statements of OperationsHitachi, Ltd. and Subsidiaries Years ended March 31, 2010, 2009 and 2008
Millions of yenThousands of
U.S. dollars (note 3)
2010 2009 2008 2010
Revenues:
Product sales . . . . . . . . . . . . . . . . . . . . . . . . . . . . . . . . . . . . ¥ 8,044,971 ¥ 9,076,913 ¥10,262,690 $ 86,505,064
Financial and other services . . . . . . . . . . . . . . . . . . . . . . . . . 923,575 923,456 964,045 9,930,914
Total revenues . . . . . . . . . . . . . . . . . . . . . . . . . . . . . . . . . 8,968,546 10,000,369 11,226,735 96,435,978
Cost of sales:
Product sales . . . . . . . . . . . . . . . . . . . . . . . . . . . . . . . . . . . . (6,185,937) (7,153,228) (8,080,728) (66,515,451)
Financial and other services . . . . . . . . . . . . . . . . . . . . . . . . . (663,318) (662,952) (696,929) (7,132,452)
Total cost of sales . . . . . . . . . . . . . . . . . . . . . . . . . . . . . . . (6,849,255) (7,816,180) (8,777,657) (73,647,903)
Selling, general and administrative expenses . . . . . . . . . . . . . . (1,917,132) (2,057,043) (2,103,562) (20,614,323)
Impairment losses for long-lived assets (note 19) . . . . . . . . . . . (25,196) (128,400) (87,549) (270,925)
Restructuring charges (note 20) . . . . . . . . . . . . . . . . . . . . . . . . (25,154) (22,927) (18,110) (270,473)
Interest income . . . . . . . . . . . . . . . . . . . . . . . . . . . . . . . . . . . . 12,017 19,177 31,501 129,215
Dividends income . . . . . . . . . . . . . . . . . . . . . . . . . . . . . . . . . . 5,799 8,544 6,031 62,355
Gains on sales of stock by subsidiaries or affiliated companies (note 22) . . . . . . . . . . . . . . . . . . . . . . . . . 183 360 3,846 1,968
Other income (note 21) . . . . . . . . . . . . . . . . . . . . . . . . . . . . . . 186 5,203 101,169 2,000
Interest charges . . . . . . . . . . . . . . . . . . . . . . . . . . . . . . . . . . . . (26,252) (33,809) (42,448) (282,279)
Other deductions (note 21) . . . . . . . . . . . . . . . . . . . . . . . . . . . (21,976) (102,960) (37,760) (236,301)
Equity in net earnings (loss) of affiliated companies . . . . . . . . . (58,186) (162,205) 22,586 (625,656)
Income (loss) before income taxes . . . . . . . . . . . . . . . . . . . . 63,580 (289,871) 324,782 683,656
Income taxes (note 9) . . . . . . . . . . . . . . . . . . . . . . . . . . . . . . . (147,971) (505,249) (272,163) (1,591,086)
Net income (loss) . . . . . . . . . . . . . . . . . . . . . . . . . . . . . . . . . (84,391) (795,120) 52,619 (907,430)
Less net income (loss) attributable to noncontrolling interests . . 22,570 (7,783) 110,744 242,688
Net loss attributable to Hitachi, Ltd. . . . . . . . . . . . . . . . . . . . ¥ (106,961) ¥ (787,337) ¥ (58,125) $ (1,150,118)
Net loss attributable to Hitachi, Ltd. stockholders per share (note 23): Yen U.S. dollars (note 3)
Basic . . . . . . . . . . . . . . . . . . . . . . . . . . . . . . . . . . . . . . . . . . ¥(29.20) ¥(236.86) ¥(17.48) $(0.31)
Diluted . . . . . . . . . . . . . . . . . . . . . . . . . . . . . . . . . . . . . . . . . (29.20) (236.87) (17.77) (0.31)
See accompanying notes to consolidated financial statements.
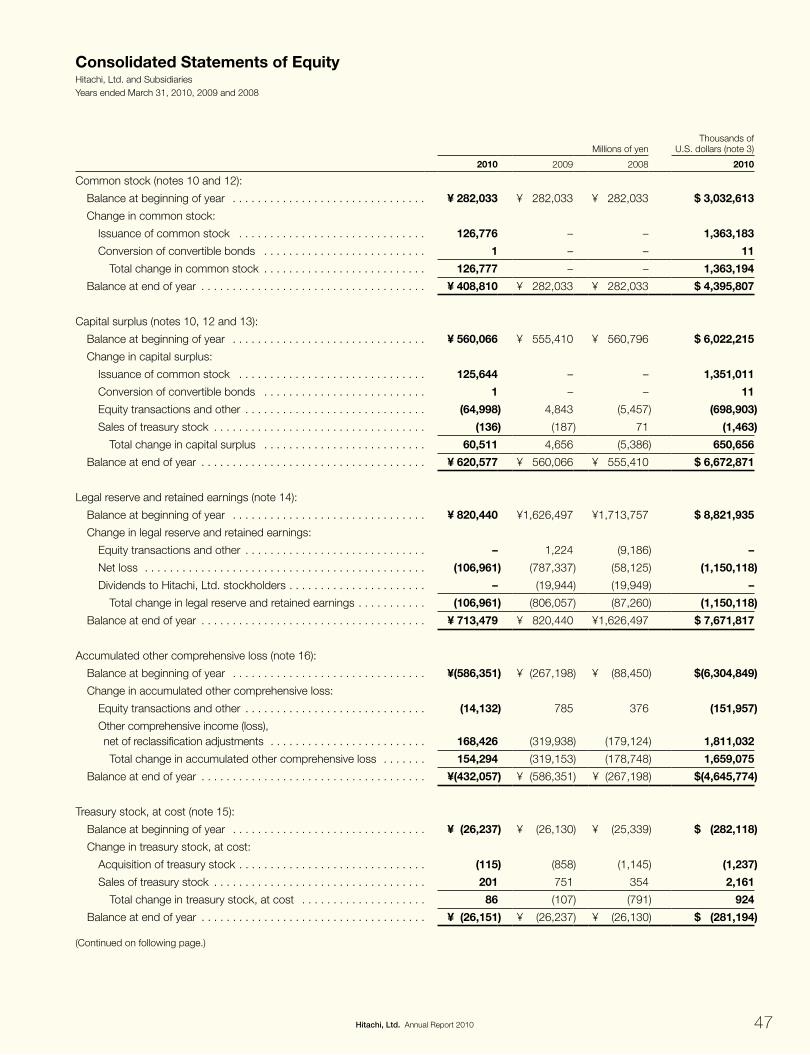
47Hitachi, Ltd. Annual Report 2010
Consolidated Statements of EquityHitachi, Ltd. and Subsidiaries Years ended March 31, 2010, 2009 and 2008
Millions of yenThousands of
U.S. dollars (note 3)
2010 2009 2008 2010
Common stock (notes 10 and 12):
Balance at beginning of year . . . . . . . . . . . . . . . . . . . . . . . . . . . . . . . ¥ 282,033 ¥ 282,033 ¥ 282,033 $ 3,032,613
Change in common stock:
Issuance of common stock . . . . . . . . . . . . . . . . . . . . . . . . . . . . . . 126,776 – – 1,363,183
Conversion of convertible bonds . . . . . . . . . . . . . . . . . . . . . . . . . . 1 – – 11
Total change in common stock . . . . . . . . . . . . . . . . . . . . . . . . . . 126,777 – – 1,363,194
Balance at end of year . . . . . . . . . . . . . . . . . . . . . . . . . . . . . . . . . . . . ¥ 408,810 ¥ 282,033 ¥ 282,033 $ 4,395,807
Capital surplus (notes 10, 12 and 13):
Balance at beginning of year . . . . . . . . . . . . . . . . . . . . . . . . . . . . . . . ¥ 560,066 ¥ 555,410 ¥ 560,796 $ 6,022,215
Change in capital surplus:
Issuance of common stock . . . . . . . . . . . . . . . . . . . . . . . . . . . . . . 125,644 – – 1,351,011
Conversion of convertible bonds . . . . . . . . . . . . . . . . . . . . . . . . . . 1 – – 11
Equity transactions and other . . . . . . . . . . . . . . . . . . . . . . . . . . . . . (64,998) 4,843 (5,457) (698,903)
Sales of treasury stock . . . . . . . . . . . . . . . . . . . . . . . . . . . . . . . . . . (136) (187) 71 (1,463)
Total change in capital surplus . . . . . . . . . . . . . . . . . . . . . . . . . . 60,511 4,656 (5,386) 650,656
Balance at end of year . . . . . . . . . . . . . . . . . . . . . . . . . . . . . . . . . . . . ¥ 620,577 ¥ 560,066 ¥ 555,410 $ 6,672,871
Legal reserve and retained earnings (note 14):
Balance at beginning of year . . . . . . . . . . . . . . . . . . . . . . . . . . . . . . . ¥ 820,440 ¥1,626,497 ¥1,713,757 $ 8,821,935
Change in legal reserve and retained earnings:
Equity transactions and other . . . . . . . . . . . . . . . . . . . . . . . . . . . . . – 1,224 (9,186) –
Net loss . . . . . . . . . . . . . . . . . . . . . . . . . . . . . . . . . . . . . . . . . . . . . (106,961) (787,337) (58,125) (1,150,118)
Dividends to Hitachi, Ltd. stockholders . . . . . . . . . . . . . . . . . . . . . . – (19,944) (19,949) –
Total change in legal reserve and retained earnings . . . . . . . . . . . (106,961) (806,057) (87,260) (1,150,118)
Balance at end of year . . . . . . . . . . . . . . . . . . . . . . . . . . . . . . . . . . . . ¥ 713,479 ¥ 820,440 ¥1,626,497 $ 7,671,817
Accumulated other comprehensive loss (note 16):
Balance at beginning of year . . . . . . . . . . . . . . . . . . . . . . . . . . . . . . . ¥(586,351) ¥ (267,198) ¥ (88,450) $(6,304,849)
Change in accumulated other comprehensive loss:
Equity transactions and other . . . . . . . . . . . . . . . . . . . . . . . . . . . . . (14,132) 785 376 (151,957)
Other comprehensive income (loss), net of reclassification adjustments . . . . . . . . . . . . . . . . . . . . . . . . . 168,426 (319,938) (179,124) 1,811,032
Total change in accumulated other comprehensive loss . . . . . . . 154,294 (319,153) (178,748) 1,659,075
Balance at end of year . . . . . . . . . . . . . . . . . . . . . . . . . . . . . . . . . . . . ¥(432,057) ¥ (586,351) ¥ (267,198) $(4,645,774)
Treasury stock, at cost (note 15):
Balance at beginning of year . . . . . . . . . . . . . . . . . . . . . . . . . . . . . . . ¥ (26,237) ¥ (26,130) ¥ (25,339) $ (282,118)
Change in treasury stock, at cost:
Acquisition of treasury stock . . . . . . . . . . . . . . . . . . . . . . . . . . . . . . (115) (858) (1,145) (1,237)
Sales of treasury stock . . . . . . . . . . . . . . . . . . . . . . . . . . . . . . . . . . 201 751 354 2,161
Total change in treasury stock, at cost . . . . . . . . . . . . . . . . . . . . 86 (107) (791) 924
Balance at end of year . . . . . . . . . . . . . . . . . . . . . . . . . . . . . . . . . . . . ¥ (26,151) ¥ (26,237) ¥ (26,130) $ (281,194)
(Continued on following page.)

48 Hitachi, Ltd. Annual Report 2010
Millions of yenThousands of
U.S. dollars (note 3)
2010 2009 2008 2010
Total Hitachi, Ltd. stockholders’ equity:
Balance at beginning of year . . . . . . . . . . . . . . . . . . . . . . . . . . . . . . ¥1,049,951 ¥ 2,170,612 ¥2,442,797 $11,289,796
Change in total Hitachi, Ltd. stockholders’ equity:
Issuance of common stock . . . . . . . . . . . . . . . . . . . . . . . . . . . . . 252,420 – – 2,714,194
Conversion of convertible bonds . . . . . . . . . . . . . . . . . . . . . . . . . 2 – – 22
Equity transactions and other . . . . . . . . . . . . . . . . . . . . . . . . . . . . (79,130) 6,852 (14,267) (850,860)
Net loss . . . . . . . . . . . . . . . . . . . . . . . . . . . . . . . . . . . . . . . . . . . . (106,961) (787,337) (58,125) (1,150,118)
Other comprehensive income (loss), net of reclassification adjustments . . . . . . . . . . . . . . . . . . . . . . . 168,426 (319,938) (179,124) 1,811,032
Dividends to Hitachi, Ltd. stockholders . . . . . . . . . . . . . . . . . . . . . – (19,944) (19,949) –
Acquisition of treasury stock . . . . . . . . . . . . . . . . . . . . . . . . . . . . . (115) (858) (1,145) (1,237)
Sales of treasury stock . . . . . . . . . . . . . . . . . . . . . . . . . . . . . . . . . 65 564 425 698
Total change in total Hitachi, Ltd. stockholders’ equity . . . . . . . 234,707 (1,120,661) (272,185) 2,523,731
Balance at end of year . . . . . . . . . . . . . . . . . . . . . . . . . . . . . . . . . . . ¥1,284,658 ¥ 1,049,951 ¥2,170,612 $13,813,527
Noncontrolling interests (note 13):
Balance at beginning of year . . . . . . . . . . . . . . . . . . . . . . . . . . . . . . ¥1,129,401 ¥ 1,142,508 ¥1,073,749 $12,144,097
Change in noncontrolling interests:
Equity transactions and other . . . . . . . . . . . . . . . . . . . . . . . . . . . . (174,675) 90,750 25,158 (1,878,226)
Net income (loss) . . . . . . . . . . . . . . . . . . . . . . . . . . . . . . . . . . . . . 22,570 (7,783) 110,744 242,688
Other comprehensive income (loss), net of reclassification adjustments . . . . . . . . . . . . . . . . . . . . . . . 30,509 (67,668) (41,356) 328,054
Dividends to noncontrolling interests . . . . . . . . . . . . . . . . . . . . . . (24,618) (28,406) (25,787) (264,710)
Total change in noncontrolling interests . . . . . . . . . . . . . . . . . . . (146,214) (13,107) 68,759 (1,572,194)
Balance at end of year . . . . . . . . . . . . . . . . . . . . . . . . . . . . . . . . . . . ¥ 983,187 ¥ 1,129,401 ¥1,142,508 $10,571,903
Total equity:
Balance at beginning of year . . . . . . . . . . . . . . . . . . . . . . . . . . . . . . ¥2,179,352 ¥ 3,313,120 ¥3,516,546 $23,433,893
Change in total equity:
Issuance of common stock . . . . . . . . . . . . . . . . . . . . . . . . . . . . . . 252,420 – – 2,714,194
Conversion of convertible bonds . . . . . . . . . . . . . . . . . . . . . . . . . 2 – – 22
Equity transactions and other . . . . . . . . . . . . . . . . . . . . . . . . . . . . (253,805) 97,602 10,891 (2,729,086)
Net income (loss) . . . . . . . . . . . . . . . . . . . . . . . . . . . . . . . . . . . . . (84,391) (795,120) 52,619 (907,430)
Other comprehensive income (loss), net of reclassification adjustments . . . . . . . . . . . . . . . . . . . . . . . 198,935 (387,606) (220,480) 2,139,086
Dividends to Hitachi, Ltd. stockholders . . . . . . . . . . . . . . . . . . . . . – (19,944) (19,949) –
Dividends to noncontrolling interests . . . . . . . . . . . . . . . . . . . . . . (24,618) (28,406) (25,787) (264,710)
Acquisition of treasury stock . . . . . . . . . . . . . . . . . . . . . . . . . . . . . (115) (858) (1,145) (1,237)
Sales of treasury stock . . . . . . . . . . . . . . . . . . . . . . . . . . . . . . . . . 65 564 425 698
Total change in total equity . . . . . . . . . . . . . . . . . . . . . . . . . . . . 88,493 (1,133,768) (203,426) 951,537
Balance at end of year . . . . . . . . . . . . . . . . . . . . . . . . . . . . . . . . . . . ¥2,267,845 ¥ 2,179,352 ¥3,313,120 $24,385,430
(Continued on following page.)
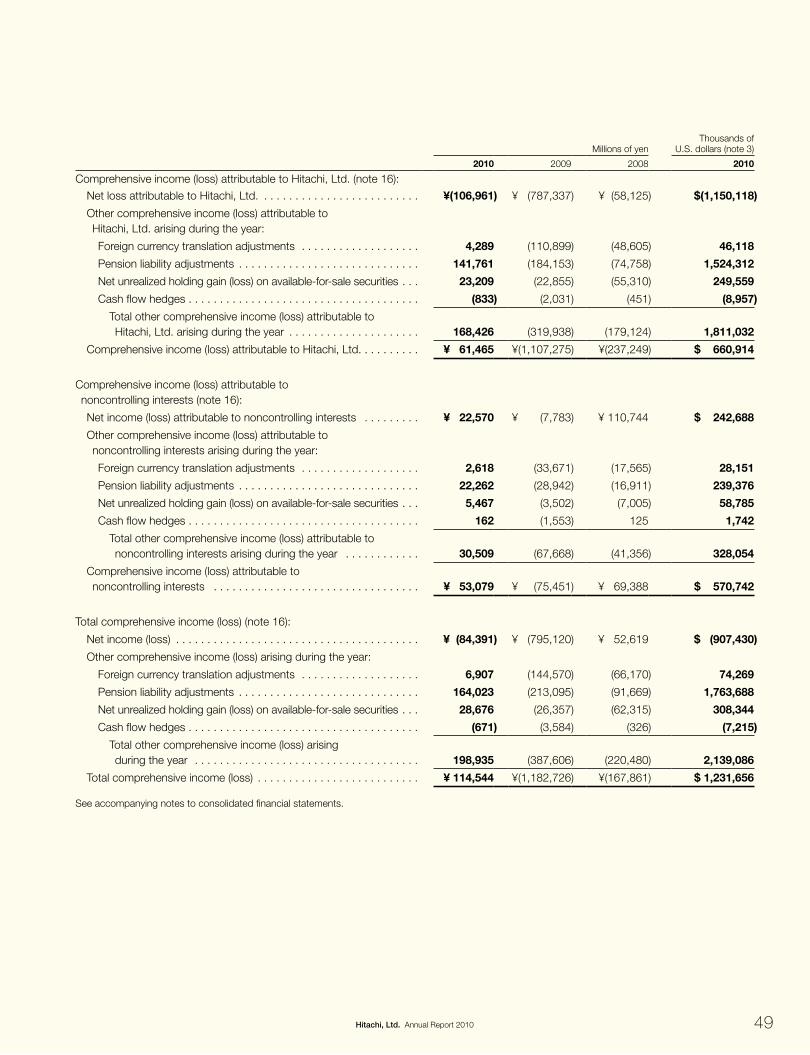
49Hitachi, Ltd. Annual Report 2010
Millions of yenThousands of
U.S. dollars (note 3)
2010 2009 2008 2010
Comprehensive income (loss) attributable to Hitachi, Ltd. (note 16):
Net loss attributable to Hitachi, Ltd. . . . . . . . . . . . . . . . . . . . . . . . . . ¥(106,961) ¥ (787,337) ¥ (58,125) $(1,150,118)
Other comprehensive income (loss) attributable to Hitachi, Ltd. arising during the year:
Foreign currency translation adjustments . . . . . . . . . . . . . . . . . . . 4,289 (110,899) (48,605) 46,118
Pension liability adjustments . . . . . . . . . . . . . . . . . . . . . . . . . . . . . 141,761 (184,153) (74,758) 1,524,312
Net unrealized holding gain (loss) on available-for-sale securities . . . 23,209 (22,855) (55,310) 249,559
Cash flow hedges . . . . . . . . . . . . . . . . . . . . . . . . . . . . . . . . . . . . . (833) (2,031) (451) (8,957)
Total other comprehensive income (loss) attributable to Hitachi, Ltd. arising during the year . . . . . . . . . . . . . . . . . . . . . 168,426 (319,938) (179,124) 1,811,032
Comprehensive income (loss) attributable to Hitachi, Ltd. . . . . . . . . . ¥ 61,465 ¥(1,107,275) ¥(237,249) $ 660,914
Comprehensive income (loss) attributable to noncontrolling interests (note 16):
Net income (loss) attributable to noncontrolling interests . . . . . . . . . ¥ 22,570 ¥ (7,783) ¥ 110,744 $ 242,688
Other comprehensive income (loss) attributable to noncontrolling interests arising during the year:
Foreign currency translation adjustments . . . . . . . . . . . . . . . . . . . 2,618 (33,671) (17,565) 28,151
Pension liability adjustments . . . . . . . . . . . . . . . . . . . . . . . . . . . . . 22,262 (28,942) (16,911) 239,376
Net unrealized holding gain (loss) on available-for-sale securities . . . 5,467 (3,502) (7,005) 58,785
Cash flow hedges . . . . . . . . . . . . . . . . . . . . . . . . . . . . . . . . . . . . . 162 (1,553) 125 1,742
Total other comprehensive income (loss) attributable to noncontrolling interests arising during the year . . . . . . . . . . . . 30,509 (67,668) (41,356) 328,054
Comprehensive income (loss) attributable to noncontrolling interests . . . . . . . . . . . . . . . . . . . . . . . . . . . . . . . . . ¥ 53,079 ¥ (75,451) ¥ 69,388 $ 570,742
Total comprehensive income (loss) (note 16):
Net income (loss) . . . . . . . . . . . . . . . . . . . . . . . . . . . . . . . . . . . . . . . ¥ (84,391) ¥ (795,120) ¥ 52,619 $ (907,430)
Other comprehensive income (loss) arising during the year:
Foreign currency translation adjustments . . . . . . . . . . . . . . . . . . . 6,907 (144,570) (66,170) 74,269
Pension liability adjustments . . . . . . . . . . . . . . . . . . . . . . . . . . . . . 164,023 (213,095) (91,669) 1,763,688
Net unrealized holding gain (loss) on available-for-sale securities . . . 28,676 (26,357) (62,315) 308,344
Cash flow hedges . . . . . . . . . . . . . . . . . . . . . . . . . . . . . . . . . . . . . (671) (3,584) (326) (7,215)
Total other comprehensive income (loss) arising during the year . . . . . . . . . . . . . . . . . . . . . . . . . . . . . . . . . . . . 198,935 (387,606) (220,480) 2,139,086
Total comprehensive income (loss) . . . . . . . . . . . . . . . . . . . . . . . . . . ¥ 114,544 ¥(1,182,726) ¥(167,861) $ 1,231,656
See accompanying notes to consolidated financial statements.

50 Hitachi, Ltd. Annual Report 2010
Consolidated Statements of Cash FlowsHitachi, Ltd. and Subsidiaries Years ended March 31, 2010, 2009 and 2008
Millions of yenThousands of
U.S. dollars (note 3)
2010 2009 2008 2010
Cash flows from operating activities (note 25): Net income (loss) . . . . . . . . . . . . . . . . . . . . . . . . . . . . . . . . . . . . . . . . . . . . . . ¥ (84,391) ¥(795,120) ¥ 52,619 $ (907,430) Adjustments to reconcile net income (loss) to net cash provided by operating activities: Depreciation . . . . . . . . . . . . . . . . . . . . . . . . . . . . . . . . . . . . . . . . . . . . . . . . 441,697 478,759 541,470 4,749,430 Amortization . . . . . . . . . . . . . . . . . . . . . . . . . . . . . . . . . . . . . . . . . . . . . . . . 116,065 178,164 146,136 1,248,011 Impairment losses for long-lived assets . . . . . . . . . . . . . . . . . . . . . . . . . . . 25,196 128,400 87,549 270,925 Deferred income taxes . . . . . . . . . . . . . . . . . . . . . . . . . . . . . . . . . . . . . . . . 60,440 403,968 84,587 649,892 Equity in net (earnings) loss of affiliated companies . . . . . . . . . . . . . . . . . . . 58,186 162,205 (22,586) 625,656 Gain on sale of investments in securities and other . . . . . . . . . . . . . . . . . . . (6,061) (1,353) (94,798) (65,172) Impairment of investments in securities . . . . . . . . . . . . . . . . . . . . . . . . . . . 9,585 45,016 14,411 103,065 Loss on disposal of rental assets and other property . . . . . . . . . . . . . . . . . 22,670 24,483 13,424 243,763 (Increase) decrease in receivables . . . . . . . . . . . . . . . . . . . . . . . . . . . . . . . . (138,785) 342,008 47,843 (1,492,312) (Increase) decrease in inventories . . . . . . . . . . . . . . . . . . . . . . . . . . . . . . . . 205,848 (57,206) (107,546) 2,213,419 (Increase) decrease in prepaid expenses and other current assets . . . . . . . 8,687 12,772 (32,763) 93,409 Increase (decrease) in payables . . . . . . . . . . . . . . . . . . . . . . . . . . . . . . . . . 62,295 (359,230) 42,453 669,839 Increase (decrease) in accrued expenses and retirement and severance benefits . . . . . . . . . . . . . . . . . . . . . . . . . . . . . . . . . . . . . . . . . . 69,724 (27,050) (38,303) 749,720 Increase (decrease) in accrued income taxes . . . . . . . . . . . . . . . . . . . . . . . 17,249 (76,343) 12,841 185,473 Increase (decrease) in other liabilities . . . . . . . . . . . . . . . . . . . . . . . . . . . . . (83,519) 39,711 61,041 (898,054) Net change in inventory-related receivables from financial services . . . . . . . (17,935) 2,117 (11,392) (192,849) Other . . . . . . . . . . . . . . . . . . . . . . . . . . . . . . . . . . . . . . . . . . . . . . . . . . . . . 31,348 57,646 (5,149) 337,075 Net cash provided by operating activities . . . . . . . . . . . . . . . . . . . . . . . . 798,299 558,947 791,837 8,583,860
Cash flows from investing activities (note 25): Capital expenditures . . . . . . . . . . . . . . . . . . . . . . . . . . . . . . . . . . . . . . . . . . . (286,259) (422,109) (474,344) (3,078,054) Purchase of intangible assets . . . . . . . . . . . . . . . . . . . . . . . . . . . . . . . . . . . . . (85,092) (107,949) (94,327) (914,968) Purchase of tangible assets and software to be leased . . . . . . . . . . . . . . . . . (271,341) (357,079) (425,384) (2,917,645) Proceeds from disposal of property, plant and equipment . . . . . . . . . . . . . . . 20,821 13,110 36,834 223,882 Proceeds from disposal of tangible assets and software to be leased . . . . . . 22,672 33,401 26,233 243,785 Collection of investments in leases . . . . . . . . . . . . . . . . . . . . . . . . . . . . . . . . . 172,327 234,984 311,321 1,852,978 Purchase of investments in securities and shares of newly consolidated subsidiaries . . . . . . . . . . . . . . . . . . . . . . . . . . . . . . . . . . (156,989) (60,337) (275,140) (1,688,054) Proceeds from sale of investments in securities and shares of consolidated subsidiaries resulting in deconsolidation . . . . . . . . . . . . . . . . . 27,410 112,771 104,878 294,731 Advance received for sale of investment in affiliated company – – 43,155 – Other . . . . . . . . . . . . . . . . . . . . . . . . . . . . . . . . . . . . . . . . . . . . . . . . . . . . . . . 25,856 3,200 57,458 278,022 Net cash used in investing activities . . . . . . . . . . . . . . . . . . . . . . . . . . . . (530,595) (550,008) (689,316) (5,705,323)
Cash flows from financing activities (note 25): Increase (decrease) in short-term debt, net . . . . . . . . . . . . . . . . . . . . . . . . . . (551,044) 314,899 (200,018) (5,925,204) Proceeds from long-term debt . . . . . . . . . . . . . . . . . . . . . . . . . . . . . . . . . . . . 656,768 467,341 404,190 7,062,022 Payments on long-term debt . . . . . . . . . . . . . . . . . . . . . . . . . . . . . . . . . . . . . (565,212) (441,550) (381,069) (6,077,548) Proceeds from issuance of common stock . . . . . . . . . . . . . . . . . . . . . . . . . . 252,420 – – 2,714,194 Proceeds from sale of common stock by subsidiaries . . . . . . . . . . . . . . . . . . 504 900 42,307 5,419 Dividends paid to Hitachi, Ltd. stockholders . . . . . . . . . . . . . . . . . . . . . . . . . . (134) (19,826) (19,889) (1,441) Dividends paid to noncontrolling interests . . . . . . . . . . . . . . . . . . . . . . . . . . . (24,852) (28,406) (25,787) (267,226) Acquisition of common stock for treasury . . . . . . . . . . . . . . . . . . . . . . . . . . . . (115) (841) (1,145) (1,237) Proceeds from sales of treasury stock . . . . . . . . . . . . . . . . . . . . . . . . . . . . . . 65 564 425 698 Purchase of shares of consolidated subsidiaries from noncontrolling interest holders . . . . . . . . . . . . . . . . . . . . . . . . . . . . . . . . . . . (261,113) – (19,422) (2,807,666) Proceeds from sale of shares of consolidated subsidiaries to noncontrolling interest holders . . . . . . . . . . . . . . . . . . . . . . . . . . . . . . . . . . . 1,886 – 71,120 20,280 Other . . . . . . . . . . . . . . . . . . . . . . . . . . . . . . . . . . . . . . . . . . . . . . . . . . . . . . . (11,517) (8,693) (4,570) (123,839) Net cash provided by (used in) financing activities . . . . . . . . . . . . . . . . . . (502,344) 284,388 (133,858) (5,401,548)
Effect of exchange rate changes on cash and cash equivalents . . . . . . . . . . . . . 4,298 (46,361) (25,569) 46,215Net increase (decrease) in cash and cash equivalents . . . . . . . . . . . . . . . . . . . . (230,342) 246,966 (56,906) (2,476,796)Cash and cash equivalents at beginning of year . . . . . . . . . . . . . . . . . . . . . . . . 807,926 560,960 617,866 8,687,377Cash and cash equivalents at end of year . . . . . . . . . . . . . . . . . . . . . . . . . . . . . ¥ 577,584 ¥ 807,926 ¥ 560,960 $ 6,210,581
See accompanying notes to consolidated financial statements.

51Hitachi, Ltd. Annual Report 2010
Notes to Consolidated Financial StatementsHitachi, Ltd. and Subsidiaries
1. NAturE OF OpErAtiONS
Hitachi, Ltd. (the Company) is a Japanese corporation, whose principal office is located in Japan. The Company’s and its subsidiaries’ businesses are diverse, and include information and telecommunication systems, power systems, social infrastructure and industrial systems, electronic systems and equipment, construction machinery, high functional materials and components, automotive systems, components and devices, digital media and consumer products, financial services, and others including logistics services.
2. BASiS OF prESENtAtiON ANd SummAry OF SigNiFiCANt ACCOuNtiNg pOLiCiES
(a) Basis of PresentationThe Company and its domestic subsidiaries keep their books of account in accordance with the financial accounting standards of Japan, and its foreign subsidiaries in accordance with those of the countries of their domicile.
The consolidated financial statements presented herein have been prepared in a manner and reflect the adjustments which are necessary to conform them with accounting principles generally accepted in the United States of America. Management of the Company has made a number of estimates and assumptions relating to the reporting of assets and liabilities and the disclosure of contingent assets and liabilities to prepare these financial statements. Actual results could differ from those estimates.
(b) Accounting Standards Codification issued by the FASBThe Company adopted the Accounting Standards Codification (ASC) issued by the Financial Accounting Standards Board (the FASB) during the year ended March 31, 2010. The ASC is established as the source of authoritative accounting principles recognized by the FASB to be applied by nongovernmental entities in the preparation of financial statements in conformity with accounting principles generally accepted in the United States. Rules and interpretive releases of the United States Securities and Exchange Commission (the SEC) under authority of federal securities laws are also sources of authoritative accounting principles generally accepted in the United States for SEC registrants. The FASB will no longer issue new standards in the form of Statements, FASB Staff Positions, or Emerging Issues Task Force Abstracts; instead the FASB will issue Accounting Standards Updates (ASUs). ASUs will not be authoritative. Instead, they will only serve to update the ASC. These changes and the ASC itself do not change accounting principles generally accepted in the United States. Other than the manner in which accounting guidance is referenced, the adoption of these changes had no effect on the Company’s consolidated financial statements.
(c) Principles of ConsolidationThe consolidated financial statements include the accounts of the Company, its majority-owned subsidiaries and all variable interest entities (VIEs) for which the Company or any of its consolidated entities is the primary beneficiary. The definition of a VIE is included in ASC 810, “Consolidation.” This guidance addresses how a business enterprise should evaluate whether it has a controlling financial interest in an entity through means other than voting rights and accordingly should consolidate the entity. The consolidated financial statements include accounts of certain subsidiaries whose closing dates differ from March 31 by 93 days or less to either comply with local statutory requirements or facilitate timely reporting. There have been no significant transactions, which would materially affect the Company’s financial position and results of operations, with such subsidiaries during the period from their closing dates to March 31. Intercompany accounts and significant intercompany transactions have been eliminated in consolidation.
Investments in corporate joint ventures and affiliated companies, where the Company has the ability to exercise significant influence over operational and financial policies generally by holding 20–50% ownership, are accounted for under the equity method. Investments where the Company does not have significant influence are accounted for under the cost method.
(d) Cash EquivalentsFor the purpose of the statement of cash flows, the Company considers all highly liquid investments with insignificant risk of changes in value which have initial maturities of three months or less when purchased to be cash equivalents.

52 Hitachi, Ltd. Annual Report 2010
(e) Allowance for Doubtful ReceivablesAllowance for doubtful receivables, including both trade receivables and investments in leases, is the Company’s and subsidiaries’ best estimate of the amount of probable credit losses in their existing receivables. The allowance is determined based on, but not limited to, historical collection experience adjusted for the effects of the current economic environment, assessment of inherent risks, aging and financial performance of debtors. Account balances are charged off against the allowance after all means of collection have been exhausted and the potential for recovery is considered remote.
(f) Foreign Currency TranslationForeign currency financial statements have been translated in accordance with ASC 830, “Foreign Currency Matters.” Under this guidance, the assets and liabilities of the Company’s subsidiaries located outside Japan are translated into Japanese yen at the rates of exchange in effect at the balance sheet date. Income and expense items are translated at the average exchange rates prevailing during the year. Gains and losses resulting from foreign currency transactions are included in other income (deductions), and those resulting from translation of financial statements are excluded from the consolidated statements of operations and included in accumulated other comprehensive loss.
(g) Investments in Securities and Affiliated CompaniesEquity securities that do not have readily determinable fair values, except for equity-method investments, are accounted for under the cost method. The Company classifies investments in equity securities that have readily determinable fair values and all investments in debt securities in three categories: held-to-maturity securities, trading securities and available-for-sale securities.
Held-to-maturity securities are debt securities that the Company has the positive intent and ability to hold to maturity. Trading securities are debt and equity securities that are bought and held principally for the purpose of selling them in the near term. Available-for-sale securities are debt and equity securities not classified as either held-to-maturity securities or trading securities.
Held-to-maturity securities are reported at amortized cost. Trading securities are reported at fair value, with unrealized gains and losses included in earnings. Available-for-sale securities are reported at fair value, with unrealized gains and losses excluded from earnings and reported in accumulated other comprehensive loss.
On a continuous basis, but no less frequently than at the end of each quarter period, the Company evaluates available-for-sale securities, held-to-maturity securities and cost-method investments for possible impairment. If the fair value of any available-for-sale security, held-to-maturity security or cost-method investment is less than the cost basis or the amortized cost basis, the Company assesses whether the impairment is temporary or other-than-temporary. Fair value is determined based on quoted market prices, projected discounted cash flows or other valuation techniques as appropriate. For certain cost-method investments for which it is not practicable to estimate the fair value, if an event or change in circumstances has occurred that may have a significant adverse effect on the fair value of the investment, the Company estimates the fair value of such investments.
Factors considered in determining whether an impairment of an equity security classified as available-for-sale or a cost-method investment is temporary or other-than-temporary include: the length of time and extent to which the fair value of the investment has been less than cost, the financial condition and near-term prospects of the issuer, and the intent and ability to retain the investment in the issuer for a period of time sufficient to allow for any anticipated recovery in fair value. A decline in fair value of an equity security classified as an available-for-sale security or cost-method investment below its cost basis that is deemed to be other-than-temporary results in a write-down of the cost basis to fair value as a new cost basis and the amount of the write-down is included in earnings. The new cost basis of the investment is not adjusted for subsequent recoveries in fair value.
Factors considered in assessing whether an impairment of a debt security classified as either available-for-sale or held-to-maturity is temporary or other-than-temporary include: whether there is intent to sell the impaired debt security, it is more likely than not that the impaired debt security will be required to be sold before recovery, or the holder is not expected to recover the entire amortized cost basis of the security for any other reason. If the best estimate of the present value of cash flows expected to be collected is less than the amortized cost basis of the security, such a difference represents the credit loss component of the impairment. If an other-than-temporary impairment has occurred, the amount of the other-than-temporary impairment recognized in earnings depends on whether the Company intends to sell the security or it is more

53Hitachi, Ltd. Annual Report 2010
likely than not that the Company will be required to sell the security before recovery of its amortized cost basis less any current-period credit loss. If the Company does not intend to sell the security and it is not more likely than not that the Company will be required to sell the security before recovery of its amortized cost basis less any current-period loss, the component of the other-than-temporary impairment related to the credit loss is recognized in earnings and the component of the other-than-temporary impairment related to other factors is recognized in accumulated other comprehensive loss. The previous amortized cost basis less the other-than-temporary impairment recognized in earnings becomes the new amortized cost basis of the investment. That new amortized cost basis is not adjusted for subsequent recoveries in fair value. However, the new amortized cost basis is adjusted for accretion and amortization as if the debt security had been purchased on the date of the other-than temporary impairment at an amortized cost basis equal to the previous amortized cost basis less the other-than-temporary impairment recognized in earnings.
On a continuous basis, but no less frequently than at the end of each quarter period, the Company evaluates the carrying amount of its ownership interests in equity-method investees for possible impairment. Factors considered in assessing whether an indication of other-than-temporary impairment exists include the achievement of business plan objectives and milestones including cash flow projections and the results of planned financing activities, the financial condition and prospects of each investee company, the fair value of the ownership interest relative to the carrying amount of the investment, the period of time during which the fair value of the ownership interest has been below the carrying amount of the investment and other relevant factors. Impairment to be recognized is measured based on the amount by which the carrying amount of the investment exceeds the fair value of the investment. Fair value is determined based on quoted market prices, projected discounted cash flows or other valuation techniques as appropriate.
The cost of a security sold or the amount reclassified out of accumulated other comprehensive loss into earnings is determined by the average cost method.
(h) SecuritizationsThe Company and certain subsidiaries have a number of securitization programs. Under those programs, certain financial assets such as lease receivables, trade receivables and others are sold to Special Purpose Entities (SPEs) which are mainly funded through the issuance of asset-backed securities to investors. When a transfer of financial assets is eligible to be accounted for as a sale under ASC 860, “Transfers and Servicing,” the carrying amount of the financial assets is allocated based on relative fair values to the portions to be retained and sold. The Company and its subsidiaries recognize a gain or loss for the difference between the net proceeds received and the allocated carrying amount of the assets sold when the transaction is consummated. Initially recorded at the allocated carrying amount in the period of securitizations, the amount of retained interests that can contractually be prepaid or otherwise settled in such a way that the holder would not recover all of its recorded interests is subsequently recorded at fair value as of the balance sheet date in the same manner as available-for-sale securities.
Fair values are based on the present value of estimated future cash flows which take into consideration various factors such as expected credit loss and others.
( i ) InventoriesInventories are stated at the lower of cost or market. Cost is determined by the specific identification method for job order inventories and generally by the average cost method for raw materials and other inventories.
(j) Property, Plant and EquipmentProperty, plant and equipment are stated at cost. Property, plant and equipment are principally depreciated using the declining-balance method, except for some assets which are depreciated using the straight-line method, mainly over the following estimated useful lives:
Buildings Buildings and building equipment . . . . . . . . . . . . . . . . . . . . . . . . . . . . . . . . . . . . . . . . . . . . . . 3 to 50 years Structures . . . . . . . . . . . . . . . . . . . . . . . . . . . . . . . . . . . . . . . . . . . . . . . . . . . . . . . . . . . . . . . 7 to 60 yearsMachinery and equipment Machinery . . . . . . . . . . . . . . . . . . . . . . . . . . . . . . . . . . . . . . . . . . . . . . . . . . . . . . . . . . . . . . . 4 to 15 years Vehicles . . . . . . . . . . . . . . . . . . . . . . . . . . . . . . . . . . . . . . . . . . . . . . . . . . . . . . . . . . . . . . . . . 4 to 7 years Tools, furniture and fixtures . . . . . . . . . . . . . . . . . . . . . . . . . . . . . . . . . . . . . . . . . . . . . . . . . . . 2 to 20 years

54 Hitachi, Ltd. Annual Report 2010
(k) Goodwill and Other Intangible AssetsThe Company tests goodwill and indefinite-lived intangible assets for impairment at least annually. The Company performs its annual impairment test mainly during the fourth quarter after the annual forecasting process is completed. Furthermore, goodwill is reviewed for impairment whenever events or changes in circumstances indicate that the carrying value may not be recoverable. The impairment test consists of two steps. In the first step, the Company compares the fair value of each reporting unit to its carrying value. The Company has certain operating segments and, in identifying the reporting unit for the purpose of testing goodwill for impairment, considers disaggregating those operating segments into economically dissimilar components based on specific facts and circumstances, especially the level at which performance of the operating segments are reviewed, how many businesses are included in the operating segments, and the economic similarity of those businesses. In assigning goodwill to reporting units, the Company considers which reporting units are expected to benefit from the synergies of the combination in a manner similar to how the amount of goodwill is recognized in a business combination. The Company determines the fair value of its reporting units mainly using an income approach (i.e., present value technique). When determining such fair value, the Company may, however, also use the fair value of that unit based on a comparison of comparable publicly traded companies or based on that unit’s stand-alone market capitalization. If the carrying value of the net assets assigned to the reporting unit exceeds the fair value of the reporting unit, then the Company performs the second step of the impairment test in order to determine the implied fair value of the reporting unit’s goodwill. If the carrying value of a reporting unit’s goodwill exceeds its implied fair value, the Company records an impairment loss equal to the difference. Intangible assets with finite useful lives are amortized over their respective estimated useful lives on either a straight-line basis or the method that reflects the pattern in which the economic benefits of the intangible assets are consumed or otherwise used up. The principal estimated useful lives are as follows:
Software . . . . . . . . . . . . . . . . . . . . . . . . . . . . . . . . . . . . . . . . . . . . . . . . . . . . . . . . . . . . . . . . 1 to 10 years Software for internal use . . . . . . . . . . . . . . . . . . . . . . . . . . . . . . . . . . . . . . . . . . . . . . . . . . . . . 3 to 10 years Patents . . . . . . . . . . . . . . . . . . . . . . . . . . . . . . . . . . . . . . . . . . . . . . . . . . . . . . . . . . . . . . . . . . 5 to 8 years Other . . . . . . . . . . . . . . . . . . . . . . . . . . . . . . . . . . . . . . . . . . . . . . . . . . . . . . . . . . . . . . . . . . . 2 to 20 years
(l) Capitalized Software CostsCosts incurred for computer software developed or obtained for internal use are capitalized and amortized on a straight-line basis over their estimated useful lives in accordance with ASC 350, “Intangibles—Goodwill and Other.” In addition, the Company and its subsidiaries develop certain computer software to be sold where related costs are capitalized after establishment of technological feasibility in accordance with ASC 985, “Software.” The annual amortization of such capitalized costs is the greater of the amount computed using the ratio of each software’s current year gross revenues to the total of current and anticipated future gross revenues or the straight-line method over the remaining estimated economic life of each software product.
(m) Impairment of Long-lived AssetsThe Company reviews the carrying value of long-lived assets or a related group of assets to be held and used, including intangible assets with finite useful lives, for impairment whenever events or circumstances occur that indicate that the carrying value of the assets may not be recoverable. The assets are considered to be impaired when estimated undiscounted cash flows expected to result from the use of the assets and their eventual disposition is less than their carrying values. The impairment losses are measured as the amount by which the carrying value of the asset or asset group exceeds the fair value. In determining the fair value, the Company uses available quoted market prices and present value techniques, if appropriate, based on the estimated future cash flows expected to result from the use of the assets and their eventual disposition.
(n) Retirement and Severance BenefitsThe Company accounts for retirement and severance benefits in accordance with ASC 715, “Compensation—Retirement Benefits.” Actuarial gains and losses and prior service benefit and cost included in accumulated other comprehensive loss are amortized using the straight-line method over the average remaining service period of active employees.

55Hitachi, Ltd. Annual Report 2010
(o) Environmental LiabilitiesThe cost for environmental remediation liabilities is accrued when it is probable that the Company will incur environmental assessments or cleanup costs and the amounts can be reasonably estimated. The cost for liabilities is estimated based on the circumstances, the available information and current law, and the liabilities are not discounted to their present values.
(p) Derivative Financial InstrumentsThe Company accounts for derivative financial instruments in accordance with ASC 815, “Derivatives and Hedging.” This guidance requires that all derivative financial instruments, such as forward exchange and interest rate swap contracts, be recognized in the financial statements as either assets or liabilities and measured at fair value regardless of the purpose or intent for holding them.
The Company designates and accounts for hedging derivatives as follows:
• “Fairvalue”hedge:ahedgeofthefairvalueofarecognizedassetorliabilityorofanunrecognizedfirmcommitment.Thechanges in fair value of the recognized assets or liabilities or unrecognized firm commitments and the related derivatives are both recorded in earnings if the hedge is considered highly effective.
• “Cashflow”hedge:ahedgeofaforecastedtransactionorofthevariabilityofcashflowstobereceivedorpaidrelatedtoa recognized asset or liability. The changes in the fair value of the derivatives designated as cash flow hedges are recorded as other comprehensive income if the hedge is considered highly effective. This treatment is continued until earnings are affected by the variability in cash flows or the unrecognized firm commitment of the designated hedged item, at which point changes in fair value of the derivative are recognized in income.
• “Foreigncurrency”hedge:ahedgeofforeign-currencyfairvalueorcashflow.Thechangesinfairvalueoftherecognizedassets or liabilities or unrecognized firm commitments and the derivatives are recorded as either earnings or other comprehensive income (loss) if the hedge is considered highly effective. Recognition as earnings or other comprehensive income (loss) is dependent on the treatment of foreign currency hedges as either fair value or cash flow hedges.
The Company follows the documentation requirements as prescribed by the guidance, which includes risk management objective and strategy for undertaking various hedge transactions. In addition, a formal assessment is made at the hedge’s inception and periodically on an ongoing basis, as to whether the derivative used in hedging activities is highly effective in offsetting changes in fair values or cash flows of hedged items. Hedge accounting is discontinued for ineffective hedges, if any. Subsequent changes in the fair value of derivatives related to discontinued hedges are recognized in earnings immediately.
The Company classifies cash flows from derivatives as cash flows from operating activities in the consolidated statements of cash flows.
(q) Revenue RecognitionThe Company recognizes revenue when persuasive evidence of an arrangement exists, delivery has occurred or services have been rendered, the sales price is fixed or determinable, and collectibility is reasonably assured.
The Company offers multiple solutions to meet its customers’ needs. Those solutions may involve the delivery or performance of multiple elements, such as products, services, or rights to use assets, and performance may occur at different points in time or over different periods of time. When one element is delivered prior to the other in an arrangement, revenue is deferred until the delivery of the last element, unless transactions are such that the delivered item has value to the customer on a standalone basis, there is objective and reliable evidence of the fair value of the undelivered item, and delivery or performance of the undelivered item is considered probable and substantially in the control of the Company if the arrangement includes a general right of return relative to the delivered item. If all conditions described above are met, each element in an arrangement is considered a separate unit of accounting, and the arrangement consideration is allocated to the separate units of accounting based on the relative fair values provided that there is objective and reliable evidence of the fair values of all units of accounting in the arrangement. The Company allocates revenue for software arrangements involving multiple elements to each element based on its relative fair value, as evidenced by vendor specific objective evidence (VSOE), or in the absence of VSOE of the delivered elements, the residual method. VSOE is the price charged by the Company to an external customer for the same element when such an element is sold separately.

56 Hitachi, Ltd. Annual Report 2010
Product Sales:
Revenue from sales of products is recognized when title and risk of loss have been transferred to the customer depending upon the terms of the contract or arrangement with the customer. The Company’s policy is not to accept product returns unless the products are defective. The conditions of delivery are governed by the terms of the contract or customer arrangement and those not meeting the predetermined specification are not recorded as revenue. When the final payment is subject to customer acceptance, a portion of revenue for the amount of the final payment is deferred until an enforceable claim has become effective. Product warranties are offered on the Company’s and certain subsidiaries’ products and a warranty accrual is established when sales are recognized based on estimated future costs of repair and replacement principally using historical experience of warranty claims. Revenue from separately priced extended warranty and product maintenance contracts is deferred and recognized in income on a straight-line basis over the contract period except in those circumstances in which sufficient historical evidence indicates that the costs of performing services under the contract are incurred on other than a straight-line basis.
Price protection is provided to retailers of the Company’s consumer products business and others to compensate the customer retailers for a decline in the product’s value due mainly to competition. Price protection granted to the customers is classified as a reduction of revenue in the consolidated statements of operations. In addition, it is the Company’s policy to accrue reasonably and reliably estimated price adjustments at the later of the date at which the related sales are recognized, or the date at which price protection is offered. The estimate is made based primarily upon historical experience or agreement on the adjustment rate and the number of units that are subject to such adjustment (e.g., units in distribution channels).
Product revenues which are recognized upon delivery, installation or acceptance by the customer include information technology system products, construction equipment, displays, disk drives, televisions, air conditioners, batteries, magnetic tapes, high functional materials, cable products, automotive equipment, semiconductor manufacturing equipment, test and measurement equipment, railway vehicles, medical electronic devices, industrial machinery and equipment, elevators and escalators.
Revenue from sales of tangible products under long-term construction type arrangements, in connection with the construction of nuclear, thermal and hydroelectric power plants, are recognized under the percentage-of-completion method. Under the percentage-of-completion method, revenue is recognized as a percentage of estimated total revenue that incurred costs to date bear to estimated total costs after giving effect to estimates of costs to complete based upon the most recent information. Any anticipated losses on fixed price contracts are charged to operations when such losses can be estimated. Provisions are made for contingencies (i.e. performance penalty, benchmarking, etc.) in the period in which they become known pursuant to specific contract terms and conditions and are estimable. When reasonably dependable estimates of contract revenues and costs and the extent of progress toward completion do not exist, the completed-contract method of accounting is applied. A contract is complete when either acceptance by the customer is given or compliance with performance specification is achieved, whichever is appropriate under the relevant contractual terms.
The Company recognizes software revenue in accordance with the provisions of ASC 985, “Software.” Revenue from software consists primarily of software licensing, customized software development and post contract customer support. Revenues from software license arrangements are recognized upon delivery of the software if evidence of the arrangement exists, pricing is fixed or determinable and collectibility is reasonably assured. Revenue from a software arrangement that requires significant production, modification or customization of software is recognized using the percentage-of-completion method provided that reasonably dependable estimates related to contract revenue, cost and the extent of progress toward completion exist. Otherwise, the completed-contract method is applied. Customization of software is considered substantially completed when an acceptance by the customer occurs. Revenue from post contract customer support is amortized over the period of the post contract customer support. Consulting and training services revenues are recognized when the services are rendered.
Service Revenues:
Service revenues from maintenance and distribution services are recognized upon completion of service delivery. Revenue from time-based service contracts is recognized as services are rendered. Revenue from long-term fixed price service contracts such as support or maintenance contracts is recognized ratably over the contractual period. If historical data shows that the accrual of service cost is not fixed and the service is rendered in proportion to the accrual of the cost for the service, revenue is recognized based on the pattern of the cost accrual. Finance lease income is recognized at level rates of return over the term of the leases. Operating lease income is recognized on a straight-line basis over the term of the lease.
57Hitachi, Ltd. Annual Report 2010
(r) Shipping and Handling CostsShipping and handling costs are expensed as incurred and included in selling, general and administrative expenses.
(s) AdvertisingAdvertising costs are expensed as incurred.
(t) Research and Development CostsResearch and development costs are expensed as incurred. Costs incurred in connection with the development of software products for sale or lease to others are accounted for in accordance with ASC 985, “Software.” Development costs incurred in the research and development of new software products and enhancements to existing products are expensed as incurred until technological feasibility has been established.
(u) Income TaxesDeferred income taxes are accounted for under the asset and liability method in accordance with ASC 740, “Income Taxes.” Deferred tax assets and liabilities are recognized for the future tax consequences attributable to differences between the financial statement carrying amounts of existing assets and liabilities and their respective tax bases and operating losses and tax credit carryforwards. Under this method, deferred tax assets and liabilities are measured using enacted tax rates expected to apply to taxable income in the years in which those temporary differences are expected to be recovered or settled. Under ASC 740, the effect on deferred tax assets and liabilities of a change in tax rates is recognized in income in the period that includes the enactment date. Valuation allowances are established to reduce deferred tax assets to their net realizable value if it is more likely than not that some portion or all of the deferred tax assets will not be realized.
Tax positions that are more likely than not to be sustained upon examination by tax authorities are recognized in the financial statements in accordance with the provisions of ASC 740. Tax positions that meet the more-likely-than-not recognition threshold are measured as the largest amount of tax benefit that is greater than 50 percent likely of being realized upon ultimate settlement with tax authorities. Interest accrued related to unrecognized tax benefits and penalties are included in income taxes in the consolidated statements of operations.
(v) Sales of Stock by SubsidiariesPrior to the adoption of the provisions regarding noncontrolling interests in a subsidiary of ASC 810, the Company elected to recognize the change in its proportionate share of a subsidiary’s equity resulting from issuance of stock by the subsidiary in the consolidated statements of operations.
(w) Consumption TaxConsumption tax collected and remitted to taxing authorities is excluded from revenues, cost of sales and expenses in the consolidated statements of operations.
(x) Net Income Attributable to Hitachi, Ltd. stockholders Per ShareNet income attributable to Hitachi, Ltd. stockholders per share is computed in accordance with ASC 260, “Earnings Per Share.” This guidance requires a dual presentation of basic and diluted net income attributable to Hitachi, Ltd. stockholders per share amounts on the face of the statements of operations. Under this guidance, basic net income attributable to Hitachi, Ltd. stockholders per share is computed based upon the weighted average number of shares of common stock outstanding during each year. Diluted net income attributable to Hitachi, Ltd. stockholders per share reflects the potential dilution that could occur if securities or other contracts to issue common stock were exercised or converted into common stock or resulted in the issuance of common stock that then shared in the earnings of the Company.
(y) Disclosures about Segments of an Enterprise and Related InformationASC 280, “Segment Reporting,” establishes guidance about how a public business enterprise is required to report financial and descriptive information about its operating segments. This guidance defines operating segments as components of an enterprise for which separate financial information is available and evaluated regularly as a means for assessing segment performance and allocating resources to segments. Measures of profit or loss, total assets and other related information are required to be disclosed for each operating segment. Furthermore, this guidance requires the disclosure of information concerning revenues derived from the enterprise’s products or services, countries in which it earns revenue or holds assets and major customers. Certain foreign private issuers (FPIs) were exempted from the segment disclosure requirements of ASC 280 in filings with the United States Securities and Exchange Commission (SEC) under the Securities Exchange Act of 1934,

58 Hitachi, Ltd. Annual Report 2010
and the Company has not previously presented the segment information required to be disclosed in the footnotes to the consolidated financial statements based on ASC 280. However, in September 2008, the SEC issued its “Foreign Issuer Reporting Enhancements” (FIRE) rule. The FIRE rule eliminated an instruction to the Form 20-F that is filed under the Securities Exchange Act of 1934 that permitted certain FPIs to omit segment disclosures required by ASC 280, as well as other enhancements. This aspect of the FIRE rule regarding elimination of the ability to omit segment disclosures is effective for fiscal years ended on or after December 15, 2009. As a result, the Company retrospectively adopted ASC 280 beginning April 1, 2008. The Company’s consolidated financial statements for the year ended March 31, 2008 do not disclose segment information required by ASC 280.
(z) GuaranteesThe Company recognizes, at the inception of the guarantee, a liability for the fair value of the obligation undertaken in issuing the guarantee in accordance with ASC 460, “Guarantees.”
(aa) Fair Value MeasurementThe Company adopted ASC 820, “Fair Value Measurements and Disclosures” for all financial assets and liabilities and non-financial assets and liabilities on a recurring basis on April 1, 2008 and for non-recurring valuations of non-financial assets and non-financial liabilities on April 1, 2009. This guidance defines fair value as the price that would be received to sell an asset or paid to transfer a liability (an exit price) in an orderly transaction between market participants at the measurement date. For the determination of fair value, the Company considers the principal or most advantageous market where the Company would transact and considers assumptions that market participants would use in pricing the asset or liability.
(ab) Accounting ChangesThe Company adopted the provisions of ASC 805, “Business Combinations,” and the provisions of ASC 810 regarding noncontrolling interests in a subsidiary on April 1, 2009. These provisions improve and simplify the accounting for business combinations and the reporting of noncontrolling interests in consolidated financial statements. The provisions of ASC 805 require an acquiring entity in a business combination to recognize all the assets acquired, liabilities assumed and any noncontrolling interest in an acquiree at the full amount of their fair values as of the acquisition date. Also, the related provisions of ASC 810 clarify that a noncontrolling interest in a subsidiary should be reported as equity in the consolidated financial statements and all the transactions resulting in changes in a parent’s ownership interest in a subsidiary that do not result in deconsolidation are equity transactions. The adoption of the provisions of ASC 805 did not have a material effect on the Company’s consolidated financial statements upon adoption, however, the additional required disclosures are presented in note 30. The changes in equity resulting from accounting treatment in accordance with the provisions of ASC 810 are presented in note 13.
The Company adopted the provisions regarding fair value measurements that are included primarily in ASC 820, “Fair Value Measurements and Disclosures,” on April 1, 2009, for non-recurring valuations of non-financial assets and non-financial liabilities, such as those used in measuring impairments of goodwill, other intangible assets, other long-lived assets and fair value measurements of non-financial assets acquired and non-financial liabilities assumed in business combinations consummated after the effective date. The adoption of these provisions did not have a material effect on the Company’s consolidated financial statements.
The Company adopted the provisions of ASC 470, “Debt,” related to debt with conversion and other options on April 1, 2009. These provisions require that issuers of convertible debt instruments that may be settled in cash or other assets upon conversion separately account for the liability and equity components in a manner that reflects the entity’s nonconvertible debt borrowing rate when interest cost is recognized in subsequent periods. The requirements must be applied retrospectively to all periods presented. For the year ended March 31, 2010, the adoption of these provisions did not have a material effect on the Company’s consolidated financial statements.

59Hitachi, Ltd. Annual Report 2010
The Company adopted the provisions of ASC 320, “Investment—Debts and Equity Securities,” related to recognition and presentation of other-than-temporary impairments on April 1, 2009. These provisions modify the existing model for recognition and measurement of impairment for debt securities. Under the provisions, an other-than-temporary impairment is triggered when there is intent to sell the impaired debt security, it is more likely than not that the impaired debt security will be required to be sold before recovery, or the holder is not expected to recover the entire amortized cost basis of the security. Additionally, the provisions change the presentation of an other-than-temporary impairment in the statement of operations for those impairments involving credit losses when the holder does not intend to sell the security and it is not more likely than not that the holder will be required to sell the security before recovery of its amortized cost basis. The credit loss component is recognized in earnings and the remainder of the impairment is recorded in other comprehensive income (loss). For the year ended March 31, 2010, the adoption of these provisions did not have a material effect on the Company’s consolidated financial statements.
The Company adopted the provisions of ASC 820 related to the determination of fair value when the volume and level of activity for the asset or liability have significantly decreased and identifying transactions that are not orderly on April 1, 2009. These provisions provide additional guidance for estimating fair value in accordance with other provisions of ASC 820 when the volume and level of activity for the asset or liability have significantly decreased in relation to normal market activity. The provisions also include guidance on identifying circumstances that indicate a transaction is not orderly. For the year ended March 31, 2010, the adoption of these provisions did not have a material effect on the Company’s consolidated financial statements.
The Company adopted the provisions of ASC 820 which provides additional guidance, including illustrative examples, clarifying the measurement of liabilities at fair value. When a quoted price in an active market for the identical liability is not available, the guidance requires that the fair value of a liability be measured using one or more of the listed valuation techniques that should maximize the use of relevant observable inputs and minimize the use of unobservable inputs. In addition, the guidance clarifies that when estimating the fair value of a liability, an entity is not required to include a separate input or adjustment to other inputs relating to the existence of a restriction that prevents the transfer of the liability. The guidance also clarifies how the price of a traded debt security (an asset value) should be considered in estimating the fair value of the issuer’s liability. For the year ended March 31, 2010, the adoption of these provisions did not have a material effect on the Company’s consolidated financial statements.
(ac) ReclassificationsCertain reclassifications have been made to prior year balances in order to conform to the current year presentation.
The Company adopted the provisions of ASC 810 with respect to noncontrolling interest in a subsidiary on April 1, 2009. Noncontrolling interests, which were previously referred to as minority interests and were classified between liabilities and stockholders’ equity in the consolidated balance sheets as a separate component, are included in equity. In addition, consolidated net income (loss) in the consolidated statement of operations now includes the net income (loss) attributable to noncontrolling interests. As the presentation requirements of these provisions are applied retrospectively, the presentation of the prior years’ financial statements has been reclassified in conformity with the presentation of the current year financial statements.
The Company has reclassified certain amounts on the consolidated statements of cash flows for the years ended March 31, 2009 and 2008 to conform to the March 31, 2010 presentation. Cash flows related to tangible and intangible assets have been separated into tangible assets, intangible assets and tangible assets and software to be leased. Increase (decrease) in short-term investments, which was previously presented separately, is included in investments in securities. Additionally, as a result of adopting the provisions of ASC 810, purchases and proceeds from sales of shares of subsidiaries that do not result in a change in the scope of consolidation, which were previously included in cash flows from investing activities, are included in cash flows from financing activities.
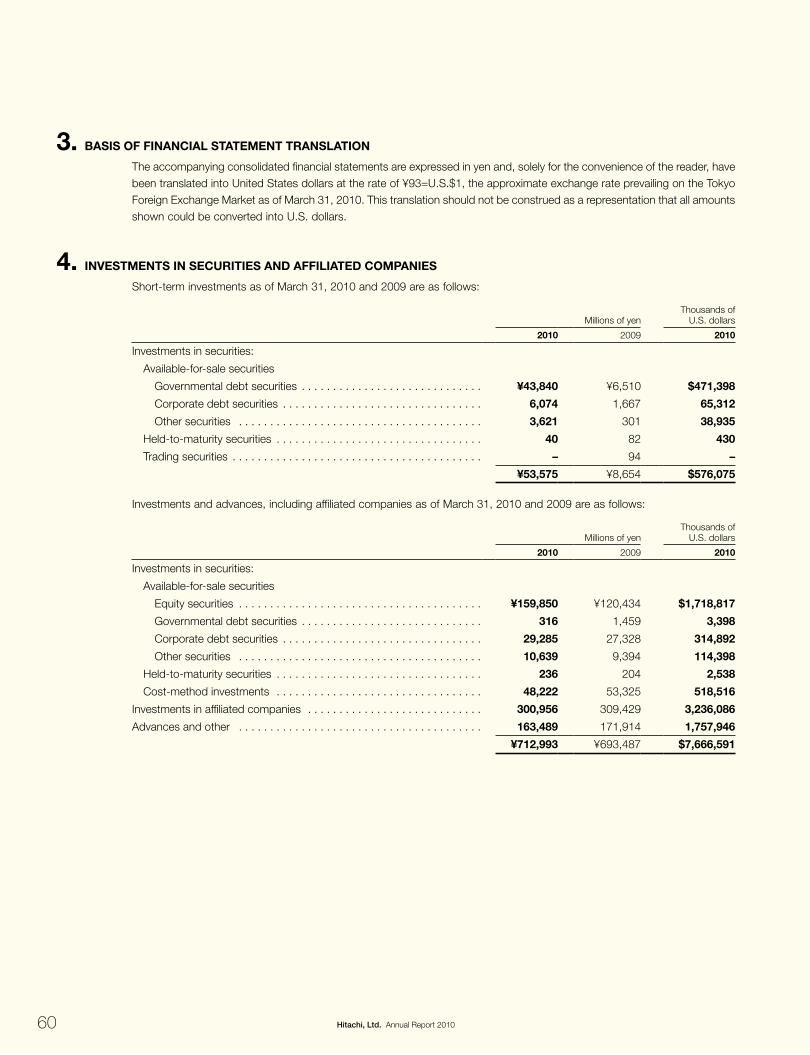
60 Hitachi, Ltd. Annual Report 2010
3. BASiS OF FiNANCiAL StAtEmENt trANSLAtiON
The accompanying consolidated financial statements are expressed in yen and, solely for the convenience of the reader, have been translated into United States dollars at the rate of ¥93=U.S.$1, the approximate exchange rate prevailing on the Tokyo Foreign Exchange Market as of March 31, 2010. This translation should not be construed as a representation that all amounts shown could be converted into U.S. dollars.
4. iNvEStmENtS iN SECuritiES ANd AFFiLiAtEd COmpANiES
Short-term investments as of March 31, 2010 and 2009 are as follows:
Millions of yenThousands of
U.S. dollars
2010 2009 2010
Investments in securities:
Available-for-sale securities
Governmental debt securities . . . . . . . . . . . . . . . . . . . . . . . . . . . . . ¥43,840 ¥6,510 $471,398
Corporate debt securities . . . . . . . . . . . . . . . . . . . . . . . . . . . . . . . . 6,074 1,667 65,312
Other securities . . . . . . . . . . . . . . . . . . . . . . . . . . . . . . . . . . . . . . . 3,621 301 38,935
Held-to-maturity securities . . . . . . . . . . . . . . . . . . . . . . . . . . . . . . . . . 40 82 430
Trading securities . . . . . . . . . . . . . . . . . . . . . . . . . . . . . . . . . . . . . . . . – 94 –
¥53,575 ¥8,654 $576,075
Investments and advances, including affiliated companies as of March 31, 2010 and 2009 are as follows:
Millions of yenThousands of
U.S. dollars
2010 2009 2010
Investments in securities:
Available-for-sale securities
Equity securities . . . . . . . . . . . . . . . . . . . . . . . . . . . . . . . . . . . . . . . ¥159,850 ¥120,434 $1,718,817
Governmental debt securities . . . . . . . . . . . . . . . . . . . . . . . . . . . . . 316 1,459 3,398
Corporate debt securities . . . . . . . . . . . . . . . . . . . . . . . . . . . . . . . . 29,285 27,328 314,892
Other securities . . . . . . . . . . . . . . . . . . . . . . . . . . . . . . . . . . . . . . . 10,639 9,394 114,398
Held-to-maturity securities . . . . . . . . . . . . . . . . . . . . . . . . . . . . . . . . . 236 204 2,538
Cost-method investments . . . . . . . . . . . . . . . . . . . . . . . . . . . . . . . . . 48,222 53,325 518,516
Investments in affiliated companies . . . . . . . . . . . . . . . . . . . . . . . . . . . . 300,956 309,429 3,236,086
Advances and other . . . . . . . . . . . . . . . . . . . . . . . . . . . . . . . . . . . . . . . 163,489 171,914 1,757,946
¥712,993 ¥693,487 $7,666,591
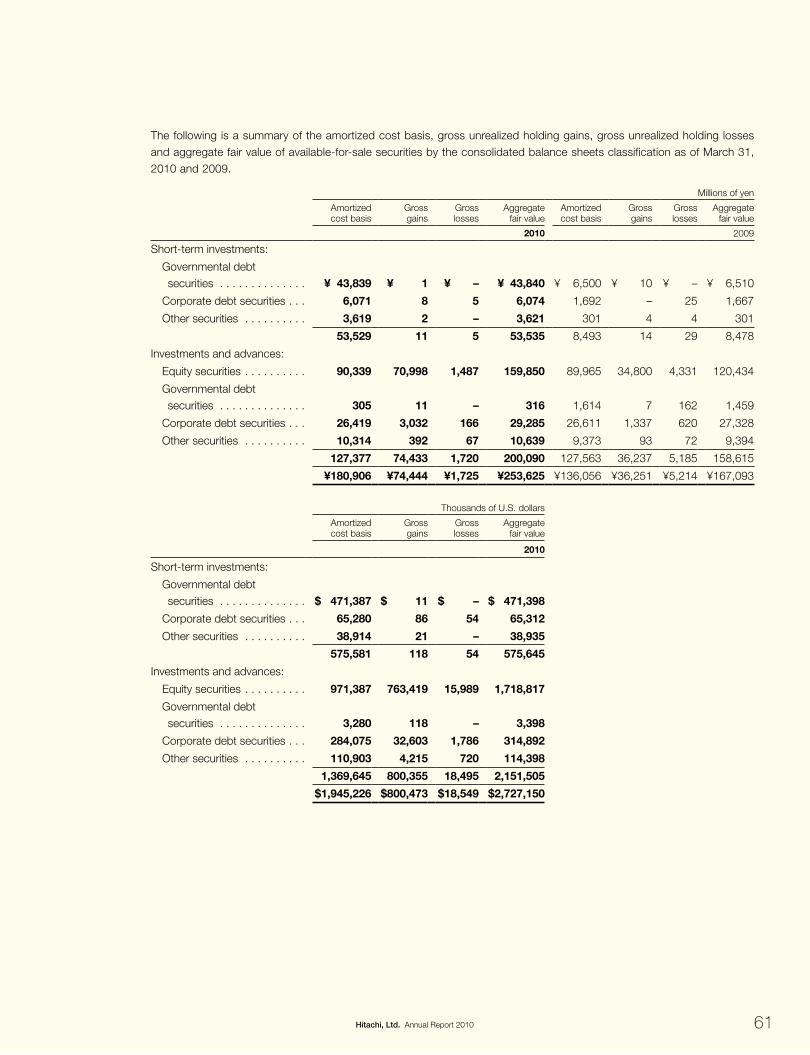
61Hitachi, Ltd. Annual Report 2010
The following is a summary of the amortized cost basis, gross unrealized holding gains, gross unrealized holding losses and aggregate fair value of available-for-sale securities by the consolidated balance sheets classification as of March 31, 2010 and 2009.
Millions of yen
Amortized cost basis
Gross gains
Gross losses
Aggregate fair value
Amortized cost basis
Gross gains
Gross losses
Aggregate fair value
2010 2009
Short-term investments:
Governmental debt securities . . . . . . . . . . . . . . ¥ 43,839 ¥ 1 ¥ – ¥ 43,840 ¥ 6,500 ¥ 10 ¥ – ¥ 6,510
Corporate debt securities . . . 6,071 8 5 6,074 1,692 – 25 1,667
Other securities . . . . . . . . . . 3,619 2 – 3,621 301 4 4 301
53,529 11 5 53,535 8,493 14 29 8,478
Investments and advances:
Equity securities . . . . . . . . . . 90,339 70,998 1,487 159,850 89,965 34,800 4,331 120,434
Governmental debt securities . . . . . . . . . . . . . . 305 11 – 316 1,614 7 162 1,459
Corporate debt securities . . . 26,419 3,032 166 29,285 26,611 1,337 620 27,328
Other securities . . . . . . . . . . 10,314 392 67 10,639 9,373 93 72 9,394
127,377 74,433 1,720 200,090 127,563 36,237 5,185 158,615
¥180,906 ¥74,444 ¥1,725 ¥253,625 ¥136,056 ¥36,251 ¥5,214 ¥167,093
Thousands of U.S. dollars
Amortized cost basis
Gross gains
Gross losses
Aggregate fair value
2010
Short-term investments:
Governmental debt securities . . . . . . . . . . . . . . $ 471,387 $ 11 $ – $ 471,398
Corporate debt securities . . . 65,280 86 54 65,312
Other securities . . . . . . . . . . 38,914 21 – 38,935
575,581 118 54 575,645
Investments and advances:
Equity securities . . . . . . . . . . 971,387 763,419 15,989 1,718,817
Governmental debt securities . . . . . . . . . . . . . . 3,280 118 – 3,398
Corporate debt securities . . . 284,075 32,603 1,786 314,892
Other securities . . . . . . . . . . 110,903 4,215 720 114,398
1,369,645 800,355 18,495 2,151,505
$1,945,226 $800,473 $18,549 $2,727,150

62 Hitachi, Ltd. Annual Report 2010
The following is a summary of gross unrealized holding losses on available-for-sale securities and the fair value of the related securities, aggregated by investment category and length of time that individual securities have been in a continuous unrealized loss position, as of March 31, 2010 and 2009.
Millions of yen
Less than 12 months 12 months or longer Less than 12 months 12 months or longer
Aggregate fair value
Gross losses
Aggregate fair value
Gross losses
Aggregate fair value
Gross losses
Aggregate fair value
Gross losses
2010 2009
Short-term investments:
Corporate debt securities . . . . . . . . ¥1,498 ¥ 2 ¥ 697 ¥ 3 ¥ 1,288 ¥ 9 ¥ 279 ¥ 16
Other securities . . . . . . . . . . . . . . . – – – – – – – 4
1,498 2 697 3 1,288 9 279 20
Investments and advances:
Equity securities . . . . . . . . . . . . . . . 3,491 532 4,718 955 21,836 3,092 4,336 1,239
Governmental debt securities . . . . . – – – – 838 162 – –
Corporate debt securities . . . . . . . . 2,646 44 5,669 122 3,089 156 10,220 464
Other securities . . . . . . . . . . . . . . . – – 327 67 995 67 27 5
6,137 576 10,714 1,144 26,758 3,477 14,583 1,708
¥7,635 ¥578 ¥11,411 ¥1,147 ¥28,046 ¥3,486 ¥14,862 ¥1,728
Thousands of U.S. dollars
Less than 12 months 12 months or longer
Aggregate fair value
Gross losses
Aggregate fair value
Gross losses
2010
Short-term investments:
Corporate debt securities . . . . . . . . $16,108 $ 22 $ 7,495 $ 32
Other securities . . . . . . . . . . . . . . . – – – –
16,108 22 7,495 32
Investments and advances:
Equity securities . . . . . . . . . . . . . . . 37,538 5,720 50,731 10,269
Governmental debt securities . . . . . – – – –
Corporate debt securities . . . . . . . . 28,452 473 60,957 1,312
Other securities . . . . . . . . . . . . . . . – – 3,516 720
65,990 6,193 115,204 12,301
$82,098 $6,215 $122,699 $12,333
Equity securities consist primarily of stocks issued by Japanese listed companies. Governmental debt securities consist primarily of Japan treasury bonds. Corporate debt securities consist primarily of structured bonds. Other securities consist primarily of investments funds.

63Hitachi, Ltd. Annual Report 2010
The proceeds from the sale of available-for-sale securities for the years ended March 31, 2010, 2009 and 2008 were ¥5,890 million ($63,333 thousand), ¥60,063 million and ¥38,264 million, respectively. The gross realized gains on the sale of those securities for the years ended March 31, 2010, 2009 and 2008 were ¥1,124 million ($12,086 thousand), ¥2,017 million and ¥10,137 million, respectively, while the gross realized losses on the sale of those securities for the years ended March 31, 2010, 2009 and 2008 were ¥56 million ($602 thousand), ¥1,029 million and ¥107 million, respectively. In addition, during the year ended March 31, 2008, the Company contributed certain available-for-sale securities, with an aggregate fair value of ¥42,240 million, to a pension fund trust. Gross realized gain on the contribution for the year ended March 31, 2008 was ¥21,040 million, which has been included in other income in the accompanying consolidated statement of operations.
The contractual maturities of debt securities and other securities classified as investments and advances in the consolidated balance sheet as of March 31, 2010 are as follows:
Millions of yen Thousands of U.S. dollars
Held-to- maturity
Available- for-sale Total
Held-to- maturity
Available- for-sale Total
2010 2010
Due within five years . . . . . . . . . . . . . . . . . . . . ¥ 37 ¥12,895 ¥12,932 $ 398 $138,656 $139,054
Due after five years through ten years . . . . . . . 199 5,824 6,023 2,140 62,623 64,763
Due after ten years . . . . . . . . . . . . . . . . . . . . . – 21,521 21,521 – 231,409 231,409
¥236 ¥40,240 ¥40,476 $2,538 $432,688 $435,226
Expected redemptions may differ from contractual maturities because some of these securities are redeemable at the option of the issuers.
The aggregate carrying amounts of cost-method investments which were not evaluated for impairment as of March 31, 2010 and 2009 were ¥47,900 million ($515,054 thousand) and ¥51,197 million, respectively, mainly because it is not practicable to estimate the fair value of the investments due to lack of a market price and difficulty in estimating fair value without incurring excessive cost and the Company did not identify any events or changes in circumstances that might have had a significant adverse effect on their fair value.
The aggregate fair values of investments in affiliated companies, for which a quoted market price was available, as of March 31, 2010 and 2009, were ¥17,388 million ($186,968 thousand) and ¥13,630 million, respectively. The aggregate carrying amounts of such investments as of March 31, 2010 and 2009 were ¥13,962 million ($150,129 thousand) and ¥13,452 million, respectively.
As of March 31, 2010 and 2009, cumulative recognition of other-than-temporary declines in values of investments in certain affiliated companies resulted in the difference of ¥32,621 ($350,763 thousand) million and ¥17,452 million, respectively, between the carrying amount of the investment and the amount of underlying equity in net assets. In addition, as of March 31, 2010 and 2009, equity-method goodwill included in investments in certain affiliated companies aggregated ¥38,346 million ($412,323 thousand) and ¥43,015 million, respectively.

64 Hitachi, Ltd. Annual Report 2010
Summarized financial information relating to Renesas Technology Corp. (Renesas), Casio Hitachi Mobile Communications Co., Ltd. (CHMC) and other affiliated companies accounted for by the equity method is as follows:
Millions of yen
Renesas CHMC Others Total
2010
Current assets . . . . . . . . . . . . . . . . . . . . . . . . . . . . . . . . . . . ¥327,687 ¥50,535 ¥ 645,257 ¥1,023,479
Non-current assets . . . . . . . . . . . . . . . . . . . . . . . . . . . . . . . 294,192 9,521 465,209 768,922
Total assets . . . . . . . . . . . . . . . . . . . . . . . . . . . . . . . . . . . 621,879 60,056 1,110,466 1,792,401
Current liabilities . . . . . . . . . . . . . . . . . . . . . . . . . . . . . . . . . 342,680 41,546 617,825 1,002,051
Non-current liabilities . . . . . . . . . . . . . . . . . . . . . . . . . . . . . . 135,603 1,014 100,779 237,396
Total liabilities . . . . . . . . . . . . . . . . . . . . . . . . . . . . . . . . . . 478,283 42,560 718,604 1,239,447
Equity . . . . . . . . . . . . . . . . . . . . . . . . . . . . . . . . . . . . . . . 143,596 17,496 391,862 552,954
Stockholders’ equity 141,567 17,496
Percentage of ownership in equity investees . . . . . . . . . . 55.0% 49.0%
Equity investment and undistributed earnings of affiliated companies, before consolidating and reconciling adjustments . . . . . . . . . . . . . . . . . . . . . . . . . 77,862 8,573
Consolidation and reconciling adjustments:
Impairment loss . . . . . . . . . . . . . . . . . . . . . . . . . . . . . . (10,881) (4,232)
Other . . . . . . . . . . . . . . . . . . . . . . . . . . . . . . . . . . . . . . 2 (141)
Investments in affiliated companies . . . . . . . . . . . . . . . . . ¥ 66,983 ¥ 4,200 ¥ 229,773 ¥ 300,956
Thousands of U.S. dollars
Renesas CHMC Others Total
2010
Current assets . . . . . . . . . . . . . . . . . . . . . . . . . . . . . . . . . . . $3,523,516 $543,387 $ 6,938,248 $11,005,151
Non-current assets . . . . . . . . . . . . . . . . . . . . . . . . . . . . . . . 3,163,355 102,376 5,002,247 8,267,978
Total assets . . . . . . . . . . . . . . . . . . . . . . . . . . . . . . . . . . . 6,686,871 645,763 11,940,945 19,273,129
Current liabilities . . . . . . . . . . . . . . . . . . . . . . . . . . . . . . . . . 3,684,731 446,731 6,643,280 10,774,742
Non-current liabilities . . . . . . . . . . . . . . . . . . . . . . . . . . . . . . 1,458,097 10,903 1,083,645 2,552,645
Total liabilities . . . . . . . . . . . . . . . . . . . . . . . . . . . . . . . . . . 5,142,828 457,634 7,726,925 13,327,387
Equity . . . . . . . . . . . . . . . . . . . . . . . . . . . . . . . . . . . . . . . 1,544,043 188,129 4,213,570 5,945,742
Stockholders’ equity 1,522,226 188,129
Percentage of ownership in equity investees . . . . . . . . . . 55.0% 49.0%
Equity investment and undistributed earnings of affiliated companies, before consolidating and reconciling adjustments . . . . . . . . . . . . . . . . . . . . . . . . . 837,225 92,183
Consolidation and reconciling adjustments:
Impairment loss . . . . . . . . . . . . . . . . . . . . . . . . . . . . . . (117,000) (45,505)
Other . . . . . . . . . . . . . . . . . . . . . . . . . . . . . . . . . . . . . . 22 (1,516)
Investments in affiliated companies . . . . . . . . . . . . . . . . . $ 720,247 $ 45,162 $ 2,470,677 $ 3,236,086

65Hitachi, Ltd. Annual Report 2010
Millions of yen
Renesas CHMC Others Total
2009
Current assets . . . . . . . . . . . . . . . . . . . . . . . . . . . . . . . . . . . ¥349,784 ¥48,265 ¥ 658,438 ¥1,056,487
Non-current assets . . . . . . . . . . . . . . . . . . . . . . . . . . . . . . . 342,978 12,798 454,869 810,645
Total assets . . . . . . . . . . . . . . . . . . . . . . . . . . . . . . . . . . . 692,762 61,063 1,113,307 1,867,132
Current liabilities . . . . . . . . . . . . . . . . . . . . . . . . . . . . . . . . . 349,608 56,884 610,827 1,017,319
Non-current liabilities . . . . . . . . . . . . . . . . . . . . . . . . . . . . . . 195,420 1,315 117,156 313,891
Total liabilities . . . . . . . . . . . . . . . . . . . . . . . . . . . . . . . . . . 545,028 58,199 727,983 1,331,210
Equity . . . . . . . . . . . . . . . . . . . . . . . . . . . . . . . . . . . . . . . 147,734 2,864 385,324 535,922
Stockholders’ equity . . . . . . . . . . . . . . . . . . . . . . . . . . . . 145,344 2,864
Percentage of ownership in equity investees . . . . . . . . . . 55.0% 49.0%
Equity investment and undistributed earnings of affiliated companies, before consolidating and reconciling adjustments . . . . . . . . . . . . . . . . . . . . . . . . . 79,939 1,403
Consolidation and reconciling adjustments . . . . . . . . . . . . 50 35
Investments in affiliated companies . . . . . . . . . . . . . . . . . ¥ 79,989 ¥ 1,438 ¥228,002 ¥ 309,429
Millions of yen
Renesas CHMC Others Total
2010
Revenues . . . . . . . . . . . . . . . . . . . . . . . . . . . . . . . . . . . . . . ¥ 599,791 ¥ 99,623 ¥ 1,170,893 ¥ 1,870,307
Cost of sales . . . . . . . . . . . . . . . . . . . . . . . . . . . . . . . . . . . . (555,990) (110,381) (1,007,203) (1,673,574)
Selling, general and administrative expenses . . . . . . . . . . . . (108,003) (14,448) (176,368) (298,819)
Impairment losses for long-lived assets . . . . . . . . . . . . . . . . (4,551) –
Restructuring charges . . . . . . . . . . . . . . . . . . . . . . . . . . . . . (202) –
Other deductions (net) . . . . . . . . . . . . . . . . . . . . . . . . . . . . . (12,603) (12)
Loss before income taxes . . . . . . . . . . . . . . . . . . . . . . . . (81,558) (25,218)
Income taxes . . . . . . . . . . . . . . . . . . . . . . . . . . . . . . . . . . . . (4,991) (4,150)
Net loss . . . . . . . . . . . . . . . . . . . . . . . . . . . . . . . . . . . . . . (86,549) (29,368)
Less net loss attributable to noncontrolling interests . . . . . . (183) –
Net loss attributable to affiliated companies . . . . . . . . . . . (86,366) (29,368) (51,729) (167,463)
Percentage of ownership in equity investees . . . . . . . . . . 55.0% 49.0%
Equity in net loss of affiliated companies, before consolidating and reconciling adjustments . . . . . . (47,501) (14,390)
Consolidation and reconciling adjustments . . . . . . . . . . . . (96) (1)
Equity in net earnings (loss) of affiliated companies . . . . . ¥ (47,597) ¥ (14,391) ¥ 3,802 ¥ (58,186)
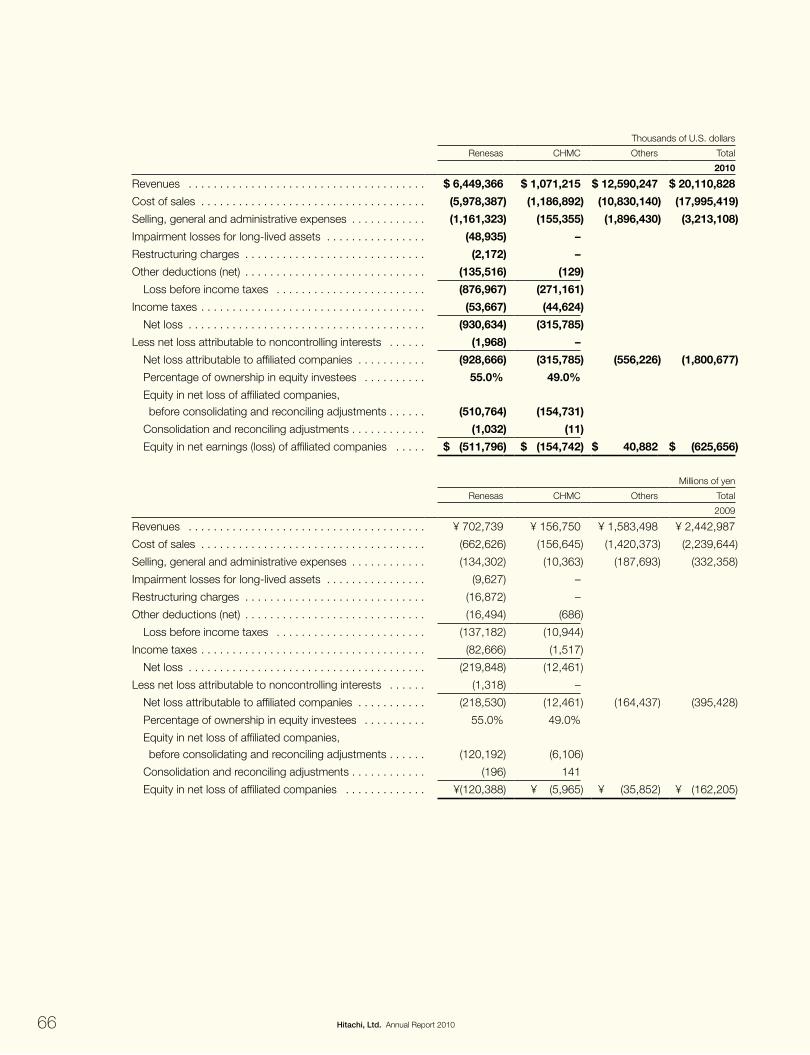
66 Hitachi, Ltd. Annual Report 2010
Thousands of U.S. dollars
Renesas CHMC Others Total
2010
Revenues . . . . . . . . . . . . . . . . . . . . . . . . . . . . . . . . . . . . . . $ 6,449,366 $ 1,071,215 $ 12,590,247 $ 20,110,828
Cost of sales . . . . . . . . . . . . . . . . . . . . . . . . . . . . . . . . . . . . (5,978,387) (1,186,892) (10,830,140) (17,995,419)
Selling, general and administrative expenses . . . . . . . . . . . . (1,161,323) (155,355) (1,896,430) (3,213,108)
Impairment losses for long-lived assets . . . . . . . . . . . . . . . . (48,935) –
Restructuring charges . . . . . . . . . . . . . . . . . . . . . . . . . . . . . (2,172) –
Other deductions (net) . . . . . . . . . . . . . . . . . . . . . . . . . . . . . (135,516) (129)
Loss before income taxes . . . . . . . . . . . . . . . . . . . . . . . . (876,967) (271,161)
Income taxes . . . . . . . . . . . . . . . . . . . . . . . . . . . . . . . . . . . . (53,667) (44,624)
Net loss . . . . . . . . . . . . . . . . . . . . . . . . . . . . . . . . . . . . . . (930,634) (315,785)
Less net loss attributable to noncontrolling interests . . . . . . (1,968) –
Net loss attributable to affiliated companies . . . . . . . . . . . (928,666) (315,785) (556,226) (1,800,677)
Percentage of ownership in equity investees . . . . . . . . . . 55.0% 49.0%
Equity in net loss of affiliated companies, before consolidating and reconciling adjustments . . . . . . (510,764) (154,731)
Consolidation and reconciling adjustments . . . . . . . . . . . . (1,032) (11)
Equity in net earnings (loss) of affiliated companies . . . . . $ (511,796) $ (154,742) $ 40,882 $ (625,656)
Millions of yen
Renesas CHMC Others Total
2009
Revenues . . . . . . . . . . . . . . . . . . . . . . . . . . . . . . . . . . . . . . ¥ 702,739 ¥ 156,750 ¥ 1,583,498 ¥ 2,442,987
Cost of sales . . . . . . . . . . . . . . . . . . . . . . . . . . . . . . . . . . . . (662,626) (156,645) (1,420,373) (2,239,644)
Selling, general and administrative expenses . . . . . . . . . . . . (134,302) (10,363) (187,693) (332,358)
Impairment losses for long-lived assets . . . . . . . . . . . . . . . . (9,627) –
Restructuring charges . . . . . . . . . . . . . . . . . . . . . . . . . . . . . (16,872) –
Other deductions (net) . . . . . . . . . . . . . . . . . . . . . . . . . . . . . (16,494) (686)
Loss before income taxes . . . . . . . . . . . . . . . . . . . . . . . . (137,182) (10,944)
Income taxes . . . . . . . . . . . . . . . . . . . . . . . . . . . . . . . . . . . . (82,666) (1,517)
Net loss . . . . . . . . . . . . . . . . . . . . . . . . . . . . . . . . . . . . . . (219,848) (12,461)
Less net loss attributable to noncontrolling interests . . . . . . (1,318) –
Net loss attributable to affiliated companies . . . . . . . . . . . (218,530) (12,461) (164,437) (395,428)
Percentage of ownership in equity investees . . . . . . . . . . 55.0% 49.0%
Equity in net loss of affiliated companies, before consolidating and reconciling adjustments . . . . . . (120,192) (6,106)
Consolidation and reconciling adjustments . . . . . . . . . . . . (196) 141
Equity in net loss of affiliated companies . . . . . . . . . . . . . ¥(120,388) ¥ (5,965) ¥ (35,852) ¥ (162,205)

67Hitachi, Ltd. Annual Report 2010
Millions of yen
Renesas CHMC Others Total
2008
Revenues . . . . . . . . . . . . . . . . . . . . . . . . . . . . . . . . . . . . . . ¥ 950,518 ¥ 156,571 ¥ 1,709,020 ¥ 2,816,109
Cost of sales . . . . . . . . . . . . . . . . . . . . . . . . . . . . . . . . . . . . (752,090) (143,156) (1,442,229) (2,337,475)
Selling, general and administrative expenses . . . . . . . . . . . . (153,789) (12,512) (192,819) (359,120)
Impairment losses for long-lived assets . . . . . . . . . . . . . . . . (2,864) –
Restructuring charges . . . . . . . . . . . . . . . . . . . . . . . . . . . . . (4,208) –
Other deductions (net) . . . . . . . . . . . . . . . . . . . . . . . . . . . . . (8,047) (1,327)
Income (loss) before income taxes . . . . . . . . . . . . . . . . . . 29,520 (424)
Income taxes . . . . . . . . . . . . . . . . . . . . . . . . . . . . . . . . . . . . (19,229) 227
Net income (loss) . . . . . . . . . . . . . . . . . . . . . . . . . . . . . . . 10,291 (197)
Less net income attributable to noncontrolling interests . . . . 23 –
Net income (loss) attributable to affiliated companies . . . . 10,268 (197) 39,588 49,659
Percentage of ownership in equity investees . . . . . . . . . . 55.0% 49.0%
Equity in net earnings (loss) of affiliated companies, before consolidating and reconciling adjustment . . . . . . 5,647 (97)
Consolidation and reconciling adjustments . . . . . . . . . . . . (21) –
Equity in net earnings (loss) of affiliated companies . . . . . ¥ 5,626 ¥ (97) ¥ 17,057 ¥ 22,586
On April 1, 2003, Renesas, which focused on system LSI (Large Scale Integration) operations, was incorporated through a corporate split procedure, where the semiconductor and integrated circuits operations of the Company and Mitsubishi Electric Corporation were spun-off and contributed to a new company. Although the Company has owned 55.0% of the voting stock of Renesas since its foundation, the Company accounts for the investment under the equity method of accounting as Mitsubishi Electric Corp. has substantive participating rights under the joint venture agreement. Renesas increased its capital by ¥54,000 million and ¥71,700 million ($770,968 thousand) during the years ended March 31, 2009 and 2010, respectively. Renesas Electronics Corporation was established on April 1, 2010 when Renesas was combined with NEC Electronics Corporation. As a result, the Company received a 30.6% interest in Renesas Electronics Corporation and accounts for the investment under the equity method of accounting.
On April 1, 2004, CHMC, which focused on mobile phone design, production and sales, was incorporated. The Company has owned 49.0% of the voting stock of CHMC since its foundation and accounts for the investment under the equity method of accounting. CHMC increased its capital by ¥44,000 million ($473,118 thousand) during the year ended March 31, 2010. On June 1, 2010, CHMC was merged into NEC CASIO Mobile Communications, Ltd. Consequently, the Company received a 16.7% interest in NEC CASIO Mobile Communications, Ltd. and accounts for the investment under the cost method of accounting. NEC CASIO Mobile Communications, Ltd. plans to increase its capital by allocating new shares to shareholders other than the Company in June 2010, and as a result, the Company’s interest in NEC CASIO Mobile Communications, Ltd. will decrease to 9.3%.
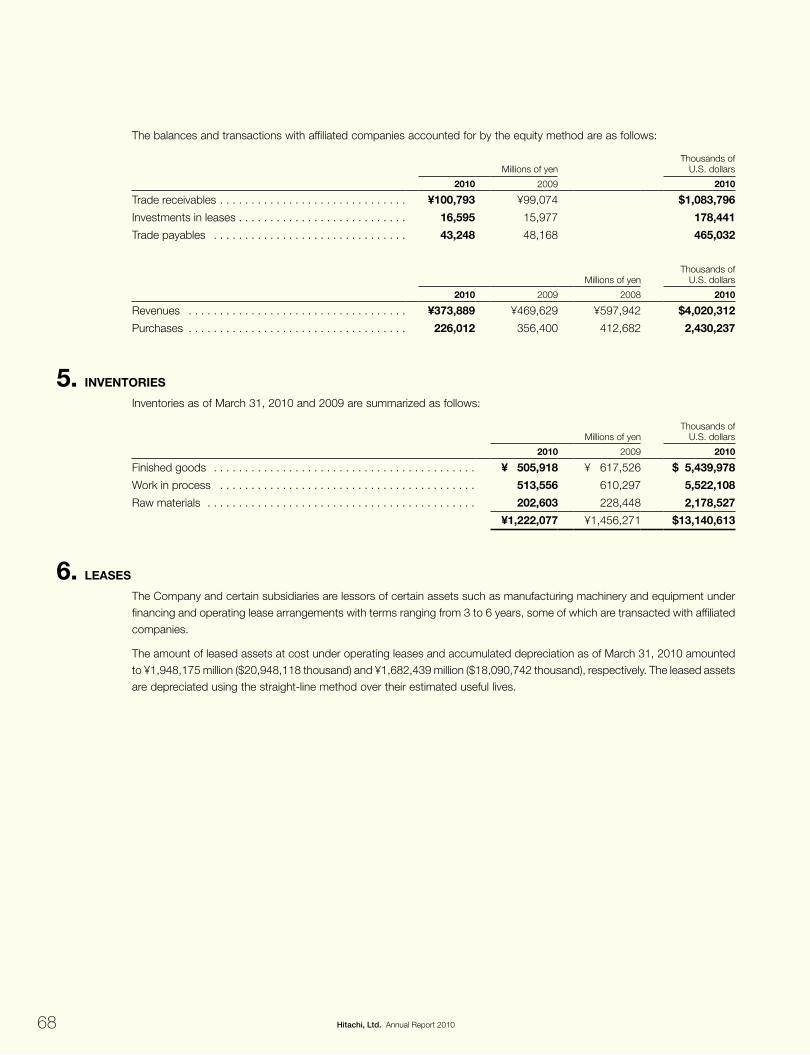
68 Hitachi, Ltd. Annual Report 2010
The balances and transactions with affiliated companies accounted for by the equity method are as follows:
Millions of yenThousands of
U.S. dollars
2010 2009 2010
Trade receivables . . . . . . . . . . . . . . . . . . . . . . . . . . . . . . ¥100,793 ¥99,074 $1,083,796
Investments in leases . . . . . . . . . . . . . . . . . . . . . . . . . . . 16,595 15,977 178,441
Trade payables . . . . . . . . . . . . . . . . . . . . . . . . . . . . . . . 43,248 48,168 465,032
Millions of yenThousands of
U.S. dollars
2010 2009 2008 2010
Revenues . . . . . . . . . . . . . . . . . . . . . . . . . . . . . . . . . . . ¥373,889 ¥469,629 ¥597,942 $4,020,312
Purchases . . . . . . . . . . . . . . . . . . . . . . . . . . . . . . . . . . . 226,012 356,400 412,682 2,430,237
5. iNvENtOriES
Inventories as of March 31, 2010 and 2009 are summarized as follows:
Millions of yenThousands of
U.S. dollars
2010 2009 2010
Finished goods . . . . . . . . . . . . . . . . . . . . . . . . . . . . . . . . . . . . . . . . . . ¥ 505,918 ¥ 617,526 $ 5,439,978
Work in process . . . . . . . . . . . . . . . . . . . . . . . . . . . . . . . . . . . . . . . . . 513,556 610,297 5,522,108
Raw materials . . . . . . . . . . . . . . . . . . . . . . . . . . . . . . . . . . . . . . . . . . . 202,603 228,448 2,178,527
¥1,222,077 ¥1,456,271 $13,140,613
6. LEASES
The Company and certain subsidiaries are lessors of certain assets such as manufacturing machinery and equipment under financing and operating lease arrangements with terms ranging from 3 to 6 years, some of which are transacted with affiliated companies.
The amount of leased assets at cost under operating leases and accumulated depreciation as of March 31, 2010 amounted to ¥1,948,175 million ($20,948,118 thousand) and ¥1,682,439 million ($18,090,742 thousand), respectively. The leased assets are depreciated using the straight-line method over their estimated useful lives.

69Hitachi, Ltd. Annual Report 2010
The following table shows the future minimum lease receivables of financing and non-cancelable operating leases as of March 31, 2010 and the future minimum lease receivables of financing leases as of March 31, 2009:
Millions of yenThousands of
U.S. dollars
Financing leases
Operating leases
Financing leases
Operating leases
Years ending March 31 2010 2010
2011 . . . . . . . . . . . . . . . . . . . . . . . . . . . . . . . . . . . . . . . . . . . ¥200,234 ¥34,732 $2,153,054 $373,462
2012 . . . . . . . . . . . . . . . . . . . . . . . . . . . . . . . . . . . . . . . . . . . 152,837 21,723 1,643,408 233,581
2013 . . . . . . . . . . . . . . . . . . . . . . . . . . . . . . . . . . . . . . . . . . . 102,875 13,004 1,106,183 139,828
2014 . . . . . . . . . . . . . . . . . . . . . . . . . . . . . . . . . . . . . . . . . . . 58,533 5,790 629,387 62,258
2015 . . . . . . . . . . . . . . . . . . . . . . . . . . . . . . . . . . . . . . . . . . . 30,656 2,421 329,634 26,032
Thereafter . . . . . . . . . . . . . . . . . . . . . . . . . . . . . . . . . . . . . . . 97,566 2,195 1,049,097 23,602
Total minimum payments to be received . . . . . . . . . . . . . . . . 642,701 ¥79,865 6,910,763 $858,763
Unguaranteed residual values . . . . . . . . . . . . . . . . . . . . . . . . 66,289 712,785
Amount representing executory costs . . . . . . . . . . . . . . . . . . (46,522) (500,236)
Unearned income . . . . . . . . . . . . . . . . . . . . . . . . . . . . . . . . . (44,877) (482,548)
Allowance for doubtful receivables . . . . . . . . . . . . . . . . . . . . . (4,825) (51,882)
Net investment in financing leases . . . . . . . . . . . . . . . . . . . . . 612,766 6,588,882
Less current portion of net investment in financing leases, included in investments in leases . . . . . . . . . . . . . . . . . . . . . 194,108 2,087,183
Long-term net investment in financing leases, included in other assets . . . . . . . . . . . . . . . . . . . . . . . . . . . . ¥418,658 $4,501,699
Millions of yen
Financing Leases
2009
Total minimum payments to be received . . . . . . . . . . . . . . . . ¥575,350
Unguaranteed residual values . . . . . . . . . . . . . . . . . . . . . . . . 74,870
Amount representing executory costs . . . . . . . . . . . . . . . . . . (32,803)
Unearned income . . . . . . . . . . . . . . . . . . . . . . . . . . . . . . . . . (41,161)
Allowance for doubtful receivables . . . . . . . . . . . . . . . . . . . . . (3,778)
Net investment in financing leases . . . . . . . . . . . . . . . . . . . . . 572,478
Less current portion of net investment in financing leases, included in investments in leases . . . . . . . . . . . . . . . . . . . . . 170,340
Long-term net investment in financing leases, included in other assets . . . . . . . . . . . . . . . . . . . . . . . . . . . . ¥402,138
The Company and certain subsidiaries lease certain buildings, manufacturing machinery and equipment used in their operations. The amount of leased assets at cost under capital leases as of March 31, 2010 and 2009 amounted to ¥39,398 million ($423,634 thousand) and ¥37,846 million, respectively, and accumulated depreciation as of March 31, 2010 and 2009 amounted to ¥19,440 million ($209,032 thousand) and ¥18,993 million, respectively. Amortization of assets under capital leases is included in depreciation expense.

70 Hitachi, Ltd. Annual Report 2010
The following table shows the future minimum lease payments of capital and non-cancelable operating leases as of March 31, 2010:
Millions of yenThousands of
U.S. dollars
Capital leases
Operating leases
Capital leases
Operating leases
Years ending March 31 2010 2010
2011 . . . . . . . . . . . . . . . . . . . . . . . . . . . . . . . . . . . . . . . . . . . . . . . . . ¥11,128 ¥16,286 $119,656 $175,118
2012 . . . . . . . . . . . . . . . . . . . . . . . . . . . . . . . . . . . . . . . . . . . . . . . . . 10,117 14,748 108,785 158,581
2013 . . . . . . . . . . . . . . . . . . . . . . . . . . . . . . . . . . . . . . . . . . . . . . . . . 5,507 10,535 59,215 113,279
2014 . . . . . . . . . . . . . . . . . . . . . . . . . . . . . . . . . . . . . . . . . . . . . . . . . 3,242 8,761 34,860 94,204
2015 . . . . . . . . . . . . . . . . . . . . . . . . . . . . . . . . . . . . . . . . . . . . . . . . . 1,847 7,995 19,860 85,968
Thereafter . . . . . . . . . . . . . . . . . . . . . . . . . . . . . . . . . . . . . . . . . . . . . 3,898 21,091 41,914 226,785
Total minimum lease payments . . . . . . . . . . . . . . . . . . . . . . . . . . . . . 35,739 ¥79,416 384,290 $853,935
Amount representing executory costs . . . . . . . . . . . . . . . . . . . . . . . . (153) (1,645)
Amount representing interest . . . . . . . . . . . . . . . . . . . . . . . . . . . . . . . (1,667) (17,925)
Present value of net minimum lease payments . . . . . . . . . . . . . . . . . . 33,919 364,720
Less current portion of capital lease obligations . . . . . . . . . . . . . . . . . 10,554 113,483
Long-term capital lease obligations . . . . . . . . . . . . . . . . . . . . . . . . . . ¥23,365 $251,237
7. SECuritizAtiONS
The Company and certain subsidiaries securitize certain financial assets, such as lease, trade and mortgage loans receivable, and arrange other forms of asset-backed financing for the purpose of providing diversified and stable fund raising as part of their ongoing securitization activities. Historically, they have used both Hitachi-supported and third-party Special Purpose Entities (SPEs) to execute securitization transactions funded with commercial paper and other borrowings. The securitization transactions they engage in are similar to those used by many financial institutions.
Investors in these entities only have recourse to the assets owned by the entity and not to their general credit, unless noted below. They do not provide non-contractual support to SPEs and do not have implicit support arrangements with any SPEs. The majority of their involvement with SPEs relate to the securitization activities: assisting in the formation and financing of an entity, providing recourse, servicing the assets and receiving fees for services provided.
A portion of these lease, trade and mortgage loans receivable is transferred to SPEs sponsored by financial institutions, which operate those SPEs as a part of their businesses. Accordingly, the amount of assets transferred by the Company and its subsidiaries is considerably small compared to the total assets of the SPEs sponsored by these financial institutions that purchase a large amount of assets from entities other than the Company and its subsidiaries. In certain transactions, the Company’s subsidiaries retain subordinated interests in the transferred assets. In other transactions, investors have recourse with a scope that is considerably limited.
Most of the transactions transferring lease and mortgage loans receivable utilize securitization trusts. In those transactions, certain subsidiaries initially transfer the receivables to trusts that satisfy the conditions of Qualifying SPEs (QSPEs), and receive the beneficial interests in trusts originated from the transferred assets. Subsequently, the subsidiaries transfer the interests to and receive cash as consideration from SPEs that are not QSPEs, as a part of off-balance sheet arrangements.
The rest of these financial assets, consisting mainly of trade receivables, are transferred to QSPEs established by certain of the Company’s subsidiaries in the Cayman Islands. In those transactions, the Company and certain subsidiaries receive cash as consideration from QSPEs that are funded through the issuance of asset-backed securities or other borrowings from investors that are secured by the transferred assets. The Company and certain subsidiaries retain subordinated interests in the transferred assets relating to these transactions, or otherwise investors have recourse with considerably limited scope. Furthermore, the Company and certain subsidiaries retain servicing responsibility, and certain of the Company’s subsidiaries provide credit facilities to QSPEs in accordance with the service agency business contracts from which temporary payments on behalf of such QSPEs are made.

71Hitachi, Ltd. Annual Report 2010
As of March 31, 2010 and 2009, the Company and its subsidiaries have three QSPEs with outstanding balances of transferred receivables and the total amount of their assets was ¥117,159 million ($1,259,774 thousand) and ¥164,863 million, respectively. The Company and its subsidiaries do not hold any of the voting shares issued by those QSPEs, and none of the directors of those QSPEs are executives or employees of the Company or its subsidiaries. Additionally, the QSPEs also purchase receivables from third-party customers.
The transferred assets have similar risks and characteristics to the Company’s and subsidiaries’ receivables recorded on the consolidated balance sheets. Accordingly, the performance, such as collections or expected credit loss, of these transferred assets has been similar to the receivables recorded on the consolidated balance sheets; however, the blended performance of the pools of transferred assets reflects the eligibility screening requirements that the Company and subsidiaries apply to determine which receivables are selected for transfer. Therefore, the blended performance may differ from receivables recorded on the consolidated balance sheets.
Hitachi Capital Corporation and certain other financing subsidiaries sold lease receivables to SPEs that are not QSPEs. For the years ended March 31, 2010, 2009 and 2008, net gains recognized on the sale of these lease receivables amounted to ¥10,017 million ($107,710 thousand), ¥13,975 million and ¥17,440 million, respectively. The subsidiaries retained servicing responsibilities, but did not record a servicing asset or liability because the cost to service the receivables approximated the servicing income.
The table below summarizes cash flows received from and paid to the SPEs during the years ended March 31, 2010, 2009 and 2008:
Millions of yenThousands of
U.S. dollars
2010 2009 2008 2010
Proceeds from transfer of lease receivables . . . . . . . . . . . . . ¥167,483 ¥254,211 ¥310,898 $1,800,892
Servicing fees received . . . . . . . . . . . . . . . . . . . . . . . . . . . . 72 78 78 774
Purchases of delinquent or ineligible assets . . . . . . . . . . . . . (60,983) (46,760) (26,610) (655,731)
Quantitative information about delinquencies, net credit losses, and components of lease receivables subject to transfer and other assets managed together as of and for the years ended March 31, 2010 and 2009 is as follows:
Millions of yen Thousands of U.S. dollars
Total principal
amount of receivables
Principal amount of
receivables 90 days or
more past dueNet credit
loss
Total principal
amount of receivables
Principal amount of
receivables 90 days or
more past dueNet credit
loss
2010 2010
Total assets managed or transferred:
Lease receivables . . . . . . . . . . . . ¥1,103,804 ¥243 ¥1,943 $11,868,860 $2,613 $20,892
Assets transferred . . . . . . . . . . . . (491,038) (5,279,978)
Assets held in portfolio . . . . . . . . . . . ¥ 612,766 $ 6,588,882
Millions of yen
Total principal
amount of receivables
Principal amount of
receivables 90 days or
more past dueNet credit
loss
2009
Total assets managed or transferred:
Lease receivables . . . . . . . . . . . . ¥1,172,350 ¥218 ¥1,779
Assets transferred . . . . . . . . . . . . (599,872)
Assets held in portfolio . . . . . . . . . . . ¥ 572,478
As of March 31, 2010 and 2009, the amount of the subordinated interests measured at fair value relating to these securitizations of lease receivables was ¥77,756 million ($836,086 thousand) and ¥87,247 million, respectively.
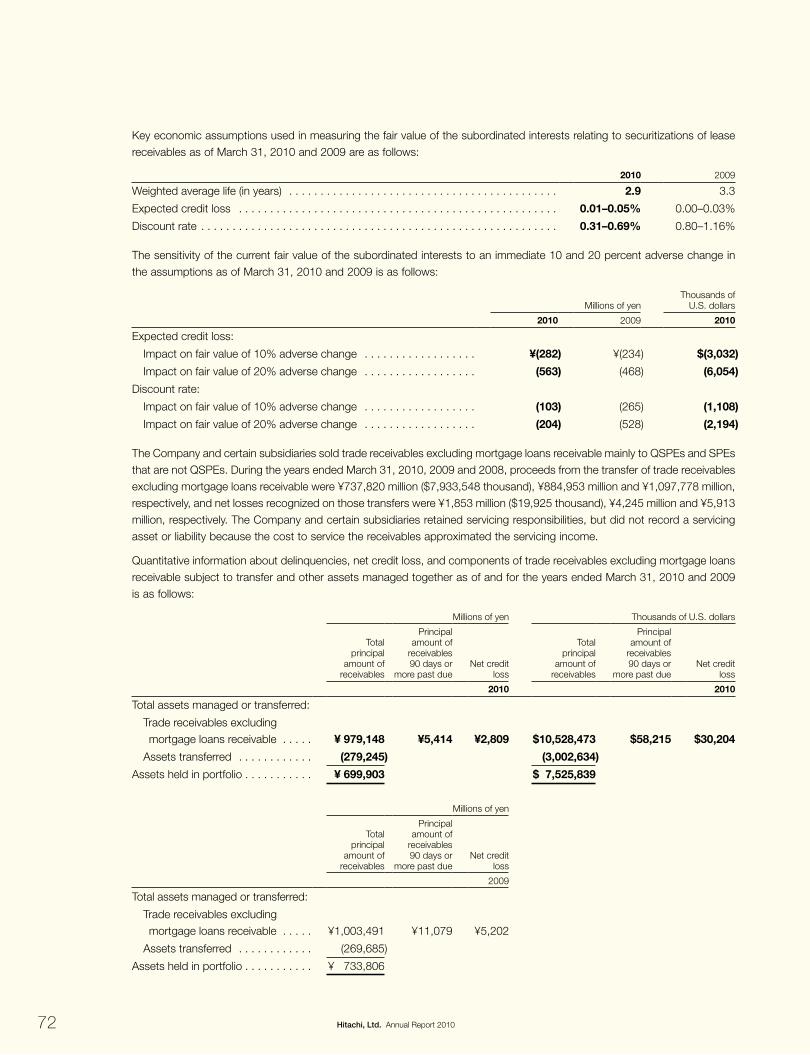
72 Hitachi, Ltd. Annual Report 2010
Key economic assumptions used in measuring the fair value of the subordinated interests relating to securitizations of lease receivables as of March 31, 2010 and 2009 are as follows:
2010 2009
Weighted average life (in years) . . . . . . . . . . . . . . . . . . . . . . . . . . . . . . . . . . . . . . . . . . . 2.9 3.3
Expected credit loss . . . . . . . . . . . . . . . . . . . . . . . . . . . . . . . . . . . . . . . . . . . . . . . . . . . 0.01–0.05% 0.00–0.03%
Discount rate . . . . . . . . . . . . . . . . . . . . . . . . . . . . . . . . . . . . . . . . . . . . . . . . . . . . . . . . . 0.31–0.69% 0.80–1.16%
The sensitivity of the current fair value of the subordinated interests to an immediate 10 and 20 percent adverse change in the assumptions as of March 31, 2010 and 2009 is as follows:
Millions of yenThousands of
U.S. dollars
2010 2009 2010
Expected credit loss:
Impact on fair value of 10% adverse change . . . . . . . . . . . . . . . . . . ¥(282) ¥(234) $(3,032)
Impact on fair value of 20% adverse change . . . . . . . . . . . . . . . . . . (563) (468) (6,054)
Discount rate:
Impact on fair value of 10% adverse change . . . . . . . . . . . . . . . . . . (103) (265) (1,108)
Impact on fair value of 20% adverse change . . . . . . . . . . . . . . . . . . (204) (528) (2,194)
The Company and certain subsidiaries sold trade receivables excluding mortgage loans receivable mainly to QSPEs and SPEs that are not QSPEs. During the years ended March 31, 2010, 2009 and 2008, proceeds from the transfer of trade receivables excluding mortgage loans receivable were ¥737,820 million ($7,933,548 thousand), ¥884,953 million and ¥1,097,778 million, respectively, and net losses recognized on those transfers were ¥1,853 million ($19,925 thousand), ¥4,245 million and ¥5,913 million, respectively. The Company and certain subsidiaries retained servicing responsibilities, but did not record a servicing asset or liability because the cost to service the receivables approximated the servicing income.
Quantitative information about delinquencies, net credit loss, and components of trade receivables excluding mortgage loans receivable subject to transfer and other assets managed together as of and for the years ended March 31, 2010 and 2009 is as follows:
Millions of yen Thousands of U.S. dollars
Total principal
amount of receivables
Principal amount of
receivables 90 days or
more past dueNet credit
loss
Total principal
amount of receivables
Principal amount of
receivables 90 days or
more past dueNet credit
loss
2010 2010
Total assets managed or transferred:
Trade receivables excluding mortgage loans receivable . . . . . ¥ 979,148 ¥5,414 ¥2,809 $10,528,473 $58,215 $30,204
Assets transferred . . . . . . . . . . . . (279,245) (3,002,634)
Assets held in portfolio . . . . . . . . . . . ¥ 699,903 $ 7,525,839
Millions of yen
Total principal
amount of receivables
Principal amount of
receivables 90 days or
more past dueNet credit
loss
2009
Total assets managed or transferred:
Trade receivables excluding mortgage loans receivable . . . . . ¥1,003,491 ¥11,079 ¥5,202
Assets transferred . . . . . . . . . . . . (269,685)
Assets held in portfolio . . . . . . . . . . . ¥ 733,806

73Hitachi, Ltd. Annual Report 2010
As of March 31, 2010 and 2009, the amount of the subordinated interests relating to these securitizations of trade receivables excluding mortgage loans receivable was ¥45,249 million ($486,548 thousand) and ¥20,807 million, respectively.
A portion of these trade receivables excluding mortgage loans receivable was transferred to QSPEs. The aggregate cash received from and paid to the QSPEs for the years ended March 31, 2010 and 2009, and the outstanding balance as of March 31, 2010 and 2009, are summarized as follows:
Millions of yenThousands of
U.S. dollars
2010 2009 2010
Proceeds from transfer of trade receivables . . . . . . . . . . . . . . . . . . . . . ¥362,147 ¥490,647 $3,894,054
Net loss recognized on those transfers . . . . . . . . . . . . . . . . . . . . . . . . (616) (993) (6,624)
Outstanding balance of transferred receivables . . . . . . . . . . . . . . . . . . 75,654 98,214 813,484
Hitachi Capital Corporation sold mortgage loans receivable to SPEs that are not QSPEs. For the years ended March 31, 2010, 2009 and 2008, no proceeds from the transfer of mortgage loans receivable were recorded. The subsidiary retained servicing responsibilities but did not record a servicing asset or liability because the cost to service the receivables approximated the servicing income.
Quantitative information about delinquencies, net credit loss, and components of mortgage loans receivable subject to transfer and other assets managed together as of and for the years ended March 31, 2010 and 2009 is as follows:
Millions of yen Thousands of U.S. dollars
Total principal
amount of receivables
Principal amount of
receivables 90 days or
more past dueNet credit
loss
Total principal
amount of receivables
Principal amount of
receivables 90 days or
more past dueNet credit
loss
2010 2010
Total assets managed or transferred:
Mortgage loans receivable . . . . . . ¥ 224,449 ¥– ¥12 $ 2,413,430 $– $129
Assets transferred . . . . . . . . . . . . (210,834) (2,267,032)
Assets held in portfolio . . . . . . . . . . . ¥ 13,615 $ 146,398
Millions of yen
Total principal
amount of receivables
Principal amount of
receivables 90 days or
more past dueNet credit
loss
2009
Total assets managed or transferred:
Mortgage loans receivable . . . . . . ¥ 247,058 ¥0 ¥69
Assets transferred . . . . . . . . . . . . (232,553)
Assets held in portfolio . . . . . . . . . . . ¥ 14,505
As of March 31, 2010 and 2009, the amount of the subordinated interests measured at fair value relating to securitizations of mortgage loans receivable was ¥37,661 million ($404,957 thousand) and ¥36,218 million respectively.
Key economic assumptions used in measuring the fair value of the subordinated interests relating to securitizations of mortgage loans receivable as of March 31, 2010 and 2009 are as follows:
2010 2009
Weighted average life (in years) . . . . . . . . . . . . . . . . . . . . . . . . . . . . . . . . . . . . . . . . . . . . 10.4 11.4
Expected credit loss . . . . . . . . . . . . . . . . . . . . . . . . . . . . . . . . . . . . . . . . . . . . . . . . . . . . 0.02% 0.01%
Discount rate . . . . . . . . . . . . . . . . . . . . . . . . . . . . . . . . . . . . . . . . . . . . . . . . . . . . . . . . . . 1.89–3.41% 1.76–2.03%
Prepayment rate . . . . . . . . . . . . . . . . . . . . . . . . . . . . . . . . . . . . . . . . . . . . . . . . . . . . . . . 0.33% 1.00%

74 Hitachi, Ltd. Annual Report 2010
The sensitivity of the current fair value of the subordinated interests to an immediate 10 and 20 percent adverse change in the assumptions as of March 31, 2010 and 2009 are as follows:
Millions of yenThousands of
U.S. dollars
2010 2009 2010
Expected credit loss:
Impact on fair value of 10% adverse change . . . . . . . . . . . . . . . . . . ¥ (162) ¥ (126) $ (1,742)
Impact on fair value of 20% adverse change . . . . . . . . . . . . . . . . . . (323) (253) (3,473)
Discount rate:
Impact on fair value of 10% adverse change . . . . . . . . . . . . . . . . . . (940) (619) (10,108)
Impact on fair value of 20% adverse change . . . . . . . . . . . . . . . . . . (1,847) (1,225) (19,860)
Prepayment rate:
Impact on fair value of 10% adverse change . . . . . . . . . . . . . . . . . . (318) (402) (3,419)
Impact on fair value of 20% adverse change . . . . . . . . . . . . . . . . . . (625) (756) (6,720)
The sensitivities presented in this note are hypothetical and should be used with caution. As the figures indicate, changes in fair value based on a 10 percent variation in assumptions generally cannot be extrapolated because the relationship of the change in assumption to the change in fair value may not be linear. Also, in the above tables, the effect of a variation in a particular assumption of the fair value of the interest is calculated without changing any other assumption; in reality, changes in one factor may result in changes in another, which might magnify or counteract the sensitivities.
8. gOOdwiLL ANd OthEr iNtANgiBLE ASSEtS
Intangible assets other than goodwill acquired during the years ended March 31, 2010, 2009 and 2008 amounted to ¥140,215 million ($1,507,688 thousand), ¥168,911 million and ¥167,397 million, respectively, and related amortization expense during the years ended March 31, 2010, 2009 and 2008 amounted to ¥116,065 million ($1,248,011 thousand), ¥178,164 million and ¥146,136 million, respectively.
The main component of intangible assets subject to amortization was capitalized software. Amortization of capitalized costs for software to be sold, leased or otherwise marketed is charged to cost of sales. The amounts charged during the years ended March 31, 2010, 2009 and 2008 were ¥40,128 million ($431,484 thousand), ¥85,841 million and ¥49,180 million, respectively.

75Hitachi, Ltd. Annual Report 2010
Intangible assets other than goodwill as of March 31, 2010 and 2009 are as follows:
Millions of yen
2010 2009
Gross carrying amount
Accumulated amortization
Net carrying amount
Gross carrying amount
Accumulated amortization
Net carrying amount
Amortized intangible assets:
Software . . . . . . . . . . . . . . . . . . ¥ 691,856 ¥ 580,138 ¥111,718 ¥ 659,097 ¥ 549,079 ¥110,018
Software for internal use . . . . . . 473,621 343,733 129,888 445,098 311,220 133,878
Patents . . . . . . . . . . . . . . . . . . . 106,815 87,526 19,289 103,489 75,456 28,033
Other . . . . . . . . . . . . . . . . . . . . . 145,892 99,952 45,940 132,926 92,834 40,092
¥1,418,184 ¥1,111,349 ¥306,835 ¥1,340,610 ¥1,028,589 ¥312,021
Indefinite-lived intangible assets . . . ¥ 8,259 ¥ – ¥ 8,259 ¥ 8,644 ¥ – ¥ 8,644
Thousands of U.S. dollars
2010
Gross carrying amount
Accumulated amortization
Net carrying amount
Amortized intangible assets:
Software . . . . . . . . . . . . . . . . . . $ 7,439,312 $ 6,238,043 $1,201,269
Software for internal use . . . . . . 5,092,699 3,696,054 1,396,645
Patents . . . . . . . . . . . . . . . . . . . 1,148,548 941,140 207,408
Other . . . . . . . . . . . . . . . . . . . . . 1,568,731 1,074,752 493,979
$15,249,290 $11,949,989 $3,299,301
Indefinite-lived intangible assets . . . $ 88,807 $ – $ 88,807
The following table shows the estimated aggregate amortization expense of intangible assets for the next five years.
Years ending March 31 Millions of yenThousands of
U.S. dollars
2011 . . . . . . . . . . . . . . . . . . . . . . . . . . . . . . . . . . . . . . . . . . . . . . . . . . . . . . . . . . . . . . ¥86,805 $933,387
2012 . . . . . . . . . . . . . . . . . . . . . . . . . . . . . . . . . . . . . . . . . . . . . . . . . . . . . . . . . . . . . . 66,763 717,882
2013 . . . . . . . . . . . . . . . . . . . . . . . . . . . . . . . . . . . . . . . . . . . . . . . . . . . . . . . . . . . . . . 47,323 508,849
2014 . . . . . . . . . . . . . . . . . . . . . . . . . . . . . . . . . . . . . . . . . . . . . . . . . . . . . . . . . . . . . . 28,332 304,645
2015 . . . . . . . . . . . . . . . . . . . . . . . . . . . . . . . . . . . . . . . . . . . . . . . . . . . . . . . . . . . . . . 16,521 177,645

76 Hitachi, Ltd. Annual Report 2010
The changes in the carrying amount of goodwill by reportable segment for the years ended March 31, 2010 and 2009 are as follows:
Millions of yen
2010
Information & Tele-
communication Systems
Construction Machinery
High Functional
Materials & Components
Components & Devices
Other Reportable Segments Total
Balance at beginning of year . . . . . . . ¥35,708 ¥ 4,987 ¥56,675 ¥ 9,995 ¥27,065 ¥134,430
Acquisition . . . . . . . . . . . . . . . . . . . 2,938 57,649 – 182 6,210 66,979
Impairment loss . . . . . . . . . . . . . . . – – – – (7,285) (7,285)
Translation adjustment and other . . (1,203) (1) – 117 (2,783) (3,870)
Balance at end of year . . . . . . . . . . . . ¥37,443 ¥62,635 ¥56,675 ¥10,294 ¥23,207 ¥190,254
Thousands of U.S. dollars
2010
Information & Tele-
communication Systems
Construction Machinery
High Functional
Materials & Components
Components & Devices
Other Reportable Segments Total
Balance at beginning of year . . . . . . . $383,957 $ 53,624 $609,408 $107,473 $291,022 $1,445,484
Acquisition . . . . . . . . . . . . . . . . . . . 31,591 619,882 – 1,957 66,774 720,204
Impairment loss . . . . . . . . . . . . . . . – – – – (78,333) (78,333)
Translation adjustment and other . . (12,935) (11) – 1,258 (29,925) (41,613)
Balance at end of year . . . . . . . . . . . . $402,613 $673,495 $609,408 $110,688 $249,538 $2,045,742
Millions of yen
2009
Information & Tele-
communication Systems
High Functional
Materials & Components
Automotive Systems
Components & Devices
Other Reportable Segments Total
Balance at beginning of year . . . . . . . ¥33,584 ¥55,359 ¥ 25,926 ¥11,857 ¥32,313 ¥159,039
Acquisition . . . . . . . . . . . . . . . . . . . 4,028 2,561 – – 2,270 8,859
Impairment loss . . . . . . . . . . . . . . . (3) (1,244) (22,060) – (1,253) (24,560)
Translation adjustment and other . . (1,901) (1) (88) (1,862) (5,056) (8,908)
Balance at end of year . . . . . . . . . . . . ¥35,708 ¥56,675 ¥ 3,778 ¥ 9,995 ¥28,274 ¥134,430
The Company does not have any accumulated impairment losses related to the goodwill balances as of March 31, 2010 and 2009 as the Company considers goodwill that has been fully impaired to be written-off.
The main component of goodwill acquired during the year ended March 31, 2010 was related to the additional acquisition of the ownership interests in a former affiliated company, Telco Construction Equipment Co., Ltd. to make it a subsidiary.
Mainly due to a large decline in global demand for automobiles, operating profits and cash flows were lower than expected in the Automotive Systems segment for the year ended March 31, 2009. Based on that trend, the earnings forecast for the succeeding three years was revised, and as such, the Company recorded a pre-tax goodwill impairment loss of ¥22,060 million during the year ended March 31, 2009. The fair value of that reporting unit was estimated using the present value of expected future cash flows and quoted market prices. Impairment losses are included in selling, general and administrative expenses in the consolidated statements of operations.

77Hitachi, Ltd. Annual Report 2010
9. iNCOmE tAxES
Components of income (loss) before income taxes and income taxes attributable to continuing operations are as follows:
Millions of yen
2010
Domestic Foreign Total
Income (loss) before income taxes . . . . . . . . . . . . . . . . . . . . . . . . . . . . . . . . . . ¥ (16,083) ¥79,663 ¥ 63,580
Income taxes:
Current tax expense . . . . . . . . . . . . . . . . . . . . . . . . . . . . . . . . . . . . . . . . . . . 60,428 27,103 87,531
Deferred tax expense (benefit) . . . . . . . . . . . . . . . . . . . . . . . . . . . . . . . . . . . 63,493 (3,053) 60,440
¥123,921 ¥24,050 ¥147,971
Thousands of U.S. dollars
2010
Domestic Foreign Total
Income (loss) before income taxes . . . . . . . . . . . . . . . . . . . . . . . . . . . . . . . . . . $ (172,935) $856,591 $ 683,656
Income taxes:
Current tax expense . . . . . . . . . . . . . . . . . . . . . . . . . . . . . . . . . . . . . . . . . . . 649,764 291,430 941,194
Deferred tax expense (benefit) . . . . . . . . . . . . . . . . . . . . . . . . . . . . . . . . . . . 682,720 (32,828) 649,892
$1,332,484 $258,602 $1,591,086
Millions of yen
2009
Domestic Foreign Total
Income (loss) before income taxes . . . . . . . . . . . . . . . . . . . . . . . . . . . . . . . . . . ¥(315,032) ¥25,161 ¥(289,871)
Income taxes:
Current tax expense . . . . . . . . . . . . . . . . . . . . . . . . . . . . . . . . . . . . . . . . . . . 75,612 25,669 101,281
Deferred tax expense . . . . . . . . . . . . . . . . . . . . . . . . . . . . . . . . . . . . . . . . . . 401,928 2,040 403,968
¥ 477,540 ¥27,709 ¥ 505,249
Millions of yen
2008
Domestic Foreign Total
Income before income taxes . . . . . . . . . . . . . . . . . . . . . . . . . . . . . . . . . . . . . . ¥257,084 ¥67,698 ¥324,782
Income taxes:
Current tax expense . . . . . . . . . . . . . . . . . . . . . . . . . . . . . . . . . . . . . . . . . . . 140,262 47,314 187,576
Deferred tax expense (benefit) . . . . . . . . . . . . . . . . . . . . . . . . . . . . . . . . . . . 88,720 (4,133) 84,587
¥228,982 ¥43,181 ¥272,163

78 Hitachi, Ltd. Annual Report 2010
Significant components of income tax expense (benefit) attributable to continuing operations and other comprehensive income (loss), net of reclassification adjustments, for the years ended March 31, 2010, 2009 and 2008 are as follows:
Millions of yenThousands of
U.S. dollars
2010 2009 2008 2010
Continuing operations:
Current tax expense . . . . . . . . . . . . . . . . . . . . . . . . . . . . . . . . ¥ 87,531 ¥ 101,281 ¥ 187,576 $ 941,194
Deferred tax benefit (exclusive of the effects of other components listed below) . . . . . . . . . . . . . . . . . . . . . . (19,350) (187,751) (64,422) (208,065)
Change in valuation allowance . . . . . . . . . . . . . . . . . . . . . . . . 79,790 591,719 149,009 857,957
147,971 505,249 272,163 1,591,086
Other comprehensive income (loss), net of reclassification adjustments:
Pension liability adjustments . . . . . . . . . . . . . . . . . . . . . . . . . . 25,738 (53,171) (61,538) 276,753
Net unrealized holding gain on available-for-sale securities . . . 11,692 (14,915) (39,318) 125,720
Cash flow hedges . . . . . . . . . . . . . . . . . . . . . . . . . . . . . . . . . 720 (2,323) 205 7,742
38,150 (70,409) (100,651) 410,215
¥186,121 ¥ 434,840 ¥ 171,512 $2,001,301
The Company and its domestic subsidiaries are subject to a national corporate tax of 30%, an inhabitant tax of between 17.3% and 20.7% of the national corporate tax and a combined deductible business tax and special local corporation tax between 3.8% and 10.1%, which in the aggregate resulted in a combined statutory income tax rate of approximately 40.6% for the year ended March 31, 2010.
The Company and its domestic subsidiaries were subject to a national corporate tax of 30%, an inhabitant tax of between 17.3% and 20.7% of the national corporate tax and a deductible business tax between 3.8% and 10.1%, which in the aggregate resulted in a combined statutory income tax rate of approximately 40.6% for the years ended March 31, 2009 and 2008.
The Company adopted the consolidated taxation system in Japan effective from the year ended March 31, 2003. Under the consolidated taxation system, the Company consolidates, for Japanese tax purposes, all wholly-owned domestic subsidiaries.
Reconciliations between the combined statutory income tax rate and the effective income tax rate as a percentage of income (loss) before income taxes are as follows:
2010 2009 2008
Combined statutory income tax rate . . . . . . . . . . . . . . . . . . . . . . . . . . . . . . . . 40.6% (40.6)% 40.6%
Equity in net (earnings) loss of affiliated companies . . . . . . . . . . . . . . . . . . . 37.1 22.7 (2.8)
Impairment of investments in affiliated companies . . . . . . . . . . . . . . . . . . . . 9.7 1.6 0.3
Change in excess amounts over the tax basis of investments in subsidiaries and affiliated companies . . . . . . . . . . . . . . . . . . . . . . . . . . . (0.9) (18.3) 1.7
Adjustment on sale of investments in subsidiaries and affiliated companies . . (0.0) 0.5 (7.9)
Expenses not deductible for tax purposes . . . . . . . . . . . . . . . . . . . . . . . . . . 35.6 5.4 4.0
Impairment of goodwill . . . . . . . . . . . . . . . . . . . . . . . . . . . . . . . . . . . . . . . . . 4.6 3.4 0.9
Change in valuation allowance . . . . . . . . . . . . . . . . . . . . . . . . . . . . . . . . . . . 125.5 204.1 45.9
Difference in statutory tax rates of foreign subsidiaries . . . . . . . . . . . . . . . . . (20.8) (4.0) 2.2
Other, net . . . . . . . . . . . . . . . . . . . . . . . . . . . . . . . . . . . . . . . . . . . . . . . . . . . 1.3 (0.5) (1.1)
Effective income tax rate . . . . . . . . . . . . . . . . . . . . . . . . . . . . . . . . . . . . . . . . . 232.7% 174.3% 83.8%

79Hitachi, Ltd. Annual Report 2010
An increase in valuation allowance for the year ended March 31, 2010 related primarily to the addition of certain previously consolidated domestic subsidiaries to the Company’s consolidated taxation group when they became wholly-owned during the year ended March 31, 2010. A valuation allowance was recorded for these subsidiaries’ deferred tax assets as the Company concluded that it was not more-likely-than-not that these deferred tax assets would be realized within the consolidated taxation group.
The Company recognized an additional valuation allowance during the year ended March 31, 2009 resulting from the reassessment of the realizability of the beginning of the year deferred tax assets mainly related to the deductible temporary differences associated with retirement benefits and net operating loss carryforwards. The Company concluded that the generation of significant taxable income of the Company and certain subsidiaries was not expected in the near future and therefore increased the valuation allowance related to the deferred tax assets associated with those entities.
An increase in valuation allowance for the year ended March 31, 2008 resulted mainly from a decline in profitability in the plasma TV business.
The tax effects of temporary differences and carryforwards that give rise to significant portions of the deferred tax assets and liabilities as of March 31, 2010 and 2009 are presented below:
Millions of yenThousands of
U.S. dollars
2010 2009 2010
Total gross deferred tax assets:
Retirement and severance benefits . . . . . . . . . . . . . . . . . . . . . . . . . . ¥ 406,838 ¥ 467,356 $ 4,374,602
Accrued expenses . . . . . . . . . . . . . . . . . . . . . . . . . . . . . . . . . . . . . . . 292,644 295,334 3,146,710
Property, plant and equipment, due to differences in depreciation . . . 63,534 56,522 683,161
Investment in securities . . . . . . . . . . . . . . . . . . . . . . . . . . . . . . . . . . . 68,158 89,145 732,882
Net operating loss carryforwards . . . . . . . . . . . . . . . . . . . . . . . . . . . . 273,549 214,017 2,941,387
Other . . . . . . . . . . . . . . . . . . . . . . . . . . . . . . . . . . . . . . . . . . . . . . . . . 226,134 279,537 2,431,548
1,330,857 1,401,911 14,310,290
Valuation allowance . . . . . . . . . . . . . . . . . . . . . . . . . . . . . . . . . . . . . . . . (1,076,848) (1,067,145) (11,579,011)
254,009 334,766 2,731,279
Total gross deferred tax liabilities:
Deferred profit on sale of properties . . . . . . . . . . . . . . . . . . . . . . . . . . (27,955) (27,172) (300,591)
Tax purpose reserves regulated by Japanese tax laws . . . . . . . . . . . . (6,961) (7,658) (74,850)
Other . . . . . . . . . . . . . . . . . . . . . . . . . . . . . . . . . . . . . . . . . . . . . . . . . (66,627) (50,501) (716,419)
(101,543) (85,331) (1,091,860)
Net deferred tax asset . . . . . . . . . . . . . . . . . . . . . . . . . . . . . . . . . . . . ¥ 152,466 ¥ 249,435 $ 1,639,419
In addition to the above, income taxes paid on net intercompany profit on assets remaining within the group, which had been deferred in accordance with ASC 810, “Consolidation,” as of March 31, 2010 and 2009 are reflected in the accompanying consolidated balance sheets under the following captions:
Millions of yenThousands of
U.S. dollars
2010 2009 2010
Prepaid expenses and other current assets . . . . . . . . . . . . . . . . . . . . . . ¥23,090 ¥19,164 $248,279
Other assets . . . . . . . . . . . . . . . . . . . . . . . . . . . . . . . . . . . . . . . . . . . . . 49,622 52,044 533,570
¥72,712 ¥71,208 $781,849
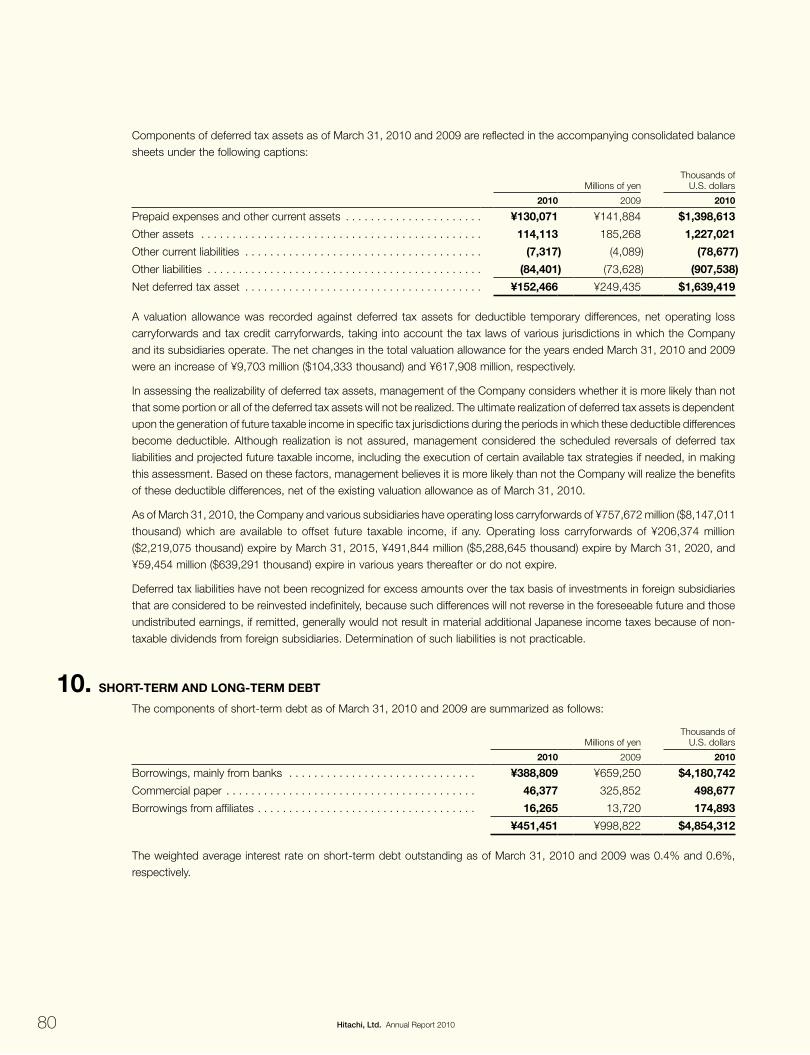
80 Hitachi, Ltd. Annual Report 2010
Components of deferred tax assets as of March 31, 2010 and 2009 are reflected in the accompanying consolidated balance sheets under the following captions:
Millions of yenThousands of
U.S. dollars
2010 2009 2010
Prepaid expenses and other current assets . . . . . . . . . . . . . . . . . . . . . . ¥130,071 ¥141,884 $1,398,613
Other assets . . . . . . . . . . . . . . . . . . . . . . . . . . . . . . . . . . . . . . . . . . . . . 114,113 185,268 1,227,021
Other current liabilities . . . . . . . . . . . . . . . . . . . . . . . . . . . . . . . . . . . . . . (7,317) (4,089) (78,677)
Other liabilities . . . . . . . . . . . . . . . . . . . . . . . . . . . . . . . . . . . . . . . . . . . . (84,401) (73,628) (907,538)
Net deferred tax asset . . . . . . . . . . . . . . . . . . . . . . . . . . . . . . . . . . . . . . ¥152,466 ¥249,435 $1,639,419
A valuation allowance was recorded against deferred tax assets for deductible temporary differences, net operating loss carryforwards and tax credit carryforwards, taking into account the tax laws of various jurisdictions in which the Company and its subsidiaries operate. The net changes in the total valuation allowance for the years ended March 31, 2010 and 2009 were an increase of ¥9,703 million ($104,333 thousand) and ¥617,908 million, respectively.
In assessing the realizability of deferred tax assets, management of the Company considers whether it is more likely than not that some portion or all of the deferred tax assets will not be realized. The ultimate realization of deferred tax assets is dependent upon the generation of future taxable income in specific tax jurisdictions during the periods in which these deductible differences become deductible. Although realization is not assured, management considered the scheduled reversals of deferred tax liabilities and projected future taxable income, including the execution of certain available tax strategies if needed, in making this assessment. Based on these factors, management believes it is more likely than not the Company will realize the benefits of these deductible differences, net of the existing valuation allowance as of March 31, 2010.
As of March 31, 2010, the Company and various subsidiaries have operating loss carryforwards of ¥757,672 million ($8,147,011 thousand) which are available to offset future taxable income, if any. Operating loss carryforwards of ¥206,374 million ($2,219,075 thousand) expire by March 31, 2015, ¥491,844 million ($5,288,645 thousand) expire by March 31, 2020, and ¥59,454 million ($639,291 thousand) expire in various years thereafter or do not expire.
Deferred tax liabilities have not been recognized for excess amounts over the tax basis of investments in foreign subsidiaries that are considered to be reinvested indefinitely, because such differences will not reverse in the foreseeable future and those undistributed earnings, if remitted, generally would not result in material additional Japanese income taxes because of non-taxable dividends from foreign subsidiaries. Determination of such liabilities is not practicable.
10. ShOrt-tErm ANd LONg-tErm dEBt
The components of short-term debt as of March 31, 2010 and 2009 are summarized as follows:
Millions of yenThousands of
U.S. dollars
2010 2009 2010
Borrowings, mainly from banks . . . . . . . . . . . . . . . . . . . . . . . . . . . . . . ¥388,809 ¥659,250 $4,180,742
Commercial paper . . . . . . . . . . . . . . . . . . . . . . . . . . . . . . . . . . . . . . . . 46,377 325,852 498,677
Borrowings from affiliates . . . . . . . . . . . . . . . . . . . . . . . . . . . . . . . . . . . 16,265 13,720 174,893
¥451,451 ¥998,822 $4,854,312
The weighted average interest rate on short-term debt outstanding as of March 31, 2010 and 2009 was 0.4% and 0.6%, respectively.

81Hitachi, Ltd. Annual Report 2010
The components of long-term debt as of March 31, 2010 and 2009 are summarized as follows:
Millions of yenThousands of
U.S. dollars
2010 2009 2010
Unsecured notes and debentures:
Due 2013, interest 0.72% debenture . . . . . . . . . . . . . . . . . . . . . . . . ¥ 80,000 ¥ 80,000 $ 860,215
Due 2010, interest 0.7% debenture . . . . . . . . . . . . . . . . . . . . . . . . . 49,898 49,895 536,538
Due 2015, interest 1.56% debenture . . . . . . . . . . . . . . . . . . . . . . . . 49,987 49,984 537,495
Due 2010, interest 0.74% debenture . . . . . . . . . . . . . . . . . . . . . . . . 5,000 5,000 53,763
Due 2010–2018, interest 0.58–2.78%, issued by subsidiaries . . . . . 457,726 451,293 4,921,785
Unsecured convertible debentures:
Series A, due 2009, zero coupon . . . . . . . . . . . . . . . . . . . . . . . . . . . – 50,000 –
Series B, due 2009, zero coupon . . . . . . . . . . . . . . . . . . . . . . . . . . . – 50,000 –
Due 2014, interest 0.1% debenture . . . . . . . . . . . . . . . . . . . . . . . . . 99,998 – 1,075,247
Due 2016 and 2019, zero coupon, issued by a subsidiary . . . . . . . . 40,000 40,000 430,108
Loans, principally from banks and insurance companies:
Secured by various assets and mortgages on property, plant and equipment, maturing 2010–2024, interest 1.89–5.4% . . . 68,841 45,081 740,226
Unsecured, maturing 2010–2026, interest 0.65–6.97% . . . . . . . . . . 1,030,323 966,488 11,078,742
Capital lease obligations . . . . . . . . . . . . . . . . . . . . . . . . . . . . . . . . . . . 33,919 33,546 364,720
1,915,692 1,821,287 20,598,839
Less current portion . . . . . . . . . . . . . . . . . . . . . . . . . . . . . . . . . . . . . . . 303,730 531,635 3,265,914
¥1,611,962 ¥1,289,652 $17,332,925
The aggregate annual maturities of long-term debt after March 31, 2011 are as follows:
Years ending March 31 Millions of yenThousands of
U.S. dollars
2012 . . . . . . . . . . . . . . . . . . . . . . . . . . . . . . . . . . . . . . . . . . . . . . . . . . . . . . . . . . . . . . . ¥ 403,230 $ 4,335,807
2013 . . . . . . . . . . . . . . . . . . . . . . . . . . . . . . . . . . . . . . . . . . . . . . . . . . . . . . . . . . . . . . . 349,833 3,761,645
2014 . . . . . . . . . . . . . . . . . . . . . . . . . . . . . . . . . . . . . . . . . . . . . . . . . . . . . . . . . . . . . . . 225,018 2,419,548
2015 . . . . . . . . . . . . . . . . . . . . . . . . . . . . . . . . . . . . . . . . . . . . . . . . . . . . . . . . . . . . . . . 326,791 3,513,882
Thereafter . . . . . . . . . . . . . . . . . . . . . . . . . . . . . . . . . . . . . . . . . . . . . . . . . . . . . . . . . . . 307,090 3,302,043
¥1,611,962 $17,332,925

82 Hitachi, Ltd. Annual Report 2010
Short-term and long-term debt above include secured borrowings resulting mainly from the transfers of trade receivables that do not meet the criteria for a sale pursuant to ASC 860 and are accounted for as secured borrowings with pledge of collateral. The transferred assets are restricted solely to satisfy the obligation, and the pledged assets approximate the amount of such borrowings. Short-term debt above as of March 31, 2010 and 2009 includes such borrowings of ¥2,449 million ($26,333 thousand) and ¥10,008 million, and long-term debt above as of March 31, 2010 and 2009 includes such borrowings of ¥52,650 million ($566,129 thousand) and ¥36,096 million, respectively.
As is customary in Japan, both short-term and long-term bank loans are made under general agreements that provide that securities and guarantees for present and future indebtedness will be given upon request of the bank, and that the bank shall have the right, as the obligations become due, or in the event of their default, to offset cash deposits against such obligations.
Generally, the mortgage debenture trust agreements and certain secured and unsecured loan agreements provide, among other things, that the lenders or trustees shall have the right to have any distribution of earnings, including the payment of dividends and the issuance of additional capital stock, submitted to them for prior approval and also grant them the right to request additional securities or mortgages on property, plant and equipment.
In December 2009, the Company issued ¥100,000 million ($1,075,269 thousand) convertible bonds due 2014. The bondholders are entitled to stock acquisition rights effective from January 4, 2010 to December 10, 2014. The initial conversion price is ¥317 ($3.41) per share. Aside from the standard antidilution provisions, the conversion price shall be reduced for a certain period before the early redemption triggered upon the occurrence of a corporate event or delisting event. The reduction of the conversion price will be based on the premium which is based on the Company’s common stock price and the effective date of the reduction. The reduced price will range from ¥238 ($2.56) to ¥317 ($3.41). When each of the closing prices of the shares of the Company’s common stock at the Tokyo Stock Exchange on 20 continuous trading days are 130% or more of the conversion price of the bonds applicable on those trading days, the Company has the option to redeem all the remaining bonds on a specified redemption date after January 3, 2013 at a rate of ¥100 ($1.08) per ¥100 ($1.08) of each bond. The Company was not required to bifurcate any of the embedded features contained in these bonds for accounting purposes.
In September 2007, Hitachi Metals Ltd. (the issuer), a subsidiary of the Company, issued ¥20,000 million Euroyen zero coupon convertible bonds due 2016 (the 2016 bonds) and ¥20,000 million Euroyen zero coupon convertible bonds due 2019 (the 2019 bonds) (together, “the Bonds”). In the case of the 2016 bonds, the bondholders are entitled to stock acquisition rights effective from September 27, 2007 to August 30, 2016 and the initial conversion price is ¥2,056 per share. In the case of the 2019 bonds, the bondholders are entitled to stock acquisition rights effective from September 27, 2007 to August 30, 2019 and the initial conversion price is ¥2,042 per share. The closing price of the shares on August 28, 2007, as reported by Tokyo Stock Exchange, was ¥1,344 per share. The stock acquisition rights may be exercised by the holder of the bonds during any particular calendar quarter only if the closing price of the shares for any 20 trading days in a period of 30 consecutive trading days ending on the last trading day of the immediately preceding calendar quarter is more than 120% of the conversion price. The Bonds also contain other embedded features, none of which were required to be bifurcated, such as the issuer’s call option, the issuer’s cash-settlement option, and the investors’ put option. By giving notice to the bondholders on or after September 13, 2012 (in the case of the 2016 bonds), or on or after September 13, 2014 (in the case of the 2019 bonds), the issuer may acquire from all bondholders all of the relevant bonds under the cash-settlement option, and upon reacquiring the Bonds, the issuer is required to pay the bondholders cash equal to 100% of the principal amount and deliver common shares of the issuer with a fair value equivalent to the fair value of the stock acquisition rights. As for the put option, the bondholders are entitled, at their option, to require the issuer to redeem the Bonds at a redemption price of 100% of the principal amount on September 13, 2010 and September 13, 2013 (with respect to the 2016 bonds) and on September 13, 2011 and September 11, 2015 (with respect to the 2019 bonds).

83Hitachi, Ltd. Annual Report 2010
11. rEtirEmENt ANd SEvErANCE BENEFitS
(a) Defined benefit plansThe Company and its subsidiaries have a number of contributory funded defined benefit pension plans and unfunded lump-sum payment plans to provide retirement and severance benefits to substantially all employees.
The Company and certain subsidiaries make contributions to a number of contributory funded defined benefit pension plans. The Company and certain subsidiaries adopted cash balance plans, and certain subsidiaries amended certain of their defined benefit plans to cash balance plans during the years ended March 31, 2010, 2009 and 2008.
Under the cash balance plans, each employee has a notional account which represents pension benefits. The balance in the notional account is based on principal credits, which are accumulated as employees render services, and interest credits, which are determined based on the market interest rates.
Under unfunded lump-sum payment plans, employees are entitled to lump-sum payments based on their earnings and the length of service at retirement or termination of employment for reasons other than dismissal for cause.
Net periodic benefit cost for the funded benefit pension plans and the unfunded lump-sum payment plans for the years ended March 31, 2010, 2009 and 2008 consists of the following components:
Millions of yenThousands of
U.S. dollars
2010 2009 2008 2010
Service cost . . . . . . . . . . . . . . . . . . . . . . . . . . . . . . . . . . . . . . . . ¥ 71,777 ¥ 72,064 ¥ 71,577 $ 771,796
Interest cost . . . . . . . . . . . . . . . . . . . . . . . . . . . . . . . . . . . . . . . 55,352 54,701 56,079 595,183
Expected return on plan assets for the period . . . . . . . . . . . . . . (33,564) (45,804) (44,911) (360,903)
Amortization of prior service benefit . . . . . . . . . . . . . . . . . . . . . . (22,005) (21,103) (23,627) (236,613)
Recognized actuarial loss . . . . . . . . . . . . . . . . . . . . . . . . . . . . . 96,399 71,857 58,326 1,036,548
Transfer to defined contribution pension plan . . . . . . . . . . . . . . . 39 (1,289) (1,611) 419
Curtailments gain . . . . . . . . . . . . . . . . . . . . . . . . . . . . . . . . . . . . (227) – (388) (2,441)
Settlements loss . . . . . . . . . . . . . . . . . . . . . . . . . . . . . . . . . . . . 603 – – 6,484
Employees’ contributions . . . . . . . . . . . . . . . . . . . . . . . . . . . . . . (164) (489) (346) (1,763)
Net periodic benefit cost . . . . . . . . . . . . . . . . . . . . . . . . . . . . . . ¥168,210 ¥129,937 ¥115,099 $1,808,710
The estimated prior service cost and actuarial loss for the defined benefit pension plans that will be amortized from accumulated other comprehensive income (loss) into net periodic benefit cost during the year ending March 31, 2011 are as follows:
Millions of yenThousands of
U.S. dollars
Prior service benefit . . . . . . . . . . . . . . . . . . . . . . . . . . . . . . . . . . . . . . . . . . . . . . . . . . . . . . ¥(22,315) $(239,946)
Actuarial loss . . . . . . . . . . . . . . . . . . . . . . . . . . . . . . . . . . . . . . . . . . . . . . . . . . . . . . . . . . . 90,656 974,796

84 Hitachi, Ltd. Annual Report 2010
Reconciliations of beginning and ending balances of the benefit obligation and the fair value of plan assets of the contributory funded defined benefit pension plans and the benefit obligation of unfunded lump-sum payment plans are as follows:
Millions of yenThousands of
U.S. dollars
2010 2009 2010
Change in benefit obligation:
Benefit obligation at beginning of year . . . . . . . . . . . . . . . . . . . . . . . . ¥2,205,459 ¥2,219,577 $23,714,613
Service cost . . . . . . . . . . . . . . . . . . . . . . . . . . . . . . . . . . . . . . . . . . . . 71,777 72,064 771,796
Interest cost . . . . . . . . . . . . . . . . . . . . . . . . . . . . . . . . . . . . . . . . . . . . 55,352 54,701 595,183
Plan amendments . . . . . . . . . . . . . . . . . . . . . . . . . . . . . . . . . . . . . . . 275 (2,155) 2,957
Actuarial (gain) loss . . . . . . . . . . . . . . . . . . . . . . . . . . . . . . . . . . . . . . 26,734 (33,410) 287,462
Benefits paid . . . . . . . . . . . . . . . . . . . . . . . . . . . . . . . . . . . . . . . . . . . (160,046) (155,712) (1,720,925)
Acquisitions and divestitures . . . . . . . . . . . . . . . . . . . . . . . . . . . . . . . 396 90,984 4,258
Transfer to defined contribution pension plan . . . . . . . . . . . . . . . . . . . (996) (28,643) (10,710)
Curtailments . . . . . . . . . . . . . . . . . . . . . . . . . . . . . . . . . . . . . . . . . . . 129 – 1,387
Settlements . . . . . . . . . . . . . . . . . . . . . . . . . . . . . . . . . . . . . . . . . . . . (3,956) – (42,537)
Foreign currency exchange rate changes . . . . . . . . . . . . . . . . . . . . . . (1,675) (11,947) (18,011)
Benefit obligation at end of year . . . . . . . . . . . . . . . . . . . . . . . . . . . . . 2,193,449 2,205,459 23,585,473
Change in plan assets:
Fair value of plan assets at beginning of year . . . . . . . . . . . . . . . . . . . 1,123,646 1,381,049 12,082,215
Actual return on plan assets . . . . . . . . . . . . . . . . . . . . . . . . . . . . . . . . 169,004 (295,345) 1,817,247
Employers’ contributions . . . . . . . . . . . . . . . . . . . . . . . . . . . . . . . . . . 100,299 106,826 1,078,484
Employees’ cash contributions . . . . . . . . . . . . . . . . . . . . . . . . . . . . . . 164 489 1,763
Benefits paid . . . . . . . . . . . . . . . . . . . . . . . . . . . . . . . . . . . . . . . . . . . (117,835) (107,993) (1,267,043)
Acquisitions and divestitures . . . . . . . . . . . . . . . . . . . . . . . . . . . . . . . 270 49,899 2,903
Transfer to defined contribution pension plan . . . . . . . . . . . . . . . . . . . (954) (1,346) (10,258)
Settlements . . . . . . . . . . . . . . . . . . . . . . . . . . . . . . . . . . . . . . . . . . . . (3,956) – (42,537)
Foreign currency exchange rate changes . . . . . . . . . . . . . . . . . . . . . . (1,505) (9,933) (16,183)
Fair value of plan assets at end of year . . . . . . . . . . . . . . . . . . . . . . . . 1,269,133 1,123,646 13,646,591
Funded status . . . . . . . . . . . . . . . . . . . . . . . . . . . . . . . . . . . . . . . . . . . . (924,316) (1,081,813) (9,938,882)
Amounts recognized in the consolidated balance sheets as of March 31, 2010 and 2009 are as follows:
Millions of yenThousands of
U.S. dollars
2010 2009 2010
Other assets . . . . . . . . . . . . . . . . . . . . . . . . . . . . . . . . . . . . . . . . . . . . . ¥ 11,409 ¥ 6,282 $ 122,677
Accrued expenses . . . . . . . . . . . . . . . . . . . . . . . . . . . . . . . . . . . . . . . . . (30,542) (38,498) (328,409)
Retirement and severance benefits . . . . . . . . . . . . . . . . . . . . . . . . . . . . (905,183) (1,049,597) (9,733,150)
¥(924,316) ¥(1,081,813) $(9,938,882)
Amounts recognized in accumulated other comprehensive loss as of March 31, 2010 and 2009 consist of:
Millions of yenThousands of
U.S. dollars
2010 2009 2010
Prior service benefit . . . . . . . . . . . . . . . . . . . . . . . . . . . . . . . . . . . . . . . . ¥(153,502) ¥(175,964) $(1,650,559)
Actuarial loss . . . . . . . . . . . . . . . . . . . . . . . . . . . . . . . . . . . . . . . . . . . . . 655,669 862,629 7,050,204
¥ 502,167 ¥ 686,665 $ 5,399,645

85Hitachi, Ltd. Annual Report 2010
The Company and all subsidiaries use their year-end as a measurement date. Weighted-average assumptions used to determine the year-end benefit obligations are as follows:
2010 2009
Discount rate . . . . . . . . . . . . . . . . . . . . . . . . . . . . . . . . . . . . . . . . . . . . . . . . . . . . . . . . . . . . . . 2.5% 2.6%
Rate of compensation increase . . . . . . . . . . . . . . . . . . . . . . . . . . . . . . . . . . . . . . . . . . . . . . . . 2.6% 2.7%
Weighted-average assumptions used to determine the net periodic pension cost for the years ended March 31, 2010, 2009 and 2008 are as follows:
2010 2009 2008
Discount rate . . . . . . . . . . . . . . . . . . . . . . . . . . . . . . . . . . . . . . . . . . . . . . . . . 2.6% 2.5% 2.5%
Expected long-term return on plan assets . . . . . . . . . . . . . . . . . . . . . . . . . . . 3.0% 3.4% 3.1%
Rate of compensation increase . . . . . . . . . . . . . . . . . . . . . . . . . . . . . . . . . . . 2.7% 2.7% 2.7%
The expected long-term rate of return on plan assets is developed for each asset class, and is determined primarily on historical returns on the plan assets and other factors.
The accumulated benefit obligation was ¥2,107,093 million ($22,656,914 thousand) as of March 31, 2010 and ¥2,104,708 million as of March 31, 2009.
Information for pension plans with accumulated benefit obligations in excess of plan assets and pension plans with projected benefit obligations in excess of plan assets is as follows:
Millions of yenThousands of
U.S. dollars
2010 2009 2010
Plans with accumulated benefit obligations in excess of plan assets:
Accumulated benefit obligations . . . . . . . . . . . . . . . . . . . . . . . . . . . . . ¥1,917,053 ¥2,063,535 $20,613,473
Plan assets . . . . . . . . . . . . . . . . . . . . . . . . . . . . . . . . . . . . . . . . . . . . 1,058,941 1,070,069 11,386,462
Plans with projected benefit obligations in excess of plan assets:
Projected benefit obligations . . . . . . . . . . . . . . . . . . . . . . . . . . . . . . . ¥2,061,648 ¥2,189,327 $22,168,258
Plan assets . . . . . . . . . . . . . . . . . . . . . . . . . . . . . . . . . . . . . . . . . . . . 1,125,923 1,101,232 12,106,699
The objective of the Company’s investment policy is to ensure a stable return from the plans’ investments over the long term, which allows the Company’s and certain subsidiaries’ pension funds to meet their future obligations, and the Company and certain subsidiaries attempt to maintain the pension funds in sound condition. In order to achieve the above objective, a target rate of return is established, taking into consideration the composition of participants, level of funded status, the Company’s and certain subsidiaries’ capacity to absorb risks and the current economic environment. Also, a target asset allocation is established to achieve a target rate of return, based on the expected rate of return by each asset class, the standard deviation of the rate of return and the correlation coefficient among the assets. The investments are diversified. Under the current target asset allocation, approximately 35 percent of plan assets are invested in equity securities and approximately 40 percent are invested in domestic and foreign government bonds and corporate bonds. The remaining 25 percent are invested in other assets, such as hedge funds, private equity funds and life insurance company general accounts. The Company and certain subsidiaries reduced the ratio of equity securities during the year ended March 31, 2010 in order to reduce the risks resulting from volatility in the equity markets. Rebalancing will occur if markets fluctuate in excess of certain levels. The Company and certain subsidiaries periodically review actual returns on assets, economic environments and their capacity to absorb risk and realign the target asset allocation if necessary.

86 Hitachi, Ltd. Annual Report 2010
The Company and certain subsidiaries prioritize the use of observable inputs in markets over the use of unobservable inputs when measuring fair value as follows:
Level 1Quoted prices for identical assets in active markets.
Level 2Quoted prices for similar assets in active markets; quoted prices associated with transactions that are not distressed for identical or similar assets in markets that are not active; or, valuations whose significant inputs are derived from or corroborated by observable market data.
Level 3Valuations using inputs that are not observable.
The following table presents the plan assets that are measured at fair value as of March 31, 2010.
Millions of yen
Fair Value Measurements
Total Level 1 Level 2 Level 3
Equity securities (a) . . . . . . . . . . . . . . . . . . . . . . . . . . . . . . . . ¥ 132,255 ¥131,264 ¥ 991 ¥ –
Government and municipal debt securities (b) . . . . . . . . . . . . 190,906 183,077 7,829 –
Corporate and other debt securities (c) . . . . . . . . . . . . . . . . . 50,770 – 31,277 19,493
Hedge funds (d) . . . . . . . . . . . . . . . . . . . . . . . . . . . . . . . . . . . 57,642 – 8,256 49,386
Securitization products (e) . . . . . . . . . . . . . . . . . . . . . . . . . . . 29,262 – – 29,262
Cash and cash equivalents . . . . . . . . . . . . . . . . . . . . . . . . . . 20,038 20,038 – –
Life insurance company general accounts (f) . . . . . . . . . . . . . 85,298 – 85,298 –
Commingled funds (g) . . . . . . . . . . . . . . . . . . . . . . . . . . . . . . 661,672 – 624,190 37,482
Other . . . . . . . . . . . . . . . . . . . . . . . . . . . . . . . . . . . . . . . . . . . 41,290 26,857 9,511 4,922
¥1,269,133 ¥361,236 ¥767,352 ¥140,545
Thousands of U.S. dollars
Fair Value Measurements
Total Level 1 Level 2 Level 3
Equity securities (a) . . . . . . . . . . . . . . . . . . . . . . . . . . . . . . . . $ 1,422,097 $1,411,441 $ 10,656 $ –
Government and municipal debt securities (b) . . . . . . . . . . . . 2,052,753 1,968,570 84,183 –
Corporate and other debt securities (c) . . . . . . . . . . . . . . . . . 545,914 – 336,312 209,602
Hedge funds (d) . . . . . . . . . . . . . . . . . . . . . . . . . . . . . . . . . . . 619,806 – 88,774 531,032
Securitization products (e) . . . . . . . . . . . . . . . . . . . . . . . . . . . 314,645 – – 314,645
Cash and cash equivalents . . . . . . . . . . . . . . . . . . . . . . . . . . 215,462 215,462 – –
Life insurance company general accounts (f) . . . . . . . . . . . . . 917,183 – 917,183 –
Commingled funds (g) . . . . . . . . . . . . . . . . . . . . . . . . . . . . . . 7,114,753 – 6,711,720 403,033
Other . . . . . . . . . . . . . . . . . . . . . . . . . . . . . . . . . . . . . . . . . . . 443,978 288,785 102,268 52,925
$13,646,591 $3,884,258 $8,251,096 $1,511,237
(a) Approximately 85 percent of equity securities are invested in Japan-listed stocks. Approximately 15 percent of equity securities are invested in stocks listed overseas. Equity securities are primarily valued at quoted market prices.
(b) Approximately 80 percent of government and municipal debt securities are invested in bonds issued in Japan and primarily consist of Japanese government bonds. Approximately 20 percent of government and municipal debt securities are invested in bonds issued in overseas markets and primarily consist of foreign government bonds. Government and municipal debt securities are primarily valued at prices provided by the securities industry, the industrial associations in each country, or prices which are calculated on the basis of market interest rates.

87Hitachi, Ltd. Annual Report 2010
(c) Approximately 30 percent of corporate and other debt securities are invested in bonds issued in Japan. Approximately 70 percent of corporate and other debt securities are invested in bonds issued in overseas markets. Corporate and other debt securities are mainly valued at prices provided by the securities industry, the industrial associations in each country, or prices which are calculated on the basis of market interest rates. If these values are not available, corporate and other debt securities are valued at theoretical prices, taking into consideration the interest rates of government bonds of the related countries, swap interest rates and credit risks.
(d) Hedge funds are invested primarily in relative value strategy funds, event driven funds, equity long/short funds, and macroeconomic and Commodity Trading Advisor (CTA) funds. Hedge funds are valued using the Net Asset Value (NAV) provided by the administrator of the fund. The NAV is based on the value of the underlying assets owned by the fund, minus its liabilities, and then divided by the number of units outstanding.
(e) Securitization products are invested primarily in collateralized loan obligations. These investments are valued at prices provided by financial institutions. The Company corroborates the prices, taking into consideration primarily the market values of the underlying loans, the market values of similar debt securities, and the future expected default rates and recovery rates of the collateralized loans.
(f) Life insurance company general accounts are valued at conversion value at the end of the period.
(g) Commingled funds represent pooled institutional investments. Approximately 35 percent of commingled funds are invested in listed stocks, 35 percent in government and municipal debt securities, 10 percent in corporate and other debt securities, and 20 percent in other assets. Commingled funds are valued at their NAV provided by the administrators of the funds, which are based on the value of the underlying assets owned by the funds, divided by the number of units outstanding.
The following table presents the reconciliation of the beginning and ending balances of Level 3 assets for the year ended March 31, 2010.
Millions of yen
Beginning balance at March 31,
2009
Actual return on
plan assets still held
at the reporting date
Realized gain or loss
on plan assets
sold during the period
Purchases, sales, and
settlements
Foreign currency
exchange
Ending balance at March 31,
2010
Corporate and other debt securities . . . . . . . . . . . . . . . . . . ¥ 5,952 ¥ 123 ¥ 87 ¥ 13,446 ¥(115) ¥ 19,493
Hedge funds . . . . . . . . . . . . . . . . 82,161 8,574 227 (41,583) 7 49,386
Securitization products . . . . . . . . 16,097 14,496 342 (1,677) 4 29,262
Commingled funds . . . . . . . . . . . 44,063 (6,193) (1,056) 665 3 37,482
Other . . . . . . . . . . . . . . . . . . . . . . 5,987 (529) (91) (447) 2 4,922
¥154,260 ¥16,471 ¥ (491) ¥(29,596) ¥ (99) ¥140,545
Thousands of U.S. dollars
Beginning balance at March 31,
2009
Actual return on
plan assets still held
at the reporting date
Realized gain or loss
on plan assets
sold during the period
Purchases, sales, and
settlements
Foreign currency
exchange
Ending balance at March 31,
2010
Corporate and other debt securities . . . . . . . . . . . . . . . . . . $ 64,000 $ 1,323 $ 935 $ 144,581 $(1,237) $ 209,602
Hedge funds . . . . . . . . . . . . . . . . 883,452 92,193 2,441 (447,129) 75 531,032
Securitization products . . . . . . . . 173,086 155,871 3,677 (18,032) 43 314,645
Commingled funds . . . . . . . . . . . 473,796 (66,591) (11,355) 7,151 32 403,033
Other . . . . . . . . . . . . . . . . . . . . . . 64,376 (5,688) (978) (4,807) 22 52,925
$1,658,710 $177,108 $ (5,280) $(318,236) $(1,065) $1,511,237

88 Hitachi, Ltd. Annual Report 2010
The Company and its subsidiaries expect to contribute ¥109,007 million ($1,172,118 thousand) to their defined benefit plans for the year ending March 31, 2011.
The following benefit payments, which reflect expected future service, as appropriate, are expected to be paid.
Years ending March 31 Millions of yenThousands of
U.S. dollars
2011 . . . . . . . . . . . . . . . . . . . . . . . . . . . . . . . . . . . . . . . . . . . . . . . . . . . . . . . . . . . . . . . ¥136,289 $1,465,473
2012 . . . . . . . . . . . . . . . . . . . . . . . . . . . . . . . . . . . . . . . . . . . . . . . . . . . . . . . . . . . . . . . 132,433 1,424,011
2013 . . . . . . . . . . . . . . . . . . . . . . . . . . . . . . . . . . . . . . . . . . . . . . . . . . . . . . . . . . . . . . . 134,119 1,442,140
2014 . . . . . . . . . . . . . . . . . . . . . . . . . . . . . . . . . . . . . . . . . . . . . . . . . . . . . . . . . . . . . . . 121,508 1,306,538
2015 . . . . . . . . . . . . . . . . . . . . . . . . . . . . . . . . . . . . . . . . . . . . . . . . . . . . . . . . . . . . . . . 125,578 1,350,301
2016–2020 . . . . . . . . . . . . . . . . . . . . . . . . . . . . . . . . . . . . . . . . . . . . . . . . . . . . . . . . . . 614,921 6,612,054
(b) Defined contribution plansThe Company and certain subsidiaries have a number of defined contribution plans. The amount of cost recognized for the Company’s and certain subsidiaries’ contributions to the plans for the years ended March 31, 2010, 2009 and 2008 were ¥18,758 million ($201,699 thousand), ¥18,059 million and ¥15,749 million, respectively.
12. COmmON StOCk
The Company has authorized issuance of 10 billion shares of common stock.
The number of issued shares and the amount of common stock for the years ended March 31, 2010, 2009, 2008 and 2007 are as follows:
Millions of yenThousands of
U.S. dollars
Issued shares Amount Amount
Balance as of March 31, 2009, 2008, and 2007 . . . . . . . . . . . . . . . . 3,368,126,056 ¥282,033 $3,032,613
Issuance of common stock . . . . . . . . . . . . . . . . . . . . . . . . . . . . . 1,150,000,000 126,776 1,363,183
Conversion of convertible debentures . . . . . . . . . . . . . . . . . . . . . 6,309 1 11
Balance as of March 31, 2010 . . . . . . . . . . . . . . . . . . . . . . . . . . . . . 4,518,132,365 ¥408,810 $4,395,807
The issuance of common stock and the conversion of convertible debentures into common stock for the year ended March 31, 2010 were accounted for in accordance with the provisions of the Japanese Company Law by crediting one-half of the issue price or the conversion price to each of the common stock accounts and the capital surplus accounts.
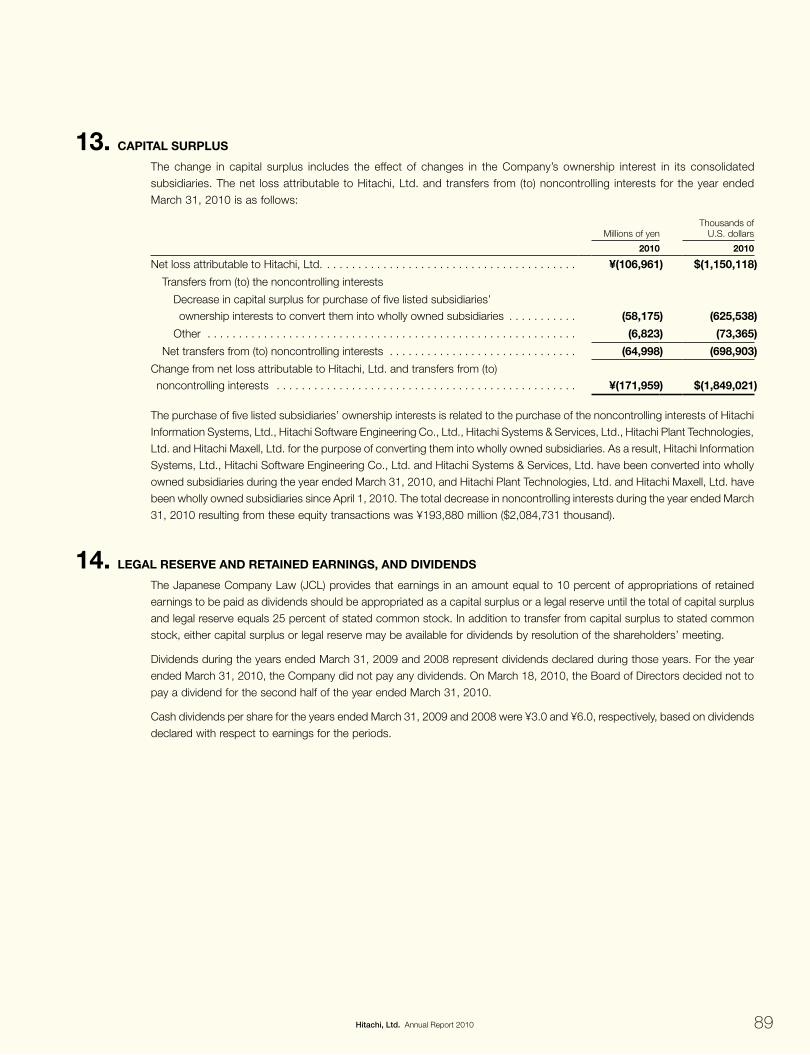
89Hitachi, Ltd. Annual Report 2010
13. CApitAL SurpLuS
The change in capital surplus includes the effect of changes in the Company’s ownership interest in its consolidated subsidiaries. The net loss attributable to Hitachi, Ltd. and transfers from (to) noncontrolling interests for the year ended March 31, 2010 is as follows:
Millions of yenThousands of
U.S. dollars
2010 2010
Net loss attributable to Hitachi, Ltd. . . . . . . . . . . . . . . . . . . . . . . . . . . . . . . . . . . . . . . . . ¥(106,961) $(1,150,118)
Transfers from (to) the noncontrolling interests
Decrease in capital surplus for purchase of five listed subsidiaries’ ownership interests to convert them into wholly owned subsidiaries . . . . . . . . . . . (58,175) (625,538)
Other . . . . . . . . . . . . . . . . . . . . . . . . . . . . . . . . . . . . . . . . . . . . . . . . . . . . . . . . . . . (6,823) (73,365)
Net transfers from (to) noncontrolling interests . . . . . . . . . . . . . . . . . . . . . . . . . . . . . . (64,998) (698,903)
Change from net loss attributable to Hitachi, Ltd. and transfers from (to) noncontrolling interests . . . . . . . . . . . . . . . . . . . . . . . . . . . . . . . . . . . . . . . . . . . . . . . . ¥(171,959) $(1,849,021)
The purchase of five listed subsidiaries’ ownership interests is related to the purchase of the noncontrolling interests of Hitachi Information Systems, Ltd., Hitachi Software Engineering Co., Ltd., Hitachi Systems & Services, Ltd., Hitachi Plant Technologies, Ltd. and Hitachi Maxell, Ltd. for the purpose of converting them into wholly owned subsidiaries. As a result, Hitachi Information Systems, Ltd., Hitachi Software Engineering Co., Ltd. and Hitachi Systems & Services, Ltd. have been converted into wholly owned subsidiaries during the year ended March 31, 2010, and Hitachi Plant Technologies, Ltd. and Hitachi Maxell, Ltd. have been wholly owned subsidiaries since April 1, 2010. The total decrease in noncontrolling interests during the year ended March 31, 2010 resulting from these equity transactions was ¥193,880 million ($2,084,731 thousand).
14. LEgAL rESErvE ANd rEtAiNEd EArNiNgS, ANd dividENdS
The Japanese Company Law (JCL) provides that earnings in an amount equal to 10 percent of appropriations of retained earnings to be paid as dividends should be appropriated as a capital surplus or a legal reserve until the total of capital surplus and legal reserve equals 25 percent of stated common stock. In addition to transfer from capital surplus to stated common stock, either capital surplus or legal reserve may be available for dividends by resolution of the shareholders’ meeting.
Dividends during the years ended March 31, 2009 and 2008 represent dividends declared during those years. For the year ended March 31, 2010, the Company did not pay any dividends. On March 18, 2010, the Board of Directors decided not to pay a dividend for the second half of the year ended March 31, 2010.
Cash dividends per share for the years ended March 31, 2009 and 2008 were ¥3.0 and ¥6.0, respectively, based on dividends declared with respect to earnings for the periods.

90 Hitachi, Ltd. Annual Report 2010
15. trEASury StOCk
The JCL allows a company to acquire treasury stock upon shareholders’ approval to the extent that sufficient distributable funds are available. If the Board of Directors’ authority is stated in the articles of incorporation, a company is allowed to acquire treasury stock not upon shareholders’ approval but Board of Directors’ approval. Acquisition of treasury stock is allowed under the Company’s articles of incorporation.
Pursuant to the provisions of the JCL, shareholders may request the company to acquire their shares representing less than a minimum trading lot as shares less than a minimum trading lot cannot be publicly traded and such a shareholder holding less than a minimum trading lot cannot exercise a voting right and other shareholder’s rights except as provided in the JCL or the articles of incorporation. The JCL also states that a shareholder holding shares less than a minimum trading lot may request the company to sell its treasury stock, if any, to the shareholder up to a minimum trading lot if entitled under the articles of incorporation. Sale of treasury stock is allowed under the Company’s articles of incorporation.
The changes in treasury stock for the years ended March 31, 2010, 2009 and 2008 are summarized as follows:
Millions of yenThousands of
U.S. dollars
Shares Amount Amount
Balance as of March 31, 2007 . . . . . . . . . . . . . . . . . . . . . . . . . . . . . . . 42,966,434 ¥25,339
Acquisition for treasury . . . . . . . . . . . . . . . . . . . . . . . . . . . . . . . . . . . 1,358,519 1,145
Sales of treasury stock . . . . . . . . . . . . . . . . . . . . . . . . . . . . . . . . . . . (597,224) (354)
Balance as of March 31, 2008 . . . . . . . . . . . . . . . . . . . . . . . . . . . . . . . 43,727,729 26,130
Acquisition for treasury . . . . . . . . . . . . . . . . . . . . . . . . . . . . . . . . . . . 1,500,226 858
Sales of treasury stock . . . . . . . . . . . . . . . . . . . . . . . . . . . . . . . . . . . (1,253,991) (751)
Balance as of March 31, 2009 . . . . . . . . . . . . . . . . . . . . . . . . . . . . . . . 43,973,964 26,237 $282,118
Acquisition for treasury . . . . . . . . . . . . . . . . . . . . . . . . . . . . . . . . . . . 376,025 115 1,237
Sales of treasury stock . . . . . . . . . . . . . . . . . . . . . . . . . . . . . . . . . . . (335,738) (201) (2,161)
Balance as of March 31, 2010 . . . . . . . . . . . . . . . . . . . . . . . . . . . . . . . 44,014,251 ¥26,151 $281,194

91Hitachi, Ltd. Annual Report 2010
16. ACCumuLAtEd OthEr COmprEhENSivE LOSS
Accumulated other comprehensive loss, net of related tax effects, displayed in the consolidated statements of equity is classified as follows:
Millions of yenThousands of
U.S. dollars
2010 2009 2008 2010
Foreign currency translation adjustments:
Balance at beginning of year . . . . . . . . . . . . . . . . . . . . . . . . . ¥(179,737) ¥ (69,222) ¥ (20,906) $(1,932,656)
Other comprehensive income (loss), net of reclassification adjustments . . . . . . . . . . . . . . . . . . . . 4,289 (110,899) (48,605) 46,118
Net transfer from (to) noncontrolling interests . . . . . . . . . . . . . (7,335) 384 289 (78,871)
Balance at end of year . . . . . . . . . . . . . . . . . . . . . . . . . . . . . . ¥(182,783) ¥(179,737) ¥ (69,222) $(1,965,409)
Pension liability adjustments:
Balance at beginning of year . . . . . . . . . . . . . . . . . . . . . . . . . . ¥(405,082) ¥(221,007) ¥(146,329) $(4,355,720)
Other comprehensive income (loss), net of reclassification adjustments . . . . . . . . . . . . . . . . . . . . 141,761 (184,153) (74,758) 1,524,312
Net transfer from (to) noncontrolling interests . . . . . . . . . . . . . (9,089) 78 80 (97,732)
Balance at end of year . . . . . . . . . . . . . . . . . . . . . . . . . . . . . . ¥(272,410) ¥(405,082) ¥(221,007) $(2,929,140)
Net unrealized holding gain on available-for-sale securities:
Balance at beginning of year . . . . . . . . . . . . . . . . . . . . . . . . . ¥ 12 ¥ 22,581 ¥ 77,883 $ 129
Other comprehensive income (loss), net of reclassification adjustments . . . . . . . . . . . . . . . . . . . . 23,209 (22,855) (55,310) 249,559
Net transfer from (to) noncontrolling interests . . . . . . . . . . . . . 2,343 286 8 25,194
Balance at end of year . . . . . . . . . . . . . . . . . . . . . . . . . . . . . . ¥ 25,564 ¥ 12 ¥ 22,581 $ 274,882
Cash flow hedges:
Balance at beginning of year . . . . . . . . . . . . . . . . . . . . . . . . . ¥ (1,544) ¥ 450 ¥ 902 $ (16,602)
Other comprehensive loss, net of reclassification adjustments . . . . . . . . . . . . . . . . . . . . (833) (2,031) (451) (8,957)
Net transfer from (to) noncontrolling interests . . . . . . . . . . . . . (51) 37 (1) (548)
Balance at end of year . . . . . . . . . . . . . . . . . . . . . . . . . . . . . . ¥ (2,428) ¥ (1,544) ¥ 450 $ (26,107)
Total accumulated other comprehensive loss:
Balance at beginning of year . . . . . . . . . . . . . . . . . . . . . . . . . ¥(586,351) ¥(267,198) ¥ (88,450) $(6,304,849)
Other comprehensive income (loss), net of reclassification adjustments . . . . . . . . . . . . . . . . . . . . 168,426 (319,938) (179,124) 1,811,032
Net transfer from (to) noncontrolling interests . . . . . . . . . . . . . (14,132) 785 376 (151,957)
Balance at end of year . . . . . . . . . . . . . . . . . . . . . . . . . . . . . . ¥(432,057) ¥(586,351) ¥(267,198) $(4,645,774)

92 Hitachi, Ltd. Annual Report 2010
The following is a summary of reclassification adjustments by each classification of other comprehensive income (loss) arising during the years ended March 31, 2010, 2009 and 2008 and the amounts of income tax expense or benefit allocated to each component of other comprehensive income (loss), including reclassification adjustments. The amounts include amounts attributable to noncontrolling interests.
Millions of yen
2010
Before-tax amount
Tax benefit (expense)
Net-of-tax amount
Other comprehensive income arising during the year:
Foreign currency translation adjustments . . . . . . . . . . . . . . . . . . . . . . . . . . ¥ 8,487 ¥ – ¥ 8,487
Pension liability adjustments . . . . . . . . . . . . . . . . . . . . . . . . . . . . . . . . . . . . 116,184 3,979 120,163
Net unrealized holding gain on available-for-sale securities . . . . . . . . . . . . . 40,295 (11,758) 28,537
Cash flow hedges . . . . . . . . . . . . . . . . . . . . . . . . . . . . . . . . . . . . . . . . . . . (308) (1,173) (1,481)
164,658 (8,952) 155,706
Reclassification adjustments for realized net loss included in net loss:
Foreign currency translation adjustments . . . . . . . . . . . . . . . . . . . . . . . . . . (1,580) – (1,580)
Pension liability adjustments . . . . . . . . . . . . . . . . . . . . . . . . . . . . . . . . . . . . 73,776 (29,916) 43,860
Net unrealized holding gain on available-for-sale securities . . . . . . . . . . . . . 236 (97) 139
Cash flow hedges . . . . . . . . . . . . . . . . . . . . . . . . . . . . . . . . . . . . . . . . . . . 258 552 810
72,690 (29,461) 43,229
Other comprehensive income, net of reclassification adjustments:
Foreign currency translation adjustments . . . . . . . . . . . . . . . . . . . . . . . . . . 6,907 – 6,907
Pension liability adjustments . . . . . . . . . . . . . . . . . . . . . . . . . . . . . . . . . . . . 189,960 (25,937) 164,023
Net unrealized holding gain on available-for-sale securities . . . . . . . . . . . . . 40,531 (11,855) 28,676
Cash flow hedges . . . . . . . . . . . . . . . . . . . . . . . . . . . . . . . . . . . . . . . . . . . (50) (621) (671)
¥237,348 ¥(38,413) ¥198,935
Thousands of U.S. dollars
2010
Before-tax amount
Tax benefit (expense)
Net-of-tax amount
Other comprehensive income arising during the year:
Foreign currency translation adjustments . . . . . . . . . . . . . . . . . . . . . . . . . . $ 91,258 $ – $ 91,258
Pension liability adjustments . . . . . . . . . . . . . . . . . . . . . . . . . . . . . . . . . . . . 1,249,290 42,785 1,292,075
Net unrealized holding gain on available-for-sale securities . . . . . . . . . . . . . 433,280 (126,430) 306,850
Cash flow hedges . . . . . . . . . . . . . . . . . . . . . . . . . . . . . . . . . . . . . . . . . . . (3,312) (12,613) (15,925)
1,770,516 (96,258) 1,674,258
Reclassification adjustments for realized net loss included in net loss:
Foreign currency translation adjustments . . . . . . . . . . . . . . . . . . . . . . . . . . (16,989) – (16,989)
Pension liability adjustments . . . . . . . . . . . . . . . . . . . . . . . . . . . . . . . . . . . . 793,290 (321,677) 471,613
Net unrealized holding gain on available-for-sale securities . . . . . . . . . . . . . 2,537 (1,043) 1,494
Cash flow hedges . . . . . . . . . . . . . . . . . . . . . . . . . . . . . . . . . . . . . . . . . . . 2,775 5,935 8,710
781,613 (316,785) 464,828
Other comprehensive income, net of reclassification adjustments:
Foreign currency translation adjustments . . . . . . . . . . . . . . . . . . . . . . . . . . 74,269 – 74,269
Pension liability adjustments . . . . . . . . . . . . . . . . . . . . . . . . . . . . . . . . . . . . 2,042,580 (278,892) 1,763,688
Net unrealized holding gain on available-for-sale securities . . . . . . . . . . . . . 435,817 (127,473) 308,344
Cash flow hedges . . . . . . . . . . . . . . . . . . . . . . . . . . . . . . . . . . . . . . . . . . . (537) (6,678) (7,215)
$2,552,129 $(413,043) $2,139,086

93Hitachi, Ltd. Annual Report 2010
Millions of yen
2009
Before-tax amount
Tax benefit (expense)
Net-of-tax amount
Other comprehensive loss arising during the year:
Foreign currency translation adjustments . . . . . . . . . . . . . . . . . . . . . . . . . . ¥(144,317) ¥ – ¥(144,317)
Pension liability adjustments . . . . . . . . . . . . . . . . . . . . . . . . . . . . . . . . . . . . (318,557) 73,589 (244,968)
Net unrealized holding gain on available-for-sale securities . . . . . . . . . . . . . (68,652) 26,158 (42,494)
Cash flow hedges . . . . . . . . . . . . . . . . . . . . . . . . . . . . . . . . . . . . . . . . . . . (6,854) 2,446 (4,408)
(538,380) 102,193 (436,187)
Reclassification adjustments for realized net loss included in net loss:
Foreign currency translation adjustments . . . . . . . . . . . . . . . . . . . . . . . . . . (253) – (253)
Pension liability adjustments . . . . . . . . . . . . . . . . . . . . . . . . . . . . . . . . . . . . 53,186 (21,313) 31,873
Net unrealized holding gain on available-for-sale securities . . . . . . . . . . . . . 27,134 (10,997) 16,137
Cash flow hedges . . . . . . . . . . . . . . . . . . . . . . . . . . . . . . . . . . . . . . . . . . . 900 (76) 824
80,967 (32,386) 48,581
Other comprehensive loss, net of reclassification adjustments:
Foreign currency translation adjustments . . . . . . . . . . . . . . . . . . . . . . . . . . (144,570) – (144,570)
Pension liability adjustments . . . . . . . . . . . . . . . . . . . . . . . . . . . . . . . . . . . . (265,371) 52,276 (213,095)
Net unrealized holding gain on available-for-sale securities . . . . . . . . . . . . . (41,518) 15,161 (26,357)
Cash flow hedges . . . . . . . . . . . . . . . . . . . . . . . . . . . . . . . . . . . . . . . . . . . (5,954) 2,370 (3,584)
¥(457,413) ¥ 69,807 ¥(387,606)
Millions of yen
2008
Before-tax amount
Tax benefit (expense)
Net-of-tax amount
Other comprehensive loss arising during the year:
Foreign currency translation adjustments . . . . . . . . . . . . . . . . . . . . . . . . . . ¥ (68,113) ¥ – ¥ (68,113)
Pension liability adjustments . . . . . . . . . . . . . . . . . . . . . . . . . . . . . . . . . . . . (191,590) 78,464 (113,126)
Net unrealized holding gain on available-for-sale securities . . . . . . . . . . . . . (100,184) 40,310 (59,874)
Cash flow hedges . . . . . . . . . . . . . . . . . . . . . . . . . . . . . . . . . . . . . . . . . . . 448 (585) (137)
(359,439) 118,189 (241,250)
Reclassification adjustments for realized net loss included in net income:
Foreign currency translation adjustments . . . . . . . . . . . . . . . . . . . . . . . . . . 1,943 – 1,943
Pension liability adjustments . . . . . . . . . . . . . . . . . . . . . . . . . . . . . . . . . . . . 35,793 (14,336) 21,457
Net unrealized holding gain on available-for-sale securities . . . . . . . . . . . . . (5,580) 3,139 (2,441)
Cash flow hedges . . . . . . . . . . . . . . . . . . . . . . . . . . . . . . . . . . . . . . . . . . . (233) 44 (189)
31,923 (11,153) 20,770
Other comprehensive loss, net of reclassification adjustments:
Foreign currency translation adjustments . . . . . . . . . . . . . . . . . . . . . . . . . . (66,170) – (66,170)
Pension liability adjustments . . . . . . . . . . . . . . . . . . . . . . . . . . . . . . . . . . . . (155,797) 64,128 (91,669)
Net unrealized holding gain on available-for-sale securities . . . . . . . . . . . . . (105,764) 43,449 (62,315)
Cash flow hedges . . . . . . . . . . . . . . . . . . . . . . . . . . . . . . . . . . . . . . . . . . . 215 (541) (326)
¥(327,516) ¥107,036 ¥(220,480)

94 Hitachi, Ltd. Annual Report 2010
17. pLEdgEd ASSEtS
As of March 31, 2010, the Company and certain subsidiaries pledged a portion of their assets as collateral primarily for bank loans as follows:
Millions of yenThousands of
U.S. dollars
2010 2010
Cash and cash equivalents . . . . . . . . . . . . . . . . . . . . . . . . . . . . . . . . . . . . . . . . . . . . . . ¥ 1,780 $ 19,140
Other current assets . . . . . . . . . . . . . . . . . . . . . . . . . . . . . . . . . . . . . . . . . . . . . . . . . . . 1,603 17,236
Investments and advances . . . . . . . . . . . . . . . . . . . . . . . . . . . . . . . . . . . . . . . . . . . . . . 351 3,774
Land . . . . . . . . . . . . . . . . . . . . . . . . . . . . . . . . . . . . . . . . . . . . . . . . . . . . . . . . . . . . . . . 3,345 35,968
Buildings . . . . . . . . . . . . . . . . . . . . . . . . . . . . . . . . . . . . . . . . . . . . . . . . . . . . . . . . . . . . 5,213 56,054
Machinery and equipment . . . . . . . . . . . . . . . . . . . . . . . . . . . . . . . . . . . . . . . . . . . . . . . 5,951 63,989
¥18,243 $196,161
In addition to the above, prepaid expenses and other current assets as of March 31, 2010 and 2009 include restricted cash of ¥4,168 million ($44,817 thousand) and ¥6,906 million, respectively, as a compensating balance for short-term borrowing arrangements.
18. COmmitmENtS ANd CONtiNgENCiES
The Company and its operating subsidiaries are contingently liable for loan guarantees to its affiliates and others in the amount of approximately ¥49,911 million ($536,667 thousand) as of March 31, 2010.
Hitachi Capital Corporation (HCC) and certain other financial subsidiaries provide guarantees to financial institutions for extending loans to customers of the subsidiaries. As of March 31, 2010, the undiscounted maximum potential future payments under such guarantees amounted to ¥413,616 million ($4,447,484 thousand). For providing these guarantees, the subsidiaries obtain collateral equal to the amount of the guarantees, and therefore, the Company considers the risk to be low. The Company accrued ¥13,045 million ($140,269 thousand) as an obligation to stand ready to perform over the term of the guarantees in the event the customer cannot make scheduled payments.
The subsidiaries provide certain revolving lines of credit to its credit card holders in accordance with the terms of the credit card business customer service contracts. Furthermore, the subsidiaries provide credit facilities to parties in accordance with the service agency business contracts from which temporary payments on behalf of such parties are made. In addition, the Company and HCC provide loan commitments to affiliates and others.
The outstanding balance of these revolving lines of credit, credit facilities and loan commitments as of March 31, 2010 is as follows:
Millions of yenThousands of
U.S. dollars
2010 2010
Total commitment available . . . . . . . . . . . . . . . . . . . . . . . . . . . . . . . . . . . . . . . . . . . . . . ¥358,638 $3,856,323
Less amount utilized . . . . . . . . . . . . . . . . . . . . . . . . . . . . . . . . . . . . . . . . . . . . . . . . . . . 4,460 47,957
Balance available . . . . . . . . . . . . . . . . . . . . . . . . . . . . . . . . . . . . . . . . . . . . . . . . . . . . . . ¥354,178 $3,808,366
A portion of these revolving lines of credit is pending credit approval and cannot be utilized.
The Company and certain subsidiaries have line of credit arrangements with banks in order to secure a financing source for business operations. The unused lines of credit as of March 31, 2010 amounted to ¥395,787 million ($4,255,774 thousand), primarily related to unused lines of credit belonging to the Company. The Company maintains commitment line agreements with a number of banks and pays commissions as consideration. These commitment agreements generally provide a one-year term, and are subject to renewal at the end of the term. The unused availability under these agreements as of March 31, 2010 amounted to ¥200,000 million ($2,150,538 thousand). The Company also maintains another commitment line agreement, whose three years and two months term ends in May 2013, with financing companies. The unused availability under this agreement as of March 31, 2010 amounted to ¥100,000 million ($1,075,269 thousand).
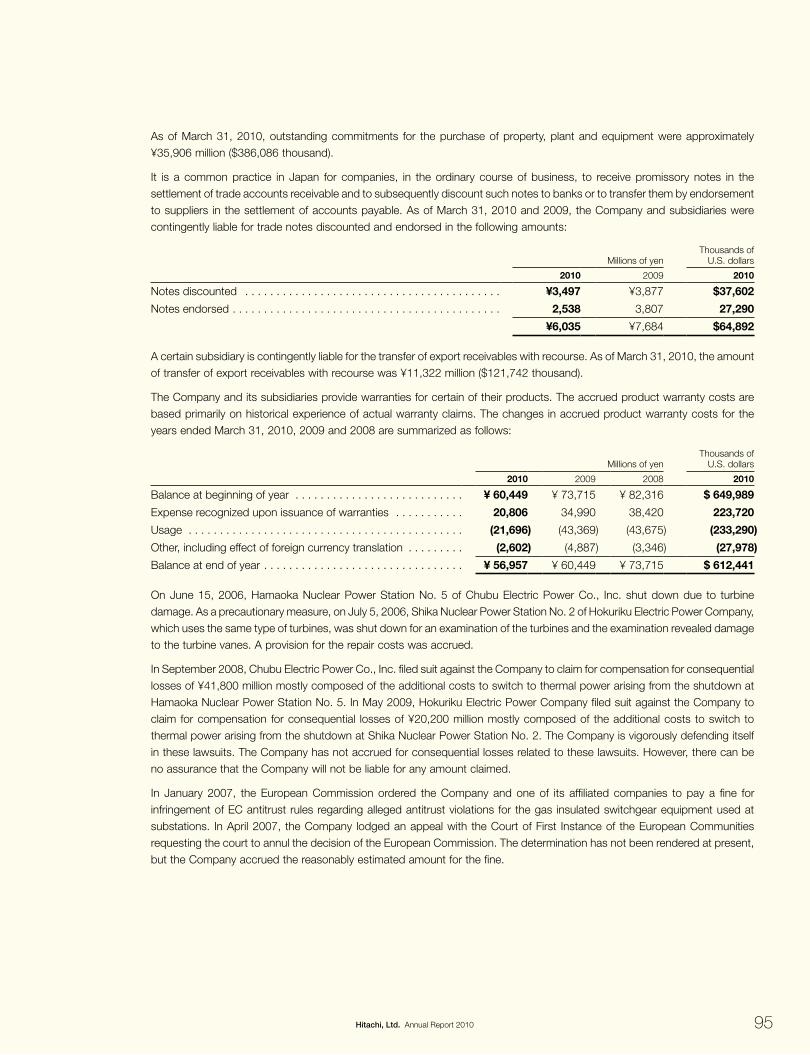
95Hitachi, Ltd. Annual Report 2010
As of March 31, 2010, outstanding commitments for the purchase of property, plant and equipment were approximately ¥35,906 million ($386,086 thousand).
It is a common practice in Japan for companies, in the ordinary course of business, to receive promissory notes in the settlement of trade accounts receivable and to subsequently discount such notes to banks or to transfer them by endorsement to suppliers in the settlement of accounts payable. As of March 31, 2010 and 2009, the Company and subsidiaries were contingently liable for trade notes discounted and endorsed in the following amounts:
Millions of yenThousands of
U.S. dollars
2010 2009 2010
Notes discounted . . . . . . . . . . . . . . . . . . . . . . . . . . . . . . . . . . . . . . . . . ¥3,497 ¥3,877 $37,602
Notes endorsed . . . . . . . . . . . . . . . . . . . . . . . . . . . . . . . . . . . . . . . . . . . 2,538 3,807 27,290
¥6,035 ¥7,684 $64,892
A certain subsidiary is contingently liable for the transfer of export receivables with recourse. As of March 31, 2010, the amount of transfer of export receivables with recourse was ¥11,322 million ($121,742 thousand).
The Company and its subsidiaries provide warranties for certain of their products. The accrued product warranty costs are based primarily on historical experience of actual warranty claims. The changes in accrued product warranty costs for the years ended March 31, 2010, 2009 and 2008 are summarized as follows:
Millions of yenThousands of
U.S. dollars
2010 2009 2008 2010
Balance at beginning of year . . . . . . . . . . . . . . . . . . . . . . . . . . . ¥ 60,449 ¥ 73,715 ¥ 82,316 $ 649,989
Expense recognized upon issuance of warranties . . . . . . . . . . . 20,806 34,990 38,420 223,720
Usage . . . . . . . . . . . . . . . . . . . . . . . . . . . . . . . . . . . . . . . . . . . . (21,696) (43,369) (43,675) (233,290)
Other, including effect of foreign currency translation . . . . . . . . . (2,602) (4,887) (3,346) (27,978)
Balance at end of year . . . . . . . . . . . . . . . . . . . . . . . . . . . . . . . . ¥ 56,957 ¥ 60,449 ¥ 73,715 $ 612,441
On June 15, 2006, Hamaoka Nuclear Power Station No. 5 of Chubu Electric Power Co., Inc. shut down due to turbine damage. As a precautionary measure, on July 5, 2006, Shika Nuclear Power Station No. 2 of Hokuriku Electric Power Company, which uses the same type of turbines, was shut down for an examination of the turbines and the examination revealed damage to the turbine vanes. A provision for the repair costs was accrued.
In September 2008, Chubu Electric Power Co., Inc. filed suit against the Company to claim for compensation for consequential losses of ¥41,800 million mostly composed of the additional costs to switch to thermal power arising from the shutdown at Hamaoka Nuclear Power Station No. 5. In May 2009, Hokuriku Electric Power Company filed suit against the Company to claim for compensation for consequential losses of ¥20,200 million mostly composed of the additional costs to switch to thermal power arising from the shutdown at Shika Nuclear Power Station No. 2. The Company is vigorously defending itself in these lawsuits. The Company has not accrued for consequential losses related to these lawsuits. However, there can be no assurance that the Company will not be liable for any amount claimed.
In January 2007, the European Commission ordered the Company and one of its affiliated companies to pay a fine for infringement of EC antitrust rules regarding alleged antitrust violations for the gas insulated switchgear equipment used at substations. In April 2007, the Company lodged an appeal with the Court of First Instance of the European Communities requesting the court to annul the decision of the European Commission. The determination has not been rendered at present, but the Company accrued the reasonably estimated amount for the fine.
96 Hitachi, Ltd. Annual Report 2010
In December 2006, the Company and a subsidiary in Europe received requests for information from the European Commission, a subsidiary in Japan received a grand jury subpoena in connection with the investigation conducted by the Antitrust Division of the U.S. Department of Justice and received requests for information from the Fair Trade Commission of Japan, and an affiliate in Japan received a request for information from the Fair Trade Commission of Japan, all in respect of alleged antitrust violations relating to the liquid crystal displays. In December 2008, a subsidiary in Japan received a cease and desist order from the Fair Trade Commission of Japan, but it has not received a surcharge payment order. The Japanese subsidiary accrued the reasonably estimated amount for the loss in relation to the investigation by the Antitrust Division of the U.S. Department of Justice as of March 31, 2009, and paid that fine in June 2009.
In June 2007, the Company received requests for information from the European Commission in respect of alleged antitrust violations relating to dynamic random access memories. In May 2010, the European Commission ordered the Company to pay a fine for infringement of EC antitrust rules. The Company has accrued the reasonably estimated amount for the fine.
In September 2007, a subsidiary and an affiliated company of the Company in the U.S. received a grand jury subpoena in connection with the investigation conducted by the Antitrust Division of the U.S. Department of Justice in respect of alleged antitrust violations relating to flash memories. In July 2009, these companies received information that the Antitrust Division of the U.S. Department of Justice would terminate the investigation of this matter.
In November 2007, a subsidiary of the Company in the U.S. received a grand jury subpoena in connection with the investigation conducted by the Antitrust Division of the U.S. Department of Justice in respect of alleged antitrust violations relating to cathode ray tubes. In addition, in November 2007, two subsidiaries in Asia and in Europe received requests for information from the European Commission. Furthermore, in November 2007, a subsidiary in Canada received requests for information from the Canadian Competition Bureau.
In December 2008, the Company received requests for information from the European Commission in respect of alleged antitrust violations relating to power transformers. In October 2009, the European Commission ordered the Company to pay a fine for infringement of EC antitrust rules. The Company paid that fine in January 2010.
In June 2009, a subsidiary of the Company in Japan received a grand jury subpoena in connection with an investigation conducted by the Antitrust Division of the U.S. Department of Justice and received requests for information from the European Commission, and a subsidiary of the Company in Korea was investigated in Singapore by the Competition Commission of Singapore, all in respect of alleged antitrust violations relating to optical disk drives.
The Company and these companies have cooperated with the competent authorities in connection with the above matters. Depending upon the outcome of these matters, fines or surcharge payments, the amount of which is uncertain, may be imposed on them. In addition, subsequent to these actions by the competent authorities, a number of class action lawsuits have been filed against the Company and some of these companies in the U.S. and Canada.
Depending upon the outcome of the above legal proceedings, there may be an adverse effect on the consolidated financial position or results of operations. Currently the Company is unable to estimate the adverse effect, if any, of many of these proceedings. Accordingly, except as otherwise stated, no accrual for potential loss has been made. The actual amount of fines, surcharge payments or any other payments resulting from these legal proceedings may be different from the accrued amounts.
In addition to the above, the Company and certain subsidiaries are subject to several legal proceedings and claims which have arisen in the ordinary course of business and have not been finally adjudicated. These actions when ultimately concluded and determined will not, in the opinion of management, have a material adverse effect on the consolidated financial position or results of operations of the Company and subsidiaries.

97Hitachi, Ltd. Annual Report 2010
19. impAirmENt LOSSES FOr LONg-LivEd ASSEtS
For the year ended March 31, 2010, the majority of the impairment losses were recorded on long-lived property, plant and equipment located in Japan. The Components & Devices segment recognized a loss of ¥18,611 million ($200,118 thousand), primarily due to 1) its battery business for which the Company has recognized losses for consecutive periods and lower-than-expected future income because of a reduction of production, 2) its liquid crystal display business which was projected to have lower production because of smaller demand in the market, and 3) a part of its record media products business whose profitability has deteriorated because of severe market conditions accompanied by falling prices. The fair value estimates used to determine these losses were based primarily on discounted future cash flows.
For the year ended March 31, 2009, the majority of the impairment losses were recorded on long-lived property, plant and equipment located in Japan. The Digital Media & Consumer Products segment recognized a loss of ¥51,695 million primarily in its plasma TV business due to the decision to reorganize sourcing for glass panel components from in-house manufacturing to an outside supplier and patents with lower-than-expected future license income. The Automotive Systems segment recognized a loss of ¥29,240 million primarily in its automotive products businesses whose profitability deteriorated because of a significant deterioration of the automotive market. The Information & Telecommunication Systems segment recognized a loss of ¥15,752 million primarily due to its semiconductor and financial institution-related businesses whose profitability deteriorated because of smaller demand in the markets. The High Functional Materials & Components segment recognized a loss of ¥12,888 million primarily in its semiconductor-related and automotive-related products businesses whose profitabilities deteriorated because of a significant deterioration in these markets. The Components & Devices segment recognized a loss of ¥12,022 million primarily due to a specific type of electronic parts that were projected to have lower production because of smaller demand in the market and a decline in the expected selling price of certain assets held for sale caused by a deterioration of the real estate market. The fair value estimates used to determine these losses were based primarily on discounted future cash flows.
For the year ended March 31, 2008, the majority of the impairment losses were recorded on long-lived property, plant and equipment located in Japan. The Digital Media & Consumer Products segment recognized a loss of ¥63,291 million primarily due to its plasma TV business for which the Company and certain subsidiaries recognized losses for consecutive periods because of severe market competition accompanied by falling prices. These impairment losses included patents with lower-than-expected future license income. The High Functional Materials & Components segment recognized a loss of ¥7,172 million primarily due to rapid falling prices of LCD drivers for which a subsidiary supplies material for the related semiconductors. The Power Systems segment recognized a loss of ¥4,673 million primarily due to its electric power selling business whose profitability deteriorated due to rising fuel prices. The fair value estimates used to determine these losses were based primarily on discounted future cash flows.
20. rEStruCturiNg ChArgES
Certain losses incurred in the reorganization of the Company’s operations are considered restructuring charges. Components and related amounts of the restructuring charges, before the related tax effects, for the years ended March 31, 2010, 2009 and 2008 are as follows:
Millions of yenThousands of
U.S. dollars
2010 2009 2008 2010
Special and one-time termination benefits . . . . . . . . . . . . . . . . . ¥24,191 ¥21,517 ¥15,676 $260,118
Loss on fixed assets . . . . . . . . . . . . . . . . . . . . . . . . . . . . . . . . . 963 1,410 2,434 10,355
¥25,154 ¥22,927 ¥18,110 $270,473

98 Hitachi, Ltd. Annual Report 2010
The Company and certain subsidiaries provided special termination benefits to those employees voluntarily leaving the companies, and certain subsidiaries provided one-time termination benefits due to the subsidiaries’ liquidations. The accrued special termination benefits were recognized at the time voluntary termination was offered and benefits were accepted by the employees. The accrued one-time termination benefits were recognized at the time the subsidiaries communicated the plan to their employees. An analysis of the accrued special and one-time termination benefits for the years ended March 31, 2010, 2009 and 2008 is as follows:
Millions of yenThousands of
U.S. dollars
2010 2009 2008 2010
Balance at beginning of the year . . . . . . . . . . . . . . . . . . . . . . . . ¥ 7,543 ¥ 8,952 ¥ 44 $ 81,107
New charges . . . . . . . . . . . . . . . . . . . . . . . . . . . . . . . . . . . . . . . 24,191 21,517 15,676 260,118
Cash payments . . . . . . . . . . . . . . . . . . . . . . . . . . . . . . . . . . . . . (23,548) (22,449 ) (6,348) (253,204)
Foreign currency exchange rate changes . . . . . . . . . . . . . . . . . . (16) (477) (420) (172)
Balance at end of the year . . . . . . . . . . . . . . . . . . . . . . . . . . . . . ¥ 8,170 ¥ 7,543 ¥ 8,952 $ 87,849
The following represents the significant restructuring activities for the year ended March 31, 2010 by reportable segment:
1. The Automotive Systems segment restructured in order to reorganize the automotive products business, which has encountered severe deterioration in the market. The accrued special termination benefits expensed and paid during the year ended March 31, 2010 amounted to ¥7,731 million ($83,129 thousand). Total restructuring charges during the year ended March 31, 2010 consisted only of special termination benefits.
2. The High Functional Materials & Components segment restructured in order to reorganize its high-grade metal products and materials business to reduce costs and improve profitability. The accrued special termination benefits expensed during the year ended March 31, 2010 amounted to ¥4,010 million ($43,118 thousand). The liabilities for special termination benefits amounting to ¥787 million ($8,462 thousand) as of March 31, 2010 will be paid by March 31, 2011. Total restructuring charges during the year ended March 31, 2010 amounted to ¥4,426 million ($47,591 thousand).
3. The Components & Devices segment restructured in order to reorganize the liquid crystal display business, which includes several subsidiaries’ liquidations. The accrued special and one-time termination benefits expensed during the year ended March 31, 2010 amounted to ¥4,144 million ($44,559 thousand). The liabilities for special and one-time termination benefits amounting to ¥3,054 million ($32,839 thousand) as of March 31, 2010 will be paid by March 31, 2011. Total restructuring charges during the year ended March 31, 2010 amounted to ¥4,182 million ($44,968 thousand).
The following represents the significant restructuring activities for the year ended March 31, 2009 by reportable segment:
1. The Automotive Systems segment restructured in order to reorganize the automotive products business, which encountered severe deterioration in the market. The accrued special termination benefits expensed during the year ended March 31, 2009 amounted to ¥5,717 million. The liabilities for special termination benefits amounting to ¥3,164 million as of March 31, 2009 were paid by March 31, 2010. Total restructuring charges during the year ended March 31, 2009 consisted only of special termination benefits.
2. The High Functional Materials & Components segment restructured in order to reorganize its high-grade metal products and materials business to reduce costs and improve profitability. The accrued special termination benefits expensed during the year ended March 31, 2009 amounted to ¥4,069 million. The liabilities for special termination benefits amounting to ¥1,050 million as of March 31, 2009 were paid by March 31, 2010. Total restructuring charges during the year ended March 31, 2009 amounted to ¥4,252 million.
3. The Components & Devices segment restructured mainly in order to strengthen its storage business on a global basis. The accrued special termination benefits expensed during the year ended March 31, 2009 amounted to ¥2,230 million. The liabilities for special termination benefits amounting to ¥937 million as of March 31, 2009 were paid by March 31, 2010. Total restructuring charges during the year ended March 31, 2009 amounted to ¥3,286 million.

99Hitachi, Ltd. Annual Report 2010
The following represents the significant restructuring activities for the year ended March 31, 2008 by reportable segment:
1. The Components & Devices segment restructured in order to strengthen its storage business on a global basis. The accrued special termination benefits expensed during the year ended March 31, 2008 amounted to ¥4,156 million. The liabilities for special termination benefits amounting to ¥1,711 million as of March 31, 2008 were paid by March 31, 2009. Total restructuring charges during the year ended March 31, 2008 amounted to ¥5,512 million.
2. The Digital Media & Consumer Products segment restructured in order to reorganize the flat-panel TV business which was subject to severe market competition accompanied with falling prices. The accrued special termination benefits expensed during the year ended March 31, 2008 amounted to ¥3,144 million. The liabilities for special termination benefits amounting to ¥856 million as of March 31, 2008 were paid by March 31, 2009. Total restructuring charges during the year ended March 31, 2008 amounted to ¥3,324 million.
3. The Social Infrastructure & Industrial Systems segment restructured in order to reorganize its plant construction business for reducing costs and improving profitability primarily in Japan. The accrued special termination benefits expensed during the year ended March 31, 2008 amounted to ¥2,836 million. The liabilities for special termination benefits amounting to ¥2,836 million as of March 31, 2008 were paid by March 31, 2009. Total restructuring charges during the year ended March 31, 2008 consisted only of special termination benefits.
21. OthEr iNCOmE ANd OthEr dEduCtiONS
The following items are included in other income or other deductions for the years ended March 31, 2010, 2009 and 2008.
Millions of yenThousands of
U.S. dollars
2010 2009 2008 2010
Net gain (loss) on securities . . . . . . . . . . . . . . . . . . . . . . . . . . . . ¥ (1,220) ¥(44,077) ¥ 80,129 $ (13,118)
Net loss on sale and disposal of rental assets and other property . . . . . . . . . . . . . . . . . . . . . . . . . . . . . . . . . . (20,202) (21,292) (8,246) (217,226)
Exchange gain (loss) . . . . . . . . . . . . . . . . . . . . . . . . . . . . . . . . . 186 (37,259) (28,414) 2,000
Other income for the year ended March 31, 2009 represents a gain of ¥5,203 million on the sale of a subsidiary’s mobile communication business.
The major components of net gain on securities for the year ended March 31, 2008 were related to sales of a part of the shares of Hitachi Displays, Ltd. and Hitachi-GE Nuclear Energy, Ltd. and of all of the shares of Hitachi Semiconductor Singapore Pte. Ltd.
Other income for the year ended March 31, 2008 also includes a realized gain of ¥21,040 million on a contribution of available-for-sale securities to a pension fund trust.
22. SALES OF StOCk By SuBSidiAriES Or AFFiLiAtEd COmpANiES
In April 2007, Hitachi Metals, Ltd., a subsidiary which manufactures and sells high-grade metal products, and NEOMAX Co., Ltd., a subsidiary which manufactures and sells magnets and ceramics, conducted a merger in which Hitachi Metals, Ltd. was the surviving entity and NEOMAX Co., Ltd. was the acquired entity. Prior to the merger, Hitachi Metals, Ltd. opened its tender offer to acquire common shares of NEOMAX Co., Ltd. for the period from November 7, 2006 to December 11, 2006 for ¥2,500 per share. In April 2007, Hitachi Metals, Ltd. allocated 2 of its shares to 1 share of NEOMAX Co., Ltd. to acquire the shares of NEOMAX Co., Ltd. held by third parties in accordance with the terms and conditions of the tender offer. As a result, Hitachi Metals, Ltd. issued 9,389,202 shares of common stock to the shareholders of NEOMAX Co., Ltd. Since all the shares of Hitachi Metals, Ltd. were issued to third parties, the Company’s ownership interest of common stock decreased from 56.6% to 55.1%. The Company did not recognize a deferred tax liability on this transaction.

100 Hitachi, Ltd. Annual Report 2010
23. NEt iNCOmE AttriButABLE tO hitAChi, Ltd. StOCkhOLdErS pEr ShArE iNFOrmAtiON
The reconciliations of the numbers and the amounts used in the basic and diluted net loss attributable to Hitachi, Ltd. stockholders per share computations are as follows:
Number of shares
2010 2009 2008
Weighted average number of shares on which basic net loss per share is calculated . . . . . . . . . . . . . . . . . . . . 3,662,578,076 3,323,996,973 3,324,562,767
Effect of dilutive securities:
Stock options . . . . . . . . . . . . . . . . . . . . . . . . . . . . . . . . . . . . . . . . . – – 122,257
Number of shares on which diluted net loss per share is calculated . . . . . . . . . . . . . . . . . . . . . . . . . . . . . . . . . . . . 3,662,578,076 3,323,996,973 3,324,685,024
Millions of yenThousands of
U.S. dollars
2010 2009 2008 2010
Net loss attributable to Hitachi, Ltd. . . . . . . . . . . . . . ¥(106,961) ¥(787,337) ¥(58,125) $(1,150,118)
Effect of dilutive securities:
Subsidiaries’ stock options and other . . . . . . . . . . (0) (8) (948) (0)
Net loss attributable to Hitachi, Ltd. on which diluted net loss per share is calculated . . . . . . . . . . ¥(106,961) ¥(787,345) ¥(59,073) $(1,150,118)
Yen U.S. dollars
Net loss attributable to Hitachi, Ltd. stockholders per share:
Basic . . . . . . . . . . . . . . . . . . . . . . . . . . . . . . . . . . ¥(29.20) ¥(236.86) ¥(17.48) $(0.31)
Diluted . . . . . . . . . . . . . . . . . . . . . . . . . . . . . . . . . (29.20) (236.87) (17.77) (0.31)
The net loss attributable to Hitachi, Ltd. stockholders per share computations for the years ended March 31, 2010, 2009 and 2008 exclude all convertible bonds and certain stock options because their effect would have been antidilutive.
24. SuppLEmENtAry iNCOmE ANd ExpENSE iNFOrmAtiON
Millions of yenThousands of
U.S. dollars
2010 2009 2008 2010
Shipping and handling costs . . . . . . . . . . . . . . . . . . ¥124,019 ¥148,145 ¥162,526 $1,333,538
Advertising expense . . . . . . . . . . . . . . . . . . . . . . . . 28,877 38,598 45,823 310,505
Maintenance and repairs . . . . . . . . . . . . . . . . . . . . . 72,065 78,242 84,122 774,892
Rent . . . . . . . . . . . . . . . . . . . . . . . . . . . . . . . . . . . . 142,077 148,401 143,369 1,527,710
Research and development expense . . . . . . . . . . . . 372,470 416,517 428,171 4,005,054
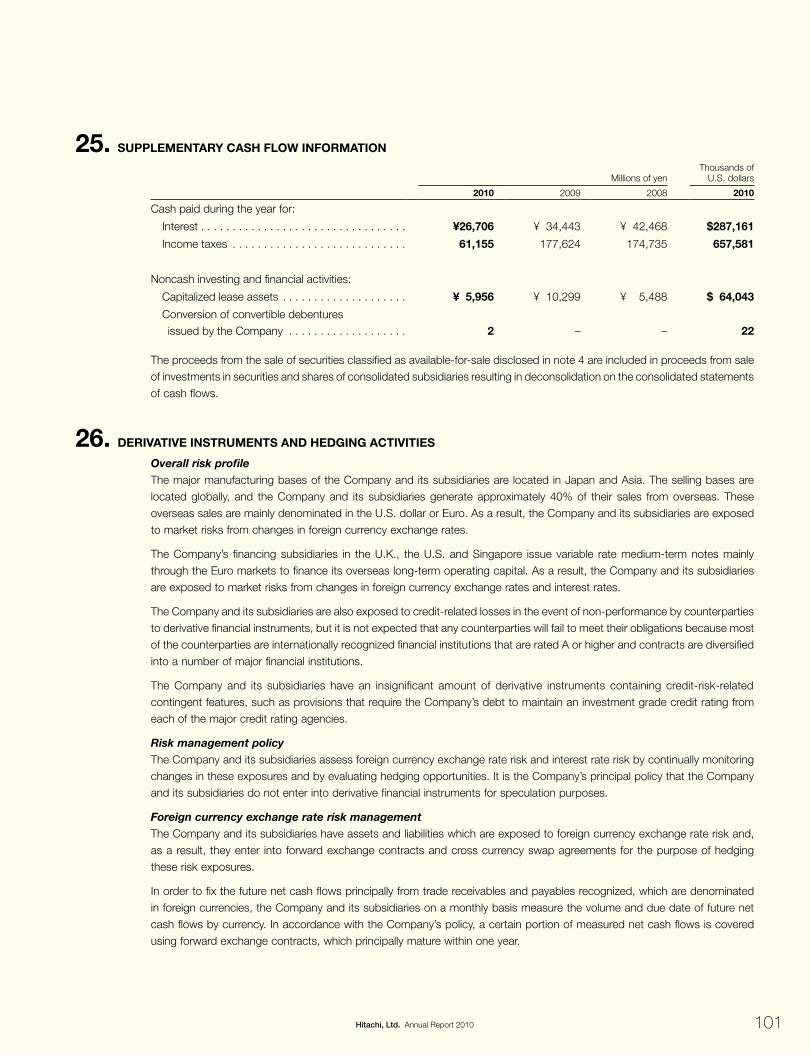
101Hitachi, Ltd. Annual Report 2010
25. SuppLEmENtAry CASh FLOw iNFOrmAtiON
Millions of yenThousands of
U.S. dollars
2010 2009 2008 2010
Cash paid during the year for:
Interest . . . . . . . . . . . . . . . . . . . . . . . . . . . . . . . . . ¥26,706 ¥ 34,443 ¥ 42,468 $287,161
Income taxes . . . . . . . . . . . . . . . . . . . . . . . . . . . . 61,155 177,624 174,735 657,581
Noncash investing and financial activities:
Capitalized lease assets . . . . . . . . . . . . . . . . . . . . ¥ 5,956 ¥ 10,299 ¥ 5,488 $ 64,043
Conversion of convertible debentures issued by the Company . . . . . . . . . . . . . . . . . . . 2 – – 22
The proceeds from the sale of securities classified as available-for-sale disclosed in note 4 are included in proceeds from sale of investments in securities and shares of consolidated subsidiaries resulting in deconsolidation on the consolidated statements of cash flows.
26. dErivAtivE iNStrumENtS ANd hEdgiNg ACtivitiES
Overall risk profileThe major manufacturing bases of the Company and its subsidiaries are located in Japan and Asia. The selling bases are located globally, and the Company and its subsidiaries generate approximately 40% of their sales from overseas. These overseas sales are mainly denominated in the U.S. dollar or Euro. As a result, the Company and its subsidiaries are exposed to market risks from changes in foreign currency exchange rates.
The Company’s financing subsidiaries in the U.K., the U.S. and Singapore issue variable rate medium-term notes mainly through the Euro markets to finance its overseas long-term operating capital. As a result, the Company and its subsidiaries are exposed to market risks from changes in foreign currency exchange rates and interest rates.
The Company and its subsidiaries are also exposed to credit-related losses in the event of non-performance by counterparties to derivative financial instruments, but it is not expected that any counterparties will fail to meet their obligations because most of the counterparties are internationally recognized financial institutions that are rated A or higher and contracts are diversified into a number of major financial institutions.
The Company and its subsidiaries have an insignificant amount of derivative instruments containing credit-risk-related contingent features, such as provisions that require the Company’s debt to maintain an investment grade credit rating from each of the major credit rating agencies.
Risk management policyThe Company and its subsidiaries assess foreign currency exchange rate risk and interest rate risk by continually monitoring changes in these exposures and by evaluating hedging opportunities. It is the Company’s principal policy that the Company and its subsidiaries do not enter into derivative financial instruments for speculation purposes.
Foreign currency exchange rate risk managementThe Company and its subsidiaries have assets and liabilities which are exposed to foreign currency exchange rate risk and, as a result, they enter into forward exchange contracts and cross currency swap agreements for the purpose of hedging these risk exposures.
In order to fix the future net cash flows principally from trade receivables and payables recognized, which are denominated in foreign currencies, the Company and its subsidiaries on a monthly basis measure the volume and due date of future net cash flows by currency. In accordance with the Company’s policy, a certain portion of measured net cash flows is covered using forward exchange contracts, which principally mature within one year.

102 Hitachi, Ltd. Annual Report 2010
The Company and its subsidiaries enter into cross currency swap agreements with the same maturities as underlying debt to fix cash flows from long-term debt denominated in foreign currencies. The hedging relationship between the derivative financial instrument and its hedged item is highly effective in achieving offsetting changes in foreign currency exchange rates.
Interest rate risk managementThe Company’s and certain subsidiaries’ exposure to interest rate risk is related principally to long-term debt obligations. Management believes it is prudent to minimize the variability caused by interest rate risk.
To meet this objective, the Company and certain subsidiaries principally enter into interest rate swaps to manage fluctuations in cash flows. The interest rate swaps entered into are receive-variable, pay-fixed interest rate swaps. Under the interest rate swaps, the Company and certain subsidiaries receive variable interest rate payments on long-term debt associated with medium-term notes and make fixed interest rate payments, thereby creating fixed interest rate long-term debt.
Certain financing subsidiaries mainly finance a portion of their operations using long-term debt with a fixed interest rate and lend funds at variable interest rates. Therefore, such companies are exposed to interest rate risk. Management believes it is prudent to minimize the variability caused by interest rate risk. To meet this objective, certain financing subsidiaries principally enter into interest rate swaps converting the fixed rate to a variable rate to manage fluctuations in fair value resulting from interest rate risk. Under the interest rate swaps, certain financing subsidiaries receive fixed interest rate payments associated with long-term debt, including medium-term notes, and make variable interest rate payments, thereby creating variable-rate long-term debt.
The hedging relationship between the interest rate swaps and its hedged item is highly effective in achieving offsetting changes in cash flows and fair value resulting from interest rate risk.
Fair value hedgeChanges in the fair value of both recognized assets and liabilities, and derivative financial instruments designated as fair value hedges of these assets and liabilities are recognized in other income (deductions). Derivative financial instruments designated as fair value hedges include forward exchange contracts associated with operating transactions, cross currency swap agreements and interest rate swaps associated with financing transactions.
Exchange loss for the years ended March 31, 2009 and 2008 includes net gains of ¥169 million and ¥4,142 million, respectively, which represent the component of hedging instruments excluded from the assessment of hedge effectiveness. Net gain or loss related to the ineffective portion of hedging instruments is not material for the years ended March 31, 2009 and 2008.
Interest charges for the years ended March 31, 2009 and 2008 include net losses of ¥466 million and ¥586 million, respectively, which represent the component of hedging instruments excluded from the assessment of hedge effectiveness. Net gain or loss related to the ineffective portion of hedging instruments is not material for the years ended March 31, 2009 and 2008.
Cash flow hedgeForeign currency exposure:
Changes in the fair value of forward exchange contracts designated and qualifying as cash flow hedges of forecasted transactions are reported in accumulated other comprehensive income (AOCI). These amounts are reclassified into earnings in the same period as the hedged items affect earnings.
Exchange gain for the years ended March 31, 2009 and 2008 includes net gains of ¥2,229 million and ¥1,591 million, respectively, which represent the component of hedging instruments excluded from the assessment of hedge effectiveness. Net gain or loss related to the ineffective portion of hedging instruments is not material for the years ended March 31, 2009 and 2008.
It is expected that a net gain of approximately ¥3,241 million ($34,849 thousand) recorded in AOCI relating to existing forward exchange contracts will be reclassified into other income or other deductions during the year ending March 31, 2011.
As of March 31, 2010, the maximum length of time over which the Company and its subsidiaries are hedging their exposure to the variability in future cash flows associated with foreign currency forecasted transactions is approximately 49 months.

103Hitachi, Ltd. Annual Report 2010
Interest rate exposure:
Changes in fair values of interest rate swaps designated as hedging instruments for the variability of cash flows associated with long-term debt obligations are reported in AOCI. These amounts subsequently are reclassified into interest charges as a yield adjustment in the same period in which the hedged debt obligations affect earnings.
Interest charges for the years ended March 31, 2009 and 2008 include net losses of ¥347 million and ¥194 million, respectively, which represent the component of hedging instruments excluded from the assessment of hedge effectiveness. Interest charges for the years ended March 31, 2009 and 2008 include a net gain of ¥553 million and a net loss of ¥730 million, respectively, which represents the component of hedge ineffectiveness.
It is expected that a net loss of approximately ¥740 million ($7,957 thousand) recorded in AOCI related to interest rate swaps will be reclassified into interest charges as a yield adjustment of the hedged debt obligations during the year ending March 31, 2011.
The contract or notional amounts of derivative financial instruments held as of March 31, 2010 and 2009 are summarized as follows:
Millions of yenThousands of
U.S. dollars
2010 2009 2010
Forward exchange contracts:
To sell foreign currencies . . . . . . . . . . . . . . . . . . . . . . . . . . . . . . . . . . ¥204,084 ¥237,177 $2,194,452
To buy foreign currencies . . . . . . . . . . . . . . . . . . . . . . . . . . . . . . . . . . 93,659 128,035 1,007,086
Cross currency swap agreements:
To sell foreign currencies . . . . . . . . . . . . . . . . . . . . . . . . . . . . . . . . . . 78,381 106,329 842,806
To buy foreign currencies . . . . . . . . . . . . . . . . . . . . . . . . . . . . . . . . . . 107,778 131,111 1,158,903
Interest rate swaps . . . . . . . . . . . . . . . . . . . . . . . . . . . . . . . . . . . . . . . . 354,492 406,725 3,811,742
Option contracts . . . . . . . . . . . . . . . . . . . . . . . . . . . . . . . . . . . . . . . . . . 935 7,552 10,054
The following tables, “Effective portion of derivatives designated as hedging instruments and related hedged items” and “Ineffective portion and amount excluded from effectiveness test,” show the effects of derivative instruments for fair value hedges on the consolidated statement of operations for the year ended March 31, 2010:
Effective portion of derivatives designated as hedging instruments and related hedged items
2010
Hedging instruments Related hedged items
Derivatives LocationMillions of yen
Thousands of U.S. dollars Items Location
Millions of yen
Thousands of U.S. dollars
Forward exchange contracts
Other income . . . . . . ¥ 5,871 $ 63,129 Accounts receivable and accounts payable
Other income . . . . . . ¥(5,877) $(63,194)
Cross currency swap agreements
Interest charges . . . . (6,368) (68,473) Long-term debt
Interest charges . . . . 6,514 70,043
¥ (497) $ (5,344) ¥ 637 $ 6,849
Ineffective portion and amount excluded from effectiveness test
2010
Derivatives Location Millions of yenThousands of
U.S. dollars
Forward exchange contracts Other income . . . . . . . . . . . . . . . . . . . . . . ¥ (175) $ (1,882)
Cross currency swap agreements Other income . . . . . . . . . . . . . . . . . . . . . . 3,206 34,473
Interest rate swaps Interest charges . . . . . . . . . . . . . . . . . . . . 580 6,237
¥3,611 $38,828

104 Hitachi, Ltd. Annual Report 2010
The following tables, “Effective portion of derivatives designated as hedging instruments and related hedged items” and “Ineffective portion and amount excluded from effectiveness test,” show the effects of derivative instruments for fair value hedges on the consolidated statement of operations for the quarter ended March 31, 2009:
Effective portion of derivatives designated as hedging instruments and related hedged items
Hedging instruments Related hedged items
Derivatives Location Millions of yen Items Location Millions of yen
Forward exchange contracts
Other deductions . . . ¥ (6,814) Accounts receivable and accounts payable
Other deductions . . . ¥ 5,832
Other deductions . . . (590) Short-term investments and short-term debt
Other deductions . . . 614
Cross currency swap agreements
Other deductions . . . (3,036) Investments and advances
Other deductions . . . . 3,053
Interest charges . . . . (3,115) Long-term debt Interest charges . . . . 2,900
¥(13,555) ¥12,399
Ineffective portion and amount excluded from effectiveness test
Derivatives Location Millions of yen
Forward exchange contracts Other deductions . . . . . . . . . . . . . . . . . . . . . . . . . . ¥ 227
Cross currency swap agreements Other deductions . . . . . . . . . . . . . . . . . . . . . . . . . . (2,065)
Interest rate swaps Interest charges . . . . . . . . . . . . . . . . . . . . . . . . . . . (58)
¥(1,896)
The following tables, “Gain (loss) recognized in OCI, Effective portion of derivatives designated as hedging instruments,” “Gain (loss) reclassified from AOCI into consolidated statement of operations, Effective portion of derivatives designated as hedging instruments” and “Gain (loss) on derivatives designated as cash flow hedging instruments, Ineffective portion and amount excluded from effectiveness test” show the effect of derivative instruments for cash flow hedges on the consolidated statement of operations for the year ended March 31, 2010:
Gain (loss) recognized in OCIEffective portion of derivatives designated as hedging instruments
2010
Derivatives Millions of yenThousands of
U.S. dollars
Forward exchange contracts . . . . . . . . . . . . . . . . . . . . . . . . . . . . . . . . . . . . . . . . . . . . . ¥ 1,323 $ 14,226
Cross currency swap agreements . . . . . . . . . . . . . . . . . . . . . . . . . . . . . . . . . . . . . . . . . 2,435 26,182
Interest rate swaps . . . . . . . . . . . . . . . . . . . . . . . . . . . . . . . . . . . . . . . . . . . . . . . . . . . . (2,469) (26,548)
Option contracts . . . . . . . . . . . . . . . . . . . . . . . . . . . . . . . . . . . . . . . . . . . . . . . . . . . . . . 639 6,871
¥ 1,928 $ 20,731
Gain (loss) reclassified from AOCI into consolidated statement of operationsEffective portion of derivatives designated as hedging instruments
2010
Derivatives Location Millions of yenThousands of
U.S. dollars
Forward exchange contracts Other income . . . . . . . . . . . . . . . ¥(1,007) $(10,828)
Cross currency swap agreements Other income . . . . . . . . . . . . . . . (7,536) (81,032)
Interest rate swaps Interest charges . . . . . . . . . . . . . 1,756 18,881
Option contracts Other income . . . . . . . . . . . . . . . (634) (6,817)
¥(7,421) $(79,796)

105Hitachi, Ltd. Annual Report 2010
Gain (loss) on derivatives designated as cash flow hedging instrumentsIneffective portion and amount excluded from effectiveness test
2010
Derivatives Location Millions of yenThousands of
U.S. dollars
Forward exchange contracts Other income . . . . . . . . . . . . . . . ¥ 245 $ 2,634
Cross currency swap agreements Other income . . . . . . . . . . . . . . . (3,378) (36,322)
Interest rate swaps Interest charges . . . . . . . . . . . . . 589 6,333
¥(2,544) $(27,355)
The following tables, “Gain (loss) recognized in OCI, Effective portion of derivatives designated as hedging instruments,” “Gain (loss) reclassified from AOCI into consolidated statement of operations, Effective portion of derivatives designated as hedging instruments” and “Gain (loss) on derivatives designated as cash flow hedging instruments, Ineffective portion and amount excluded from effectiveness test” show the effect of derivative instruments for cash flow hedges on the consolidated statement of operations for the quarter ended March 31, 2009:
Gain (loss) recognized in OCIEffective portion of derivatives designated as hedging instruments
Derivatives Millions of yen
Forward exchange contracts . . . . . . . . . . . . . . . . . . . . . . . . . . . . . . . . . . . . . . . . . . . . . . . . . . . . . . . . . . . . ¥ 638
Cross currency swap agreements . . . . . . . . . . . . . . . . . . . . . . . . . . . . . . . . . . . . . . . . . . . . . . . . . . . . . . . . (1,685)
Interest rate swaps . . . . . . . . . . . . . . . . . . . . . . . . . . . . . . . . . . . . . . . . . . . . . . . . . . . . . . . . . . . . . . . . . . . (1,025)
Option contracts . . . . . . . . . . . . . . . . . . . . . . . . . . . . . . . . . . . . . . . . . . . . . . . . . . . . . . . . . . . . . . . . . . . . . 8
¥(2,064)
Gain (loss) reclassified from AOCI into consolidated statement of operationsEffective portion of derivatives designated as hedging instruments
Derivatives Location Millions of yen
Forward exchange contracts Other deductions . . . . . . . . . . . . . . . . . . . . . . . . . . . ¥(1,623)
Cross currency swap agreements Other deductions . . . . . . . . . . . . . . . . . . . . . . . . . . . (1,080)
Interest rate swaps Interest income . . . . . . . . . . . . . . . . . . . . . . . . . . . . 830
Option contracts Other deductions . . . . . . . . . . . . . . . . . . . . . . . . . . . (1,492)
¥(3,365)
Gain (loss) on derivatives designated as cash flow hedging instrumentsIneffective portion and amount excluded from effectiveness test
Derivatives Location Millions of yen
Forward exchange contracts Other deductions . . . . . . . . . . . . . . . . . . . . . . . . . . ¥(1,598)
Cross currency swap agreements Other deductions . . . . . . . . . . . . . . . . . . . . . . . . . . (358)
Interest rate swaps Interest income . . . . . . . . . . . . . . . . . . . . . . . . . . . 120
¥(1,836)
27. CONCENtrAtiONS OF CrEdit riSk
The Company and its subsidiaries generally do not have significant concentrations of credit risk to any counterparties nor any regions because they are diversified and spread globally.

106 Hitachi, Ltd. Annual Report 2010
28. FAir vALuE OF FiNANCiAL iNStrumENtS
The following methods and assumptions are used to estimate the fair values of financial instruments:
Long-term debtThe fair value of long-term debt is estimated based on quoted market prices or the present value of future cash flows using the Company’s and its subsidiaries’ market interest rates for the same contractual terms.
Cash and cash equivalents, Trade receivables, Short-term debt and Trade payablesThe carrying amount approximates the fair value because of the short maturity of these instruments.
Investments in securities, Subordinated interests resulting from securitization and DerivativesRefer to note 29 for the methods and assumptions used to estimate the fair values.
The carrying amounts and estimated fair values of the financial instruments as of March 31, 2010 and 2009 are as follows:
Millions of yen Thousands of U.S. dollars
2010 2009 2010
Carrying amounts
Estimated fair values
Carrying amounts
Estimated fair values
Carrying amounts
Estimated fair values
Investments in securities:
Short-term investments . . . . . . . . . . . . . . . . . . ¥ 53,575 ¥ 53,575 ¥ 8,654 ¥ 8,654 $ 576,075 $ 576,075
Investments and advances . . . . . . . . . . . . . . . . 200,326 200,326 158,819 158,819 2,154,043 2,154,043
Derivatives (Effective Portion in Other Current Assets):
Forward exchange contracts . . . . . . . . . . . . . . 2,624 2,624 2,475 2,475 28,215 28,215
Cross currency swap agreements . . . . . . . . . . 5,357 5,357 16,297 16,297 57,602 57,602
Interest rate swaps . . . . . . . . . . . . . . . . . . . . . . 3 3 31 31 32 32
Option contracts . . . . . . . . . . . . . . . . . . . . . . . 1 1 1 1 11 11
Derivatives (Ineffective Portion in Other Current Assets):
Forward exchange contracts . . . . . . . . . . . . . . 407 407 180 180 4,376 4,376
Cross currency swap agreements . . . . . . . . . . 3,268 3,268 414 414 35,140 35,140
Interest rate swaps . . . . . . . . . . . . . . . . . . . . . . – – – – – –
Option contracts . . . . . . . . . . . . . . . . . . . . . . . – – – – – –
Derivatives (Effective Portion in Other Assets):
Forward exchange contracts . . . . . . . . . . . . . . 27 27 34 34 290 290
Cross currency swap agreements . . . . . . . . . . 12,070 12,070 14,358 14,358 129,785 129,785
Interest rate swaps . . . . . . . . . . . . . . . . . . . . . . 999 999 496 496 10,742 10,742
Option contracts . . . . . . . . . . . . . . . . . . . . . . . – – – – – –
Derivatives (Ineffective Portion in Other Assets):
Forward exchange contracts . . . . . . . . . . . . . . 22 22 – – 237 237
Cross currency swap agreements . . . . . . . . . . 2,091 2,091 5,963 5,963 22,484 22,484
Interest rate swaps . . . . . . . . . . . . . . . . . . . . . . 11 11 – – 118 118
Option contracts . . . . . . . . . . . . . . . . . . . . . . . – – – – – –
Subordinated interests resulting from securitization:
Other current assets . . . . . . . . . . . . . . . . . . . . 4,114 4,114 5,793 5,793 44,237 44,237
Advances and other . . . . . . . . . . . . . . . . . . . . . 111,303 111,303 117,672 117,672 1,196,806 1,196,806

107Hitachi, Ltd. Annual Report 2010
Millions of yen Thousands of U.S. dollars
2010 2009 2010
Carrying amounts
Estimated fair values
Carrying amounts
Estimated fair values
Carrying amounts
Estimated fair values
Long-term debt . . . . . . . . . . . . . . . ¥(1,915,692) ¥(1,954,713) ¥(1,821,287) ¥(1,801,249) $(20,598,839) $(21,018,419)
Derivatives (Effective Portion in Other Current Liabilities):
Forward exchange contracts . . . (3,480) (3,480) (4,669) (4,669) (37,419) (37,419)
Cross currency swap agreements . . . . . . . . . . . . . . . (488) (488) (142) (142) (5,247) (5,247)
Interest rate swaps . . . . . . . . . . . (701) (701) (379) (379) (7,538) (7,538)
Option contracts . . . . . . . . . . . . (6 ) (6) (37) (37) (64) (64)
Derivatives (Ineffective Portion in Other Current Liabilities):
Forward exchange contracts . . . (721) (721) (619) (619) (7,753) (7,753)
Cross currency swap agreements . . . . . . . . . . . . . . . – – (345) (345) – –
Interest rate swaps . . . . . . . . . . . (142) (142) (466) (466) (1,527) (1,527)
Option contracts . . . . . . . . . . . . – – – – – –
Derivatives (Effective Portion in Other Liabilities):
Forward exchange contracts . . . (103) (103) (66) (66) (1,107) (1,107)
Cross currency swap agreements . . . . . . . . . . . . . . . (228) (228) (4,842) (4,842) (2,452) (2,452)
Interest rate swaps . . . . . . . . . . . (4,076) (4,076) (3,135) (3,135) (43,828) (43,828)
Option contracts . . . . . . . . . . . . – – (5) (5) – –
Derivatives (Ineffective Portion in Other Liabilities):
Forward exchange contracts . . . – – – – – –
Cross currency swap agreements . . . . . . . . . . . . . . . (5,148) (5,148) (2) (2) (55,355) (55,355)
Interest rate swaps . . . . . . . . . . . (42) (42) (840) (840) (452) (452)
Option contracts . . . . . . . . . . . . – – – – – –
It is not practicable to estimate the fair value of investments in unlisted stock because of the lack of a market price and difficulty in estimating fair value without incurring excessive cost. The carrying amounts of these investments as of March 31, 2010 and 2009 totaled ¥48,222 million ($518,516 thousand) and ¥53,325 million, respectively.
29. FAir vALuE
ASC 820 establishes a fair value hierarchy that prioritizes the use of observable inputs in markets over the use of unobservable inputs when measuring fair value as follows:
Level 1Quoted prices for identical assets or liabilities in active markets.
Level 2Quoted prices for similar assets or liabilities in active markets; quoted prices associated with transactions that are not distressed for identical or similar assets or liabilities in markets that are not active; or valuations whose significant inputs are derived from or corroborated by observable market data.

108 Hitachi, Ltd. Annual Report 2010
Level 3Valuations using inputs that are not observable.
Investments in debt and equity securitiesWhen available, quoted market prices are used to determine the fair value of investment securities included in Level 1. Level 1 securities include available-for-sale securities such as listed stocks on exchange markets, debt securities such as Japan treasury bonds and U.S. treasury bonds and exchange traded funds.
In the absence of an active market for investment securities, quoted prices for similar investment securities, quoted prices associated with transactions that are not distressed for identical or similar investment securities or other relevant information including market interest rate curves, referenced credit spreads or default rates, are used to determine fair value. These investments are included in Level 2. Level 2 securities include short-term investments and available-for-sale securities such as listed stocks traded over-the-counter, investment funds and debt securities traded over-the-counter.
In infrequent circumstances, the significant inputs of fair value for investment securities are unobservable and the Company mainly uses an income or market approach to corroborate relevant information provided by financial institutions. These investments are included in Level 3. Level 3 securities include available-for-sale securities such as subordinated debentures and structured bonds with little market activity.
DerivativesClosing prices are used for derivatives included in Level 1, which are traded on active markets. The majority of derivatives are traded on over-the-counter markets, which the Company does not deem to represent active markets. Derivative assets and liabilities for which fair value is based on quoted prices associated with transactions that are not distressed, in markets that are not active, or based on models using interest rate curves and forward and spot prices for currencies and commodities are included in Level 2. Derivatives included in Level 2 primarily consist of interest rate swaps, cross-currency swaps and foreign currency and commodity forward and option contracts. In infrequent circumstances, the significant inputs of fair value are unobservable and the Company mainly uses an income or market approach to corroborate relevant information provided by financial institutions. These derivatives are included in Level 3.
Subordinated interests resulting from securitizationWhen fair value is determined using observable inputs, including prices of recent transactions in markets that are not distressed, subordinated interests are included in Level 2. When significant inputs are not observable, fair value is determined based on economic assumptions used in measuring the fair value of the subordinated interests, including weighted-average life, expected credit risks, and discount rates, and the subordinated interests are included in Level 3.

109Hitachi, Ltd. Annual Report 2010
The following tables present the assets and liabilities that are measured at fair value on a recurring basis and the fair value hierarchy classification as of March 31, 2010 and 2009. The carrying value on the consolidated balance sheet is equal to the fair value.
Millions of yen
2010
Fair value hierarchy classification
Total Balance Level 1 Level 2 Level 3
Assets:
Investments in securities
Equity securities . . . . . . . . . . . . . . . . . . . . . . . . . . . . . . . ¥159,850 ¥156,879 ¥ 2,971 ¥ –
Governmental debt securities . . . . . . . . . . . . . . . . . . . . . 44,156 43,989 167 –
Corporate debt securities . . . . . . . . . . . . . . . . . . . . . . . . 35,359 – 6,426 28,933
Other . . . . . . . . . . . . . . . . . . . . . . . . . . . . . . . . . . . . . . . 14,260 5,903 8,357 –
Derivatives . . . . . . . . . . . . . . . . . . . . . . . . . . . . . . . . . . . . . 26,880 – 26,880 –
Subordinated interests resulting from securitization . . . . . . 115,417 – – 115,417
¥395,922 ¥206,771 ¥ 44,801 ¥144,350
Liabilities:
Derivatives . . . . . . . . . . . . . . . . . . . . . . . . . . . . . . . . . . . . . ¥ (15,135) ¥ – ¥(15,135) ¥ –
Thousands of U.S. dollars
2010
Fair value hierarchy classification
Total Balance Level 1 Level 2 Level 3
Assets:
Investments in securities
Equity securities . . . . . . . . . . . . . . . . . . . . . . . . . . . . . . . $1,718,817 $1,686,871 $ 31,946 $ –
Governmental debt securities . . . . . . . . . . . . . . . . . . . . . 474,796 473,000 1,796 –
Corporate debt securities . . . . . . . . . . . . . . . . . . . . . . . . 380,204 – 69,097 311,107
Other . . . . . . . . . . . . . . . . . . . . . . . . . . . . . . . . . . . . . . . 153,333 63,473 89,860 –
Derivatives . . . . . . . . . . . . . . . . . . . . . . . . . . . . . . . . . . . . . 289,032 – 289,032 –
Subordinated interests resulting from securitization . . . . . . 1,241,043 – – 1,241,043
$4,257,225 $2,223,344 $ 481,731 $1,552,150
Liabilities:
Derivatives . . . . . . . . . . . . . . . . . . . . . . . . . . . . . . . . . . . . . $ (162,742) $ – $(162,742) $ –
Millions of yen
2009
Fair value hierarchy classification
Total Balance Level 1 Level 2 Level 3
Assets:
Investments in securities
Equity securities . . . . . . . . . . . . . . . . . . . . . . . . . . . . . . . ¥120,434 ¥118,063 ¥ 2,371 ¥ –
Governmental debt securities . . . . . . . . . . . . . . . . . . . . . 7,969 6,413 1,556 –
Corporate debt securities . . . . . . . . . . . . . . . . . . . . . . . . 28,995 1,153 1,310 26,532
Other . . . . . . . . . . . . . . . . . . . . . . . . . . . . . . . . . . . . . . . 9,789 3,377 6,412 –
Derivatives . . . . . . . . . . . . . . . . . . . . . . . . . . . . . . . . . . . . . 40,249 – 40,249 –
Subordinated interests resulting from securitization . . . . . . 123,465 – – 123,465
¥330,901 ¥129,006 ¥51,898 ¥149,997
Liabilities:
Derivatives ¥ (15,547) ¥ – ¥(15,547) ¥ –

110 Hitachi, Ltd. Annual Report 2010
The following table presents the changes in Level 3 instruments measured on a recurring basis for the year ended March 31, 2010.
Millions of yen Thousands of U.S. dollars
2010 2010
Corporate debt
securities
Subordinated interests
resulting from securitization Total
Corporate debt
securities
Subordinated interests
resulting from securitization Total
Balance at beginning of year . . . . . . . . . . . . . ¥26,532 ¥123,465 ¥149,997 $285,290 $1,327,581 $1,612,871
Purchases, sales, issuances and settlements . . . . . . . . . . . . . . . . . . . . . . (271) (11,275) (11,546) (2,914) (121,237) (124,151)
Total gains or losses (realized/unrealized)
Included in earnings (a) . . . . . . . . . . . . . . . (15) 3,588 3,573 (161) 38,581 38,420
Included in other comprehensive loss . . . . . 2,687 (361) 2,326 28,892 (3,882) 25,010
Balance at end of year . . . . . . . . . . . . . . . . . . ¥28,933 ¥115,417 ¥144,350 $311,107 $1,241,043 $1,552,150
The amount of total gains or losses for the period included in earnings attributable to the change in unrealized gains or losses relating to assets still held at the reporting date . . . . . . . . . . . . . . . ¥ (14) ¥ 3,534 ¥ 3,520 $ (151) $ 38,000 $ 37,849
(a) Level 3 gains and losses (realized and unrealized) included in earnings for the year ended March 31, 2010 are reported in other income (deductions) for corporate debt securities and are reported in revenue for subordinated interests resulting from securitization.
The following table presents the changes in Level 3 instruments measured on a recurring basis for the year ended March 31, 2009.
Millions of yen
2009
Corporate debt
securities
Subordinated interests
resulting from securitization Total
Balance at beginning of year . . . . . . . . . . . . . ¥46,324 ¥133,271 ¥179,595
Purchases, sales, issuances and settlements . . . . . . . . . . . . . . . . . . . . . . (16,662) (9,402) (26,064)
Total gains or losses (realized/unrealized)
Included in earnings (b) . . . . . . . . . . . . . . . (2,928) 3,592 664
Included in other comprehensive loss . . . . . (202 ) (3,996) (4,198)
Balance at end of year . . . . . . . . . . . . . . . . . . ¥26,532 ¥123,465 ¥149,997
The amount of total gains or losses for the period included in earnings attributable to the change in unrealized gains or losses relating to assets still held at the reporting date . . . . . . . . . . . . . . . ¥ (2,685) ¥ 3,408 ¥ 723
(b) Level 3 gains and losses (realized and unrealized) included in earnings for the year ended March 31, 2009 are reported in other income (deductions) for corporate debt securities and are reported in revenue for subordinated interests resulting from securitization.
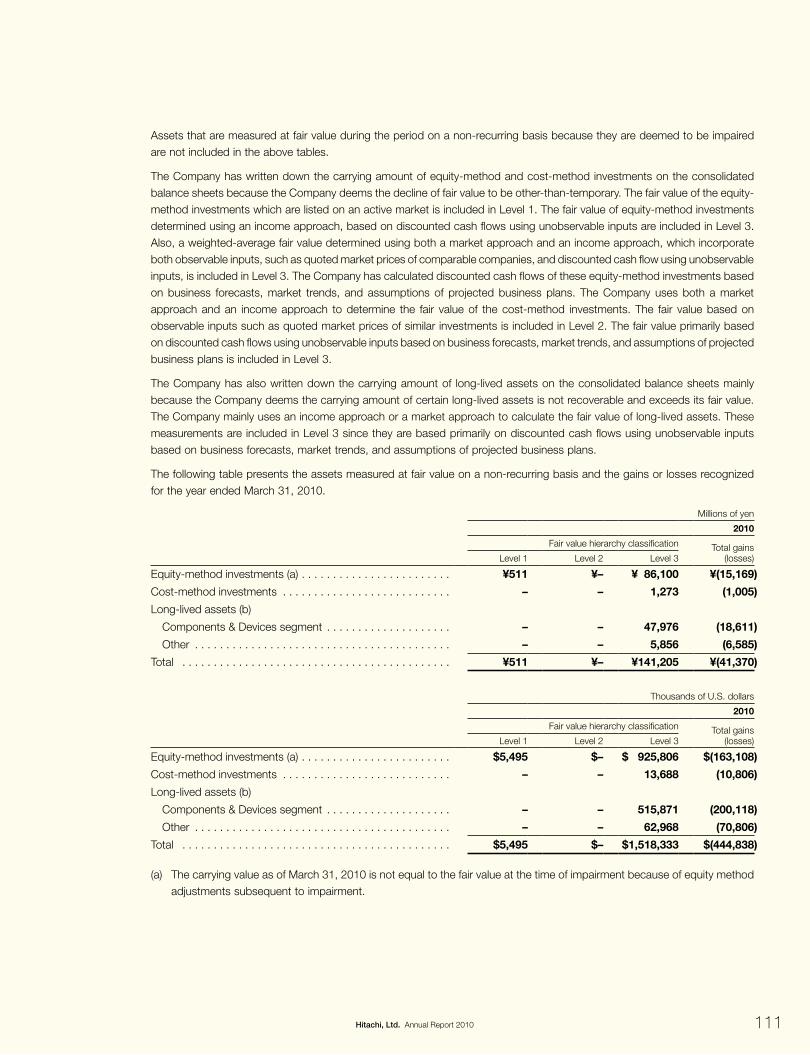
111Hitachi, Ltd. Annual Report 2010
Assets that are measured at fair value during the period on a non-recurring basis because they are deemed to be impaired are not included in the above tables.
The Company has written down the carrying amount of equity-method and cost-method investments on the consolidated balance sheets because the Company deems the decline of fair value to be other-than-temporary. The fair value of the equity-method investments which are listed on an active market is included in Level 1. The fair value of equity-method investments determined using an income approach, based on discounted cash flows using unobservable inputs are included in Level 3. Also, a weighted-average fair value determined using both a market approach and an income approach, which incorporate both observable inputs, such as quoted market prices of comparable companies, and discounted cash flow using unobservable inputs, is included in Level 3. The Company has calculated discounted cash flows of these equity-method investments based on business forecasts, market trends, and assumptions of projected business plans. The Company uses both a market approach and an income approach to determine the fair value of the cost-method investments. The fair value based on observable inputs such as quoted market prices of similar investments is included in Level 2. The fair value primarily based on discounted cash flows using unobservable inputs based on business forecasts, market trends, and assumptions of projected business plans is included in Level 3.
The Company has also written down the carrying amount of long-lived assets on the consolidated balance sheets mainly because the Company deems the carrying amount of certain long-lived assets is not recoverable and exceeds its fair value. The Company mainly uses an income approach or a market approach to calculate the fair value of long-lived assets. These measurements are included in Level 3 since they are based primarily on discounted cash flows using unobservable inputs based on business forecasts, market trends, and assumptions of projected business plans.
The following table presents the assets measured at fair value on a non-recurring basis and the gains or losses recognized for the year ended March 31, 2010.
Millions of yen
2010
Fair value hierarchy classification Total gains (losses)Level 1 Level 2 Level 3
Equity-method investments (a) . . . . . . . . . . . . . . . . . . . . . . . . ¥511 ¥– ¥ 86,100 ¥(15,169)
Cost-method investments . . . . . . . . . . . . . . . . . . . . . . . . . . . – – 1,273 (1,005)
Long-lived assets (b)
Components & Devices segment . . . . . . . . . . . . . . . . . . . . – – 47,976 (18,611)
Other . . . . . . . . . . . . . . . . . . . . . . . . . . . . . . . . . . . . . . . . . – – 5,856 (6,585)
Total . . . . . . . . . . . . . . . . . . . . . . . . . . . . . . . . . . . . . . . . . . . ¥511 ¥– ¥141,205 ¥(41,370)
Thousands of U.S. dollars
2010
Fair value hierarchy classification Total gains (losses)Level 1 Level 2 Level 3
Equity-method investments (a) . . . . . . . . . . . . . . . . . . . . . . . . $5,495 $– $ 925,806 $(163,108)
Cost-method investments . . . . . . . . . . . . . . . . . . . . . . . . . . . – – 13,688 (10,806)
Long-lived assets (b)
Components & Devices segment . . . . . . . . . . . . . . . . . . . . – – 515,871 (200,118)
Other . . . . . . . . . . . . . . . . . . . . . . . . . . . . . . . . . . . . . . . . . – – 62,968 (70,806)
Total . . . . . . . . . . . . . . . . . . . . . . . . . . . . . . . . . . . . . . . . . . . $5,495 $– $1,518,333 $(444,838)
(a) The carrying value as of March 31, 2010 is not equal to the fair value at the time of impairment because of equity method adjustments subsequent to impairment.

112 Hitachi, Ltd. Annual Report 2010
(b) The carrying value as of March 31, 2010 is not equal to the fair value at the time of impairment because of depreciation expense subsequent to impairment.
The following table presents the financial assets measured at fair value on a non-recurring basis and the gains or losses recognized for the year ended March 31, 2009.
Millions of yen
2009
Fair value hierarchy classification Total gains (losses)Level 1 Level 2 Level 3
Equity-method investments (a) . . . . . . . . . . . . . . . . . . . . . . . . ¥11,831 ¥ – ¥ – ¥(11,219)
Cost-method investments . . . . . . . . . . . . . . . . . . . . . . . . . . . – 2,044 1,068 (5,877)
Total . . . . . . . . . . . . . . . . . . . . . . . . . . . . . . . . . . . . . . . . . . . ¥11,831 ¥2,044 ¥1,068 ¥(17,096)
(a) The carrying value as of March 31, 2009 is not equal to the fair value at the time of impairment because of equity method adjustments subsequent to impairment.
30. mErgEr ANd ACquiSitiON
On March 30, 2010, Hitachi Construction Machinery Co., Ltd. (Hitachi Construction Machinery), a subsidiary of the Company in the Construction Machinery segment, agreed with Tata Motors Limited to purchase an additional 20% interest in Telco Construction Equipment Co., Ltd. (Telcon). As a result, Hitachi Construction Machinery purchased a total of 20,000,000 shares for ¥23,704 million ($254,882 thousand) on March 30, 2010, resulting in the percentage of Hitachi Construction Machinery’s ownership interests in Telcon increasing from 40.0% to 60.0%. Accordingly, Hitachi Construction Machinery obtained control over Telcon and it became a consolidated subsidiary effective March 30, 2010 (the acquisition date).
Telcon manufactures and sells major construction machinery including hydraulic excavators, backhoe loaders and wheel loaders. Hitachi Construction Machinery decided to purchase an additional 20% interest to obtain a strong lead in the India market, which is expected to grow significantly.
The following table summarizes the consideration paid for Telcon, the provisional amounts of the assets acquired and liabilities assumed and recognized as of the acquisition date, as well as the fair value as of the acquisition date of the noncontrolling interest in Telcon.
Millions of yenThousands of
U.S. dollars
Current assets . . . . . . . . . . . . . . . . . . . . . . . . . . . . . . . . . . . . . . . . . . . . . . . . . . . . . . . . ¥ 29,741 $ 319,796
Non-current assets . . . . . . . . . . . . . . . . . . . . . . . . . . . . . . . . . . . . . . . . . . . . . . . . . . . . 16,912 181,849
Goodwill (not deductible for tax purposes) . . . . . . . . . . . . . . . . . . . . . . . . . . . . . . . . . . . 57,649 619,882
Current liabilities . . . . . . . . . . . . . . . . . . . . . . . . . . . . . . . . . . . . . . . . . . . . . . . . . . . . . . (35,105) (377,473)
Non-current liabilities . . . . . . . . . . . . . . . . . . . . . . . . . . . . . . . . . . . . . . . . . . . . . . . . . . . (1,393) (14,978)
Previously acquired equity interest measured at fair value . . . . . . . . . . . . . . . . . . . . . . . (22,050) (237,097)
Cash paid for acquisition . . . . . . . . . . . . . . . . . . . . . . . . . . . . . . . . . . . . . . . . . . . . . . . . (23,704) (254,882)
Fair value of noncontrolling interests . . . . . . . . . . . . . . . . . . . . . . . . . . . . . . . . . . . . . . . (22,050) (237,097)
The Company recognized a gain of ¥14,923 million ($160,462 thousand) as a result of remeasuring to fair value its 40% equity interest in Telcon held before the business combination. The gain is included in other deductions in the Company’s consolidated statement of operations for the year ended March 31, 2010.
The fair value of both the equity interest held before the business combination and the noncontrolling interest in Telcon, a private entity, were estimated by applying the income approach. These fair value measurements are based on significant inputs that are not observable in the market and thus represent Level 3 measurements. Key inputs include business forecasts, market trends, assumptions of projected business plans and adjustments because of the lack of control that market participants would consider when estimating the fair value of the noncontrolling interest in Telcon.

113Hitachi, Ltd. Annual Report 2010
The results of operations of Telcon for the period from the acquisition date to March 31, 2010 were not material.
The Company is currently evaluating the fair values to be assigned to assets and liabilities of Telcon at the acquisition date, and therefore the above amounts are subject to change.
On a pro forma basis, revenue, net loss and the per share information of the Company with assumed acquisition dates for Telcon of April 1, 2009 and 2008 would not differ materially from the amounts reported in the accompanying consolidated financial statements as of and for the years ended March 31, 2010 and 2009.
On January 14, 2009, the Company announced its decision to purchase additional shares of Hitachi Kokusai Electric Inc. (Hitachi Kokusai Electric), an equity method affiliate, through a tender offer to make Hitachi Kokusai Electric its subsidiary for the purpose of establishing a stable equity-based relationship and strengthening the cooperative relationship in the fields of communications and video, and broadcasting systems businesses. Hitachi Kokusai Electric’s Board of Directors resolved to approve the tender offer at the meeting held on the same day. The price of the tender offer was ¥780 per share, which was determined by comprehensively taking into consideration the market price of Hitachi Kokusai Electric’s common stock, Hitachi Kokusai Electric’s financial condition, future earnings prospects and a valuation of Hitachi Kokusai Electric stock conducted by a third party appraiser. The price included a premium of approximately 77% over the average share price of Hitachi Kokusai Electric’s common stock traded on the First Section of the Tokyo Stock Exchange for the three month period ended January 13, 2009. As a result, the Company purchased 13,406,000 shares, the upper limit for the number of shares in the tender offer, for ¥10,456 million in the period from January 26, 2009 through March 11, 2009, resulting in the Company’s ownership increasing from 38.8% to 51.6%. Accordingly, the Company obtained control over Hitachi Kokusai Electric and it became a consolidated subsidiary of the Company. Therefore, the Company has consolidated Hitachi Kokusai Electric as of March 31, 2009 in the consolidated balance sheet. The results of operations of Hitachi Kokusai Electric for the period from the acquisition date to March 31, 2009 were not material. Accordingly, the results of operations of Hitachi Kokusai Electric have been consolidated since the year beginning April 1, 2009.
As a result of the purchase price allocation, the Company did not recognize any goodwill.
On a pro forma basis, revenue, net loss and the per share information of the Company with assumed acquisition dates for Hitachi Kokusai Electric of April 1, 2008 and 2007 would not differ materially from the amounts reported in the accompanying consolidated financial statements as of and for the years ended March 31, 2009 and 2008.
On January 14, 2009, the Company also announced its decision to purchase additional shares of Hitachi Koki Co., Ltd. (Hitachi Koki), an equity method affiliate, through a tender offer to make Hitachi Koki its subsidiary for the purpose of establishing a stable equity-based relationship and strengthening the cooperative relationship in business expansion on a global scale and research and development into lithium-ion battery-operated products. Hitachi Koki’s Board of Directors resolved to approve the tender offer at the meeting held on the same day. The price of the tender offer was ¥1,300 per share, which was determined by comprehensively taking into consideration the market price of Hitachi Koki’s common stock, Hitachi Koki’s financial condition, future earnings prospects and a valuation of Hitachi Koki stock conducted by a third party appraiser. The price included a premium of approximately 77% over the average share price of Hitachi Koki’s common stock traded on the First Section of the Tokyo Stock Exchange for the three month period ended January 13, 2009. As a result, the Company purchased 12,473,000 shares, the upper limit for the number of shares in the tender offer, for ¥16,214 million in the period from January 26, 2009 through March 9, 2009, resulting in the Company’s ownership increasing from 38.9% to 51.2%. Accordingly, the Company obtained control over Hitachi Koki and it became a consolidated subsidiary of the Company. Therefore, the Company has consolidated Hitachi Koki as of March 31, 2009 in the consolidated balance sheet. The results of operations of Hitachi Koki for the period from the acquisition date to March 31, 2009 were not material. Accordingly, the results of operations of Hitachi Koki have been consolidated since the year beginning April 1, 2009.
As a result of the purchase price allocation, the Company did not recognize any goodwill.
On a pro forma basis, revenue, net loss and the per share information of the Company with assumed acquisition dates for Hitachi Koki of April 1, 2008 and 2007 would not differ materially from the amounts reported in the accompanying consolidated financial statements as of and for the years ended March 31, 2009 and 2008.

114 Hitachi, Ltd. Annual Report 2010
31. SEgmENt iNFOrmAtiON
Business SegmentsThe operating segments of the Company are the components for which separate financial information is available and for which segment profit or loss amounts are evaluated regularly by the chief operating decision maker in deciding how to allocate resources and in assessing performance. The Company has aggregated certain operating segments into reportable segments for reporting purpose, since such aggregation helps financial statement users better understand the Company’s performance.
The reportable segments correspond to categories of activities classified primarily by markets, products and services.
The Company discloses its business in eleven reportable segments: Information & Telecommunication Systems, Power Systems, Social Infrastructure & Industrial Systems, Electronic Systems & Equipment, Construction Machinery, High Functional Materials & Components, Automotive Systems, Components & Devices, Digital Media & Consumer Products, Financial Services, and Others.
The primary products and services included in each segment are as follows:
Information & telecommunication Systems:
Systems integration, Outsourcing services, Software, Disk array subsystems, Servers, Mainframes, Telecommunication equipment and ATMs
Power Systems:
Thermal power generation systems, Nuclear power generation systems, Hydroelectric power generation systems and Wind power generation systems
Social Infrastructure & Industrial Systems:
Industrial machinery and plants, Elevators, Escalators and Railway vehicles and systems
Electronic Systems & Equipment:
Semiconductor and LCDs manufacturing equipment, Test and measurement equipment, Medical electronics equipment, Power tools and Electronic parts manufacturing system
Construction Machinery:
Hydraulic excavators, Wheel loaders and Mining dump trucks
High Functional Materials & Components:
Wires and cables, Copper products, Semiconductor and display related materials, Circuit boards and materials, Specialty steels, Magnetic materials and components and High grade casting components and materials
Automotive Systems:
Engine management systems, Electric powertrain systems, Drive control systems and Car information systems
Components & Devices:
Hard disk drives, LCDs, Information storage media and Batteries
Digital Media & Consumer Products:
Optical disk drives, Flat-panel TVs, LCD projectors, Mobile phones, Room air conditioners, Refrigerators, Washing machines and Air-conditioning equipment
Financial Services:
Leasing and Loan guarantees
Others:
Logistics, Property management, Insurance agent and others

115Hitachi, Ltd. Annual Report 2010
The following tables show business segment information for the years ended March 31, 2010 and 2009, and as of March 31, 2010 and 2009.
Revenues from Outside Customers
Millions of yenThousands of
U.S. dollars
2010 2009 2010
Information & Telecommunication Systems . . . . . . . . . . . . . . . . . . . . . . ¥1,522,457 ¥ 1,730,818 $16,370,505
Power Systems . . . . . . . . . . . . . . . . . . . . . . . . . . . . . . . . . . . . . . . . . . . 805,007 777,833 8,655,989
Social Infrastructure & Industrial Systems . . . . . . . . . . . . . . . . . . . . . . . . 1,044,208 1,077,548 11,228,043
Electronic Systems & Equipment . . . . . . . . . . . . . . . . . . . . . . . . . . . . . . 868,449 830,080 9,338,161
Construction Machinery . . . . . . . . . . . . . . . . . . . . . . . . . . . . . . . . . . . . . 578,129 717,251 6,216,441
High Functional Materials & Components . . . . . . . . . . . . . . . . . . . . . . . 1,176,292 1,467,934 12,648,301
Automotive Systems . . . . . . . . . . . . . . . . . . . . . . . . . . . . . . . . . . . . . . . 633,399 667,094 6,810,742
Components & Devices . . . . . . . . . . . . . . . . . . . . . . . . . . . . . . . . . . . . . 690,062 904,944 7,420,022
Digital Media & Consumer Products . . . . . . . . . . . . . . . . . . . . . . . . . . . 863,091 1,006,017 9,280,548
Financial Services . . . . . . . . . . . . . . . . . . . . . . . . . . . . . . . . . . . . . . . . . 327,072 324,540 3,516,903
Others . . . . . . . . . . . . . . . . . . . . . . . . . . . . . . . . . . . . . . . . . . . . . . . . . . 457,315 491,642 4,917,366
Subtotal . . . . . . . . . . . . . . . . . . . . . . . . . . . . . . . . . . . . . . . . . . . . . . . 8,965,481 9,995,701 96,403,021
Corporate items . . . . . . . . . . . . . . . . . . . . . . . . . . . . . . . . . . . . . . . . . . . 3,065 4,668 32,957
Total . . . . . . . . . . . . . . . . . . . . . . . . . . . . . . . . . . . . . . . . . . . . . . . . . . ¥8,968,546 ¥10,000,369 $96,435,978
Revenues from Intersegment transactions
Millions of yenThousands of
U.S. dollars
2010 2009 2010
Information & Telecommunication Systems . . . . . . . . . . . . . . . . . . . . . . ¥ 183,130 ¥ 214,533 $ 1,969,140
Power Systems . . . . . . . . . . . . . . . . . . . . . . . . . . . . . . . . . . . . . . . . . . . 77,128 84,556 829,334
Social Infrastructure & Industrial Systems . . . . . . . . . . . . . . . . . . . . . . . . 206,017 256,698 2,215,236
Electronic Systems & Equipment . . . . . . . . . . . . . . . . . . . . . . . . . . . . . . 130,183 153,741 1,399,817
Construction Machinery . . . . . . . . . . . . . . . . . . . . . . . . . . . . . . . . . . . . . 5,507 7,438 59,215
High Functional Materials & Components . . . . . . . . . . . . . . . . . . . . . . . 73,035 93,111 785,323
Automotive Systems . . . . . . . . . . . . . . . . . . . . . . . . . . . . . . . . . . . . . . . 5,429 14,656 58,376
Components & Devices . . . . . . . . . . . . . . . . . . . . . . . . . . . . . . . . . . . . . 64,827 73,353 697,064
Digital Media & Consumer Products . . . . . . . . . . . . . . . . . . . . . . . . . . . 66,167 97,843 711,473
Financial Services . . . . . . . . . . . . . . . . . . . . . . . . . . . . . . . . . . . . . . . . . 92,578 76,777 995,463
Others . . . . . . . . . . . . . . . . . . . . . . . . . . . . . . . . . . . . . . . . . . . . . . . . . . 306,350 339,192 3,294,086
Subtotal . . . . . . . . . . . . . . . . . . . . . . . . . . . . . . . . . . . . . . . . . . . . . . . 1,210,351 1,411,898 13,014,527
Eliminations and Corporate items . . . . . . . . . . . . . . . . . . . . . . . . . . . . . (1,210,351) (1,411,898) (13,014,527)
Total . . . . . . . . . . . . . . . . . . . . . . . . . . . . . . . . . . . . . . . . . . . . . . . . . . ¥ – ¥ – $ –
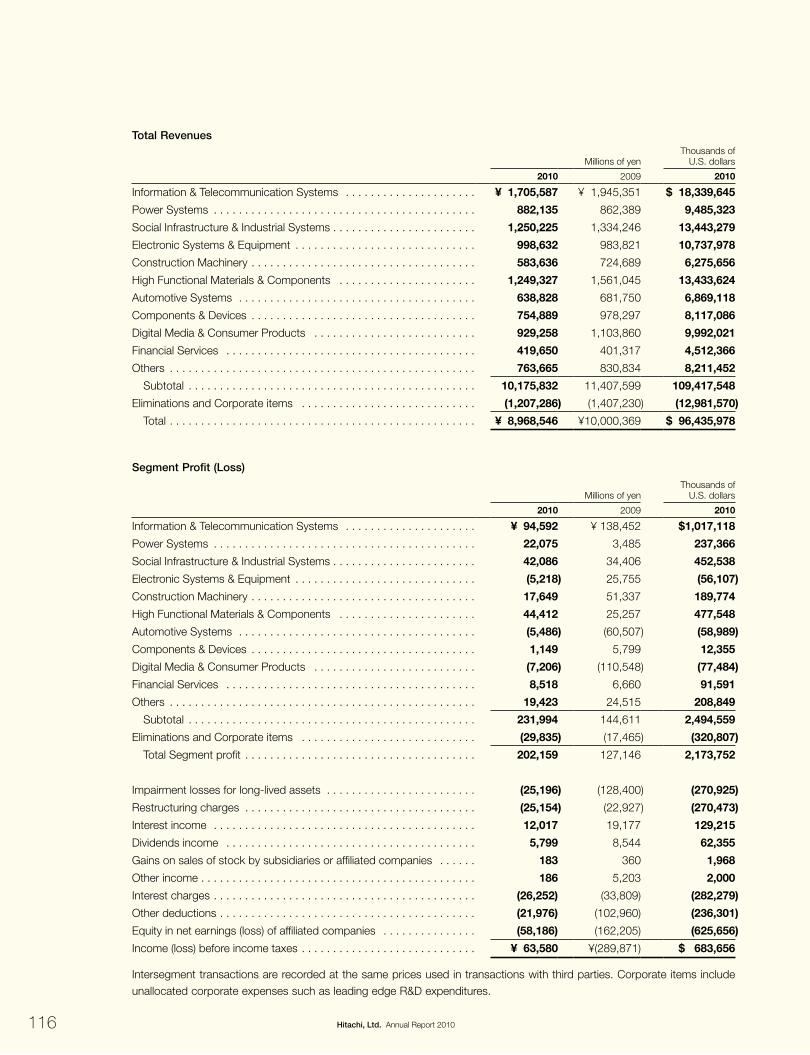
116 Hitachi, Ltd. Annual Report 2010
total Revenues
Millions of yenThousands of
U.S. dollars
2010 2009 2010
Information & Telecommunication Systems . . . . . . . . . . . . . . . . . . . . . ¥ 1,705,587 ¥ 1,945,351 $ 18,339,645
Power Systems . . . . . . . . . . . . . . . . . . . . . . . . . . . . . . . . . . . . . . . . . . 882,135 862,389 9,485,323
Social Infrastructure & Industrial Systems . . . . . . . . . . . . . . . . . . . . . . . 1,250,225 1,334,246 13,443,279
Electronic Systems & Equipment . . . . . . . . . . . . . . . . . . . . . . . . . . . . . 998,632 983,821 10,737,978
Construction Machinery . . . . . . . . . . . . . . . . . . . . . . . . . . . . . . . . . . . . 583,636 724,689 6,275,656
High Functional Materials & Components . . . . . . . . . . . . . . . . . . . . . . 1,249,327 1,561,045 13,433,624
Automotive Systems . . . . . . . . . . . . . . . . . . . . . . . . . . . . . . . . . . . . . . 638,828 681,750 6,869,118
Components & Devices . . . . . . . . . . . . . . . . . . . . . . . . . . . . . . . . . . . . 754,889 978,297 8,117,086
Digital Media & Consumer Products . . . . . . . . . . . . . . . . . . . . . . . . . . 929,258 1,103,860 9,992,021
Financial Services . . . . . . . . . . . . . . . . . . . . . . . . . . . . . . . . . . . . . . . . 419,650 401,317 4,512,366
Others . . . . . . . . . . . . . . . . . . . . . . . . . . . . . . . . . . . . . . . . . . . . . . . . . 763,665 830,834 8,211,452
Subtotal . . . . . . . . . . . . . . . . . . . . . . . . . . . . . . . . . . . . . . . . . . . . . . 10,175,832 11,407,599 109,417,548
Eliminations and Corporate items . . . . . . . . . . . . . . . . . . . . . . . . . . . . (1,207,286) (1,407,230) (12,981,570)
Total . . . . . . . . . . . . . . . . . . . . . . . . . . . . . . . . . . . . . . . . . . . . . . . . . ¥ 8,968,546 ¥10,000,369 $ 96,435,978
Segment Profit (Loss)
Millions of yenThousands of
U.S. dollars
2010 2009 2010
Information & Telecommunication Systems . . . . . . . . . . . . . . . . . . . . . ¥ 94,592 ¥ 138,452 $1,017,118
Power Systems . . . . . . . . . . . . . . . . . . . . . . . . . . . . . . . . . . . . . . . . . . 22,075 3,485 237,366
Social Infrastructure & Industrial Systems . . . . . . . . . . . . . . . . . . . . . . . 42,086 34,406 452,538
Electronic Systems & Equipment . . . . . . . . . . . . . . . . . . . . . . . . . . . . . (5,218) 25,755 (56,107)
Construction Machinery . . . . . . . . . . . . . . . . . . . . . . . . . . . . . . . . . . . . 17,649 51,337 189,774
High Functional Materials & Components . . . . . . . . . . . . . . . . . . . . . . 44,412 25,257 477,548
Automotive Systems . . . . . . . . . . . . . . . . . . . . . . . . . . . . . . . . . . . . . . (5,486) (60,507) (58,989)
Components & Devices . . . . . . . . . . . . . . . . . . . . . . . . . . . . . . . . . . . . 1,149 5,799 12,355
Digital Media & Consumer Products . . . . . . . . . . . . . . . . . . . . . . . . . . (7,206) (110,548) (77,484)
Financial Services . . . . . . . . . . . . . . . . . . . . . . . . . . . . . . . . . . . . . . . . 8,518 6,660 91,591
Others . . . . . . . . . . . . . . . . . . . . . . . . . . . . . . . . . . . . . . . . . . . . . . . . . 19,423 24,515 208,849
Subtotal . . . . . . . . . . . . . . . . . . . . . . . . . . . . . . . . . . . . . . . . . . . . . . 231,994 144,611 2,494,559
Eliminations and Corporate items . . . . . . . . . . . . . . . . . . . . . . . . . . . . (29,835) (17,465) (320,807)
Total Segment profit . . . . . . . . . . . . . . . . . . . . . . . . . . . . . . . . . . . . . 202,159 127,146 2,173,752
Impairment losses for long-lived assets . . . . . . . . . . . . . . . . . . . . . . . . (25,196) (128,400) (270,925)
Restructuring charges . . . . . . . . . . . . . . . . . . . . . . . . . . . . . . . . . . . . . (25,154) (22,927) (270,473)
Interest income . . . . . . . . . . . . . . . . . . . . . . . . . . . . . . . . . . . . . . . . . . 12,017 19,177 129,215
Dividends income . . . . . . . . . . . . . . . . . . . . . . . . . . . . . . . . . . . . . . . . 5,799 8,544 62,355
Gains on sales of stock by subsidiaries or affiliated companies . . . . . . 183 360 1,968
Other income . . . . . . . . . . . . . . . . . . . . . . . . . . . . . . . . . . . . . . . . . . . . 186 5,203 2,000
Interest charges . . . . . . . . . . . . . . . . . . . . . . . . . . . . . . . . . . . . . . . . . . (26,252) (33,809) (282,279)
Other deductions . . . . . . . . . . . . . . . . . . . . . . . . . . . . . . . . . . . . . . . . . (21,976) (102,960) (236,301)
Equity in net earnings (loss) of affiliated companies . . . . . . . . . . . . . . . (58,186) (162,205) (625,656)
Income (loss) before income taxes . . . . . . . . . . . . . . . . . . . . . . . . . . . . ¥ 63,580 ¥(289,871) $ 683,656
Intersegment transactions are recorded at the same prices used in transactions with third parties. Corporate items include unallocated corporate expenses such as leading edge R&D expenditures.
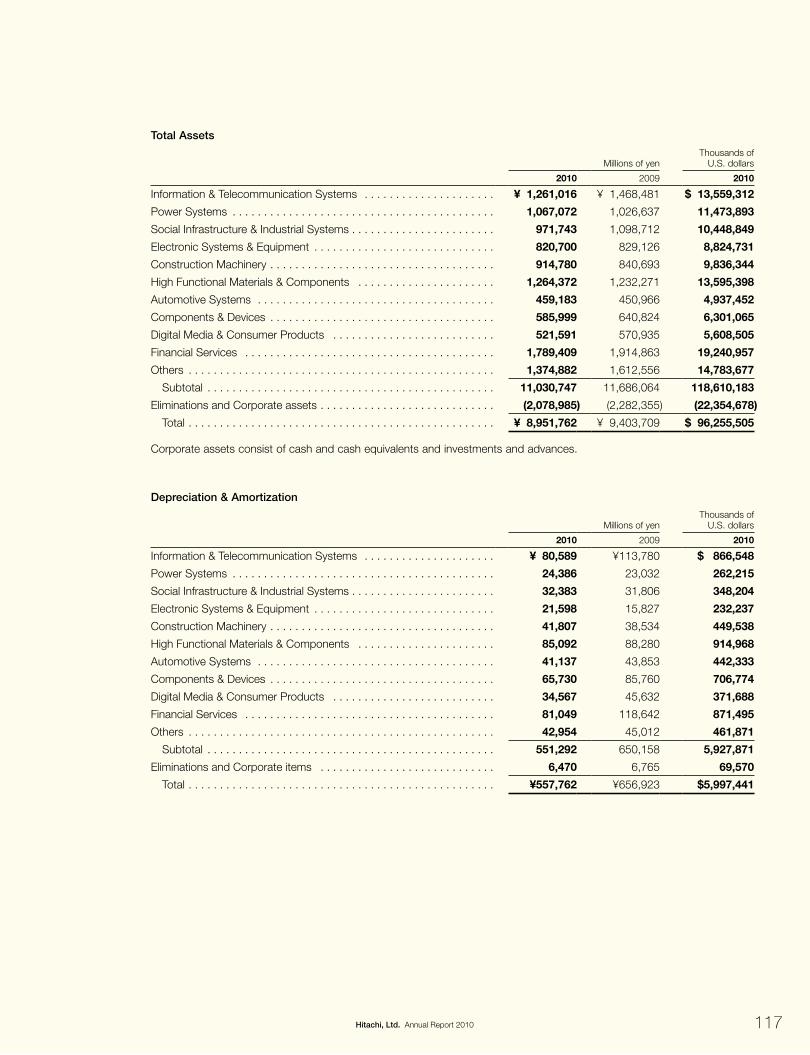
117Hitachi, Ltd. Annual Report 2010
total Assets
Millions of yenThousands of
U.S. dollars
2010 2009 2010
Information & Telecommunication Systems . . . . . . . . . . . . . . . . . . . . . ¥ 1,261,016 ¥ 1,468,481 $ 13,559,312
Power Systems . . . . . . . . . . . . . . . . . . . . . . . . . . . . . . . . . . . . . . . . . . 1,067,072 1,026,637 11,473,893
Social Infrastructure & Industrial Systems . . . . . . . . . . . . . . . . . . . . . . . 971,743 1,098,712 10,448,849
Electronic Systems & Equipment . . . . . . . . . . . . . . . . . . . . . . . . . . . . . 820,700 829,126 8,824,731
Construction Machinery . . . . . . . . . . . . . . . . . . . . . . . . . . . . . . . . . . . . 914,780 840,693 9,836,344
High Functional Materials & Components . . . . . . . . . . . . . . . . . . . . . . 1,264,372 1,232,271 13,595,398
Automotive Systems . . . . . . . . . . . . . . . . . . . . . . . . . . . . . . . . . . . . . . 459,183 450,966 4,937,452
Components & Devices . . . . . . . . . . . . . . . . . . . . . . . . . . . . . . . . . . . . 585,999 640,824 6,301,065
Digital Media & Consumer Products . . . . . . . . . . . . . . . . . . . . . . . . . . 521,591 570,935 5,608,505
Financial Services . . . . . . . . . . . . . . . . . . . . . . . . . . . . . . . . . . . . . . . . 1,789,409 1,914,863 19,240,957
Others . . . . . . . . . . . . . . . . . . . . . . . . . . . . . . . . . . . . . . . . . . . . . . . . . 1,374,882 1,612,556 14,783,677
Subtotal . . . . . . . . . . . . . . . . . . . . . . . . . . . . . . . . . . . . . . . . . . . . . . 11,030,747 11,686,064 118,610,183
Eliminations and Corporate assets . . . . . . . . . . . . . . . . . . . . . . . . . . . . (2,078,985) (2,282,355) (22,354,678)
Total . . . . . . . . . . . . . . . . . . . . . . . . . . . . . . . . . . . . . . . . . . . . . . . . . ¥ 8,951,762 ¥ 9,403,709 $ 96,255,505
Corporate assets consist of cash and cash equivalents and investments and advances.
Depreciation & Amortization
Millions of yenThousands of
U.S. dollars
2010 2009 2010
Information & Telecommunication Systems . . . . . . . . . . . . . . . . . . . . . ¥ 80,589 ¥113,780 $ 866,548
Power Systems . . . . . . . . . . . . . . . . . . . . . . . . . . . . . . . . . . . . . . . . . . 24,386 23,032 262,215
Social Infrastructure & Industrial Systems . . . . . . . . . . . . . . . . . . . . . . . 32,383 31,806 348,204
Electronic Systems & Equipment . . . . . . . . . . . . . . . . . . . . . . . . . . . . . 21,598 15,827 232,237
Construction Machinery . . . . . . . . . . . . . . . . . . . . . . . . . . . . . . . . . . . . 41,807 38,534 449,538
High Functional Materials & Components . . . . . . . . . . . . . . . . . . . . . . 85,092 88,280 914,968
Automotive Systems . . . . . . . . . . . . . . . . . . . . . . . . . . . . . . . . . . . . . . 41,137 43,853 442,333
Components & Devices . . . . . . . . . . . . . . . . . . . . . . . . . . . . . . . . . . . . 65,730 85,760 706,774
Digital Media & Consumer Products . . . . . . . . . . . . . . . . . . . . . . . . . . 34,567 45,632 371,688
Financial Services . . . . . . . . . . . . . . . . . . . . . . . . . . . . . . . . . . . . . . . . 81,049 118,642 871,495
Others . . . . . . . . . . . . . . . . . . . . . . . . . . . . . . . . . . . . . . . . . . . . . . . . . 42,954 45,012 461,871
Subtotal . . . . . . . . . . . . . . . . . . . . . . . . . . . . . . . . . . . . . . . . . . . . . . 551,292 650,158 5,927,871
Eliminations and Corporate items . . . . . . . . . . . . . . . . . . . . . . . . . . . . 6,470 6,765 69,570
Total . . . . . . . . . . . . . . . . . . . . . . . . . . . . . . . . . . . . . . . . . . . . . . . . . ¥557,762 ¥656,923 $5,997,441

118 Hitachi, Ltd. Annual Report 2010
Impairment Losses for Long-Lived Assets
Millions of yenThousands of
U.S. dollars
2010 2009 2010
Information & Telecommunication Systems . . . . . . . . . . . . . . . . . . . . . ¥ 353 ¥ 15,752 $ 3,796
Power Systems . . . . . . . . . . . . . . . . . . . . . . . . . . . . . . . . . . . . . . . . . . 136 82 1,462
Social Infrastructure & Industrial Systems . . . . . . . . . . . . . . . . . . . . . . . 715 3,609 7,688
Electronic Systems & Equipment . . . . . . . . . . . . . . . . . . . . . . . . . . . . . 624 961 6,710
Construction Machinery . . . . . . . . . . . . . . . . . . . . . . . . . . . . . . . . . . . . 119 – 1,280
High Functional Materials & Components . . . . . . . . . . . . . . . . . . . . . . 2,117 12,888 22,763
Automotive Systems . . . . . . . . . . . . . . . . . . . . . . . . . . . . . . . . . . . . . . 175 29,240 1,882
Components & Devices . . . . . . . . . . . . . . . . . . . . . . . . . . . . . . . . . . . . 18,611 12,022 200,118
Digital Media & Consumer Products . . . . . . . . . . . . . . . . . . . . . . . . . . 845 51,695 9,086
Financial Services . . . . . . . . . . . . . . . . . . . . . . . . . . . . . . . . . . . . . . . . – 1,499 –
Others . . . . . . . . . . . . . . . . . . . . . . . . . . . . . . . . . . . . . . . . . . . . . . . . . 1,501 652 16,140
Subtotal . . . . . . . . . . . . . . . . . . . . . . . . . . . . . . . . . . . . . . . . . . . . . . 25,196 128,400 270,925
Eliminations and Corporate items . . . . . . . . . . . . . . . . . . . . . . . . . . . . – – –
Total . . . . . . . . . . . . . . . . . . . . . . . . . . . . . . . . . . . . . . . . . . . . . . . . . ¥25,196 ¥128,400 $270,925
Capital Investment for Long-Lived Assets
Millions of yenThousands of
U.S. dollars
2010 2009 2010
Information & Telecommunication Systems . . . . . . . . . . . . . . . . . . . . . ¥ 65,976 ¥ 91,665 $ 709,419
Power Systems . . . . . . . . . . . . . . . . . . . . . . . . . . . . . . . . . . . . . . . . . . 34,704 31,155 373,161
Social Infrastructure & Industrial Systems . . . . . . . . . . . . . . . . . . . . . . . 32,005 46,716 344,140
Electronic Systems & Equipment . . . . . . . . . . . . . . . . . . . . . . . . . . . . . 15,728 17,894 169,118
Construction Machinery . . . . . . . . . . . . . . . . . . . . . . . . . . . . . . . . . . . . 36,504 76,651 392,516
High Functional Materials & Components . . . . . . . . . . . . . . . . . . . . . . 55,038 112,595 591,807
Automotive Systems . . . . . . . . . . . . . . . . . . . . . . . . . . . . . . . . . . . . . . 19,261 47,442 207,108
Components & Devices . . . . . . . . . . . . . . . . . . . . . . . . . . . . . . . . . . . . 41,240 63,582 443,441
Digital Media & Consumer Products . . . . . . . . . . . . . . . . . . . . . . . . . . 20,399 31,446 219,344
Financial Services . . . . . . . . . . . . . . . . . . . . . . . . . . . . . . . . . . . . . . . . 351,298 422,805 3,777,398
Others . . . . . . . . . . . . . . . . . . . . . . . . . . . . . . . . . . . . . . . . . . . . . . . . . 34,768 46,027 373,849
Subtotal . . . . . . . . . . . . . . . . . . . . . . . . . . . . . . . . . . . . . . . . . . . . . . 706,921 987,978 7,601,301
Eliminations and Corporate items . . . . . . . . . . . . . . . . . . . . . . . . . . . . (20,380) (23,557) (219,140)
Total . . . . . . . . . . . . . . . . . . . . . . . . . . . . . . . . . . . . . . . . . . . . . . . . . ¥686,541 ¥964,421 $7,382,161
Capital investment represents the additions to property, plant and equipment and other intangible assets on an accrual basis.

119Hitachi, Ltd. Annual Report 2010
Geographic InformationRevenues
The following table shows revenues which are attributed to geographic areas based on the location of the customers for the years ended March 31, 2010 and 2009.
Millions of yenThousands of
U.S. dollars
2010 2009 2010
Japan . . . . . . . . . . . . . . . . . . . . . . . . . . . . . . . . . . . . . . . . . . . . . . . . . . ¥5,313,790 ¥ 5,861,448 $57,137,527
Outside Japan
Asia . . . . . . . . . . . . . . . . . . . . . . . . . . . . . . . . . . . . . . . . . . . . . . . . . . 1,699,071 1,911,290 18,269,580
North America . . . . . . . . . . . . . . . . . . . . . . . . . . . . . . . . . . . . . . . . . . 729,698 899,550 7,846,215
Europe . . . . . . . . . . . . . . . . . . . . . . . . . . . . . . . . . . . . . . . . . . . . . . . . 824,697 904,425 8,867,710
Other Areas . . . . . . . . . . . . . . . . . . . . . . . . . . . . . . . . . . . . . . . . . . . . 401,290 423,656 4,314,946
Subtotal . . . . . . . . . . . . . . . . . . . . . . . . . . . . . . . . . . . . . . . . . . . . . 3,654,756 4,138,921 39,298,451
Total . . . . . . . . . . . . . . . . . . . . . . . . . . . . . . . . . . . . . . . . . . . . . . . . ¥8,968,546 ¥10,000,369 $96,435,978
Other than in Japan and China mainland, the Company does not conduct business in any individual country and region in which its revenues in that country exceed 10% of the consolidated total revenues. Revenues in China mainland for the years ended March 31, 2010 and 2009 were ¥991,653 million ($10,662,935 thousand) and ¥1,078,582 million, respectively.
Long-lived Assets including Goodwill
The following table shows long-lived assets such as property, plant and equipment and intangible assets including goodwill for each geographic area as of March 31, 2010 and 2009.
Millions of yenThousands of
U.S. dollars
2010 2009 2010
Japan . . . . . . . . . . . . . . . . . . . . . . . . . . . . . . . . . . . . . . . . . . . . . . . . . . ¥2,088,846 ¥2,271,389 $22,460,710
Asia . . . . . . . . . . . . . . . . . . . . . . . . . . . . . . . . . . . . . . . . . . . . . . . . . . . . 330,791 267,628 3,556,893
North America . . . . . . . . . . . . . . . . . . . . . . . . . . . . . . . . . . . . . . . . . . . . 157,113 163,630 1,689,387
Europe . . . . . . . . . . . . . . . . . . . . . . . . . . . . . . . . . . . . . . . . . . . . . . . . . 111,105 107,478 1,194,677
Other Areas . . . . . . . . . . . . . . . . . . . . . . . . . . . . . . . . . . . . . . . . . . . . . . 15,717 12,280 169,000
Subtotal . . . . . . . . . . . . . . . . . . . . . . . . . . . . . . . . . . . . . . . . . . . . . . . 2,703,572 2,822,405 29,070,667
Eliminations and Corporate items . . . . . . . . . . . . . . . . . . . . . . . . . . . . . 21,580 26,636 232,043
Total . . . . . . . . . . . . . . . . . . . . . . . . . . . . . . . . . . . . . . . . . . . . . . . . . . ¥2,725,152 ¥2,849,041 $29,302,710
Other than in Japan, the Company does not conduct business in any individual country and region in which its long-lived assets in that country exceed 10% of the consolidated balance of long-lived assets.
There are no revenues to a single major outside customer for the years ended March 31, 2010 and 2009.
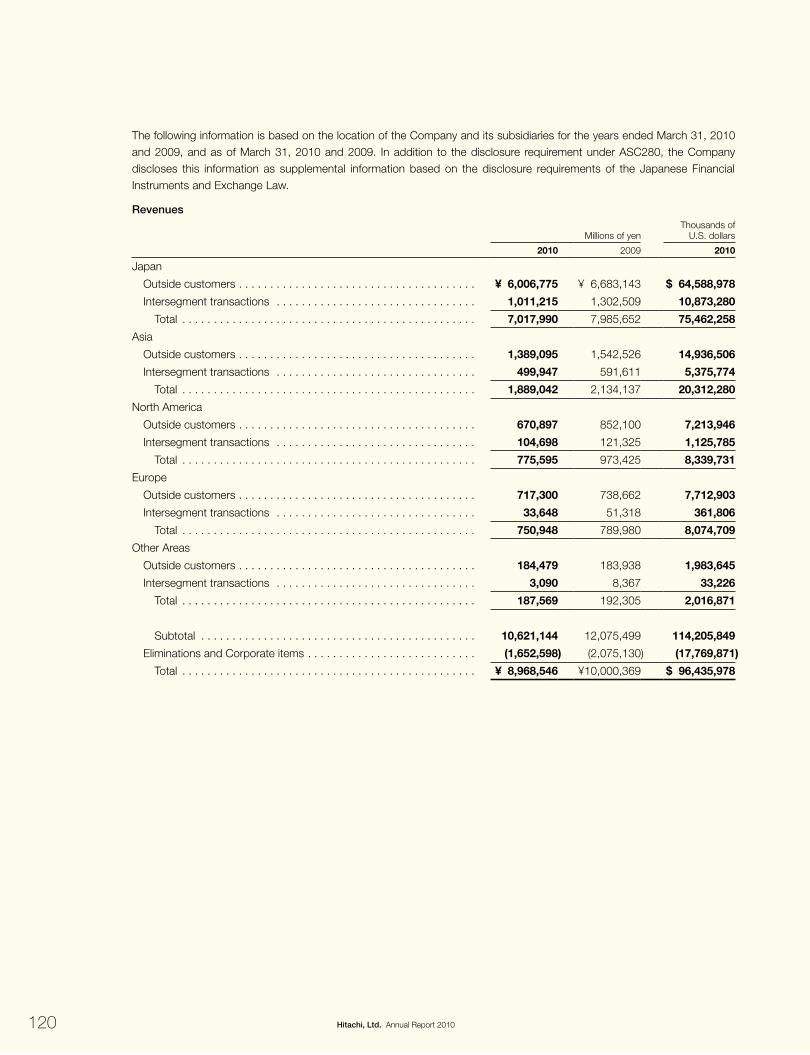
120 Hitachi, Ltd. Annual Report 2010
The following information is based on the location of the Company and its subsidiaries for the years ended March 31, 2010 and 2009, and as of March 31, 2010 and 2009. In addition to the disclosure requirement under ASC280, the Company discloses this information as supplemental information based on the disclosure requirements of the Japanese Financial Instruments and Exchange Law.
Revenues
Millions of yenThousands of
U.S. dollars
2010 2009 2010
Japan
Outside customers . . . . . . . . . . . . . . . . . . . . . . . . . . . . . . . . . . . . . . ¥ 6,006,775 ¥ 6,683,143 $ 64,588,978
Intersegment transactions . . . . . . . . . . . . . . . . . . . . . . . . . . . . . . . . 1,011,215 1,302,509 10,873,280
Total . . . . . . . . . . . . . . . . . . . . . . . . . . . . . . . . . . . . . . . . . . . . . . . 7,017,990 7,985,652 75,462,258
Asia
Outside customers . . . . . . . . . . . . . . . . . . . . . . . . . . . . . . . . . . . . . . 1,389,095 1,542,526 14,936,506
Intersegment transactions . . . . . . . . . . . . . . . . . . . . . . . . . . . . . . . . 499,947 591,611 5,375,774
Total . . . . . . . . . . . . . . . . . . . . . . . . . . . . . . . . . . . . . . . . . . . . . . . 1,889,042 2,134,137 20,312,280
North America
Outside customers . . . . . . . . . . . . . . . . . . . . . . . . . . . . . . . . . . . . . . 670,897 852,100 7,213,946
Intersegment transactions . . . . . . . . . . . . . . . . . . . . . . . . . . . . . . . . 104,698 121,325 1,125,785
Total . . . . . . . . . . . . . . . . . . . . . . . . . . . . . . . . . . . . . . . . . . . . . . . 775,595 973,425 8,339,731
Europe
Outside customers . . . . . . . . . . . . . . . . . . . . . . . . . . . . . . . . . . . . . . 717,300 738,662 7,712,903
Intersegment transactions . . . . . . . . . . . . . . . . . . . . . . . . . . . . . . . . 33,648 51,318 361,806
Total . . . . . . . . . . . . . . . . . . . . . . . . . . . . . . . . . . . . . . . . . . . . . . . 750,948 789,980 8,074,709
Other Areas
Outside customers . . . . . . . . . . . . . . . . . . . . . . . . . . . . . . . . . . . . . . 184,479 183,938 1,983,645
Intersegment transactions . . . . . . . . . . . . . . . . . . . . . . . . . . . . . . . . 3,090 8,367 33,226
Total . . . . . . . . . . . . . . . . . . . . . . . . . . . . . . . . . . . . . . . . . . . . . . . 187,569 192,305 2,016,871
Subtotal . . . . . . . . . . . . . . . . . . . . . . . . . . . . . . . . . . . . . . . . . . . . 10,621,144 12,075,499 114,205,849
Eliminations and Corporate items . . . . . . . . . . . . . . . . . . . . . . . . . . . (1,652,598) (2,075,130) (17,769,871)
Total . . . . . . . . . . . . . . . . . . . . . . . . . . . . . . . . . . . . . . . . . . . . . . . ¥ 8,968,546 ¥10,000,369 $ 96,435,978

121Hitachi, Ltd. Annual Report 2010
Geographical Profit (Loss)
Millions of yenThousands of
U.S. dollars
2010 2009 2010
Japan . . . . . . . . . . . . . . . . . . . . . . . . . . . . . . . . . . . . . . . . . . . . . . . . . ¥149,429 ¥ 74,370 $1,606,763
Asia . . . . . . . . . . . . . . . . . . . . . . . . . . . . . . . . . . . . . . . . . . . . . . . . . . . 89,399 76,742 961,279
North America . . . . . . . . . . . . . . . . . . . . . . . . . . . . . . . . . . . . . . . . . . . 4,835 7,182 51,989
Europe . . . . . . . . . . . . . . . . . . . . . . . . . . . . . . . . . . . . . . . . . . . . . . . . 11,784 (17,129) 126,710
Other Areas . . . . . . . . . . . . . . . . . . . . . . . . . . . . . . . . . . . . . . . . . . . . . 6,273 9,434 67,452
Subtotal . . . . . . . . . . . . . . . . . . . . . . . . . . . . . . . . . . . . . . . . . . . . . . 261,720 150,599 2,814,193
Eliminations and Corporate items . . . . . . . . . . . . . . . . . . . . . . . . . . . . (59,561) (23,453) (640,441)
Total Geographical profit . . . . . . . . . . . . . . . . . . . . . . . . . . . . . . . . . ¥202,159 ¥127,146 $2,173,752
total Assets
Millions of yenThousands of
U.S. dollars
2010 2009 2010
Japan . . . . . . . . . . . . . . . . . . . . . . . . . . . . . . . . . . . . . . . . . . . . . . . . . ¥ 7,297,719 ¥ 8,011,421 $ 78,470,097
Asia . . . . . . . . . . . . . . . . . . . . . . . . . . . . . . . . . . . . . . . . . . . . . . . . . . . 1,318,735 1,158,234 14,179,946
North America . . . . . . . . . . . . . . . . . . . . . . . . . . . . . . . . . . . . . . . . . . . 669,423 555,602 7,198,097
Europe . . . . . . . . . . . . . . . . . . . . . . . . . . . . . . . . . . . . . . . . . . . . . . . . 847,584 861,242 9,113,806
Other Areas . . . . . . . . . . . . . . . . . . . . . . . . . . . . . . . . . . . . . . . . . . . . . 214,927 142,738 2,311,043
Subtotal . . . . . . . . . . . . . . . . . . . . . . . . . . . . . . . . . . . . . . . . . . . . . . 10,348,388 10,729,237 111,272,989
Eliminations and Corporate assets . . . . . . . . . . . . . . . . . . . . . . . . . . . . (1,396,626) (1,325,528) (15,017,484)
Total . . . . . . . . . . . . . . . . . . . . . . . . . . . . . . . . . . . . . . . . . . . . . . . . . ¥ 8,951,762 ¥ 9,403,709 $ 96,255,505
122 Hitachi, Ltd. Annual Report 2010
management’s report on internal Control Over Financial reporting
Our management is responsible for establishing and maintaining adequate internal control over financial reporting. Internal control over financial reporting is defined in Rule 13a-15(f) or 15d-15(f) promulgated under the Securities Exchange Act of 1934 as a process designed by, or under the supervision of, our principal executive and principal financial officers and effected by our Board of Directors, management and other personnel, to provide reasonable assurance regarding the reliability of financial reporting and the preparation of financial statements for external purposes in accordance with generally accepted accounting principles and includes those policies and procedures that:
•pertain to the maintenance of records that, in reasonable detail, accurately and fairly reflect the transaction anddispositions of our assets;
•providereasonableassurancethattransactionsarerecordedasnecessarytopermitpreparationoffinancialstatementsin accordance with generally accepted accounting principles, and that our receipts and expenditures are being made only in accordance with authorizations of our management and directors; and
•providereasonableassuranceregardingpreventionortimelydetectionofunauthorizedacquisition,useordispositionof our assets that could have a material effect on the financial statements.
Because of its inherent limitations, internal control over financial reporting may not prevent or detect misstatements. Projections of any evaluation of effectiveness to future periods are subject to the risk that controls may become inadequate because of changes in conditions, or that the degree of compliance with the policies or procedures may deteriorate.
Our management assessed the effectiveness of our internal control over financial reporting as of March 31, 2010. In making this assessment, our management used the criteria set forth by the Committee of Sponsoring Organizations of the Treadway Commission (COSO) in Internal Control-Integrated Framework.
Based on its assessment, our management concluded that, as of March 31, 2010, our internal control over financial reporting was effective based on those criteria.
Our independent registered public accounting firm has issued an audit report on the effectiveness of our internal control over financial reporting. This report appears on page 114.

123Hitachi, Ltd. Annual Report 2010
report of independent registered public Accounting Firm
To the Stockholders and Board of Directors of Hitachi, Ltd.:
We have audited the accompanying consolidated balance sheets of Hitachi, Ltd. and subsidiaries (the “Company”) as of March 31, 2010 and 2009, and the related consolidated statements of operations, equity, and cash flows for each of the three years in the period ended March 31, 2010, all expressed in Japanese yen. These financial statements are the responsibility of the Company’s management. Our responsibility is to express an opinion on these financial statements based on our audits.
We conducted our audits in accordance with the standards of the Public Company Accounting Oversight Board (United States). Those standards require that we plan and perform the audit to obtain reasonable assurance about whether the financial statements are free of material misstatement. An audit includes examining, on a test basis, evidence supporting the amounts and disclosures in the financial statements. An audit also includes assessing the accounting principles used and significant estimates made by management, as well as evaluating the overall financial statement presentation. We believe that our audits provide a reasonable basis for our opinion.
In our report dated June 23, 2009, we expressed an opinion that, except for the omission of segment reporting information, the consolidated financial statements as of March 31, 2009 and 2008 and for each of the three years in the period ended March 31, 2009 presented fairly, in all material respects, the consolidated financial position, results of operations and cash flows of Hitachi, Ltd. and subsidiaries, in conformity with U.S. generally accepted accounting principles. As described in Note 2 (y), during the year ended March 31, 2010, the Company adopted Accounting Standards Codification (ASC) 280, “Segment Reporting” and revised the disclosures in its consolidated financial statements as of March 31, 2009 and for the year then ended to conform with U.S. generally accepted accounting principles. Accordingly, our present opinion on the consolidated financial statements as of March 31, 2009 and for the year then ended, as presented herein, is unqualified rather than qualified.
The Company’s consolidated financial statements as of March 31, 2008 and for the year then ended do not disclose segment reporting information required by ASC 280. In our opinion, disclosure of segment reporting information is required by U.S. generally accepted accounting principles.
In our opinion, except for the omission of segment reporting information discussed in the preceding paragraph, the financial statements referred to above present fairly, in all material respects, the consolidated financial position of Hitachi, Ltd. and subsidiaries at March 31, 2010 and 2009, and the consolidated results of their operations and their cash flows for each of the three years in the period ended March 31, 2010, in conformity with U.S. generally accepted accounting principles.
As discussed in Note 2 (ac), the Company adopted new accounting guidance for noncontrolling interests in a subsidiary as prescribed in ASC 810 on April 1, 2009.
We also have audited, in accordance with the standards of the Public Company Accounting Oversight Board (United States), Hitachi, Ltd. and subsidiaries’ internal control over financial reporting as of March 31, 2010, based on criteria established in Internal Control-Integrated Framework issued by the Committee of Sponsoring Organizations of the Treadway Commission and our report dated June 29, 2010 expressed an unqualified opinion thereon.
We also have recomputed the translation of the consolidated financial statements as of and for the year ended March 31, 2010 into United States dollars. In our opinion, the consolidated financial statements expressed in Japanese yen have been translated into United States dollars on the basis described in Note 3.
Tokyo, JapanJune 29, 2010

124 Hitachi, Ltd. Annual Report 2010
report of independent registered public Accounting Firm
To the Stockholders and Board of Directors of Hitachi, Ltd.:
We have audited Hitachi, Ltd. and subsidiaries’ internal control over financial reporting as of March 31, 2010, based on criteria established in Internal Control-Integrated Framework issued by the Committee of Sponsoring Organizations of the Treadway Commission (the COSO criteria). Hitachi, Ltd. and subsidiaries’ management is responsible for maintaining effective internal control over financial reporting, and for its assessment of the effectiveness of internal control over financial reporting included in the accompanying Management’s Report on Internal Control Over Financial Reporting. Our responsibility is to express an opinion on the company’s internal control over financial reporting based on our audit.
We conducted our audit in accordance with the standards of the Public Company Accounting Oversight Board (United States). Those standards require that we plan and perform the audit to obtain reasonable assurance about whether effective internal control over financial reporting was maintained in all material respects. Our audit included obtaining an understanding of internal control over financial reporting, assessing the risk that a material weakness exists, testing and evaluating the design and operating effectiveness of internal control based on the assessed risk, and performing such other procedures as we considered necessary in the circumstances. We believe that our audit provides a reasonable basis for our opinion.
A company’s internal control over financial reporting is a process designed to provide reasonable assurance regarding the reliability of financial reporting and the preparation of financial statements for external purposes in accordance with generally accepted accounting principles. A company’s internal control over financial reporting includes those policies and procedures that (1) pertain to the maintenance of records that, in reasonable detail, accurately and fairly reflect the transactions and dispositions of the assets of the company; (2) provide reasonable assurance that transactions are recorded as necessary to permit preparation of financial statements in accordance with generally accepted accounting principles, and that receipts and expenditures of the company are being made only in accordance with authorizations of management and directors of the company; and (3) provide reasonable assurance regarding prevention or timely detection of unauthorized acquisition, use or disposition of the company’s assets that could have a material effect on the financial statements.
Because of its inherent limitations, internal control over financial reporting may not prevent or detect misstatements. Also, projections of any evaluation of effectiveness to future periods are subject to the risk that controls may become inadequate because of changes in conditions, or that the degree of compliance with the policies or procedures may deteriorate.
In our opinion, Hitachi, Ltd. and subsidiaries maintained, in all material respects, effective internal control over financial reporting as of March 31, 2010, based on the COSO criteria.
We also have audited, in accordance with the standards of the Public Company Accounting Oversight Board (United States), the accompanying consolidated balance sheets of Hitachi, Ltd. and subsidiaries as of March 31, 2010 and 2009, and the related consolidated statements of operations, equity, and cash flows for each of the three years in the period ended March 31, 2010, all expressed in Japanese yen, and our report dated June 29, 2010 stated that, except for the omission of segment reporting information required by Accounting Standards Codification 280, “Segment Reporting” as of March 31, 2008 and for the year then ended, the financial statements referred to above present fairly, in all material respects, the consolidated financial position of Hitachi, Ltd. and subsidiaries at March 31, 2010 and 2009, and the consolidated results of their operations and their cash flows for each of the three years in the period ended March 31, 2010, in conformity with U.S. generally accepted accounting principles.
Tokyo, JapanJune 29, 2010

125Hitachi, Ltd. Annual Report 2010

126 Hitachi, Ltd. Annual Report 2010
Five-year SummaryHitachi, Ltd. and Subsidiaries
Millions of yen
2010 2009 2008 2007 2006
For the year:
Revenues . . . . . . . . . . . . . . . . . . . . . . . . . . . . . . . . . . . ¥8,698,546 ¥10,000,369 ¥11,226,735 ¥10,247,903 ¥ 9,464,801
Operating income (note) . . . . . . . . . . . . . . . . . . . . . . . . 202,159 127,146 345,516 182,512 256,012
Net income (loss) attributable to Hitachi, Ltd. . . . . . . . . (106,961) (787,337) (58,125) (32,799) 37,320
Cash dividends declared . . . . . . . . . . . . . . . . . . . . . . . – 9,971 19,947 19,974 36,641
Capital investment (Property, plant and equipment) . . . . . . . . . . . . . . . . . 546,326 788,466 969,087 1,048,572 954,706
Depreciation (Property, plant and equipment) . . . . . . . . 441,697 478,759 541,470 472,175 451,170
R&D expenditures . . . . . . . . . . . . . . . . . . . . . . . . . . . . 372,470 416,517 428,171 412,534 405,079
At year-end:
Total assets . . . . . . . . . . . . . . . . . . . . . . . . . . . . . . . . . 8,951,762 9,403,709 10,530,847 10,644,259 10,021,195
Net property, plant and equipment . . . . . . . . . . . . . . . . 2,219,804 2,393,946 2,653,918 2,688,977 2,460,186
Total Hitachi, Ltd. stockholders’ equity . . . . . . . . . . . . . 1,284,658 1,049,951 2,170,612 2,442,797 2,507,773
Yen
Per share information:
Net income (loss) attributable to Hitachi, Ltd. stockholders:
Basic . . . . . . . . . . . . . . . . . . . . . . . . . . . . . . . . . . . . ¥ (29.20) ¥ (236.86) ¥ (17.48) ¥ (9.84) ¥ 11.20
Diluted . . . . . . . . . . . . . . . . . . . . . . . . . . . . . . . . . . . (29.20) (236.87) (17.77) (9.87) 10.84
Net income (loss) attributable to Hitachi, Ltd. stockholders per ADS (representing 10 shares):
Basic . . . . . . . . . . . . . . . . . . . . . . . . . . . . . . . . . . . . (292) (2,369) (175) (98) 112
Diluted . . . . . . . . . . . . . . . . . . . . . . . . . . . . . . . . . . . (292) (2,369) (178) (99) 108
Cash dividends declared . . . . . . . . . . . . . . . . . . . . . . . – 3.0 6.0 6.0 11.0
Cash dividends declared per ADS (representing 10 shares) . . . . . . . . . . . . . . . . . . . . . . . – 30 60 60 110
Total Hitachi, Ltd. stockholders’ equity . . . . . . . . . . . . . 287.13 315.86 652.95 734.66 752.91
Number of employees . . . . . . . . . . . . . . . . . . . . . . . . . . . 359,746 361,796 347,810 349,996 327,324
Note: In order to be consistent with financial reporting principles and practices generally accepted in Japan, operating income is presented as total revenues less cost of sales and selling, general and administrative expenses. The Company believes that this is useful to investors in comparing the Company’s financial results with those of other Japanese companies. Under accounting principles generally accepted in the United States of America, restructuring charges, net gain or loss on sale and disposal of rental assets and other property and impairment losses for long-lived assets are included as part of operating income. See the consolidated statements of operations and notes 19, 20 and 21 to the consolidated financial statements.
The restructuring charges mainly represent special termination benefits incurred with the reorganization of our business structures, and as the result of the Company and its subsidiaries reviewing and reshaping the business portfolio. Restructuring charges, net gain or loss on sale and disposal of rental assets and other property and impairment losses for long-lived assets for the year ended March 31, 2007 and 2006 totaled net losses of ¥38,512 million and ¥34,944 million, respectively.
The Company has changed the number of employees to exclude temporary employees starting from the year ended March 31, 2010. Figures for prior years have been restated to reflect the current year presentation.

CoRpoRAte DAtA(As of March 31, 2010)
Corporate Name
Hitachi, Ltd.
(Kabushiki Kaisha Hitachi Seisakusho)
Principal Office
6-6, Marunouchi 1-chome, Chiyoda-ku,
Tokyo, 100-8280, Japan
Founded
1910 (Incorporated in 1920)
Number of Employees
359,746
Number of Shares Issued
Common Stock: 4,518,132,365 shares
Number of Shareholders
460,320
Administrator of Shareholders’ Register
Tokyo Securities Transfer Agent Co., Ltd.
6-2, Otemachi, 2-chome, Chiyoda-ku,
Tokyo, 100-0004, Japan
Depositary and Registrar for
American Depositary Receipts
(New York Stock Exchange Listed Symbol — HIT)
Citibank, N.A. Shareholder Services
P.O. Box 43077
Providence, Rhode Island 02940-3077 USA
TEL: U.S.A. 1-877-CITI-ADR (248-4237) (toll-free)
International +1-781-575-4555
E-mail: [email protected]
URL: www.citi.com/adr
Overseas Stock Exchange Listing
New York
Japanese Stock Exchange Listings
Tokyo, Osaka, Nagoya, Fukuoka and Sapporo
Independent Registered Public Accounting Firm
Ernst & Young ShinNihon LLC
URL
http://www.hitachi.com/
For Further inFormation, please contact:
Investor Relations
JAPAN
Hitachi, Ltd.
6-6, Marunouchi 1-chome, Chiyoda-ku,
Tokyo, 100-8280
TEL: +81-3-3258-1111
E-mail: [email protected]
U.S.A.
Hitachi America, Ltd.
50 Prospect Avenue, Tarrytown, NY 10591
TEL: +1-914-333-2987
E-mail: [email protected]
U.K.
Hitachi Europe Ltd.
Whitebrook Park, Lower Cookham Road,
Maidenhead Berkshire SL6 8YA
TEL: +44-1628-585714
CHINA
Hitachi (China) Ltd.
Beijing Fortune Bldg. 18F,
5 Dong San Huan Bei-Lu, Chao Yang District, Beijing 100004
TEL: +86-10-6539-9139
127Hitachi, Ltd. Annual Report 2010
HITA
CH
I Annual R
epo
rt 2010
Printed in Japan