Embed Size (px)
Citation preview
Leading Partners in Science
Cost-effectiveness and implications of GWPs and GTPs under alternative policy goals
Andy Reisinger1 Keywan Riahi2 Oscar van Vliet2
1 New Zealand Agricultural Greenhouse Gas Research Centre2 International Institute for Applied Systems Analysis (IIASA)
Manuscript submitted to Climatic ChangeWork funded by NZ Ministry of Agriculture and various EU-FP7 programs
Copyright © 2010 New Zealand Agricultural Greenhouse Gas Research Centre April 20, 2023 | 1
Leading Partners in Science
In a nutshell
100-year GWPs are not a cost-effective way of comparing GHGs if the main policy goal is to limit long-term climate change.
Few studies have explored the cost and climate policy implications if other physically-based metrics were to replace GWPs.
1.Determine the global cost-effectiveness of different metrics for the main policy goal of limiting radiative forcing in 2100 to 450 or 550ppm CO2-equivalent
2.Evaluate influence of metrics on additional policy goals (realised warming, GDP, timing of CO2 emissions peak)
Copyright © 2010 New Zealand Agricultural Greenhouse Gas Research Centre April 20, 2023 | 2
Leading Partners in Science
Copyright © 2010 New Zealand Agricultural Greenhouse Gas Research Centre April 20, 2023 | 3
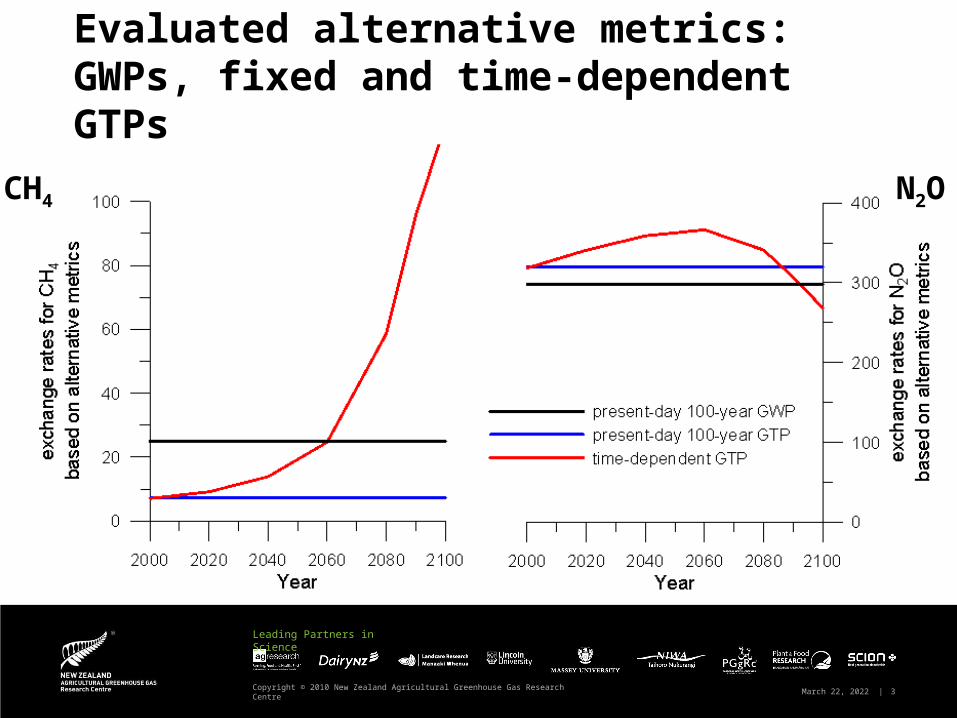
Evaluated alternative metrics:GWPs, fixed and time-dependent GTPs
CH4 N2O
Leading Partners in Science
Sensitivity tests: technology/policy assumptions
• Assumed policy goal is to limit radiative forcing in 2100: 450 ppm CO2-eq (~2.7 Wm-2)
550 ppm CO2-eq (~3.8 Wm-2)
• Rate of improvement of agricultural mitigation potential No improvement / rapid improvement Additional technology from 2030 or 2070 to mitigate
CH4 from enteric fermentation
• Policy treatment of agricultural GHG emissions Fully included in global mitigation efforts /
fully excluded / excluded until 2050
Use integrated assessment model MESSAGE to determine cost-minimising abatement pathways over 21st century
Copyright © 2010 New Zealand Agricultural Greenhouse Gas Research Centre April 20, 2023 | 4
Leading Partners in Science
Copyright © 2010 New Zealand Agricultural Greenhouse Gas Research Centre April 20, 2023 | 5
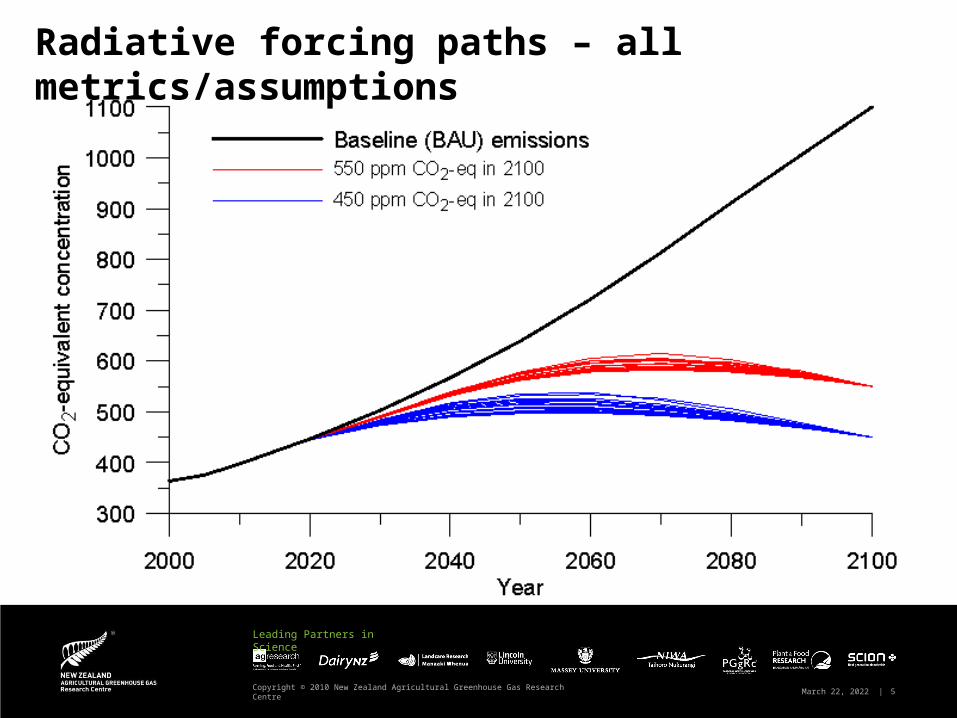
Radiative forcing paths – all metrics/assumptions
Leading Partners in Science
Copyright © 2010 New Zealand Agricultural Greenhouse Gas Research Centre April 20, 2023 | 6
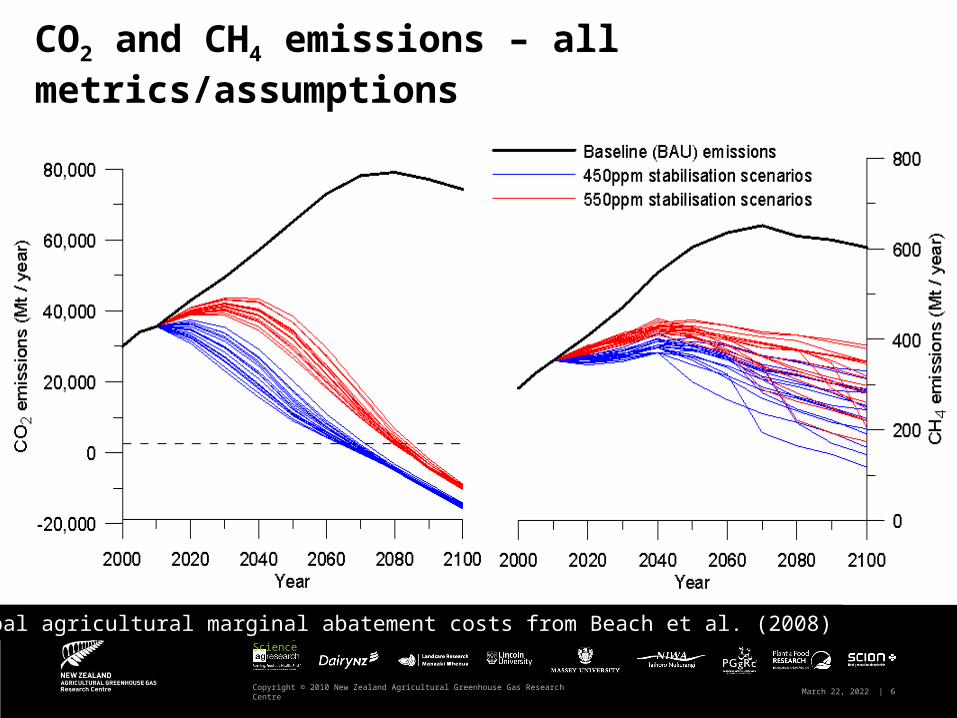
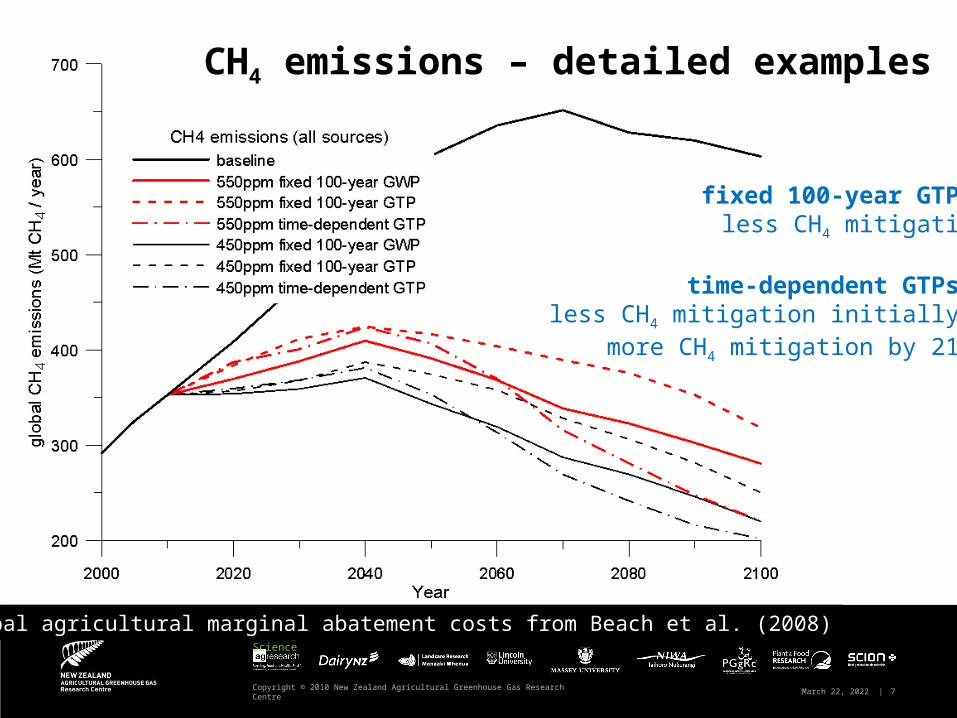
Global agricultural marginal abatement costs from Beach et al. (2008)
CO2 and CH4 emissions – all metrics/assumptions
Leading Partners in Science
Copyright © 2010 New Zealand Agricultural Greenhouse Gas Research Centre April 20, 2023 | 7
fixed 100-year GTPs:less CH4 mitigation
time-dependent GTPs: less CH4 mitigation initially,
more CH4 mitigation by 2100
Global agricultural marginal abatement costs from Beach et al. (2008)
CH4 emissions – detailed examples
Leading Partners in Science
Global agricultural CH4 emission pathways8
MESSAGE results
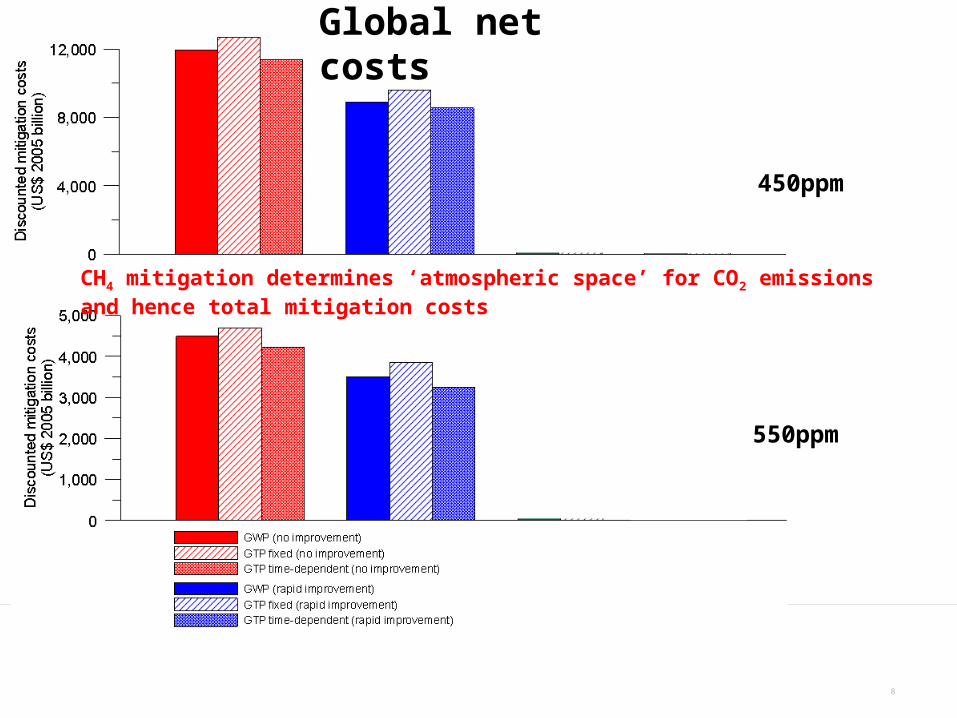
450ppm
550ppm
Global net costs
CH4 mitigation determines ‘atmospheric space’ for CO2 emissionsand hence total mitigation costs
Leading Partners in Science
Global agricultural CH4 emission pathways9
0
1000
2000
3000
4000
5000
NP
Vm
itiga
tion
cost
(US
$20
05
bill
ion)
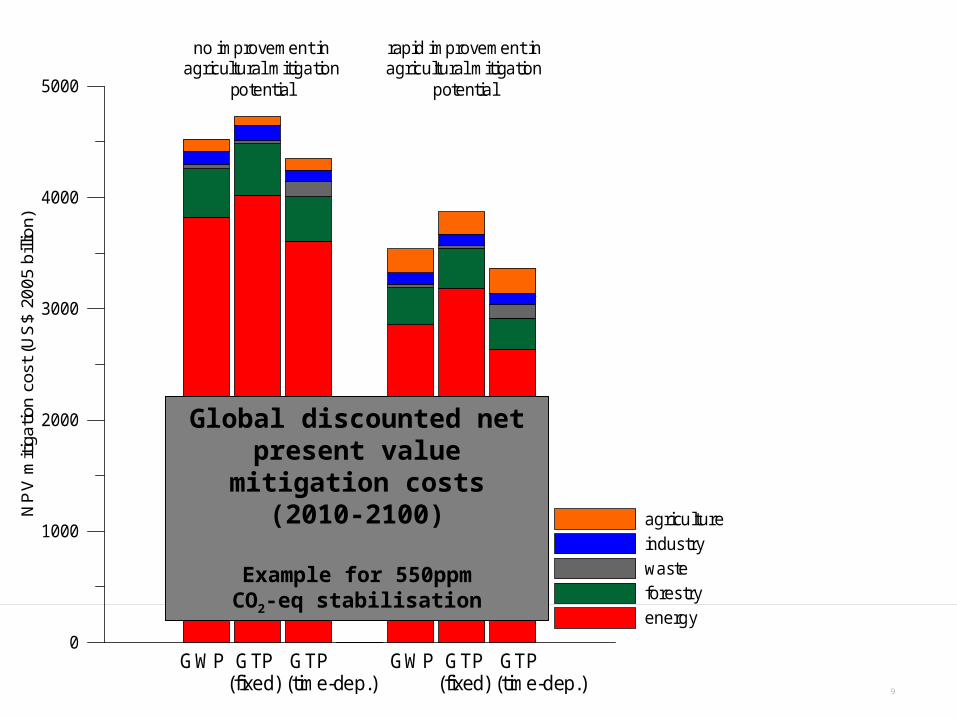
agricultureindustrywasteforestryenergy
GWP GTP GTP(fixed) (time-dep.)
0
50
100
150
200
250
NP
Vm
itiga
tion
cost
(US
$20
05
billi
on
)
agriculture
CH4 2010 - 2050
N2O 2010 - 2050
CH4 2050 - 2100
N2O 2050 - 2100
no improvement inagricultural mitigation
potential
rapid improvement inagricultural mitigation
potential
no improvement inagricultural mitigation
potential
rapid improvement inagricultural mitigation
potential
GWP GTP GTP(fixed) (time-dep.)
Global discounted net present value mitigation
costs (2010-2100)
Example for 550ppmCO2-eq stabilisation
Leading Partners in Science
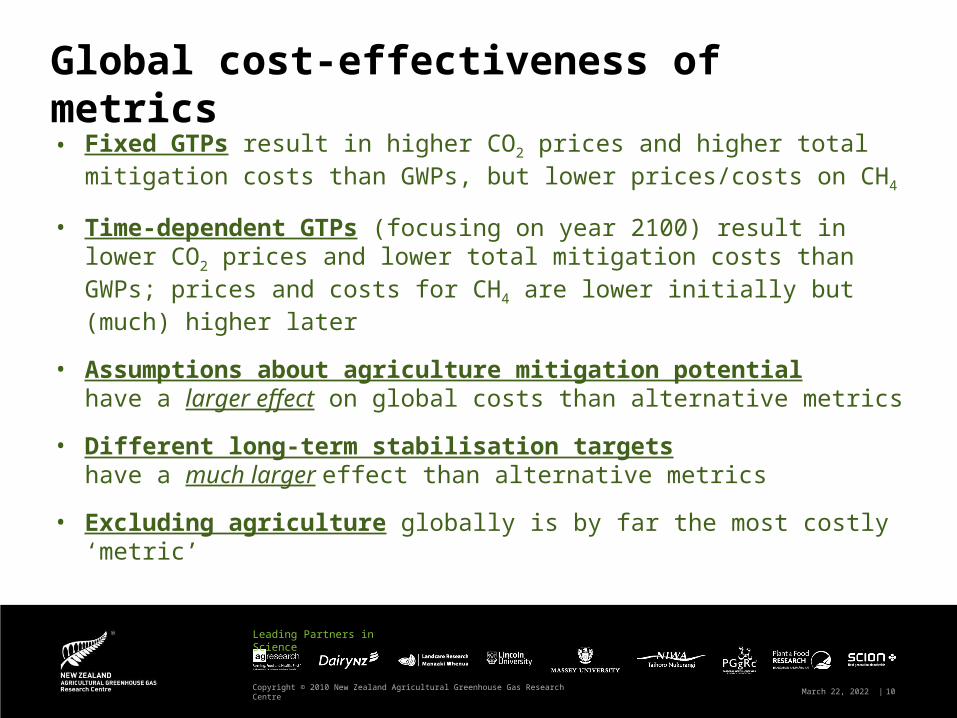
Global cost-effectiveness of metrics
• Fixed GTPs result in higher CO2 prices and higher total mitigation costs than GWPs, but lower prices/costs on CH4
• Time-dependent GTPs (focusing on year 2100) result in lower CO2 prices and lower total mitigation costs than GWPs; prices and costs for CH4 are lower initially but (much) higher later
• Assumptions about agriculture mitigation potentialhave a larger effect on global costs than alternative metrics
• Different long-term stabilisation targets have a much larger effect than alternative metrics
• Excluding agriculture globally is by far the most costly ‘metric’
Copyright © 2010 New Zealand Agricultural Greenhouse Gas Research Centre April 20, 2023 | 10
Leading Partners in Science
What about other relevant policy goals?
• Realised amount of warming and overshoot
• GDP impacts
• Timing of cost-effective CO2 emissions peak
• Regional implications
Copyright © 2010 New Zealand Agricultural Greenhouse Gas Research Centre April 20, 2023 | 11
Leading Partners in Science
Copyright © 2010 New Zealand Agricultural Greenhouse Gas Research Centre April 20, 2023 | 12
Global agricultural marginal abatement costs from Beach et al. (2008)
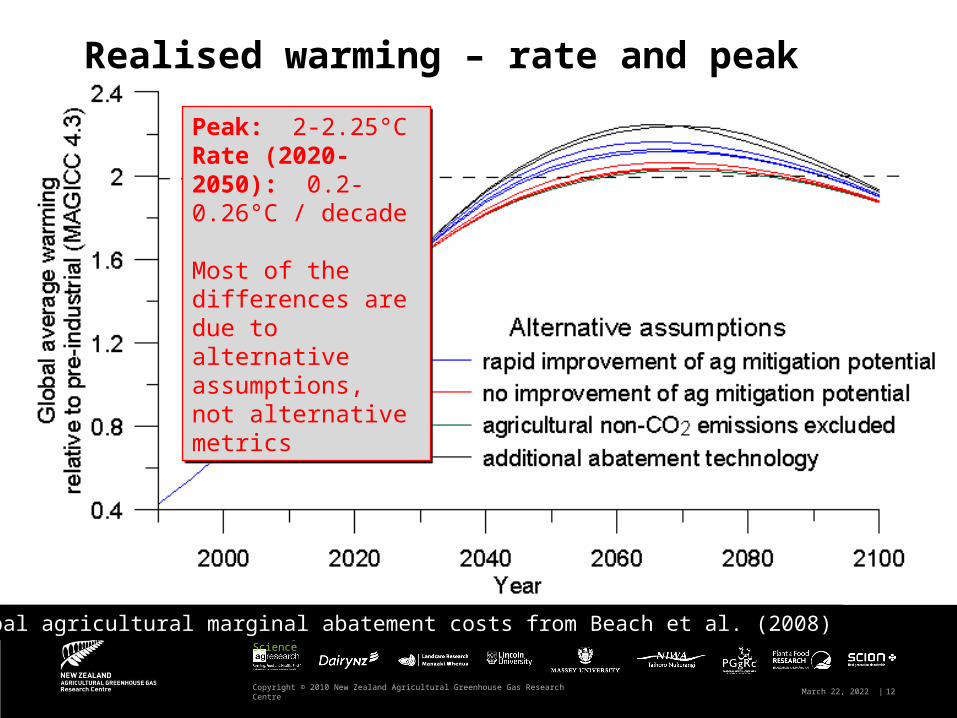
Realised warming – rate and peak
Peak: 2-2.25°CRate (2020-2050): 0.2-0.26°C / decade
Most of the differences are due to alternative assumptions, not alternative metrics
Peak: 2-2.25°CRate (2020-2050): 0.2-0.26°C / decade
Most of the differences are due to alternative assumptions, not alternative metrics
Leading Partners in Science
Copyright © 2010 New Zealand Agricultural Greenhouse Gas Research Centre April 20, 2023 | 13
Global agricultural marginal abatement costs from Beach et al. (2008)
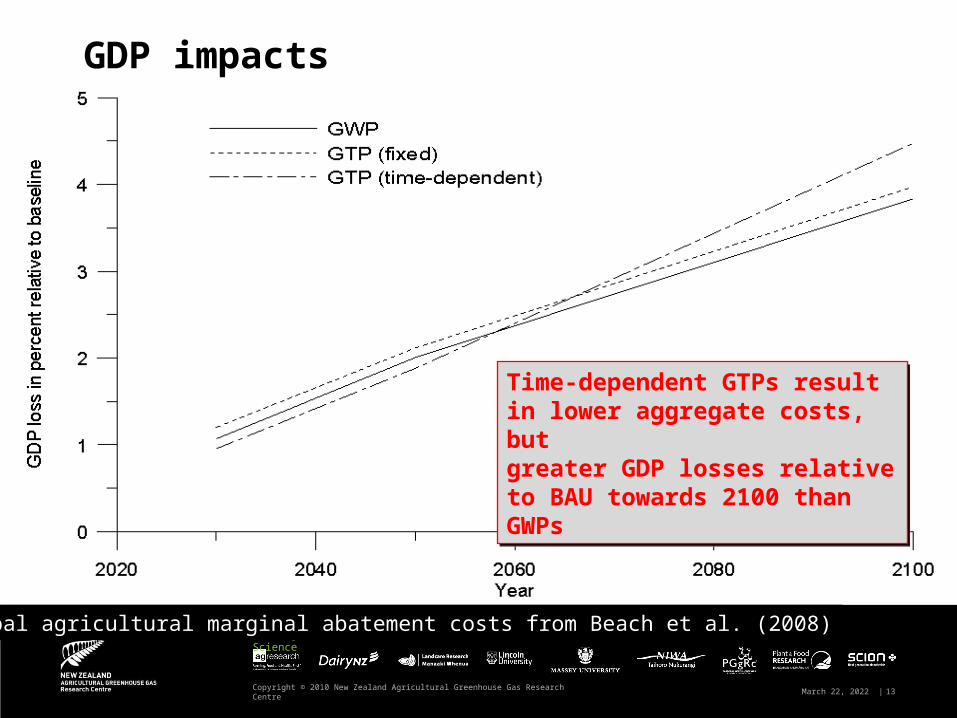
GDP impacts
Time-dependent GTPs result in lower aggregate costs, butgreater GDP losses relative to BAU towards 2100 than GWPs
Time-dependent GTPs result in lower aggregate costs, butgreater GDP losses relative to BAU towards 2100 than GWPs
Leading Partners in Science
Copyright © 2010 New Zealand Agricultural Greenhouse Gas Research Centre April 20, 2023 | 14
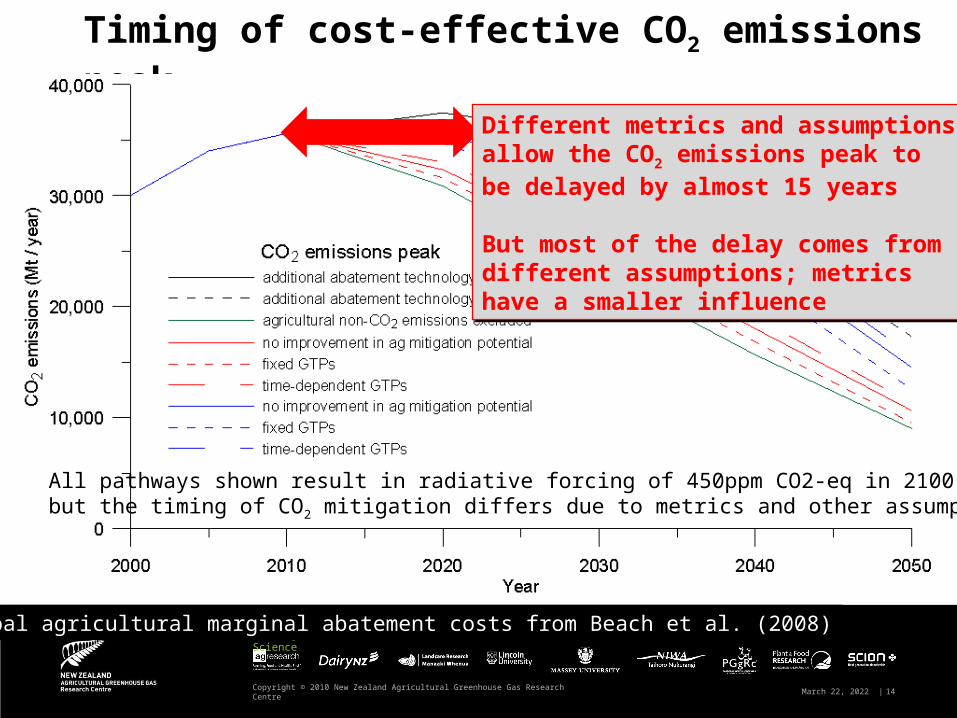
Global agricultural marginal abatement costs from Beach et al. (2008)
Timing of cost-effective CO2 emissions peak
Different metrics and assumptionsallow the CO2 emissions peak tobe delayed by almost 15 years
But most of the delay comes fromdifferent assumptions; metricshave a smaller influence
Different metrics and assumptionsallow the CO2 emissions peak tobe delayed by almost 15 years
But most of the delay comes fromdifferent assumptions; metricshave a smaller influence
All pathways shown result in radiative forcing of 450ppm CO2-eq in 2100,but the timing of CO2 mitigation differs due to metrics and other assumptions
Leading Partners in Science
Copyright © 2010 New Zealand Agricultural Greenhouse Gas Research Centre April 20, 2023 | 15
Conclusions
GWPs are not the most cost-effective metric to compare GHGsIF the main goal is to limit long-term radiative forcing in 2100, and to do so via cost-minimising global abatement pathways
Fixed 100-year GTPs are even less cost-effective (+ 5 to 10%) time-dependent GTPs would be more cost-effective (- 4 to 5%)
Cost implications of alternative metrics: smaller than alternative assumptions about future agricultural mitigation potential, and much smaller than choices of long-term target
Other policy goals: different equivalent metrics do not result in equivalent other environmental outcomes – but differences are again smaller than those arising from other assumptions
Regional implications: regional effect of metrics on production systems and land-use change – see second presentation please!
Leading Partners in Science
Copyright © 2010 New Zealand Agricultural Greenhouse Gas Research Centre April 20, 2023 | 16
Questions to the policy community
How important is it for the policy process to have a metric that is optimal for a particular policy goal but, almost by definition, will do a poorer job for other policy goals?
How sustainable is the implementation of a metric that implies escalating cost of CH4 emissions globally?
What are the social/policy benefits and costs of continuously updating a metric to achieve optimality (however defined)?
Are tests of metrics useful that assume full global and sectoral participation at full price levels?
What are the implications of different metrics for regional and sectoral engagement to climate change?