Embed Size (px)
Citation preview
LEAN MANAGEMENT PRACTICES AND OPERATIONAL
PERFORMANCE OF COMMERCIAL BANKS IN KENYA
BY
GERTRUDE MANGA MWACHARI
A RESEARCH PROJECT SUBMITTED IN PARTIAL
FULFILLMENT FOR THE AWARD OF MASTER OF BUSINESS
ADMINISTRATION (MBA) SCHOOL OF BUSINESS, UNIVERSITY
OF NAIROBI
DECEMBER, 2018
ii
DECLARATION
I declare that this research project is my original work and has never been submitted to any
other University
Signature……………………………... Date…………………………...………
Gertrude M Mwachari
D61/83069/2015
This project has been submitted for examination with our approval as the University
supervisors.
Signature …………………………………. Date ……………………………….
Dr. Stephen Odock
Lecturer, Department of Management Science,
School of Business,
University of Nairobi.
Signature …………………………………. Date ……………………………….
Dr. James Kariuki
Lecturer, Department of Management Science,
School of Business,
University of Nairobi.
iii
DEDICATION
This work is dedicated to all those who assisted me in one way or another to carry out this
research, to my family for their support and encouragement and to the Almighty God for
the wisdom and gift of life that has seen me through to the end of this research.
iv
ACKNOWLEDGEMENT
I sincerely thank the Almighty for guiding me and seeing me throughout my studies. To
my academic supervisors, Dr. James Kariuki and Dr. Stephen Odock for their great
contribution and for the support they have offered me thus far. The success of this research
was fundamentally attributed to shared efforts from family, colleagues, friends and scholars
who I owe a great deal of appreciation. Thank you all.
v
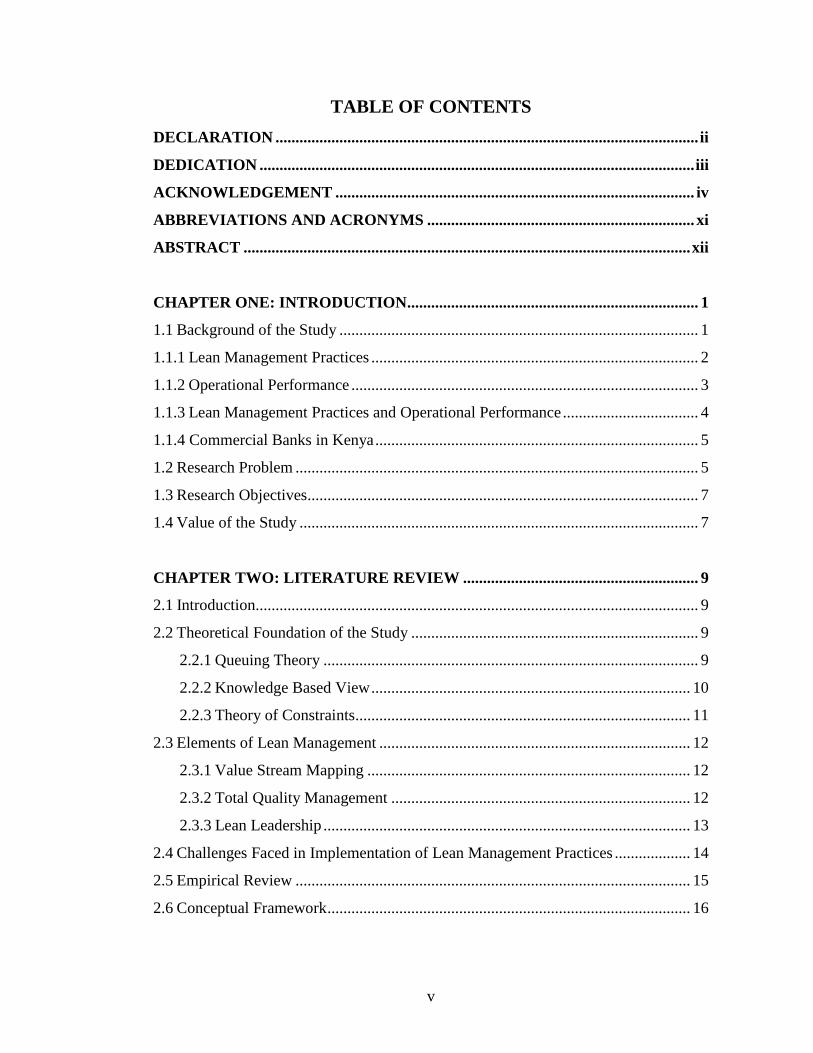
TABLE OF CONTENTS
DECLARATION .......................................................................................................... ii
DEDICATION ............................................................................................................. iii
ACKNOWLEDGEMENT .......................................................................................... iv
ABBREVIATIONS AND ACRONYMS ................................................................... xi
ABSTRACT ................................................................................................................ xii
CHAPTER ONE: INTRODUCTION ......................................................................... 1
1.1 Background of the Study .......................................................................................... 1
1.1.1 Lean Management Practices .................................................................................. 2
1.1.2 Operational Performance ....................................................................................... 3
1.1.3 Lean Management Practices and Operational Performance .................................. 4
1.1.4 Commercial Banks in Kenya ................................................................................. 5
1.2 Research Problem ..................................................................................................... 5
1.3 Research Objectives.................................................................................................. 7
1.4 Value of the Study .................................................................................................... 7
CHAPTER TWO: LITERATURE REVIEW ........................................................... 9
2.1 Introduction............................................................................................................... 9
2.2 Theoretical Foundation of the Study ........................................................................ 9
2.2.1 Queuing Theory .............................................................................................. 9
2.2.2 Knowledge Based View ................................................................................ 10
2.2.3 Theory of Constraints .................................................................................... 11
2.3 Elements of Lean Management .............................................................................. 12
2.3.1 Value Stream Mapping ................................................................................. 12
2.3.2 Total Quality Management ........................................................................... 12
2.3.3 Lean Leadership ............................................................................................ 13
2.4 Challenges Faced in Implementation of Lean Management Practices ................... 14
2.5 Empirical Review ................................................................................................... 15
2.6 Conceptual Framework ........................................................................................... 16
vi
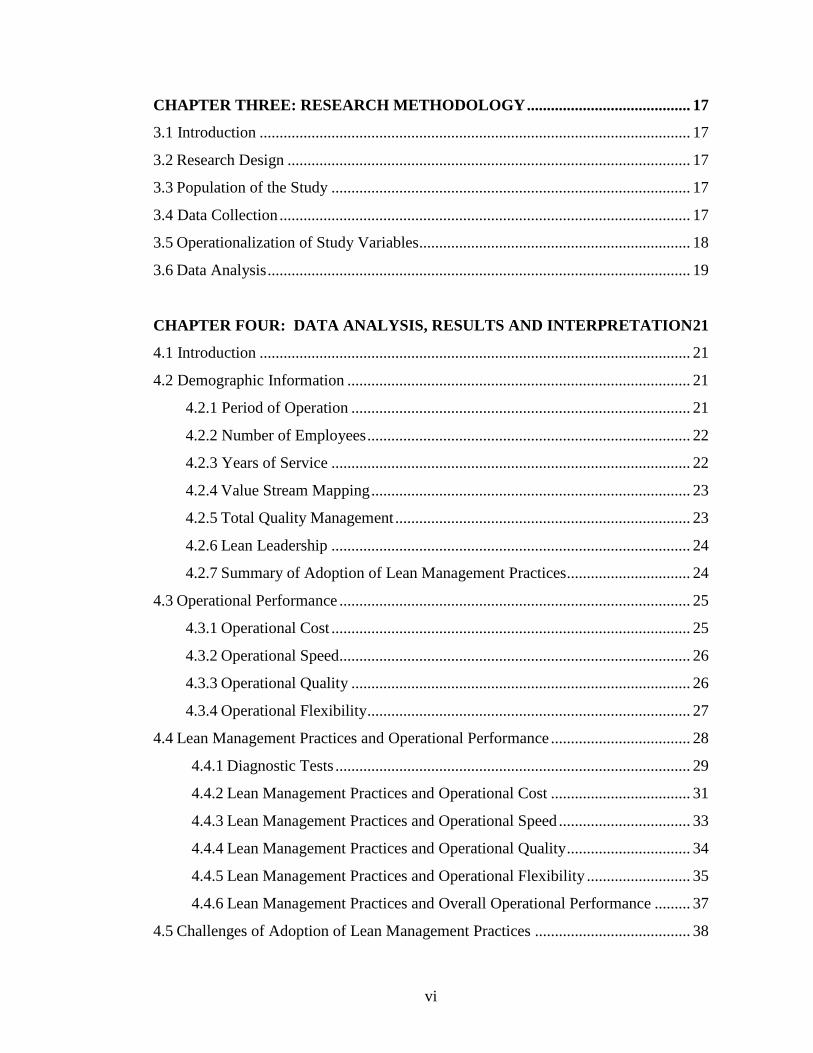
CHAPTER THREE: RESEARCH METHODOLOGY ......................................... 17
3.1 Introduction ............................................................................................................ 17
3.2 Research Design ..................................................................................................... 17
3.3 Population of the Study .......................................................................................... 17
3.4 Data Collection ....................................................................................................... 17
3.5 Operationalization of Study Variables.................................................................... 18
3.6 Data Analysis .......................................................................................................... 19
CHAPTER FOUR: DATA ANALYSIS, RESULTS AND INTERPRETATION 21
4.1 Introduction ............................................................................................................ 21
4.2 Demographic Information ...................................................................................... 21
4.2.1 Period of Operation ..................................................................................... 21
4.2.2 Number of Employees ................................................................................. 22
4.2.3 Years of Service .......................................................................................... 22
4.2.4 Value Stream Mapping ................................................................................ 23
4.2.5 Total Quality Management .......................................................................... 23
4.2.6 Lean Leadership .......................................................................................... 24
4.2.7 Summary of Adoption of Lean Management Practices............................... 24
4.3 Operational Performance ........................................................................................ 25
4.3.1 Operational Cost .......................................................................................... 25
4.3.2 Operational Speed........................................................................................ 26
4.3.3 Operational Quality ..................................................................................... 26
4.3.4 Operational Flexibility ................................................................................. 27
4.4 Lean Management Practices and Operational Performance ................................... 28
4.4.1 Diagnostic Tests ......................................................................................... 29
4.4.2 Lean Management Practices and Operational Cost ................................... 31
4.4.3 Lean Management Practices and Operational Speed ................................. 33
4.4.4 Lean Management Practices and Operational Quality ............................... 34
4.4.5 Lean Management Practices and Operational Flexibility .......................... 35
4.4.6 Lean Management Practices and Overall Operational Performance ......... 37
4.5 Challenges of Adoption of Lean Management Practices ....................................... 38
vii
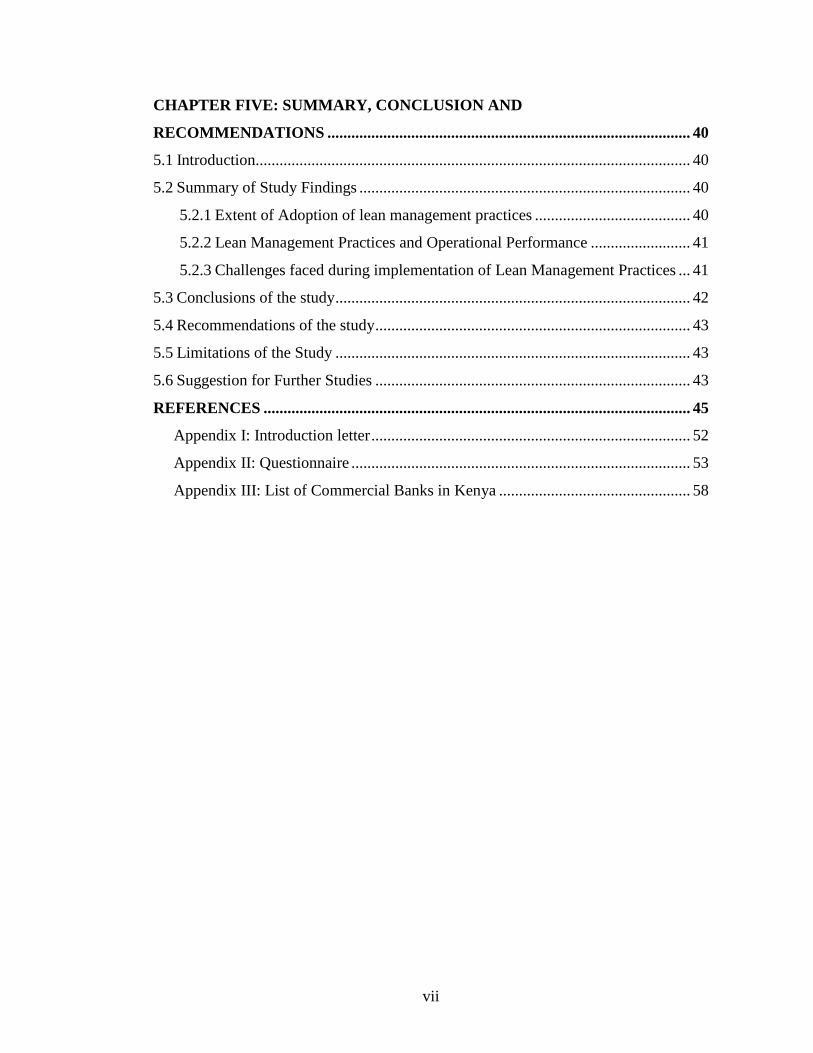
CHAPTER FIVE: SUMMARY, CONCLUSION AND
RECOMMENDATIONS ........................................................................................... 40
5.1 Introduction............................................................................................................. 40
5.2 Summary of Study Findings ................................................................................... 40
5.2.1 Extent of Adoption of lean management practices ....................................... 40
5.2.2 Lean Management Practices and Operational Performance ......................... 41
5.2.3 Challenges faced during implementation of Lean Management Practices ... 41
5.3 Conclusions of the study ......................................................................................... 42
5.4 Recommendations of the study ............................................................................... 43
5.5 Limitations of the Study ......................................................................................... 43
5.6 Suggestion for Further Studies ............................................................................... 43
REFERENCES ........................................................................................................... 45
Appendix I: Introduction letter ................................................................................ 52
Appendix II: Questionnaire ..................................................................................... 53
Appendix III: List of Commercial Banks in Kenya ................................................ 58
viii
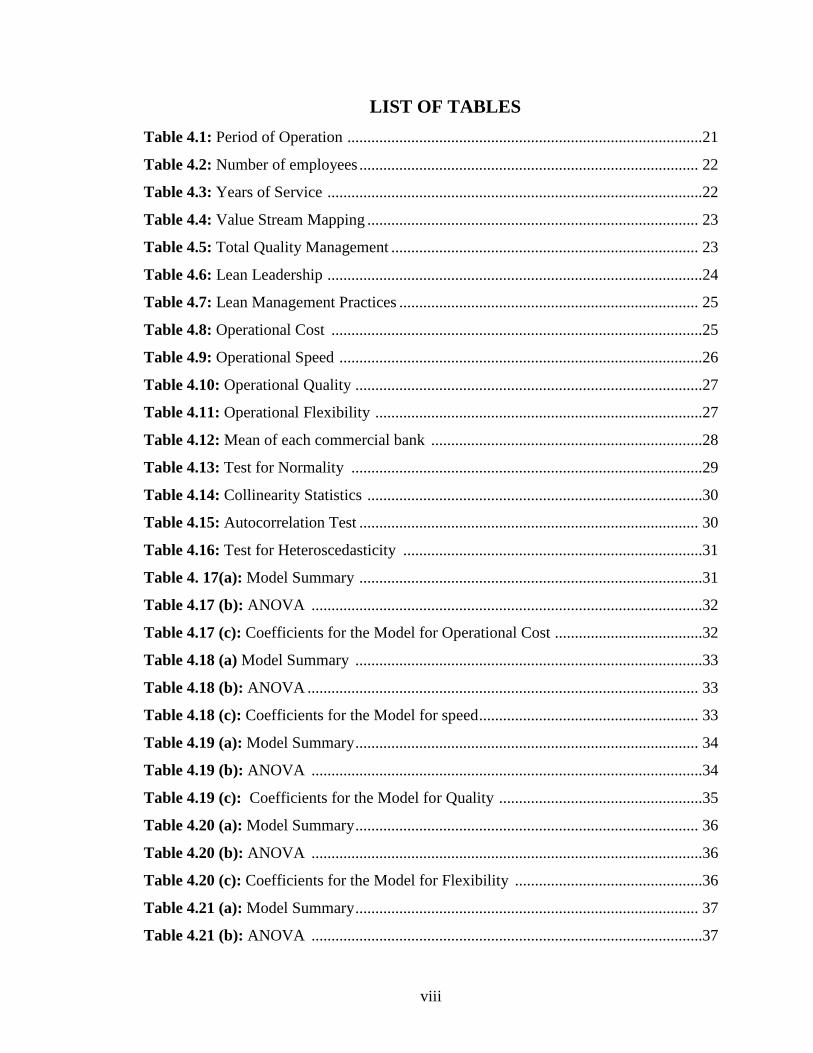
LIST OF TABLES
Table 4.1: Period of Operation .........................................................................................21
Table 4.2: Number of employees ..................................................................................... 22
Table 4.3: Years of Service ..............................................................................................22
Table 4.4: Value Stream Mapping ................................................................................... 23
Table 4.5: Total Quality Management ............................................................................. 23
Table 4.6: Lean Leadership ..............................................................................................24
Table 4.7: Lean Management Practices ........................................................................... 25
Table 4.8: Operational Cost .............................................................................................25
Table 4.9: Operational Speed ...........................................................................................26
Table 4.10: Operational Quality .......................................................................................27
Table 4.11: Operational Flexibility ..................................................................................27
Table 4.12: Mean of each commercial bank ....................................................................28
Table 4.13: Test for Normality ........................................................................................29
Table 4.14: Collinearity Statistics ....................................................................................30
Table 4.15: Autocorrelation Test ..................................................................................... 30
Table 4.16: Test for Heteroscedasticity ...........................................................................31
Table 4. 17(a): Model Summary ......................................................................................31
Table 4.17 (b): ANOVA ..................................................................................................32
Table 4.17 (c): Coefficients for the Model for Operational Cost .....................................32
Table 4.18 (a) Model Summary .......................................................................................33
Table 4.18 (b): ANOVA .................................................................................................. 33
Table 4.18 (c): Coefficients for the Model for speed ....................................................... 33
Table 4.19 (a): Model Summary ...................................................................................... 34
Table 4.19 (b): ANOVA ..................................................................................................34
Table 4.19 (c): Coefficients for the Model for Quality ...................................................35
Table 4.20 (a): Model Summary ...................................................................................... 36
Table 4.20 (b): ANOVA ..................................................................................................36
Table 4.20 (c): Coefficients for the Model for Flexibility ...............................................36
Table 4.21 (a): Model Summary ...................................................................................... 37
Table 4.21 (b): ANOVA ..................................................................................................37
ix
Table 4.21(c): Coefficients for the Model for Overall Operational Performance ...........38
Table 4.22: Challenges of Adoption of Lean Management Practices .............................. 39

x
LIST OF FIGURES
Figure 2.1: Conceptual Framework ................................................................................. 16
xi
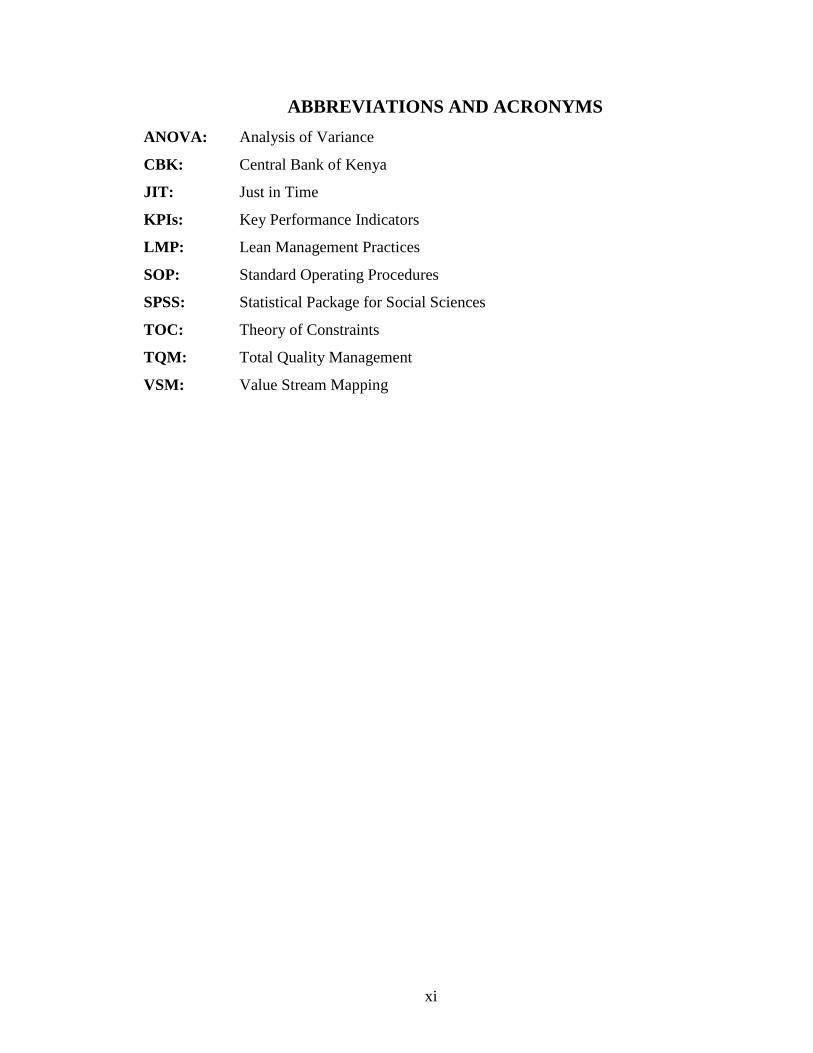
ABBREVIATIONS AND ACRONYMS
ANOVA: Analysis of Variance
CBK: Central Bank of Kenya
JIT: Just in Time
KPIs: Key Performance Indicators
LMP: Lean Management Practices
SOP: Standard Operating Procedures
SPSS: Statistical Package for Social Sciences
TOC: Theory of Constraints
TQM: Total Quality Management
VSM: Value Stream Mapping
xii
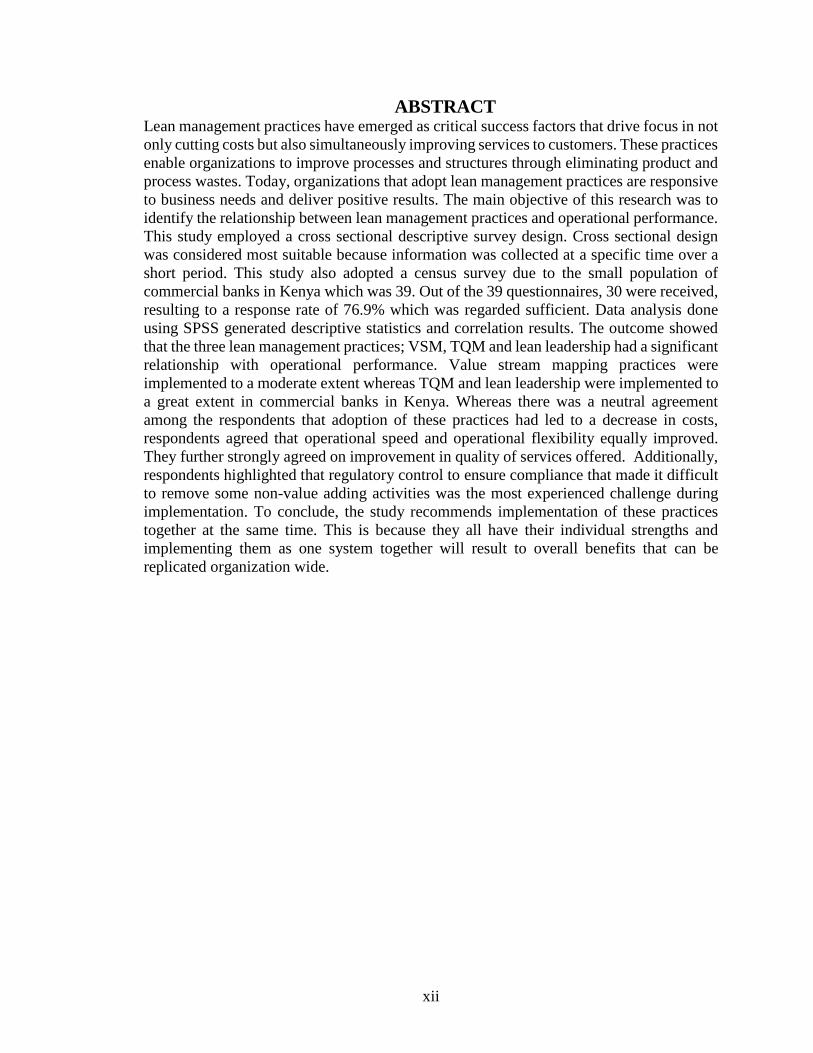
ABSTRACT Lean management practices have emerged as critical success factors that drive focus in not
only cutting costs but also simultaneously improving services to customers. These practices
enable organizations to improve processes and structures through eliminating product and
process wastes. Today, organizations that adopt lean management practices are responsive
to business needs and deliver positive results. The main objective of this research was to
identify the relationship between lean management practices and operational performance.
This study employed a cross sectional descriptive survey design. Cross sectional design
was considered most suitable because information was collected at a specific time over a
short period. This study also adopted a census survey due to the small population of
commercial banks in Kenya which was 39. Out of the 39 questionnaires, 30 were received,
resulting to a response rate of 76.9% which was regarded sufficient. Data analysis done
using SPSS generated descriptive statistics and correlation results. The outcome showed
that the three lean management practices; VSM, TQM and lean leadership had a significant
relationship with operational performance. Value stream mapping practices were
implemented to a moderate extent whereas TQM and lean leadership were implemented to
a great extent in commercial banks in Kenya. Whereas there was a neutral agreement
among the respondents that adoption of these practices had led to a decrease in costs,
respondents agreed that operational speed and operational flexibility equally improved.
They further strongly agreed on improvement in quality of services offered. Additionally,
respondents highlighted that regulatory control to ensure compliance that made it difficult
to remove some non-value adding activities was the most experienced challenge during
implementation. To conclude, the study recommends implementation of these practices
together at the same time. This is because they all have their individual strengths and
implementing them as one system together will result to overall benefits that can be
replicated organization wide.
1
CHAPTER ONE: INTRODUCTION
1.1 Background of the Study
Technological spread, consumer requirements and trade liberalization is what describes the
present business environment. Survival of companies is being continuously tested when
these changes are directed on available limited resources, consumers as well as market
leadership in their spheres of operations. To sustain profitability, managers are taking giant
steps that ensure they are competing well on the local font as well as globally. As they do
so, they are also required to acknowledge that the eventual buildup of a successful
organization broadly relies on the ability to amalgamate the company’s systems and
relations based on lean (Kallrath & Maindl, 2006)
Lean management practices have emerged as critical success factors that drive focus in not
only cutting costs but also simultaneously improving services to customers. Their
application has resulted to several benefits including better quality of services, bigger
market share, increased profit margins, revenue growth and even faster response to the
ever-changing market conditions (Chowdhury, 2013). Companies that make use of lean
management practices are effective in time management since information flows
seamlessly with minimum or zero interruptions (Emiliani, 2006). This plays a major role
in improving operational performance in an organization as it involves the alignment of
business units to ensure they are incorporated in the achievement of the core business goals.
This study was steered by the queuing theory. This theory is applied in the management of
queues and waiting lines (Singh & Sharma, 2009). Its applicability in lean management
ensures identification of improvement opportunities that shorten waiting time and improve
speed of delivery. It is also guided by the theory of constraints (TOC) that focuses on
identifying limiting factors that hinder an organization from achieving a set of performance
goals. This theory when applied in lean management assists in effective identification of
organization’s goal, identification of constraints in the operations, identification of ways
of dealing with them to achieve maximum performance and the development of indicators
to facilitate the improvement of processes (Goldratt & Cox, 2004). The knowledge based
2
view theory recognizes that knowledge is the most vital asset in any company and can be
shared among individuals in an organization to ensure sustainability.
Advancement in financial sector, changing customer demographics combined with
technology are also extensively transforming the banking environment (Grigoroudis,
Politis, & Siskos, 2002). The banking sector has further been tied up by internal and
international regulations that have been relatively slow in improving internal efficiencies.
Today banks have been forced to have an intense understanding of how customers
comprehend value and re-look at the way in which their costs are managed. To be
successful in improving productivity and optimizing costs there needs to be a paradigm
shift in the way their operations are carried out.
1.1.1 Lean Management Practices
Lean is all about making processes and structures better in an organization through eliminating
product and process wastes that consequently reduce costs. Organizations adopt lean
management practices that are responsive to business needs and deliver positive outcomes to
all stakeholders. A lean organization is created when provision of goods and services is
achieved with less resources (Juran & Godfrey, 1998). Customers desire consistent value from
products and services that can result from application of lean management practices supported
by simple tools and processes.
In today’s business environment, lean focuses on value rather than cost issues, which largely
signifies a more strategic and general approach that is less specific and tactical. This therefore
makes the lean concept less dependent on the context and hence suitable for application in
enhancing operational efficiency in both manufacturing and service delivery organizations.
Successful implementation of lean practices like value streaming mapping, total quality
management and lean leadership requires strong management commitment and support
considering that lean is a continuous program that takes time to implement.
Value steam mapping is a lean practice that involves determining the value created within
an organization based on integrated improvements on a process scope that are
progressively added in the final service or product. According to McManus and Millard
3
(2002), value stream mapping reduces waste in processes, and increases efficiency, which
is important in ensuring rapid response to customer needs. It encompasses voice of the
customer tools, lean office and visual management. Total quality management is a
structured way of combining elements of quality and people management. It includes
standardization, operational reviews and problem-solving skills. Lean leadership also
forms part of lean management practices that describes employees working together and
committing to making every day changes towards improvement. Lean leadership involves
making sure that there is long term development of employees in all levels, policy
implementation, improvement in organizational culture as well as appropriate allocation of
resources. Lean management in the banking sector encompasses improvement in the
efficiency of the process, organizational capabilities and performance management as well
as improvement in the behavior and the mindset of the employees.
1.1.2 Operational Performance
Voss, Blackmon, Hanson, and Oak (1995) explain that operational performance indicate
characteristics of an organization’s processes that are measurable such as retaining of market
share, queuing time, turnaround time, cost of service delivery, inventory management and
waste reduction. General measures of operational performance include compliance with
regulations and waste reduction. Neely, Gregory and Platts (2005) indicate that regulatory
performance, efficiency and effectiveness are the also indicators of operational performance.
Madiavale (2016) indicates that the measures of operational performance in the banking
industry include compliance with regulations, efficiency in service delivery, service quality
and efficient resource utilization.
Operational performance impacts key performance indicators (KPIs) in any organization such
as customer service level and net profit. According to Ndubai, Mbeche and Pokhariyal (2016)
operational performance measures such as timeliness, costs, flexibility, efficiency and
effectiveness. Timeliness involves the speed of delivery of products. It suggests the time taken
from request of a service to the actual receipt of it. Customer turnaround time and on time
launch of new products are some of the indicators of speed (Slack 2007). Cost on the other
hand represents the cash obligation to an organization that enables it to carry out its services
4
as well as make a profit from it. Additionally, operational flexibility is also an operational
performance measurement that gives the organization the ability to be versatile. Customers
from time to time require operations to change in a way they are capable to offer volume, mix
or even movement flexibility (Addis & Holbrook, 2001).
Ladhari (2009) describes service quality as a measurement to assess whether the services
delivered to a customer match or exceed their expectations. This can be done through
considering the SERVQUAL model that focus on reliability, tangibility, responsiveness
and assurance quality characteristics. Performance of promised service consistently
denotes reliability quality in a service whereas amenities layout for use by customers
describes tangibility aspect of operational quality (Olsen & Johnson, 2003). Knowledge of
employees that provides them with the capability to feedback on customer queries
demonstrates assurance to the customer (Maylor, 2003). Operational quality is also
indicated by the ability of help customers and promptly offer a service which describes the
responsiveness of service delivery.
1.1.3 Lean Management Practices and Operational Performance
Lean management entails getting rid of waste from processes to boost efficiency. Several
studies have linked lean practices to operational performance (Shah & Ward, 2007). For
instance, according to Radnor, Holweg, and Waring (2012) lean implementation in the
healthcare system has reduced cost, increased flexibility and reduced patient waiting time
through examining the flow of activities and flagging waste.
According to Movahedi, Miri-Lavassani and Kumar (2016) lean encourages on time
product developments. This in turn assists in ensuring availability of products to consumers
that are up to date and fit their requirements. Lean also stimulates utilization of machinery
and equipment that is less capital intensive resulting to less rigidity (Schonberger &
Kopfer, 2008). As a result, product creation and adoption cycles are condensed and
improvement features added in newer product more frequently.
5
1.1.4 Commercial Banks in Kenya
The Companies Act 2015, Banking Amendment Act, 2016, the Central Bank of Kenya
Act1966, and the diverse guiding principles published by CBK govern banks. CBK comes up
with policies, implements them as well as promotes availability of cash, proper functioning of
the financial system and solvency of organizations in Kenya. During the period ended
December 2017, there were 42 commercial banks in Kenya. However, Imperial Bank Limited
was placed under receivership in October 2015. In addition, Chase Bank (K) Limited was
placed under receivership in April 2016 while Charterhouse Bank Limited was placed under-
statutory management in June 2006 (Central Bank of Kenya, 2017).
The banking industry in Kenya has in the last one decade been characterized by profound
changes and transformations. For instance, the CBK introduced legislative reforms aimed at
stabilizing the interest rates, which culminated in the passing of the Banking (Amendment)
Act, 2016. The Act, which came into force with effect from September 2016, imposed limits
on the interest rates chargeable by commercial banks on credit facilities and the rates payable
on customer deposits respectively, with a view to influencing the overall cost of credit and
enhancing access (Central Bank of Kenya, 2017).
These changes, and others, have forced commercial banks to make changes in their business
models from traditional brick and mortar model to technological business models making use
of agency banking, mobile banking, and internet banking among other banking platforms.
These changes according to Kathaara (2014) also enable commercial banks to effectively
identify and manage potential risks, improve efficiency in service delivery, implement
substantial changes to the way services are delivered and concentrate on how these services
can be enhanced in a way that it can increase value to both the customers and the banks.
1.2 Research Problem
Lean practices have facilitated firms to considerably increase their competitive edge
(Ramachandran, 2013). Investment in lean practices has enabled companies to be more
flexible and profitable. According to Ochieng ’ondiek and Kisombe (2013) the most
widespread advantages widely connected to lean practices implementation are lead time
improvement, quality, turnaround time, manufacturing cost coupled up with improvement in
6
labor productivity. Piercy and Rich (2009) registered major improvement in operational
measures through adoption of lean practices in services. Lean practices that can be applied in
service firms such as lean leadership, total quality management and value stream mapping are
same as those adopted by manufacturing firms (Allway & Corbett, 2002)
Commercial banks in Kenya are facing challenges due to stiff competition, influence of
technology and globalization. Due to these challenges, banks have been keen to reduce their
operating costs through options such as downsizing their branch networks, reducing the
number of employees or even relocating call centers overseas. Despite these options having
resulted in huge improvements in their income/cost ratios and their profitability, they do not
guarantee improvement in performance because they are still experiencing challenges in their
processes. Therefore, lean implementation can be considered as a viable and sustainable
solution that might offer sustainable improvements.
Thrulogachantar (2011) conducted a research work on lean and established that lean was
positively linked to performance of the electrical and electronics manufacturing service
companies in Malaysia. In addition, Rahman (2010) in a study on influence of lean tactics and
performance operationally in Thailand discovered that flow management, Just in Time and
waste reduction have a major influence. Furthermore, Panwar, Jain and Rathore (2015)
examined the link between lean practices and OP in India revealed that lean had a positive
connection with measures such as timely deliveries, waste elimination, inventory and cost
reduction.
Wamalwa, Onkware and Musiega (2014) investigated operational performance in Mumias
and concluded that lean manufacturing tools such as mistake proofing, cause and effect
diagram, load balancing as well as takt time have a positive effect on performance. Wafukho
(2011) established that there was improved productivity and effectiveness in service delivery
on implementing lean sigma strategy at GlaxoSmithKline. Yala (2016) also investigated lean
and manufacturing firms’ performance and established demand management, waste
management, cross enterprise collaboration, cultural practices and standardization as the key
lean tools implemented by manufacturing firms in Kenya.
7
In the banking industry, Madiavale (2016) examined how operational performance of
microfinance institutions in Mombasa was impacted by implementation of lean and
established their significant relation on operational KPIs. In addition, Ndaita, Gachie and
Kiveu (2015) examined the concept of lean operations at National Bank of Kenya and found
that their implementation led to cost reduction, error rates reduction and turnaround time
reduction. However, these studies have been limited to microfinance institutions and the
National bank of Kenya as a case study and hence their conclusions cannot be generalized to
the whole sector in Kenya. In addition, these studies did not look at how lean leadership
influences operational performance. Having understood the importance of efficient operations
management in an organization, this study sought to respond to these questions; to what extent
is lean management practiced by banks, what are the effects of lean management to
operational performance and what challenges are faced during adoption of lean management
by commercial banks?
1.3 Research Objectives
This research aims to investigate the relationship between lean management practices and
operational performance of commercial banks.
The specific objectives are:
i. To determine the extent to which lean management is practiced by Commercial
Bank in Kenya.
ii. To establish the effect of lean management on operational performance of
Commercial Banks in Kenya.
iii. To determine challenges faced in the implementation of lean management by
Commercial Banks in Kenya.
1.4 Value of the Study
This research elaborates how various lean management practices influence operational
performance in the banking industry. Commercial bank managers and decision makers would
use this study as a basis of making informed decisions especially those involving reducing
costs in their end-to-end processes.
8
This study makes a great contribution to theories related to LMP in banks. The three theories
of the study; knowledge based view, queuing theory and theory of constraints (TOC), mainly
focus on the production processes in manufacturing industries. This study provided
information on how these theories would be applied in the services industries, and more
specifically in the banking industry. Other researchers and academicians conducting studies
on lean management practices in the service industry can obtain research material that can be
used as empirical literature.
Government institutions such as Central Bank of Kenya (CBK) and policy makers in
government can formulate policies and to identify opportunities derived from implementing
lean practices that they can replicate in government practices. The study has added more
information to the already existing knowledge on lean management practices application
among commercial banks.
9
CHAPTER TWO: LITERATURE REVIEW
2.1 Introduction
A review of the literature on the relationship between lean management practices and OP
is covered in this chapter. Specifically, this chapter covers theoretical review, lean
management practices and operational performance, empirical review as well as the
conceptual framework.
2.2 Theoretical Foundation of the Study
Lean practices are components of lean systems with underlying theories that enable
organizations to influence its operations. According to Westbrook (1995) operations
management academics need to embrace the relationship between theory and practice in order
to show its influence in the achievement of competitive advantage. The theories linked to lean
implementation and performance of commercial banks includes queuing theory, theory of
constraints and knowledge based view theory.
2.2.1 Queuing Theory
Demand for a service in a service organization is mostly unpredictable and often depends on
the date of the month, which day of the week it is, or even the time of the day. Many service
companies such as hotels and hospitals require daily work scheduling to deliver the service
when demanded. This is because poor staff-customer scheduling results in waste in the form
of long customer waiting long times, loss of productivity, and consequently, waiting cost
(chowdhury, 2013). Operations managers need to recognize peak times and non-peak cycles
to settle on the staffing requirements putting into consideration variability in demand levels
from past or real-time data. Using queuing theory and a control system that can simulate the
system ensures close monitoring to enable model and analyze a real-time queuing situation,
consider scheduling options and the matching the level of service being offered to provide a
superior scheduling combination based on the desired service level.
Extension of the applicability of the queuing theory to the service sector has enabled banks
identify improvement opportunities through shortening the waiting experience in the banking
industry, provide better understanding into service system in congestion analysis and resource
10
planning and explore the automated queuing system where customers are served on first in
first out basis (Mital, 2010). Kamau (2014) indicates that queuing significantly influences
customer satisfaction and hence loyalty. ‘When the queues are long in the banking halls
customers get disgruntled and upset for their lost time. Some of the commercial banks in
Kenya have adopted queue management systems that provide information to the customers
on the approximate duration of waiting and the number of people ahead of them.
2.2.2 Knowledge Based View
This theory considers knowledge as a principle asset in an organization Thompson and
Walsham (2004), knowledge in an organization can be found in different areas including
records, documents, policies, standards, procedures as well as the untapped tacit expertise and
experience of individual employees. Knowledge is used in an organization to improve service
delivery. It can be demonstrated in many forms and transferred from one person to another
within and outside the organization hence ensuring continuity and continuous improvement.
According to Madiavale (2016) knowledge management simplifies decision making by
providing managers with the data needed to come up with better, more up to date high-quality
resolutions that are beneficial to their organization. It also helps them put together a learning
organization by making learning routine with continuous improvement through critical
reviewing of tasks, identifying successes and failures and documenting them for future
reference.
Jayaram and Xu (2016) further alludes that knowledge management encourages a change of
culture that is open to managers sharing ideas and insight that could be sources of innovations.
Through the implementation of knowledge based view theory, employee-training gaps can be
identified. Managers in turn use these gaps to come up with training programs specific to each
employee’s job and linked to the overall direction and key priorities of the company. This is
in line with lean leadership that focuses on leadership development.
Knowledge based view theory was relevant in this study as it highlights the role of continuous
learning in ensuring operational performance. By using lean leadership, organizations use
available knowledge to improve processes used in service delivery. This in turn leads to an
11
improvement in efficiency, cost reduction, effectiveness and reliability of services. In
addition, the application of value stream mapping, total quality management and lean
leadership requires knowledge and experience.
2.2.3 Theory of Constraints
This theory involves recognizing constraints and coming up with ways to manage them with
an aim to improve organizational performance. TOC is based on the principle organizations
constantly face constraints that restrict the achievement of higher performance levels. This
theory therefore focuses on identifying the most limiting factors that hinder an organization
from achieving a set of objectives and then improving them until they are no longer limiting
(Goldratt & Cox, 2004).
To facilitate process improvements, the theory of constraints outlines concepts applicable to
effectively identify key priorities in an organization, establish the constraints to achieving
targeted performance on the performance indicators that directly link to the key priorities, and
develop practical ways of cascading and measuring to facilitate process improvements and
bring visibility on performance. Identification of constraints in banks can be done through
three TOC set of measurements; throughput, operating expense and inventory. Unlike
manufacturing where constraints would be found in capacity or equipment, constraints in
service companies are commonly found in policies and procedures. The TOC can be effective
where a well laid out standardized process is established which can clearly reveal problem
areas common to employees in the organization (Jaideep, Hung & Manu, 1996).
In this study, the theory of constraints was used to show the connection between lean
management and operational performance. The theory of constraints involves identification
of constraints in service delivery processes. These constraints mainly include slow machines
and movement from one office to another seeking approval when servicing customers. These
constraints may negatively influence cost of delivery and waiting time for each customer.
However, putting into practice lean management practices would improve on material flow
between tellers and managers and hence reduce movement from one office to another when
serving a customer.
12
2.3 Elements of Lean Management
Lean management practices bring together several elements to form a unified whole, which
aligns the various parts of an organization to make a change of great magnitude (Hult,
Ketchen, Cavusgil & Calantone, 2006). They comprise, a plan reliant on a group of
practices to be implemented and lean thinking ways of working, that focus on reducing
costs both internally as well as outside the company (Magu, 2015). The elements of lean
management used in this study are discussed in the following subsections.
2.3.1 Value Stream Mapping
This is a lean practice that enables organizations document a process in a way that will help
set up and execute the transformation necessary to attain a seamless flow with less
resources. It comprises documenting a process flow with symbols of both materials and
information movements inside a facility. The existing state map signifies the current
situation, whereas the second one represents the ideal pull service delivery system that is
meant to be adopted (Bonaccorsi, Carmignani & Zammori, 2011).
The value stream mapping approach is superior to other mapping techniques because it
implements a structured way of visualizing a process to communicate priorities of an
organization, identify type of waste and document the relationship between the actual step
by step processes and the documented governing policies used to oversee these processes.
It is a process that involves employees at different levels of the organization through a
methodology that makes it easier to quickly identify areas with waste in a snapshot (Ali &
Schneider, 2003). Employees are therefore tasked to identify activities to be removed so as
to optimize the flow (Tapping & Shuker, 2003). Of importance to note however is the fact
that before the mapping is done, data is collected from various departments including
customers in form of customer feedback, complaints and suggestions and this forms a
fundamental input into this whole process.
2.3.2 Total Quality Management
This practice entails the application of excellent management practices that involve people,
systems and their interaction with different departments’ end to end flows. TQM require
13
organizations to develop operational processes with the customer in mind and at the same
time commit their resources in positioning themselves to meeting their customers’
expectation profitably.
The adoption of the total quality management approach is to ensure that quality is managed
in the different functional areas of operation without giving room for mistakes in other
functional processes. This can be done through people which are a central part of TQM.
Top management commitment and employee involvement are facets of TQM that have a
bigger bearing to the success of an organization (Singh & Dhalla, 2010). While this cover
the organization internally, external collaboration with third parties such as suppliers is
also integral to TQM. Moreover, continuous improvement that strives to ensure that an
organization makes continuous small improvements every day is also a fundamental
quality philosophy.
2.3.3 Lean Leadership
This is a systematic practice meant for sustainable application and day to day advancement
of lean implementation (Dombrowski & Mielke, 2013) It describes teaming up all
employees in running the day to day operations of their organizations. This includes a focus
on the customer needs in all the processes coupled up with employees and leaders long
term development. Improvement culture is a fundamental principle under lean leadership
that requires leaders to constantly challenge the current processes to improve them. Lean
leaders need to pick employees’ ideas and apply them in their organizations.
In self-development, a teacher or a mentor is the guide for both leaders and workers. In
most cases, short term courses are used to achieve constant self-development. Apart from
self-development, use of every day coaching can be applied by lean leaders to develop
others as well (Krijnen, 2007). Employees qualifications is an important requirement as it
enables staff to take part in the small improvement initiatives for processes in the
organization that goes along with continuous development of employees and leaders.
Qualification is not restricted to level of education, but it also incorporates knowledge and
skills in specific areas.
14
Most of the learning and coaching in lean leadership happens every day and takes place
where the actual job happens such as at the shop floor. Strategy deployment is also part of
lean leadership that focuses the continuous improvement activities of each team cascaded
at different levels that are reviewed in weekly and monthly meetings to ensure that
improvement actions are tracked and moving in the right direction. Through this, all the
team members become aligned and involved in the achievement of the big picture
(Dombrowski, Mielke & Schulze, 2011).
2.4 Challenges Faced in Implementation of Lean Management Practices
The principles from lean manufacturing are practically applicable to the service sector
however lean implementation in services needs to be done differently because of the
context under which service processes function. Preceding studies highlight a range of
challenges in implementation of lean management practices. For example, according to to
Seidel, Saurin, Marodin and Ribeiro (2017), resistance to change is a significant factor
impacting lean implementation in companies. This is mostly due to improper change
management techniques and inability to shift corporate culture to implement new tools.
This forces organizations to ensure that managers are visible and directly connected to the
new structures that enable active participation of all involved employees (Chauhan &
Singh, 2012)
In manufacturing, outlining value in a process may be straightforward to achieve (Young
& McClean, 2008). Conversely, nature of the service processes makes it cumbersome to
easily determine the customer needs. Multi-site companies such as banks additionally find
it difficult to deploy lean practices in all branches due to complexity in monitoring and
controlling the progress achieved in each branch.
Financial ability amidst cost cutting measures adopted by companies is also another
challenge. Funding is important to take care of expenses such as material resources, human
resources, technical utilities, consulting and employee training which all vital elements for
lean implementation (Achanga, Shehab, Roy & Nelder 2006), Moreover, variability of
15
services has forced organizations to adopt agile thinking as a solution to deal with the
customer demand variability challenge (Hines & Rich, 2004).
2.5 Empirical Review
Leadership of an organization have their interests on sustainable performance of the
organization which can be accomplished through implementation of LMP. Organizations that
put in place efficient and effective implementation programs enable its employees and its
customers to easily adopt to change and embrace lean tools. Pratanna (2015) examined how
hospitals in Thailand have adopted lean management practices such as continuous
improvement (kaizen). The paper investigated lean and organizational commitment in the
medical sector. The results indicated that the necessary resources of operational performance
in a healthcare setting include human resource management, a focus on patient movement
from one stage to another and social capital.
Wamalwa, Onkware and Musiega (2014) investigated on operational performance and
concluded that lean manufacturing has a definite outcome on manufacturing performance.
Yala (2016) further investigated the lean supply chain management and established demand
management, waste management, cross enterprise collaboration, cultural practices and
standardization as the key lean tools implemented by manufacturing firms in Kenya.
Ahlstrom (2004) analyzed the relevance of lean management practices in the service industry.
The research indicated the tenets of lean practices that can be incorporated in the service
industry to improve its performance. Nonetheless, Ahlstrom (2004) indicated that without
adequate allocation of resources and proper implementation the benefits cannot be realized.
This empirical literature review shows that lean practices can be well executed in service
organizations to improve performance. However, their application to the entire organization
and effect on an organization’s performance has not been clearly outlined. This study therefore
sought to assess the application of lean management practices in commercial banks in Kenya
and its effect on operational measures.
16
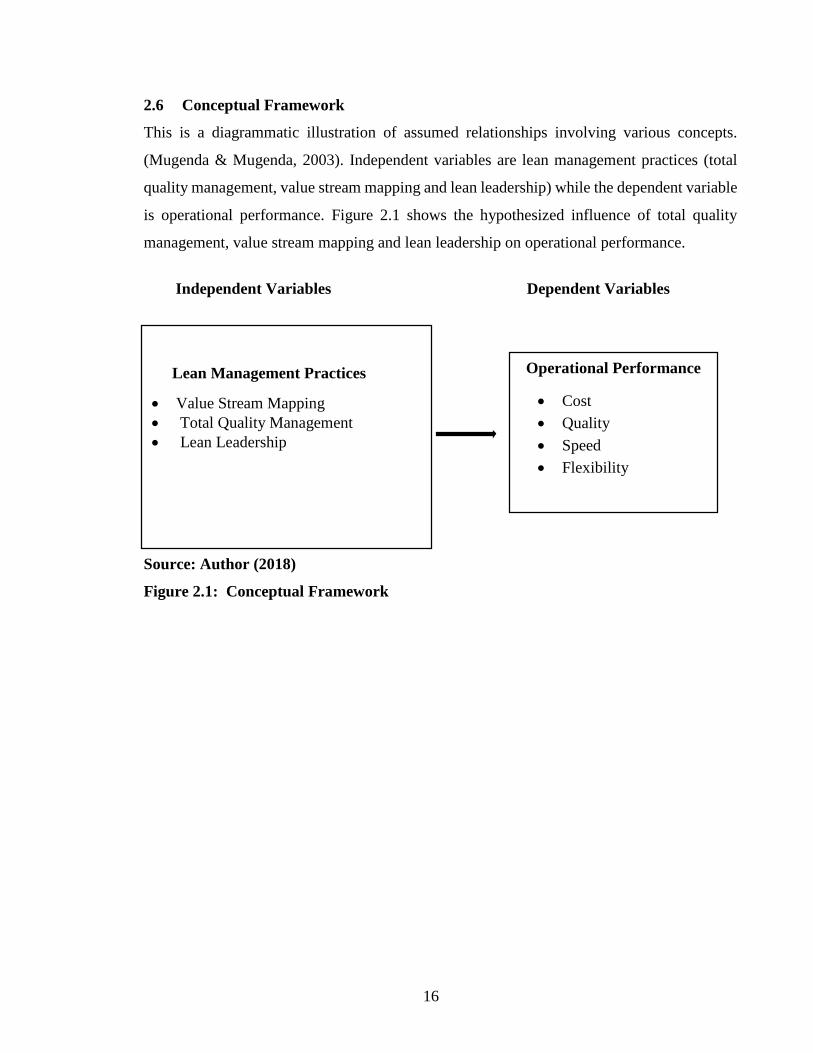
2.6 Conceptual Framework
This is a diagrammatic illustration of assumed relationships involving various concepts.
(Mugenda & Mugenda, 2003). Independent variables are lean management practices (total
quality management, value stream mapping and lean leadership) while the dependent variable
is operational performance. Figure 2.1 shows the hypothesized influence of total quality
management, value stream mapping and lean leadership on operational performance.
Independent Variables Dependent Variables
Source: Author (2018)
Figure 2.1: Conceptual Framework
Operational Performance
Cost
Quality
Speed
Flexibility
Lean Management Practices
Value Stream Mapping
Total Quality Management
Lean Leadership
17
CHAPTER THREE: RESEARCH METHODOLOGY
3.1 Introduction
This chapter outlines the methodology that was considered in carrying out the study.
It encompasses the research design, population of the study, data collection and data
analysis.
3.2 Research Design
This study made use of a cross sectional research design. This is because this design
involves obtaining information about the status of a given phenomenon to provide a
detailed description on the existing conditions and variables under study without making
any change in the variables (Creswell, 2014). Descriptive research design tends to give
explanation on the status of the phenomenon.
3.3 Population of the Study
Total count of all commercial banks operating in Kenya as at December 2017 was 42.
However, three commercial banks were excluded. Imperial Bank Limited and Chase Bank
(K) Limited are under receivership and Charterhouse Bank Limited is under-statutory
management. Therefore, 39 commercial banks were targeted for the study. A census was
conducted since the population is small.
3.4 Data Collection
The study made use of primary data collected from operation managers or their equivalents
in the 39 commercial banks through closed ended questionnaires. Sections in the
questionnaires included; section A that comprised of demographics, section B lean
management practices, section C operational performance and section D challenges faced
during implementation of lean management practices.
18
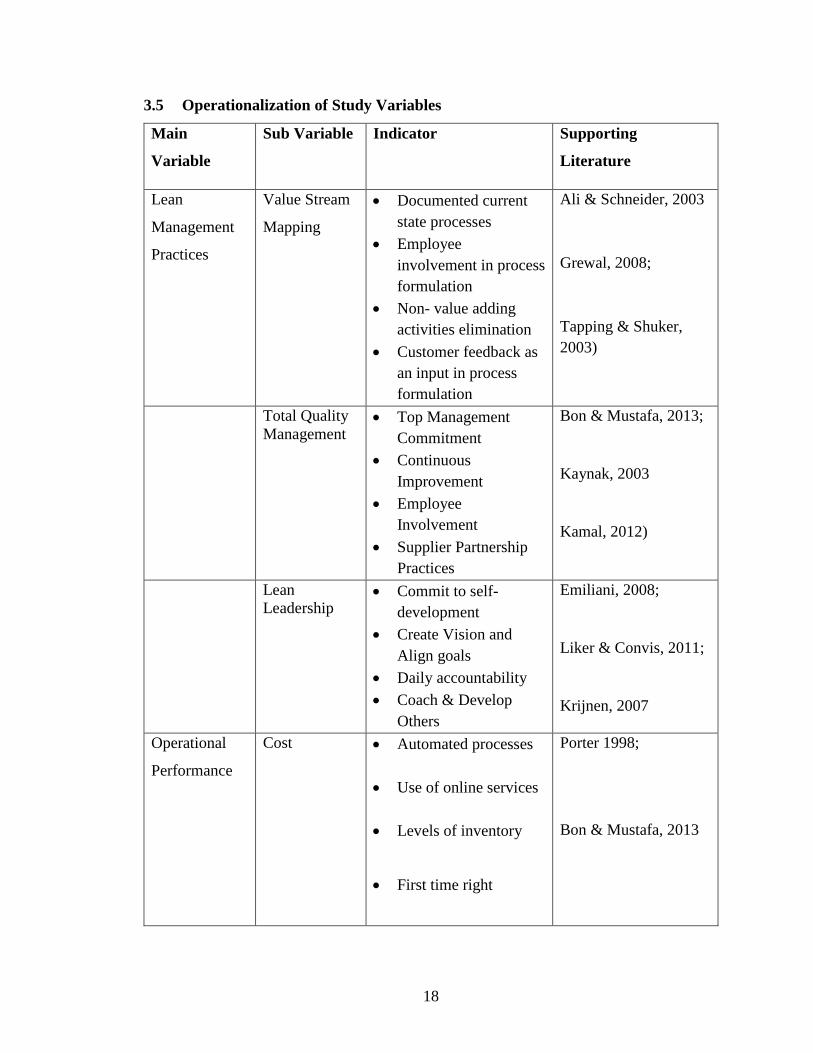
3.5 Operationalization of Study Variables
Main
Variable
Sub Variable Indicator Supporting
Literature
Lean
Management
Practices
Value Stream
Mapping
Documented current
state processes
Employee
involvement in process
formulation
Non- value adding
activities elimination
Customer feedback as
an input in process
formulation
Ali & Schneider, 2003
Grewal, 2008;
Tapping & Shuker,
2003)
Total Quality
Management Top Management
Commitment
Continuous
Improvement
Employee
Involvement
Supplier Partnership
Practices
Bon & Mustafa, 2013;
Kaynak, 2003
Kamal, 2012)
Lean
Leadership Commit to self-
development
Create Vision and
Align goals
Daily accountability
Coach & Develop
Others
Emiliani, 2008;
Liker & Convis, 2011;
Krijnen, 2007
Operational
Performance
Cost Automated processes
Use of online services
Levels of inventory
First time right
Porter 1998;
Bon & Mustafa, 2013
19
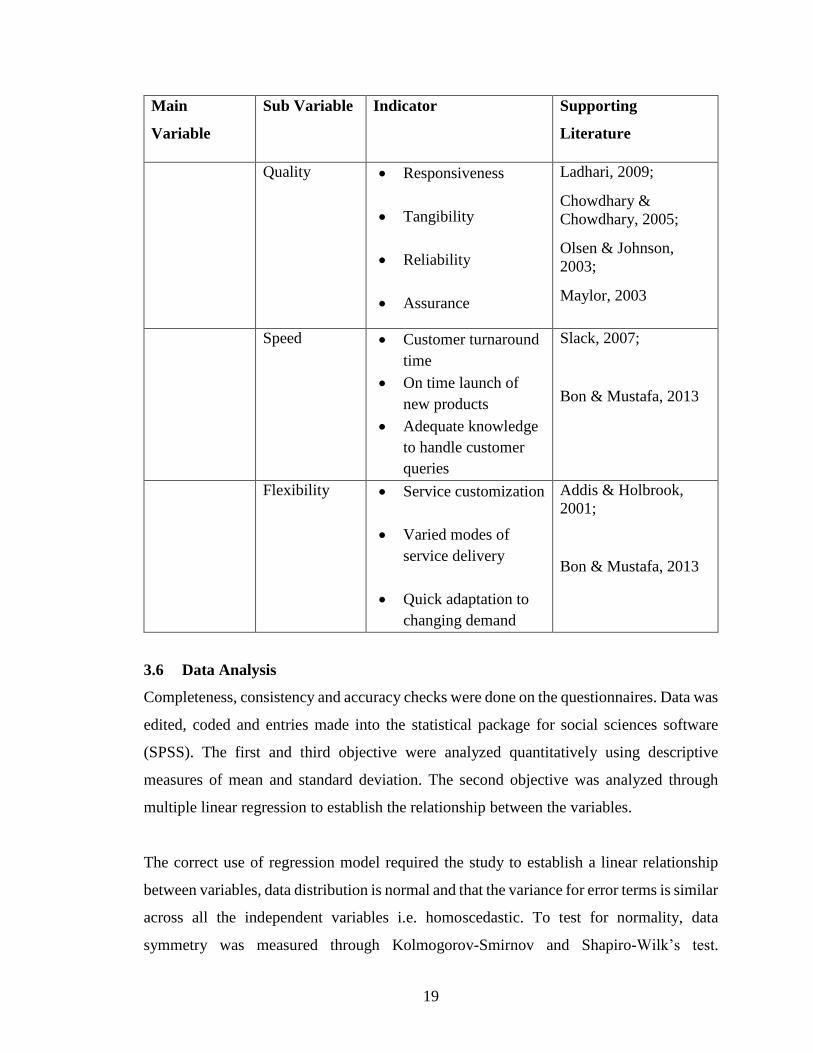
Main
Variable
Sub Variable Indicator Supporting
Literature
Quality Responsiveness
Tangibility
Reliability
Assurance
Ladhari, 2009;
Chowdhary &
Chowdhary, 2005;
Olsen & Johnson,
2003;
Maylor, 2003
Speed Customer turnaround
time
On time launch of
new products
Adequate knowledge
to handle customer
queries
Slack, 2007;
Bon & Mustafa, 2013
Flexibility Service customization
Varied modes of
service delivery
Quick adaptation to
changing demand
Addis & Holbrook,
2001;
Bon & Mustafa, 2013
3.6 Data Analysis
Completeness, consistency and accuracy checks were done on the questionnaires. Data was
edited, coded and entries made into the statistical package for social sciences software
(SPSS). The first and third objective were analyzed quantitatively using descriptive
measures of mean and standard deviation. The second objective was analyzed through
multiple linear regression to establish the relationship between the variables.
The correct use of regression model required the study to establish a linear relationship
between variables, data distribution is normal and that the variance for error terms is similar
across all the independent variables i.e. homoscedastic. To test for normality, data
symmetry was measured through Kolmogorov-Smirnov and Shapiro-Wilk’s test.
20
Homoscedasticity assumption was checked through Koenker test to ascertain if the
variance of errors is the equal in all levels of the independent variables. Additionally,
multicollinearity was tested through getting the variance inflation factor (VIF). Durbin
Watson test was applied to test for autocorrelation for each model.
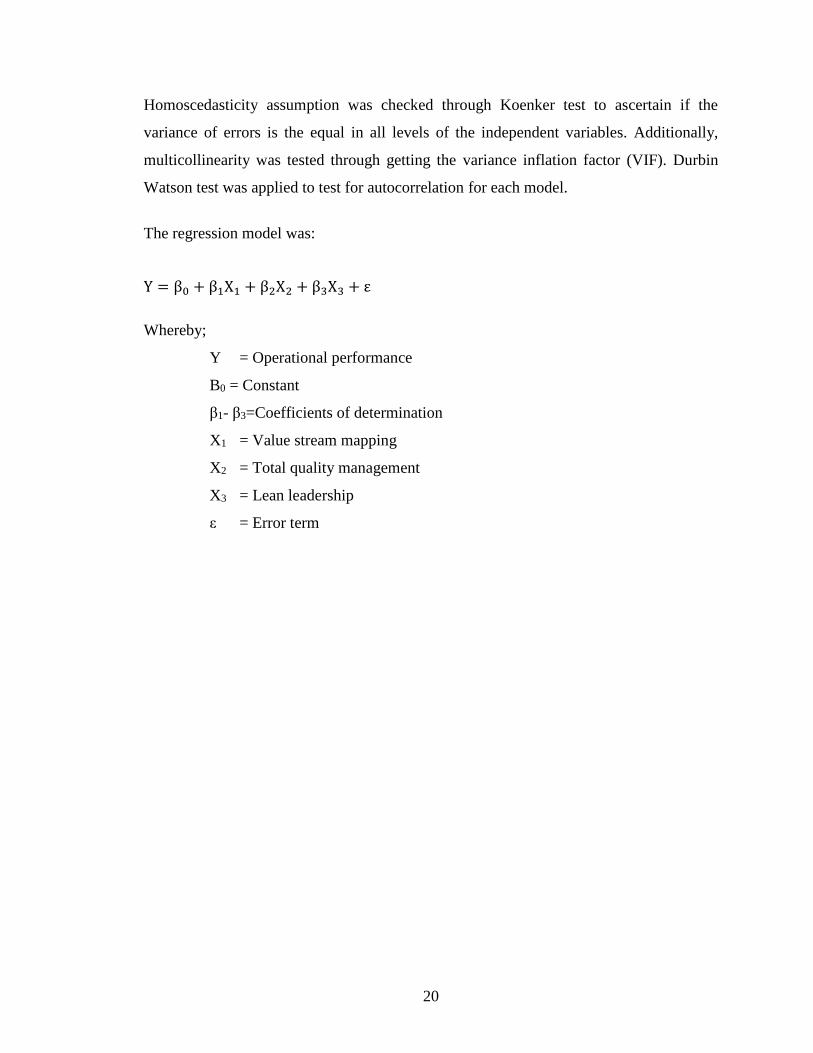
The regression model was:
Y = β0 + β1X1 + β2X2 + β3X3 + ε
Whereby;
Y = Operational performance
B0 = Constant
β1- β3=Coefficients of determination
X1 = Value stream mapping
X2 = Total quality management
X3 = Lean leadership
ε = Error term
21
CHAPTER FOUR: DATA ANALYSIS, RESULTS AND
INTERPRETATION
4.1 Introduction
This chapter focused on analysis of the data, interpretation and presentation of findings.
The chapter began by looking at the demographics. Afterwards, analysis of the extent of
adoption of lean management practices by commercial banks was done, impact on
operational performance and finally challenges faced during adoption.
4.2 Demographic Information
This study was a census survey of 39 commercial banks. To collect data, 39 questionnaires
were issued out to be completed by one respondent in each bank. Out of the 39
questionnaires, 30 were received and analyzed. This represents 76.9% response rate and
implies that the response rate obtained was adequate and enabled generalization of the
findings. A response rate of above 65% is sufficient (Mugenda & Mugenda,2003). The
demographic summary was discussed in following sub sections.
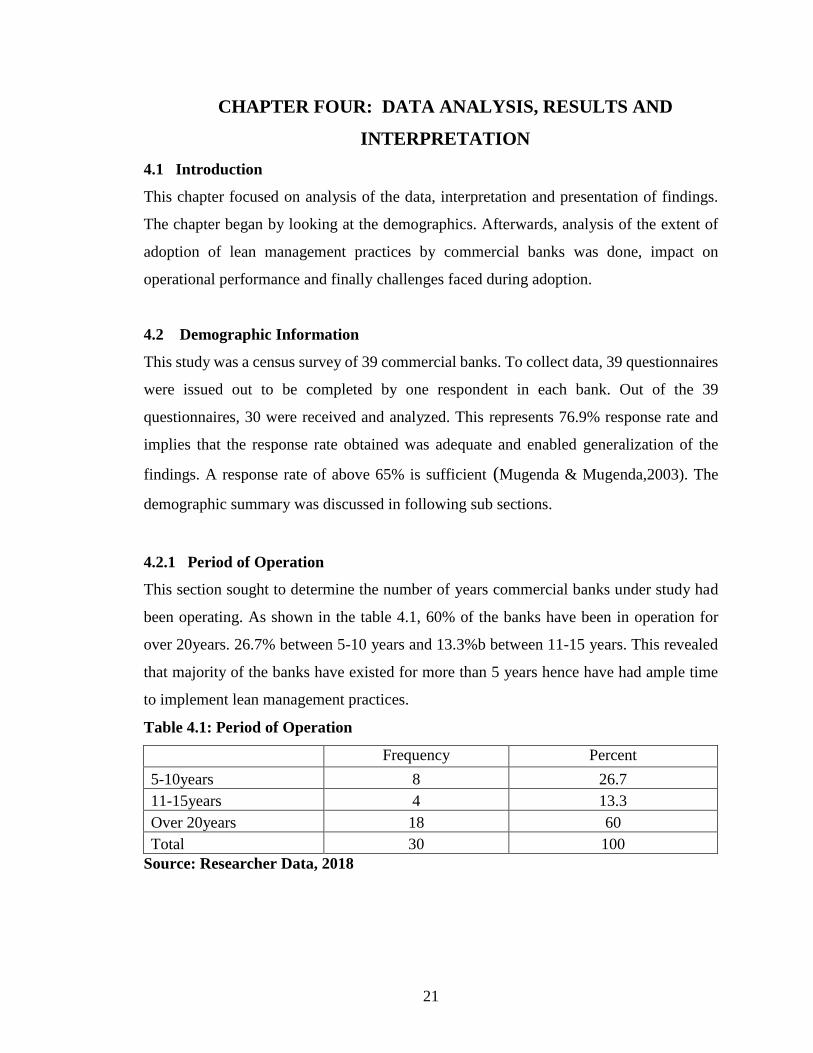
4.2.1 Period of Operation
This section sought to determine the number of years commercial banks under study had
been operating. As shown in the table 4.1, 60% of the banks have been in operation for
over 20years. 26.7% between 5-10 years and 13.3%b between 11-15 years. This revealed
that majority of the banks have existed for more than 5 years hence have had ample time
to implement lean management practices.
Table 4.1: Period of Operation
Frequency Percent
5-10years 8 26.7
11-15years 4 13.3
Over 20years 18 60
Total 30 100
Source: Researcher Data, 2018
22
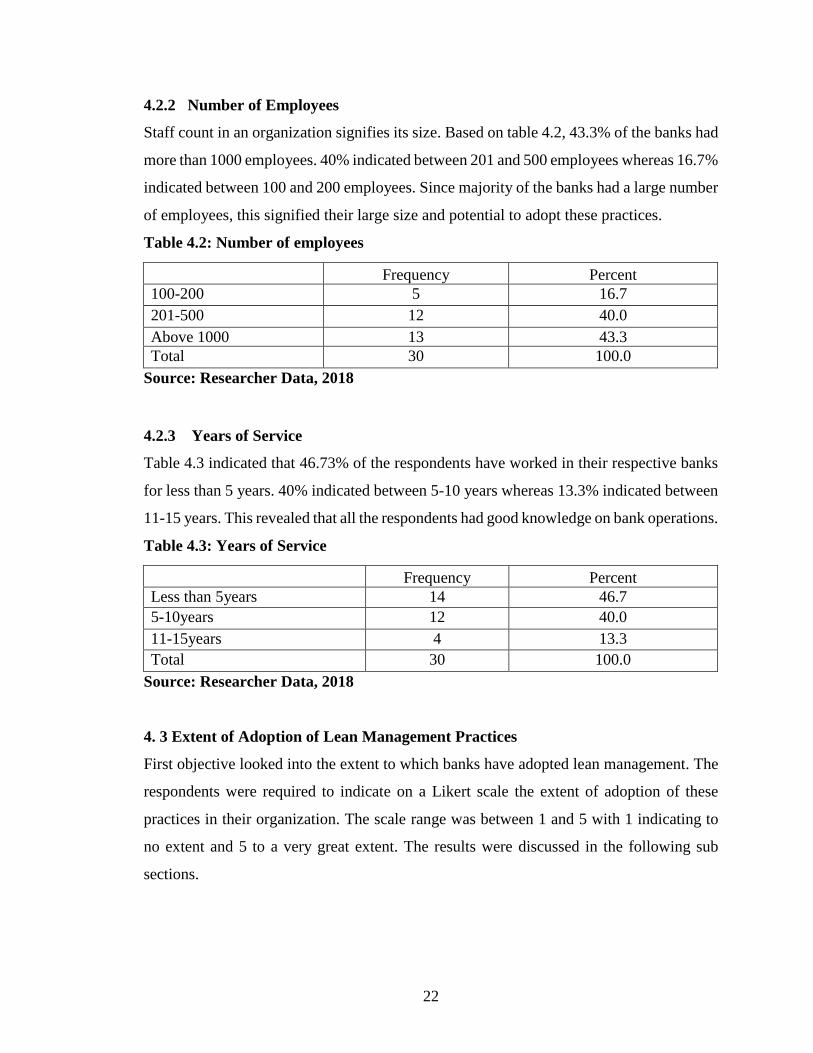
4.2.2 Number of Employees
Staff count in an organization signifies its size. Based on table 4.2, 43.3% of the banks had
more than 1000 employees. 40% indicated between 201 and 500 employees whereas 16.7%
indicated between 100 and 200 employees. Since majority of the banks had a large number
of employees, this signified their large size and potential to adopt these practices.
Table 4.2: Number of employees
Frequency Percent
100-200 5 16.7
201-500 12 40.0
Above 1000 13 43.3
Total 30 100.0
Source: Researcher Data, 2018
4.2.3 Years of Service
Table 4.3 indicated that 46.73% of the respondents have worked in their respective banks
for less than 5 years. 40% indicated between 5-10 years whereas 13.3% indicated between
11-15 years. This revealed that all the respondents had good knowledge on bank operations.
Table 4.3: Years of Service
Frequency Percent
Less than 5years 14 46.7
5-10years 12 40.0
11-15years 4 13.3
Total 30 100.0
Source: Researcher Data, 2018
4. 3 Extent of Adoption of Lean Management Practices
First objective looked into the extent to which banks have adopted lean management. The
respondents were required to indicate on a Likert scale the extent of adoption of these
practices in their organization. The scale range was between 1 and 5 with 1 indicating to
no extent and 5 to a very great extent. The results were discussed in the following sub
sections.
23
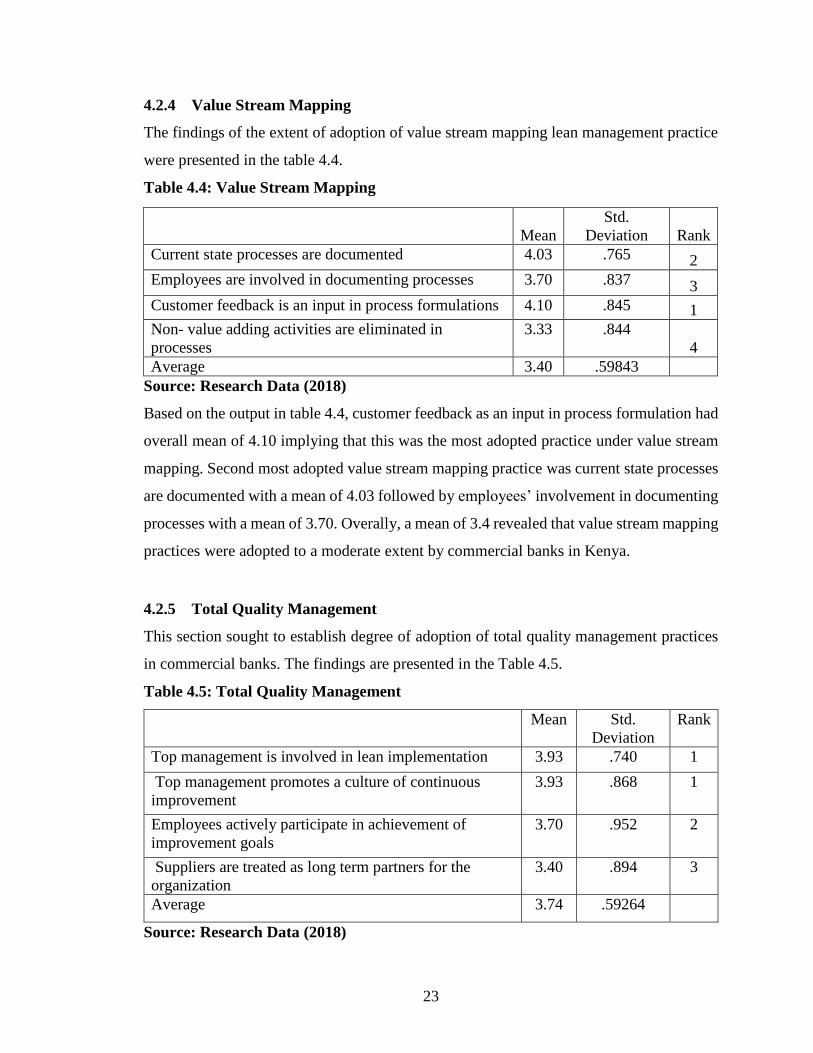
4.2.4 Value Stream Mapping
The findings of the extent of adoption of value stream mapping lean management practice
were presented in the table 4.4.
Table 4.4: Value Stream Mapping
Mean
Std.
Deviation Rank
Current state processes are documented 4.03 .765 2
Employees are involved in documenting processes 3.70 .837 3
Customer feedback is an input in process formulations 4.10 .845 1
Non- value adding activities are eliminated in
processes
3.33 .844
4
Average 3.40 .59843
Source: Research Data (2018)
Based on the output in table 4.4, customer feedback as an input in process formulation had
overall mean of 4.10 implying that this was the most adopted practice under value stream
mapping. Second most adopted value stream mapping practice was current state processes
are documented with a mean of 4.03 followed by employees’ involvement in documenting
processes with a mean of 3.70. Overally, a mean of 3.4 revealed that value stream mapping
practices were adopted to a moderate extent by commercial banks in Kenya.
4.2.5 Total Quality Management
This section sought to establish degree of adoption of total quality management practices
in commercial banks. The findings are presented in the Table 4.5.
Table 4.5: Total Quality Management
Mean Std.
Deviation
Rank
Top management is involved in lean implementation 3.93 .740 1
Top management promotes a culture of continuous
improvement
3.93 .868 1
Employees actively participate in achievement of
improvement goals
3.70 .952 2
Suppliers are treated as long term partners for the
organization
3.40 .894 3
Average 3.74 .59264
Source: Research Data (2018)
24
The study established that top management involvement in lean implementation and
promotion of continuous improvement culture by top management were the most adopted
practices under total quality management with a mean tie of 3.93. This was closely
followed by employee’s actively participating in the achievement of improvement goals
with a mean of 3.70 and suppliers being treated as long term partners for the organization
with a mean of 3.40. Overall results revealed a mean of 3.74 denoting that total quality
management practices are adopted to a great extent by commercial banks in Kenya.
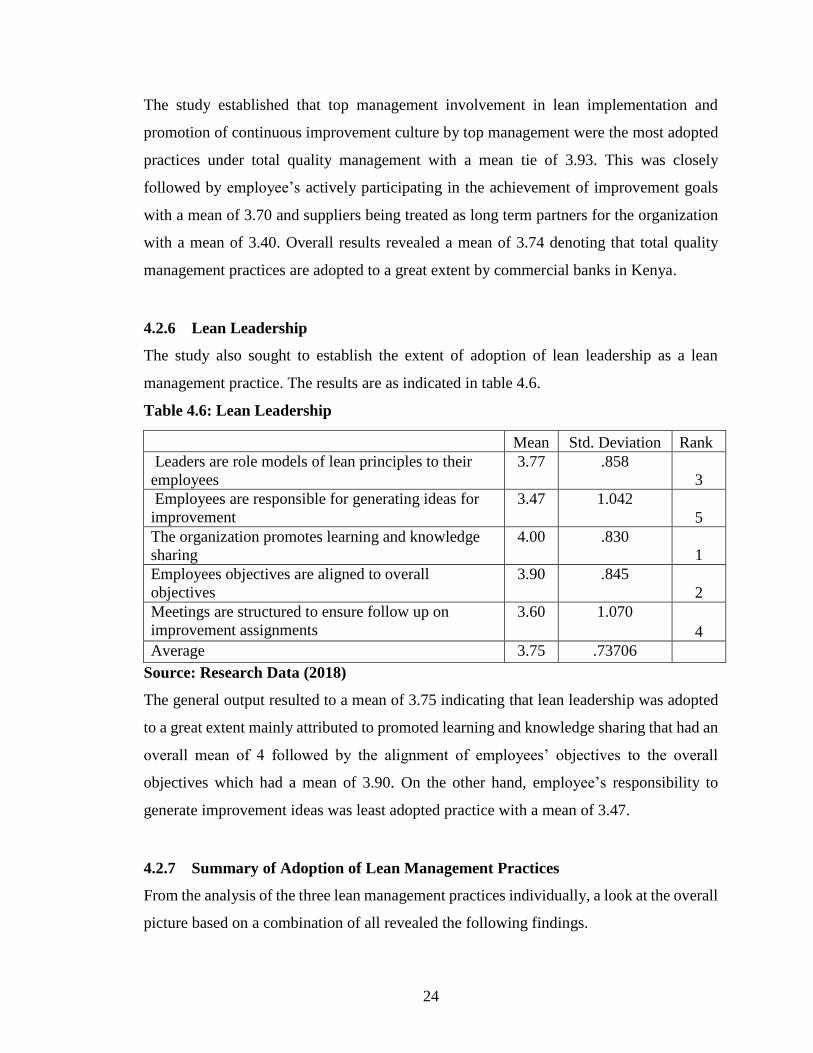
4.2.6 Lean Leadership
The study also sought to establish the extent of adoption of lean leadership as a lean
management practice. The results are as indicated in table 4.6.
Table 4.6: Lean Leadership
Mean Std. Deviation Rank
Leaders are role models of lean principles to their
employees
3.77 .858
3
Employees are responsible for generating ideas for
improvement
3.47 1.042
5
The organization promotes learning and knowledge
sharing
4.00 .830
1
Employees objectives are aligned to overall
objectives
3.90 .845
2
Meetings are structured to ensure follow up on
improvement assignments
3.60 1.070
4
Average 3.75 .73706
Source: Research Data (2018)
The general output resulted to a mean of 3.75 indicating that lean leadership was adopted
to a great extent mainly attributed to promoted learning and knowledge sharing that had an
overall mean of 4 followed by the alignment of employees’ objectives to the overall
objectives which had a mean of 3.90. On the other hand, employee’s responsibility to
generate improvement ideas was least adopted practice with a mean of 3.47.
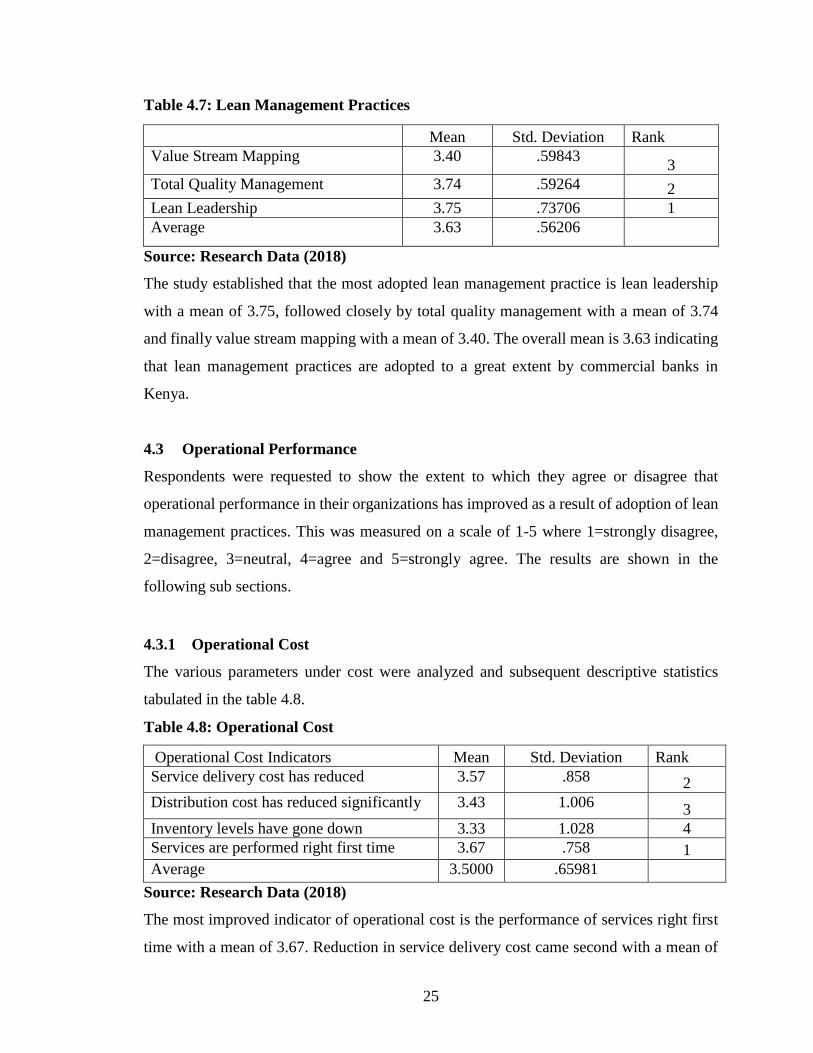
4.2.7 Summary of Adoption of Lean Management Practices
From the analysis of the three lean management practices individually, a look at the overall
picture based on a combination of all revealed the following findings.
25
Table 4.7: Lean Management Practices
Mean Std. Deviation Rank
Value Stream Mapping 3.40 .59843 3
Total Quality Management 3.74 .59264 2
Lean Leadership 3.75 .73706 1
Average 3.63 .56206
Source: Research Data (2018)
The study established that the most adopted lean management practice is lean leadership
with a mean of 3.75, followed closely by total quality management with a mean of 3.74
and finally value stream mapping with a mean of 3.40. The overall mean is 3.63 indicating
that lean management practices are adopted to a great extent by commercial banks in
Kenya.
4.3 Operational Performance
Respondents were requested to show the extent to which they agree or disagree that
operational performance in their organizations has improved as a result of adoption of lean
management practices. This was measured on a scale of 1-5 where 1=strongly disagree,
2=disagree, 3=neutral, 4=agree and 5=strongly agree. The results are shown in the
following sub sections.
4.3.1 Operational Cost
The various parameters under cost were analyzed and subsequent descriptive statistics
tabulated in the table 4.8.
Table 4.8: Operational Cost
Operational Cost Indicators Mean Std. Deviation Rank
Service delivery cost has reduced 3.57 .858 2
Distribution cost has reduced significantly 3.43 1.006 3
Inventory levels have gone down 3.33 1.028 4
Services are performed right first time 3.67 .758 1
Average 3.5000 .65981
Source: Research Data (2018)
The most improved indicator of operational cost is the performance of services right first
time with a mean of 3.67. Reduction in service delivery cost came second with a mean of
26
3.57 followed by significant reduction in distribution cost that had a mean of 3.43. The
overall mean of 3.5 signified that respondents had a neutral agreement on cost
improvement.
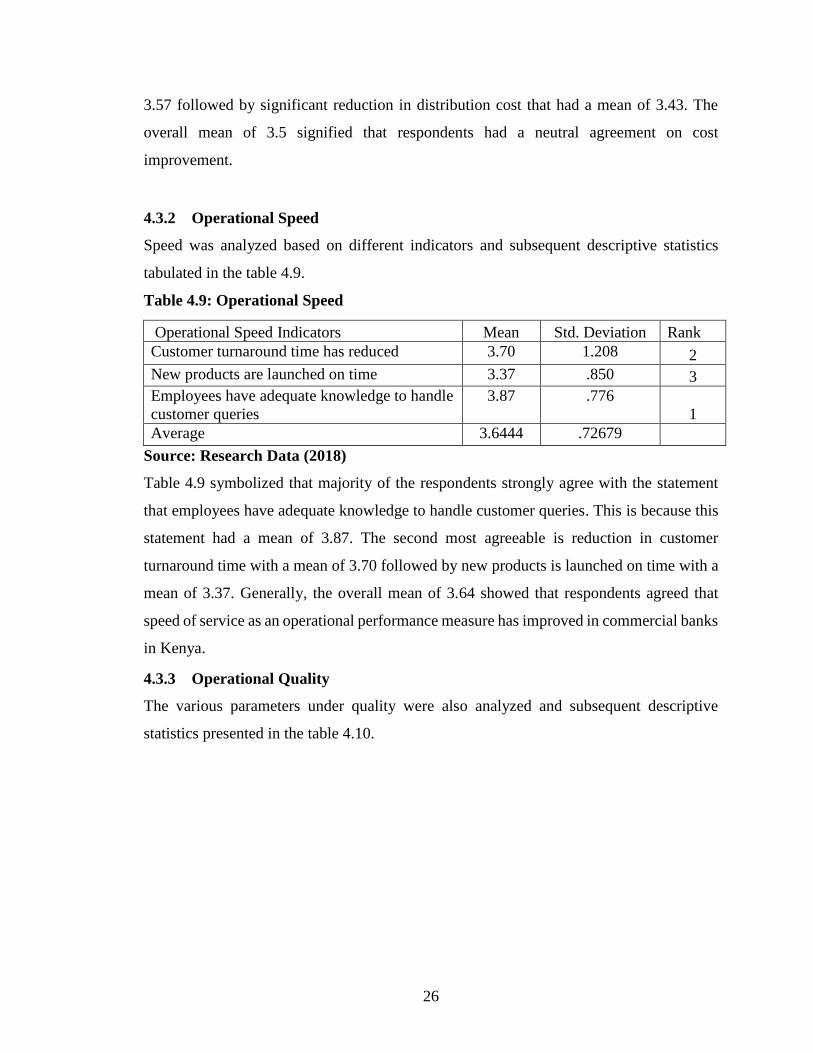
4.3.2 Operational Speed
Speed was analyzed based on different indicators and subsequent descriptive statistics
tabulated in the table 4.9.
Table 4.9: Operational Speed
Operational Speed Indicators Mean Std. Deviation Rank
Customer turnaround time has reduced 3.70 1.208 2
New products are launched on time 3.37 .850 3
Employees have adequate knowledge to handle
customer queries
3.87 .776
1
Average 3.6444 .72679
Source: Research Data (2018)
Table 4.9 symbolized that majority of the respondents strongly agree with the statement
that employees have adequate knowledge to handle customer queries. This is because this
statement had a mean of 3.87. The second most agreeable is reduction in customer
turnaround time with a mean of 3.70 followed by new products is launched on time with a
mean of 3.37. Generally, the overall mean of 3.64 showed that respondents agreed that
speed of service as an operational performance measure has improved in commercial banks
in Kenya.
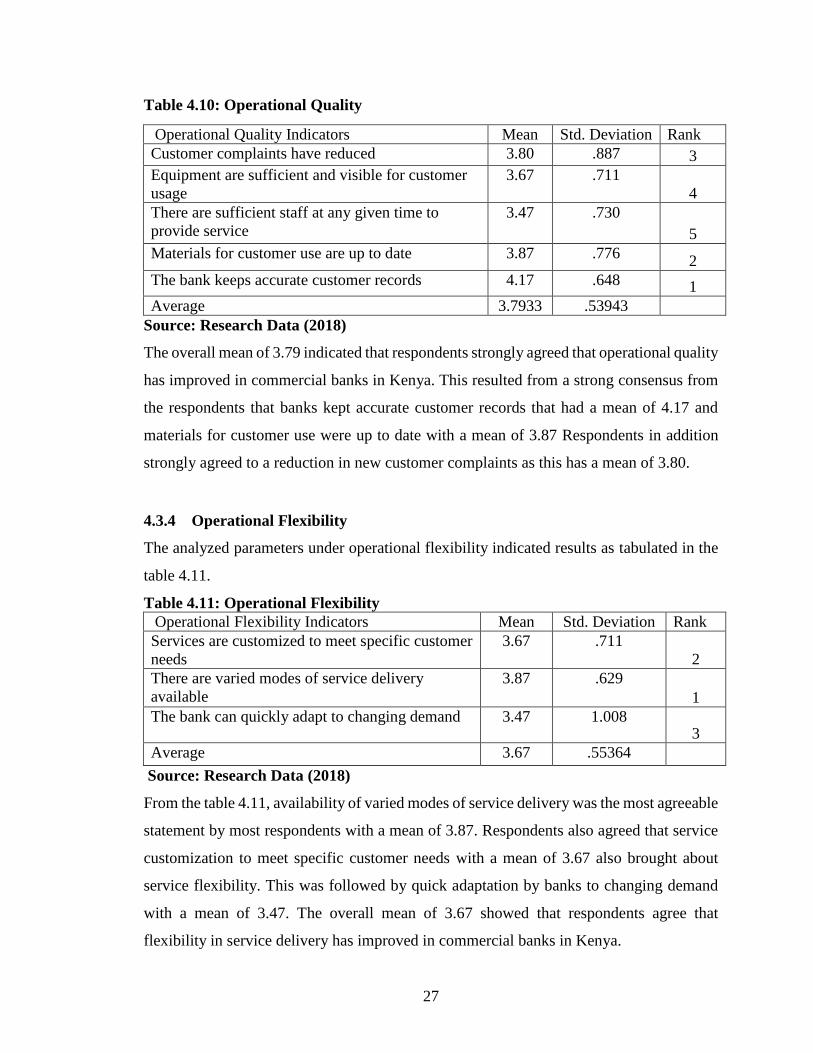
4.3.3 Operational Quality
The various parameters under quality were also analyzed and subsequent descriptive
statistics presented in the table 4.10.
27
Table 4.10: Operational Quality
Operational Quality Indicators Mean Std. Deviation Rank
Customer complaints have reduced 3.80 .887 3
Equipment are sufficient and visible for customer
usage
3.67 .711
4
There are sufficient staff at any given time to
provide service
3.47 .730
5
Materials for customer use are up to date 3.87 .776 2
The bank keeps accurate customer records 4.17 .648 1
Average 3.7933 .53943
Source: Research Data (2018)
The overall mean of 3.79 indicated that respondents strongly agreed that operational quality
has improved in commercial banks in Kenya. This resulted from a strong consensus from
the respondents that banks kept accurate customer records that had a mean of 4.17 and
materials for customer use were up to date with a mean of 3.87 Respondents in addition
strongly agreed to a reduction in new customer complaints as this has a mean of 3.80.
4.3.4 Operational Flexibility
The analyzed parameters under operational flexibility indicated results as tabulated in the
table 4.11.
Table 4.11: Operational Flexibility
Operational Flexibility Indicators Mean Std. Deviation Rank
Services are customized to meet specific customer
needs
3.67 .711
2
There are varied modes of service delivery
available
3.87 .629
1
The bank can quickly adapt to changing demand 3.47 1.008 3
Average 3.67 .55364
Source: Research Data (2018)
From the table 4.11, availability of varied modes of service delivery was the most agreeable
statement by most respondents with a mean of 3.87. Respondents also agreed that service
customization to meet specific customer needs with a mean of 3.67 also brought about
service flexibility. This was followed by quick adaptation by banks to changing demand
with a mean of 3.47. The overall mean of 3.67 showed that respondents agree that
flexibility in service delivery has improved in commercial banks in Kenya.
28
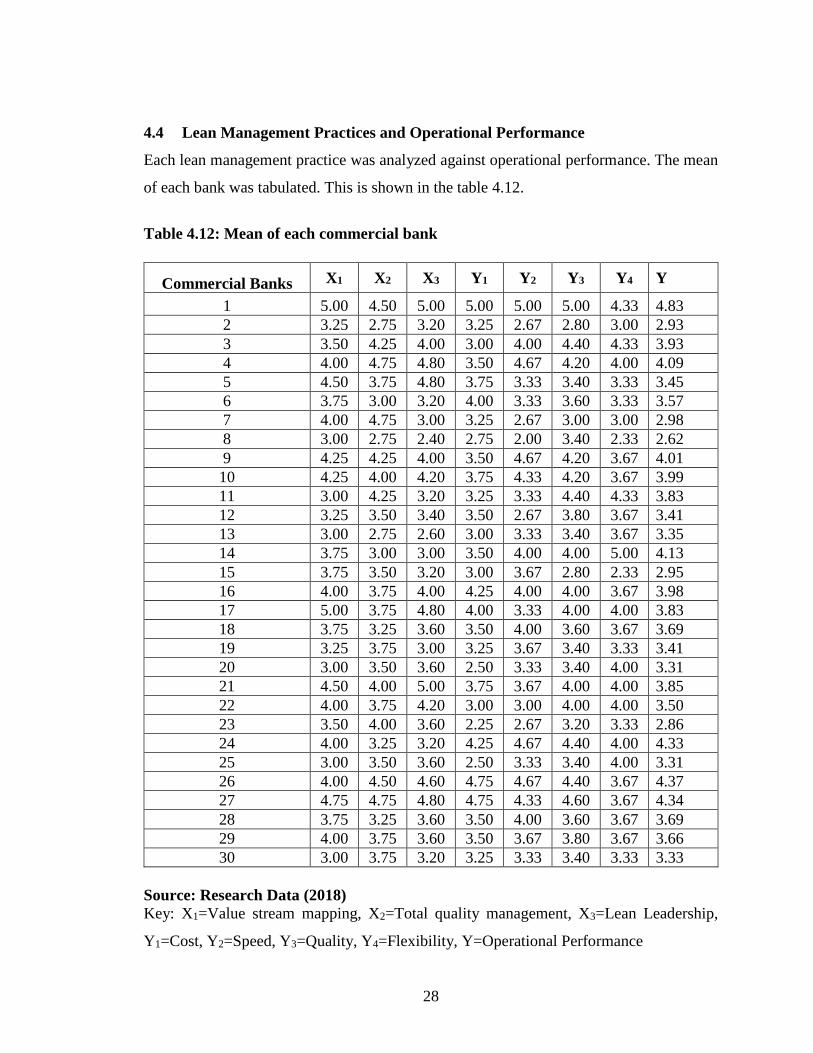
4.4 Lean Management Practices and Operational Performance
Each lean management practice was analyzed against operational performance. The mean
of each bank was tabulated. This is shown in the table 4.12.
Table 4.12: Mean of each commercial bank
Source: Research Data (2018)
Key: X1=Value stream mapping, X2=Total quality management, X3=Lean Leadership,
Y1=Cost, Y2=Speed, Y3=Quality, Y4=Flexibility, Y=Operational Performance
Commercial Banks X1 X2 X3 Y1 Y2 Y3 Y4 Y
1 5.00 4.50 5.00 5.00 5.00 5.00 4.33 4.83
2 3.25 2.75 3.20 3.25 2.67 2.80 3.00 2.93
3 3.50 4.25 4.00 3.00 4.00 4.40 4.33 3.93
4 4.00 4.75 4.80 3.50 4.67 4.20 4.00 4.09
5 4.50 3.75 4.80 3.75 3.33 3.40 3.33 3.45
6 3.75 3.00 3.20 4.00 3.33 3.60 3.33 3.57
7 4.00 4.75 3.00 3.25 2.67 3.00 3.00 2.98
8 3.00 2.75 2.40 2.75 2.00 3.40 2.33 2.62
9 4.25 4.25 4.00 3.50 4.67 4.20 3.67 4.01
10 4.25 4.00 4.20 3.75 4.33 4.20 3.67 3.99
11 3.00 4.25 3.20 3.25 3.33 4.40 4.33 3.83
12 3.25 3.50 3.40 3.50 2.67 3.80 3.67 3.41
13 3.00 2.75 2.60 3.00 3.33 3.40 3.67 3.35
14 3.75 3.00 3.00 3.50 4.00 4.00 5.00 4.13
15 3.75 3.50 3.20 3.00 3.67 2.80 2.33 2.95
16 4.00 3.75 4.00 4.25 4.00 4.00 3.67 3.98
17 5.00 3.75 4.80 4.00 3.33 4.00 4.00 3.83
18 3.75 3.25 3.60 3.50 4.00 3.60 3.67 3.69
19 3.25 3.75 3.00 3.25 3.67 3.40 3.33 3.41
20 3.00 3.50 3.60 2.50 3.33 3.40 4.00 3.31
21 4.50 4.00 5.00 3.75 3.67 4.00 4.00 3.85
22 4.00 3.75 4.20 3.00 3.00 4.00 4.00 3.50
23 3.50 4.00 3.60 2.25 2.67 3.20 3.33 2.86
24 4.00 3.25 3.20 4.25 4.67 4.40 4.00 4.33
25 3.00 3.50 3.60 2.50 3.33 3.40 4.00 3.31
26 4.00 4.50 4.60 4.75 4.67 4.40 3.67 4.37
27 4.75 4.75 4.80 4.75 4.33 4.60 3.67 4.34
28 3.75 3.25 3.60 3.50 4.00 3.60 3.67 3.69
29 4.00 3.75 3.60 3.50 3.67 3.80 3.67 3.66
30 3.00 3.75 3.20 3.25 3.33 3.40 3.33 3.33
29
4.4.1 Diagnostic Tests
Before subjecting the data to regression analysis, it is usually important to subject it to
diagnostic tests to confirm that the data does not violate key assumptions of regression
analysis. This was done and the results were discussed in the following sub sections.
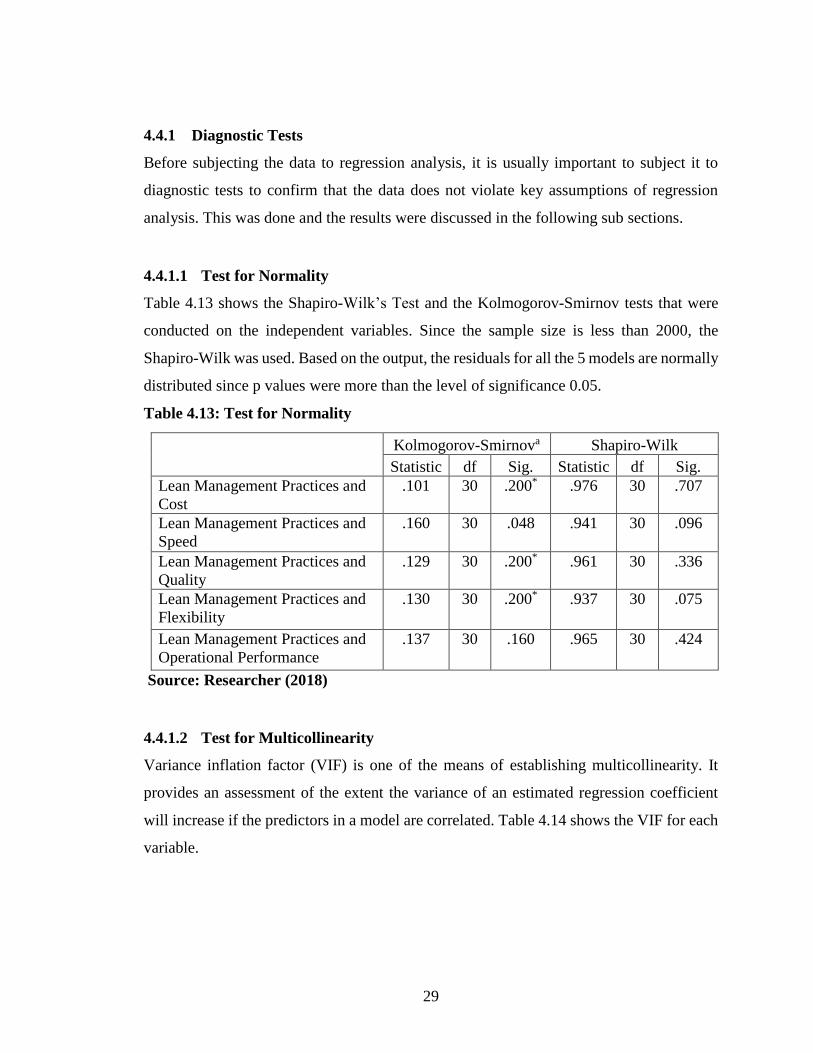
4.4.1.1 Test for Normality
Table 4.13 shows the Shapiro-Wilk’s Test and the Kolmogorov-Smirnov tests that were
conducted on the independent variables. Since the sample size is less than 2000, the
Shapiro-Wilk was used. Based on the output, the residuals for all the 5 models are normally
distributed since p values were more than the level of significance 0.05.
Table 4.13: Test for Normality
Kolmogorov-Smirnova Shapiro-Wilk
Statistic df Sig. Statistic df Sig.
Lean Management Practices and
Cost
.101 30 .200* .976 30 .707
Lean Management Practices and
Speed
.160 30 .048 .941 30 .096
Lean Management Practices and
Quality
.129 30 .200* .961 30 .336
Lean Management Practices and
Flexibility
.130 30 .200* .937 30 .075
Lean Management Practices and
Operational Performance
.137 30 .160 .965 30 .424
Source: Researcher (2018)
4.4.1.2 Test for Multicollinearity
Variance inflation factor (VIF) is one of the means of establishing multicollinearity. It
provides an assessment of the extent the variance of an estimated regression coefficient
will increase if the predictors in a model are correlated. Table 4.14 shows the VIF for each
variable.
30
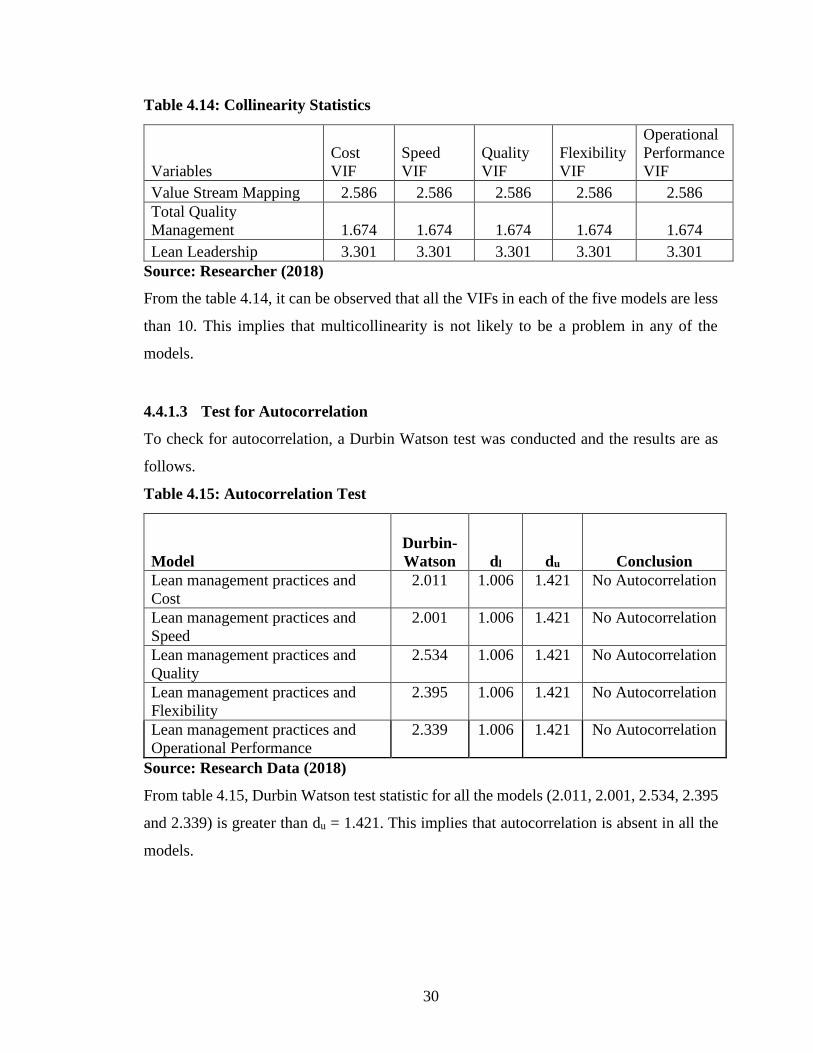
Table 4.14: Collinearity Statistics
Variables
Cost
VIF
Speed
VIF
Quality
VIF
Flexibility
VIF
Operational
Performance
VIF
Value Stream Mapping 2.586 2.586 2.586 2.586 2.586
Total Quality
Management 1.674 1.674 1.674 1.674 1.674
Lean Leadership 3.301 3.301 3.301 3.301 3.301
Source: Researcher (2018)
From the table 4.14, it can be observed that all the VIFs in each of the five models are less
than 10. This implies that multicollinearity is not likely to be a problem in any of the
models.
4.4.1.3 Test for Autocorrelation
To check for autocorrelation, a Durbin Watson test was conducted and the results are as
follows.
Table 4.15: Autocorrelation Test
Model
Durbin-
Watson dl du Conclusion
Lean management practices and
Cost
2.011 1.006 1.421 No Autocorrelation
Lean management practices and
Speed
2.001 1.006 1.421 No Autocorrelation
Lean management practices and
Quality
2.534 1.006 1.421 No Autocorrelation
Lean management practices and
Flexibility
2.395 1.006 1.421 No Autocorrelation
Lean management practices and
Operational Performance
2.339 1.006 1.421 No Autocorrelation
Source: Research Data (2018)
From table 4.15, Durbin Watson test statistic for all the models (2.011, 2.001, 2.534, 2.395
and 2.339) is greater than du = 1.421. This implies that autocorrelation is absent in all the
models.
31
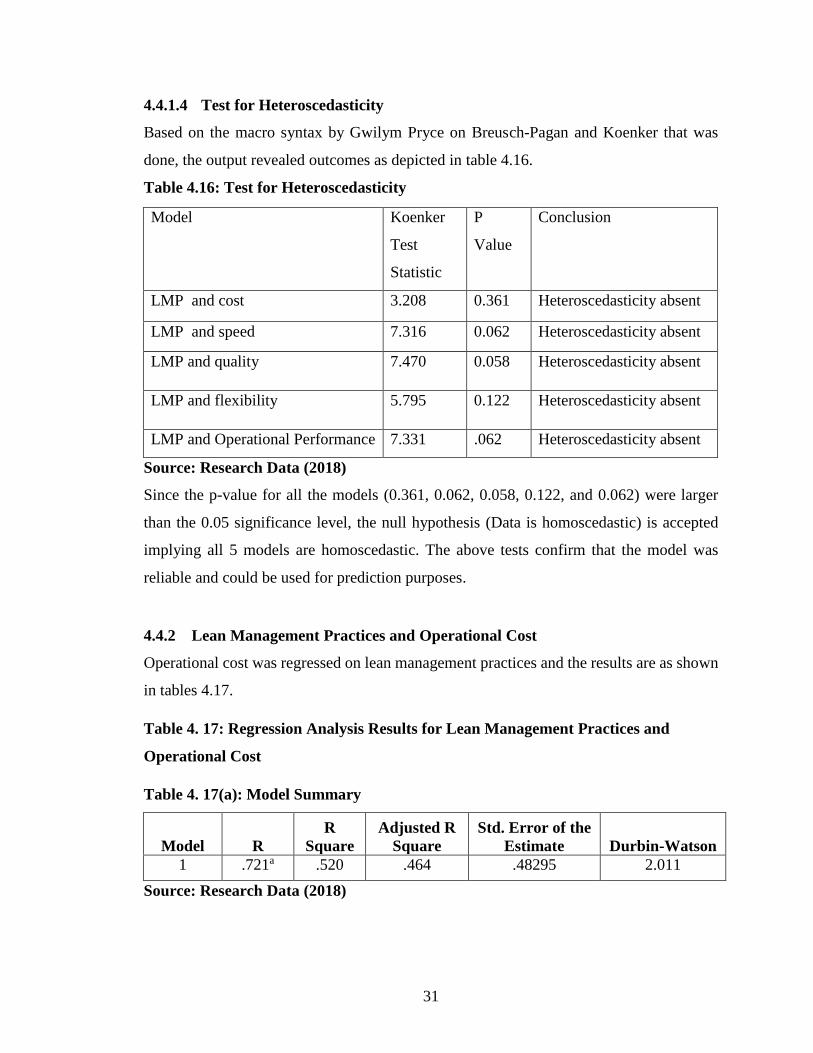
4.4.1.4 Test for Heteroscedasticity
Based on the macro syntax by Gwilym Pryce on Breusch-Pagan and Koenker that was
done, the output revealed outcomes as depicted in table 4.16.
Table 4.16: Test for Heteroscedasticity
Model Koenker
Test
Statistic
P
Value
Conclusion
LMP and cost 3.208 0.361 Heteroscedasticity absent
LMP and speed 7.316 0.062 Heteroscedasticity absent
LMP and quality 7.470 0.058 Heteroscedasticity absent
LMP and flexibility 5.795 0.122 Heteroscedasticity absent
LMP and Operational Performance 7.331 .062 Heteroscedasticity absent
Source: Research Data (2018)
Since the p-value for all the models (0.361, 0.062, 0.058, 0.122, and 0.062) were larger
than the 0.05 significance level, the null hypothesis (Data is homoscedastic) is accepted
implying all 5 models are homoscedastic. The above tests confirm that the model was
reliable and could be used for prediction purposes.
4.4.2 Lean Management Practices and Operational Cost
Operational cost was regressed on lean management practices and the results are as shown
in tables 4.17.
Table 4. 17: Regression Analysis Results for Lean Management Practices and
Operational Cost
Table 4. 17(a): Model Summary
Model R
R
Square
Adjusted R
Square
Std. Error of the
Estimate Durbin-Watson
1 .721a .520 .464 .48295 2.011
Source: Research Data (2018)
32
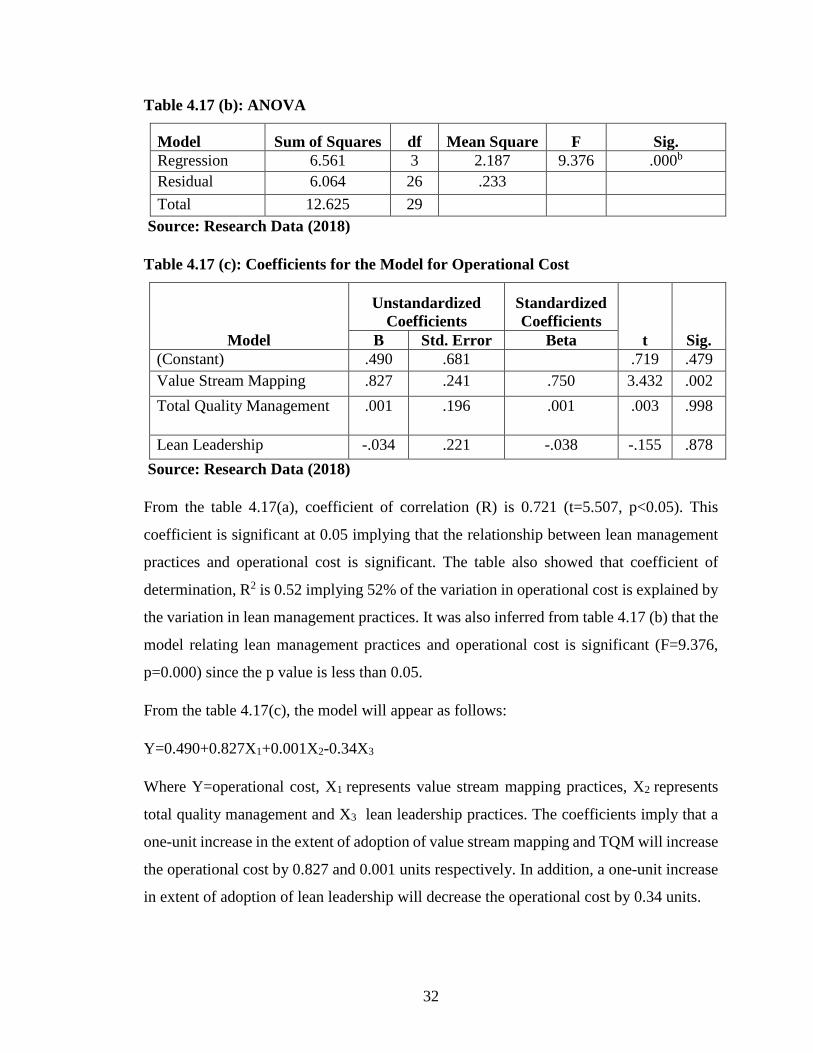
Table 4.17 (b): ANOVA
Model Sum of Squares df Mean Square F Sig.
Regression 6.561 3 2.187 9.376 .000b
Residual 6.064 26 .233
Total 12.625 29
Source: Research Data (2018)
Table 4.17 (c): Coefficients for the Model for Operational Cost
Model
Unstandardized
Coefficients
Standardized
Coefficients
t Sig. B Std. Error Beta
(Constant) .490 .681 .719 .479
Value Stream Mapping .827 .241 .750 3.432 .002
Total Quality Management .001 .196 .001 .003 .998
Lean Leadership -.034 .221 -.038 -.155 .878
Source: Research Data (2018)
From the table 4.17(a), coefficient of correlation (R) is 0.721 (t=5.507, p<0.05). This
coefficient is significant at 0.05 implying that the relationship between lean management
practices and operational cost is significant. The table also showed that coefficient of
determination, R2 is 0.52 implying 52% of the variation in operational cost is explained by
the variation in lean management practices. It was also inferred from table 4.17 (b) that the
model relating lean management practices and operational cost is significant (F=9.376,
p=0.000) since the p value is less than 0.05.
From the table 4.17(c), the model will appear as follows:
Y=0.490+0.827X1+0.001X2-0.34X3
Where Y=operational cost, X1 represents value stream mapping practices, X2 represents
total quality management and X3 lean leadership practices. The coefficients imply that a
one-unit increase in the extent of adoption of value stream mapping and TQM will increase
the operational cost by 0.827 and 0.001 units respectively. In addition, a one-unit increase
in extent of adoption of lean leadership will decrease the operational cost by 0.34 units.
33
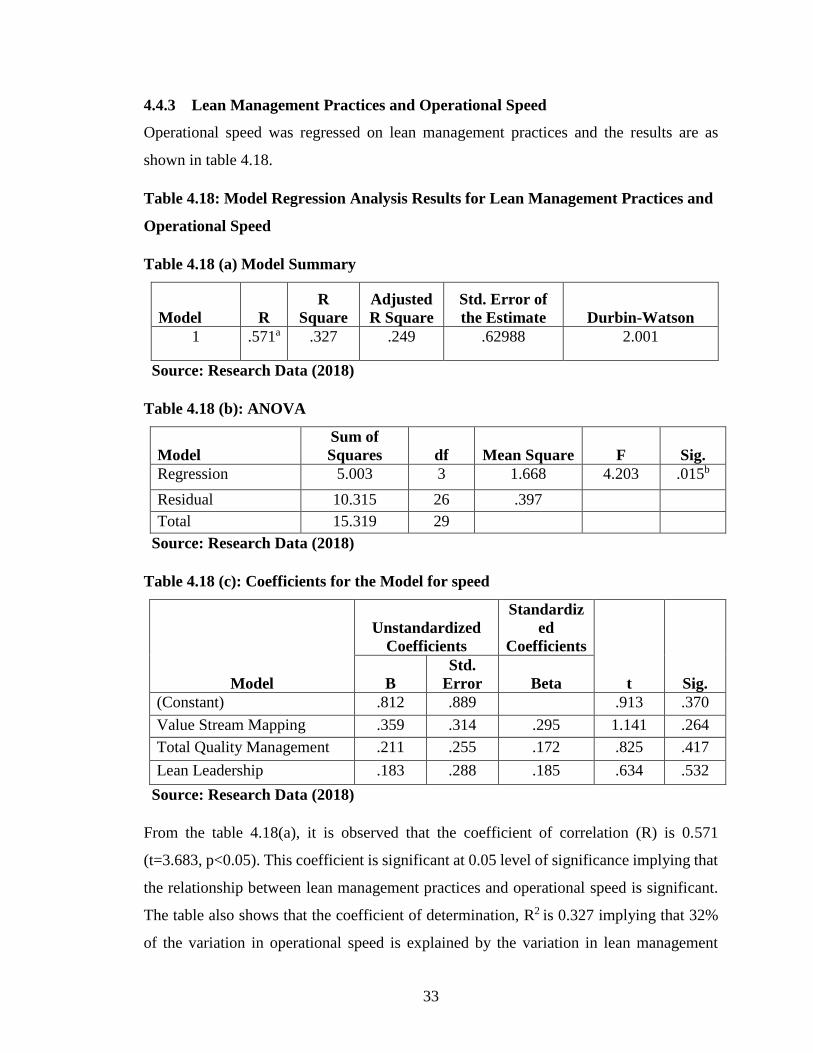
4.4.3 Lean Management Practices and Operational Speed
Operational speed was regressed on lean management practices and the results are as
shown in table 4.18.
Table 4.18: Model Regression Analysis Results for Lean Management Practices and
Operational Speed
Table 4.18 (a) Model Summary
Model R
R
Square
Adjusted
R Square
Std. Error of
the Estimate Durbin-Watson
1 .571a .327 .249 .62988 2.001
Source: Research Data (2018)
Table 4.18 (b): ANOVA
Model
Sum of
Squares df Mean Square F Sig.
Regression 5.003 3 1.668 4.203 .015b
Residual 10.315 26 .397
Total 15.319 29
Source: Research Data (2018)
Table 4.18 (c): Coefficients for the Model for speed
Model
Unstandardized
Coefficients
Standardiz
ed
Coefficients
t Sig. B
Std.
Error Beta
(Constant) .812 .889 .913 .370
Value Stream Mapping .359 .314 .295 1.141 .264
Total Quality Management .211 .255 .172 .825 .417
Lean Leadership .183 .288 .185 .634 .532
Source: Research Data (2018)
From the table 4.18(a), it is observed that the coefficient of correlation (R) is 0.571
(t=3.683, p<0.05). This coefficient is significant at 0.05 level of significance implying that
the relationship between lean management practices and operational speed is significant.
The table also shows that the coefficient of determination, R2 is 0.327 implying that 32%
of the variation in operational speed is explained by the variation in lean management
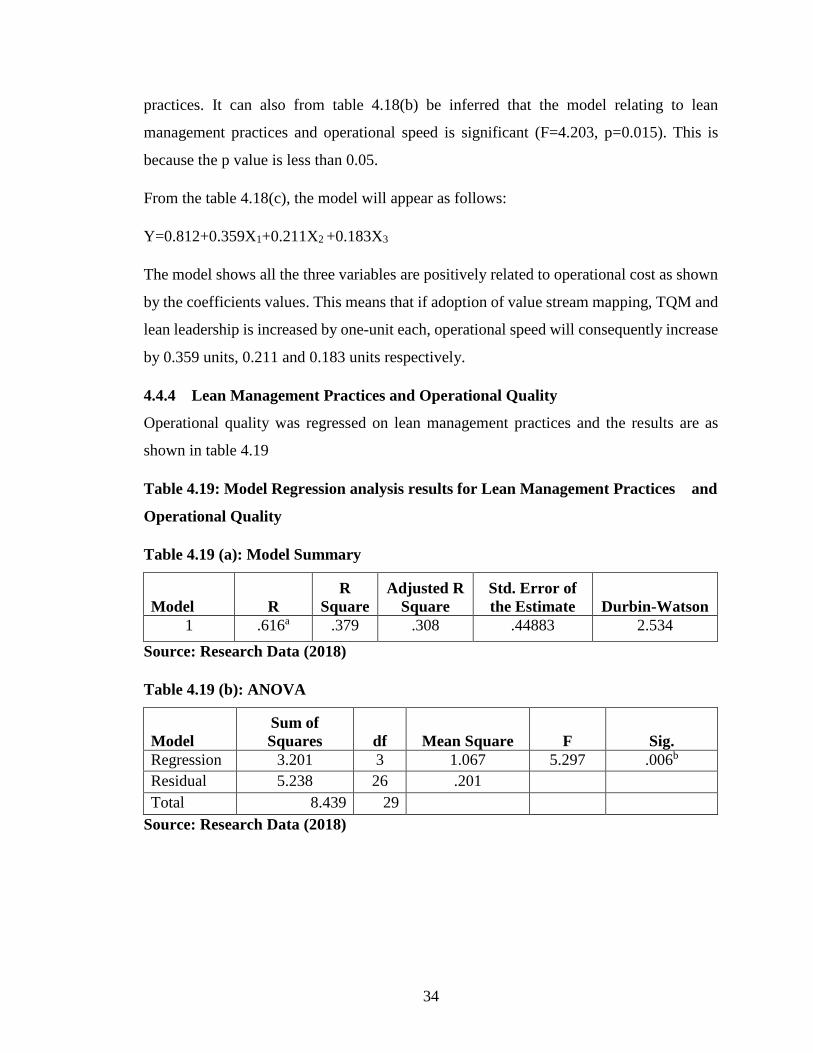
34
practices. It can also from table 4.18(b) be inferred that the model relating to lean
management practices and operational speed is significant (F=4.203, p=0.015). This is
because the p value is less than 0.05.
From the table 4.18(c), the model will appear as follows:
Y=0.812+0.359X1+0.211X2 +0.183X3
The model shows all the three variables are positively related to operational cost as shown
by the coefficients values. This means that if adoption of value stream mapping, TQM and
lean leadership is increased by one-unit each, operational speed will consequently increase
by 0.359 units, 0.211 and 0.183 units respectively.
4.4.4 Lean Management Practices and Operational Quality
Operational quality was regressed on lean management practices and the results are as
shown in table 4.19
Table 4.19: Model Regression analysis results for Lean Management Practices and
Operational Quality
Table 4.19 (a): Model Summary
Model R
R
Square
Adjusted R
Square
Std. Error of
the Estimate Durbin-Watson
1 .616a .379 .308 .44883 2.534
Source: Research Data (2018)
Table 4.19 (b): ANOVA
Model
Sum of
Squares df Mean Square F Sig.
Regression 3.201 3 1.067 5.297 .006b
Residual 5.238 26 .201
Total 8.439 29
Source: Research Data (2018)
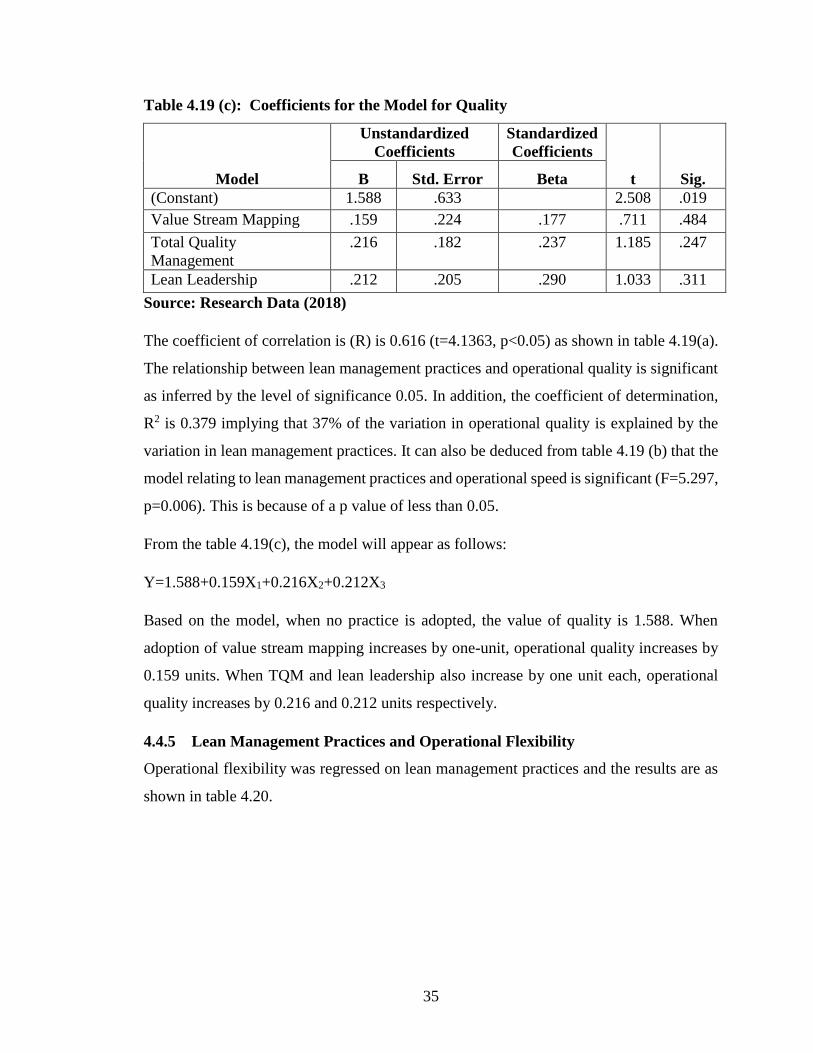
35
Table 4.19 (c): Coefficients for the Model for Quality
Model
Unstandardized
Coefficients
Standardized
Coefficients
t Sig. B Std. Error Beta
(Constant) 1.588 .633 2.508 .019
Value Stream Mapping .159 .224 .177 .711 .484
Total Quality
Management
.216 .182 .237 1.185 .247
Lean Leadership .212 .205 .290 1.033 .311
Source: Research Data (2018)
The coefficient of correlation is (R) is 0.616 (t=4.1363, p<0.05) as shown in table 4.19(a).
The relationship between lean management practices and operational quality is significant
as inferred by the level of significance 0.05. In addition, the coefficient of determination,
R2 is 0.379 implying that 37% of the variation in operational quality is explained by the
variation in lean management practices. It can also be deduced from table 4.19 (b) that the
model relating to lean management practices and operational speed is significant (F=5.297,
p=0.006). This is because of a p value of less than 0.05.
From the table 4.19(c), the model will appear as follows:
Y=1.588+0.159X1+0.216X2+0.212X3
Based on the model, when no practice is adopted, the value of quality is 1.588. When
adoption of value stream mapping increases by one-unit, operational quality increases by
0.159 units. When TQM and lean leadership also increase by one unit each, operational
quality increases by 0.216 and 0.212 units respectively.
4.4.5 Lean Management Practices and Operational Flexibility
Operational flexibility was regressed on lean management practices and the results are as
shown in table 4.20.
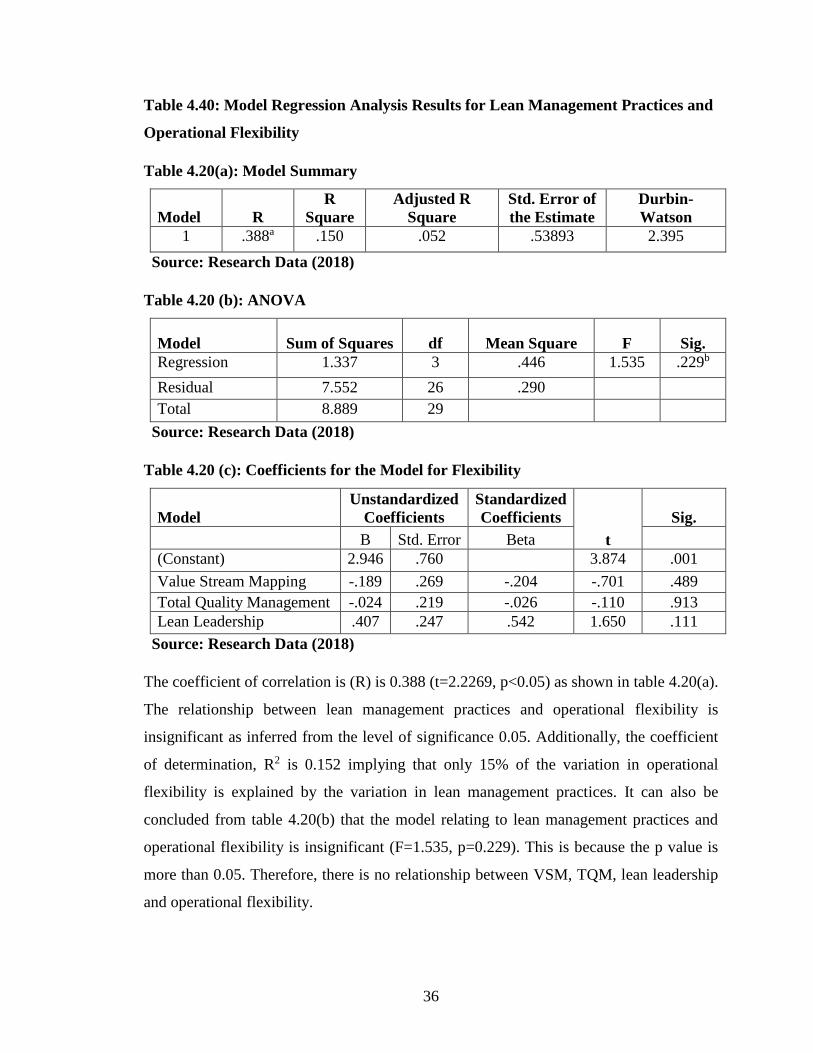
36
Table 4.40: Model Regression Analysis Results for Lean Management Practices and
Operational Flexibility
Table 4.20(a): Model Summary
Model R
R
Square
Adjusted R
Square
Std. Error of
the Estimate
Durbin-
Watson
1 .388a .150 .052 .53893 2.395
Source: Research Data (2018)
Table 4.20 (b): ANOVA
Model Sum of Squares df Mean Square F Sig.
Regression 1.337 3 .446 1.535 .229b
Residual 7.552 26 .290
Total 8.889 29
Source: Research Data (2018)
Table 4.20 (c): Coefficients for the Model for Flexibility
Model
Unstandardized
Coefficients
Standardized
Coefficients
t
Sig.
B Std. Error Beta
(Constant) 2.946 .760 3.874 .001
Value Stream Mapping -.189 .269 -.204 -.701 .489
Total Quality Management -.024 .219 -.026 -.110 .913
Lean Leadership .407 .247 .542 1.650 .111
Source: Research Data (2018)
The coefficient of correlation is (R) is 0.388 (t=2.2269, p<0.05) as shown in table 4.20(a).
The relationship between lean management practices and operational flexibility is
insignificant as inferred from the level of significance 0.05. Additionally, the coefficient
of determination, R2 is 0.152 implying that only 15% of the variation in operational
flexibility is explained by the variation in lean management practices. It can also be
concluded from table 4.20(b) that the model relating to lean management practices and
operational flexibility is insignificant (F=1.535, p=0.229). This is because the p value is
more than 0.05. Therefore, there is no relationship between VSM, TQM, lean leadership
and operational flexibility.
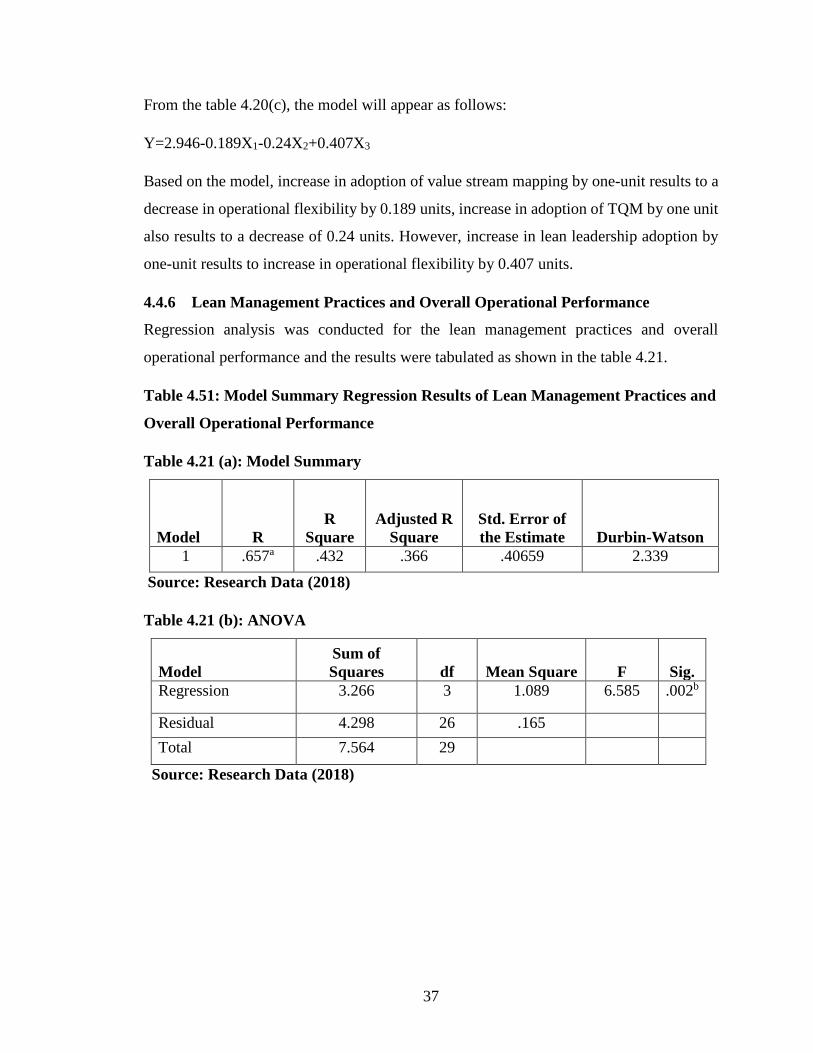
37
From the table 4.20(c), the model will appear as follows:
Y=2.946-0.189X1-0.24X2+0.407X3
Based on the model, increase in adoption of value stream mapping by one-unit results to a
decrease in operational flexibility by 0.189 units, increase in adoption of TQM by one unit
also results to a decrease of 0.24 units. However, increase in lean leadership adoption by
one-unit results to increase in operational flexibility by 0.407 units.
4.4.6 Lean Management Practices and Overall Operational Performance
Regression analysis was conducted for the lean management practices and overall
operational performance and the results were tabulated as shown in the table 4.21.
Table 4.51: Model Summary Regression Results of Lean Management Practices and
Overall Operational Performance
Table 4.21 (a): Model Summary
Model R
R
Square
Adjusted R
Square
Std. Error of
the Estimate Durbin-Watson
1 .657a .432 .366 .40659 2.339
Source: Research Data (2018)
Table 4.21 (b): ANOVA
Model
Sum of
Squares df Mean Square F Sig.
Regression 3.266 3 1.089 6.585 .002b
Residual 4.298 26 .165
Total 7.564 29
Source: Research Data (2018)
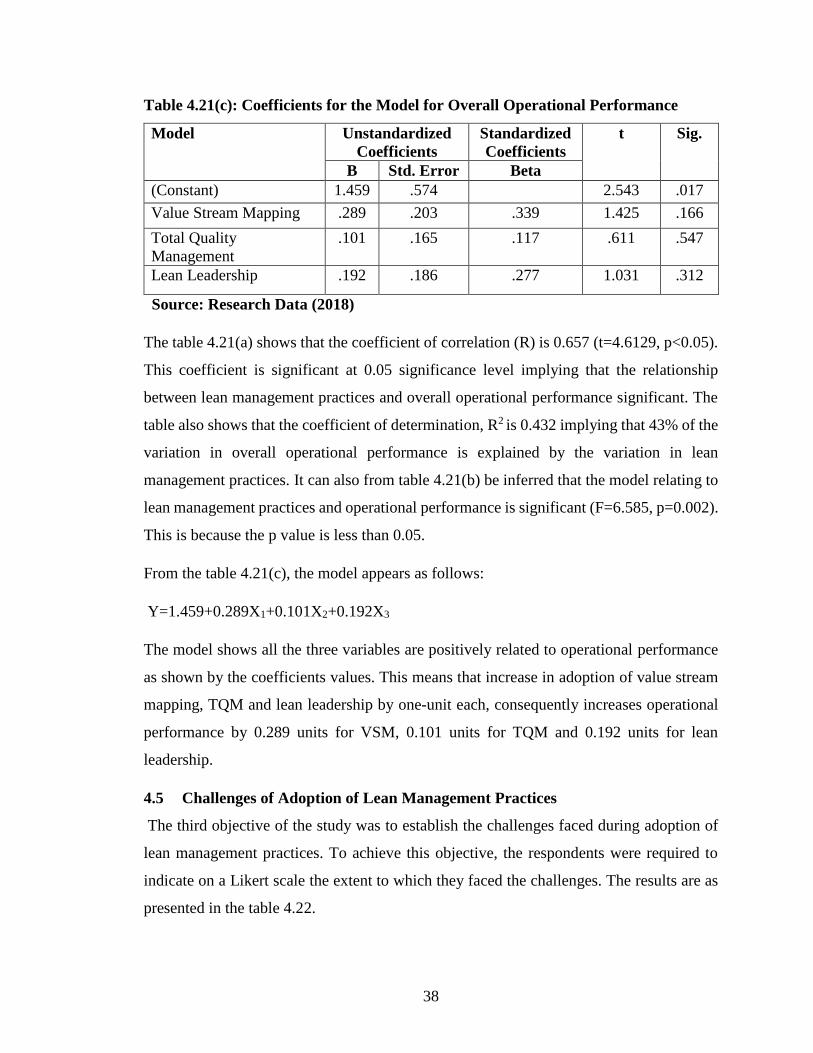
38
Table 4.21(c): Coefficients for the Model for Overall Operational Performance
Model
Unstandardized
Coefficients
Standardized
Coefficients
t Sig.
B Std. Error Beta
(Constant) 1.459 .574 2.543 .017
Value Stream Mapping .289 .203 .339 1.425 .166
Total Quality
Management
.101 .165 .117 .611 .547
Lean Leadership .192 .186 .277 1.031 .312
Source: Research Data (2018)
The table 4.21(a) shows that the coefficient of correlation (R) is 0.657 (t=4.6129, p<0.05).
This coefficient is significant at 0.05 significance level implying that the relationship
between lean management practices and overall operational performance significant. The
table also shows that the coefficient of determination, R2 is 0.432 implying that 43% of the
variation in overall operational performance is explained by the variation in lean
management practices. It can also from table 4.21(b) be inferred that the model relating to
lean management practices and operational performance is significant (F=6.585, p=0.002).
This is because the p value is less than 0.05.
From the table 4.21(c), the model appears as follows:
Y=1.459+0.289X1+0.101X2+0.192X3
The model shows all the three variables are positively related to operational performance
as shown by the coefficients values. This means that increase in adoption of value stream
mapping, TQM and lean leadership by one-unit each, consequently increases operational
performance by 0.289 units for VSM, 0.101 units for TQM and 0.192 units for lean
leadership.
4.5 Challenges of Adoption of Lean Management Practices
The third objective of the study was to establish the challenges faced during adoption of
lean management practices. To achieve this objective, the respondents were required to
indicate on a Likert scale the extent to which they faced the challenges. The results are as
presented in the table 4.22.
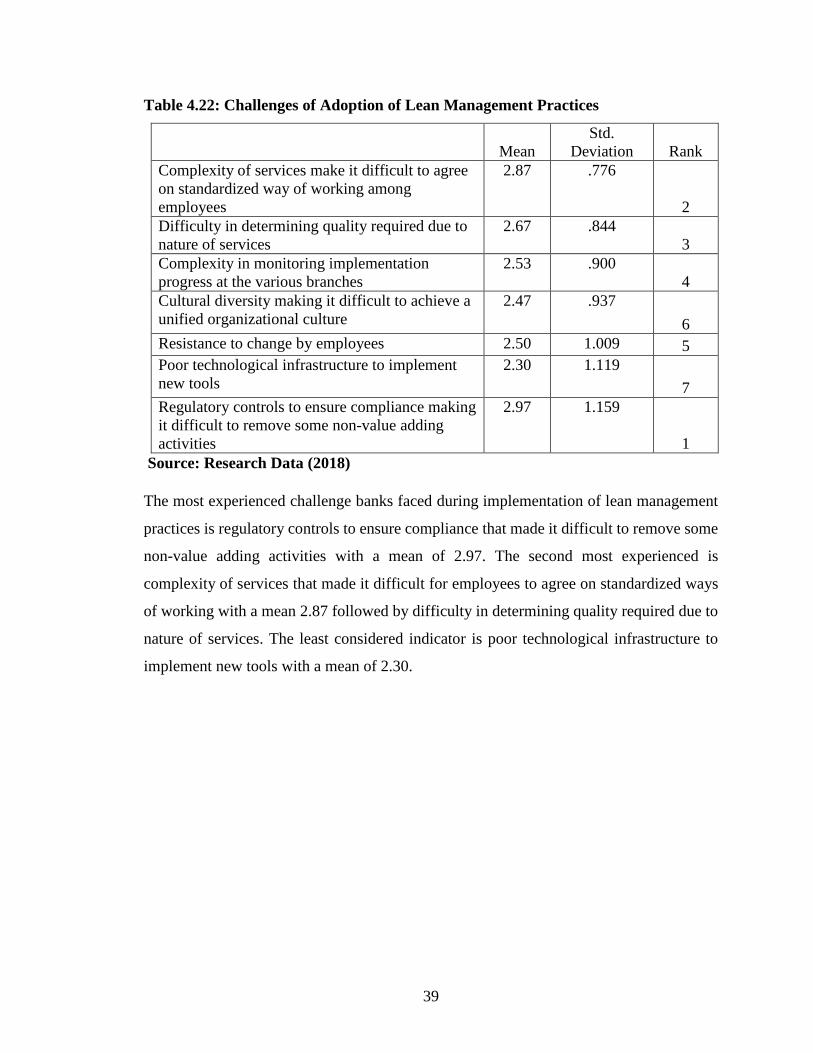
39
Table 4.22: Challenges of Adoption of Lean Management Practices
Mean
Std.
Deviation Rank
Complexity of services make it difficult to agree
on standardized way of working among
employees
2.87 .776
2
Difficulty in determining quality required due to
nature of services
2.67 .844
3
Complexity in monitoring implementation
progress at the various branches
2.53 .900
4
Cultural diversity making it difficult to achieve a
unified organizational culture
2.47 .937
6
Resistance to change by employees 2.50 1.009 5
Poor technological infrastructure to implement
new tools
2.30 1.119
7
Regulatory controls to ensure compliance making
it difficult to remove some non-value adding
activities
2.97 1.159
1
Source: Research Data (2018)
The most experienced challenge banks faced during implementation of lean management
practices is regulatory controls to ensure compliance that made it difficult to remove some
non-value adding activities with a mean of 2.97. The second most experienced is
complexity of services that made it difficult for employees to agree on standardized ways
of working with a mean 2.87 followed by difficulty in determining quality required due to
nature of services. The least considered indicator is poor technological infrastructure to
implement new tools with a mean of 2.30.
40
CHAPTER FIVE: SUMMARY, CONCLUSION AND
RECOMMENDATIONS
5.1 Introduction
This chapter contains summary of the study, conclusion, recommendations and areas for
further research. Data analysis, summary and conclusions were made in line with the study
objective which investigated the relationship between lean management practices and
operational performance of commercial banks in Kenya.
5.2 Summary of Study Findings
Demographic characteristics of the respondents indicated that a good number of the banks
have existed for twenty years and above hence had adequate time to deploy lean practices.
Staff count is high indicating potential of these banks to adopt these practices. In addition,
respondents had a good knowledge of bank operations as they had worked for the banks
for a considerable length of time.
5.2.1 Extent of Adoption of lean management practices
The first objective of this study sought to establish the extent of adoption of lean
management practices by commercial banks. Results showed that value stream mapping,
total quality management and lean leadership have been adopted, however at varying
levels. Total quality management and lean leadership were the most adopted lean
management practices whereas value steam mapping was only adopted to a moderate
extent. Notably, promotion of learning and knowledge sharing, top management
involvement in lean implementation and promotion of a culture of continuous improvement
by top management were most adopted indicators in lean leadership and total quality
management.
This study showed that lean management practices adoption remains key for organizations
such as banks. Commercial banks should therefore put a key focus on those that have been
moderately implemented such as value stream mapping to increase their adoption and
create the combined effect required to improve the overall operational performance.
41
5.2.2 Lean Management Practices and Operational Performance
The second objective in this study sought to find out lean management practices impact on
each operational performance indicator and the overall operational performance. Based on
the findings, value stream mapping, TQM and lean leadership impacted operational cost
significantly. It was also noted that a considerable change in operational cost could be
explained by change in lean management practices. The results also indicated a significant
effect of the lean management practices on operational speed where a considerable increase
in lean leadership would lead to highest increase in operational speed.
Operational quality had an equally significant relationship with lean management practices
where total quality management increase in adoption would have the highest overall impact
on operational quality. For operational flexibility, only a small percentage of its variation
could be explained by value stream mapping, TQM and lean leadership. This meant no
significant relationship between operational flexibility and lean management practices in
services.
Generally, a significant relationship exists between overall lean management practices and
operational performance of commercial banks. This meant that lean management practices
are considered as a basis of operational performance because they enable organization
reduce costs, become more competitive and meet customer needs. Hence continuous
adoption of all lean management practices is paramount for banks especially those not fully
implemented to boost operational performance.
5.2.3 Challenges faced during implementation of Lean Management Practices
The study sought to also find out the challenges that banks face during implementation of
lean management practices. Based on the findings, regulatory controls to ensure
compliance that made it difficult to remove some non-value adding activities was the most
experienced challenge that affected banks to a moderate extent. The second biggest
challenge is the fact that complexity of services made it difficult to agree on standardized
way of working among employees also affected commercial banks to a moderate extent.
The respondents however highlighted that poor technological infrastructure to implement
new tools had the least impact on them.
42
5.3 Conclusions of the study
The underlying objective of lean implementation is to improve operations performance
through waste elimination. This study is evidence that lean practices are considered key to
improving operational performance in many organizations. Different past studies point out
positive relationship between lean and dimensions of operational performance. According
to Abdallah and Matsui (2007), there is a positive impact between lean management
practices and quality performance. The effect of lean practices on cost performance was
widely investigated by researchers and there is an agreement that the effect is positive and
significant (Fullerton & McWatters, 2001). This study therefore has shown that certainly
adoption of lean management practices specifically value stream mapping, total quality
management and lean leadership has a positive impact on operational cost, quality and
speed.
In this study, lean management practices had an insignificant impact on operational
flexibility. This was mainly attributed to the fact that flexibility revolves around meeting
the changing customer tastes and preferences, finding the right balance between demand
and supply and quick adaptation which can accurately be achieved through use of
technology and automation. Organizations therefore need to find how they can integrate
lean management practices and automation to achieve operational flexibility and
consequently overall operational performance. In addition, it was noted from other studies
that due to the multidimensional nature of flexibility, it was more applicable for
manufacturing companies with an aim of achieving for example changeover and volume
flexibility when producing goods (Gerwin, 1993). This could be difficult to achieve in
services industries due their nature.
In addition, Barney (2001) points out that human resource is fundamental for any
organizations and forms the foundation for performance prediction. In this study
knowledge is considered an enabler to performance therefore achieving operational
performance through lean management practices depends on how well organization invest
in employee training, continuous learning and coaching so as to close competence gaps
and improve execution. The focus of knowledge based view is to tie together the intangible
assets to gain operational performance over competition.
43
5.4 Recommendations of the study
A holistic approach is recommended during implementation of lean management practices.
Hence all the three practices have their individual strengths that when implemented
together enable achievement of better results. One or two practices may not result to the
preferred operational performance compared to all practices implemented and working in
union. Banks have a role in ensuring the right resources are put in place that will support
implementation of these practices all together.
Compliance is required in banks and this is enforced through regulations. As such banks
are forced to look at ways to be compliant but at the same time improve operational
performance. While this is not easy to achieve, this study recommends incorporating
automation and design thinking with principles and methodologies drawn from lean more
so to bring about operational flexibility. This would entail taking advantage of technology,
analytics and building competences of people to take part in coming up with improvement
solutions. On the other hand, government and related institutions through partnership with
these commercial banks have a role to play in ensuring that regulations and policies
formulated support implementation of lean as much as they support compliance and risk
management.
5.5 Limitations of the Study
Several limitations impacted this study. First, respondents were unwilling to share
information touching on their operational performance. The researcher however
guaranteed confidentiality to the respondents concerned. Data from this study was mainly
collected from commercial banks in Mombasa which makes the study unrepresentative
hence reducing its generalizability to the whole banking sector. Lack of knowledge on the
subject made it difficult for some respondents to give proper information. This was mainly
contributed by lack of experience in the area of the study. The study targeted operational
managers, credit managers or branch managers who were too busy and not readily available
to provide the information. This made data collection take a long time and tedious.
5.6 Suggestion for Further Studies
This study concentrated on the extent of adoption without deep diving on how these
practices were implemented. This is an area that future studies can look into so as to have
44
an understanding on how this is done across different banks. Future studies can also look
into adoption of lean in other service industries such as logistics and shipping so as to
determine whether similar findings prevail. Additionally, a deep dive into the integration
between automation and lean practices can be done to understand how these two can be
incorporated together to result to operational flexibility in service industries.
45
REFERENCES
Abdallah, A. B., & Matsui, Y. (2007). JIT and TPM : Their relationship and impact on
JIT and competitive performances. Tpm, 1, 1–18.
Achanga, P., Shehab, E., Roy, R., & Nelder, G. (2006). Critical success factors for lean
implementation within SME’s. Journal of Manufacturing Technology Management,
17(4) 460-471.
Addis, M., & Holbrook, M. B. (2001). On the conceptual link between mass
customisation and experiential consumption: an explosion of subjectivity. Journal of
Consumer Behaviour.
Ahlstrom, P. (2004). Lean service operations: translating lean production principles to
service operations. International Journal of Services Technology and Management.
Ali, N., Petersen, K., & Schneider, K. (2016). Flow-assisted value stream mapping in the
early phases of large-scale software development. The Journal of Systems and
Software, 111, 213-227.
Allway, M., & Corbett, S. (2002). Shifting to lean service: Stealing a page from
manufacturers’ playbooks. Journal of Organizational Excellence, 21(2), 45–54.
Ballard, G., & Howell, G. A. (2003). Lean project management. Building Research and
Information, 31(2), 119–133.
Barney, J. B. (2001). Resource-based theories of the competitive advantage: A ten-year
retrospective on the resource-based view. Journal of Management, 27, 643-650.
Bonaccorsi, A., Carmignani, G., & Zammori, F. (2011). Service value stream
management (SVSM): Developing lean thinking in the service industry. Journal of
Service Science and Management, 04(04), 428–439.
Bon, A., & Mustafa, E. (2013). Impact of total quality management on innovation in
service organization.
Callen, J. L., Fader, C., & Krinsky, I. (2000). Just-in-time: A cross-sectional plant
analysis. International Journal of Production Economics, 63(3), 277–301.
46
Central Bank of Kenya (2017). Bank Supervision Annual Report 2017.
Chauhan, G., Singh, T.P. (2012), Measuring parameters of lean manufacturing
realization, Measuring Business Excellence, 16(3) 57-71.
Chowdhury, M. S. R. (2013). Solving waiting lines models in the bank using queuing
theory model the practice case: Islami Bank Bangladesh Limited, Chawkbazar
Branch, Chittagong. IOSR Journal of Business and Management (IOSR-JBM),
10(1), 22–29.
Cooper, D. R., & Schindler, P. S. (2003). Business research methods. Business.
Creswell, J. W. (2014). Research Design, Qualitative Quantitative & Mixed Methods
Appoaches.
Dadashnejad, A. A., & Valmohammadi, C. (2018). Investigating the effect of value
stream mapping on operational losses: Journal of Engineering, Design and
Technology.
Dombrowski, U., & Mielke, T. (2013). Lean Leadership: Fundamental principles and
their application. In Procedia CIRP 7, 569–574.
Emiliani, B. (2008). Practical Lean Leadership: A Strategic Leadership Guide for
Executives. Wethersfield, CT: The Center for Lean Business Management.
Emiliani, M. L. (2006). Origins of lean management in America: The role of connecticut
businesses. Journal of Management History, 12(2), 167–184.
Fullerton, R., & McWatters, C. (2001). The production performance benefits from JIT
implementation. Journal of Operations Management, 19(1), 81-96.
Gerwin, D. (1993). Manufacturing flexibility: A strategic perspective. Management
Science, 39(4) 395-410
Goldratt, E. M., & Cox, J. (2004). The Goal: A process of ongoing improvement. ( 3rd
ed).
Grewal, C. (2008). An initiative to implement lean manufacturing using value stream
47
mapping in a small company. International Journal of Manufacturing Technology
and Management, 15(3), 404-417.
Grigoroudis, E., Politis, Y., & Siskos, Y. (2002). Satisfaction benchmarking and
customer classification: An Application to the Branches of a Banking Organization.
International Transactions in Operational Research, 9(5), 599–618.
Hines, P., Howlweg, M., & Rich, N. (2004). Learning to evolve: A review of the
contemporary lean thinking . International Journal of Operations & Production
Management, 24(10), 994- 1011.
Hult, G. T. M., Ketchen, D. J., Cavusgil, S. T., & Calantone, R. J. (2006). Knowledge as
a strategic resource in supply chains. Journal of Operations Management, 24(5),
458–475.
Jaideep, M., Hung, C., & Manu, M. (1996). Implementation of ISO 9000 in the
healthcare sector: a case study. Health Marketing Quarterly, 14(2), 63–72.
Jayaram, J., & Xu, K. (2016). Determinants of quality and efficiency performance in
service operations. International Journal of Operations & Production Management,
36(3), 265–285.
Juran, J. M., & Godfrey, A. B. (1998). Juran’s Quality Handbook. McGrawHill.
Kallrath, J., & Maindl, T. I. (2006). Real optimization with SAP® APO.
Kamal, A.M. (2012). The impact of total quality management on competitive advante of
pharmaceutical manufacturing companies in Jordan. Perspectives of Innovations,
Economics and Business, 12 (3), 59 - 75
Kamau, M. (2014). Lean supply chain practices in urban roads construction projects: A
case of class A road construction companies in Nairobi. (Master’s Thesis,
University of Nairobi).
Kathaara C. K. (2014). A study on total quality management practices and operational
performance of commercial banks in Kenya. (Master’s Thesis, University of
Nairobi).
48
Kaynak, H. (2003). The relationship between total quality management practices and
their effects on firm performance. Journal of Operations Management, 34(2), 1-31.
Krijnen, A. (2007). The toyota way: 14 management principles from the world’s greatest
manufacturer. Action Learning: Research and Practice.
Ladhari, R. (2009). Service quality, emotional satisfaction, and behavioural intentions: A
study in the hotel industry. Managing Service Quality, 19(3) 308 - 31.
Liker, J., & Convis, G. L. (2011). The Toyota way to lean leadership: Achieving and
Sustaining Excellence through Leadership Development. New York: McGraw-Hill.
Madiavale, E. M. (2016). Effect of lean practices on operational performance of
microfinance institutions in Mombasa county (Master's Thesis, University of
Nairobi).
Maylor, H. (2003). Project Management (3rd ed.). Financial Times Prentice Hall,
Harlow.
McManus, H. L., & Millard, R. L. (2002). Value stream analysis and mapping for
product development. Technology, 20(3), 8–13.
Miller C. C., & Cardinal L.B. (1994). Strategic planning and firm performance: A
synthesis of more than two decades of research. Academy of Management Journal,
37(1), 1649-1665
Mital, K. M. (2010). Queuing analysis for outpatient and inpatient services: a case study.
Management Decision, 48(3), 419–439.
Movahedi, B., Miri-Lavassani, K., & Kumar, U. (2016). Operational excellence through
business process orientation: An intra- and inter-organizational analysis. TQM
Journal.
Mugenda, O. M., & Mugenda, A.G. (2003). Research methods: Qualitative and
qualitative approaches. Nairobi: Acts Press.
49
Ndaita, P.M., Gachie, T., & Kiveu, C.W. (2015). The implementation of lean six sigma
concept at national bank of Kenya – Operation division. The TQM Journal 27(6),
683–690.
Ndubai, R. E., Mbeche, I. M., & Pokhariyal, G. P. (2016). A study of the relationship
among performance contracting, measurement and public service delivery in Kenya.
Neely, A., Gregory, M., & Platts, K. (2005). Performance measurement system design: A
literature review and research agenda. International Journal of Operations and
Production Management.
Ochieng ’ondiek, G., & Kisombe, S. M. (2013). A survey on adoption of lean
manufacturing tools and techniques in sugar processing industries in Kenya.
Industrial Engineering Letters, 3(10), 92–105.
Olsen, L.L., & Johnson, M.D. (2003). Service equity, satisfaction, and loyalty: from
transaction-specific to cumulative evaluations. Journal of Service Research, 5(3)
184-95.
Piercy, N., & Rich, N. (2009). Lean transformation in the pure service environment: The
case of the call service centre. International Journal of Operations & Production
Management, 29(1), 54–76.
Radnor, Z. J., Holweg, M., & Waring, J. (2012). Lean in healthcare: The unfilled
promise. Social Science and Medicine.
Rahman, S., Laosirihongthong, T., & Sohal, A. S. (2010). Impact of lean strategy on
operational performance: A study of Thai manufacturing companies. Journal of
Manufacturing Technology Management.
Ramachandran, N. A. (2013). Lean manufacturing facilitator selection with VIKOR
under fuzzy environment. International Journal of Current Engineering and
Technology, 3(2), 356–359.
Schonberger, J., & Kopfer, H. (2008). On the value of objective function adaptation in
online optimisation. Operations Research Proceedings 2007.
50
Seidel, A., Saurin, T. A., Marodin, G. A., & Ribeiro, J. L. D. (2017). Lean leadership
competencies: a multi-method study. Management Decision.
Shah, R., & Ward, P. T. (2007). Defining and developing measures of lean production.
Journal of Operations Management.
Singh, S.B., & Dhalla, R.S. (2010). Effect of quality management on performance of
Indian pharmaceutical industries. International Conference on Industrial
Engineering and Operations Management Dhaka, Bangladesh.
Singh, S. B., & Sharma, S. K. (2009). Value stream mapping as a versatile tool for lean
implementation: An Indian case study of a manufacturing firm. Measuring Business
Excellence, 13(3), 58–68.
Slack, N., Chambers, S., & Johnston, R. (2007). Operations management (5th ed.).
England: Pearson Education Limited.
Taj, S. (2005). Applying lean assessment tools in Chinese hitech industries. Management
Decision, 43(4), 628–643.
Tapping, D., & Shuker, T. 2003. Value stream management for the lean office. New York:
Productivity Press.
Thompson, M. P. A., & Walsham, G. (2004). Placing knowledge management in context.
Journal of Management Studies, 41(5), 725–747.
Thrulogachantar, P., & Zailani, S. (2011). The influence of purchasing strategies on
manufacturing performance. Journal of Manufacturing Technology Management,
22(5), 641–663.
Voss, C., Blackmon, K., Hanson, P., & Oak, B. (1995). The Competitiveness of
European Manufacturing: A four country study. Business Strategy Review, 6(1), 1–
25.
Wafukho, F.M., (2011). Effectiveness of lean six sigma on continuous improvement at
GlaxoSmithKline. (Master's thesis, University of Nairobi).
51
Wamalwa M. S., Onkware K., & Musiega (2014). Effects of lean manufacturing
technology strategy implementation on factory time efficiency, a case study of
Mumias sugar company limited in Kakamega County, Kenya. International
Journal of Business and Management Invention, 3(5)
Westbrook, R. (1995). Action research: a new paradigm for research in production and
operations management. International Journal of Operations & Production
Management, 15(12), 6–20.
Worley, J. M., Doolen, T. L., Worley, J. M., Doolen, T. L., Wiengartan, F., Gimenez, C.,
Ismail, Y. (2015). Lean manufacturing : context , practice bundles and performance.
Journal of Manufacturing Technology Management.
Yadav, V., Jain, R., Mittal, M. L., Panwar, A., & Lyons, A. (2018). The impact of lean
practices on the operational performance of SMEs in India. Industrial Management
and Data Systems.
Yala, J.O. (2016). Lean management supply chain and operational performance of
manufacturing firms in Kenya. (Master's thesis, University of Nairobi).
Young, T. P., & McClean, S. I. (2008). A critical look at lean thinking in healthcare.
Quality and Safety in Health Care.
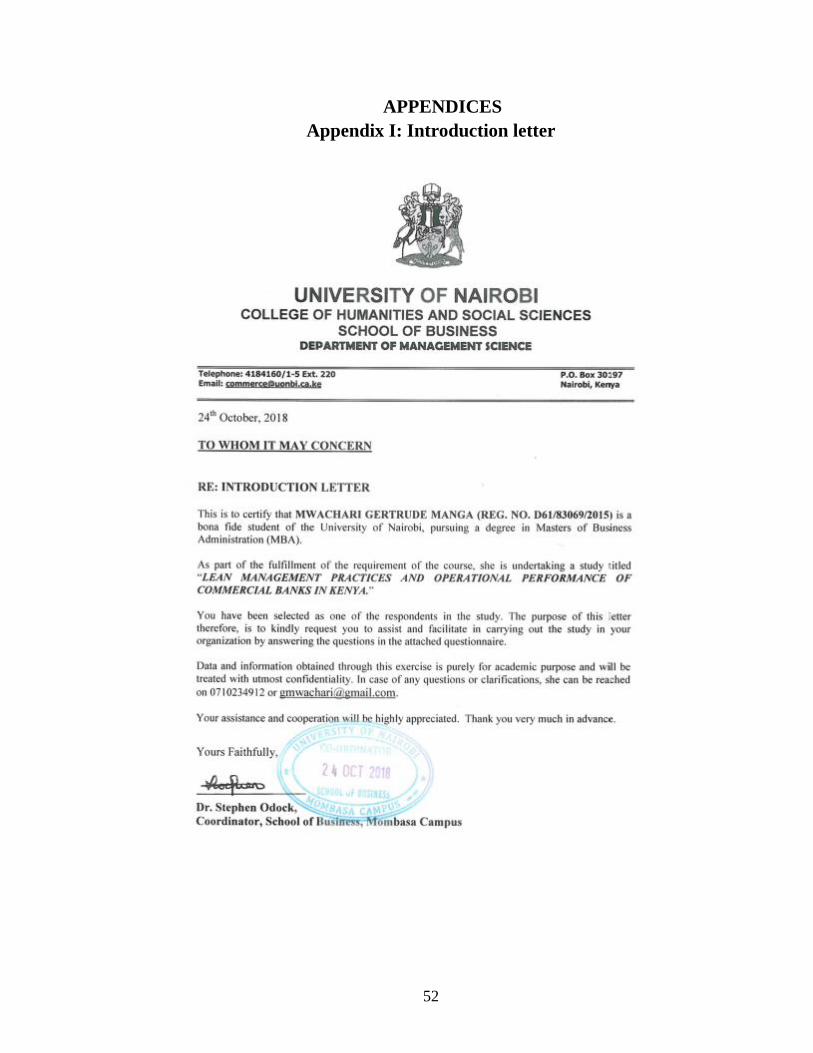
52
APPENDICES
Appendix I: Introduction letter

53
Appendix II: Questionnaire
SECTION A: GENERAL INFORMATION
1. Name of the Bank………………………………………………….
2. How long has the bank been in operation?
a) 5 – 10 years [ ] b) 11 – 15 years [ ]
c) 16 – 20 years [ ] d) Over 20 years [ ]
3. What is the current number of employees in the bank in Kenya?
a) 100 – 200 [ ] b)201 – 500 [ ]
b) 501 – 1000 [ ] d) Above 1000 [ ]
4. Years of Service in the bank
a) Less than 5 years [ ] b) 5 – 10 years [ ]
c) 11 – 15 years [ ] d) Above 15 years [ ]
SECTION B: LEAN MANAGEMENT PRACTICES
5. To what extent does your organization make use of the following lean
management practices?
Lean Management
Practices
No
Extent
(1)
Little
Extent
(2)
Moderate
Extent
(3)
Great
Extent
(4)
Very
Great
Extent (5)
Value Stream Mapping
1. Current state processes are
documented
2. Cross functional teams are
involved in documenting
processes
3. Customer feedback in an
input in process mapping
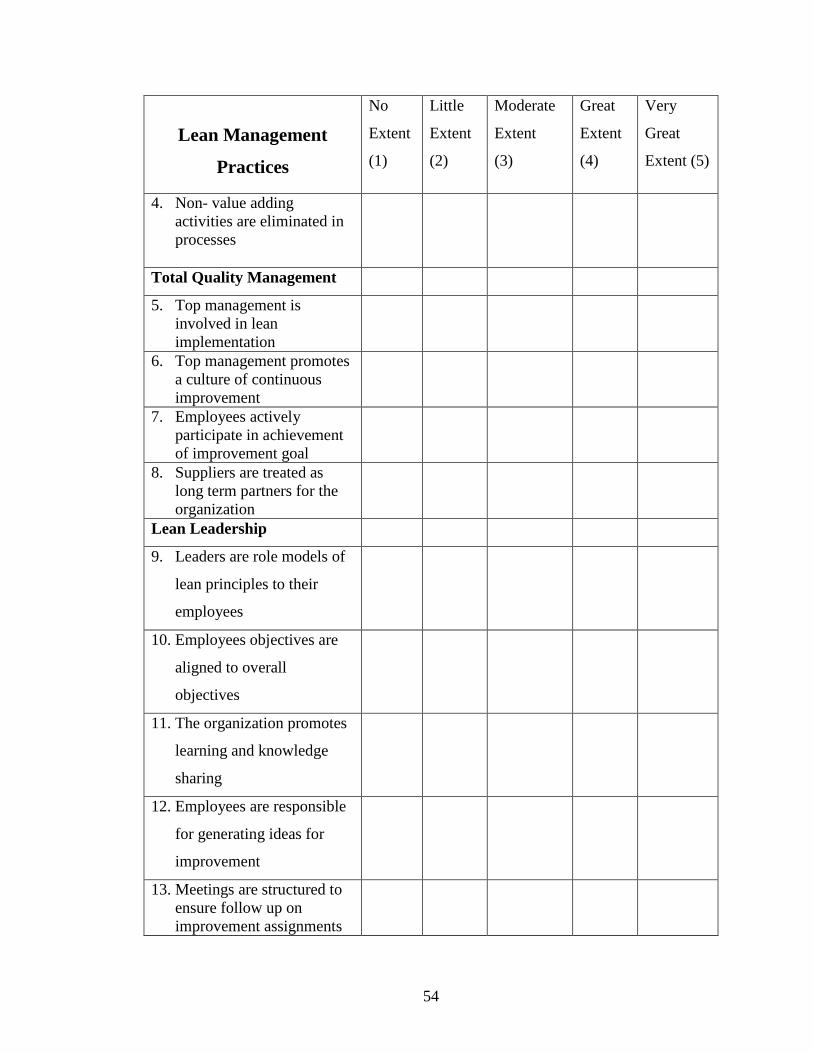
54
Lean Management
Practices
No
Extent
(1)
Little
Extent
(2)
Moderate
Extent
(3)
Great
Extent
(4)
Very
Great
Extent (5)
4. Non- value adding
activities are eliminated in
processes
Total Quality Management
5. Top management is
involved in lean
implementation
6. Top management promotes
a culture of continuous
improvement
7. Employees actively
participate in achievement
of improvement goal
8. Suppliers are treated as
long term partners for the
organization
Lean Leadership
9. Leaders are role models of
lean principles to their
employees
10. Employees objectives are
aligned to overall
objectives
11. The organization promotes
learning and knowledge
sharing
12. Employees are responsible
for generating ideas for
improvement
13. Meetings are structured to
ensure follow up on
improvement assignments
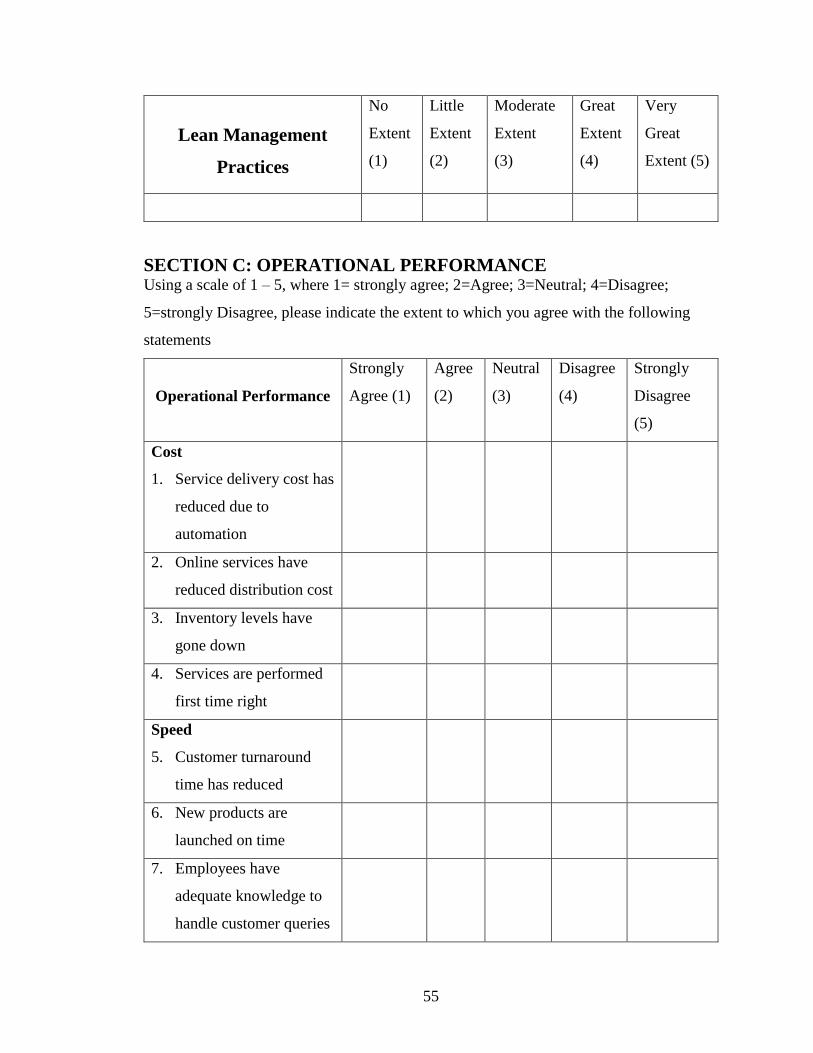
55
Lean Management
Practices
No
Extent
(1)
Little
Extent
(2)
Moderate
Extent
(3)
Great
Extent
(4)
Very
Great
Extent (5)
SECTION C: OPERATIONAL PERFORMANCE Using a scale of 1 – 5, where 1= strongly agree; 2=Agree; 3=Neutral; 4=Disagree;
5=strongly Disagree, please indicate the extent to which you agree with the following
statements
Operational Performance
Strongly
Agree (1)
Agree
(2)
Neutral
(3)
Disagree
(4)
Strongly
Disagree
(5)
Cost
1. Service delivery cost has
reduced due to
automation
2. Online services have
reduced distribution cost
3. Inventory levels have
gone down
4. Services are performed
first time right
Speed
5. Customer turnaround
time has reduced
6. New products are
launched on time
7. Employees have
adequate knowledge to
handle customer queries
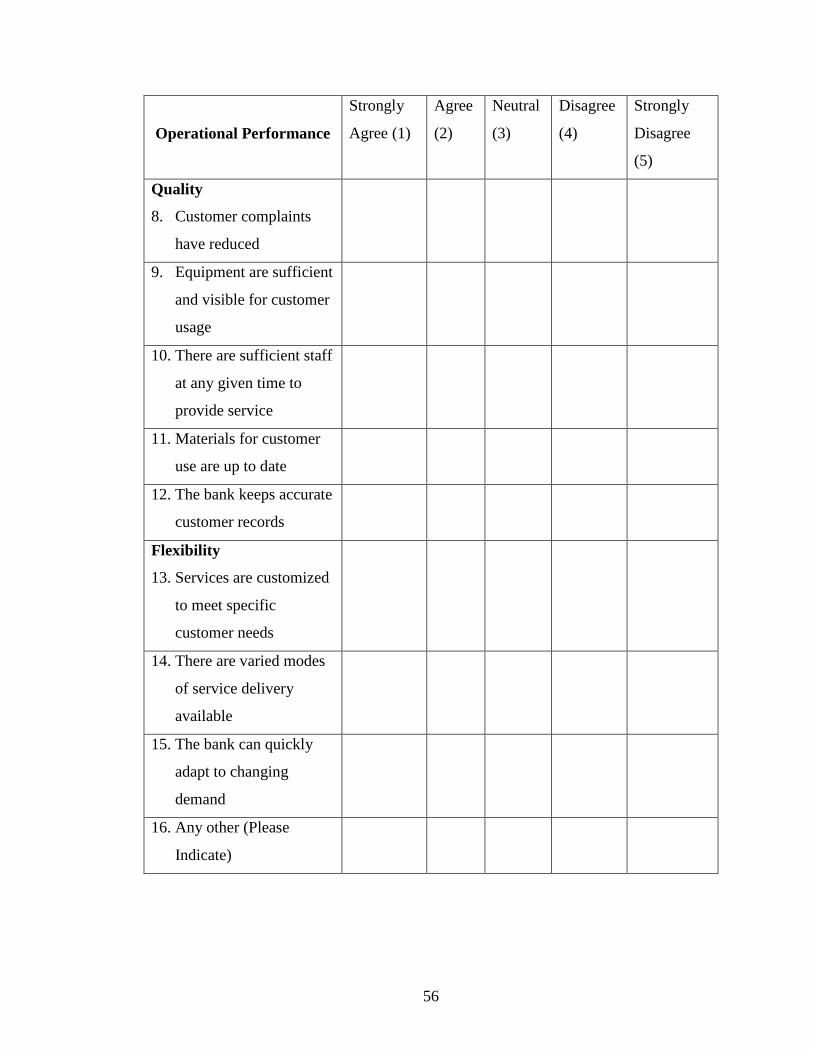
56
Operational Performance
Strongly
Agree (1)
Agree
(2)
Neutral
(3)
Disagree
(4)
Strongly
Disagree
(5)
Quality
8. Customer complaints
have reduced
9. Equipment are sufficient
and visible for customer
usage
10. There are sufficient staff
at any given time to
provide service
11. Materials for customer
use are up to date
12. The bank keeps accurate
customer records
Flexibility
13. Services are customized
to meet specific
customer needs
14. There are varied modes
of service delivery
available
15. The bank can quickly
adapt to changing
demand
16. Any other (Please
Indicate)
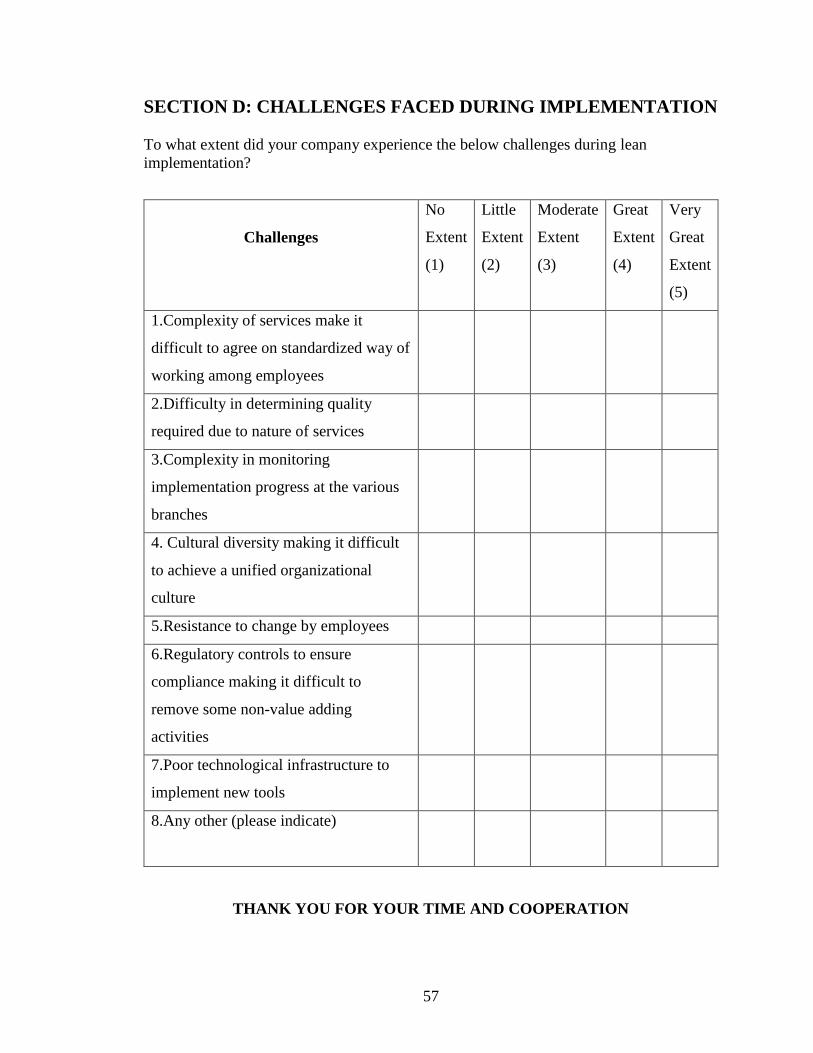
57
SECTION D: CHALLENGES FACED DURING IMPLEMENTATION
To what extent did your company experience the below challenges during lean
implementation?
Challenges
No
Extent
(1)
Little
Extent
(2)
Moderate
Extent
(3)
Great
Extent
(4)
Very
Great
Extent
(5)
1.Complexity of services make it
difficult to agree on standardized way of
working among employees
2.Difficulty in determining quality
required due to nature of services
3.Complexity in monitoring
implementation progress at the various
branches
4. Cultural diversity making it difficult
to achieve a unified organizational
culture
5.Resistance to change by employees
6.Regulatory controls to ensure
compliance making it difficult to
remove some non-value adding
activities
7.Poor technological infrastructure to
implement new tools
8.Any other (please indicate)
THANK YOU FOR YOUR TIME AND COOPERATION
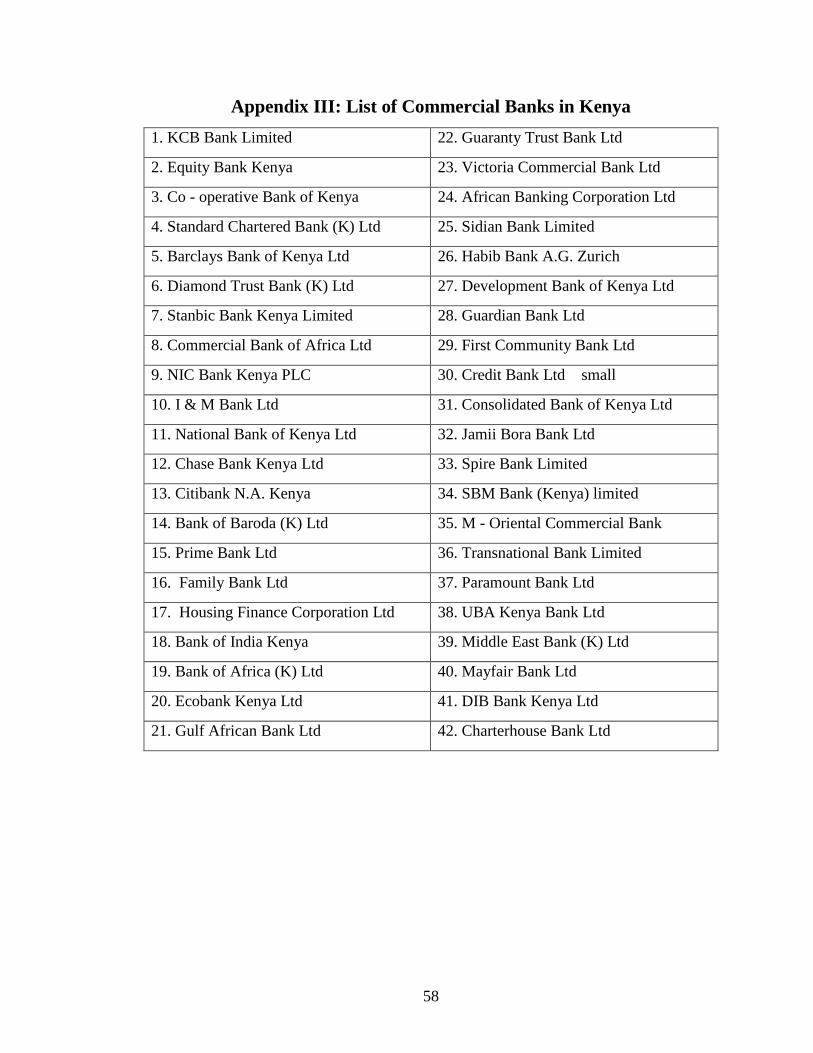
58
Appendix III: List of Commercial Banks in Kenya
1. KCB Bank Limited 22. Guaranty Trust Bank Ltd
2. Equity Bank Kenya 23. Victoria Commercial Bank Ltd
3. Co - operative Bank of Kenya 24. African Banking Corporation Ltd
4. Standard Chartered Bank (K) Ltd 25. Sidian Bank Limited
5. Barclays Bank of Kenya Ltd 26. Habib Bank A.G. Zurich
6. Diamond Trust Bank (K) Ltd 27. Development Bank of Kenya Ltd
7. Stanbic Bank Kenya Limited 28. Guardian Bank Ltd
8. Commercial Bank of Africa Ltd 29. First Community Bank Ltd
9. NIC Bank Kenya PLC 30. Credit Bank Ltd small
10. I & M Bank Ltd 31. Consolidated Bank of Kenya Ltd
11. National Bank of Kenya Ltd 32. Jamii Bora Bank Ltd
12. Chase Bank Kenya Ltd 33. Spire Bank Limited
13. Citibank N.A. Kenya 34. SBM Bank (Kenya) limited
14. Bank of Baroda (K) Ltd 35. M - Oriental Commercial Bank
15. Prime Bank Ltd 36. Transnational Bank Limited
16. Family Bank Ltd 37. Paramount Bank Ltd
17. Housing Finance Corporation Ltd 38. UBA Kenya Bank Ltd
18. Bank of India Kenya 39. Middle East Bank (K) Ltd
19. Bank of Africa (K) Ltd 40. Mayfair Bank Ltd
20. Ecobank Kenya Ltd 41. DIB Bank Kenya Ltd
21. Gulf African Bank Ltd 42. Charterhouse Bank Ltd