Embed Size (px)
Citation preview
LEAN SUPPLY CHAINS
Chapter FourteenCopyright © 2014 by The McGraw-Hill Companies, Inc. All rights reserved.McGraw-Hill/Irwin
Lean Logic
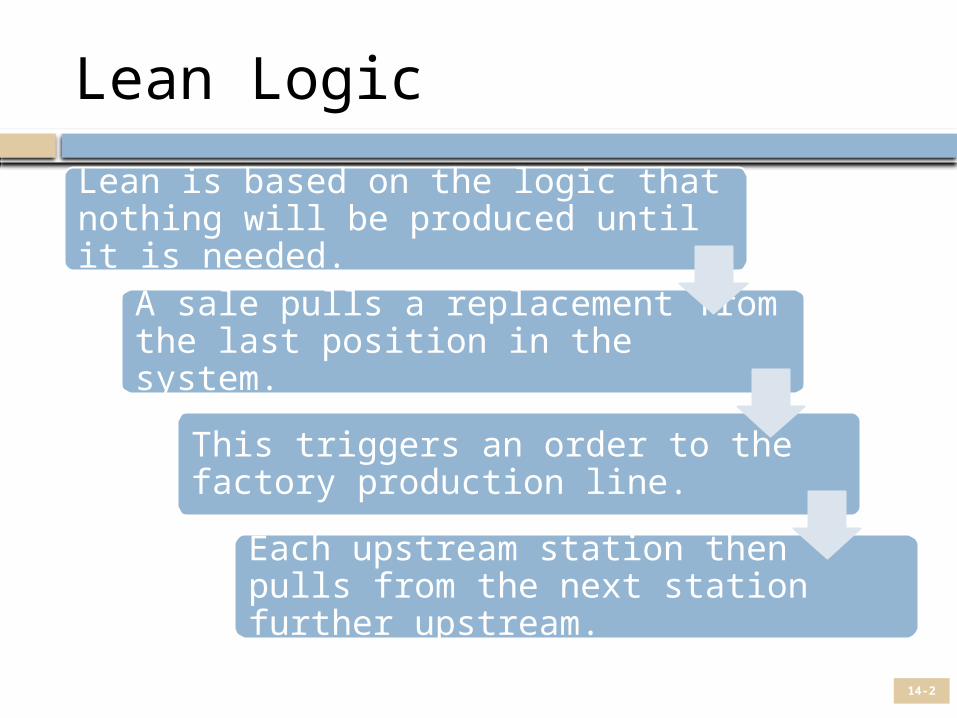
Lean is based on the logic that nothing will be produced until it is needed.
A sale pulls a replacement from the last position in the system.
This triggers an order to the factory production line.
Each upstream station then pulls from the next station further upstream.
14-2
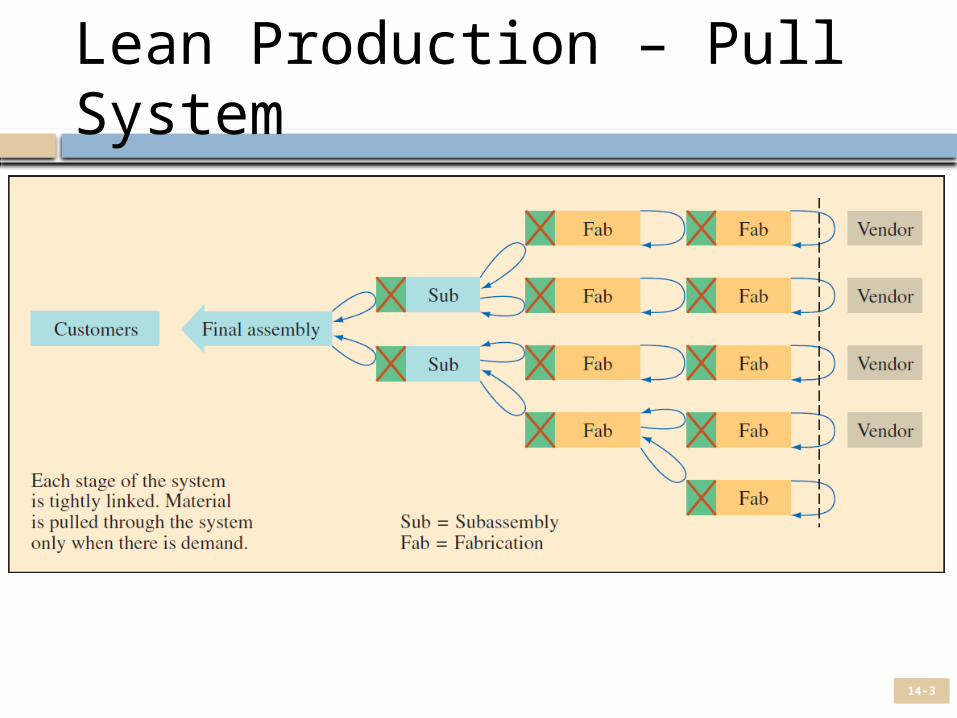
Lean Production – Pull System
14-3
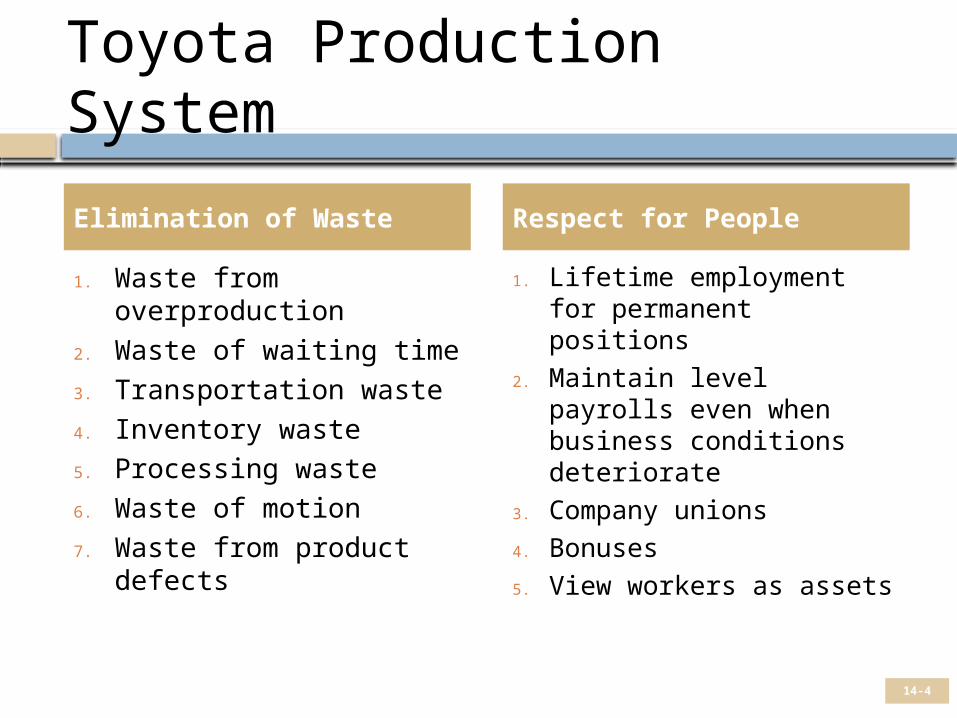
Toyota Production System
1. Waste from overproduction
2. Waste of waiting time3. Transportation waste4. Inventory waste5. Processing waste6. Waste of motion7. Waste from product
defects
1. Lifetime employment for permanent positions
2. Maintain level payrolls even when business conditions deteriorate
3. Company unions4. Bonuses5. View workers as assets
Elimination of Waste Respect for People
14-4
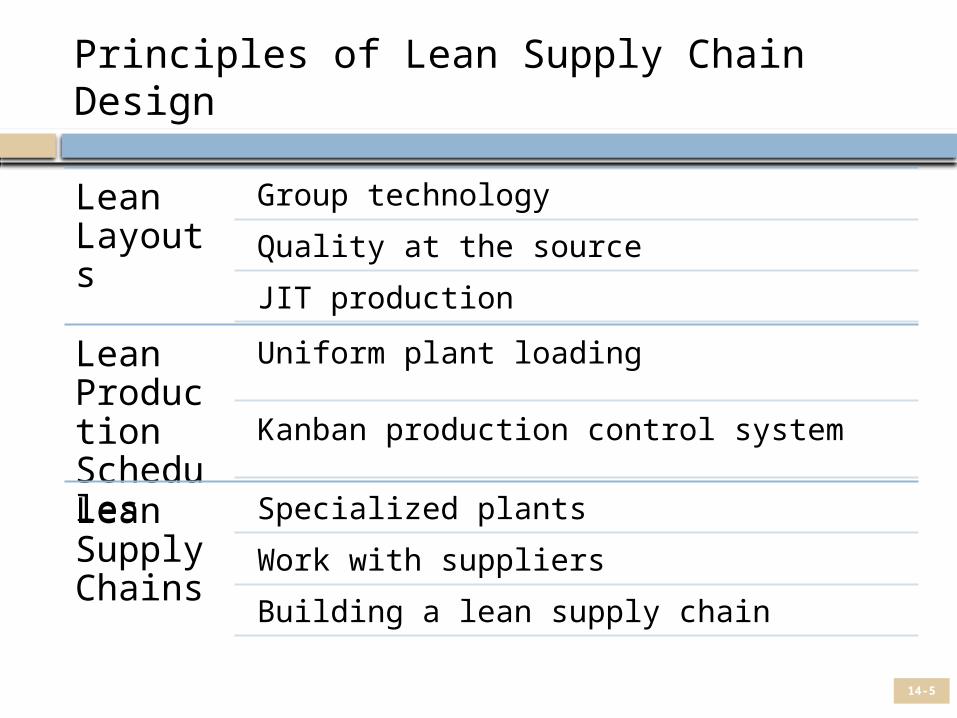
Principles of Lean Supply Chain Design
Lean Layouts
Group technology
Quality at the source
JIT production
Lean Production Schedules
Uniform plant loading
Kanban production control system
Lean Supply Chains
Specialized plants
Work with suppliers
Building a lean supply chain
14-5
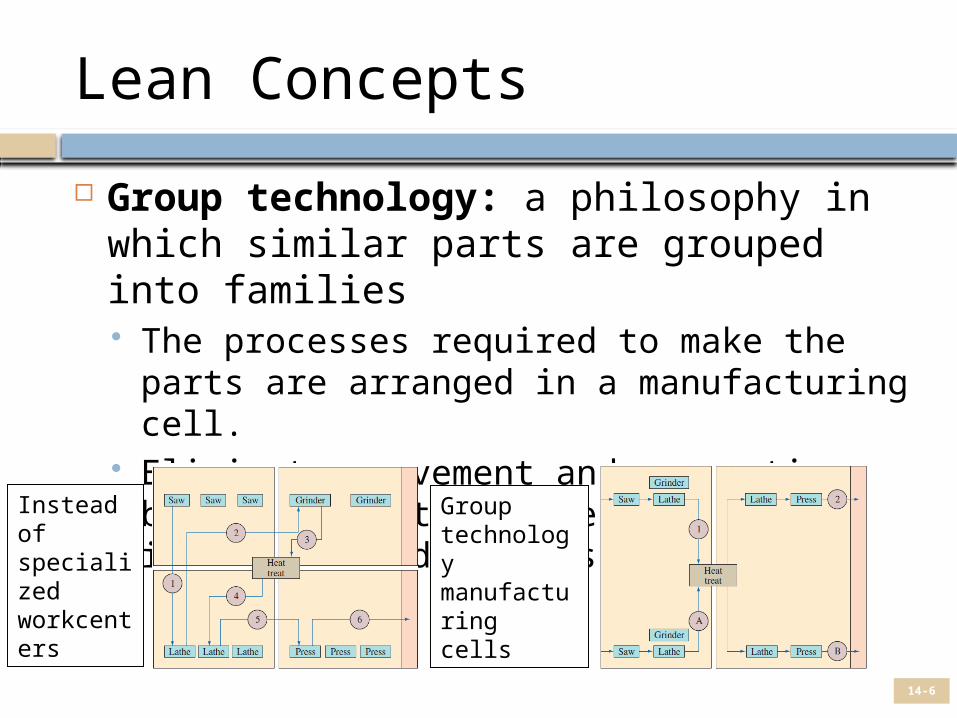
Lean Concepts
Group technology: a philosophy in which similar parts are grouped into families The processes required to make the parts
are arranged in a manufacturing cell. Eliminates movement and queue time
between operations, reduces inventory, and reduces employees.Instead
of specialized workcenters
Group technology manufacturing cells
14-6
Quality at the Source
Quality at the source: do it right the first time and if something goes wrong, stop the process immediately Workers are personally responsible for the
quality of their output. Workers become their own inspectors. Workers are empowered to do their own
maintenance.
14-7
Just-in-Time (JIT) Production
JIT production: producing what is needed when needed and nothing more Anything over the minimum is waste. Typically applied to repetitive
manufacturing. Ideal lot size is one. Vendors ship several times a day. JIT exposes problems otherwise hidden by
inventory.
14-8
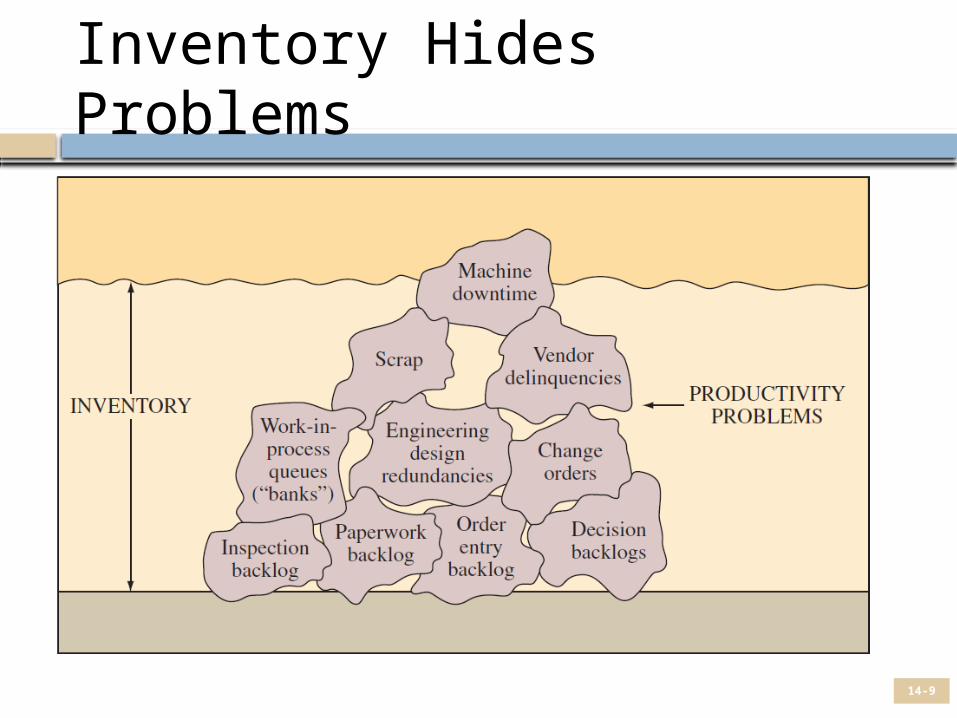
Inventory Hides Problems
14-9
Kanban Systems
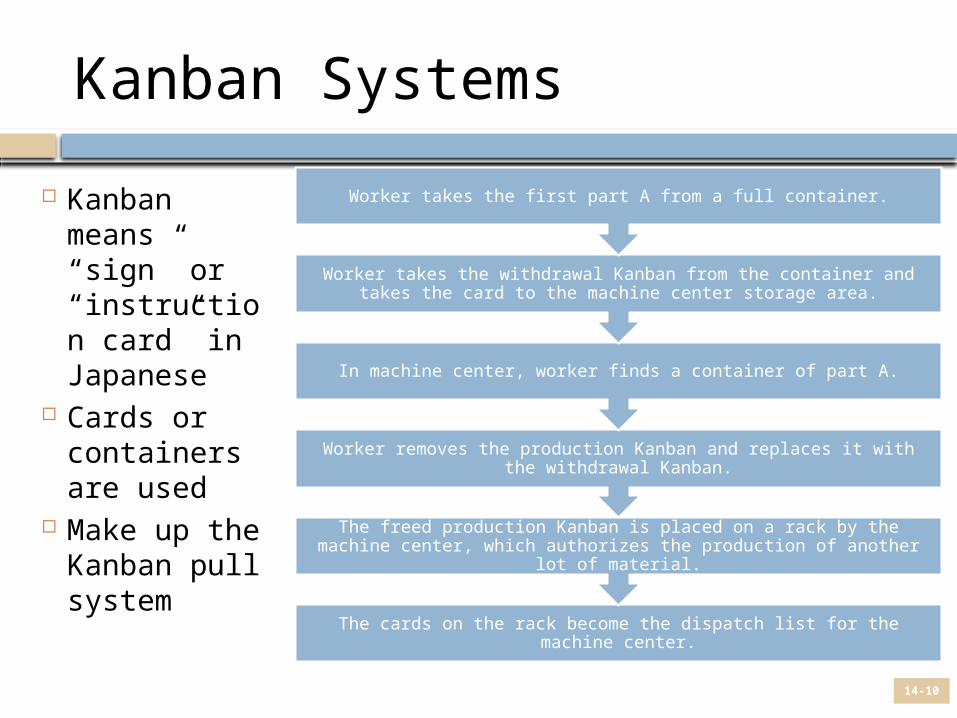
Kanban means “sign” or “instruction card” in Japanese
Cards or containers are used
Make up the Kanban pull system The cards on the rack become the dispatch list for the machine center.
The freed production Kanban is placed on a rack by the machine center, which authorizes the production of another lot of material.
Worker removes the production Kanban and replaces it with the withdrawal Kanban.
In machine center, worker finds a container of part A.
Worker takes the withdrawal Kanban from the container and takes the card to the machine center storage area.
Worker takes the first part A from a full container.
14-10
Other Kanban Approaches
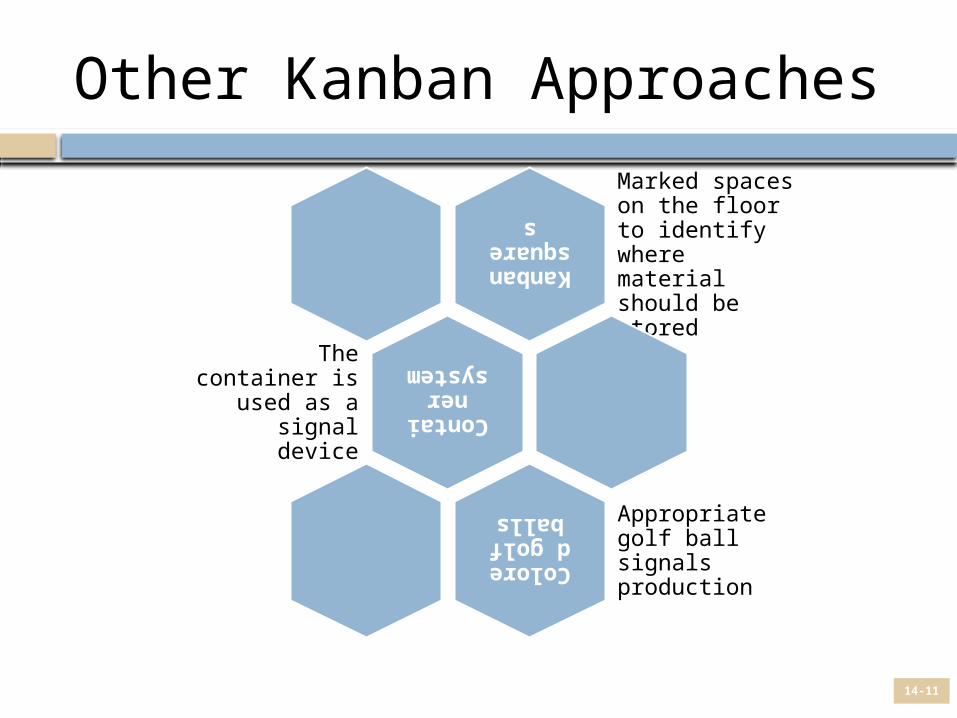
Kanban squares
Marked spaces on the floor to identify where material should be stored
Container systemThe container
is used as a signal device
Colored golf balls Appropriate
golf ball signals production
14-11
Kanban System
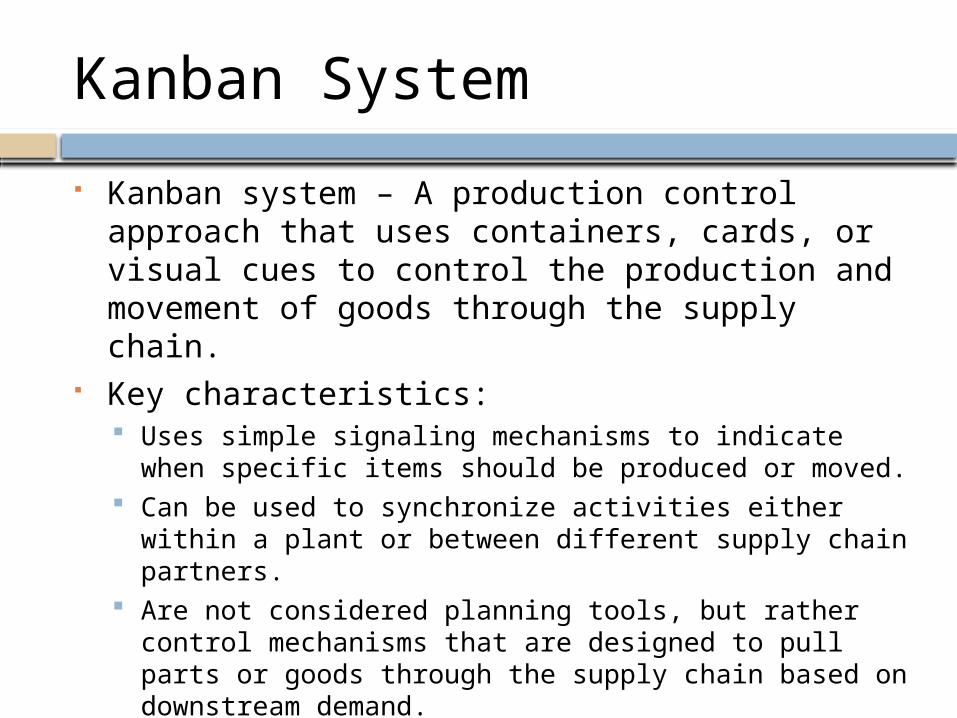
Kanban system – A production control approach that uses containers, cards, or visual cues to control the production and movement of goods through the supply chain.
Key characteristics: Uses simple signaling mechanisms to indicate when
specific items should be produced or moved. Can be used to synchronize activities either within a
plant or between different supply chain partners. Are not considered planning tools, but rather control
mechanisms that are designed to pull parts or goods through the supply chain based on downstream demand.
Kanban System
Two-card kanban system – Uses one card to control production and another card to control movement of materials.
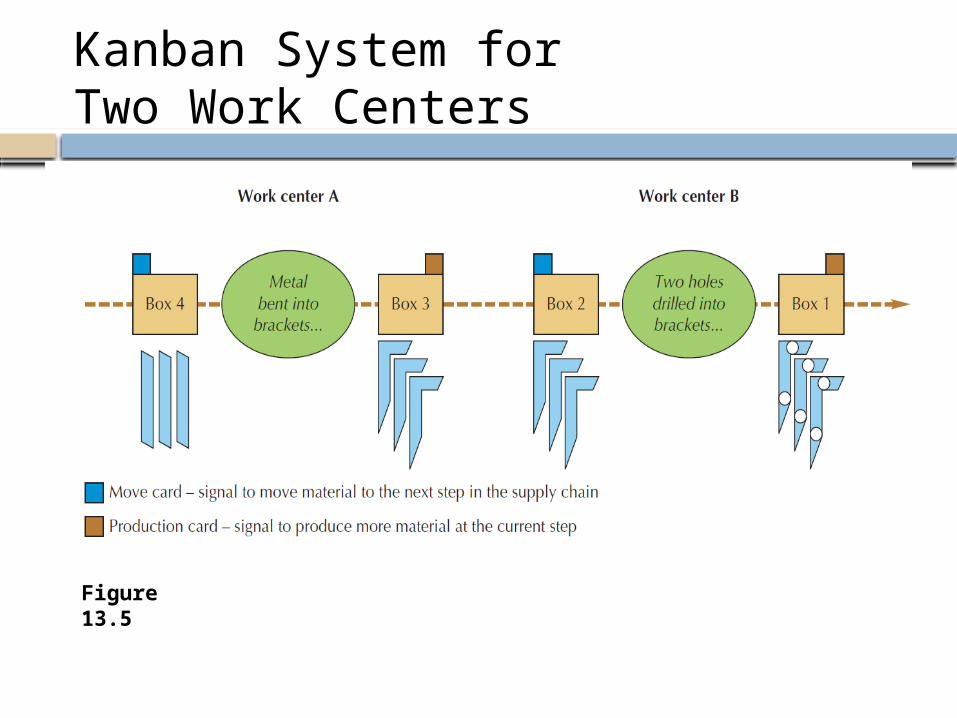
Kanban System for Two Work Centers
Figure 13.5
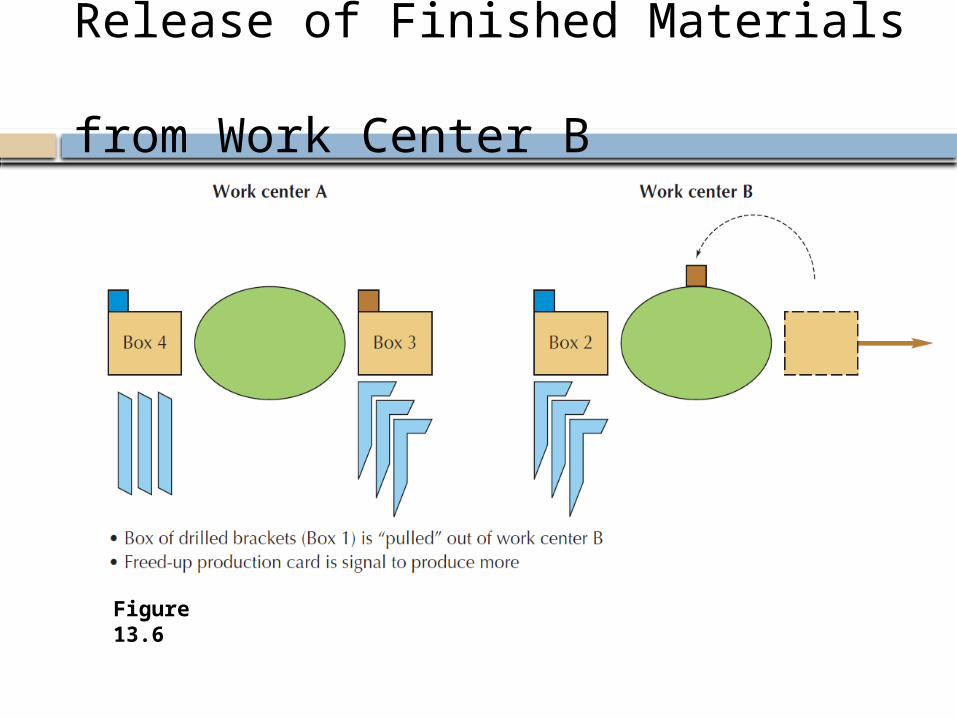
Release of Finished Materials from Work Center B
Figure 13.6
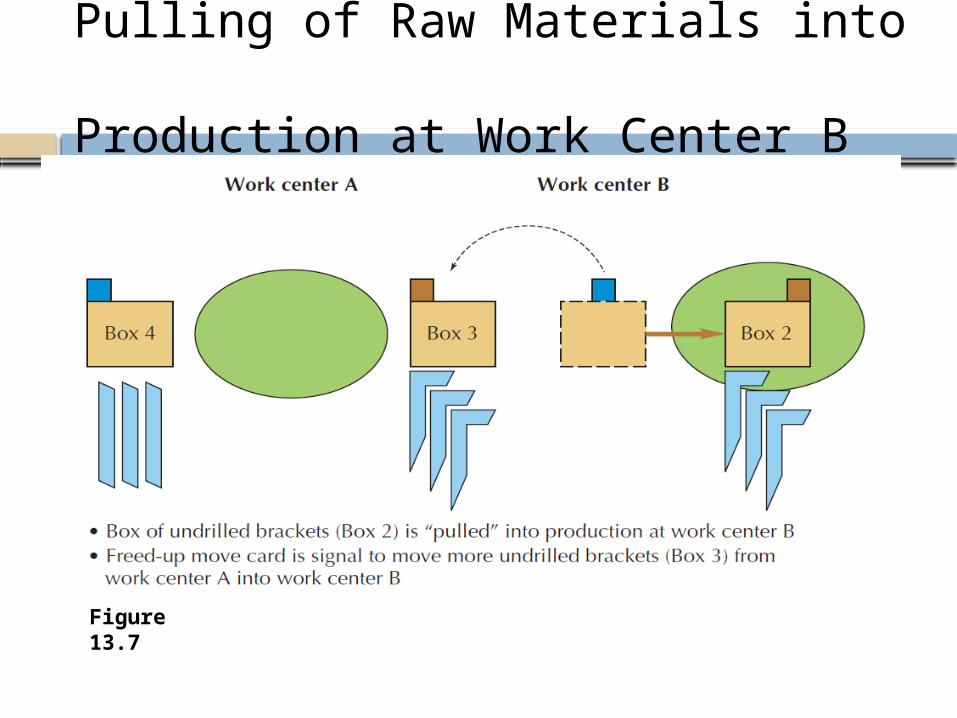
Pulling of Raw Materials into Production at Work Center B
Figure 13.7
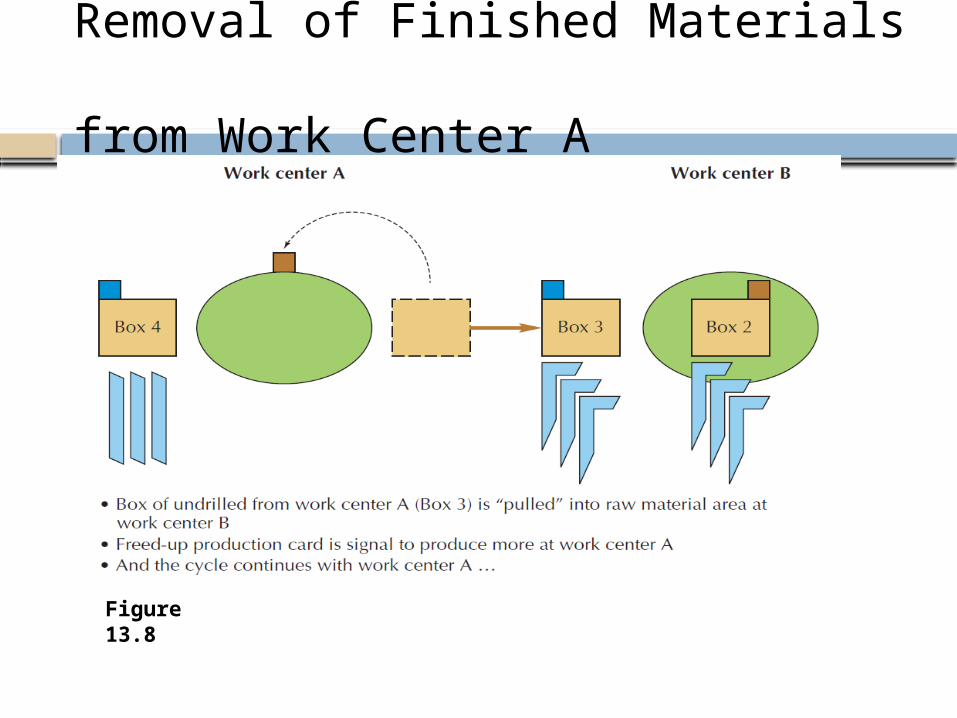
Removal of Finished Materials from Work Center A
Figure 13.8
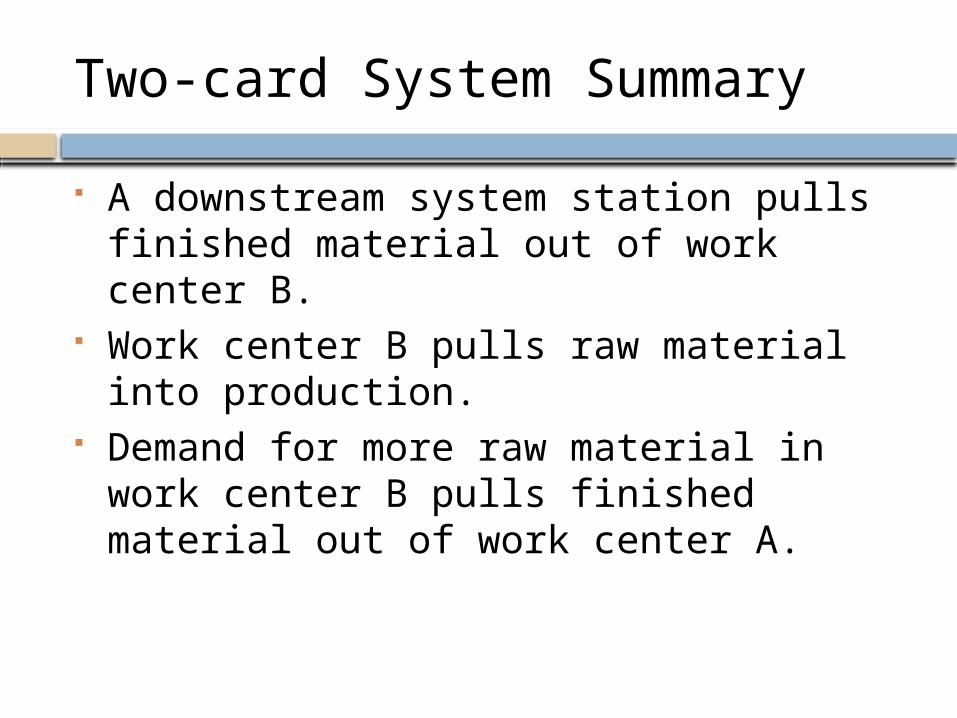
Two-card System Summary
A downstream system station pulls finished material out of work center B.
Work center B pulls raw material into production.
Demand for more raw material in work center B pulls finished material out of work center A.
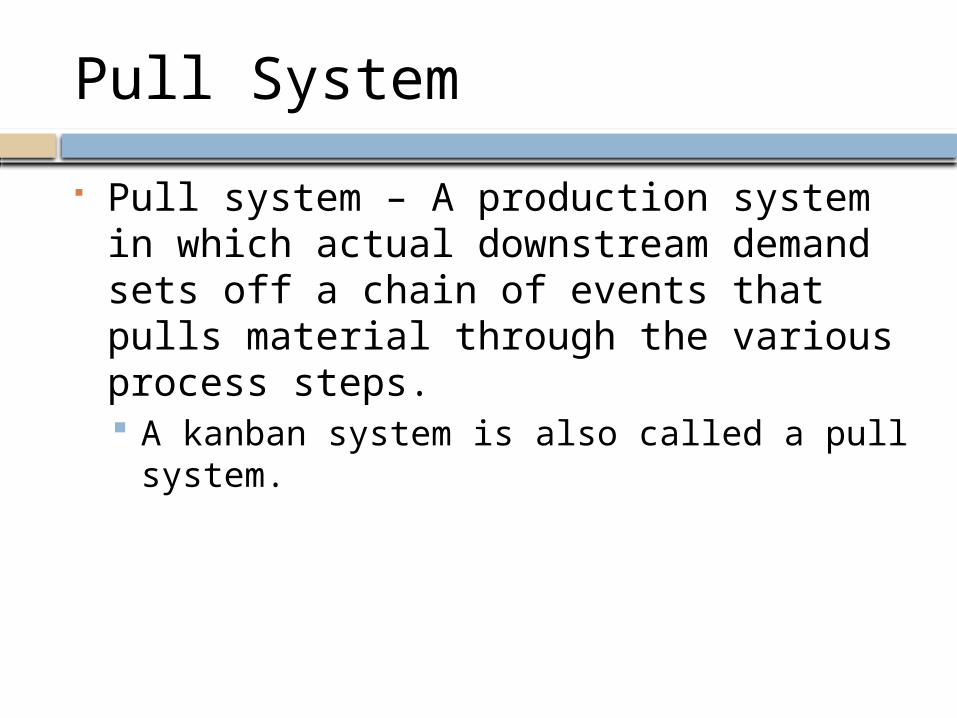
Pull System
Pull system – A production system in which actual downstream demand sets off a chain of events that pulls material through the various process steps. A kanban system is also called a pull
system.
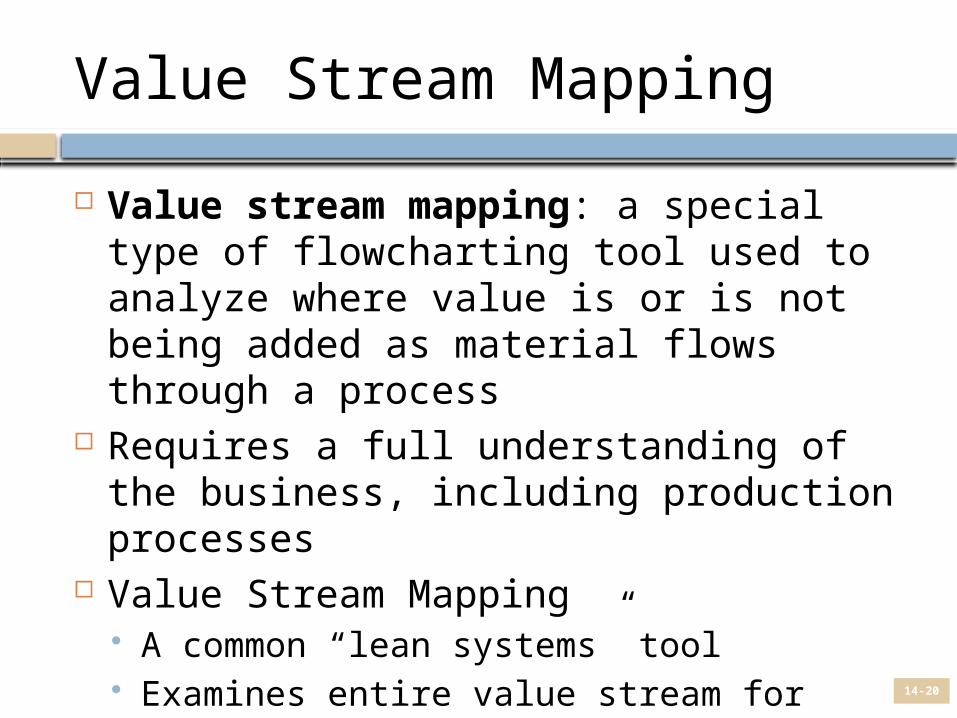
Value Stream Mapping
Value stream mapping: a special type of flowcharting tool used to analyze where value is or is not being added as material flows through a process
Requires a full understanding of the business, including production processes
Value Stream Mapping A common “lean systems” tool Examines entire value stream for waste
14-20
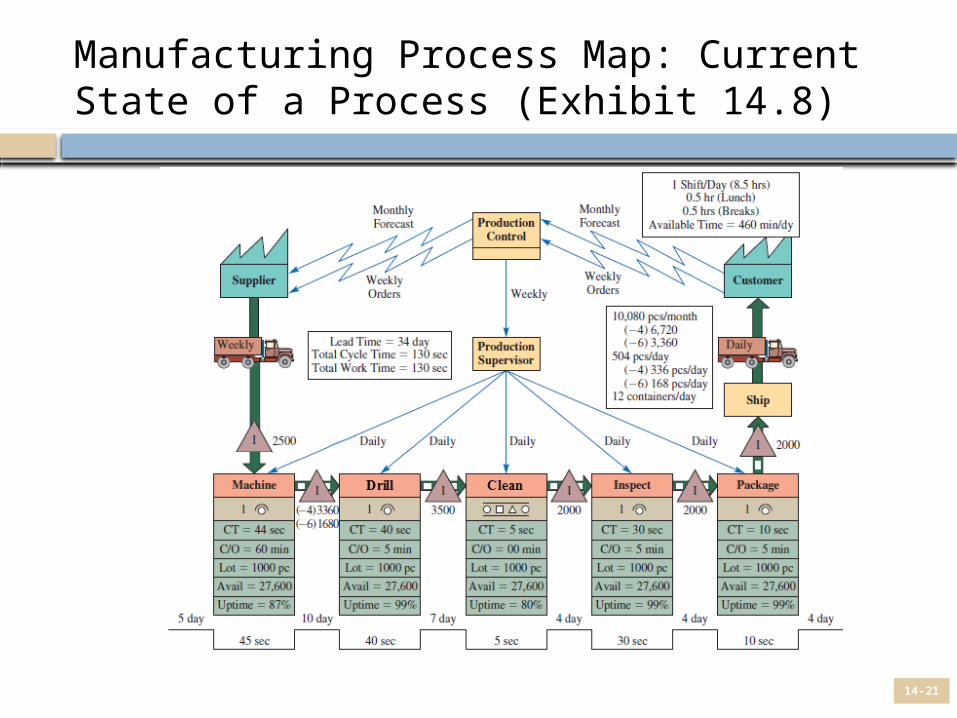
Manufacturing Process Map: Current State of a Process (Exhibit 14.8)
14-21
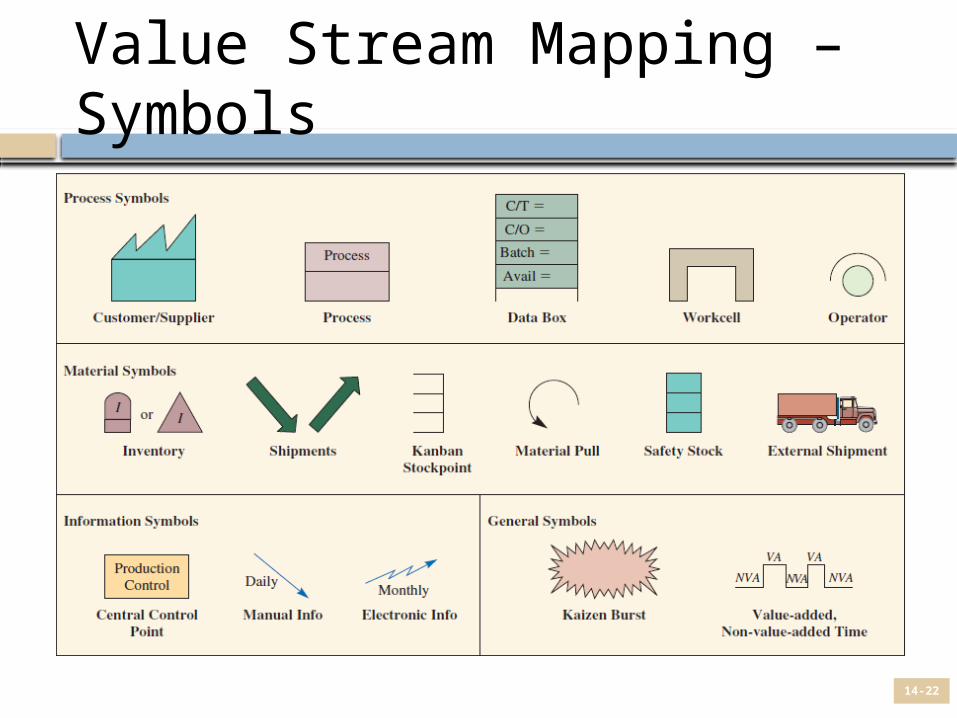
Value Stream Mapping – Symbols
14-22

Manufacturing Process Map: Possible Future State of a Process (Exhibit 14.10)
14-23
4-24
Lean Waste
Lean Waste – Any activity that does not add value to the good or service in the eyes of the consumer. Called “muda” in Japanese Identification of lean wastes began with
Taiichi Ohno, a Toyota engineer.
Eight Lean Wastes
Overproduction Waiting Unnecessary transportation Inappropriate process Unnecessary inventory Unnecessary/excess motion Defects Underutilization of employees
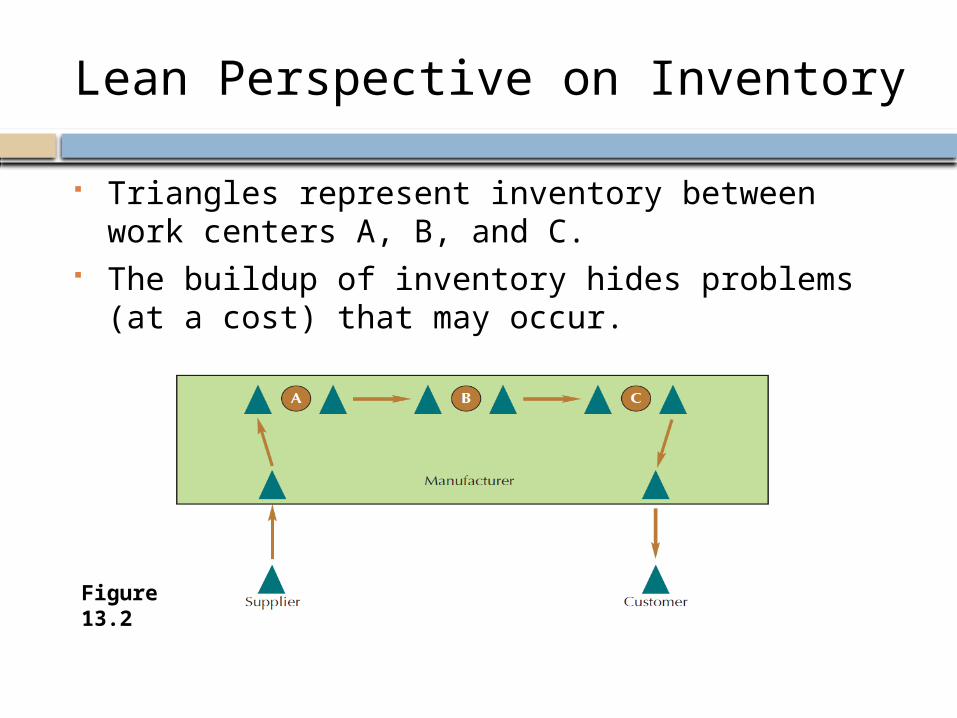
Lean Perspective on Inventory
Triangles represent inventory between work centers A, B, and C.
The buildup of inventory hides problems (at a cost) that may occur.
Figure 13.2
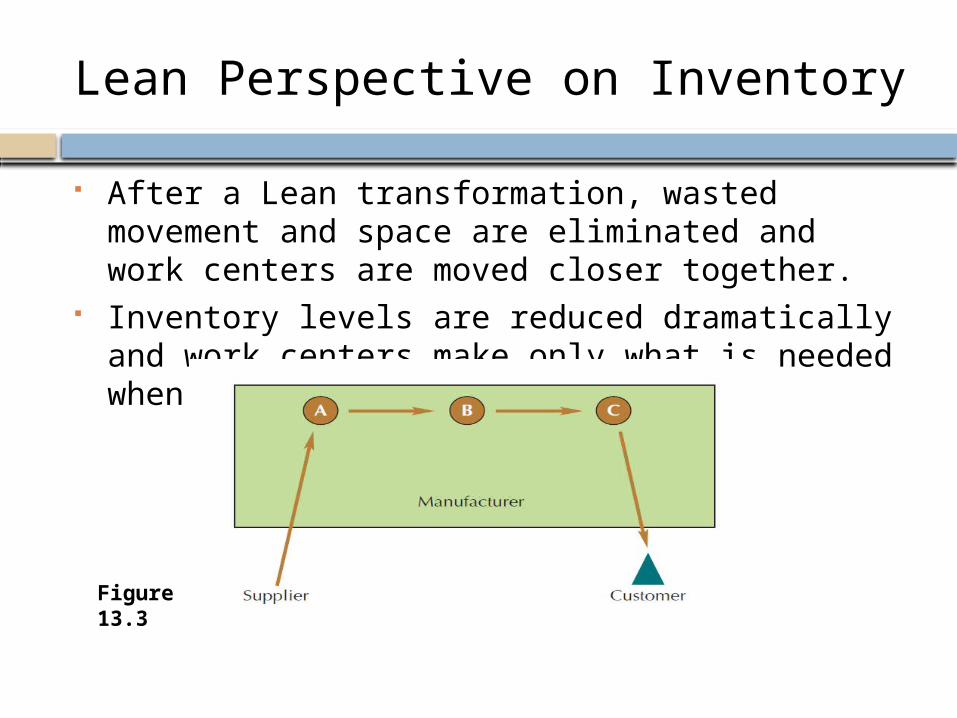
Lean Perspective on Inventory
After a Lean transformation, wasted movement and space are eliminated and work centers are moved closer together.
Inventory levels are reduced dramatically and work centers make only what is needed when it is needed.
Figure 13.3
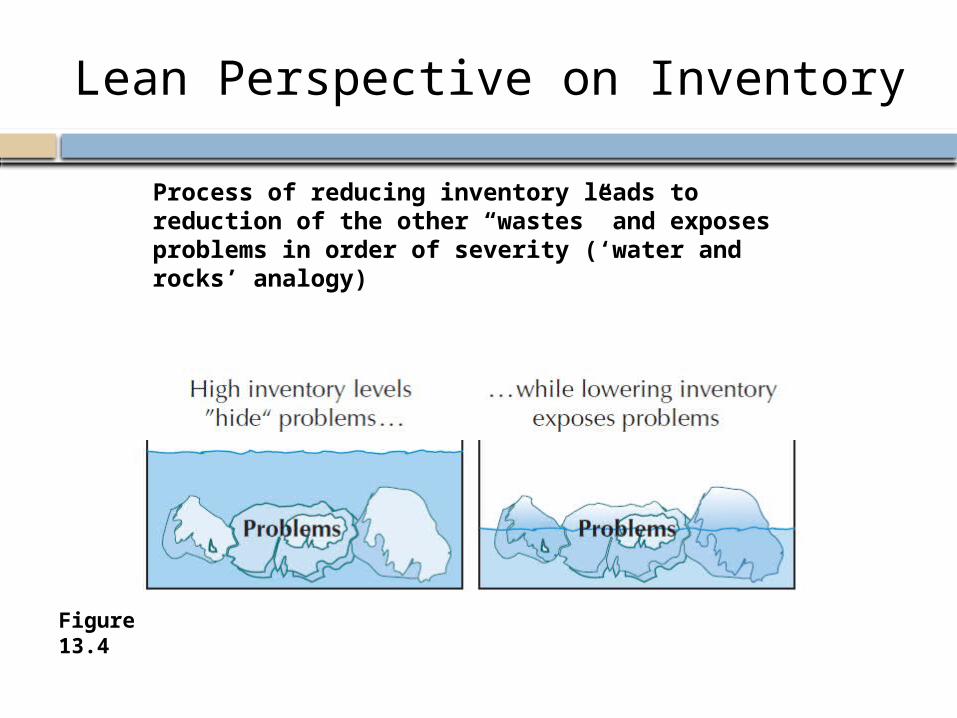
Lean Perspective on Inventory
Process of reducing inventory leads to reduction of the other “wastes” and exposes problems in order of severity (‘water and rocks’ analogy)
Figure 13.4